author's personal copy - university of south...
TRANSCRIPT

This article appeared in a journal published by Elsevier. The attachedcopy is furnished to the author for internal non-commercial researchand education use, including for instruction at the authors institution
and sharing with colleagues.
Other uses, including reproduction and distribution, or selling orlicensing copies, or posting to personal, institutional or third party
websites are prohibited.
In most cases authors are permitted to post their version of thearticle (e.g. in Word or Tex form) to their personal website orinstitutional repository. Authors requiring further information
regarding Elsevier’s archiving and manuscript policies areencouraged to visit:
http://www.elsevier.com/copyright

Author's personal copy
Visuospatial interpolation in typically developing childrenand in people with Williams Syndrome
Melanie Palomares a,*, Barbara Landau b, Howard Egeth a
a Psychological and Brain Sciences, Johns Hopkins University, 3400 North Charles Street, Ames Hall, Baltimore, MD 21218, USAb Cognitive Science, Johns Hopkins University, 3400 North Charles Street, Krieger Hall, Baltimore, MD 21218, USA
a r t i c l e i n f o
Article history:Received 2 April 2008Received in revised form 5 August 2008
Keywords:Williams SyndromeDevelopmentVernier acuityPositional acuityInterpolationIllusory contoursVisual maturationVisuospatial integrationPerceptual grouping
a b s t r a c t
Visuospatial interpolation is the estimation of object position or contour shape computed from known‘‘anchor” positions. We characterized the developmental profile of interpolation by measuring positionalthresholds as a function of inter-element separation without (Experiment 1) and with (Experiment 2) thecontext of illusory contours in typically developing children, typical adults and individuals with WilliamsSyndrome (WS), a genetic disorder that causes impaired global visuospatial abilities. We found that typ-ically developing children and WS individuals had more difficulty integrating information across distantelements than typical adults. However, illusory contours improved thresholds in all participant groups ina similar way. Our results suggest that in WS individuals, and in typically developing children, the group-ing mechanisms that enable long-range spatial integration are immature. We hypothesize that WS indi-viduals and young children can use stimulus-driven grouping cues for bottom–up integration, but haveimmature mechanisms for top–down integration of spatial information.
� 2008 Elsevier Ltd. All rights reserved.
1. Introduction
In this paper, we examine the nature of visuospatial interpo-lation in typically developing children and people with WS, arare genetic deficit that gives rise to an unusual pattern of se-verely impaired spatial cognition together with relatively stronglanguage skills. Visuospatial interpolation is an especially usefultool to examine spatial development and patterns of deficit incases such as WS for several reasons. First, many experimentalprocedures for measuring visual interpolation are well suitedfor testing children and atypical populations because they areeasy to understand. One common interpolation task is thethree-point Vernier alignment task, which is used to efficientlyassess retinal and cortical impairments in children (Kim et al.,2000), older adults (Yebra-Pimentel Vilar et al., 1995) and clini-cal populations (Fang et al., 2000). In this task, observers areasked to judge the position of a central dot relative to flankingdots (see Fig. 2). Second, visuospatial interpolation is fundamen-tal to our ability to judge the position of an object relative toother locations in space, and this supports various everydayskills such as object avoidance (e.g. parallel parking), and objecttracking (e.g. following a caravan). Third, positional thresholds of
typical adults have been extensively studied using tasks of bisec-tion (Levi, Klein, & Yap, 1987), separation discrimination (West-heimer & McKee, 1977) and alignment discrimination (Hess &Hayes, 1993). For these tasks, adult functions are well specified:they generally follow Weber’s law as a function of inter-elementseparation. This function (positional threshold vs. inter-elementseparation) has a log–log slope of 1 for high contrast, long-dura-tion, broadband stimuli (e.g. Hess & Hayes, 1993). That is, theWeber fraction for judging relative position is constant acrossinter-element separation. Deviation from this function wouldbe indicative of a mechanism that operates differently from thatof typical adults.
Since the time of Fechner in the mid-19th century, localizationof an object relative to other objects has been found to propor-tionally depend on their inter-object separation in typical adults.However, very little is known about how judgment of relativelocation behaves in typical development, and whether it is sus-ceptible to developmental damage. The present study is a para-metric investigation of how relative position across multipleelements at different inter-element distances is judged (i.e., inter-polated) by typical children and Williams Syndrome (WS) indi-viduals. Since typically developing children (e.g. Carkeet, Levi, &Manny, 1997) and WS individuals (Farran & Jarrold, 2005; Landau& Hoffman, 2005) show some difficulty judging relative position,it is possible that they may have interpolation functions that aredifferent from typical adults.
0042-6989/$ - see front matter � 2008 Elsevier Ltd. All rights reserved.doi:10.1016/j.visres.2008.08.012
* Corresponding author. Present address. The Smith-Kettlewell Institute, InfantVision Laboratory, 2318 Fillmore Street, San Francisco, CA 94115, USA.
E-mail address: [email protected] (M. Palomares).
Vision Research 48 (2008) 2439–2450
Contents lists available at ScienceDirect
Vision Research
journal homepage: www.elsevier .com/locate /v isres

Author's personal copy
1.1. Williams Syndrome
Williams Syndrome is a rare genetic disorder that occurs in 1out of 20,000 live births, associated with a microdeletion of about20+ genes on chromosomal region 7q11.23 (Lenhoff, Wang, Green-berg, & Bellugi, 1997). WS causes mild to moderate mental retarda-tion, with an average IQ of 60, but is typically associated withrelative aptitude in language abilities despite profound weaknessin visuospatial abilities (Bellugi, Lichtenberger, Mills, Galaburda,& Korenberg, 1999). This uneven cognitive profile suggests that dif-ferent cognitive systems might be linked to specific genetic deficits(see also Karmiloff-Smith, 2002; Karmiloff-Smith, 2007). In partic-ular, the genes related to WS might target a suite of visuospatialfunctions. To date, however, our understanding of the mechanismsunderlying the spatial impairment in WS is incomplete.
Early work on WS suggested that reconstruction of global struc-ture of visual stimuli was impaired, which led to the hypothesis thatvisuospatial integration, which is the combination or coordinationof separate elements into a unified group, was the root of WS spatialdeficits (Bellugi et al., 1999). WS individuals draw local elements ofNavon stimuli well, but often miscopy their global configurations(Bihrle, Bellugi, Delis, & Marks, 1989). Moreover, WS individuals of-ten fail to recreate the global configuration in block constructiontasks (Hoffman, Landau, & Pagani, 2003). However, the severe defi-cits in these visual–spatial construction tasks are not observed inperception tasks using the same stimuli. Farran and Jarrold (2003)reported that the global configurations of Navon stimuli were drawnpoorly by WS individuals (see also Georgopoulos, Georgopoulos,Kurz, & Landau, 2004), but were perceptually identified well relativeto controls. This suggests that the integration difficulty experiencedby people with WS may not extend to strictly perceptual processes.
Evidence on this issue is mixed. WS individuals can use group-ing properties to accelerate visual search (Pani, Mervis, & Robinson,1999), and are susceptible to visual illusions (Palomares, Ogbonna,Landau, & Egeth, 2008). However, Gestalt grouping by shape, orien-tation and proximity is perceived poorly by WS individuals, whilegrouping by luminance, closure and alignment is perceived nor-mally relative to controls, suggesting that not all global configura-tions are perceived in a typical manner (Farran, 2005). It has alsobeen reported that detection of contours composed of collineargratings is impaired in WS (Kovacs, Lukacs, Feher, Racsmany, &Pleh, 2001).
1.2. Weber’s law and predictions
In typical adults, interpolation of high contrast, broadbandstimuli generally scales with inter-element separation (Hess &Hayes, 1993; Hess & Hayes, 1994; Levi et al., 1987). That is, typicaladult observers have constant Weber fractions for judging relativeposition across near and far elements. Here, we asked whether theinterpolation function of typical children and WS individuals scalewith separation as in typical adults (Fig. 1a), or whether it deviatesfrom scaling (Fig. 1b).
Fig. 1 shows two possible outcomes for our study (see Appen-dix for details). The dashed lines represent the interpolation func-tions of typical adults, which have log–log slopes of 1. Farran andJarrold (2005) found that judgment of relative position is less pre-cise in WS individuals than in typical adults. One possibility isthat this imprecision is a constant proportion of inter-elementseparation. This case would be depicted by a vertical translationof the WS interpolation function relative to the typical adult func-tion. That is, these results would indicate that although the We-ber fractions for judging relative position are different for WSindividuals compared to typical adults, the Weber fractions areconstant across inter-element separation in both WS individualsand typical adults (Fig. 1a).
Alternatively, the imprecision for judging relative position maynot be a constant proportion of inter-element separation. A differ-ence in slope with no difference in intercept (Fig. 1b) would indi-cate that the interpolation function of WS individuals does notscale with separation, unlike the interpolation function of typicaladults. That is, in WS individuals, the Weber fraction for judgingrelative position may vary with inter-element separation(Fig. 1b). The pattern of results depicted in Fig. 1b would suggestthat mechanisms underlying visuospatial integration in WS areatypical compared to those of typical adults.
2. Experiment 1: Interpolation of three squares
In this study, we used a two-alternative forced choice version ofthe three-point Vernier alignment task over a wide range of inter-element spacing (Fig. 2) to determine how positional precision var-ied over distance and whether it differed for normally developingchildren and WS individuals compared to typical adults.
2.1. Methods
2.1.1. ParticipantsSixty observers with normal or corrected-to-normal vision par-
ticipated in this experiment. There were five participant groupseach with 12 observers. These included individuals with WS (mean
Fig. 1. Predictions for three-point Vernier tasks. (a) Vertical translation of interpo-lation function without a change in slope. (b) Change in the slope of theinterpolation function. Solid lines represent thresholds of WS and dashed linesrepresent thresholds of normal adults. See text and Appendix A for details.
Fig. 2. Schematic of stimuli in Experiment 1. Observers were asked which group ofsquares, left or right, was misaligned. We measured positional offset thresholds as afunction of inter-element separation (1.5, 3.0, 4.5, 6.0 and 11.5 deg).
2440 M. Palomares et al. / Vision Research 48 (2008) 2439–2450

Author's personal copy
age = 18 years; minimum age = 11 years 4 months; maximumage = 24 years 5 months), typical adults (mean age = 23 years2 months), typically developing children aged 3–4 years (meanage = 4 years 2 months), 5–6 years (mean age = 5 years 8 months)and 7–9 years (mean age = 8 years 7 months). Our study trackedtypical development of visuospatial interpolation, which allowedus to compare performance of WS to performance of typicalobservers at different ages.
All WS observers were positively diagnosed by a geneticist forthe WS genetic marker with a fluorescent in situ hybridization test.WS observers were given the Kaufman Brief Intelligence Tests ver-sion 2 (KBIT2), an intelligence test that measures vocabulary (ver-bal) and non-verbal analytical skills (matrices), as well as the blockconstruction subtest of the Differential Abilities Scales (DAS; Elliot,1990). The WS group had mean raw scores of 54 (range of 35–77)for verbal and 23 for matrices (range of 15–32) components of theKBIT2. The KBIT2 verbal scores fell below the 18th percentile forchronological age, while the matrices scores fell below the 32ndpercentile. These correspond to scores of typical 9- to 10-year olds(verbal) and 7- to 8-year olds (matrices) at the 50th percentile. Themean full IQ of the WS group was 68 (range of 40–88). The mean ofthe DAS block construction scores was 104 (range of 40–126),which fell below the 7th percentile for chronological age. Thesecorrespond to scores of typical 6- to 7-year olds at the 50thpercentile.
2.1.2. Stimuli, design and procedureThis experiment was executed on an Apple iMac G3 computer
attached to a 1900 NEC monitor using MATLAB software with theVideoToolbox (Pelli, 1997) and Psychophysics Toolbox extensions(Brainard, 1997). The gray background luminance was set to themiddle of the monitor range, about 18 cd/m2. The stimuli weretwo groups of three white squares (Fig. 2), one group 8.0 deg leftand the other 8.0 deg right from the center of the monitor (i.e.,stimulus groups were 16 deg apart). The squares in each groupwere 1.0 deg � 1.0 deg in size, and were aligned vertically. Eachgroup had vertical inter-element separations of 1.5, 3.0, 4.5, 6.0or 11.5 deg (measured from the center of the squares) that variedacross experimental blocks. Observers sat 48 cm away from themonitor.
In each trial, one group of squares was perfectly aligned, whilethe other was misaligned due to a horizontal positional offset of amiddle square. Observers were instructed to point to which groupof squares, the left or right, was misaligned. The experimenternoted the observers’ choice by typing ‘‘1” for left and ‘‘2” for rightusing the number pad on the keyboard. The stimuli remained onthe screen until response, and observers were allowed to freelymake eye movements. On 25% of randomly chosen correct trials,the computer played a verbal recording of ‘‘Good job”, or ‘‘Excel-lent” as feedback. No feedback was given on incorrect trials.
Positional alignment thresholds were measured using an adap-tive staircase method. The horizontal positional offset progres-sively decreased until the observer makes an error, after whichthe offset increased. For each experimental block, the initial hori-zontal positional offset (at Trial 1) was 30% of the inter-elementseparation (e.g. the initial offset was 0.45 deg at 1.5 deg inter-ele-ment distance). After a correct trial, the subsequent trial was mademore difficult by reducing the current horizontal positional offsetby 30%. After an incorrect trial, the subsequent trial was made eas-ier by increasing the offset by 60%. For example if an observerchose the correct answer in a trial with a 0.5-deg offset, the subse-quent trial would have an offset of 0.35 deg. Alternatively, anincorrect trial would result in an offset of 0.8 deg in the subsequenttrial. The positional threshold was the average of the last threepositional offsets at which observers made errors. The number oftrials was fixed at 25 for WS individuals and typical 3- to 4-year
old children, 35 for typical 5- to 6- and 7- to 9-year-old children,and either 40 or 45 for typical adults.1 Accuracies for each blockconverged to about 70% correct.
2.2. Results
2.2.1. Comparing thresholds of Williams Syndrome individuals andtypical adults
Positional thresholds were plotted as a function of inter-ele-ment separation. We compared thresholds of WS individuals withthose of typical adults (Fig. 3a). We found that positional thresh-olds of typical adults had a log–log slope of 1.03 (R = .703). Thisshows that visuospatial interpolation scales (on a unit slope) as afunction of inter-element separation, which replicates results ofother studies on positional alignment (Hess & Hayes, 1993; Hess& Hayes, 1994; Levi et al., 1987). However, we found that thresh-olds of WS individuals did not scale with inter-element distance;log–log slope of 1.62 (R = .773). That is, they had a different Weberfraction for integrating near and far elements. Fig. 3a shows thatthresholds of typical adults and WS individuals diverge at far sep-arations and converge at near inter-element separations. A 5 (in-ter-element separation) � 2 (participant group) ANOVA on logthresholds shows significant effect of inter-element separation,F(4,88) = 75.379; p < .001, a significant difference between WSand typical adults, F(1,22) = 31.372; p < .001, and more impor-tantly, a significant interaction between inter-element separationand participant group, F(4,88) = 7.394; p < .001. Tukey post-hocanalyses showed that thresholds of WS individuals were signifi-cantly higher than thresholds of typical adults at inter-elementseparations of 3.0 deg (p < .001), 4.5 deg (p < .001), 6.0 deg(p = .011) and 11.5 deg (p < .001), but not at 1.5 deg (p = 1.000).
Planned t-tests were also performed for the nearest (1.5 deg)and farthest (11.5 deg) inter-element separation. We found thatthe log thresholds of WS individuals and typical adults were notsignificantly different at the nearest separation, t(22) = 0.079;p = .938, but were significantly different at the farthest separation,t(22) = 5.409; p < .001. This pattern of results indicates that inte-gration of positional information in WS is not a generalized impair-ment. WS individuals had difficulty in integrating positional overdistant locations, but are within normal range in integrating infor-mation over near locations.
2.2.2. Thresholds of typically developing childrenWe also looked at how typical maturation affects visuospatial
interpolation (Fig. 3b–d) to address the possibility that elevatedpositional thresholds of WS over distant locations might be dueto arrest or retardation of visual functions. If this is the case, theninterpolation functions of typical children should also have in-creased slopes relative to typical adults.
Indeed, interpolation functions of typical children had slopes thatdecrease over development: 1.61 for 3- to 4-year olds (R = .805), 1.40for 5- to 6-year olds (R = .839), 1.29 for 7- to 9-year olds (R = .829)and 1.03 for typical adults (R = .703), indicating that interpolationfunctions of typical children do not scale with inter-element separa-tion (i.e., slope – 1.0). This shows that typical children have differentWeber fractions for close and far inter-element separations that be-come a single consistent Weber fraction over development.
1 The number of trials was chosen based on an a priori assumption that WSindividuals and normal children would be worse than normal adults on this task,which would necessitate more trials for normal adults. That is, WS individuals andnormal children would reach threshold more quickly, with fewer trials than normaladults. Due to experimenter error in Experiment 1, different numbers of trials wereused in the normal adult group: six normal adults had 40 trials and six normal adultshad 45 trials across all conditions. In Experiment 2, all 12 normal adults had 40 trialsfor each condition.
M. Palomares et al. / Vision Research 48 (2008) 2439–2450 2441

Author's personal copy
In other words, we found that age affected positional thresh-olds at more distant inter-element spacing, but not at nearerspacing (Fig. 3b–d). A more detailed assessment using a 5 (in-ter-element separation) � 4 (participant group) ANOVA on logthresholds of typical children and adults indicated a significanteffect of inter-element separation, F(4,176) = 167.026; p < .001,a significant effect of age group, F(3,44) = 2.540; p < .001, and asignificant interaction between them, F(12,176) = 2.887;p = .001. Tukey’s post-hoc analyses were conducted: at the near-est inter-element separation of 1.5 deg, positional thresholds didnot vary across age (p values > 0.20). At 3.0 deg, thresholds of 3-to 4-year olds (p = .008) and 5- to 6-year olds (p = .040) werehigher than thresholds of typical adults. At 4.5 deg, thresholdsof 3- to 4-year olds (p < .001) and 5- to 6-year olds (p = .007)were higher than thresholds of typical adults. Thresholds of 3-to 4-year olds were also higher than thresholds of 7- to 9-yearolds (p = .002). At 6.0 deg, thresholds of 3- to 4-year olds werehigher than thresholds of typical adults. At 11.5 deg, thresholdsof 3- to 4-year olds (p < .001) and 5- to 6-year olds (p = .047)were higher than thresholds of typical adults. Thresholds of 3-to 4-year olds were also higher than thresholds of 7- to 9-yearolds (p = .001).
2.2.3. Comparing thresholds of typically developing children and WSWe also compared thresholds of WS individuals and typical
children directly by conducting three separate 5 (inter-elementseparation) � 2 (participant groups) ANOVAs. Thresholds of WSindividuals and 3- to 4-year olds showed no main effect of groupF(1,22) = 0.011, p = .917 and no interaction with distanceF(4,88) = 0.822; p = .515. Thresholds of WS individuals and 5-to 6-year olds showed a significant main effect of groupF(1,22) = 5.658, p = .026 but no interaction with distanceF(4,88) = 0.856; p = .493. Thresholds of WS individuals and 7-to 9-year olds showed a significant main effect of groupF(1,22) = 22.430, p < .001 and a significant interaction with dis-tance F(4,88) = 3.867; p = .008. These results are consistent withthe idea that interpolation abilities of WS individuals are imma-ture, similar to the level of typical 3- to 4-year olds.
2.2.4. Correlations of WS scoresWe computed correlations in order to determine whether our
measures of visuospatial interpolation were related to scores ofWS individuals on standardized tests. First, we evaluated whetherour interpolation task was related to block construction by corre-lating positional thresholds with DAS block construction rawscores. Across all inter-element separations, we found no signifi-cant correlations with block construction (p values >.20). Second,we evaluated whether our interpolation task was related to lan-
guage abilities by correlating positional thresholds with the KBIT2verbal raw scores. Across all inter-element separations, we foundno significant correlations verbal scores (p values >.15). Third, weevaluated whether our interpolation task was related to non-ver-bal abilities by correlating positional thresholds with the KBIT2matrices raw scores. Across all inter-element separations, wefound no significant correlations with non-verbal scores (p values>.20). In addition, all possible correlations among chronologicalage, DAS block construction and KBIT2 (verbal and matrices) scoreswere non-significant2 (p values >.05).
2.3. Discussion
In Experiment 1, we found that interpolation functions of WSindividuals and typical children did not scale with inter-elementseparation (i.e., slope – 1.0), while the interpolation function oftypical adults did scale (i.e., slope = 1.0). At near locations, posi-tional thresholds across all participant groups did not differ sug-gesting that interpolation within this condition was typical in WSand adult-like in typical children. At distant locations, positionalthresholds of WS and typical children were elevated compared tothose of typical adults suggesting that interpolation within thiscondition may be mediated by immature mechanisms in WS andtypical children. Specifically, interpolation abilities in WS mightbe arrested or delayed at the level of typical 3- to 4-year olds.
One possible explanation for our results is the idea that in WSindividuals and typical children the grouping mechanisms that en-able long-range integration of spatial information are immature,consistent with the results of Kovacs and colleagues (Kovacs,2000; Kovacs, Kozma, Feher, & Benedek, 1999). More generally,they may have difficulty in spatial integration when groupingproperties in the stimulus are weak (proximity, in this case; Farran,2005). This idea is consistent with the results of Palomares et al.(2008), in which nearby illusion context affected size discrimina-tion in WS individuals and typical children to the same degree astypical adults. It is a common observation that the closer thingsare the more likely they are organized into one group. Classic psy-chological demonstrations of grouping indicate that children havea stronger bias for perceiving global shapes compared with adults.When presented with a hierarchical figure, such as a letter ‘‘A”made up of smaller letters ‘‘Bs”, typical children and adults respondfaster for the identification of global shape, the letter ‘‘A”. However,the bias for quickly recognizing global forms (global precedence ef-fect) is stronger in younger children and diminishes to adult-like
2 The prevalence of non-significant correlations may be due to the narrow range inthe KBIT2 and DAS scores of our WS participants, which averaged below the 7thpercentile of their chronological age.
Fig. 3. Positional thresholds as a function of inter-element separation in Experiment 1. Solid lines represent threshold functions with slopes of (a) 1.62 for WS, (b) 1.61 for 3-to 4-year olds, (c) 1.40 for 5- to 6-year olds and (d) 1.29 for 7- to 9-year olds. Dashed lines in all panels represent threshold function for normal adults with a slope of 1.03.Thresholds of WS and normal 3- to 4-year olds are not significantly different. Thresholds of normal children improve with increasing age.
2442 M. Palomares et al. / Vision Research 48 (2008) 2439–2450
Author's personal copy
levels between the ages of 10 and 14 years (Mondloch, Geldart,Maurer, & de Schonen, 2003). This result is consistent with theGestaltist viewpoint that integration occurs automatically, andprovides evidence that integration occurs early in development.
In fact, our main experimental manipulation, inter-elementproximity, corresponds to a Gestalt grouping ‘‘law” (Wertheimer,1923). WS and typical children may be able to detect strong group-ing cues inherent in the stimuli as well as typical adults, but theymight have difficulty in integrating spatial information acrossstimuli with weak grouping cues.
To further test this hypothesis in the next experiment, we askedobservers to judge positional alignment within the context of illu-sory contours. Illusory contours have collinearity and closure cuesthat facilitate grouping of elements into a larger object that mayaid in localization judgments. In typical adults, formation of objectsvia illusory contours improves dot localization thresholds in typi-cal adults (Guttman & Kellman, 2004). If typical children and WSindividuals can integrate stimulus-based grouping cues, then thepresence of illusory contours should also improve localizationthresholds.
3. Experiment 2: Interpolation within illusory contours
The visual system has a tendency to complete contours in an im-age, despite occluding surfaces (Rauschenberger & Yantis, 2001) andmissing segments (Snodgrass & Feenan, 1990). Even in the absenceof color, luminance, depth, texture or motion discontinuities, someboundaries are perceived (Grossberg, Mingolla, & Ross, 1997)—these are illusory contours. Psychophysical studies have shown thatillusory contours, like real contours, facilitate localization of a dot(Guttman & Kellman, 2004; Pomerantz, Goldberg, Golder, & Tetew-sky, 1981) and discrimination of letters (Moore, Yantis, & Vaughan,1998). These studies are consistent with the idea that objectsformed by illusory contours conform to the rules of object-basedattention, in which spatial selection is enhanced (Roelfsema, Lam-me, & Spekreijse, 1998) or prioritized (Shomstein & Yantis, 2002)more within an object than across objects. This suggests that realand illusory contours are mediated by similar mechanisms.
Illusory contours can be perceived early in development, by asearly as 2 months (Curran, Braddick, Atkinson, Wattam-Bell, & An-drew, 1999). Likewise, WS individuals perceive illusory contourslike typical adults, despite having atypical ERP signatures (Griceet al., 2003). In this experiment, we added illusory contours toour stimuli to see how grouping cues from illusory contours affectour interpolation task across multiple separations in typical adults,typical children and WS individuals. Although, it is known that theperception of illusory contours is affected by the support ratio (i.e.,ratio of distance and size) of their inducers (Kellman & Shipley,1991), it is currently unknown how localization within the contextof illusory contours would be affected by inter-element separation.If illusory contours affect target localization in typical adults, typ-ical children and WS individuals in a similar manner, then it wouldsuggest that the ability of young children and WS to perceive anduse additional grouping cues from illusory contours are relativelymature. Alternatively, illusory contours may affect localization intypical children and WS individuals differently from typical adults,which would suggest that mechanisms underlying grouping viaillusory contours in young children and WS individuals are differ-ent from those of typical adults.
3.1. Methods
3.1.1. ParticipantsSixty observers with normal or corrected-to-normal vision par-
ticipated in this experiment. The individuals in the WS, 5- to
6-year-old and 7- to 9-year-old group from Experiment 1 alsoparticipated in Experiment 2. A new group of typical adults (meanage = 18 years 5 months), and typically developing 3- to 4-year-oldchildren (mean age = 4 years 3 months) were recruited. Eachparticipant group had 12 observers.
3.1.2. Stimuli, design and procedureThere were two kinds of stimuli in Experiment 2: one that cre-
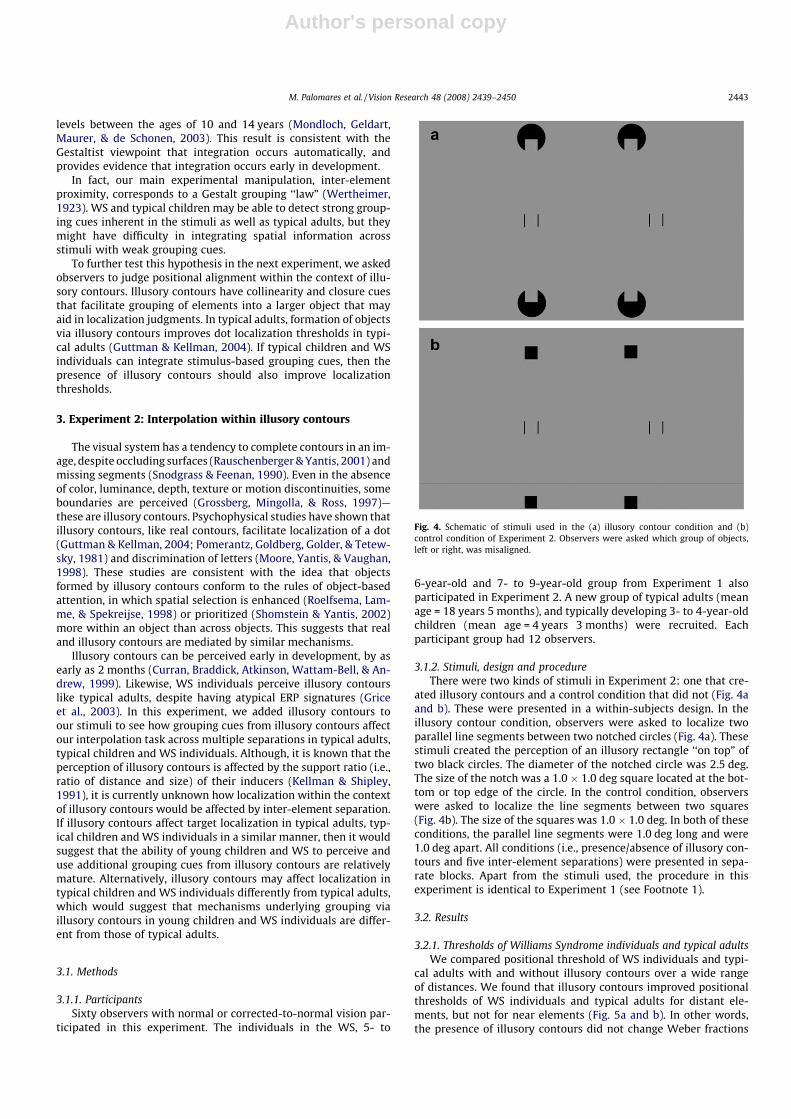
ated illusory contours and a control condition that did not (Fig. 4aand b). These were presented in a within-subjects design. In theillusory contour condition, observers were asked to localize twoparallel line segments between two notched circles (Fig. 4a). Thesestimuli created the perception of an illusory rectangle ‘‘on top” oftwo black circles. The diameter of the notched circle was 2.5 deg.The size of the notch was a 1.0 � 1.0 deg square located at the bot-tom or top edge of the circle. In the control condition, observerswere asked to localize the line segments between two squares(Fig. 4b). The size of the squares was 1.0 � 1.0 deg. In both of theseconditions, the parallel line segments were 1.0 deg long and were1.0 deg apart. All conditions (i.e., presence/absence of illusory con-tours and five inter-element separations) were presented in sepa-rate blocks. Apart from the stimuli used, the procedure in thisexperiment is identical to Experiment 1 (see Footnote 1).
3.2. Results
3.2.1. Thresholds of Williams Syndrome individuals and typical adultsWe compared positional threshold of WS individuals and typi-
cal adults with and without illusory contours over a wide rangeof distances. We found that illusory contours improved positionalthresholds of WS individuals and typical adults for distant ele-ments, but not for near elements (Fig. 5a and b). In other words,the presence of illusory contours did not change Weber fractions
Fig. 4. Schematic of stimuli used in the (a) illusory contour condition and (b)control condition of Experiment 2. Observers were asked which group of objects,left or right, was misaligned.
M. Palomares et al. / Vision Research 48 (2008) 2439–2450 2443

Author's personal copy
at the closest inter-element separation, but it decreased Weberfractions at the farthest separation. For WS individuals, the inter-polation function had a log–log slope of 1.48 (R = .857) in the con-trol condition and 1.21 (R = .746) in the illusory contour condition.For typical adults, the interpolation function had a log–log slope of1.01 (R = .801) in the control condition and 0.77 (R = .682) in theillusory contour condition.
To complement our regression analysis, a 5 (inter-element sep-aration) � 2 (participants group: WS vs. typical adults) � 2 (illu-sory contour condition) ANOVA on log thresholds showssignificant effects of participant group, F(1,22) = 342.357;p < .001, inter-element separation, F(4,88) = 96.682; p < .001 andillusory contour condition, F(1,22) = 38.102; p < .001. Tukey post-hoc analyses showed that positional thresholds of WS individualswere higher than positional thresholds of typical adults across allinter-element separations in both the control and illusory contourcondition (Supplementary Table 1). More importantly, however,the interaction between inter-element separation and participantgroup, F(4,88) = 4.840; p = .001, was significant, which reflectsthe difference in slopes of the interpolation function between WSand typical adults. The interaction between inter-element separa-tion and illusory contour condition, F(4,88) = 2.437; p = .053, wasalso nearly significant, which reflects the uneven effect of illusorycontours across inter-element separation.
Notably, interactions between condition and participant group,F(1,22) = 0.002; p = .968, and among condition, participant groupand inter-element separations, F(4,88) = 0.238; p = .916, werenon-significant, which implies that there were no differences be-tween WS and typical adults in how illusory contours affectedinterpolation. These results show that WS individuals are able touse collinear and/or closure grouping cues from illusory contoursto the same extent as typical adults, despite the fact that ERP sig-natures for detecting illusory contours have been reported to beatypical in WS (Grice et al., 2003).
Since we found the effect of participant group was most differ-ent at the endpoints of our interpolation functions in Experiment 1,planned t-tests were also conducted on the nearest (1.5 deg) andfarthest (11.5 deg) separations to isolate the effects of illusory con-tours and participant group. We found that positional thresholds at1.5 deg inter-element separation were not affected by illusory con-tours in either WS, t(11) = 0.527, p = .609, or typical adults,t(11) = 1.521, p = .157, while positional thresholds at 11.5 deg weresignificantly affected in both WS, t(11) = 4.609, p = .001, and typicaladults, t(11) = 4.549, p = .001. These results show that the presenceof illusory contours mainly facilitates interpolation of distant ele-ments, but provides no significant benefit for interpolating nearelements in both groups of WS individuals and typical adults. In
all conditions, we also found that thresholds of WS participantswere higher than thresholds of typical adults: in 1.5 deg control,t(22) = 4.529; p < .001, 11.5 deg control, t(22) = 10.598; p < .001,1.5 deg illusory contour, t(22) = 4.846; p < .001, and 11.5 deg illu-sory contour, t(22) = 9.814; p < .001, conditions. These are unlikethe results of Experiment 1, in which there was no difference be-tween thresholds of WS and adults at the nearest inter-elementseparation. It is not obvious why this difference may exist, butone explanation could be the degree of inter-element similarity.The elements were identical squares in Experiment 1 (Fig. 2), butwere dissimilar lines and notched circles in Experiment 2 (Fig. 4).Because similarity is a Gestalt grouping cue (Wertheimer, 1923),the presence of highly similar elements may have improvedthresholds of WS participants at the nearest separation in Experi-ment 1. Interpolation of identical elements may be easier thannon-identical elements because the observer may be able to usethe edges of the elements as well as their centers of mass.
3.2.2. Thresholds of typically developing childrenWe also looked at how illusory contours affected interpolation
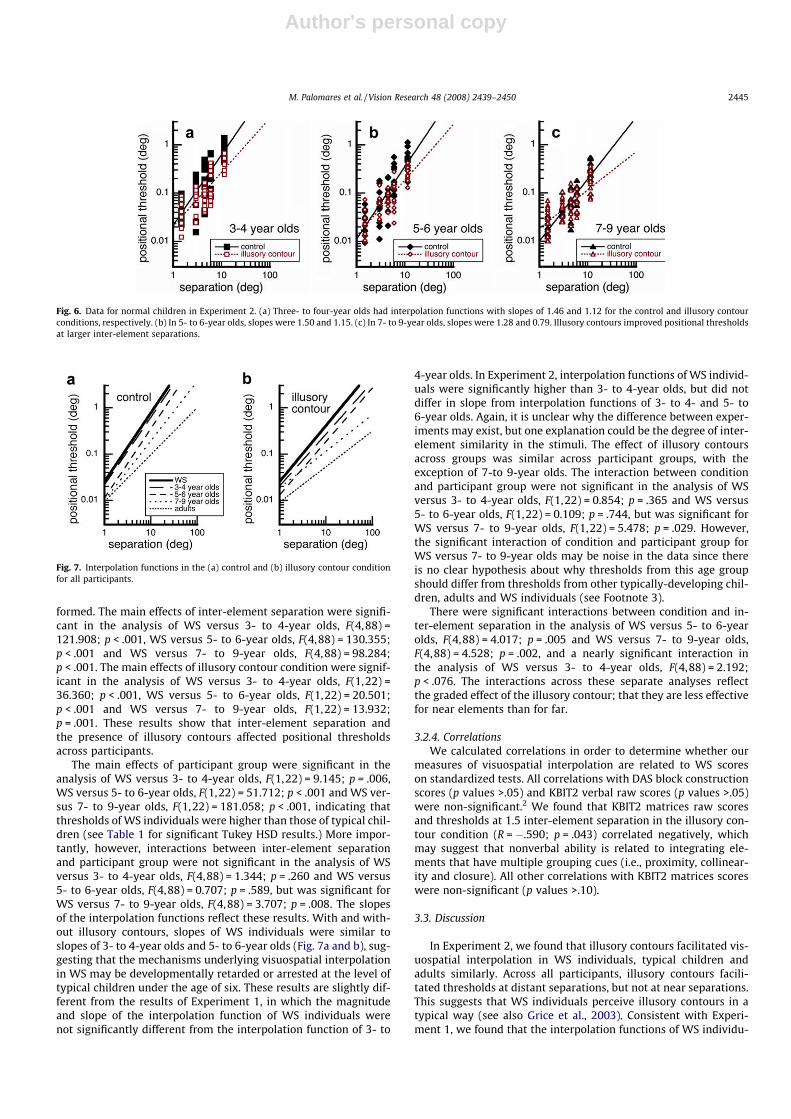
in typical development (Figs. 5b and 6a–c). A 5 (inter-element sep-aration) � 4 (participant group) � 2 (illusory contour condition)ANOVA on log thresholds of typical adults and children showedthat there were main effects of inter-element separation,F(4,176) = 289.248; p < .001, age group, F(3,44) = 69.900; p < .001and illusory contour condition, F(1,44) = 47.970; p < .001. Thesedata reflect the graded effect of inter-element separation over typ-ical development. There was a significant interaction of age and in-ter-element separation, F(12,176) = 2.688; p = .002, which reflectsthe deceasing slopes in the interpolation functions over develop-ment. In the control condition, interpolation functions had log–log slopes of 1.46 (R = .872) for 3- to 4-year olds, 1.50 (R = .800)for 5- to 6-year olds, 1.28 (R = .851) for 7- to 9-year olds and1.01 (R = .801) for adults. In the illusory contour condition, log–log slopes were 1.12 (R = .826) for 3- to 4-year olds, 1.15 for 5- to6-year olds, 0.79 (R = 0.724) for 7- to 9-year olds and 0.77(R = .682) for adults. Here, a log–log slope of less than 1.0 indicatesthat the facilitatory effects of illusory contours in interpolation aregreater at farther positions than at nearer positions.
The effect of illusory contours also varied over inter-elementseparation, as shown by the significant interaction between condi-tion and inter-element distance, F(4,176) = 7.066; p < .001. Illusorycontours were effective in facilitating interpolation of distant ele-ments in typical adults and children (Fig. 6a–c). The interactionamong condition, age group and inter-element separation wasnon-significant, F(12,176) = 0.978; p = .472. However, the interac-tion between condition and age group was significant,F(3,44) = 3.595; p = .021, which may be due to relatively elevatedthresholds of 7- to 9-year olds in the illusory contour condition.3
In both the control and illusory contour condition, positional thresh-olds generally decrease over development (Fig. 7; for significant Tu-key HSD results, see Supplementary Table 2).
3.2.3. Comparing thresholds of typically developing children and WSThree independent 5 (inter-element separation) � 2 (partici-
pant group: WS and typical children) � 2 (illusory contour condi-tion) ANOVAs comparing thresholds of WS to thresholds of 3- to4-year olds, 5- to 6-year olds and 7- to 9-year olds were also per-
3 For 7- to 9-year-old participants, the elevated thresholds in the illusory contourcondition were specifically due to elevated thresholds at the inter-element separationof 1.5 deg (see Supplementary results). At this separation, thresholds in the controlcondition were significantly higher than thresholds in the illusory contour condition,tone-tail (11) = �2.107; p = .03) for this age group. No other participant group at anyinter-element distance show this effect. It is unclear why this should be the case andmight be noise in the data.
Fig. 5. Data for WS individuals and normal adults in Experiment 2. (a) In the WSgroup, interpolation functions had slopes of 1.48 and 1.21 for the control andillusory contour conditions, respectively. (b) In normal adults, slopes were 1.01 and0.77. Illusory contours improved positional thresholds at larger inter-elementseparations.
2444 M. Palomares et al. / Vision Research 48 (2008) 2439–2450
Author's personal copy
formed. The main effects of inter-element separation were signifi-cant in the analysis of WS versus 3- to 4-year olds, F(4,88) =121.908; p < .001, WS versus 5- to 6-year olds, F(4,88) = 130.355;p < .001 and WS versus 7- to 9-year olds, F(4,88) = 98.284;p < .001. The main effects of illusory contour condition were signif-icant in the analysis of WS versus 3- to 4-year olds, F(1,22) =36.360; p < .001, WS versus 5- to 6-year olds, F(1,22) = 20.501;p < .001 and WS versus 7- to 9-year olds, F(1,22) = 13.932;p = .001. These results show that inter-element separation andthe presence of illusory contours affected positional thresholdsacross participants.
The main effects of participant group were significant in theanalysis of WS versus 3- to 4-year olds, F(1,22) = 9.145; p = .006,WS versus 5- to 6-year olds, F(1,22) = 51.712; p < .001 and WS ver-sus 7- to 9-year olds, F(1,22) = 181.058; p < .001, indicating thatthresholds of WS individuals were higher than those of typical chil-dren (see Table 1 for significant Tukey HSD results.) More impor-tantly, however, interactions between inter-element separationand participant group were not significant in the analysis of WSversus 3- to 4-year olds, F(4,88) = 1.344; p = .260 and WS versus5- to 6-year olds, F(4,88) = 0.707; p = .589, but was significant forWS versus 7- to 9-year olds, F(4,88) = 3.707; p = .008. The slopesof the interpolation functions reflect these results. With and with-out illusory contours, slopes of WS individuals were similar toslopes of 3- to 4-year olds and 5- to 6-year olds (Fig. 7a and b), sug-gesting that the mechanisms underlying visuospatial interpolationin WS may be developmentally retarded or arrested at the level oftypical children under the age of six. These results are slightly dif-ferent from the results of Experiment 1, in which the magnitudeand slope of the interpolation function of WS individuals werenot significantly different from the interpolation function of 3- to
4-year olds. In Experiment 2, interpolation functions of WS individ-uals were significantly higher than 3- to 4-year olds, but did notdiffer in slope from interpolation functions of 3- to 4- and 5- to6-year olds. Again, it is unclear why the difference between exper-iments may exist, but one explanation could be the degree of inter-element similarity in the stimuli. The effect of illusory contoursacross groups was similar across participant groups, with theexception of 7-to 9-year olds. The interaction between conditionand participant group were not significant in the analysis of WSversus 3- to 4-year olds, F(1,22) = 0.854; p = .365 and WS versus5- to 6-year olds, F(1,22) = 0.109; p = .744, but was significant forWS versus 7- to 9-year olds, F(1,22) = 5.478; p = .029. However,the significant interaction of condition and participant group forWS versus 7- to 9-year olds may be noise in the data since thereis no clear hypothesis about why thresholds from this age groupshould differ from thresholds from other typically-developing chil-dren, adults and WS individuals (see Footnote 3).
There were significant interactions between condition and in-ter-element separation in the analysis of WS versus 5- to 6-yearolds, F(4,88) = 4.017; p = .005 and WS versus 7- to 9-year olds,F(4,88) = 4.528; p = .002, and a nearly significant interaction inthe analysis of WS versus 3- to 4-year olds, F(4,88) = 2.192;p < .076. The interactions across these separate analyses reflectthe graded effect of the illusory contour; that they are less effectivefor near elements than for far.
3.2.4. CorrelationsWe calculated correlations in order to determine whether our
measures of visuospatial interpolation are related to WS scoreson standardized tests. All correlations with DAS block constructionscores (p values >.05) and KBIT2 verbal raw scores (p values >.05)were non-significant.2 We found that KBIT2 matrices raw scoresand thresholds at 1.5 inter-element separation in the illusory con-tour condition (R = �.590; p = .043) correlated negatively, whichmay suggest that nonverbal ability is related to integrating ele-ments that have multiple grouping cues (i.e., proximity, collinear-ity and closure). All other correlations with KBIT2 matrices scoreswere non-significant (p values >.10).
3.3. Discussion
In Experiment 2, we found that illusory contours facilitated vis-uospatial interpolation in WS individuals, typical children andadults similarly. Across all participants, illusory contours facili-tated thresholds at distant separations, but not at near separations.This suggests that WS individuals perceive illusory contours in atypical way (see also Grice et al., 2003). Consistent with Experi-ment 1, we found that the interpolation functions of WS individu-
Fig. 6. Data for normal children in Experiment 2. (a) Three- to four-year olds had interpolation functions with slopes of 1.46 and 1.12 for the control and illusory contourconditions, respectively. (b) In 5- to 6-year olds, slopes were 1.50 and 1.15. (c) In 7- to 9-year olds, slopes were 1.28 and 0.79. Illusory contours improved positional thresholdsat larger inter-element separations.
Fig. 7. Interpolation functions in the (a) control and (b) illusory contour conditionfor all participants.
M. Palomares et al. / Vision Research 48 (2008) 2439–2450 2445

Author's personal copy
als and typical children had higher slopes than the interpolationfunction of typical adults, suggesting that WS difficulties in visuo-spatial interpolation might be due to arrested or delayed visualfunctions. These results support the hypothesis that WS and typicalchildren can detect strong grouping cues as well as typical adults,but that they have difficulty in integrating spatial informationacross stimuli when grouping cues are weak. WS and typical chil-dren can detect grouping cues inherent in the stimuli as well astypical adults, but they have difficulty in integrating spatial infor-mation across stimuli with weak grouping cues.
Moreover, since the effect of illusory contours did not vary withparticipant group, while effect of separation did vary, our resultsimply that visuospatial integration within a single object (withinillusory contours) and across multiple objects (across threesquares) may have different developmental trajectories. They fur-ther indicate that these two types of integration have different sus-ceptibilities to damage in atypical development.
4. General discussion
We explored how WS individuals, typical children and typicaladults integrate visuospatial information across space. We manipu-lated two factors: inter-element separation and the presence of illu-sory contours. We found a consistent difference betweeninterpolation of near versus far elements: There was no effect ofparticipant group for integrating over near elements, while thresh-olds of WS individuals and typically developing children were high-er than thresholds of typical adults for integrating over far elements(Fig. 3). There was no effect of illusory contours for integrating overnear elements, while the presence of illusory contours improvedthresholds of all participant groups for integrating over farelements (Figs. 5–7). These results suggest that visuospatial inte-gration is highly dependent on inter-element proximity (see Quinn,Bhatt, & Hayden, 2008; Kubovy, Holocombe & Wagemans, 1998).
More importantly, we found that the effect of inter-elementseparation varied over participant group, while the effect of illu-sory contours did not. WS individuals and typical children hadhigher thresholds than typical adults (Figs. 3 and 7), but visuospa-tial interpolation by all participants was facilitated by illusory con-tours to the same degree (Figs. 6 and 7). We found that theintegration of distant elements has a different trajectory in typicaldevelopment, and a different susceptibility to damage in atypicaldevelopment than the integration of illusory contour cues. To-gether, these findings are consistent with the idea that visuospatialintegration involves various visual areas, whose computationalcontributions depend on the grouping cues inherent in the stimuli.When grouping cues such as proximity, closure or collinearity areweak, voluntary attention may be necessary to integrate visuospa-tial information in a top–down manner.
We hypothesize that our results can be explained in terms oftwo different kinds of integration: bottom–up and top–down. Wenow lay out the reasoning in support of this hypothesis, which in-cludes current theories on the mechanisms of bottom–up vs. top–down integration, their apparent brain bases, and the developmen-tal patterns in people with WS that suggest the possibility ofimpairment in top–down integration but not bottom–upintegration.
4.1. Mechanisms of bottom–up and top–down visuospatial integration
4.1.1. Theoretical and behavioral supportThere are two broad theories on how integration occurs. On the
one hand, Gestalt psychologists in the 1920s and 1930s observedthat elements are organized into whole objects readily and effort-lessly. They proposed six fundamental laws of grouping: proximity,
similarity, good continuation, common fate, closure and ‘‘goodnessof form” (Wertheimer, 1923). On the other hand, Treisman and col-leagues found that search for a complex, multi-featured objectamong distractors required more effort than search for simple fea-tures. They formulated Feature Integration Theory (Treisman & Ge-lade, 1980; Treisman & Schmidt, 1982), which contended thatintegration of multiple features was effortful and requires visualattention. We suggest that Gestalt laws are the bases for bot-tom–up integration, while voluntary attention is the basis fortop–down integration.
This hypothesis is consistent with human adult psychophysics,in which the proximity (Polat & Sagi, 1993) and alignment (Popple,Polat, & Bonneh, 2001) of flankers modulate grating contrast sensi-tivity. Moreover, as we have seen in our current data (Figs. 3, 6 and7), proximity and collinearity/closure also improves positionalalignment thresholds of high contrast stimuli (Popple et al.,2001; but see also Keeble & Hess, 1998). Waugh and Levi (1993)measured contrast thresholds and Vernier acuities of line segmentsacross various separations. They found that Vernier acuities de-pended on contrast at small separations, but were independentof contrast at large separations. These authors proposed that posi-tion acuity is governed by local spatial filters (i.e., receptive fields)at small separations and by a ‘‘local sign” mechanism, in whichabsolute positions are tagged and compared to obtain relative po-sition information, at large separations. Since the degree of Gestaltgrouping cues in the stimuli affect psychophysical data in adults,we speculate that it also accounts for our developmental data.
4.1.2. Possible neural basisThere is a growing body of evidence that the horizontal connec-
tions in layers 2/3 of V1 encode grouping properties in the stimuli(Chisum & Fitzpatrick, 2004). Gilbert and colleagues (Gilbert, Das,Ito, Kapadia, & Westheimer, 1996; Gilbert, Ito, Kapadia, & Westhei-mer, 2000; Kapadia, Ito, Gilbert, & Westheimer, 1995, Li & Gilbert,2002) have consistently found that neuronal response in V1 ismodulated by contextual stimuli. Single-cell recordings in monkeyhave resulted in increased neuronal firing rate to an oriented barwhen a collinear line segment is presented outside of its classicalreceptive field. Firing rate is dependent on the inter-element sepa-ration, on the relative positional offset as well as on the relativeorientation between the oriented bar and the neighboring line seg-ment (Gilbert et al., 1996).
Several other areas of the ventral visual pathway in addition toV1 seem to be modulated by stimulus-driven grouping cues. Alt-mann, Bulthoff, and Kourtzi (2003) have found that viewing collin-ear contours increases fMRI signals in V1, V2, VP, V4v and LOCrelative to viewing randomly oriented gratings. Moreover, percep-tion of grouped stimuli seems to alter fMRI activation in both V1and LOC (Murray, Kersten, Olshausen, Schrater, & Woods, 2002).These findings suggest that both primary visual cortex and higheroccipitotemporal areas are responsible for encoding groupingproperties found within the stimuli.
Whereas primary and ventral visual areas may mediate bottom-up integration, top–down visuospatial integration may be medi-ated by cortical area involved in visual attention. FMRI studieshave found that attentional selectivity over multiple elements de-pends on dorsal visual areas (Culham, Cavanagh, & Kanwisher,2001), particularly the parietal lobe. The findings of Ritzl et al.(2003) are particularly consistent with our hypothesis. They askedobservers to identify simple polygons (e.g. triangles, squares anddiamonds) composed of outlines, inducers that form illusory con-tours and reversed inducers that do not form illusory contours.They found significant activation in posterior parietal cortex whenbrain activations in the illusory contour and outline conditionswere subtracted from the activation in the reversed inducer condi-tion. When brain activation in the reversed inducer condition was
2446 M. Palomares et al. / Vision Research 48 (2008) 2439–2450

Author's personal copy
subtracted from the activation from the illusory contour and out-line conditions, there were greater activations in the LOC. They alsofound that when activation in the outline condition was subtractedfrom activation in the illusory contour condition, there was moreactivation in the occipital cortex, while the reverse of this contrast,(i.e., illusory contour condition subtracted from the outline condi-tion) activated temporal areas. The results of Ritzl et al. (2003) sug-gest that the same task (shape identification) increases activationin different brain areas depending on the grouping propertiesavailable in the stimuli.
Moreover, Gestalt properties of the stimuli have been found toimprove bisection, which is also a visuospatial interpolation task.Bisection of square activated the LOC (Fink, Marshall, Weiss,et al., 2000), while bisection of a line activated parietal cortex (Fink,Marshall, Shah, et al., 2000), suggesting that different brain areasare recruited for the same task depending on the number of group-ing cues (i.e., closure) within the stimuli. In addition, the presenceof illusory contours improved bisection performance in peoplewith hemispatial neglect due to parietal lobe damage (Vuilleumier,Valenza, & Landis, 2001). This result suggests that the parietal lobeis not necessary for the perception of illusory contours. It furthersuggests that functions primarily mediated by the parietal lobeare improved by activity in areas responsible for illusory contours(e.g. V1, V2, and LOC).
4.2. Integration in typically developing children and people with WS
Our results highlight the importance of investigating perceptualand cognitive functions in neuropsychological and developing pop-ulations, which may provide insight into what mechanisms under-lie functions in a typical and mature system. Previous studies intypical adults have yielded Weber’s Law in judging relative posi-tion as a function of inter-element separation, but they did not giveinformation on how this function might change acrossdevelopment.
We have replicated results from other studies of typical adults,in which we found near perfect scaling, log–log slope of 1.0, ofpositional thresholds with inter-element separation (Fig. 3a). Thisscaling of positional judgment with inter-element distance may re-flect the equilibrium between the relative activities in bottom–upand top–down grouping within a typical and mature visual system.More informatively, however, positional thresholds of typical chil-dren and WS individuals did not scale with inter-element separa-tion (Fig. 3b–d). In other words, Weber fractions of typicalchildren were different between near and far separations, whilethe Weber fraction of typical adults was the same. The interpola-tion functions of typical children and WS individuals were steeperthan that of typical adults due to higher positional thresholds forinterpolating distant elements. Since attentional mechanismsmay be immature in typical children (Gogtay et al., 2004) this vio-lation of scaling (i.e., slope – 1.0) may reflect the imbalance be-tween the relative activities in the mechanisms involved inbottom–up and top–down integration.4
Notably in our experiments, the effect of separation cannot beisolated from the effect of viewing eccentricity. Unless the task iscognitively demanding, peripheral acuity of 6- to 7-year olds(Whiteside, 1976) and the extent of visual fields of 2- to 3-year olds(Cummings, van Hof-van Duin, Mayer, Hansen, & Fulton, 1988) areadult-like. This suggests that the differences between typical
adults and children are not likely due to acuity differences betweentheir foveal and peripheral vision, but may be due to differences inintegrating information over wide distances.
The difficulty of WS people in voluntarily integrating posi-tional information from multiple locations is consistent withabnormalities in brain areas responsible for visual attention suchas the parietal lobe5 (Meyer-Lindenberg et al., 2004). We proposethat bottom–up integration of stimulus-driven grouping propertiesare intact in WS, while top–down integration by voluntary atten-tion is immature to the level of typical children under the age of6 years.6
Interestingly, WS individuals have gross anatomical abnormali-ties in the occipital lobe (Bellugi et al., 1999, Galaburda, Holinger,Bellugi & Sherman., 2002); but these do not give rise to atypicalperception of illusory contours (Grice et al., 2003) or contextual vi-sual illusions (Palomares et al., 2008). Grice et al. (2003) did findatypical ERP signatures in the WS occipital lobe for typical percep-tion of illusory contours. Of course more detailed psychophysicalinvestigation may yet reveal perceptual abnormalities, but it ispossible that atypical ERP signals come from the anatomical com-pression of the posterior portion of the WS brain rather thanreflecting the integrity of neuronal connectivity in V1, which medi-ates the perception of illusory contours (Grosof, Shapley & Haw-ken., 1993, Grossberg et al., 1997). The typical perception ofvarious visual illusions (Palomares et al., 2008), and the facilitativeeffect of illusory contours on interpolation in the present studysuggest that the mechanisms underlying illusory perception arenot impaired in people with WS.
Other studies have found that WS individuals have difficultyperceiving positional information at a distance. When asked tojudge the location of a dot relative to a central rectangle, Landauand Hoffman (2005) found that performance of WS children (8–14 years old) was no different from typically developing childrenmatched for verbal and non-verbal abilities (3–6 years old) whenthe dot and rectangle were close; but that it was impaired whenthe dot and rectangle were more distant. The performance of WSindividuals declined more sharply over distance than performanceof controls—a finding that echoes our present results. In addition,Farran and Jarrold (2005) asked WS adults to determine the posi-tion of a ‘‘ball” relative to the position of a ‘‘bat.” They found thatWS adults have broader positional tuning than typical adults, butare comparable to tuning of typically developing 4- to 6-year olds(Farran & Jarrold, 2005). This is consistent with our findings inExperiment 2, in which positional thresholds of WS were elevatedrelative to typical adults even at the nearest distance (Fig. 7). Far-ran and Jarrold (2005) also found that the peak of the spatial tuningwas somewhat shifted in WS. We cannot assess this bias in ourdata since we asked observers to determine which group of ele-ments was misaligned, and not to determine the direction of themisalignment. Nonetheless, our results, along with these studies,suggest that judgment of relative position for distant elements issomewhat impaired in WS.
4 Our data can be described as y = cx(b�d), where b and d independently modify theWeber fraction and c is a constant. The exponent b (top–down integration ofseparated elements) varies with age, and ranges from 1 (adults) to 1.5 (3- to 4-yearolds) in our data. However, the exponent d (bottom–up integration of collinear/closure cues from illusory contour) is invariant with age, and is estimated to be 0.3(see Appendix for details).
5 Abnormalities in the parietal lobe are consistent with a more general hypothesisthat dorsal visual functions are impaired in people with WS (e.g. Atkinson et al.,2003). However, WS individuals show deficits in many, but not all, of these functions.For example, WS individuals are able to detect motion coherence, but they havedifficulty detecting form from motion (Braddick, Atkinson, & Wattam-Bell, 2003;Reiss, Hoffman, & Landau, 2005).
6 The difference between bottom-up and top-down integration of visual informa-tion in WS and typical development might be related to the difference in the basicrepresentation of implicit and explicit information in development. Implicit andexplicit representations in visuospatial cognition (Palomares et al., 2008; Farran &Cole, 2008) and memory (Krinsky-McHale, Kittler, Brown, Jenkins, & Devenny, 2005)have been found to be functionally different in WS and typically-developing children.
M. Palomares et al. / Vision Research 48 (2008) 2439–2450 2447
Author's personal copy
5. Conclusions
Our study provides insight into the nature of visuospatial inte-gration over typical development and in people with WS who havesevere spatial impairment. First, we found that developmental pro-gression of near and distant elements were qualitatively different.WS individuals and typically developing children had higher posi-tional thresholds than typical adults for integrating distant spatialinformation, but had adult-like thresholds at proximate distances.Second, we found that WS individuals and typically developingchildren were adult-like in their ability to use closure and collin-earity cues from illusory contours to improve positional thresh-olds. Taken together, our data suggest that visuospatialintegration—our ‘‘position sense”—may recruit multiple mecha-nisms with variable developmental trajectories, whose relativecontributions depend on the grouping cues (e.g. proximity, collin-earity and closure) available in the stimuli.
Acknowledgments
We thank the Williams Syndrome Association, our participantsand their families, Abha Gupta, Gitana Chunyo and Whitney Streetfor help in recruiting and running participants. We thank SuzanneMcKee and Amy Shelton for comments on earlier drafts of thismanuscript. An NIH fellowship (F31-NS047979) to M.P., NSF(0117744), March of Dimes (04-4601-87), and NIH (RO1-NS050876) grants to B.L. funded this research. Preliminary datafrom this paper were presented at the 2005 and 2006 Vision Sci-ences Society Conference in Sarasota, FL.
Appendix A
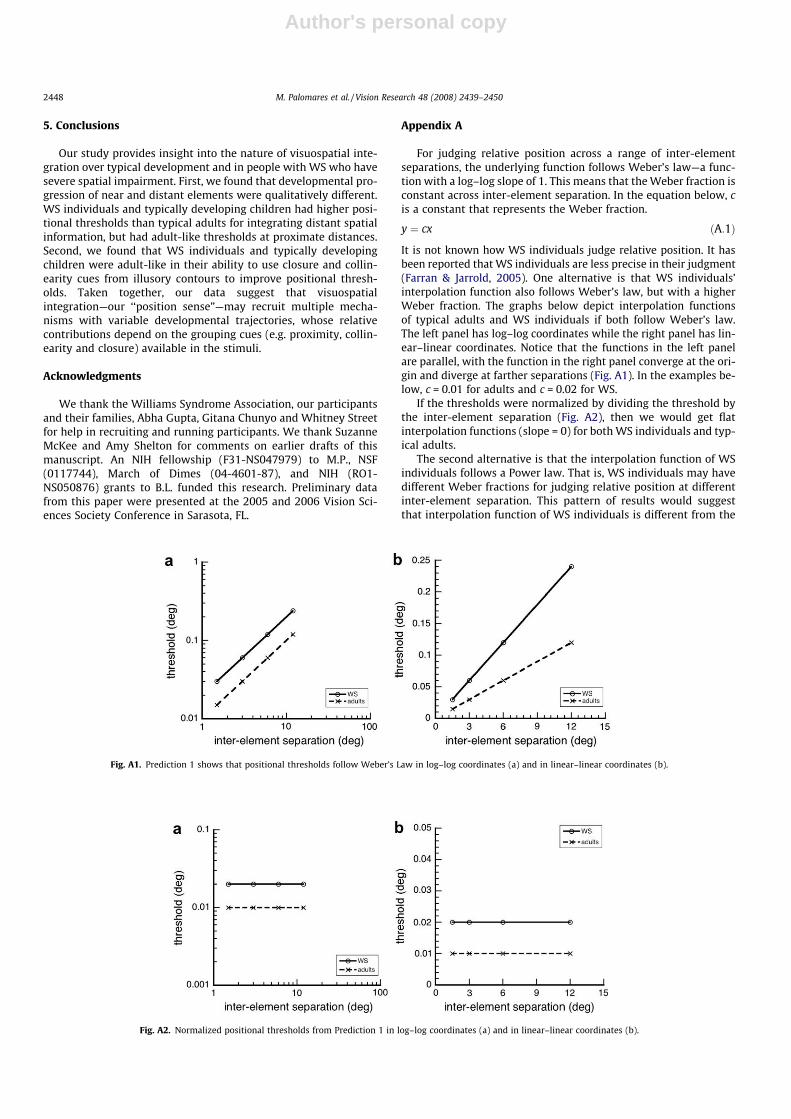
For judging relative position across a range of inter-elementseparations, the underlying function follows Weber’s law—a func-tion with a log–log slope of 1. This means that the Weber fraction isconstant across inter-element separation. In the equation below, cis a constant that represents the Weber fraction.
y ¼ cx ðA:1Þ
It is not known how WS individuals judge relative position. It hasbeen reported that WS individuals are less precise in their judgment(Farran & Jarrold, 2005). One alternative is that WS individuals’interpolation function also follows Weber’s law, but with a higherWeber fraction. The graphs below depict interpolation functionsof typical adults and WS individuals if both follow Weber’s law.The left panel has log–log coordinates while the right panel has lin-ear–linear coordinates. Notice that the functions in the left panelare parallel, with the function in the right panel converge at the ori-gin and diverge at farther separations (Fig. A1). In the examples be-low, c = 0.01 for adults and c = 0.02 for WS.
If the thresholds were normalized by dividing the threshold bythe inter-element separation (Fig. A2), then we would get flatinterpolation functions (slope = 0) for both WS individuals and typ-ical adults.
The second alternative is that the interpolation function of WSindividuals follows a Power law. That is, WS individuals may havedifferent Weber fractions for judging relative position at differentinter-element separation. This pattern of results would suggestthat interpolation function of WS individuals is different from the
Fig. A1. Prediction 1 shows that positional thresholds follow Weber’s Law in log–log coordinates (a) and in linear–linear coordinates (b).
Fig. A2. Normalized positional thresholds from Prediction 1 in log–log coordinates (a) and in linear–linear coordinates (b).
2448 M. Palomares et al. / Vision Research 48 (2008) 2439–2450

Author's personal copy
interpolation function of typical adults. In the equation below, c isa constant, and b is an exponent that modifies the Weber fraction.As you can see, the Power law is a more generalized form of We-ber’s law.
y ¼ cxb ðA:2Þ
The example graphs depict interpolation functions of typicaladults following Weber’s law and of WS individuals following aPower law. The left panel has log–log coordinates while the rightpanel has linear–linear coordinates. Notice that the functions inboth panels converge at the origin and diverge at farther separa-tions in Fig. A3. The slope of the log–log function corresponds tothe exponent, b. In these examples, c = 0.01; b = 1.5 for WS andb = 1.0 for typical adults.
If the thresholds were normalized by dividing the threshold bythe inter-element separation, then we would get flat interpolationfunctions (slope = 0) for typical adults, but not for WS individuals(log–log slope = 0.5) as in Fig. A4.
Appendix B. Supplementary data
Supplementary data associated with this article can be found, inthe online version, at doi:10.1016/j.visres.2008.08.012.
References
Altmann, C. F., Bulthoff, H. H., & Kourtzi, Z. (2003). Perceptual organization of localelements into global shapes in the human visual cortex. Current Biology, 13(4),342–349.
Atkinson, J., Braddick, O., Anker, S., Curran, W., Andrew, R., Wattam-Bell, J., et al.(2003). Neurobiological models of visuospatial cognition in children with
Williams syndrome: Measures of dorsal-stream and frontal function.Developmental Neuropsychology, 23(1-2), 139–172.
Bellugi, U., Lichtenberger, L., Mills, D., Galaburda, A., & Korenberg, J. R. (1999).Bridging cognition, the brain and molecular genetics: Evidence from Williamssyndrome. Trends in Neurosciences, 22(5), 197–207.
Bihrle, A. M., Bellugi, U., Delis, D., & Marks, S. (1989). Seeing either the forest or thetrees: Dissociation in visuospatial processing. Brain and Cognition, 11(1), 37–49.
Braddick, O., Atkinson, J., & Wattam-Bell, J. (2003). Normal and anomalousdevelopment of visual motion processing: Motion coherence and ‘dorsal-stream vulnerability’. Neuropsychologia, 41(13), 1769–1784.
Brainard, D. H. (1997). The psychophysics toolbox. Spatial Vision, 10(4), 433–436.Carkeet, A., Levi, D. M., & Manny, R. E. (1997). Development of Vernier acuity in
childhood. Optometry and Vision Science, 74(9), 741–750.Chisum, H. J., & Fitzpatrick, D. (2004). The contribution of vertical and horizontal
connections to the receptive field center and surround in V1. Neural Networks,17(5–6), 681–693.
Culham, J. C., Cavanagh, P., & Kanwisher, N. G. (2001). Attention response functions:Characterizing brain areas using fMRI activation during parametric variations ofattentional load. Neuron, 32(4), 737–745.
Cummings, M. F., van Hof-van Duin, J., Mayer, D. L., Hansen, R. M., & Fulton, A. B.(1988). Visual fields of young children. Behavioral and Brain Research, 29(1–2),7–16.
Curran, W., Braddick, O. J., Atkinson, J., Wattam-Bell, J., & Andrew, R. (1999).Development of illusory-contour perception in infants. Perception, 28(4),527–538.
Elliot, C. D. (1990). Differential abilities scale. San Diego: Harcourt, Brace, Jovanovich.Fang, M. S., Enoch, J. M., Lakshminarayanan, V., Kim, E., Kono, M., Strada, E.,
et al. (2000). The three point vernier alignment or acuity test (3Pt VAtest): an analysis of variance. Ophthalmic and Physiological Optics, 20(3),220–234.
Farran, E. K. (2005). Perceptual grouping ability in Williams syndrome: Evidence fordeviant patterns of performance. Neuropsychologia, 43(5), 815–822.
Farran, E. K., & Cole, V. L. (2008). Perceptual grouping and distance estimate intypical and atypical development: Comparing performance acrossperception, drawing and construction tasks. Brain and Cognition (Epubahead of print).
Farran, E. K., & Jarrold, C. (2003). Visuospatial cognition in Williams syndrome:Reviewing and accounting for the strengths and weaknesses in performance.Developmental Neuropsychology, 23(1–2), 173–200.
Fig. A3. Prediction 2 shows that positional thresholds of typical adults follow Weber’s Law, while thresholds of WS individuals follow Power law in log–log coordinates (a)and in linear–linear coordinates (b).
Fig. A4. Normalized positional thresholds from Prediction 2 in log–log coordinates (a) and in linear–linear coordinates (b).
M. Palomares et al. / Vision Research 48 (2008) 2439–2450 2449
Author's personal copy
Farran, E. K., & Jarrold, C. (2005). Evidence for unusual spatial location coding inWilliams syndrome: An explanation for the local bias in visuo-spatialconstruction tasks? Brain and Cognition, 59(2), 159–172.
Fink, G. R., Marshall, J. C., Shah, N. J., Weiss, P. H., Halligan, P. W., Grosse-Ruyken, M.,et al. (2000). Line bisection judgments implicate right parietal cortex andcerebellum as assessed by fMRI. Neurology, 54(6), 1324–1331.
Fink, G. R., Marshall, J. C., Weiss, P. H., Shah, N. J., Toni, I., Halligan, P. W., et al. (2000).‘Where’ depends on ‘what’: A differential functional anatomy for positiondiscrimination in one- versus two-dimensions. Neuropsychologia, 38(13),1741–1748.
Galaburda, A. M., Holinger, D. P., Bellugi, U., & Sherman, G. F. (2002). Williamssyndrome: Neuronal size and neuronal-packing density in primary visualcortex. Archives of Neurology, 59(9), 1461–1467.
Georgopoulos, M. A., Georgopoulos, A. P., Kurz, N., & Landau, B. (2004). Figurecopying in Williams syndrome and normal subjects. Experimental BrainResearch, 157(2), 137–146.
Gilbert, C. D., Das, A., Ito, M., Kapadia, M., & Westheimer, G. (1996). Spatialintegration and cortical dynamics. Proceedings of the National Academy ofSciences of the United States of America, 93(2), 615–622.
Gilbert, C., Ito, M., Kapadia, M., & Westheimer, G. (2000). Interactions betweenattention, context and learning in primary visual cortex. Vision Research, 40(10-12), 1217–1226.
Gogtay, N., Giedd, J. N., Lusk, L., Hayashi, K. M., Greenstein, D., Vaituzis, A. C., et al.(2004). Dynamic mapping of human cortical development during childhoodthrough early adulthood. Proceedings of the National Academy of Sciences of theUnited States of America, 101(21), 8174–8179.
Grice, S. J., Haan, M. D., Halit, H., Johnson, M. H., Csibra, G., Grant, J., et al. (2003). ERPabnormalities of illusory contour perception in Williams syndrome.Neuroreport, 14(14), 1773–1777.
Grosof, D. H., Shapley, R. M., & Hawken, M. J. (1993). Macaque V1 neurons can signal‘illusory’ contours. Nature, 365(6446), 550–552.
Grossberg, S., Mingolla, E., & Ross, W. D. (1997). Visual brain and visual perception:How does the cortex do perceptual grouping? Trends in Neurosciences, 20(3),106–111.
Guttman, S. E., & Kellman, P. J. (2004). Contour interpolation revealed by a dotlocalization paradigm. Vision Research, 44(15), 1799–1815.
Hess, R. F., & Hayes, A. (1993). Neural recruitment explains ‘‘Weber’s law” of spatialposition. Vision Research, 33(12), 1673–1684.
Hess, R. F., & Hayes, A. (1994). The coding of spatial position by the human visualsystem: Effects of spatial scale and retinal eccentricity. Vision Research, 34(5),625–643.
Hoffman, J. E., Landau, B., & Pagani, B. (2003). Spatial breakdown in spatialconstruction: Evidence from eye fixations in children with Williams syndrome.Cognitive Psychology, 46(3), 260–301.
Kapadia, M. K., Ito, M., Gilbert, C. D., & Westheimer, G. (1995). Improvement invisual sensitivity by changes in local context: Parallel studies in humanobservers and in V1 of alert monkeys. Neuron, 15(4), 843–856.
Karmiloff-Smith, A. (2002). Elementary, my dear, Watson, the clue is in the genes...or is it? Proceedings of the British Academy, 117, 525–543.
Karmiloff-Smith, A. (2007). Atypical epigenesis. Developmental Science, 10, 84–88.Keeble, D. R., & Hess, R. F. (1998). Orientation masks. 3. Gabor alignment
performance. Vision Research, 38(6), 827–840.Kellman, P. J., & Shipley, T. F. (1991). A theory of visual interpolation in object
perception. Cognitive Psychology, 23(2), 141–221.Kim, E., Enoch, J. M., Fang, M. S., Lakshminarayanan, V., Kono, M., Strada, E., et al.
(2000). Performance on the three-point Vernier alignment or acuity test as afunction of age: Measurement extended to ages 5 to 9 years. Optometry andVision Science, 77(9), 492–495.
Kovacs, I. (2000). Human development of perceptual organization. Vision Research,40(10–12), 1301–1310.
Kovacs, I., Kozma, P., Feher, A., & Benedek, G. (1999). Late maturation of visualspatial integration in humans. Proceedings of the National Academy of Sciences ofthe United States of America, 96(21), 12204–12209.
Kovacs, I., Lukacs, A., Feher, A., Racsmany, M., & Pleh, C. (2001). Contour integrationdeficit in Williams Syndrome children (abstract). Journal of Vision, 1(3), 146.146a. Available at: <http://journalofvision.org/1/3/146/>, doi: 10.1167/1.3.146.
Krinsky-McHale, S. J., Kittler, P., Brown, W. T., Jenkins, E. C., & Devenny, D. A. (2005).Repetition priming in adults with Williams syndrome: Age-related dissociationbetween implicit and explicit memory. American Journal of Mental Retardation,110(6), 482–496.
Kubovy, M., Holcombe, A. O., & Wagemans, J. (1998). On the lawfulness of groupingby proximity. Cognitive Psychology, 35(1), 71–98.
Landau, B., & Hoffman, J. E. (2005). Parallels between spatial cognition and spatiallanguage: Evidence from Williams syndrome. Journal of Language and Memory,53(2), 163–185.
Lenhoff, H. M., Wang, P. P., Greenberg, F., & Bellugi, U. (1997). Williams syndromeand the brain. Scientific American, 277(6), 68–73.
Levi, D. M., Klein, S. A., & Yap, Y. L. (1987). Positional uncertainty in peripheral andamblyopic vision. Vision Research, 27(4), 581–597.
Li, W., & Gilbert, C. D. (2002). Global contour saliency and local colinear interactions.Journal of Neurophysiology, 88(5), 2846–2856.
Meyer-Lindenberg, A., Kohn, P., Mervis, C. B., Kippenhan, J. S., Olsen, R. K., Morris, C.A., et al. (2004). Neural basis of genetically determined visuospatialconstruction deficit in Williams syndrome. Neuron, 43(5), 623–631.
Mondloch, C. J., Geldart, S., Maurer, D., & de Schonen, S. (2003). Developmentalchanges in the processing of hierarchical shapes continue into adolescence.Journal of Experimental Child Psychology, 84(1), 20–40.
Moore, C. M., Yantis, S., & Vaughan, B. (1998). Object-based visual selection:Evidence from perceptual completion. Psychological Science, 9(2), 104–110.
Murray, S. O., Kersten, D., Olshausen, B. A., Schrater, P., & Woods, D. L. (2002). Shapeperception reduces activity in human primary visual cortex. Proceedings of theNational Academy of Sciences of the United States of America, 99(23),15164–15169.
Palomares, M., Ogbonna, C. O., Landau, B., & Egeth, H. (2008). Normal susceptibilityto visual illusions in abnormal development: Evidence from WilliamsSyndrome. Perception, 37, doi:10.1068/p6044.
Pani, J. R., Mervis, C. B., & Robinson, B. F. (1999). Global spatial organizationby individuals with Williams Syndrome. Psychological Science, 10(5),453–458.
Pelli, D. G. (1997). The VideoToolbox software for visual psychophysics:Transforming numbers into movies. Spatial Vision, 10(4), 437–442.
Polat, U., & Sagi, D. (1993). Lateral interactions between spatial channels:Suppression and facilitation revealed by lateral masking experiments. VisionResearch, 33(7), 993–999.
Pomerantz, J. R., Goldberg, D. M., Golder, P. S., & Tetewsky, S. (1981). Subjectivecontours can facilitate performance in a reaction-time task. Perception &Psychophysics, 29(6), 605–611.
Popple, A., Polat, U., & Bonneh, Y. (2001). Collinear effects on 3-Gabor alignmentas a function of spacing, orientation and detectability. Spatial Vision, 14(2),139–150.
Quinn, P. C., Bhatt, R. S., & Hayden, A. (2008). Young infants readily use proximity toorganize visual pattern information. Acta Psychologica (Amsterdam), 127(2),289–298.
Rauschenberger, R., & Yantis, S. (2001). Attentional capture by globally definedobjects. Perception & Psychophysics, 63(7), 1250–1261.
Reiss, J. E., Hoffman, J. E., & Landau, B. (2005). Motion processing specialization inWilliams syndrome. Vision Research, 45(27), 3379–3390.
Ritzl, A., Marshall, J. C., Weiss, P. H., Zafiris, O., Shah, N. J., Zilles, K., et al. (2003).Functional anatomy and differential time courses of neural processing forexplicit, inferred, and illusory contours: An event-related fMRI study.Neuroimage, 19(4), 1567–1577.
Roelfsema, P. R., Lamme, V. A., & Spekreijse, H. (1998). Object-based attention inthe primary visual cortex of the macaque monkey. Nature, 395(6700),376–381.
Shomstein, S., & Yantis, S. (2002). Object-based attention: Sensory modulation orpriority setting? Perception & Psychophysics, 64(1), 41–51.
Snodgrass, J. G., & Feenan, K. (1990). Priming effects in picture fragmentcompletion: Support for the perceptual closure hypothesis. Journal ofExperimental Psychology—General, 119(3), 276–296.
Treisman, A. M., & Gelade, G. (1980). A feature-integration theory of attention.Cognitive Psychology, 12(1), 97–136.
Treisman, A., & Schmidt, H. (1982). Illusory conjunctions in the perception ofobjects. Cognitive Psychology, 14(1), 107–141.
Vuilleumier, P., Valenza, N., & Landis, T. (2001). Explicit and implicit perception ofillusory contours in unilateral spatial neglect: Behavioural and anatomicalcorrelates of preattentive grouping mechanisms. Neuropsychologia, 39(6),597–610.
Waugh, S. J., & Levi, D. M. (1993). Visibility and Vernier acuity for separated targets.Vision Research, 33(4), 539–552.
Wertheimer, G. (1923). Untersuchungen zur Lehre von der Gestalt II,Psychologische Forshung, 301-350. In W. D. Ellis (Ed.), A Source Book of GestaltPsychology (Vol. 4, pp. 71–88). London: Harcourt, Brace and Javanovich.
Westheimer, G., & McKee, S. P. (1977). Integration regions for visual hyperacuity.Vision Research, 17(1), 89–93.
Whiteside, J. A. (1976). Peripheral vision in children and adults. Child Development,47(1), 290–293.
Yebra-Pimentel Vilar, E., Giraldez-Fernandez, M. J., Enoch, J. M., Lakshminarayanan,V., Knowles, R., & Srinivasan, R. (1995). Performance on three-point vernieracuity targets as a function of age. Journal of the Optical Society of America A-Optical Image Science and Vision, 12(10), 2293–2304.
2450 M. Palomares et al. / Vision Research 48 (2008) 2439–2450