author's personal copy - renewable & appropriate energy ... · pdf fileplacing wind...
TRANSCRIPT

Short Communication
Where, when and how much wind is available? A provincial-scalewind resource assessment for China
Gang He a,b,n, Daniel M. Kammen a,b,c
a Renewable and Appropriate Energy Laboratory, University of California, Berkeley, CA 94720, USAb Energy and Resources Group, University of California, Berkeley, CA 94720, USAc Goldman School of Public Policy, University of California, Berkeley, CA 94720, USA
H I G H L I G H T S
� We assessed China's wind resources by utilizing 10 years of hourly wind speed data of 200 sites.� We built provincial scale wind speed profiles and develop provincial capacity factors for China.� We found that China's wind generation could reach 2000 TWh to 3500 TWh annually.� We observed similar temporal variation pattern of wind availability across China.
a r t i c l e i n f o
Article history:Received 17 March 2014Received in revised form1 July 2014Accepted 5 July 2014
Keywords:Wind resources assessmentSpatial and temporal variationChinaHigh resolutionWind
a b s t r a c t
China's wind installed capacity has grown at a remarkable rate, over 80% annually average growth since2005, reaching 91.5 GW of capacity by end of 2013, accounting for over 27% of global capacity. This rapidgrowth has been the result of a domestic manufacturing base and favorable national policies. Furtherevolution will be greatly aided with a detailed wind resource assessment that incorporates spatial andtemporal variability across China. We utilized 200 representative locations for which 10 years of hourlywind speed data exist to develop provincial capacity factors from 2001 to 2010, and to build analyticwind speed profiles. From these data and analysis we find that China's annual wind generation couldreach 2000 TWh to 3500 TWh. Nationally this would correspond to an average capacity factor of 0.18.The diurnal and seasonal variation shows spring and winter has better wind resources than in thesummer and fall. A highly interconnected and coordinated power system is needed to effectively exploitthis large but variable resource. A full economic assessment of exploitable wind resources demands alarger, systems-level analysis of China's energy options, for which this work is a core requirement.
Published by Elsevier Ltd.
1. Introduction
China's installed wind capacity has been growing at an unpre-cedented pace, by end of 2013, the total installed capacity hasreached 91.5 GW, a 16.1 GW growth from 2012 and over 80%annually average since 2005 (CWEA, 2013; GWEC, 2014). Totalwind electricity generation was 100.8 terawatt-hours (TWh) in2012, accounting for 2% of China total electricity consumption,placing wind behind only coal and hydropower, with a calculatedaverage capacity factor of 18.36% (CWEA, 2013; NEA, 2013). Despitethis rapid progress continues, wind development in China faceschallenges of grid connection (He and Morse, 2013; Lewis, 2012; Li
et al., 2012; Zhao et al., 2013). According to the wind integrationregulatory report in key regions released by the State ElectricityRegulatory Commission, about 12.3 TWh wind electricity was lostin the curtailment in 2011, with an average curtailment rate ofabout 16%, resulting to a loss of 6.6 billion RMB (SERC, 2012).
The essential difficulties of integrating wind power lies in itshigh cross-spatial imbalance, inter-temporal variation and limitedpredictability (Xia and Song, 2009; Xie et al., 2011). The variabilityof the wind resource, impacts the availability, dispatchability,and reliability of the electricity unless larger, regional planningand synergies between intermittent and dispatachable resourcesare integrated into the planning grid (Loutan et al., 2009; Luet al., 2009; Masters, 2004; Nelson et al., 2012). However, windresources can be managed through better wind resources assess-ment, proper plant interconnection, integration, transmissionplanning, and system and market operations, among which betterresources assessment is the foundation of other measures and has
Contents lists available at ScienceDirect
journal homepage: www.elsevier.com/locate/enpol
Energy Policy
http://dx.doi.org/10.1016/j.enpol.2014.07.0030301-4215/Published by Elsevier Ltd.
n Corresponding author at: University of California, Energy and Resources Group,310 Barrows Hall, Berkeley, CA 94720, United States. Tel.: þ1 510 642 1640;fax: þ1 510 642 1085.
E-mail address: [email protected] (G. He).
Please cite this article as: He, G., Kammen, D.M., Where, when and how much wind is available? A provincial-scale wind resourceassessment for China. Energy Policy (2014), http://dx.doi.org/10.1016/j.enpol.2014.07.003i
Energy Policy ∎ (∎∎∎∎) ∎∎∎–∎∎∎Author's personal copy

big impact on adapting the appropriate measure (DeCesaro et al.,2009; Smith et al., 2007).
The existing literature on wind resources assessment in Chinahas focused on national level, with specific efforts examining theonshore and offshore capacity and potential. The China Meteor-ological Administration (CMA) has conducted three rounds ofnational wind resource surveys using the national weatherstation data, the most recent one projected a theoretical reserveof 4350 GW and a technologically feasible resource of 297 GW at10-m height (CWEAR, 2010). Researchers in the Energy ResearchInstitute (ERI) showed the total technological available onshorewind capacity range from 600 to 1000 GW and around 150 GWoffshore (Elliott et al., 2002; Energy Research Institute (ERI),2010; Xue et al., 2001). McElroy and Lu et al. reported that windcould satisfy all of the demand for electricity projected for 2030,and that the wind electricity resources could displace 23% ofelectricity generated from coal at a price of 0.4 RMB (US$0.07)per kilowatt-hour (McElroy et al., 2009). For offshore windresources, Hong and Möller (2011) reported offshore windenergy could contribute 46% of total electricity demand by2020 and 42% of demand by 2030 in the coastal region withinChina's exclusive economic zone. Those studies shed lights onoverall resources but do not provide the necessary spatialresolution or give sufficient attention on the temporal variabilityof wind resources.
China has proposed a target to have 200 GW wind capacity(170 GW onshore and 30 GW offshore) by 2020 in the WindDevelopment 12th Five Year Plan, aiming to build major onshoreand offshore wind bases each at 10 GW scale, including those inXinjiang, West Inner Mongolia, East Inner Mongolia, Hebei,Jiangsu, Jilin, and Liaoning (NEA, 2012). Expanded wind develop-ment in China therefore requires deeper understanding of theresources availability, both spatially and temporally. The existingresearch does not provide necessary details that policy maker andwind planner need to make plan for wind energy development toaddress the integration of the variable resources. This paperprovides a comprehensive assessment of China's onshore andoffshore wind resources at provincial level with high spatial andtemporal resolution.
2. Methods and data
This study combines the geographic information system (GIS)modeling and wind simulation with a large hourly data set tostudy the availability of China's wind resources. The hourly windspeed data from 2001 to 2010 for 200 chosen locations (Fig. 1) areobtained from 3TIER, with a total of 200�8760�10¼17.52million data entry. Each data entry shows the wind speed, winddirection, temperature, and pressure of given hour, which are
Fig. 1. China wind appropriate area map and the hourly data points.
G. He, D.M. Kammen / Energy Policy ∎ (∎∎∎∎) ∎∎∎–∎∎∎2
Please cite this article as: He, G., Kammen, D.M., Where, when and how much wind is available? A provincial-scale wind resourceassessment for China. Energy Policy (2014), http://dx.doi.org/10.1016/j.enpol.2014.07.003i
Author's personal copy

important input to simulate wind capacity factor. The wind speedsare at 100 m height above ground, which is the average height of a3 MW-size wind turbine. We pick those locations based on thefollowing criteria: wind resources with average wind speed largerthan 6 m/s; site conditions are appropriate for building windprojects; and spatial distribution representativeness within eachprovince, which allows 4 to 5 locations in each of China's 31provinces (excluding Hong Kong and Macau, Inner Mongolia isconsidered as East Inner Mongolia and West Inner Mongolia asthey belong to two different grid systems), along with 11 provincesthat have offshore resources. We created Thissen/Voronoi Polygonof those 200 sites to interpolate the area each site represents.
We accessed China's national and province-level GIS informa-tion from the National Fundamental Geographic InformationSystem. The land use and land cover dataset and the digitalelevation model (DEM) dataset are provided by the Environmentaland Ecological Science Data Center for West China, both are at1 km�1 km resolution (Ran et al., 2010). The land use and landcover data of 2010 was compiled by Chinese Academy of Sciencebased on county level land use survey. The General BathymetricChart of the Oceans (GEBCO) data is downloaded from BritishOceanographic Data Center (BODC, 2010). We trimmed it withChina's Exclusive Economic Zone (EEZ) to get China's offshore area.We used ArcGIS 10.0 and PostGIS to perform the spatial analysis.
We calculated the available land for wind development for eachprovince by applying the following filters in the GIS modeling: DEMwith elevation less than 3000 m and slope less than 20% (NREL,2012), land use in the categories of woody savannas, shrublands,savannas, grasslands, barren, as defined in the land use data that areavailable for wind development, and average annual wind speedlarger than 6 m/s (AQSIQ, 2002; Energy Research Institute (ERI),2010). We excluded forestry, cropland, wetland, urban built-upland, water, snow and glacial, and protected land in the onshoreland. For offshore space, we used bathymetry less than negative20 m as threshold, and excluded the buffer zone of tropical cyclonepaths, ship lines, and cable lines in the offshore space (EnergyResearch Institute (ERI), 2010; Hong and Möller, 2011). The installa-tion capacity conversion factor ranges from 2 to 8 MW per squarekilometers depends on the slope, the land availability conversionfactor ranges from 30% to 90% depends on the surface condition andwind turbine layout (Energy Research Institute (ERI), 2010). Theland use and slope conversion factors are usually have uncertaintiesdepending on the technology and local condition, and this studyconsider a lower case and upper case for the conversion factors aslisted in Table 1.
The potential wind capacity is calculated from below,
PC ¼∑li � sf i � lf i
where PC: potential capacity; li: land area of land use type of grid i.The selection criteria are listed as the following: Wind speed:vavgZ6 m=s, Elevation: Er3000 m in lower case or Er3500 m inhigher case, Bathymetry: BZ�20 m, Slope: sr20%; sf i and lf i arethe slope factor and land use factor of grid i specified in Table 1. Allcalculation are applied at 1 km�1 km grid and then using zonalstatistics by province. By applying the land selection criteria in theGIS model, the land that is appropriate for wind development foreach province is shown in Fig. 1. The most area lays in northernChina and along the coastal offshore area.
The CF of each location is simulated with the hourly wind speedvalues based on the power curves of representative newly installedturbine sizes in 2012, correcting with air density. The share of turbinesize of larger than 2.5 MW, 2 MW, 1.5 MW, less than 1 MW, andother sizes are 6.6%, 26.1%, 63.69%, 1.06% and 2.55% respectively,as reported in 2012 (Li et al., 2013). 2 MW size turbine is consideredas mainstream size for new installation. For offshore wind, the newlyinstalled turbines are shared by 2.5 MW and 3 MW size turbines,
popular sizes for newly built offshore wind projects in China (Li et al.,2012; Zhao et al., 2013). In this study, we applied the power curves ofa representative Goldwind 2 MW size wind turbine for onshore CFsimulation, and a representative Vestas 3 MW size wind turbine foroffshore CF simulation.
Capacity factor¼ reference outputrated capacity
3. Results
3.1. Average capacity factor, potential capacity and output
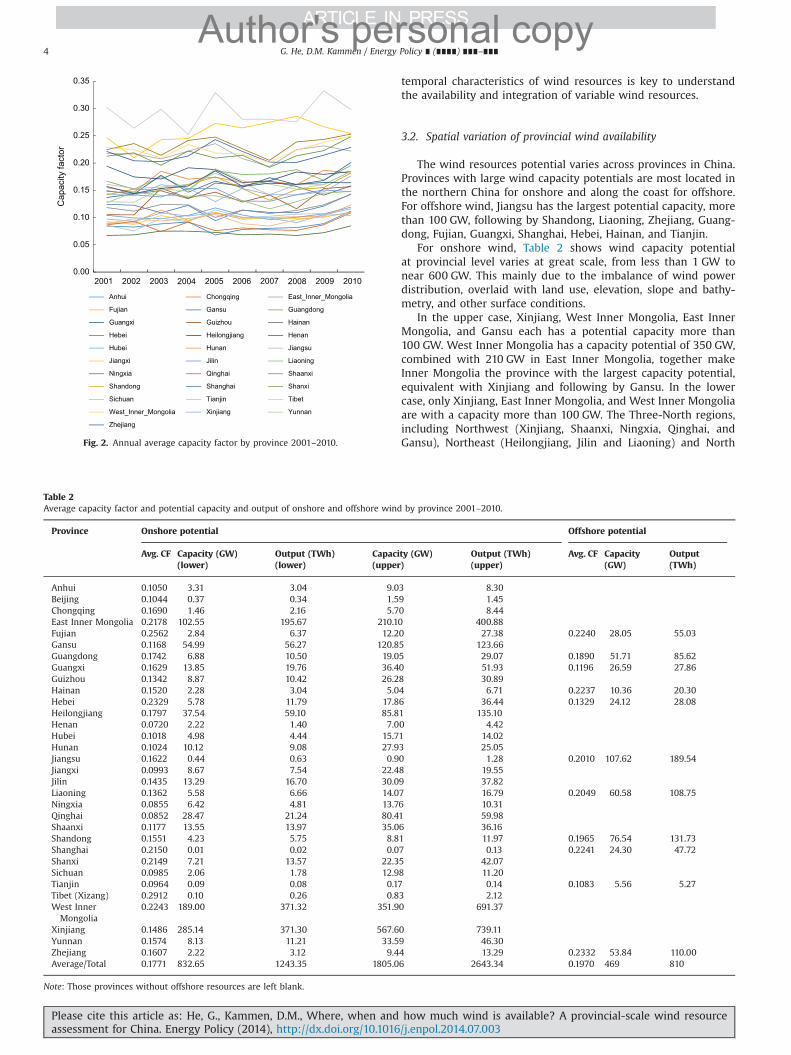
The results of the study are presented in terms of CF, potentialcapacity and output by resource type: onshore and offshore and byprovince. The annual average CFs of each province are compara-tively stable across years during the study period, see Fig. 2.Therefore, ten years average CF is representative for the long-term CF for each province.
The ten-year average CFs of onshore and offshore wind for eachprovince are shown in Table 2. Xizang (Tibet), Fujian, Hebei,East Inner Mongolia, West Inner Mongolia, Shanghai, and Shanxihave better onshore wind availability compared to other onshoreprovinces, and Zhejiang, Shanghai, Fujian, Hainan, Liaoning,and Jiangsu have better offshore wind availability, each with anaverage CF bigger than 0.2.
China has a national total potential wind capacity from1300 GW to 2300 GW and national potential annual wind outputbetween 2000 TWh and 3500 TWh in the lower case and uppercase respectively, assuming all the land appropriate for windprojects is developed.
The overall calculated average capacity factor based on hourlydata including onshore and offshore is at 0.18, which is lowercompared to what has been reported at 0.23 based on annualoutput (Cyranoski, 2009). Capacity factors that calculated fromyearly output do not reflect the real availability of a country's windresources because they do not capture the spatial imbalance andtemporal variation. A low observed overall capacity factor maybe due to unusually low winds that are below their long termpotential. This phenomena is also observed in European wind CFstudies (Boccard, 2009). This difference shows the spatial and
Table 1GIS model thresholds and capacity conversion factors.Source: The lower case of onshore assumptions are from Energy Research Institute(ERI), 2010. 2030 China wind development outlook: the feasibility study of meeting10% of electricity demand. Energy Research Institute, Beijing. pp:28–49. The uppercase are based on expert interview in the field and for comparison use. Offshoreland use factor is from Hong and Möller, 2011.
Cases Threshold/capacity conversion index
Onshore Offshore
Lower case Upper case
Elevation/bathymetry 3000 m 3500 m �20Wind speed threshold 6 m/s 6 m/s 6 m/sSlope α (%) factor αr2 5 MW/km2 8 MW/km2 4 MW/km2
2rαr3 3 MW/km2 6 MW/km2
3rαr4 2 MW/km2 4 MW/km2
4rαr20 0 MW/km2 2 MW/km2
Land use factor Mixed forest 30% 50% 64%Shrublands 65% 75%Savannas 65% 75%Grassland 80% 90%Barren 80% 90%
G. He, D.M. Kammen / Energy Policy ∎ (∎∎∎∎) ∎∎∎–∎∎∎ 3
Please cite this article as: He, G., Kammen, D.M., Where, when and how much wind is available? A provincial-scale wind resourceassessment for China. Energy Policy (2014), http://dx.doi.org/10.1016/j.enpol.2014.07.003i
Author's personal copy
temporal characteristics of wind resources is key to understandthe availability and integration of variable wind resources.
3.2. Spatial variation of provincial wind availability
The wind resources potential varies across provinces in China.Provinces with large wind capacity potentials are most located inthe northern China for onshore and along the coast for offshore.For offshore wind, Jiangsu has the largest potential capacity, morethan 100 GW, following by Shandong, Liaoning, Zhejiang, Guang-dong, Fujian, Guangxi, Shanghai, Hebei, Hainan, and Tianjin.
For onshore wind, Table 2 shows wind capacity potentialat provincial level varies at great scale, from less than 1 GW tonear 600 GW. This mainly due to the imbalance of wind powerdistribution, overlaid with land use, elevation, slope and bathy-metry, and other surface conditions.
In the upper case, Xinjiang, West Inner Mongolia, East InnerMongolia, and Gansu each has a potential capacity more than100 GW. West Inner Mongolia has a capacity potential of 350 GW,combined with 210 GW in East Inner Mongolia, together makeInner Mongolia the province with the largest capacity potential,equivalent with Xinjiang and following by Gansu. In the lowercase, only Xinjiang, East Inner Mongolia, and West Inner Mongoliaare with a capacity more than 100 GW. The Three-North regions,including Northwest (Xinjiang, Shaanxi, Ningxia, Qinghai, andGansu), Northeast (Heilongjiang, Jilin and Liaoning) and North
0.00
0.05
0.10
0.15
0.20
0.25
0.30
0.35
2001 2002 2003 2004 2005 2006 2007 2008 2009 2010
Cap
acity
fact
or
Anhui Chongqing East_Inner_Mongolia
Fujian Gansu Guangdong
Guangxi Guizhou Hainan
Hebei Heilongjiang Henan
Hubei Hunan Jiangsu
Jiangxi Jilin Liaoning
Ningxia Qinghai Shaanxi
Shandong Shanghai Shanxi
Sichuan Tianjin Tibet
West_Inner_Mongolia Xinjiang Yunnan
Zhejiang
Fig. 2. Annual average capacity factor by province 2001–2010.
Table 2Average capacity factor and potential capacity and output of onshore and offshore wind by province 2001–2010.
Province Onshore potential Offshore potential
Avg. CF Capacity (GW)(lower)
Output (TWh)(lower)
Capacity (GW)(upper)
Output (TWh)(upper)
Avg. CF Capacity(GW)
Output(TWh)
Anhui 0.1050 3.31 3.04 9.03 8.30Beijing 0.1044 0.37 0.34 1.59 1.45Chongqing 0.1690 1.46 2.16 5.70 8.44East Inner Mongolia 0.2178 102.55 195.67 210.10 400.88Fujian 0.2562 2.84 6.37 12.20 27.38 0.2240 28.05 55.03Gansu 0.1168 54.99 56.27 120.85 123.66Guangdong 0.1742 6.88 10.50 19.05 29.07 0.1890 51.71 85.62Guangxi 0.1629 13.85 19.76 36.40 51.93 0.1196 26.59 27.86Guizhou 0.1342 8.87 10.42 26.28 30.89Hainan 0.1520 2.28 3.04 5.04 6.71 0.2237 10.36 20.30Hebei 0.2329 5.78 11.79 17.86 36.44 0.1329 24.12 28.08Heilongjiang 0.1797 37.54 59.10 85.81 135.10Henan 0.0720 2.22 1.40 7.00 4.42Hubei 0.1018 4.98 4.44 15.71 14.02Hunan 0.1024 10.12 9.08 27.93 25.05Jiangsu 0.1622 0.44 0.63 0.90 1.28 0.2010 107.62 189.54Jiangxi 0.0993 8.67 7.54 22.48 19.55Jilin 0.1435 13.29 16.70 30.09 37.82Liaoning 0.1362 5.58 6.66 14.07 16.79 0.2049 60.58 108.75Ningxia 0.0855 6.42 4.81 13.76 10.31Qinghai 0.0852 28.47 21.24 80.41 59.98Shaanxi 0.1177 13.55 13.97 35.06 36.16Shandong 0.1551 4.23 5.75 8.81 11.97 0.1965 76.54 131.73Shanghai 0.2150 0.01 0.02 0.07 0.13 0.2241 24.30 47.72Shanxi 0.2149 7.21 13.57 22.35 42.07Sichuan 0.0985 2.06 1.78 12.98 11.20Tianjin 0.0964 0.09 0.08 0.17 0.14 0.1083 5.56 5.27Tibet (Xizang) 0.2912 0.10 0.26 0.83 2.12West InnerMongolia
0.2243 189.00 371.32 351.90 691.37
Xinjiang 0.1486 285.14 371.30 567.60 739.11Yunnan 0.1574 8.13 11.21 33.59 46.30Zhejiang 0.1607 2.22 3.12 9.44 13.29 0.2332 53.84 110.00Average/Total 0.1771 832.65 1243.35 1805.06 2643.34 0.1970 469 810
Note: Those provinces without offshore resources are left blank.
G. He, D.M. Kammen / Energy Policy ∎ (∎∎∎∎) ∎∎∎–∎∎∎4
Please cite this article as: He, G., Kammen, D.M., Where, when and how much wind is available? A provincial-scale wind resourceassessment for China. Energy Policy (2014), http://dx.doi.org/10.1016/j.enpol.2014.07.003i
Author's personal copy

China (Inner Mongolia, Hebei, Shanxi, Beijing and Tianjin) in totalaccount for 90% and 85% of national onshore capacity, in the lowerand upper cases, respectively. The spatial variation across Chinaand the concentration in northern part of China are the funda-mental geographical features of the wind recourses.
Potential wind output has similar geographic pattern, butslightly different order, as the capacity potential and CF are notalways coupled with each other. Inner Mongolia and Xinjiang arethe top provinces which have the potential annual output largerthan 100 TWh in the lower case. In the upper case, this listexpands to Heilongjiang and Gansu. Inner Mongolia, Xinjiang,Heilongjiang and Gansu are the top potential producers, togetheraccount for 91% and 88% of national total potential onshore outputin the lower and upper case, respectively.
3.3. Temporal variation of provincial wind availability
We examined the inter-hourly wind variability within a day,the inter-daily wind variability within a month, and the inter-monthly wind variability within a year for all the 200 chosenlocations. The inter-hourly and inter-daily variability are extremelydisperse and does not show any regular trend, however, both theonshore and offshore wind resources show regular inter-monthly(seasonal) variation pattern, due to the monsoon wind pattern inEast Asia (see Fig. 3 and Fig. 4).
For onshore wind, all provinces have better availability duringspring and winter than in summer and autumn, but someprovinces, for example, Guangxi, Shanghai, and Zhejiang have asmall increase in July. The highest monthly CF reaches as high as0.5446 in Xizang in January, and the lowest reaches 0.0318 inTianjin in August, the difference between the highest of lowest ofthe same province can as high as 0.48 in Xizang, and the maxi-mum monthly average CF is more than 8 times of the minimum.Jiangxi has the minimum differences between extreme values, buthas comparatively low average CF of 0.0994.
For offshore wind, Fujian, Zhejiang, Hainan have superioravailability in the Spring and Winter, while Shanghai has the bestavailability during the Summer. Similar to onshore wind, allprovinces have better availability during the Spring and Winterthan in Summer and Autumn, but some provinces, for example,Zhejiang, Shanghai, and Jiangsu have a small increase in July. Thehighest monthly average CF researches 0.4254 in Hainan inNovember, and the lowest 0.0354 in Tianjin in August. The biggestdifference between the highest and the lowest in the sameprovince is 0.3208 in Hainan, and the maximum monthly averageCF in more than 5 times of the minimum. Shanghai has the mini-mum difference between extreme values.
The regional differences and spatial variability of wind resourcesshow national coordination is needed to develop transmissioncorridors to transmit wind power out of the wind rich areas.However, as provinces follow similar seasonal variability pattern,inter-provinces coordination might provide less value than expectedat seasonal time scale, back up capacity or storage assets has to be inplace in order to tackle such variation and keep the power systemreliable. The integration and optimization of different energyresources, such as wind and natural gas fired power, wind and solar,wind and storage, wind and hydro, other flexible sources, anddemand response/demand side management will be sentential todeal with such temporal variation pattern.
3.4. Potential contribution of wind generation
We compared the provincial potential power output withprojected provincial demand of 2030 and showed the potentialshare of wind power in total electricity demand in each province.We use electricity demand of 2030 as it is the best available year
with projected provincial electricity demand reported by theElectricity Supply and Demand Lab in the State Grid EnergyResearch Institute (Hu et al., 2011). Wind energy developmentand the total energy demand in each province have manyuncertain factors, for example, economic development, competi-tion and integration from other sources, investments and costs,the share of wind in total energy consumption is therefore anindicative number to show the potential contribution of wind canpossibly achieve, and a schematic balance sheet of wind energysupply and demand.
Seen from Table 3, wind share at provincial level varies at greatscale, from 1% to 420%, which reiterates the geographic variabilityof wind resources. In the upper case, West Inner Mongolia,Xinjiang, and East Inner Mongolia each generates more than whatit needs therefore transmission is needed to transfer the extra
0.0
0.1
0.2
0.3
0.4
0.5
0.6
1 2 3 4 5 6 7 8 9 10 11 12
Cap
acity
fact
or
Month
Anhui Chongqing East_Inner_Mongolia
Fujian Gansu Guangdong
Guangxi Guizhou Hainan
Hebei Heilongjiang Henan
Hubei Hunan Jiangsu
Jiangxi Jilin Liaoning
Ningxia Qinghai Shaanxi
Shandong Shanghai Shanxi
Sichuan Tianjin Tibet
West_Inner_Mongolia Xinjiang Yunnan
Zhejiang
Fig. 3. Monthly average onshore wind capacity factor 2001–2010.
0.0
0.1
0.2
0.3
0.4
0.5
1 2 3 4 5 6 7 8 9 10 11 12
Cap
acity
fact
or
MonthFujian Guangdong Guangxi Hainan
Hebei Hong_Kong Jiangsu Liaoning
Shandong Shanghai Tianjin Zhejiang
Fig. 4. Monthly average offshore wind capacity factor 2001–2010.
G. He, D.M. Kammen / Energy Policy ∎ (∎∎∎∎) ∎∎∎–∎∎∎ 5
Please cite this article as: He, G., Kammen, D.M., Where, when and how much wind is available? A provincial-scale wind resourceassessment for China. Energy Policy (2014), http://dx.doi.org/10.1016/j.enpol.2014.07.003i
Author's personal copy

energy to the coastal demand centers. Inner Mongolia at the uppercase generates more than 4 times of the projected demand whichtops all provinces. Xizang and Qinghai have relatively high averageCFs but with the land at high elevation, greater than 3000 m, areexcluded in the assessment. Nationwide, potential wind annualoutput could reach 2000 TWh and 3500 TWh in the lower caseand upper case, respectively.
3.5. Sensitivity analysis and uncertainties
We conducted sensitivity analysis on four key assumptions ofthe GIS model: the 6 m/s wind speed threshold, the 20% slopethreshold, the 3000 m elevation threshold, and the 20 m ofbathymetry threshold. We studied the relations of those factorswith the potential capacity, and plotted them in Fig. 5. The resultsin the upper case and lower case are quite similar as those fourfactors follow the same change pattern.
All four factors are following non-linear relations with thecapacity potential. The capacity potential are more sensitive to the6 m/s average annual wind speed threshold and the 20 m bathy-metry threshold, but less sensitive to the 20% slope and 3000elevation threshold.
In addition, there are many uncertainties related to thisstudy. The inter-annual variation in some sites are not trivial,and should be incorporated into long-term projection. Technologyadvancement might make it possible to harvest lower speed wind,at places with steeper slope, in land with less favorable surface
conditions, and deeper bathymetry offshore wind resources,therefore the results of this analysis need update in the future astechnologies develop.
4. Conclusion and discussion
China's wind installed capacity has grown at a remarkable rate,reaching 91.5 GW of capacity by end of 2013. Existing research hasbeen focusing on national scale and does not provide the neces-sary spatial resolution or give sufficient attention on the spatialand temporal variation of wind availability. Given wind as aninherently variable resource, China's ambitious wind developmentplan will be greatly aided with a detailed wind resource assess-ment that identifies total resources, spatial availability, andseasonal and daily variability across China. Knowing where, whenand how much wind is available at provincial level can help theresearchers and policy makers on wind development planning andintegration.
Combining methods of GIS modeling and wind CF simulation,we utilized 200 representative locations for which 10 years ofhourly wind speed data exist to study provincial capacity factorfrom 2001 to 2010, and to build wind availability profiles. Fromthese data we found that China could have a potential windcapacity from 1300 GW to 2300 GW, and annual wind outputcould reach 2000 TWh to 3500 TWh. The calculated averagecapacity factor is 0.18, which is lower compared to what has beenreported.
This study extends the exiting research by investigating windavailability in China at higher spatial resolution and temporalresolution so to understand the spatial and temporal availability ofwind resources across China. The results of this study can be usedto facilitate local and national wind development plans and can bealso utilized by developers and regulators to develop strategieson wind integration. Table 4 listed the comparison of this studywith other major similar research in their methods, data and keyfindings.
While spatial variation demands highly interconnected andcoordinated power system, similar temporal variation patternrestricted the effectiveness of such a system. We studied thediurnal and seasonal features of the wind availability at provinciallevel and found similar seasonal variation pattern between pro-vinces, which indicates the difficulties to integrate wind resourcesthrough regional coordination, and back up capacity or storageassets has to be in place in order to incorporate such variation.The diurnal and seasonal variability demand a larger, systems-levelanalysis of China's energy options with more careful investigation of
Table 3Potential share of wind generation by province in 2030.
Province Demand2030 (TWh)
Total output(lower)(TWh)
Share(%)
Total output(upper)(TWh)
Share(%)
Anhui 240.00 3.04 1 8.30 3Beijing 133.20 0.34 0 1.45 1Chongqing 171.10 2.16 1 8.44 5East InnerMongolia
272.44 195.67 72 400.88 147
Fujian 308.50 61.40 20 82.40 27Gansu 205.10 56.27 27 123.66 60Guangdong 815.10 96.12 12 114.69 14Guangxi 254.30 47.61 19 79.78 31Guizhou 218.00 10.42 5 30.89 14Hainan 47.40 23.34 49 27.01 57Hebei 676.90 39.87 6 64.52 10Heilongjiang 153.50 59.10 39 135.10 88Henan 614.20 1.40 0 4.42 1Hubei 341.70 4.44 1 14.02 4Hunan 298.70 9.08 3 25.05 8Jiangsu 791.50 190.16 24 190.82 24Jiangxi 165.30 7.54 5 19.55 12Jilin 139.70 16.70 12 37.82 27Liaoning 409.30 115.40 28 125.53 31Ningxia 141.30 4.81 3 10.31 7Qinghai 96.90 21.24 22 59.98 62Shaanxi 233.50 13.97 6 36.16 15Shandong 760.30 137.48 18 143.70 19Shanghai 232.80 47.74 21 47.85 21Shanxi 370.30 13.57 4 42.07 11Sichuan 366.50 1.78 0 11.20 3Tianjin 136.70 5.35 4 5.42 4Tibet(Xizang)
7.30 0.26 3 2.12 29
West InnerMongolia
163.46 371.32 227 691.37 423
Xinjiang 244.10 371.30 152 739.11 303Yunnan 238.90 11.21 5 46.30 19Zhejiang 596.80 113.13 19 123.29 21
Total/Average
9845 2053 21 3453 35
-120%
-100%
-80%
-60%
-40%
-20%
0%
20%
40%
60%
80%
100%
-100% -80% -60% -40% -20% 0% 20% 40% 60% 80% 100%
slope elevation bathymetry wind speed
Fig. 5. The sensitivity analysis of key assumptions to the capacity potential.
G. He, D.M. Kammen / Energy Policy ∎ (∎∎∎∎) ∎∎∎–∎∎∎6
Please cite this article as: He, G., Kammen, D.M., Where, when and how much wind is available? A provincial-scale wind resourceassessment for China. Energy Policy (2014), http://dx.doi.org/10.1016/j.enpol.2014.07.003i
Author's personal copy

technical and economic availabilities and the role of inter-provincetransmissions, for further research, we will examine the implicationsof the wind variability and availability in the context of an overallenergy strategy for China.
Acknowledgments
The authors would like to thank James Nelson, Lixuan Hong,Jun Zhao and Liheng Zhong for the help with the data processingand methodology, and the Karsten Family Foundation Endowmentand the Class of 1935 of the University of California, Berkeley fortheir support of Renewable and Appropriate Energy Laboratory atUniversity of California, Berkeley. We thank 3TIER for the datasupport. We’d also like to thank the invaluable comments andsuggestions from two anonymous reviewers.
References
AQSIQ, 2002. Methodology of Wind Energy Resource Assessment for Wind Farm(No. GB/T18710-2002). General Administration of Quality Supervision, Inspec-tion and Quarantine of the People's Republic of China, Beijing.
Boccard, N., 2009. Capacity factor of wind power realized values vs. estimates.Energy Policy 37, 2679–2688. http://dx.doi.org/10.1016/j.enpol.2009.02.046.
BODC, 2010. Gridded Bathymetric Data Sets [WWW Document]. URL ⟨https://www.bodc.ac.uk/data/online_delivery/gebco/⟩.
China Meteorological Administration, 2006. Report of the Third General Investiga-tion for Wind Energy Resources in China. China Meteorological Press, Beijing.
CWEA, 2013. Statistics of China's Wind Installed Capacity 2012. Chinese WindEnergy Association, Beijing.
CWEAR, 2010. China Wind Resources Assessment Report. China MeteorologicalPress, Beijing.
Cyranoski, D., 2009. Renewable energy: Beijing's windy bet. Nat. News 457,372–374. http://dx.doi.org/10.1038/457372a.
DeCesaro, J., Porter, K., Milligan, M., 2009. Wind energy and power systemoperations: a review of wind integration studies to date. Electr. J. 22, 34–43.http://dx.doi.org/10.1016/j.tej.2009.10.010.
Elliott, D., Schwartz, M., Scott, G., Haymes, S., Heimiller, D., George, R., 2002. WindEnergy Resource Atlas of Southeast China (No. NREL/TP. National RenewableEnergy Laboratory, Golden, pp. 500–32781.
Energy Research Institute (ERI), 2010. 2030 China Wind Development Outlook: theFeasibility Study of Meeting 10% of Electricity Demand. Energy ResearchInstitute, Beijing.
GWEC, 2014. Global Wind Statistics 2013. Global Wind Energy Council, Brussels,Belgium.
He, G., Morse, R., 2013. Addressing carbon offsetters’ paradox: lessons from Chinesewind CDM. Energy Policy 63, 1051–1055. http://dx.doi.org/10.1016/j.enpol.2013.09.021.
Hong, L., Möller, B., 2011. Offshore wind energy potential in China: under technical,spatial and economic constraints. Energy 36, 4482–4491. http://dx.doi.org/10.1016/j.energy.2011.03.071.
Hu, Z., Tan, X., Xu, Z., 2011. 2050 China Economic Development and ElectricityDemand Study. China Electric Power Press, Beijing.
Lewis, J.I., 2012. Green Innovation in China: China's Wind Power Industry and theGlobal Transition to a Low-Carbon Economy. Columbia University Press.
Li, J., Cai, F., Qiao, L., Gao, H., Wang, J., Tang, W., Peng, P., Li, X., 2013. 2013 AnnualReview and Outlook on China Wind Power. CREIA, CWEA, GWEC, Beijing.
Li, J., Cai, F., Qiao, L., Xie, H., Gao, H., Yang, X., Tang, W., Wang, W., Li, X., 2012. ChinaWind Power Outlook 2012. China Environment Science Press, Beijing.
Loutan, C., Yong, T., Chowdhury, S., Chowdhury, A.A., Rosenblum, G., 2009. Impactsof integrating wind resources into the California ISO market construct. In: IEEEPower Energy Society General Meeting, 2009. PES’09. Presented at the IEEEPower Energy Society General Meeting, 2009. PES’09, pp. 1–7. doi:10.1109/PES.2009.5275196.
Lu, X., McElroy, M.B., Kiviluoma, J., 2009. Global potential for wind-generatedelectricity. Proc. Nat. Acad. Sci. U.S.A. 106, 10933–10938. http://dx.doi.org/10.1073/pnas.0904101106.
Masters, G.M., 2004. Renewable and Efficient Electric Power Systems. John Wiley &Sons, Hoboken, NJ.
McElroy, M.B., Lu, X., Nielsen, C.P., Wang, Y., 2009. Potential for wind-generatedelectricity in China. Science 325, 1378–1380. http://dx.doi.org/10.1126/science.1175706.
NEA, 2012. Wind Development 12th Five Year Plan.NEA, 2013. National Wind Energy Output Grows 41% in 2012. National Energy
Administration.Nelson, J., Johnston, J., Mileva, A., Fripp, M., Hoffman, I., Petros-Good, A., Blanco, C.,
Kammen, D.M., 2012. High-resolution modeling of the western North Americanpower system demonstrates low-cost and low-carbon futures. Energy Policy43, 436–447. http://dx.doi.org/10.1016/j.enpol.2012.01.031.
NREL, 2012. Renewable Electricity Futures Study, Renewable Electricity FuturesReport. National Renewable Energy Laboratory.
Ran, Y., Li, X., Lu, L., 2010. Land Cover Products of China. Cold and Arid RegionsScience Data Center at Lanzhou. http://dx.doi.org/10.3972/westdc.007.2013.db.
SERC, 2012. Wind Integration Regulatory Report in Key Regions. State ElectricityRegulatory Commission, Beijing.
Smith, J.C., Milligan, M.R., DeMeo, E.A., Parsons, B., 2007. Utility wind integrationand operating impact state of the art. IEEE Trans. Power Syst. 22, 900–908. http://dx.doi.org/10.1109/TPWRS.2007.901598.
Xia, C., Song, Z., 2009. Wind energy in China: current scenario and futureperspectives. Renewable Sustainable Energy Rev. 13, 1966–1974. http://dx.doi.org/10.1016/j.rser.2009.01.004.
Xie, L., Carvalho, P.M.S., Ferreira, L.A.F.M., Liu, J., Krogh, B.H., Popli, N., Ilic, M.D.,2011. Wind integration in power systems: operational challenges and possiblesolutions. Proc. IEEE 99, 214–232. http://dx.doi.org/10.1109/JPROC.2010.2070051.
Xue, H., Zhu, R., Yang, Z., Yuan, C., 2001. Assessment of wind energy reserves inChina. Acta. Energiae. Solaris. Sinica. 22, 167–170.
Zhao, Z., Yan, H., Zuo, J., Tian, Y., Zillante, G., 2013. A critical review of factorsaffecting the wind power generation industry in China. Renewable SustainableEnergy Rev. 19, 499–508. http://dx.doi.org/10.1016/j.rser.2012.11.066.
Table 4Comparison to other similar research.
Study Results Methods Data
Capacity potentialAverageCF
Total generation potential
This study (2014) Onshore: 800–1800 GW Offshore:470 GW 0.18 Total:2,000–3,500 TWhGIS model/CFsimulation
3TIER hourly dataWESTDC
China MeteorologicalAdministration (2006)
Onshore: 297 GW N/A N/AWind EnergySimulation Toolkit
Meteorological data
Energy Research Institute(ERI) (2010)
Onshore: 600–1000 GW Offshore: 150 GW N/A N/A Numerical Simulation SWEAR
McElroy et al. (2009) N/A 0.23Technical: 24,700 TWhEconomic:6,960 TWh
GIS/ Financial model GEOS-5
Hong and Möller (2011)Offshore: 570 GW, 848 GW, and 1007 GW by2010, 2020 and 2030
0.375 Offshore: 637 TWh GIS model SWERA
Note: WESTDC refers to the cold and Arid Regions Science Data Center at Lanzhou of China. SWERA refers to the Solar and Wind Energy Resource Assessment project for theUnited Nations Environment Program. GEOS-5 refers to the Goddard Earth Observing System Model, Version 5.
G. He, D.M. Kammen / Energy Policy ∎ (∎∎∎∎) ∎∎∎–∎∎∎ 7
Please cite this article as: He, G., Kammen, D.M., Where, when and how much wind is available? A provincial-scale wind resourceassessment for China. Energy Policy (2014), http://dx.doi.org/10.1016/j.enpol.2014.07.003i
Author's personal copy