author's personal copy - dalhousie's marine...
TRANSCRIPT

Author's personal copy
Modeling the dynamics and export of dissolved organic matter in theNortheastern U.S. continental shelf
J.N. Druon a,*, A. Mannino a, S. Signorini a, C. McClain a, M. Friedrichs b, J. Wilkin c, K. Fennel d
aNASA Goddard Space Flight Center, Ocean Biology Processing Group, Code 614.8, Greenbelt, MD 20771, USAbVirginia Institute of Marine Science, The College of William & Mary, Route 1208, Greate Road, Gloucester Point, VA 23062-1346, USAcRutgers University, 71 Dudley Road, New Brunswick, NJ 08901-8521, USAdDalhousie University, Department of Oceanography, Halifax, NS, Canada B3H 4J1
a r t i c l e i n f o
Article history:Received 13 July 2009Accepted 18 May 2010Available online 1 June 2010
Keywords:dissolved organic matterdissolved organic carbondissolved organic nitrogentransportcarbon burialmodelingUSAMid-Atlantic Bight
a b s t r a c t
Continental shelves are believed to play a major role in carbon cycling due to their high productivity. Toimprove our understanding of carbon dynamics on continental margins, a dissolved organic matter(DOM) model was developed and imbedded within an existing coupled ocean circulation-biogeo-chemical model of the U.S. East coast. A model simulation with the DOM module was compared with thereference model (without the DOM module) to illustrate the role of DOM dynamics in coastal oceanbiogeochemical cycling. Model results reveal that the progressive release of dissolved organic nitrogen(DON) in the ocean’s upper layer during summer increases the regenerated primary production by30e300%, which, in turn, enhances the dissolved organic carbon (DOC) production mainly fromphytoplankton exudation in the upper layer and solubilization of particulate organic matter (POM)deeper in the water column. This analysis suggests that DOM is a necessary component for representingecosystem functioning and organic fluxes in models because DOM (1) is a major organic pool directlyrelated to primary production, (2) decouples partially the carbon and nitrogen cycles (through carbonexcess uptake, POM solubilization and DOM mineralization) and (3) is intimately linked to the residencetime of water masses for its distribution and export. The seasonally produced DOC on the shelf can beexported to the open ocean by horizontal transport at comparable rates (1e2 mol C m�2 yr�1) toparticulate organic carbon burial in the southern U.S. Mid-Atlantic Bight (MAB).
� 2010 Elsevier Ltd. All rights reserved.
1. Introduction
Dissolved organic matter (DOM) has received increasingattention over the past few decades because dissolved organiccarbon (DOC) represents by far the largest pool of organic carbonin the ocean. DOC export from the surface global ocean is esti-mated at 20% of total organic carbon flux to the deep ocean (Sixand Maier-Reimer, 1996; Hansell, 2002), which represents animportant control on atmospheric carbon dioxide levels (i.e. thebiological pump). Particulate organic carbon (POC), whichaccounts for 80% of the organic carbon export in the open ocean, ismainly recycled on the shelf and fuels the DOC pool. If residencetimes of shelf waters are shorter than the lifetime of much of theseasonally produced DOC, the horizontal DOC flux could represent
the main contribution to the export of organic carbon to the openocean and exceed sinking POC fluxes (Bauer and Druffel, 1998).
DOM is believed to play an important role in carbon andnitrogen cycling from regional to global scales. Models haveincluded DOM to study eutrophicated (Lancelot et al., 2005),eutrophic (upwelling, Ianson and Allen, 2002), mesotrophic(Anderson and Williams, 1998; Fasham et al., 1999) and oligotro-phic (Anderson and Pondaven, 2003; Raick et al., 2005) regionalsystems and the global ocean (Popova and Anderson, 2002).Fasham et al. (1999) demonstrated that accounting for DOC isessential for euphotic ecosystem models and development ofa carbon budget. Because DOC and DON dynamics are partiallydecoupled (e.g. carbohydrate production, mineralization rates),these models explained important deviations from the Redfieldratio in terms of productivity and export fluxes, and sustainednutrient-based primary production through DON mineralizationand atmospheric inputs (Seitzinger and Sanders, 1999).
TheMid-Atlantic Bight (MAB) is the central region of the easternU.S. continental shelf characterized by high rates of primary
* Corresponding author at: Present address: Joint Research Centre of theEuropean Commission, Institute for the Protection and Security of the Citizen,Maritime Affairs Unit, Via Fermi, TP 051, 21027 Ispra (VA), Italy.
E-mail address: [email protected] (J.N. Druon).
Contents lists available at ScienceDirect
Estuarine, Coastal and Shelf Science
journal homepage: www.elsevier .com/locate/ecss
0272-7714/$ e see front matter � 2010 Elsevier Ltd. All rights reserved.doi:10.1016/j.ecss.2010.05.010
Estuarine, Coastal and Shelf Science 88 (2010) 488e507
Author's personal copy
productivity and strong residual circulation. This region is thusa potential area of organic carbon export to the open ocean. TheDOC pool in the MAB is one to three orders of magnitude largerthan the POC pool (Bauer et al., 2001). The hydrography andcirculation of the MAB is well studied (Biscaye et al., 1994) witha general northesouth flow from Georges Bank to Cape Hatteras.The greatest inflow of water to the MAB (0.4 Sv, Beardsley andBoicourt, 1981) is from Georges Bank. This flow represents thesouthern extension of the Labrador Current with averaged (total)DOC concentrations between 72 and 75 mmol m�3 (Vlahos et al.,2002). In the southern MAB near Cape Hatteras, the warm andsalty water of the Gulf Stream has a major impact on the flow andexchange of water on the shelf and slope. Although the meancirculation is along-shelf in the southwestward direction, cross-shelf exchanges due to frontal instabilities and eddies displacesignificant portions of the shelf water to the open ocean north ofCape Hatteras (Biscaye et al., 1988). The freshwater inflow(0.005 Sv) to the MAB is about 1% of the total water inflow(Beardsley and Boicourt, 1981), but represents a significant input oftotal DOC with mean concentrations of 200e400 mmol C m�3 inthe mid-Bay of the Chesapeake Bay (data from the Chesapeake BayProgram, http://www.chesapeakebay.net/wquality.htm) through-out the year and 90e190 mmol C m�3 in the mouths of the MABestuaries (Sharp et al., 1982; Fisher et al., 1998; Bates and Hansell,1999; Harvey and Mannino, 2001; Taylor et al., 2003). Stronggradients in DOM concentration exist between estuarine, shelf andopen oceanwaters (Hopkinson et al., 2002; Vlahos et al., 2002). TheDOM concentrations on the shelf are elevated compared to theopen ocean and contain a larger labile fraction and younger DOC(Bauer et al., 2002) than DOM in deep slopewaters, where carbon ismore refractory and enriched relative to nitrogen and phosphorus(Hopkinson et al., 2002). Because half-lives of the labile DOM poolare on the order of shelf-water residence time (w100 days),a substantial pool of DOM that is depleted in nitrogen and phos-phorus relative to carbon remains and a net export of DOC to theopen ocean can occur by advective and eddy diffusive processes(Hopkinson et al., 2002). A DOC budget study based on fieldmeasurements estimated a total export from the MAB shelf to theopen ocean of 18.7e19.6 Tg C yr�1 (Vlahos et al., 2002). To ourknowledge, there has been no attempt to model the DOC dynamicsand fluxes in the MAB.
The goal here is to model and evaluate the impact of DOM tocarbon cycling in the MAB and to estimate the horizontal exportof semi-labile DOC to the open ocean. A model simulation withthe DOM module was compared with the reference model(without the DOM module) to illustrate the role of DOMdynamics in coastal ocean biogeochemical cycling. This paper isorganized as follows. After a brief description of the coupledphysicalebiogeochemical model, a brief overview of the DOMmodule is presented (Section 2, and detailed in the Appendix),the model validation and results are described (Section 3) anddiscussed (Section 4) with a focus on DOM dynamics and carbonexport to the open ocean.
2. Model description
2.1. The physical model
The three-dimensional ocean circulation model (ROMS,Regional Ocean Modeling System version 3) extends across theNortheast North American (NENA) shelf including the Scotian shelf,the Gulf of Maine, the MAB, the South Atlantic Bight (SAB), theEastern Gulf of Mexico and the adjacent deep sea (Fig. 1). The focusof this paper is on the continental margin of the MAB and GeorgesBank regions (Fig. 1). The NENA model is nested within a North
Atlantic (NA) model in order to capture large circulation featuresand variability such as the Labrador Current, the Gulf Stream andassociated subtropical gyre circulation.
ROMS (Haidvogel et al., 2000, 2008) is a model widely used forshelf circulation and coupled physicalebiological applications (e.g.Dinniman et al., 2003; Marchesiello et al., 2003; Peliz et al., 2003;Fennel et al., 2006; Wilkin, 2006). The application on the NENAdomain uses a 10-km horizontal resolution and 30 terrain-following vertical levels stretched to give high resolution in surfaceand bottom boundary layers. This resolution is sufficient to capturethe dominant dynamics governing shelf-wide circulation. Openboundary temperature, salinity and sub-tidal frequency velocity aretaken from 3-day averages of the Hybrid Coordinate Ocean Modeldata assimilation product developed as part of the Global OceanData Assimilation Experiment North Atlantic Basin ‘best-estimate’analysis for 2003e2006. Tides have been introduced at theboundary using harmonic data from the Oregon State UniversityTopex/Jason altimeter data inversion and a surface gravity waveradiation scheme (Flather, 1976). Airesea heat and momentumfluxes are computed using bulk formulae (Fairall et al., 2003)applied to model sea surface conditions, and air temperature,pressure, humidity and winds from daily average National Centerfor Environmental Prediction re-analysis fields. Vertical turbulentmixing closure uses the parameterization of Mellor and Yamada(1982) and Warner et al. (2005). Coastal freshwater inputs areapplied using USGS river flow data.
This model exhibits recognized features of local and remotelyforced circulation on the shelf and slope. These include wind-driven upwelling in the MAB, buoyancy-driven river plumes, tidalmixing and tidal residual mean currents on Georges Bank,southwestward mean flow in the MAB and retention of passiveparticles in the shelf-slope front. In addition the model capturesinteractions of Gulf Stream warm rings with the New Englandslope (Hofmann et al., 2008). The simulations described below usea higher background value for diffusivity (10�5 m2 s�1) than inFennel et al. (2006) (10�6 m2 s�1) to compensate for the lack ofsecondary mixing processes such as internal waves and sub-gridturbulent diffusion. Similar background levels of diffusivity wereshown to be necessary to reproduce the vertical temperature fieldand have been used in other model applications as well(10�5 m2 s�1, Kantha and Clayson, 1994, and 2 � 10�5 m2 s�1,Ledwell et al., 1993).
2.2. The biogeochemical model with DOM
A general overview of the biogeochemical model schematic ispresented in Fig. 2 and the full details of the DOM processes andgoverning equations including the semi-labile DON and DOC arepresented in the Appendix. The semi-labile DOC and DON wereadded as state variables to an existing nitrogen-based model(Fennel et al., 2006) and inorganic carbon component (Fennelet al., 2008). The nitrogen model includes eight state variables:nitrate (NO3), ammonium (NH4), phytoplankton (Phy), semi-labile DON (named hereafter DON), zooplankton (Zoo), small andlarge detritus (SDetN and LDetN) and phytoplankton chlorophyll(Chl). The nitrogen-cycling formulations used are the same asthose in Fennel et al. (2006), except for the resuspension andburial of POM (see Appendix and Table A2) which were added tomeet the requirements of the DOM equations at the seabedinterface. The carbon model includes dissolved inorganic carbon(DIC), semi-labile DOC (named hereafter DOC) and small andlarge detritus (SDetC and LDetC). Two terms describe the semi-labile DOC exudation by phytoplankton in the model. Thenutrient-based release reflects the healthy phytoplanktonexudation of semi-labile DOC, and the semi-labile DON exudation
J.N. Druon et al. / Estuarine, Coastal and Shelf Science 88 (2010) 488e507 489

Author's personal copy
follows the Redfield ratio. The carbon excess-based releaserepresents the carbohydrate over-production by nutrient-stressed cells. The carbon excess uptake represents dissolvedinorganic carbon taken up by phytoplankton under nutrientlimitation and released as DOC. Phytoplankton and zooplanktonin carbon units are expressed using the nitrogen unit equationand their specific CeN ratio (CNP and CNZ respectively); thus no
explicit equations are required (see Appendix). The DIC dynamicsand airesea exchange of carbon dioxide are described in Fennelet al. (2008).
2.2.1. Semi-labile DOC and DON labilityThe definition of the DOC and DON pools may vary signifi-
cantly between authors, therefore a definition is provided here.
Fig. 1. Geographical location and bathymetry (in meters) of the Northeast North Atlantic (NENA) model domain (upper graph) and details of the Middle Atlantic Bight (MAB) andGeorges Bank regions (bottom graph). The three numbered stations cited in the text are also shown. The locations cited in the text are: ‘CC’ Cape Cod, ‘Co’ Connecticut River, ‘Ho’Housatonic River, ‘LI’ Long Island, ‘Hu’ Hudson River, ‘De’ Delaware Bay, ‘Ch’ Chesapeake Bay, ‘Ro’ Roanoke River.
J.N. Druon et al. / Estuarine, Coastal and Shelf Science 88 (2010) 488e507490

Author's personal copy
The DOM pool is generally divided into labile, semi-labile andrefractory pools although a continuum of biological lability existsbetween these categories (Amon and Benner, 1996). Highlyvariable decomposition (or turnover) rates of DOC weremeasured for surface and bottom waters of the MAB (Hopkinsonet al., 2002). The refractory pool has a very long turnover time(several thousand years on average, Druffel et al., 1992; Santschiet al., 1995), and its concentration is relatively constant in thesurface ocean at the yearly time scale. Although refractory DOMrepresents on average 70% of the total DOC pool and 61% of thetotal DON pool in shelf and slope waters of the MAB (Hopkinsonet al., 2002), the model does not take into account its variabilitysince this study concentrates on the seasonal production ofDOM. The labile material is defined here as having a turnovertime scale of a few days to hours. Since it is mineralized in a fewdays within the 10 km-grid box of the model, the labile DOM isdirected to the dissolved inorganic compartments (DIC and NH4).The semi-labile fraction simulated by the model has a turnovertime of one week to several months (due to a temperaturedependency), which is on the order of the shelf residence timein the MAB (w100 days). As such this defined semi-labile DOMcan therefore be efficiently exported to the open ocean byhorizontal transport.
2.3. Initial and boundary conditions
Initial and boundary conditions for nitrate were derived usingpolynomial approximations that predict nitrate concentrationfrom temperature using the NODC World Ocean Database 2001(Fennel et al., 2006). The semi-labile DOC and DON boundaryconditions are constant and set to 1.0 mmol m�3 and
0.15 mmol m�3 respectively. This approximation does not affectthe MAB area because it is far enough from the boundary limits ofNENA (Fig. 1) to lose its memory, i.e. the time required to transportwater masses from the boundary limit to the MAB is significantlyhigher than the semi-labile DOM half-life. The same reasoning wasapplied to all other biological state variables with boundaryconditions set to small background values. Monthly climatologyfor river flow, nitrate, and ammonium were derived from the U.S.Geological Survey monitoring database. The MAB receives a largesupply of freshwater from the Hudson, Delaware and Chesapeakeestuaries that carries high loads of DOC. Much of this DOC isbelieved to be of terrestrial origin, consisting of mostly refractoryorganic matter that can be transported across the shelf and intothe open ocean (Aluwihare et al., 2002; Bauer et al., 2002).Although the semi-labile fraction is believed to be small, the maininput of freshly produced DOM to the MAB is from productionwithin the estuaries. Since the boundary conditions for theChesapeake Bay and Delaware Bay are located in the mid andupper bay respectively, a polynomial fit is applied to the DOC dataavailable in these areas from the Chesapeake Bay Program data-base (http://www.chesapeakebay.net/wquality.htm) and othersources (Jon Sharp, pers. comm.). A dampened seasonal pattern isapplied with a minimum DOC value in March and a maximumvalue in early October with a mean of 297 � 14 mmol m�3. A smallfraction (10%) represents the semi-labile DOC and is used asa boundary condition for rivers. The boundary condition for semi-labile DON is derived using a Redfield CeN ratio, which approxi-mately characterizes freshly produced DOM (i.e. the semi-labilefraction). The river boundary condition for phytoplankton biomassand chlorophyll is set to background values of 1.8 mmol N m�3
and 6.0 mg Chl m�3, respectively.
Fig. 2. Flow diagram of the ecosystem model with the dissolved organic matter (DOM) module including the carbon (solid) and nitrogen (dash) cycles. The DOM sink and sourcefluxes are highlighted in red.
J.N. Druon et al. / Estuarine, Coastal and Shelf Science 88 (2010) 488e507 491

Author's personal copy
3. Model results
A spin up of seven months is conducted on the NENA domain toinitialize the biogeochemical model (June 2003) for the year 2004.The results of twin simulations e with and without the DOM e arediscussed in the following subsections.
3.1. Vertical and seasonal distribution of DOM
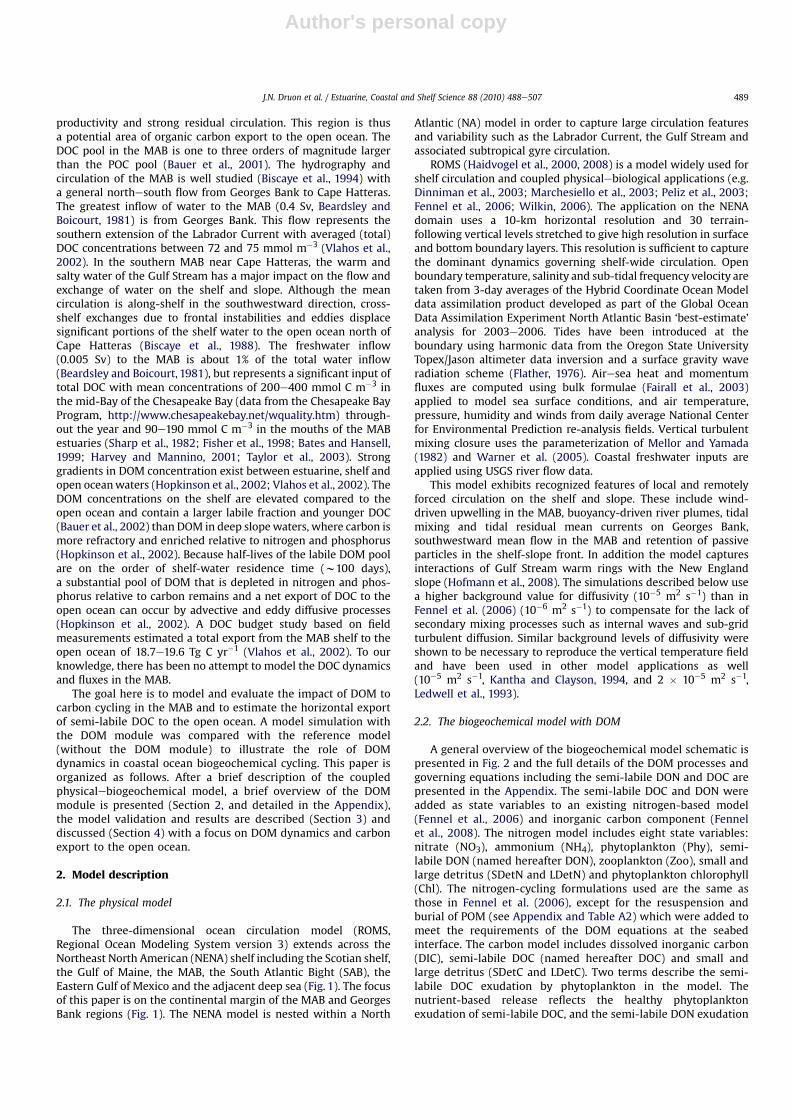
A station chosen for the representativeness of the vertical andseasonal DOM processes in the southern MAB shelf is discussed(station 3, Fig. 1) and compared to stations in the central MAB andGeorges Bank areas (Fig. 3). The bulk of semi-labile DON is formedduring the late-bloom periods at the 3 stations with a maximalvalue of 3 mmol m�3. This value is in agreement with the observedseasonal increase of 2e5 mmol m�3 (Hopkinson et al., 1997). Thesemi-labile DOC pool builds up rapidly on the shelf during thedecay phase of the spring bloomwith values up to 55 mmol m�3 atstation 2 and 3 and 35 mmol m�3 at station 1. While this freshlyproduced DOC pool decreases in June and July down to15 mmol C m�3 at station 3 following the decline of the subsurfacebiomass (Fig. 4b), it is largely maintained during summer in theCentral MAB and even increased on Georges Bank (Fig. 5).
The primary production at station 3 is characterized by a nitrate-sustained production at the subsurface in summer. Although thewater depth is 46 m, station 3 is near the shelf break and episodi-cally under the influence of the Gulf Stream. A nitrate concentrationof 5 mmol m�3 is encountered at the depth of the 10% isolumeduring that period following an intrusion of the Gulf Stream as wassuggested in other studies (Schollaert et al., 2003) and observed inJuly 1996 (Redalje et al., 2002). The most important period ofnutrient uptake occurs during summer between the mixed layerdepth and the depth of the 10% isolume, with values up to
0.8 mmol NO3 m�3 d�1 and 0.5 mmol NH4 m�3 d�1. A peak of DOCup to 23 mmol m�3 is observed in August in relation with the GulfStream intrusion (Fig. 4).
The annual new production at station 3 is 46% of the nitrogen-based production, compared to 36% at station 2 where the GulfStream has less influence and 41% at the well-mixed tidal-drivenstation 1. The carbon excess uptake at station 3 of 30 g C m�2 yr�1
represents 12% of total primary production (14% at station 2 and 6%at the nutrient-rich station 1). This ‘extra’ carbon uptake occurs ata shallower depth than the nutrient uptake, where the gradients ofbiomass and light intersect.
Fig. 5a shows the seasonal variability of the semi-labile DOCconcentration at the surface in the MAB and Georges Bank. Thepeak in semi-labile DOC occurs in spring in the inner MAB(w65mmol m�3) and in summer on Georges Bankwith the highestvalue in the shallowest area (from 30 to 50 mmol m�3). The slopeoff the MAB and Georges Bank between 100 and 1000 m showsa local maximum concentration in spring in relation with primaryproductivity.
The model exhibits a stable and minimum CeN ratio of DOMduring the growth phase of the spring bloom and an increasingratio during the stationary and decay phases. The CeN ratio (atoms)of DOM during the post-bloom increases from 10.5 to14.5 at station1, 12.5 to 21.5 at station 2 and from 12.5 to 18.5 at station 3 inagreement with previous measurements (between 10 and 25,Benner et al., 1992).
3.2. Horizontal DOM distribution and model evaluation
The general distribution of total DOC concentration in surfacewaters shows an increase from northeast to southwest, and fromoffshore to inshore (Vlahos et al., 2002). These gradients arise fromthe production and accumulation of total DOC concentration on the
31 Dec 3 Feb 9 Mar 12 Apr 16 May 19 Jun 23 Jul 26 Aug 29 Sep 3 Nov 7 Dec 0
0.5
1
1.5station 1
[g
C
m
−2 d
−1]
Productivity with DOMPER/100 (annual mean = 10%)Productivity without DOM
31 Dec 3 Feb 9 Mar 12 Apr 16 May 19 Jun 23 Jul 26 Aug 29 Sep 3 Nov 7 Dec 0
0.5
1
1.5station 2
[g
C
m
−2 d
−1]
Productivity with DOMPER/100 (annual mean = 18%)Productivity without DOM
31 Dec 3 Feb 9 Mar 12 Apr 16 May 19 Jun 23 Jul 26 Aug 29 Sep 3 Nov 7 Dec 0
0.5
1
1.5station 3
[g
C
m
−2 d
−1]
Productivity with DOMPER/100 (annual mean = 17%)Productivity without DOM
a
b
c
Fig. 3. Simulated daily vertically integrated primary production results for twin experimental model runs with DOM module (solid) and without DOM (dots) and percentage ofextracellular release (PER, dash) of dissolved organic carbon (DOC) at (a) a 59 m depth station on Georges Bank (station 1, see Fig. 1 for position), (b) a 55 m northern MAB station(station 2) and (c) a 46 m southern MAB station (station 3). PER represents the percentage of organic carbon exuded by phytoplankton as DOC relative to total primary production.
J.N. Druon et al. / Estuarine, Coastal and Shelf Science 88 (2010) 488e507492
Author's personal copy
shelf as a result of primary production and river inputs to thesouthwestward flowing water mass (Vlahos et al., 2002; Manninoet al., 2008). The validation of the modeled semi-labile DOC iscomplicated by the different quantity measured in the field (totalDOC) that includes the labile and refractory fractions. Furthermoredue to the particularly coarse model resolution in the estuary areas,we have less confidence in the simulated estuarine production. TheDOC decomposition study of Hopkinson et al. (2002) for near-surface waters of the southernMAB showed a degradable DOC poolof 28e36 mmol C m�3 in March 1996 and 40e49 mmol C m�3 inAugust 1996 (sum of two DOC components with half-lives of 1e4days and 16e34 days for stations T5S4 and T6S1). Assuming thatrefractory DOC represents on average 70% of the total DOC(Hopkinson et al., 2002), we can estimate the semi-labileDOC concentration as 30% of total DOC measured. Applying theDOC measurements from Vlahos et al. (2002) for the MABand Georges Bank yields semi-labile DOC concentrations of20.7e51 mmol C m�3 in April 1994, 15.2e53.1 mmol C m�3 inMarch 1996 and 20e52.3 mmol C m�3 in August 1996. These valuesare generally consistent with the model results (Fig. 5a). Theseasonal mean of semi-labile DOC for 2004was also estimated fromsatellite-derived (SeaWiFS) total DOC (Fig. 5b;Mannino et al., 2008)applying the 70% cut. Taking into account the high spatial, seasonaland interannual variability, the semi-labile DOC on the shelf is ingeneral agreement with the field and satellite-derived estimations,especially regarding the innereouter shelf gradient and theconcentration level. The seasonal satellite data reveals howeverhigher semi-labile DOC mainly in the southern MAB duringsummer than in spring while the model shows the opposite. Thissuggests that the use of a second phytoplankton group is necessary
to simulate adequately the springesummer dynamics of regen-erated primary production and semi-labile DOC. On Georges Bank,the DOC dynamics show no major accumulation in the surfacewater during spring (Fig. 5a) in agreement with the observation(Chen et al., 1996).
The simulated (with DOM) and observed (SeaWiFS) monthlymean of surface chlorophyll concentration are compared for thepost-bloom period (June 2004), i.e. at a critical moment for thebuildup of DOC pool. The high chlorophyll levels agree well onparticularly in the inner-shelf and on Georges Bank due to the tidalmixing and permanent nutrient availability. A feature which ispartially observed by the satellite sensor in the Georges Bank areabut appears in themodel and is well documented (Ryan et al., 1999)is the enhancement of surface chlorophyll at the shelf break of theMAB and southern Georges Bank frommid-April to late June. Thesehigher chlorophyll concentrations correspond to the transitionperiod fromwell-mixed to stratified conditions and is sustained bythe upwelled nitrate-rich waters of the geostrophic jet that flowsalong the shelf break and slope fromGeorges Bank to Cape Hatteras(Ryan et al., 1999; Fig. 8a). Although the satellite-derived chloro-phyll content in the Gulf Stream is higher than in other offshoreareas, the model overestimates it (Fig. 6) due to imperfections inthe model physics of this highly dynamic area (likely the mixedlayer depth).
A novel plot for quantitatively evaluating and displaying the skillof coupled biologicalephysical models, called the target diagram,has been recently introduced (Jolliff et al., 2009). In these diagrams,bias and centered-pattern RMS are normalized by the standarddeviation of the observations and plotted on the x- and y-axes,respectively. Because the sum of the squares of these two
Fig. 4. Seasonal profiles of (a) phytoplankton biomass (mmol N m�3), (b) semi-labile DOC (mmol C m�3) and (c) semi-labile dissolved organic nitrogen (DON, mmol N m�3)simulated by the model at station 3 (southern mid-shelf MAB). The mixed layer depth (solid black) and the depth of the 10% (dash white) and 1% (solid white) isolume are alsoshown.
J.N. Druon et al. / Estuarine, Coastal and Shelf Science 88 (2010) 488e507 493

Author's personal copy
components of the RMS difference is equal to the square of the totalRMS difference, the distance from the origin to each plot symbolrepresents total RMS error. Although centered-pattern RMS isinherently a positive quantity, in the target diagram the centered-pattern RMS is multiplied by the sign of the difference: standarddeviation of observations � standard deviation of model. Thussymbols are plotted with positive x-coordinates if the model
overestimates the data variability and with negative x-coordinatesif the model underestimates the data variability. The circle repre-senting total RMS difference ¼ 1.0 (i.e. total RMS equals the stan-dard deviation of the observations) is typically superimposed onthese diagrams for reference. By definition, model results fallingwithin this circle reproduce observed quantities better than themean of those observations.
Fig. 5. Seasonal surface concentration of semi-labile DOC (mmol C m�3) for 2004 estimated by the (a) model in the MAB and Georges Bank regions and from (b) the SeaWiFSsatellite sensor in the MAB area (see Mannino et al., 2008). Note geographical extension between (a) and (b) are different. Isobaths are in meters.
J.N. Druon et al. / Estuarine, Coastal and Shelf Science 88 (2010) 488e507494

Author's personal copy
Target diagrams for both model runs (with and without DOM)are presented in Fig. 7, and illustrate the skill of the models inreproducing the satellite monthly mean surface chlorophyllconcentrations (2004) for the region encompassing the mid- andouter-shelf and slope of the MAB. Overall the target diagrams
demonstrate that both model simulations produce monthly chlo-rophyll concentrations comparable to SeaWiFS with March andApril as the exceptions (April for the runwith DOMhas a bias of 6.5,thus just falling out the axes). The reference run generally (exceptFebruaryeApril) underestimates the surface chlorophyll content(negative bias), whereas the DOM run more often overestimatessurface chlorophyll (except in January, Fig. 7). Both simulationsoverestimate the spatial variability of surface chlorophyll in Feb-ruaryeMay (positive centered-pattern RMS). From June to August,both simulations underestimate similarly the observed spatialvariability to the same degree. However in these summer months,when the DOM plays an important role in sustaining the phyto-plankton production, the model results are negatively biased(underestimation) in the run without DOM whereas the bias isnearly zero for the run with DOM.
The organic carbon production in the MAB and Georges Bankregions (Fig. 8c) range between 100 and 300 g Cm�2 yr�1 in generalagreement with previously published values (Falkowski et al., 1988and Berger, 1989: 120e300 g C m�2 yr�1) with little alongshorevariability in the central MAB (O’Reilly and Busch, 1984). However,this level of productivity is lower than the approach using mixedsatellite and in situ profiles with values of 320 g C m�2 yr�1 on theshelf, 304 g C m�2 yr�1 on the shelf break and 411 g C m�2 yr�1 onthe slope of the northern MAB (Mouw and Yoder, 2005). Comparedto prior estimates of primary productivity for the Georges Bankregion (O’Reilly et al., 1987), the model estimates are too low byapproximately 100 g C m�2 yr�1.
The seasonal variability of simulated primary production onGeorges Bank (Fig. 3a) from May to September are in agreementwith measurements (slightly above 1 g C m�2 d�1, O’Reilly et al.,1987), but the DecembereMarch levels of productivity of0.01e0.10 g C m�2 d�1 in the model are significantly lower thanobservations (0.2e0.6 g C m�2 d�1). The lack of a low-lightsensitive phytoplankton group in the model is believed to be thecause of the winter underestimation of productivity. Thepercentage of extracellular release (PER) shown on Fig. 3 is inagreement with the measurements of O’Reilly et al. (1987)between 14% in the shallow water (8e23% at station 1) and 21%over the slope of Georges Bank. Daily primary production levelssimulated at station 2 (Fig. 3b) are also in agreement with themeasurement of the SEEP-I experiment in 1984 with0.60 g C m�2 d�1 in March and 1.33 g C m�2 d�1 in April(Falkowski et al., 1988). The inner-shelf north and south of theDelaware Bay show a much stronger underestimation of produc-tivity in the model (100 g C m�2 yr�1) than the observation(505 g C m�2 yr�1, O’Reilly et al., 1987). In that particular area, thephytoplankton is nitrogen-limited, and the lack of sedimenterosion by waves and POM resuspension is believed to cause thisdiscrepancy. The levels of productivity provided by the model in
Fig. 6. Surface chlorophyll concentration (mg Chl m�3) simulated by the model (left) and observed by the satellite sensor SeaWiFS using the algorithm OC4V4 for June 2004 in theMAB and Georges Bank regions.
-6 -4 -2 0 2 4 6
-6
-4
-2
0
2
4
6
bias
CP_RMS
JanFebMarAprMayJunJulAugSepOctNovDecdata
-6 -4 -2 0 2 4 6
-6
-4
-2
0
2
4
6
bias
CP_RMS
Fig. 7. Target diagrams (representing the total RMS difference, see text for details) ofthe monthly mean of surface chlorophyll concentration between the model estimateand derived from satellite (SeaWiFS sensor) for the reference run without DOM(upper) and the model run including DOM (lower). The area included in this evaluationcomprises the mid- and outer-shelf and the slope of the MAB. Note that a positive biasand centered-pattern RMS correspond to an overestimation compared to the satelliteestimate of the model chlorophyll value and spatial variability respectively.
J.N. Druon et al. / Estuarine, Coastal and Shelf Science 88 (2010) 488e507 495
Author's personal copy
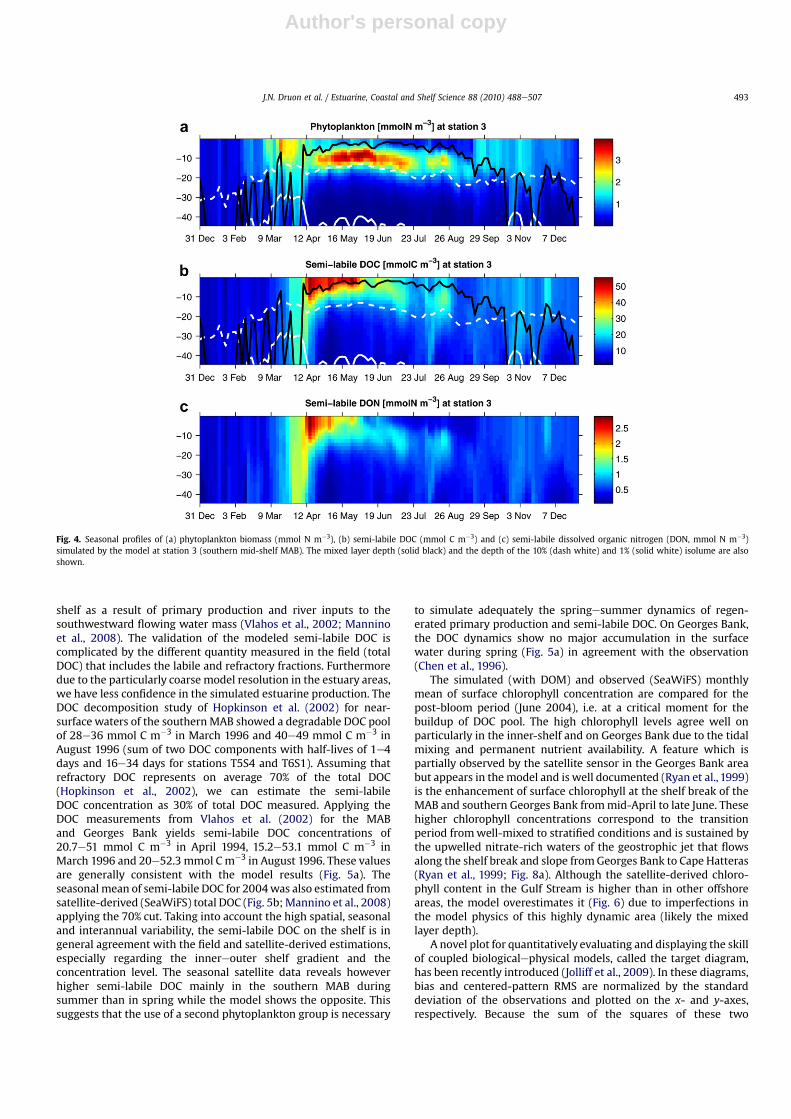
Fig. 8. Comparison of the annual nutrient uptake and carbon production rates for the model run with the DOM module (left panels) and without DOM (right panels): (a) nitrateuptake (new production, mol N m�2 yr�1), (b) ammonium uptake (regenerated production, mol N m�2 yr�1), (c) total carbon primary production (g C m�2 yr�1) and (d) carbonexcess uptake (g C m�2 yr�1) estimated by the DOM model for 2004 in the MAB and Georges Bank regions. Panels (e), (f) and (g) are the same model outputs as (a), (b), and (c) forthe simulation without the DOM model. In the DOM model, the carbon excess uptake of DIC represents an ‘overflow’ of photosynthesis under nutrient limitation, resulting in DOCproduction.
J.N. Druon et al. / Estuarine, Coastal and Shelf Science 88 (2010) 488e507496

Author's personal copy
the southern MAB shelf between the Chesapeake Bay mouth andCape Hatteras (0.5e1.0 g C m�2 d�1 in March and July) are in therange of field data (0.5e1.0 g C m�2 d�1 in March and0.5e2.0 g C m�2 d�1 in July, Verity et al., 2002). With the exceptionof the inner-shelf of the MAB, the productivity is thus wellreproduced for the springesummereautumn period when most ofsemi-labile DOC variability occurs.
3.3. Semi-labile DOC export to the open ocean and POC burial
The annual mean horizontal divergence of semi-labile DOCintegrated over the water column (Fig. 9a) shows specific areas ofproduction, areas of export (positive values) and import (negativevalues) for both the shelf and the open ocean. Areas of highprimary production are identified as regions of significant export
Fig. 9. (a) Net horizontal transport of semi-labile DOC (mol C m�2 yr�1) estimated by the model for the year 2004 in the MAB and Georges Bank regions: positive values are areas ofproduction and export of semi-labile DOC and negative values are areas of import. (b) Carbon burial (mol C m�2 yr�1) for the same area and period.
J.N. Druon et al. / Estuarine, Coastal and Shelf Science 88 (2010) 488e507 497

Author's personal copy
of semi-labile DOC. The DOC release in Georges Bank and the shelfsouth of Cape Cod is mainly exported to the central MAB shelf. TheDOC released on the southern outer-shelf and slope of the MABand off Cape Hatteras is exported to the adjacent deeper ocean.Both areas of export and import show an annual flux on the orderof 1 mol C m�2 yr�1.
POC deposition at the seabed was fairly well represented by themodel. POC deposition rates on the shelf off Delaware Bay andChesapeake Bay of 2.7 and 2.1 mol C m�2 yr�1 respectively (Biscayeet al., 1994) are in agreement with the model which ranges from 1.0to 2.5 and from 1.0 to 4.0 mol C m�2 yr�1 respectively (results notshown). The model, however, underestimates approximately ten-fold the POC deposition on the slope compared to field measure-ments (4.6e13.1 mol C m�2 yr�1 off Cape Hatteras and1e2 mol C m�2 yr�1 on other slope areas of the MAB, Biscaye et al.,1994; Schaff et al., 1992; Thomas et al., 2002). This suggests that thesinking velocity of the large detritus is too low or a third ‘very large’detritus pool with sinking velocities of 100 m d�1 (Walsh, 1994) islacking in the model for deep estimates.
Contrary to POC deposition, carbon burial on the shelf is notwelldocumented in the literature. Although the burial is probablyslightly underestimated, together with primary production, webelieve the model estimate of POC burial (Fig. 9b) is realistic sincethe POC deposition rate agrees with field measurements and thesimulated POC burial on the shelf is globally higher (from 1.5 to4.1 mol C m�2 yr�1) than field estimates on the slope(1e2 mol C m�2 yr�1). The maxima in POC burial (Fig. 9b) occur onthe inner-shelf south of the dominant simulated rivers and estu-aries from 1.5 up to 4 mol C m�2 yr�1. Except for the region south ofCape Cod and Georges Bank where the tidal-induced bottom fric-tion prevents deposition, the rest of the shelf shows decreasingvalues of POC burial from inshore to offshore, with a flux of about0.5e1 mol C m�2 yr�1 along the 40 m isobath. For water depthgreater than 100 m in the MAB, the POC is entirely mineralized inthe water column. The burial of PON has the same geographicaldistribution as POC with a CeN ratio of 9.3 (see Appendix).
4. Discussion
4.1. Impacts of the DOM on the ecosystem model
In the simulation without DOM, the POM pools are directlyremineralized to DIC and ammonium using the same rates as inFennel et al. (2006), i.e. 0.03 d�1 for small detritus and 0.01 d�1 forlarge detritus. Otherwise, the parameterization is the same forboth simulations. The main impact of the introduction of DOM tothe model is a large increase in regenerated production (ammo-nium uptake) from 30% at Georges Bank and shelf break, 50% overthe slope and deep ocean, to 250e300% in the mid- and inner-shelf of the MAB (Fig. 8b and f). In contrast, the nitrate uptakeshows globally the same distribution and level. The total carbonproduction shows an increase up to 60 g C m�2 yr�1 in the openocean and the deeper Georges Bank (between 40 and 100 m,station 1), among which 0e20 g C m�2 yr�1 is linked to the carbonexcess uptake. The increase in productivity ranges from 60 to90 g C m�2 yr�1 in the outer-shelf and the most of the slope andfrom 90 to 180 g C m�2 yr�1 in the inner- and mid-shelf amongwhich 20e35 g C m�2 yr�1 is related to carbon excess uptake. Thisenhanced production is mainly (65e100%) caused by theprogressive mineralization of the semi-labile DON in surfacewaters in summer and autumn (Fig. 4c). The productivity sup-ported by DON during summer and autumn could explain theusual underestimation of models which do not include DON (e.g.Fennel et al., 2006). Only 0e35% of this increase depending on thelevel of nutrient depletion is related to the ‘extra’ production of
carbohydrates. The constant supply of nutrient by the tidal-induced mixing on Georges Bank reduces the importance of DONas a source of nitrogen in the upper layer as shown by the smalldifference in primary production between the two simulations(Fig. 3, station 1). The phytoplankton biomass and chlorophylllevels are also dramatically lower without the DOM module,particularly in the MAB shelf and slope (Fig. 7). The targetdiagrams demonstrate the improvement in estimating surfacechlorophyll in summer for the DOM model simulation, but wors-ened for March and mid-autumn.
4.2. The semi-labile DOM dynamics
Themodel highlights that the most important contributor to thesemi-labile DOC near the surface at station 3 is the phytoplanktonexudation. The exudation mainly occurs in the mixed layer duringthe stationary and decaying phases of the bloom and between themixed layer depth and the 10% isolume during summer. Note thatthe carbon excess-based contribution of the exudation in summertakes place in the upper part of this subsurface layer wherephytoplankton are nutrient-limited and not light-limited. Incontrast, the nutrient-based release takes place in the deeper andlight-limited areas. The other important contributor to DOC releaseis the POC solubilization which occurs in deeper waters. Thevertically integrated flux of DOC release by POC solubilization isabout three times greater than the release by exudation although itis more equally distributed in the water column. The smallestcontributor to DOC release at station 3 is sloppy feeding byzooplankton, which accounts for approximately 1% of the annualrelease, although it temporarily reaches 10% of the total DOCrelease at the end of the spring bloom. This simulated rate canreach 50% in highly productive areas such as the Chesapeake Baymouth during a bloom in agreement with the field estimates(Møller et al., 2003).
The vertically integrated reservoir of semi-labile DOC at station3 is 1.5 times higher than the carbon detritus pool and twice thecarbon standing stock of phytoplankton. At station 1 and 2, thesemi-labile DOC pool is twice the POC pool and four times thecarbon phytoplankton pool. It represents therefore the largestfreshly produced organic pool of carbon in the water column on themid- and outer-shelf. It can be efficiently exported by horizontaltransport (see next section) since this organic carbon is dissolvedand slowly mineralized. Model results suggest that a large fractionof the carbon dioxide entering the shelf ocean is stored in semi-labile DOC, while 12e14% of the CO2 flux is buried at stations 2 and3 (less at station 1 where tidal mixing prevents deposition).
4.3. Carbon export
The annual carbon dioxide airesea flux simulated by the modelis positive (carbon sink) for the studied waters except in the upperpart of the Chesapeake Bay where a continuous flow of terrestrialorganic materials favors the mineralization and generates a sourceflux of dissolved CO2 to the atmosphere. The annual CO2 fluxranges from 0.5 to 2.0 mol C m�2 yr�1 in the deep ocean and onthe shelf except South of Cape Cod and Georges Bank where valuesrange from 2 to 5 mol C m�2 yr�1. This is in agreement with theestimation of a net annual uptake of w1 mol m�2 yr�1 CO2 in theMAB (DeGrandpre et al., 2002). Since the carbon-rich DOMbuildup contributes to CO2 drawdown seasonally (Sambrotto et al.,1993), the results suggest that a large amount of the carbonentering the surface ocean is temporarily stored in the DOCreservoir.
The carbon export of POC from the shelf to the slope has beenstudied extensively (e.g. Biscaye and Anderson, 1994; Thomas
J.N. Druon et al. / Estuarine, Coastal and Shelf Science 88 (2010) 488e507498

Author's personal copy
et al., 2002) and was shown to be particularly important nearCape Hatteras where both the MAB (Mayer et al., 2002) and SABproduction (Schaff et al., 1992) contribute to the shelf-slopecarbon efflux due to the converging shelf circulation. Thecomparison presented in Fig. 9 shows that POC is buried in theinner- and mid-shelf of the MAB at rates comparable to theexport of seasonally produced DOC from the outer-shelf andslope to the open ocean. In contrast to the southern MAB, theDOC produced at Georges Bank and south of Cape Cod is mostlyexported southward to the central MAB shelf between LongIsland and Delaware Bay and does not contribute to a net exportto the deep ocean.
5. Conclusion
This study describes a twin experiment where a circulationmodel coupled to a carbon and nitrogen biogeochemical model istested with and without the major DOM production processes.The test aims at estimating (1) the role of DOM in the coastalecosystem C and N cycling and (2) the relative importance of theexport of freshly produced DOC to the open ocean compared toPOC burial on the shelf. In nutrient-depleted and light-repleteconditions, the production of carbohydrate by phytoplanktonpartially decouples the carbon and nitrogen primary productivity.The results show that the introduction of DOM in the modelincreases primary production by 60e180 g C m�2 yr�1 in theMAB, of which 65e100% is caused by the ammonium releasefrom DON mineralization in the upper layer and 0e35% is linkedto the ‘excess’ production of carbohydrates. In terms of flux, theannual release of semi-labile DOC by the near-surface phyto-plankton exudation can be three times lower than the POCsolubilization in the water column. The seasonally produced DOCexport from the shelf to the open ocean takes place mostly in thesouthern outer-shelf and slope of the MAB at a comparable rateto POC burial in the inner- and mid-shelf (w1e2 mol m�2 yr�1).Subsequent steps in model development will consider theinclusion of the refractory DOC, multiple phytoplankton andzooplankton functional groups, a diagenetic sub-model to simu-late remineralization and burial in the sediment, a fast sinkingdetritus (w100 m d�1) and a higher horizontal resolution inshallow areas. The model parameterization and evaluation willalso be improved by using surface DOC and POC concentrationderived from satellite remote sensing. These refinements willallow for a more complete estimate of the carbon budget at thescale of the Eastern U.S. continental shelf and provide for a betterunderstanding of the role of DOC in the dynamics of carboncycling at the landeocean interface.
Acknowledgments
This work was supported by a NASA postdoctoral associateshiparranged by Dr. Paula Bontempi, the NASA Ocean Biology andBiogeochemistry Program Manager, in the frame of the NASAInterdisciplinary Science Project U.S. Eastern Continental ShelfCarbon Budget (USECoS, http://www.ccpo.odu.edu/Research/US-ECoS/). We wish to thank John O’Reilly, Cindy Lee, Eileen Hof-mann, Ray Najjar and Dale Haidvogel for the constructive discus-sions and suggestions on the project and Rutgers University,Institute of Marine and Coastal Sciences, for supplying thecomputer resources. The manuscript benefitted from commentsprovided by the editor, Ivan Valiela, and an anonymous reviewer.We thank the NASA Ocean Biology Processing Group for processingand distribution of SeaWiFS data.
Appendix
A.1. DOM processes and model description
DOM production by phytoplanktonAn overview of the literature highlights two phases of DOC
production by phytoplankton. Søndergaard et al. (2000) suggest intheir study that exponentially growing communities produce themost labile DOC, whereas declining and nitrogen-deficientcommunities produce the least labile DOC. During the growthphase, DOM production is linked to biomass and dominated by theexudation of labile-low molecular weight (LMW) organiccompounds (Jensen, 1983; Lancelot, 1984; Biddanda and Benner,1997) with a CeN ratio of w7 (range 3e11 depending on species[w6.6 for the diatom sp. Skeletonema], Biddanda and Benner, 1997).In fact, the exudationwas shown to be a passive diffusion across theouter cell membrane that occurs as long as new products ofphotosynthesis are available (Marañón et al., 2004). During thestationary and decaying phase of the bloom (i.e. under nutrientstress), large quantities of semi-labile, high molecular weight(HMW) DOM with high CeN ratios (10e25 compiling results ofBenner et al., 1992) would be released as a result of the exudation ofpolymeric carbohydrates (Lancelot and Billen, 1985) or due to celllysis and to ‘sloppy’ feeding by zooplankton.
Some evidence suggests that the release of carbohydrates byphytoplankton could mainly explain the accumulation of semi-labile DOC after the spring bloom and its progressive reminerali-zation during summer and autumn. Biddanda and Benner (1997)showed that the relative abundance of carbohydrates in phyto-plankton DOC increased from 23% during the exponential phase to80% during the decay phase. Continued maintenance of photo-synthetic machinery after nutrient exhaustion was found to beaccompanied by excretion of DOM and especially carbohydrateswith high CeN ratio (Hellebust, 1965; Norrman et al., 1995). Dia-toms can continue to excrete polysaccharides for a considerabletime after the halt of cellular protein synthesis (Jensen, 1983). Inmany offshore systems, a DOC decrease is found to continue afternutrient exhaustion (Sambrotto et al., 1993). The semi-labile DOCrelease would thus occur mainly in low nutrient conditions and islikely to be associated with phytoplankton primary production.Furthermore, the springesummer accumulation of DOC would berelated to microzooplankton grazing on bacteria coupled to lowbacterial growth rates, which would reduce DOC remineralizationand allow DOC accumulation (Thingstad et al., 1997).
Two models of extracellular DOM release have been proposed:the overflow model (Fogg, 1966, 1983; Williams, 1990; Nagata,2000) and the passive diffusion model (Fogg, 1966; Bjørnsen,1988). Even if these models were opposed in conflicting reports,it is likely that they are notmutually exclusive and that bothmodelsare correct given the right environmental conditions and planktoncommunity structure (Carlson, 2002). Carlson suggests that theextracellular release of labile-LMW-DOM model is likely to bea passive diffusion process linked to biomass. During the stationaryand decay phases, the overflow model is likely to represent anactive release of semi-labile-HMW-DOM linked to primaryproduction and enhanced in a nutrient-depleted environment.Because primary production is traditionally expressed in models asa function of biomass, both terms of exudation (labile) and excre-tion (semi-labile) of DOM are dependent on primary production inthe present model (and in most other modeling studies, e.g.Anderson and Williams, 1998).
Exudation of labile DON and nutrient-based labile DOCThe excretion as amino acids was estimated to be approximately
3% of the assimilated nitrate (Admiraal et al., 1986). The rate chosen
J.N. Druon et al. / Estuarine, Coastal and Shelf Science 88 (2010) 488e507 499
Author's personal copy
for the labile DON exudation (and instantaneous mineralization inthe model) is set to uN ¼ 3% of phytoplankton nitrogen production.The labile DOC leakage is also expressed as a function of primaryproduction with the same rate (uC ¼ 3%) to ensure a constantRedfield ratio for labile DOM and phytoplankton.
Semi-labile DON exudation by phytoplanktonThe average release of DON was found to be of 25e41% of the
inorganic nitrogen uptake in offshore oceanic (25%), coastal (27%)and estuarine (41%) environments with turnover times of 10 � 1,18 � 14, and 4 days respectively (Bronk et al., 1994). Since thelabile fraction of DON production is estimated to be a few percentof DIN uptake (3%, see above), the semi-labile DON total releasein the coastal ocean is estimated at 24% of nitrogen-basedprimary production with a decreasing value offshore. Varela et al.(2003) provided some evidence that DON production is domi-nated by grazing processes rather than by direct phytoplanktonexcretion. Large DON losses (>50% of nitrogen uptake) wereattributed to intense grazing and sloppy feeding for severalmarine ecosystems (Bronk and Ward, 2000). The maximum ofDON release was found to occur when small, presumablyheterotrophic, flagellates dominated the biomass and not theprimary production (Varela et al., 2003), i.e. sloppy feeding byflagellates could significantly increase the DON release. Insummary, sloppy feeding might dominate the DON releaseduring a short period of intense grazing, but phytoplanktonexudation and detritus solubilization dominates otherwise. It isestimated that the DON released by exudation follows a Redfieldratio of the nutrient-based DOC exudation that is set to 4% ofprimary production (basal value of DOC exudation by healthyphytoplankton, see next subsection). The rate of semi-labile DONexudation by phytoplankton (3N) is set to 4% of nitrogen-basedprimary production. Following the above assumption that semi-labile DON release should be 24% of primary production in mostof the continental shelf, the sloppy feeding should account for3e15% (low and high grazing) and PON solubilization for 17e5%depending on grazing.
Nutrient and carbon excess-based semi-labile DOC exudation byphytoplankton
In their mesocosm experiment, Norrman et al. (1995) observedthat 23% of total new production accumulated as DOC, which wasfound to increase due to a combination of excretion and cell lysis. Alarge range of values of DOC production as a fraction of primaryproduction can be found in the literature (5e30%, Biddanda andBenner, 1997; Norrman et al., 1995; Vlahos et al., 2002), howeverexcretion from natural healthy phytoplankton was found to belower (4e16%) than at the end of a diatom bloom (17e38%,Hellebust, 1965).
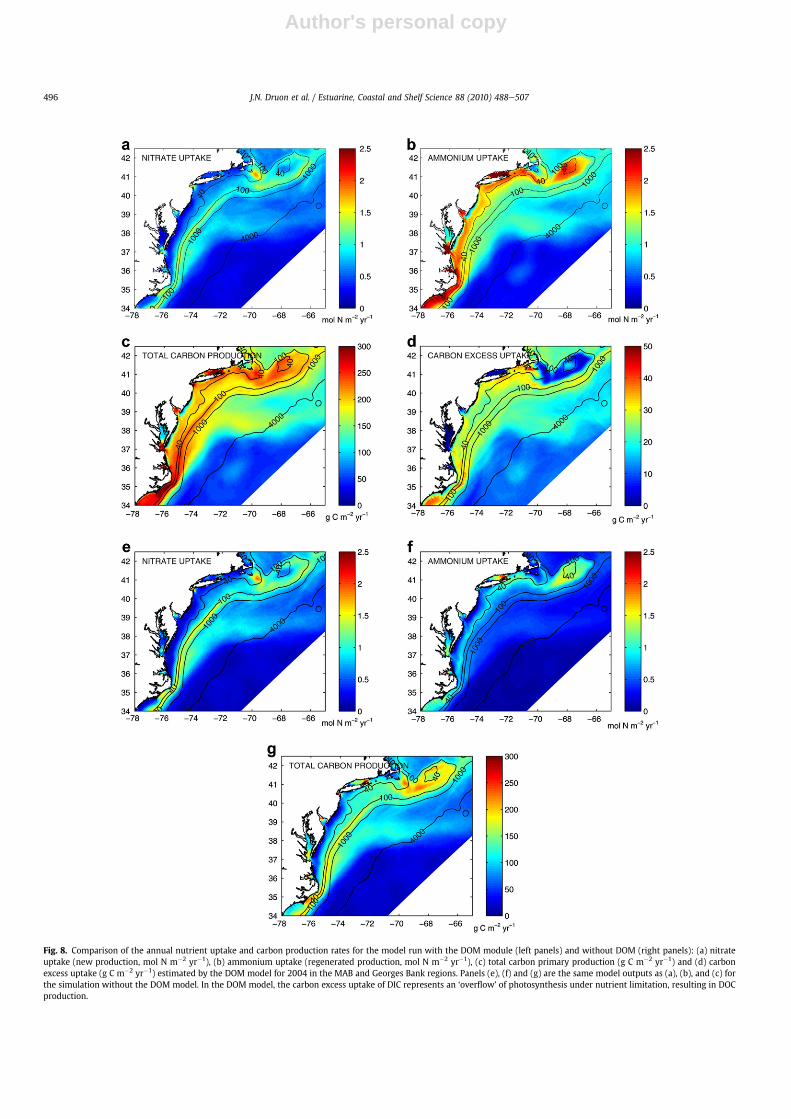
Two terms describe the semi-labile DOC exudation byphytoplankton in the model: a nutrient-based and carbon excess-based release. The nutrient-based release reflects the healthyphytoplankton exudation of semi-labile DOC and follows thesemi-labile DON exudation with the Redfield ratio. The carbonexcess-based release represents the carbohydrate over-produc-tion by nutrient-stressed cells. The carbon excess uptake is seenas an ‘overflow’ of photosynthesis under nutrient limitation. It isformulated as the difference between the nutrient-saturated(light-limited) and nutrient-limited (light-limited) primaryproduction and is directed to the semi-labile DOC (Anderson andWilliams, 1998; Ianson and Allen, 2002, see Fig. A.1 with thedetails of the terms in Table 1). The carbon excess uptake (Uexc.C)is thus expressed:
Uexc:C ¼ gCNPðPPL � PPLLNÞ
where PPL is the nutrient-based primary production limited bylight, LN is the nutrient limitation, CNP is the CeN ratio forphytoplankton and g the parameter of carbon excess-basedDOC excretion by phytoplankton. A fraction (sc) of the carbonexcess uptake is directed to the semi-labile DOC pool andrepresents the exudation of carbon excess-based DOC release.This fraction is set to sc ¼ 0.45 (Biddanda and Benner, 1997found w35%). The labile DOC originating from carbon excessuptake represents a slightly higher fraction (1 � sc) and isdirected back to DIC.
The total excretion is commonly expressed as a fraction of thetotal carbon fixed by phytoplankton, the percentage extracellularrelease (PER). In the present setting, the PER follows:
PER ¼ 100�Elab:nut:C þ Esem:nut:C þ Elab:exc:C þ Esem:exc:C
Unut:C þ Uexc:C
�
¼ 100
1� 1� uN � 3N
1þ gð 1LN � 1�!
The PER for diatoms was estimated to be between 10% and about55% (Baines and Pace, 1991; Obernosterer and Herndl, 1995) withan increase between the exponential and the stationary phase ofthe bloom. Higher PER values (70e80%) were observed ineutrophic water for Phaeocystis pouchetii (Lancelot, 1983). Theanalytical formulation of the PER in our model shows that themean PER is lower than 65% for LN below 0.5 (nutrient limitingcondition) when g is set to 0.20. We thus chose g ¼ 0.20 for thesimulations. For comparison, Anderson and Williams (1998)adjusted g to 0.26 to achieve the desired spring DOC concen-tration and obtained PER values between 10% and 60% for stationE1 in the English Channel.
Fig. A.1. Diagram of the fluxes involved in the uptake and exudation of nitrogen andcarbon. See Table 1 for details.
Table 1Summary of the terms involved in the uptake and exudation of nitrogen and carbonby phytoplankton. PPL is the nutrient-based primary production limited by light, LNis the nutrient limitation, CNP is the CeN ratio for phytoplankton and g theparameter of carbon excess-based dissolved organic carbon (DOC) excretion byphytoplankton (see Table A1 for the definition of other parameters).
Expression Description
UN ¼ PPLLN Nitrogen-based primary production or uptakeof nitrogen
Unut.C ¼ CNPUN Nutrient-based primary production in carbonElab.N ¼ uNUN Exudation of labile DON (directed to ammonium)Elab.nut.C ¼ CNPuNUN Exudation of labile DOC (directed to DIC)Esem.N ¼ 3NUN Exudation of semi-labile DONEsem.nut.C ¼ CNPEsem.N Nutrient-based exudation of semi-labile DOCUexc.C ¼ CNPgPPL(1 � LN) Carbon excess uptake by nutrient-stressed
phytoplanktonElab.exc.C ¼ (1 � sc)Uexc.C Carbon excess-based exudation of labile DOCEsem.exc.C ¼ scUexc.C Carbon excess-based exudation of semi-labile DOC
J.N. Druon et al. / Estuarine, Coastal and Shelf Science 88 (2010) 488e507500

Author's personal copy
DOC release by ‘Sloppy’ feedingMeasurements from the literature suggest a high DOC
release when the prey is large relative to the copepod and lowDOC release when the prey is small relative to the copepod(Møller, 2005). During a diatom bloom, sloppy feeding was, byfar, the most important contributor to the DOC production byCalanus spp., and 49% of the carbon removed from suspension bythe copepods was returned to the water column as DOC (Mølleret al., 2003). A significant relationship between the DOCproduction through sloppy feeding by zooplankton and thecopepod-to-prey size ratio was found (Møller, 2005). Q definesthe fraction of prey carbon removed from suspension and lost asDOC for copepod:prey size ratio below 55: Q ¼ 0.714 � 0.013(ESDcopepod/ESDprey) where ESD is the equivalent sphericaldiameter.
According to Møller et al. (2003), when copepods graze largediatom cells in spring the copepod:prey size ratio can reacha minimum of 10 and Q values may reach 71%. For an increasingsize ratio, i.e. when copepods graze on smaller prey duringsummer, Q decreases linearly down to Q ¼ 0.1% for a size ratio of55 (or more). In agreement, Møller (2005) illustrates that whenthe prey is large relative to the copepod, i.e. during a bloom oflarge cells, copepods lose significant amounts of dissolved mate-rial. In contrast, the link between copepod feeding and energyflow to higher trophic levels is tighter when the prey is small, i.e.during oligotrophic periods when small cells dominate thephytoplankton prey. The fraction of DOC released by sloppyfeeding is likely to reach its maximum during the spring bloom(large diatoms) and minimum in summer when smaller cells aregrazed. Since a high grazing level is a good proxy of high biomassof large cells (diatom spring bloom), a linear relationship is used toenhance the fraction of DOC release by sloppy feeding at highgrazing levels:
QDOC ¼ 0:71�
ggmax
�¼ 0:71
Phy2
kp þ Phy2
!
where g is the grazing, gmax is the maximum grazing rate,g ¼ gmax(Phy2/(kp þ Phy2)) (Fennel et al., 2006) and kp is the half-saturation constant of phytoplankton ingestion. The maximumfraction of DOC release of 71% is thus encountered when thegrazing intensity is maximum, i.e. at the highest levels of phyto-plankton biomass.
The fraction of semi-labile DOC (to total DOC) in the phyto-plankton cell is estimated using the work of Biddanda andBenner (1997). They estimated that dissolved carbohydratesrepresent the major part of cell DOC during the stationary phaseof the bloom. They measured a fairly stable fraction of dissolvedpolysaccharide carbohydrate (between 78 and 94% with a meanof 85%) compared to dissolved monosaccharide carbohydratebetween the exponential growth and the stationary phase.However, dissolved polysaccharides (particularly fresh material)can be rather labile (Mannino, 2000; Mannino and Harvey,2000), therefore the fraction of semi-labile DOC compared tolabile DOC is set to dC ¼ 55%. Although the cell-content of DOC isconstant in the model, Biddanda and Benner (1997) measuredan increase of dissolved carbohydrates from 23 to 80% of cellDOC for four phytoplankton groups (Synechococcus, Phaeocystis,Emiliana and Skeletonema) from the growth to the decay phase.The sloppy feeding related terms for carbon are therefore thefollowing:
Assimilation of organic carbon by zooplankton ¼ CNPbgSemi-labile DOC release by sloppy feeding ¼ CNP(1 � b)QDOCdCg
Labile DOC (towards DIC) release by sloppy feeding¼ CNP(1� b)QDOC(1 � dC)gFecal pellets production (to large detritus) ¼ CNP(1 � b)(1 � QDOC)g
where b is the zooplankton assimilation rate.
DON release by ‘sloppy’ feedingHasegawa et al. (2001) found that 9e75% of ingested nitrogen is
assimilated in zooplankton biomass depending on food concen-tration. Therefore, from 25 to 91% of grazed nitrogen is released asPON, DON or ammonium for low and high food concentrationsrespectively through the processes of sloppy feeding, excretion andegestion of fecal pellets. Zooplankton excretion rates in the originalmodel (Fennel et al., 2006) included the assimilation-relatedexcretion (lE ¼ 0.1 d�1 if grazing is maximum) and the basalmetabolism related excretion (lBM ¼ 0.1 d�1). The rate of fecal pelletproduction was set to 25% and the assimilation efficiency to 75%.Therefore, in order to compare with the values of Hasegawa et al.(2001), the fraction of nitrogen released per day in the model byexcretion (assuming zooplankton ingests 60% of its weight of preyper day1) and egestion of fecal pellets was0.1 � 0.75 þ 0.1 � 0.6 þ 0.25 ¼ 0.385. This value can decrease to28.5% if the zooplankton stops grazing. Therefore the model abso-lute assimilation efficiency ranged from 61.5% for high foodcondition to 71.5% under low food condition, which is a low rangefor DON release compared to Hasegawa et al. (2001) (9e75%assimilation). Adding the process of sloppy feeding has the effect ofdecreasing the absolute assimilation efficiency for high foodcondition, with a maximum contribution of about 50% of thenitrogen grazed. The assimilation efficiency in the model wasconstant and linked to fecal pellet production (b¼ 0.75). Comparedto the original model, b is grazing-dependant taking into accountthe loss of DON by sloppy feeding. In the current model, the‘absolute’ assimilation efficiency (which includes the excretionrates, b � lEbg/gmax � lBM) varies between 10 and 75% as a functionof the grazing intensity (Hasegawa et al., 2001), which leads to:
b ¼½0:75þ lBM � 0:65 g
gmax
ih1� lE
ggmax
iwhere b is the grazing-based assimilation efficiency (excluding theexcretion rates). The assimilation efficiency defined here does notinclude the excretion rates and varies between b¼ 0.22 for g¼ gmaxand b ¼ 0.85 for g ¼ 0. The fraction of semi-labile DON to total DONis assumed to be low (the opposite for DOC) and is set to dN ¼ 30%.QDON being the fraction of total DON to (DON þ PON) within thephytoplankton cell, a fraction (1 � QDON) of the remaining non-assimilated material (1 � b) is allocated to the fecal pellets and thecomplementary fraction (QDON) lost by sloppy feeding to the DON.Seventy percent (1 � dN) of this last fraction is labile and 30% (¼dN)is the semi-labile DON.
In summary, the grazing term for nitrogen is divided asfollowing:
Nitrogen assimilation for zooplankton ¼ bgSemi-labile DON release by sloppy feeding ¼ (1 � b)QDONdNgLabile DON release by sloppy feeding ¼ (1 � b)QDON(1 � dN)gFecal pellets production (to large detritus) ¼ (1 � b)(1 � QDON)g
1 The maximum grazing rate is 0.6 d�1.
J.N. Druon et al. / Estuarine, Coastal and Shelf Science 88 (2010) 488e507 501
Author's personal copy
The CeN ratio of semi-labile DOMproduced by sloppy feeding inthe model, deduced analytically using the terms defined above, hasthe constant value of 12.1 (CNPdC/dN) using the current parameterset (see Appendix).
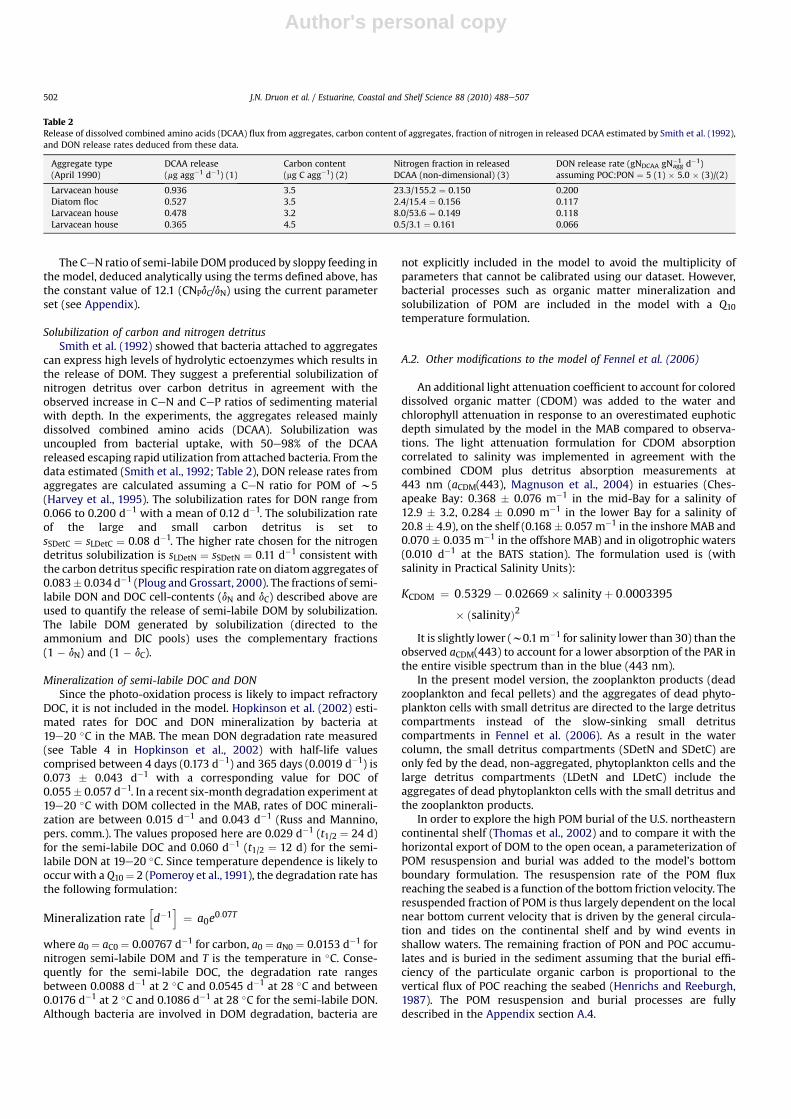
Solubilization of carbon and nitrogen detritusSmith et al. (1992) showed that bacteria attached to aggregates
can express high levels of hydrolytic ectoenzymes which results inthe release of DOM. They suggest a preferential solubilization ofnitrogen detritus over carbon detritus in agreement with theobserved increase in CeN and CeP ratios of sedimenting materialwith depth. In the experiments, the aggregates released mainlydissolved combined amino acids (DCAA). Solubilization wasuncoupled from bacterial uptake, with 50e98% of the DCAAreleased escaping rapid utilization from attached bacteria. From thedata estimated (Smith et al., 1992; Table 2), DON release rates fromaggregates are calculated assuming a CeN ratio for POM of w5(Harvey et al., 1995). The solubilization rates for DON range from0.066 to 0.200 d�1 with a mean of 0.12 d�1. The solubilization rateof the large and small carbon detritus is set tosSDetC ¼ sLDetC ¼ 0.08 d�1. The higher rate chosen for the nitrogendetritus solubilization is sLDetN ¼ sSDetN ¼ 0.11 d�1 consistent withthe carbon detritus specific respiration rate on diatom aggregates of0.083� 0.034 d�1 (Ploug and Grossart, 2000). The fractions of semi-labile DON and DOC cell-contents (dN and dC) described above areused to quantify the release of semi-labile DOM by solubilization.The labile DOM generated by solubilization (directed to theammonium and DIC pools) uses the complementary fractions(1 � dN) and (1 � dC).
Mineralization of semi-labile DOC and DONSince the photo-oxidation process is likely to impact refractory
DOC, it is not included in the model. Hopkinson et al. (2002) esti-mated rates for DOC and DON mineralization by bacteria at19e20 �C in the MAB. The mean DON degradation rate measured(see Table 4 in Hopkinson et al., 2002) with half-life valuescomprised between 4 days (0.173 d�1) and 365 days (0.0019 d�1) is0.073 � 0.043 d�1 with a corresponding value for DOC of0.055� 0.057 d�1. In a recent six-month degradation experiment at19e20 �C with DOM collected in the MAB, rates of DOC minerali-zation are between 0.015 d�1 and 0.043 d�1 (Russ and Mannino,pers. comm.). The values proposed here are 0.029 d�1 (t1/2 ¼ 24 d)for the semi-labile DOC and 0.060 d�1 (t1/2 ¼ 12 d) for the semi-labile DON at 19e20 �C. Since temperature dependence is likely tooccur with a Q10¼ 2 (Pomeroy et al., 1991), the degradation rate hasthe following formulation:
Mineralization ratehd�1
i¼ a0e
0:07T
where a0 ¼ aC0 ¼ 0.00767 d�1 for carbon, a0 ¼ aN0 ¼ 0.0153 d�1 fornitrogen semi-labile DOM and T is the temperature in �C. Conse-quently for the semi-labile DOC, the degradation rate rangesbetween 0.0088 d�1 at 2 �C and 0.0545 d�1 at 28 �C and between0.0176 d�1 at 2 �C and 0.1086 d�1 at 28 �C for the semi-labile DON.Although bacteria are involved in DOM degradation, bacteria are
not explicitly included in the model to avoid the multiplicity ofparameters that cannot be calibrated using our dataset. However,bacterial processes such as organic matter mineralization andsolubilization of POM are included in the model with a Q10temperature formulation.
A.2. Other modifications to the model of Fennel et al. (2006)
An additional light attenuation coefficient to account for coloreddissolved organic matter (CDOM) was added to the water andchlorophyll attenuation in response to an overestimated euphoticdepth simulated by the model in the MAB compared to observa-tions. The light attenuation formulation for CDOM absorptioncorrelated to salinity was implemented in agreement with thecombined CDOM plus detritus absorption measurements at443 nm (aCDM(443), Magnuson et al., 2004) in estuaries (Ches-apeake Bay: 0.368 � 0.076 m�1 in the mid-Bay for a salinity of12.9 � 3.2, 0.284 � 0.090 m�1 in the lower Bay for a salinity of20.8� 4.9), on the shelf (0.168� 0.057 m�1 in the inshore MAB and0.070 � 0.035 m�1 in the offshore MAB) and in oligotrophic waters(0.010 d�1 at the BATS station). The formulation used is (withsalinity in Practical Salinity Units):
KCDOM ¼ 0:5329� 0:02669� salinityþ 0:0003395
� ðsalinityÞ2
It is slightly lower (w0.1m�1 for salinity lower than 30) than theobserved aCDM(443) to account for a lower absorption of the PAR inthe entire visible spectrum than in the blue (443 nm).
In the present model version, the zooplankton products (deadzooplankton and fecal pellets) and the aggregates of dead phyto-plankton cells with small detritus are directed to the large detrituscompartments instead of the slow-sinking small detrituscompartments in Fennel et al. (2006). As a result in the watercolumn, the small detritus compartments (SDetN and SDetC) areonly fed by the dead, non-aggregated, phytoplankton cells and thelarge detritus compartments (LDetN and LDetC) include theaggregates of dead phytoplankton cells with the small detritus andthe zooplankton products.
In order to explore the high POM burial of the U.S. northeasterncontinental shelf (Thomas et al., 2002) and to compare it with thehorizontal export of DOM to the open ocean, a parameterization ofPOM resuspension and burial was added to the model’s bottomboundary formulation. The resuspension rate of the POM fluxreaching the seabed is a function of the bottom friction velocity. Theresuspended fraction of POM is thus largely dependent on the localnear bottom current velocity that is driven by the general circula-tion and tides on the continental shelf and by wind events inshallow waters. The remaining fraction of PON and POC accumu-lates and is buried in the sediment assuming that the burial effi-ciency of the particulate organic carbon is proportional to thevertical flux of POC reaching the seabed (Henrichs and Reeburgh,1987). The POM resuspension and burial processes are fullydescribed in the Appendix section A.4.
Table 2Release of dissolved combined amino acids (DCAA) flux from aggregates, carbon content of aggregates, fraction of nitrogen in released DCAA estimated by Smith et al. (1992),and DON release rates deduced from these data.
Aggregate type(April 1990)
DCAA release(mg agg�1 d�1) (1)
Carbon content(mg C agg�1) (2)
Nitrogen fraction in releasedDCAA (non-dimensional) (3)
DON release rate (gNDCAA gNagg�1 d�1)
assuming POC:PON ¼ 5 (1) � 5.0 � (3)/(2)
Larvacean house 0.936 3.5 23.3/155.2 ¼ 0.150 0.200Diatom floc 0.527 3.5 2.4/15.4 ¼ 0.156 0.117Larvacean house 0.478 3.2 8.0/53.6 ¼ 0.149 0.118Larvacean house 0.365 4.5 0.5/3.1 ¼ 0.161 0.066
J.N. Druon et al. / Estuarine, Coastal and Shelf Science 88 (2010) 488e507502

Author's personal copy
A.3. Parameter set
See Tables A1, A2 and A3.
A.4. Equations of the state variables
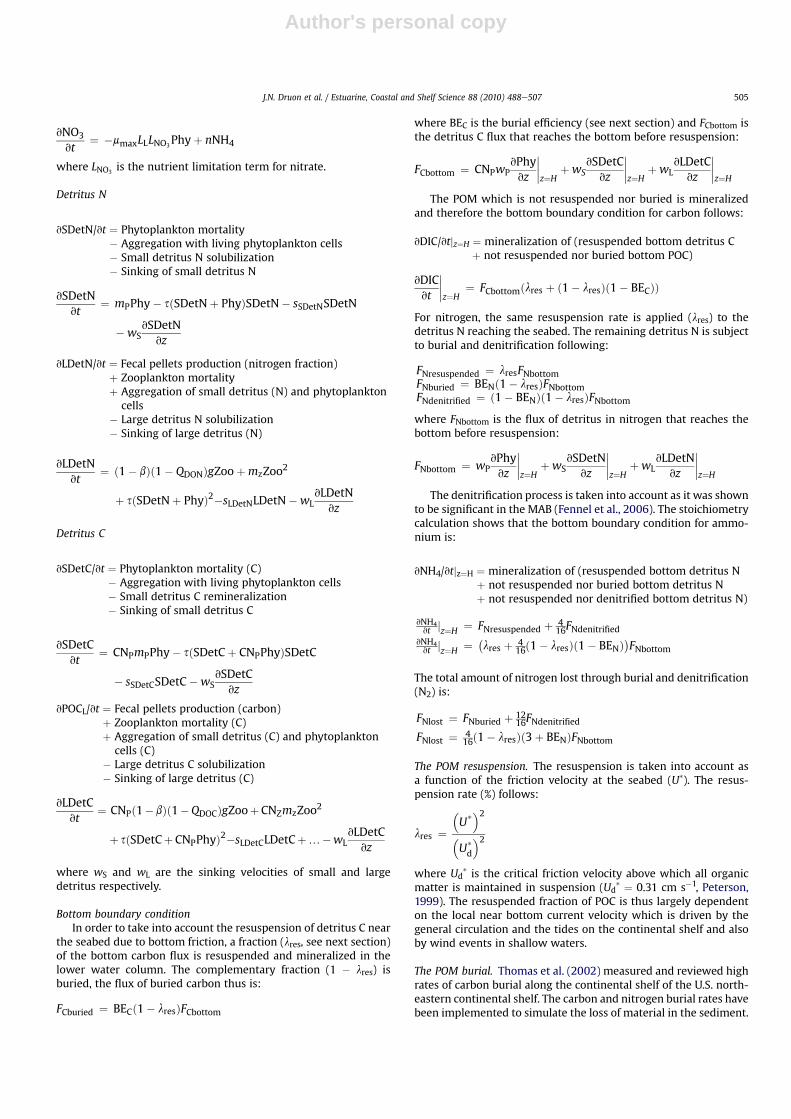
Semi-labile DON and DOCThe time rate of change of the semi-labile DON and DOC are:
vDON/vt ¼ Phytoplankton exudation þ Sloppy feedingþ Solubilization small and large N detritus (semi-labile fraction)� Remineralization semi-labile DON
vDONvt
¼ 3NmPhyþ ð1� bÞQDONdNgZooþ.þ dNðsSDetNSDetNþ sLDetNLDetNÞ � aN0e
0:07TDON
where m is the phytoplankton growth rate.
vDOC/vt ¼ Phytoplankton exudation (nutrient-based andcarbon excess-based) þ Sloppy feeding þ Solubilization smalland large C detritus (semi-labile fraction) � Remineralizationsemi-labile DOC
vDOCvt
¼ CNP ð3NmPhyþ sCg½mmaxLLð1� LNÞ�Phyþ ð1� bÞQDOCdCgZooÞ þ.þ dNðsSDetNSDetCþ sLDetNLDetCÞ � aC0e
0:07TDOC
where LL and LN are the non-dimensional terms that determinelight and nutrient limitation, and mmax the maximum phyto-plankton growth rate (m ¼ mmaxLLLN).
PhytoplanktonTwo sink terms are added in the phytoplankton time rate of
change: the exudation terms of semi-labile and labile DON towardsDON and ammonium respectively.
Table A2Modified parameterization from Fennel et al. (2006).
Symbol New value or range, and Unit Former value Parameter
aa 0.020 (W m�2)�1 d�1 0.025 (W m�2)�1 d�1 Initial slope of the PeI curvemmax
a 1.6 d�1 0.59 � 1.066T (T is the temperature in �C, Eppley, 1972) Maximum growth rate of phytoplanktonCNZ
b 5.0 [non-dimensional] 6.625 Zooplankton CeN ratiobb 0.22e085 for g/gmax ¼ [1.0e0.0] [non-dimensional] 0.75 Zooplankton assimilation efficiencywS
c 1.0 m d�1 0.1 m d�1 Small detritus sinking velocitywL
c 10.0 m d�1 1.0 m d�1 Large detritus sinking velocity
a The temperature-dependent formulation of Eppley (1972) was shown to underestimate primary production (Brush et al., 2002). Even if a temperature dependency mostprobably exists in relation to the cell metabolism, the light intensity is the prior control factor. The use of a temperature-dependent formulation led to a latitudinal variationand underestimation (low temperature below the thermocline) of primary production. For a better analysis of the results, the temperature dependency of the maximumgrowth rate was totally removed.
b See text for details.c Since the dead phytoplankton cells on one hand, and the zooplankton corps and fecal pellets on the other hand sink with distinct velocities due to their particles size
difference, the zooplankton products are flowed to the large particle pool which sinks faster instead of the small particle pool. The aggregation process thus concerns only thephytoplankton living and dead cells. The sinking velocities proposed for such a configuration are 1 m d�1 for the small detritus pool (dead phytoplankton cells) and 10 m d�1
for the large detritus pool (zooplankton particles and phytoplankton aggregates).
Table A3Common parameterization with Fennel et al. (2006).
Symbol Value and unit Parameter
kNO30.5 mmol N m�3 Half-saturation constant for
nitrate uptakekNH4
0.5 mmol N m�3 Half-saturation constant forammonium uptake
CNP 6.625 [non-dimensional] Phytoplankton CeN ratiogmax 0.6 d�1 Maximum grazing rateKPhy 2.0 (mmol N m�3)2 Half-saturation constant for grazingmp 0.15 d�1 Phytoplankton mortalitys 0.005 (mmol N m�3)�1 d�1 Aggregation parameterqmax 0.053 mg Chla mg C�1 Maximum chlorophyll to
phytoplankton ratiolBM 0.1 d�1 Excretion rate due to basal metabolismlE 0.1 d�1 Maximum rate of assimilation-
related excretionmz 0.025 (mmol N m�3)�1 d�1 Zooplankton mortalitywPhy 0.1 m d�1 Phytoplankton sinking velocity
Table A1DOM specific parameters.
Symbol Value or range and unit Parameter or formulation
uN 0.03 [non-dimensional] of primary production (N) Labile DON exudation rateuC 0.03 [non-dimensional] of primary production (C) Nutrient-based labile DOC exudation rateeN 0.04 [non-dimensional] of N primary production Exudation rate of phytoplankton semi-labile DONg 0.20 [non-dimensional] Parameter of carbon excess-based DOC exudationsC 0.45 [non-dimensional] Fraction of semi-labile DOC produced by the carbon excess-based exudationdN 0.30 [non-dimensional] Fraction of semi-labile DON to total DON within the phytoplankton celldC 0.55 [non-dimensional] Fraction of semi-labile DOC to total DOC within the phytoplankton cellQDON 0.0e0.71 [non-dimensional]: function of the ratio grazing:
maximum grazing (g/gmax)Fraction of total DON to (DON þ PON) within the phytoplankton cell
QDOC 0.0e0.71 [non-dimensional]: function of the ratio grazing:maximum grazing (g/gmax)
Fraction of total DOC to (DOC þ POC) within the phytoplankton cell
aN0 0.01530 d�1 Remineralization rate of semi-labile DON at 0 �C (aNT ¼ aN0e0.07T, with T in �C)
aC0 0.00767 d�1 Remineralization rate of semi-labile DOC at 0 �C (aCT ¼ aC0e0.07T, with T in �C)
sSDetN 0.11 d�1 Bacterial solubilization rate of small N detritussLDetN 0.11 d�1 Bacterial solubilization rate of large N detritussSDetC 0.08 d�1 Bacterial solubilization rate of small C detritussLDetC 0.08 d�1 Bacterial solubilization rate of large C detritus
J.N. Druon et al. / Estuarine, Coastal and Shelf Science 88 (2010) 488e507 503

Author's personal copy
vPhy/vt ¼ Phytoplankton growth� Exudation of semi-labile DON� Exudation of labile DON (to NH4)� Grazing� Phytoplankton mortality� Aggregation with small N detritus� Sinking of living cells
vPhyvt
¼ mPhyð1� 3N � uNÞ � gZoo�mPPhy
� sðSDet þ PhyÞPhy�wPvPhyvz
where mp is the phytoplankton mortality rate, s the aggregationparameter of the small detritus and Phy (towards the large detrituspool) and wP is the sinking velocity of living phytoplankton cells.
Phy is expressed in nitrogen unit using the constant CeN ratio(CNp) for accessing carbon units and therefore no equation isrequired for Phy expressed in carbon. A fraction (sC) of the carbonexcess uptake represents the semi-labile DOC exudation byphytoplankton and is directed towards the semi-labile DOC.
ChlorophyllThe chlorophyll equation is modified accordingly to the changes
of the phytoplankton equation:
vChl/vt ¼ Chlorophyll production� Loss by exudation of semi-labile DON� Loss by exudation of labile DON (to NH4)� Loss by grazing� Loss by phytoplankton mortality� Loss by aggregation with small N detritus� Loss by sinking of living cells
vChlvt
¼ rChlmChlð1� 3N � uNÞ � gZooChlPhy
�mPChl
� sðSDetNþ PhyÞChl�wPvChlvz
where rchl is the fraction of phytoplankton growth devoted to thechlorophyll synthesis (Geider et al., 1997):
rchl ¼ qmaxmPhy=aIChl
where qmax is the maximum ratio of chlorophyll to phytoplanktonbiomass, a is the initial slope of the phytoplankton growth curverelative to light and I the photosynthetically available radiation.
ZooplanktonThe zooplankton, like the phytoplankton, is only expressed in
nitrogen units:
vZoo/vt ¼ Fraction of grazing assimilated� Excretion (basal metabolism and grazing dependent)� Mortality
vZoovt
¼ gbZoo��lBM þ lE b
ggmax
�Zoo�mZZoo
2
The remaining term [(1 � b)gZoo] is divided between theproduction of semi-labile and labile DON by sloppy feeding(towards semi-labile DON and DIC respectively) and the productionof fecal pellets (towards the small N detritus pool).
The zooplankton equation expressed in carbon is:
vZoovt
jC¼ CNPgbZoo� CNZ
� �lBM þ lE b
ggmax
�Zoo
�mZZoo2�� rCexcCNZZoo
where rCexc is the rate of carbon excess respiration due to the CeNratio difference between phytoplankton and zooplankton. Theconstant zooplankton CeN ratio (CNZ¼ 5.0) leads to the formulation:CNZ ¼ ðCNPbgZoo� rCexc CNZ ZooÞ=bgZooor
rCexc ¼ bgðCNP � CNZÞ=CNZ
This excess of respired organic carbon is directed to DIC. Itensures the conservation of the zooplankton CeN ratio andtherefore the zooplankton equation expressed in carbon is implicit.
DICThe airesea exchange of carbon dioxide is taken from Fennel
et al. (2008).
vDIC/vt ¼ �Nutrient-based uptake by phytoplankton growth� C excess-based semi-labile DOC exudationþ Nutrient-based exudation of labile DOCþ Labile DOC produced by sloppy feedingþ Excretion (basal metabolism and grazing dependent)þ Solubilization small and large detritus C (labile
fraction)þ Remineralization of semi-labile DOC þ Airesea CO2
flux
vDICvt
¼CNPð � mPhy� gsCmmaxLLð1� LNÞPhyþ uCmPhy
þ ð1� bÞQDOCð1� dCÞgZooÞ þ.þ CNZ
�lBM þ lEb
ggmax
þ rCexc
�Zooþ SSDetCSDetCþ SLDetCLDetC
þ aC0e0:07TDOCþ.þ vKCO2
DzCO2;sol
�pCO2;air � pCO2
�
Ammonium
vNH4/vt ¼ �Ammonium uptake by phytoplankton growthþ Exudation of labile DONþ Labile DON produced by sloppy feedingþ Excretion (basal metabolism and grazing dependent)þ Solubilization small and large detritus N (labile
fraction)þ Remineralization of semi-labile DON � Nitrification
vNH4
vt¼ �mmaxLLLNH4
Phyþ uNmPhy
þ ð1� bÞQDONð1� dNÞgZooþ�lBM þ lEb
ggmax
�Zoo
þ.þ ð1� dNÞðSSDetNSDetNþ SLDetNLDetNÞþ aN0e
0:07TDON� nNH4
where lBM and lE are the zooplankton excretion rates due to basalmetabolism and assimilation intensity respectively, and n is thenitrification rate (same parameterization than in Fennel et al.(2006). LL is the non-dimensional light limitation and LNH4
is thenutrient limitation term for ammonium.
Nitrate
vNO3/vt ¼ �Nitrate uptake by phytoplankton growthþ Nitrification
J.N. Druon et al. / Estuarine, Coastal and Shelf Science 88 (2010) 488e507504
Author's personal copy
vNO3
vt¼ �mmaxLLLNO3
Phyþ nNH4
where LNO3is the nutrient limitation term for nitrate.
Detritus N
vSDetN/vt ¼ Phytoplankton mortality� Aggregation with living phytoplankton cells� Small detritus N solubilization� Sinking of small detritus N
vSDetNvt
¼ mPPhy� sðSDetNþ PhyÞSDetN� sSDetNSDetN
�wSvSDetN
vz
vLDetN/vt ¼ Fecal pellets production (nitrogen fraction)þ Zooplankton mortalityþ Aggregation of small detritus (N) and phytoplankton
cells� Large detritus N solubilization� Sinking of large detritus (N)
vLDetNvt
¼ ð1� bÞð1� QDONÞgZooþmzZoo2
þ sðSDetNþ PhyÞ2�sLDetNLDetN�wLvLDetN
vz
Detritus C
vSDetC/vt ¼ Phytoplankton mortality (C)� Aggregation with living phytoplankton cells� Small detritus C remineralization� Sinking of small detritus C
vSDetCvt
¼ CNPmPPhy� sðSDetCþ CNPPhyÞSDetC
� sSDetCSDetC�wSvSDetC
vz
vPOCL/vt ¼ Fecal pellets production (carbon)þ Zooplankton mortality (C)þ Aggregation of small detritus (C) and phytoplankton
cells (C)� Large detritus C solubilization� Sinking of large detritus (C)
vLDetCvt
¼ CNPð1� bÞð1�QDOCÞgZooþ CNZmzZoo2
þ sðSDetCþ CNPPhyÞ2�sLDetCLDetCþ.�wLvLDetC
vz
where wS and wL are the sinking velocities of small and largedetritus respectively.
Bottom boundary conditionIn order to take into account the resuspension of detritus C near
the seabed due to bottom friction, a fraction (lres, see next section)of the bottom carbon flux is resuspended and mineralized in thelower water column. The complementary fraction (1 � lres) isburied, the flux of buried carbon thus is:
FCburied ¼ BECð1� lresÞFCbottom
where BEC is the burial efficiency (see next section) and FCbottom isthe detritus C flux that reaches the bottom before resuspension:
FCbottom ¼ CNPwPvPhyvz
z¼HþwS
vSDetCvz
z¼HþwL
vLDetCvz
z¼H
The POM which is not resuspended nor buried is mineralizedand therefore the bottom boundary condition for carbon follows:
vDIC/vtjz¼H ¼ mineralization of (resuspended bottom detritus Cþ not resuspended nor buried bottom POC)
vDICvt
z¼H¼ FCbottomðlres þ ð1� lresÞð1� BECÞÞ
For nitrogen, the same resuspension rate is applied (lres) to thedetritus N reaching the seabed. The remaining detritus N is subjectto burial and denitrification following:
FNresuspended ¼ lresFNbottomFNburied ¼ BENð1� lresÞFNbottomFNdenitrified ¼ ð1� BENÞð1� lresÞFNbottomwhere FNbottom is the flux of detritus in nitrogen that reaches thebottom before resuspension:
FNbottom ¼ wPvPhyvz
z¼HþwS
vSDetNvz
z¼HþwL
vLDetNvz
z¼H
The denitrification process is taken into account as it was shownto be significant in the MAB (Fennel et al., 2006). The stoichiometrycalculation shows that the bottom boundary condition for ammo-nium is:
vNH4/vtjz¼H ¼ mineralization of (resuspended bottom detritus Nþ not resuspended nor buried bottom detritus Nþ not resuspended nor denitrified bottom detritus N)
vNH4vt jz¼H ¼ FNresuspended þ 4
16FNdenitrifiedvNH4vt jz¼H ¼ �
lres þ 416ð1� lresÞð1� BENÞ
�FNbottom
The total amount of nitrogen lost through burial and denitrification(N2) is:
FNlost ¼ FNburied þ 1216FNdenitrified
FNlost ¼ 416ð1� lresÞð3þ BENÞFNbottom
The POM resuspension. The resuspension is taken into account asa function of the friction velocity at the seabed (U*). The resus-pension rate (%) follows:
lres ¼U*�2
U*d
�2where Ud
* is the critical friction velocity above which all organicmatter is maintained in suspension (Ud
* ¼ 0.31 cm s�1, Peterson,1999). The resuspended fraction of POC is thus largely dependenton the local near bottom current velocity which is driven by thegeneral circulation and the tides on the continental shelf and alsoby wind events in shallow waters.
The POM burial. Thomas et al. (2002) measured and reviewed highrates of carbon burial along the continental shelf of the U.S. north-eastern continental shelf. The carbon and nitrogen burial rates havebeen implemented to simulate the loss of material in the sediment.
J.N. Druon et al. / Estuarine, Coastal and Shelf Science 88 (2010) 488e507 505

Author's personal copy
A fraction (burial efficiency, BEC) of the particulate organiccarbon that reaches the seabed is buried following the empiricalexpression of Henrichs and Reeburgh (1987):
logFc ¼ 0:69logwþ 2:27
and
BEC ¼ w0:4=2:1
where Fc is the organic carbon flux at the sediment surface(gC m�2 y�1) and w is the sediment accumulation rate (cm y�1).Resolving the system leads to the following formulation for BEC (%):
BEC ¼ 12:1
h10ðlogFc0:69Þ�2:27
i0:4This formulation matches the upper values of Thomas et al.
(2002) who measured and reviewed burial efficiency values (in %of organic carbon deposition): 10e20% at the slope off Cape Cod(SEEP-I), 25e50% in the MAB (SEEP-II)¼ 25e50, 3e40% at the slopeoff Cape Hatteras.
CeN ratios of buried organic matter of 9e10 were reported forthe shelf and estuarine surface sediments and slightly lower indeeper waters (Gelinas et al., 2001). A value of CNburial ¼ 9.3 is usedto estimate the flux of buried organic nitrogen in agreement withvalues measured in the sediment of the MAB shelf (Mayer et al.,2002; Mayer, pers. comm.).
A maximum of 75% of carbon burial efficiency is applied as itcorresponds to the maximum value measured:
BEC ¼ MINf½10ðlog Fc=0:69� 2:27Þ�0:4=2:1;0:75gFor nitrogen burial, a similar expression of burial efficiency is usedintroducing a CNburial ratio:
BEN ¼ MIN�h
10ðlogðCNburialFNÞ=0:69�2:27Þi0:4
=2:1;0:75�
References
Admiraal, W., Peletier, H., Lane, R., 1986. Nitrogen metabolism of marine planktonicdiatoms; excretion, assimilation and cellular pools of free amino acids in sevenspecies with different cell size. Journal of Experimental Marine Biology andEcology 98, 241e263.
Aluwihare, L., Repeta, D., Chen, R., 2002. Chemical composition and cycling ofdissolved organic matter in the Mid-Atlantic Bight. Deep Sea Research 49,4421e4437.
Amon, R., Benner, R., 1996. Bacterial utilization of different size classes of dissolvedorganic matter. Limnology and Oceanography 41, 41e51.
Anderson, T., Pondaven, P., 2003. Non-redfield carbon and nitrogen cycling in theSargasso Sea: pelagic imbalances and export flux. Deep Sea Research Part I:Oceanographic Research Papers 50, 573e591.
Anderson, T., Williams, P., 1998. Modelling the seasonal cycle of dissolved organiccarbon at station E1 in the English Channel. Estuarine, Coastal and Shelf Science46, 93e109.
Baines, S., Pace, M., 1991. The Production of dissolved organic matter by phyto-plankton and its importance to bacteria: patterns across marine and freshwatersystems. Limnology and Oceanography 36, 1078e1090.
Bates, N., Hansell, D., 1999. A high resolution study of surface layer hydrographicand biogeochemical properties between Chesapeake Bay and Bermuda. MarineChemistry 67, 1e16.
Bauer, J., Druffel, E., 1998. Ocean margins as a significance source of organic matterto the open ocean. Nature 392, 482e485.
Bauer, J.E., Druffel, E.R.M., Wolgast, D.M., Griffin, S., 2001. Cycling of dissolved andparticulate organic radiocarbon in the northwest Atlantic continental margin.Global Biogeochemical Cycles 15, 615e636.
Bauer, J.E., Druffel, E.R.M., Wolgast, D.M., Griffin, S., 2002. Temporal and regionalvariability in sources and cycling of DOC and POC in the northwest Atlanticcontinental shelf and slope. Deep Sea Research 49, 4387e4419.
Beardsley, R., Boicourt, W., 1981. On estuarine and continental shelf circulation inthe Middle Atlantic Bight. Evolution of Physical Oceanography, 198e233.
Benner, R., Pakulski, J., McCarthy, M., Hedges, J., Hatcher, P., 1992. Bulk chemicalcharacteristics of dissolved organic matter in the ocean. Science 255, 1561.
Berger, W., 1989. Global Maps of Ocean Productivity. Productivity of the Oceans:Present and Past. Wiley, New York, pp. 429e455.
Biddanda, B., Benner, R., 1997. Carbon, nitrogen, and carbohydrate fluxes during theproduction of particulate and dissolved organic matter by marine phyto-plankton. Limnology and Oceanography 42, 506e518.
Biscaye, P., Anderson, R., 1994. Fluxes of particulate matter on the slope of thesouthern Middle Atlantic Bight: SEEP-II. Deep Sea Research Part II: TopicalStudies in Oceanography 41, 459e509.
Biscaye, P., Anderson, R., Deck, B., 1988. Fluxes of particles and constituents to theeastern United States continental slope and rise: SEEP-I. Continental ShelfResearch 8, 855e904.
Biscaye, P., Flagg, C., Falkowski, P., 1994. The shelf edge exchange processes exper-iment, SEEP-II: an introduction to hypotheses, results and conclusions. DeepSea Research Part II: Topical Studies in Oceanography 41, 231e252.
Bjørnsen, B., 1988. Phytoplankton exudation of organic matter: why do healthy cellsdo it. Limnology and Oceanography 33, 151e154.
Bronk, D., Glibert, P., Ward, B., 1994. Nitrogen uptake, dissolved organic nitrogenrelease, and new production. Science 265, 1843.
Bronk, D., Ward, B., 2000. Magnitude of dissolved organic nitrogen release relativeto gross nitrogen uptake in marine systems. Limnology and Oceanography 45,1879e1883.
Brush, M., Brawley, J., Nixon, S., Kremer, J., 2002. Modeling phytoplanktonproduction: problems with the Eppley curve and an empirical alternative.Marine Ecology Progress Series 238, 31e45.
Carlson, C., 2002. Production and Removal Processes. Biogeochemistry of MarineDissolved Organic Matter. Academic, pp. 91e151.
Chen, R.F., Fry, B., Hopkinson, C.S., Repeta, D.J., Peltzer, E.T., 1996. Dissolved organiccarbon on Georges Bank. Continental Shelf Research 16, 409e420.
DeGrandpre, M., Olbu, G., Beatty, C., Hammar, T., 2002. Airesea CO2 fluxes on the USMiddle Atlantic Bight. Deep Sea Research Part II: Topical Studies in Oceanog-raphy 49, 4355e4367.
Dinniman, M., Klinck, J., Smith, W., 2003. Cross-shelf exchange in a model of theRoss Sea circulation and biogeochemistry. Deep Sea Research Part II: TopicalStudies in Oceanography 50, 3103e3120.
Druffel, E., Williams, P., Bauer, J., Ertel, J., 1992. Cycling of dissolved and particulateorganicmatter in theopenocean. JournalofGeophysicalResearch97,15639e15659.
Eppley, R., 1972. Temperature and phytoplankton growth in the sea. Fishery Bulletin70, 1063e1085.
Fairall, C., Bradley, E., Hare, J., Grachev, A., Edson, J., 2003. Bulk parameterization ofairesea fluxes: updates and verification for the COARE algorithm. Journal ofClimate 16, 571e591.
Falkowski, P., Flagg, C., Rowe, G., Smith, S., Whitledge, T., Wirick, C., 1988. The fate ofa spring phytoplankton bloom: export or oxidation. Continental Shelf Research8, 457e484.
Fasham, M., Boyd, P., Savidge, G., 1999. Modeling the relative contributions ofautotrophs and heterotrophs to carbon flow at a Lagrangian JGOFS Station inthe Northeast Atlantic: the importance of DOC. Limnology and Oceanography44, 80e94.
Fennel, K., Wilkin, J., Levin, J., Moisan, J., O’Reilly, J., Haidvogel, D., 2006. Nitrogencycling in the Middle Atlantic Bight: results from a three-dimensional modeland implications for the North Atlantic nitrogen budget. Global BiogeochemicalCycles 20.
Fennel, K., Wilkin, J., Previdi, M., Najjar, R., 2008. Denitrification effects on aireseaCO2 flux in the coastal ocean: simulations for the northwest North Atlantic.Geophysical Research Letters 35.
Fisher, T.S., Hagy, J.D., Rochelle-Newall, E., 1998. Dissolved and particulate organiccarbon in Chesapeake Bay. Estuaries 21, 215e229.
Flather, R., 1976. A tidal model of the northwest European continental shelf.Mémoires de la Société Royale des Sciences de Liège 6, 141e164.
Fogg, G., 1966. The extracellular products of algae. Oceanography and MarineBiology: an Annual Review 4, 195e212.
Fogg, G., 1983. The ecological significance of extracellular products of phyto-plankton photosynthesis. Botanica Marina 26, 3e14.
Geider, R., MacIntyre, H., Kana, T., 1997. Dynamic model of phytoplankton growthand acclimation: responses of the balanced growth rate and the chlorophyll a:carbon ratio to light, nutrient-limitation and temperature. Marine EcologyProgress Series 148, 187e200.
Gelinas, Y., Baldock, J., Hedges, J., 2001. Organic carbon composition of marinesediments: effect of oxygen exposure on oil generation potential. Science 294,145e148.
Haidvogel, D., Arango, H., Hedstrom, K., Beckmann, A., Malanotte-Rizzoli, P.,Shchepetkin, A., 2000. Model evaluation experiments in the North AtlanticBasin: simulations in nonlinear terrain-following coordinates. Dynamics ofAtmospheres and Oceans 32, 239e281.
Haidvogel, D.B., Arango, H., Budgell, W.P., Cornuell, B.D., Curchitser, E., 2008.Regional ocean forecasting in terrain-following coordinates: model formulationand skill assessment. Journal of Computational Physics.
Hansell, D., 2002. In: Hansell, D., Carlson, C. (Eds.), Biogeochemistry of MarineDissolved Organic Matter. Academic Press, New-York, pp. 685e716.
Harvey, H., Mannino, A., 2001. The chemical composition and cycling of particulateand macromolecular dissolved organic matter in temperate estuaries asrevealed by molecular organic tracers. Organic Geochemistry 32, 527e542.
Harvey, H., Tuttle, J., Bell, J., 1995. Kinetics of phytoplankton decay during simulatedsedimentation: changes in biochemical composition andmicrobial activity underoxic and anoxic conditions. Geochimica et Cosmochimica Acta 59, 3367e3377.
Hasegawa, T., Koike, I., Mukai, H., 2001. Fate of food nitrogen in marine copepods.Marine Ecology Progress Series 210, 167e174.
J.N. Druon et al. / Estuarine, Coastal and Shelf Science 88 (2010) 488e507506

Author's personal copy
Hellebust, J., 1965. Excretion of Some organic compounds by marine phytoplankton.Limnology and Oceanography 10, 192e206.
Henrichs, S., Reeburgh, W., 1987. Anaerobic mineralization of marine sedimentorganic matter: rates and the role of anaerobic processes in the oceanic carboneconomy. Geomicrobiology Journal 5 (3,4), 191e237. http://www.informaworld.com/smpp/title%7Edb¼all%7Econtent¼t713722957.
Hofmann, E., Druon, J.N., Fennel, K., Friedrichs, M., Haidvogel, D., Lee, C., Mannino, A.,McClain, C., Najjar, R., O’Reilly, J., Pollard, D., Previdi, M., Seitzinger, S., Siewert, S.,Signorini, S., Wilkin, J., 2008. Eastern U.S. continental shelf carbon budget: inte-grating models, data assimilation, and analysis. Oceanography 21, 86e104.
Hopkinson, C., Fry, B., Nolin, A., 1997. Stoichiometry of dissolved organic matterdynamics on the continental shelf of the northeastern USA. Continental ShelfResearch 17, 473e489.
Hopkinson, C.S., Vallino, J.J., Nolin, A., 2002. Decomposition of dissolved organicmatter from the continental margin. Deep Sea Research Part II: Topical Studiesin Oceanography 49, 4461e4478.
Ianson, D., Allen, S., 2002. A two-dimensional nitrogen and carbon flux model ina coastal upwelling region. Global Biogeochemical Cycles 16, 1011.
Jensen, L., 1983. Phytoplankton release of extracellular organic carbon, molecularweight composition, and bacterial assimilation. Marine Ecology Progress Series11, 39e48.
Jolliff, J.K., Kindle, J.C., Shulman, I., Penta, B., Friedrichs, M.A.M., Helber, R., Arnone, R.A., 2009. Summary diagrams for coupled hydrodynamic-ecosystem model skillassessment. Journal of Marine Systems 76, 64e82.
Kantha, L., Clayson, C., 1994. An improved mixed layer model for geophysicalapplications. Journal of Geophysical Research 99, 25235e25266.
Lancelot, C., 1983. Factors affecting phytoplankton extracellular release in theSouthern Bight of the North Sea. Marine Ecology Progress Series 12, 115e121.
Lancelot, C., 1984. Extracellular release of small and large molecules by phyto-plankton in the southern Bight of the North Sea. Estuarine, Coastal and ShelfScience 18, 65e77.
Lancelot, C., Billen, G., 1985. Carbon-nitrogen relationships in nutrient metabolismof coastal marine ecosystems. Advances in Aquatic Microbiology 3, 263e321.
Lancelot, C., Spitz, Y., Gypens, N., Ruddick, K., Becquevort, S., Rousseau, V.,Lacroix, G., Billen, G., 2005. Modelling diatom and Phaeocystis blooms andnutrient cycles in the Southern Bight of the North Sea: the MIRO model. MarineEcology Progress Series 289, 63e78.
Ledwell, J., Watson, A., Law, C., 1993. Evidence for slow mixing across the pycnoclinefrom an open-ocean tracer-release experiment. Nature 364, 701e703.
Magnuson, A., Harding, L., Mallonee, M., Adolf, J., 2004. Bio-optical model forChesapeake bay and the Middle Atlantic Bight. Estuarine, Coastal and ShelfScience.
Mannino, A., 2000. Chemical Composition of Particulate and Macromolecular Dis-solved Organic Matter in the Delaware Estuary and Experimental DiatomBlooms: Sources and Reactivity Patterns. Marine, Estuarine, EnvironmentalSciences Graduate Program, University of Maryland, College Park.
Mannino, A., Harvey, H.R., 2000. Biochemical composition of particles and dissolvedorganic matter along an estuarine gradient: sources and implications for DOMreactivity. Limnology and Oceanography 45, 775e788.
Mannino, A., Russ, M.E., Hooker, S.B., 2008. Algorithm development and validationfor satellite-derived distributions of DOC and CDOM in the US Middle AtlanticBight. Journal of Geophysical Research 113, C07051. doi:10.1029/2007JC004493.
Marañón, E., Cermeno, P., Fernandez, E., Rodriguez, J., Zabala, L., 2004. Significanceand mechanisms of photosynthetic production of dissolved organic carbon ina coastal eutrophic ecosystem. Limnology and Oceanography 49, 1652e1666.
Marchesiello, P., McWilliams, J., Shchepetkin, A., 2003. Equilibrium structure anddynamics of the California current system. Journal of Physical Oceanography 33,753e783.
Mayer, L., Benninger, L., Bock, M., DeMaster, D., Roberts, Q., Martens, C., 2002.Mineralassociations and nutritional quality of organic matter in shelf and upper slopesediments off Cape Hatteras, USA: a case of unusually high loadings. Deep SeaResearch Part II: Topical Studies in Oceanography 49, 4587e4597.
Mellor,G., Yamada, T.,1982.Developmentof a turbulenceclosuremodel for geophysicalfluid problems. Reviews of Geophysics and Space Physics 20, 851e875.
Møller, E., 2005. Sloppy feeding in marine copepods: prey-size-dependentproduction of dissolved organic carbon. Journal of Plankton Research 27, 27.
Møller, E., Thor, P., Nielsen, T., 2003. Production of DOC by Calanus finmarchicus, C.glacialis and C. hyperboreus through sloppy feeding and leakage from fecalpellets. Marine Ecology Progress Series 262, 185e191.
Mouw, C., Yoder, J., 2005. Primary production calculations in the Mid-Atlantic Bight,including effects of phytoplankton community size structure. Limnology andOceanography 50, 1232e1243.
Nagata, T., 2000. In: Kirchman, D. (Ed.), Microbial Ecology of the Oceans. Wiley,New-York, pp. 121e152.
Norrman, B., Zweifel, U., Hopkinson Jr., C., Fry, B., 1995. Production and utilization ofdissolved organic carbon during an experimental diatom bloom. Limnology andOceanography 40, 898e907.
O’Reilly, J., Busch, D., 1984. Phytoplankton primary production on the northwesternAtlantic shelf. Rapports et Procès-Verbaux des Réunions du Conseil Interna-tional pour l'Exploration de la Mer 183, 255e268.
O’Reilly, J., Evans-Zetlin, C., Busch, D., 1987. In: Backus, R. (Ed.), Georges Bank. MITPress, Cambridge, MA, pp. 220e233.
Obernosterer, I., Herndl, G., 1995. Phytoplankton extracellular release and bacterialgrowth: dependence on the inorganic N:P ratio. Marine Ecology Progress Series116, 247e257.
Peliz, A., Dubert, J., Haidvogel, D., Le Cann, B., 2003. Generation and unstableevolution of a density-driven eastern poleward current: the Iberian PolewardCurrent. Journal of Geophysical Research 108, 3268.
Peterson, E., 1999. Benthic shear stress and sediment condition. AquaculturalEngineering 21, 85e111.
Ploug, H., Grossart, H., 2000. Bacterial growth and grazing on diatom aggregates:respiratory carbon turnover as a function of aggregate size and sinking velocity.Limnology and Oceanography 45, 1467e1475.
Pomeroy, L., Wiebe, W., Deibel, D., Thompson, R., Rowe, G., Palkulski, J., 1991.Bacterial responses to temperature and substrate concentration during theNewfoundland spring bloom. Marine Ecology Progress Series 75, 143e159.
Popova, E.E, Anderson, T.R, 2002. Impact of including dissolved organic matter ina global ocean box model on simulated distributions and fluxes of carbon andnitrogen. Geophysical Research Letters 29 (9), 1303. doi:10.1029/2001GL014274.http://www.agu.org/pubs/crossref/2002.../2001GL014274.shtml.
Raick, C., Delhez, E., Soetaert, K., Gregoire, M., 2005. Study of the seasonal cycle ofthe biogeochemical processes in the Ligurian Sea using a 1D interdisciplinarymodel. Journal of Marine Systems.
Redalje, D., Lohrenz, S., Verity, P., Flagg, C., 2002. Phytoplankton dynamics withina discrete water mass off Cape Hatteras, North Carolina: the Lagrangianexperiment. Deep Sea Research Part II: Topical Studies in Oceanography 49,4511e4531.
Ryan, J., Yoder, J., Cornillon, P., 1999. Enhanced chlorophyll at the Shelfbreak of theMid-Atlantic Bight and Georges Bank during the spring transition. Limnologyand Oceanography 44, 1e11.
Sambrotto, R., Savidge, G., Robinson, C., Boyd, P., Takahashi, T., Karl, D., Langdon, C.,Chipman, D., Marra, J., Codispoti, L., 1993. Elevated consumption of carbonrelative to nitrogen in the surface ocean. Nature 363, 248e250.
Santschi, P., Guo, L., Baskaran, M., Trumbore, S., Southon, J., Bianchi, T.,Honeyman, B., Cifuentes, L., 1995. Isotopic evidence for the contemporary originof high-molecular weight organic matter in oceanic environments. Geochimicaet Cosmochimica Acta 59, 625e631.
Schaff, T., Levin, L., Blair, N., DeMaster, D., Pope, R., Boehme, S., 1992. Spatialheterogeneity of benthos on the Carolina continental slope: large (100 km)-scale variation. Marine Ecology Progress Series 88, 143e160.
Schollaert, S., Rossby, T., Yoder, J., 2003. Gulf Stream cross-frontal exchange:possible mechanisms to explain interannual variations in phytoplankton chlo-rophyll in the Slope Sea during the SeaWiFS years. Deep Sea Research.
Seitzinger, S., Sanders, R., 1999. Atmospheric inputs of dissolved organic nitrogenstimulate estuarine bacteria and phytoplankton. Limnology and Oceanography44, 721e730.
Sharp, J., Culberson, C., Church, T., 1982. The chemistry of the Delaware estuary.General considerations. Limnology and Oceanography 27, 1015e1028.
Six, K., Maier-Reimer, E., 1996. Effects of plankton dynamics on seasonal carbonfluxes in an ocean general circulation model. Global Biogeochemical Cycles 10,559e583.
Smith, D., Simon, M., Alldredge, A., Azam, F., 1992. Intense hydrolytic enzymeactivity on marine aggregates and implications for rapid particle dissolution.Nature 359, 139e142.
Søndergaard, M., Williams, P., Cauwet, G., Riemann, B., Robinson, C., Terzic, S.,Woodward, E., Worm, J., 2000. Net accumulation and flux of dissolved organiccarbon and dissolved organic nitrogen in marine plankton communities.Limnology and Oceanography 45, 1097e1111.
Taylor, G.T., Way, J., Scranton, M.I., 2003. Planktonic carbon cycling and transport insurface waters of the highly urbanized Hudson River estuary. Limnology andOceanography 48, 1779e1795.
Thingstad, T., Hagstrom, A., Rassoulzadegan, F., 1997. Accumulation of degradabledoc in surface waters: is it caused by a malfunctioning microbial loop?Limnology and Oceanography 42, 398e404.
Thomas, C., Blair, N., Alperin, M., DeMaster, D., Jahnke, R., Martens, C., Mayer, L.,2002. Organic carbon deposition on the North Carolina continental slope offCape Hatteras (USA). Deep Sea Research Part II: Topical Studies in Oceanog-raphy 49, 4687e4709.
Varela, M., Barquero, S., Bode, A., Fernandez, E., Gonzalez, N., Teira, E., Varela, M.,2003. Microplanktonic regeneration of ammonium and dissolved organicnitrogen in the upwelling area of the NW of Spain: relationships with dissolvedorganic carbon production and phytoplankton size-structure. Journal ofPlankton Research 25, 719.
Verity, P., Redalje, D., Lohrenz, S., Flagg, C., Hristov, R., 2002. Coupling betweenprimary production and pelagic consumption in temperate ocean marginpelagic ecosystems. Deep Sea Research Part II: Topical Studies in Oceanography49, 4553e4569.
Vlahos, P., Chen, R.F., Repeta, D.J., 2002. Dissolved organic carbon in the Mid-Atlantic Bight. Deep Sea Research Part II: Topical Studies in Oceanography 49,4369e4385.
Walsh, J., 1994. Particle export at Cape Hatteras. Deep Sea Research Part II: TopicalStudies in Oceanography 41, 603e628.
Warner, J., Sherwood, C., Arango, H., Signell, R., 2005. Performance of four turbu-lence closure models implemented using a generic length scale method. OceanModelling 8, 81e113.
Wilkin, J., 2006. The summertime heat budget and circulation of Southeast NewEngland shelf waters. Journal of Physical Oceanography 36, 1997e2011.
Williams, P., 1990. The importance of losses during microbial growth: commentaryon the physiology, measurement and ecology of the release of dissolved organicmaterial. Marine Microbial Food Webs 4, 175e206.
J.N. Druon et al. / Estuarine, Coastal and Shelf Science 88 (2010) 488e507 507