author's personal copy · author's personal copy...
TRANSCRIPT

This article appeared in a journal published by Elsevier. The attachedcopy is furnished to the author for internal non-commercial researchand education use, including for instruction at the authors institution
and sharing with colleagues.
Other uses, including reproduction and distribution, or selling orlicensing copies, or posting to personal, institutional or third party
websites are prohibited.
In most cases authors are permitted to post their version of thearticle (e.g. in Word or Tex form) to their personal website orinstitutional repository. Authors requiring further information
regarding Elsevier’s archiving and manuscript policies areencouraged to visit:
http://www.elsevier.com/authorsrights

Author's personal copy
Assessment of Argentinean Patagonia pollution: PBDEs, OCPs and PCBs in differentmatrices from the Río Negro basin
Karina S.B. Miglioranza a,b,⁎, Mariana Gonzalez a,b, Paola M. Ondarza a,b, Valeria M. Shimabukuro a,b,Federico I. Isla b,c, Gilberto Fillmann d, Julia E. Aizpún a, Víctor J. Moreno a
a Lab. de Ecotoxicología y Contaminación Ambiental, FCEyN, Universidad Nacional de Mar del Plata, Funes 3350, 7600, Mar del Plata, Argentinab Instituto de Investigaciones Marinas y Costeras (IIMyC,CONICET), Argentinac Instituto de Geología de Costas y el Cuaternario, FCEyN, Universidad Nacional de Mar del Plata, Funes 3350, 7600, Mar del Plata, Argentinad Laboratório de Microcontaminantes Orgânicos e Ecotoxicología Aquática, Universidade Federal do Rio Grande, Rio Grande, RS, Brazil
H I G H L I G H T S
► OCPs, PCBs and PBDEs were found in soils, sediments, SPM, streamwater and macrophytes.► Pesticides represented 70% of the total pollutants and pp′-DDE was the main pesticide found in all matrixes.► The relation PCBs/PBDEs > 1 agrees with worldwide tendency.► Macrophytes played a key role in reducing pollutant levels in the river.► Monitoring critical points of legacy contamination is crucial for watershed management.
a b s t r a c ta r t i c l e i n f o
Article history:Received 24 November 2012Received in revised form 18 February 2013Accepted 18 February 2013Available online xxxx
Keywords:PBDEsPCBsOrganochlorine pesticidesBasinArgentinean Patagonia
This work reports the occurrence and distribution of organochlorine pesticides (OCPs), polychlorinatedbiphenyls (PCBs) and polybrominated diphenyl ethers (PBDEs) in soil, sediment, suspended particle matter(SPM), streamwater and macrophytes, along the Río Negro basin, Argentinean Patagonia. The clear predom-inance of OCPs among all matrices indicates the impact of agriculture on the watershed. The highest levelswere found for pp′-DDE which represented up to 95% in agricultural soils (42.0–1.27 x 10³ ng/g d.w) fromthe Upper Valley (upstream), where long and historical intensive fruit cultures have been settled and repre-sent a hot spot of legacy pesticides for the environment. The insecticide endosulfan, currently in use, was alsofound in all matrices. Levels ranged between 0.3 and 708.0 ng/g d.w, being the highest concentrations thoseof SPM from the Middle Valley, just before the delta area, where pesticides would be retained leading tolower concentrations as was observed downstream. PCB (#153, 138, 110, 101) and PBDE (BDE-47) levelswere directly related with the presence of hydroelectric power plants, dams and dumping sites, mainlysettled in the Upper Valley (0.8 ng/g and 15.1 ng/g d.w for PBDEs and PCBs, respectively). Although therewas a decreasing gradient of these pollutant concentrations through the river flow, downstream urbanareas enhanced PCB concentrations in the aquatic environment. More efforts and monitoring programs arehighly required to control and reduce soil erosion in order to prevent the availability of forbidden pollutantsin the environment.
© 2013 Elsevier B.V. All rights reserved.
1. Introduction
The occurrence of persistent organic pollutants (POPs) in environ-mental compartments has received attention due to their persistence,biomagnification potential, long-range transport capacity and toxi-city. The use and production of most of organochlorine pesticides(OCPs) and polychlorinated biphenyls (PCBs) have been internationally
regulated by the Stockholm Convention since 2004. Restrictions for theendosulfan insecticide and the polybrominated diphenyl ethers (PBDEs)were recently implemented (UNEP, 2004, 2011). Particularly, OCPs havebeen restricted and forbidden in most countries since the late 1970s,while some developing countries are still using them for public health(Wania and MacKay, 1996; Sabljic, 2001; Borghesi et al., 2008).PCBs were banned three decades ago, and PBDEs, used as flame retar-dants since 1970, have received attention recently due to their persistenceand toxic effects (de Wit, 2002; Hites, 2004).
These pollutants can reach the aquatic environment from non-pointand punctual sources depending on land use and contaminant delivery,and due to their hydrophobic character they associate to organicmatter
Science of the Total Environment 452–453 (2013) 275–285
⁎ Corresponding author at: Laboratorio de Ecotoxicología y Contaminación Ambiental,Universidad Nacional de Mar del Plata, Funes 3350, Mar del Plata (7600), Argentina.Tel.: +54 223 475 2426x455; fax: +54 223 471 1810.
E-mail address: [email protected] (K.S.B. Miglioranza).
0048-9697/$ – see front matter © 2013 Elsevier B.V. All rights reserved.http://dx.doi.org/10.1016/j.scitotenv.2013.02.055
Contents lists available at SciVerse ScienceDirect
Science of the Total Environment
j ourna l homepage: www.e lsev ie r .com/ locate /sc i totenv
Author's personal copy
of sediments and/or lipids of organisms. Although the toxicity ofweath-ered organic compounds is generally thought to decline with residencetime in the environment (Semple et al., 2003), their long half-liveswiththeir potential for bioaccumulation and biomagnification through foodchains, present a significant threat to the environment. Agriculturalactivities, urban settlements, industries and dams are potential sourcesof PBDEs, OCPs and PCBs to large basins. To determine pollutant levelsand distribution patterns as well as to indentify the sources of thesecompounds are essential to prevent or mitigate accurately risks to theaquatic environment.
Rio Negro is the most important river with the largest drainagebasin (140,000 km2) and water discharge (600 m3/s) to the coastalarea of Argentinean Patagonia. The basin provides 4% of the worldwideproduction of apples, pears and peaches concomitantlywith an intensiveuse of pesticides from 50 years ago. Moreover, the settlement of hydro-electric power plants in the upstream zone generates 30% of the elec-tricity consumed in Argentina. In addition, the occurrence of chemicalindustries and petroleum facilities has been reported by Arribére et al.(2003). Due to the different anthropogenic activities developed in thebasin, river discharge could be an important source of contaminationto the adjacent costal environment.
This work reports the occurrence and distribution of OCPs, PCBs andPBDEs in several environmental matrices (soil, sediment, suspendedparticle matter and macrophytes) along the Río Negro basin in relationto land use. Research was sponsored by the United Nations Environ-ment Programme (UNEP), as part of the Project “Argentinean PatagoniaPollution”, which aimed to study the role of Patagonian basins on thePOP contamination in the southeastern coast of the Atlantic Ocean.
2. Materials and methods
2.1. Study area
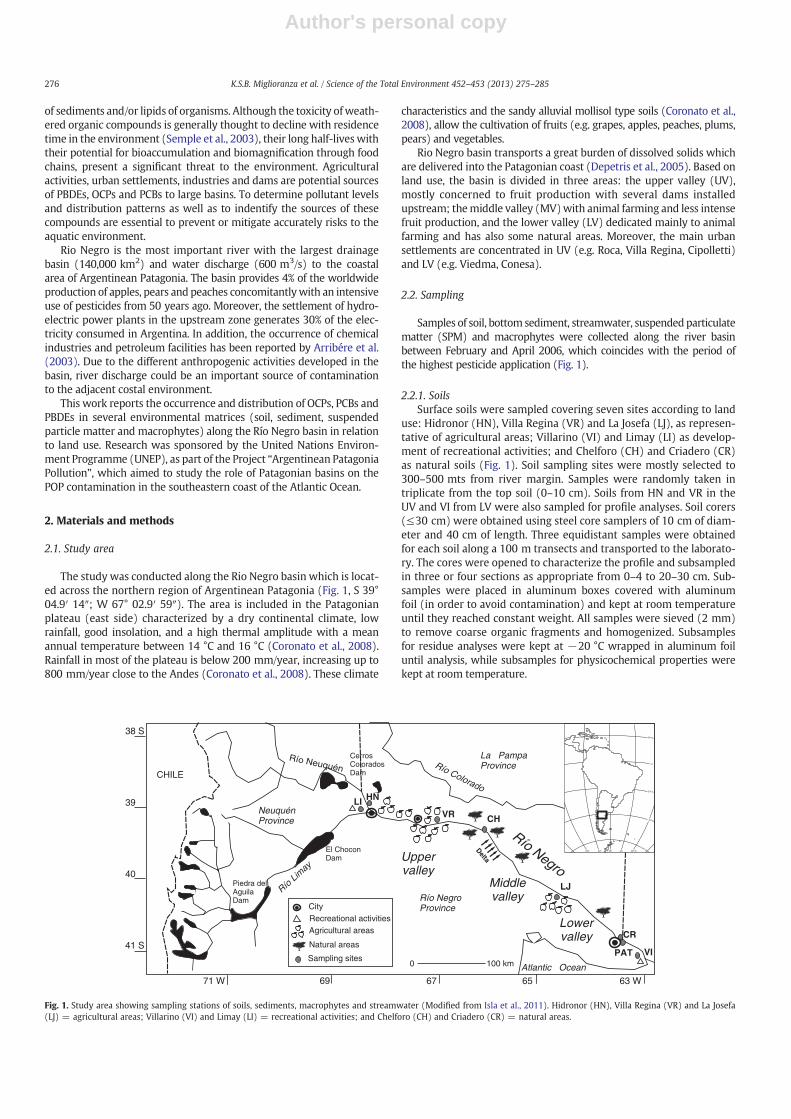
The study was conducted along the Rio Negro basin which is locat-ed across the northern region of Argentinean Patagonia (Fig. 1, S 39°04.9′ 14″; W 67° 02.9′ 59″). The area is included in the Patagonianplateau (east side) characterized by a dry continental climate, lowrainfall, good insolation, and a high thermal amplitude with a meanannual temperature between 14 °C and 16 °C (Coronato et al., 2008).Rainfall in most of the plateau is below 200 mm/year, increasing up to800 mm/year close to the Andes (Coronato et al., 2008). These climate
characteristics and the sandy alluvial mollisol type soils (Coronato et al.,2008), allow the cultivation of fruits (e.g. grapes, apples, peaches, plums,pears) and vegetables.
Rio Negro basin transports a great burden of dissolved solids whichare delivered into the Patagonian coast (Depetris et al., 2005). Based onland use, the basin is divided in three areas: the upper valley (UV),mostly concerned to fruit production with several dams installedupstream; themiddle valley (MV)with animal farming and less intensefruit production, and the lower valley (LV) dedicated mainly to animalfarming and has also some natural areas. Moreover, the main urbansettlements are concentrated in UV (e.g. Roca, Villa Regina, Cipolletti)and LV (e.g. Viedma, Conesa).
2.2. Sampling
Samples of soil, bottom sediment, streamwater, suspended particulatematter (SPM) and macrophytes were collected along the river basinbetween February and April 2006, which coincides with the period ofthe highest pesticide application (Fig. 1).
2.2.1. SoilsSurface soils were sampled covering seven sites according to land
use: Hidronor (HN), Villa Regina (VR) and La Josefa (LJ), as represen-tative of agricultural areas; Villarino (VI) and Limay (LI) as develop-ment of recreational activities; and Chelforo (CH) and Criadero (CR)as natural soils (Fig. 1). Soil sampling sites were mostly selected to300–500 mts from river margin. Samples were randomly taken intriplicate from the top soil (0–10 cm). Soils from HN and VR in theUV and VI from LV were also sampled for profile analyses. Soil corers(≤30 cm) were obtained using steel core samplers of 10 cm of diam-eter and 40 cm of length. Three equidistant samples were obtainedfor each soil along a 100 m transects and transported to the laborato-ry. The cores were opened to characterize the profile and subsampledin three or four sections as appropriate from 0–4 to 20–30 cm. Sub-samples were placed in aluminum boxes covered with aluminumfoil (in order to avoid contamination) and kept at room temperatureuntil they reached constant weight. All samples were sieved (2 mm)to remove coarse organic fragments and homogenized. Subsamplesfor residue analyses were kept at −20 °C wrapped in aluminum foiluntil analysis, while subsamples for physicochemical properties werekept at room temperature.
20º N
º0
º 20 S
40º S
40º S20º W40º 60º 80º 100º
0 100 km
38 S
39
40
41 S
67 6971 W 63 W65
Atlantic Ocean
e
RíN
gro
o
oRí NeuquénCHILE
Lowervalley
Río NegroProvince
CerrosColoradosDam
El ChoconDam
Piedra del AguilaDam
NeuquénProvince
La PampaProvince
HNLIVR CH
LJ
VI
CR
Uppervalley
Middlevalley
L
y
Ríoim
a
tDel a
PAT
o Co o a o
Ríl r d
CityRecreational activitiesAgricultural areas
Natural areas
Sampling sites
Fig. 1. Study area showing sampling stations of soils, sediments, macrophytes and streamwater (Modified from Isla et al., 2011). Hidronor (HN), Villa Regina (VR) and La Josefa(LJ) = agricultural areas; Villarino (VI) and Limay (LI) = recreational activities; and Chelforo (CH) and Criadero (CR) = natural areas.
276 K.S.B. Miglioranza et al. / Science of the Total Environment 452–453 (2013) 275–285
Author's personal copy
2.2.2. River bottom sediments (BS) and macrophytesBottom sediment samples (N = 5 from each point) were taken
from LI, HN, VR, CH, LJ and CR points (Fig. 1) using steel core samplersof 6 cm of diameter and 10 cm of length. Samples were air-dried atroom temperature and thoroughly mixed and disaggregated with amortar and pestle before sieved (250-μm) to obtain a homogeneousmatrix. Bulrush (Schoenoplectus californicus) was collected from LI,HN, VR, LJ and CR using a 20 × 20 cm square sampler with mobilesides. Five sets of six individuals and the sediments associated to theirroots were collected in each station. Samples were separated intoroots (R), stems (S) and near root sediments (NRS), defined as thesediments that did not fall from bulrush root after collection and needto be separated manually. Samples were air-dried at room temperatureand stored at –20 °C until analysis.
2.2.3. StreamwaterSubsurface water samples were obtained in MV and LV in order to
monitor the transport of pollutants to the estuary. Samples were col-lected in 1 L amber glass bottles (N = 6 each site) at 30 cm depth,and transported to the laboratory, stored at 4 °C and analyzed withinfour days after sampling. Suspended particulate matter was obtainedby filtering water samples through a 0.45 μmmembrane. SPMwas airdried at room temperature until they reached constant weight and keptwrapped in aluminum foil at −20 °C until analysis. Measurements ofriverwater quality (temperature, pH, conductivity and dissolved oxygen)were performed with a Hanna 968i device.
2.3. Analytical methods
2.3.1. Physicochemical analysesSoil and sediment subsamples were used to determine total organic
carbon (TOC) and particle size distribution (clay, silt and sand content).TOC was determined by wet-oxidation method (Walkley and Black,1965). Particle size distribution was determined by sieving and thepipette method combined (Galehouse, 1971); obtaining the weight per-centages of the three main grain size categories: clay (b0.002 mm); silt(0.002–0.062 mm) and sand (>0.062 mm). Water content was quanti-fied by constant-weight drying in an oven at 110 °C.
2.3.2. Contaminant analysesAll solvents were residue analysis grade and other reagents were
obtained from Merck Co. (Darmstadt, Germany).
2.4. Extraction procedure
2.4.1. Soils, BS, SPM and macrophytesOCPs, PCBs and PBDEs were extracted according to Metcalfe and
Metcalfe (1997), with the modifications introduced by Miglioranzaet al. (2003a, 2003b). Soil and sediment 10 g subsamples, wholefilters with SPM and 3 g of roots or stems were homogenized withsodium sulfate, spiked with 20 ng of PCB #103 as internal standard,Soxhlet extracted (8 h) and then concentrated down to 3 ml undervacuum and nitrogen flow. Lipid content from macrophyte extracts wasdetermined gravimetrically after gel permeation chromatography usingBio-Beads S-X3 (200–400mesh). Further interfering substances were re-moved with activated silica (24 h at 200 °C). Sulfur compounds were re-moved with activated copper. Extracts were concentrated down to ca.1 mL with N2 flow and kept at−20 °C in sealed vials until GC analyses.
2.4.2. WaterOCPs, PCBs and PBDEs were extracted following the procedure
developed by Gonzalez et al. (2012) consisting in spiking 1 L of waterwith 20 ng of PCB103, vigorous shaken of 500 mL spiked samples during2 h in a clean amber bottle with 300 ml of hexane-dichloromethane,sample conservation at 4 °C during 12 h. Then the organic layer was col-lected and evaporated down to 2 mL before further clean up using
activated silica. Extracts were concentrated to 1 mL and kept at −20 °C in sealed vials prior to GC analyses. Samples were analyzed intriplicate.
2.5. Analytical procedure
OCPs and PCBs were identified and quantified using a Gas Chro-matograph, Shimadzu 17-A gas equipped with a 63Ni Electron CaptureDetector (GC-ECD) and a SPB-5 [(5%phenyl)-methyl polysiloxane,30 m × 0.25 mm i.d. × 0.25 μm film thickness; Supelco Inc.] capillarycolumn. Samples (1 μL) were injected on splitless mode. The injectorwas kept at 275 °C, while the detector was at 290 °C. The followingtemperature program was applied: start at 100 °C and held for 1 min,followed by an increase of 5 °C/min up to 150 °C, held for 1 min, then1.5 °C/min up to 240 °C, and then 10 °C/min up to 300 °C for 10 min.Helium was used as carrier (1.5 mL/min) and nitrogen as make-upgas (Miglioranza et al., 2003a).
PBDEswere identified and quantified using a Gas Chromatography–Mass Spectrometry Perkin-Elmer Clarus 500 MS (GC-MS) equippedwith DB-5 MS [(5%phenyl)-methyl polysiloxane, 30 m × 0.25 mm.i.d. × 0.25 μm film thickness ELITE 5MS] capillary column, operatedunder electron impactmodewith the selecting ion and full ion scanningmode (Ondarza et al., 2011). Each PBDE was identified and confirmedby their relative retention time against PCB #103 and 3 monitoredions (1 for quantification and 2 for confirmation) considering a ±10%deviation of standard proportion.
2.5.1. Quality control and assuranceLaboratory and sampling glassware were washed with appropriate
solvents to avoid interferences. The quality assurance and quality con-trol (QA/QC) included regular analysis of matrix blank, duplicated sam-ples and instrumental and procedural blanks. Recoveries on spikedmatrices were >90%. Detection limits (DL) were calculated accordingto Keith et al. (1983) and ranged between 0.03 and 0.05 ng/mL forHCHs (α-, β-, γ-isomers) and between 0.08 and 0.33 ng/mL for therest of chlorinated compounds [Chlordanes (α- and γ-isomers andtrans-nonachlor), DDTs (pp′-DDE, pp′-DDD and pp′-DDT), endosulfans(α- and β-isomers and endosulfan sulfate) and PCBs (IUPAC #s 8, 18,28, 52, 44, 66, 101, 87, 110, 149, 118, 153, 105, 138, 126, 187, 128,167, 156, 157, 180, 169, 170, 189, 195, 206, 209)]. DL ranged between0.2 and 1.1 ng/mL for BDEs (IUPAC #s 28, 49, 47, 66, 100, 99, 154, 153,183). The standard solutions used for identification and quantificationof single compounds were obtained from Ultra Scientific — USA(PCB #103), Absolute Standards Inc. — USA (OCPs and PCBs) andBromodiphenyl Ethers Lake Michigan Study (PBDEs) of AccuStandardInc.— USA.
2.6. Statistics and data expression
Significant differences in OCP levels among different matrices weretestedwith a onewayANOVA followed by Tukeytest orMann–WhitneyU test. When parametric requirements were not fulfilled as well as forcomparing OCP levels throughout soil profile, non-parametric compar-isons were used (Kruskal–Wallis test followed by a t-paired test) fordependent samples. Pearson correlation test was used to determinewhether soil concentration correlated with soil TOC. The significancelevel was set at α = 0.05, unless otherwise specified. OCPs, PCBs andPBDEs were reported as ng/g dry weight for soils, sediments, SPM andmacrophytes, while water samples were expressed in ng/L.
3. Results and discussion
3.1. Surface soils
The highest total concentrations of contaminants (50 ng/g dryweight) were found in HN sampling point where an intensive apple
277K.S.B. Miglioranza et al. / Science of the Total Environment 452–453 (2013) 275–285

Author's personal copy
culture is developed being in some areas the main activity. A goodcorrelation between pesticide levels and TOC content (r = 0.81,Table 1) was observed. Both, pesticides and TOC, were higher thansoils from MV and LV stations (ANOVA, Tukey test p = b0.0001),where pesticide concentrations where higher than the levels set for“clean soils” (5 ng/g dry weight, Department of Soil Protection,1994). However, levels found in HN station were much lower thanthose found in VR (1330 ng/g dry weight), where peach is cultivated(Gonzalez et al., 2010). VR represents the typical agricultural soil offruit production from the upper floodplains of the basin with bothcurrent and historical use of pesticides. The difference in concentra-tions was mainly due to DDT levels (99% pp′-DDE, ANOVA, Tukeytest p = b0.0001, Table 3).
HN and VR soils presented the OCP distribution pattern ofDDTs > endosulfans and HCHs (ANOVA, Tukey test p = 0.005 forendosulfans, and p = 0.004 for DDTs). pp′-DDE predominated insoils from upper and middle valleys with a hot spot at VR. The pp′-DDT/pp′-DDE ratios b1 suggest an intense use of pp′-DDT in the past.
Miranda-Filho et al. (2007) have suggested that South America is ahot spot for organochlorine compounds on the basis of DDT levels foundin elephant seals from Antarctica.
Both, detection frequency and concentration of pp′-DDE in soilsfrom UV andMVwere higher than other pesticides. This was assignedto the extended use in the past and to the further metabolism of thepesticide with a consequent long half-life. It was reported that forpp′-DDE the half-life would be of 11 years depending on the volatili-zation in the tilled soil in the southern United States (Bidleman et al.,2006; Kurt-Karakus et al., 2006; Scholtz and Bidleman, 2006). Similarresults about predominance of pp′-DDE, have also been detected in soilsamples of Shanghai, Taihu area, Haining, and Shaoxing in Zhejiangprovince (China) where an intensive use of pp′-DDT was reported(Haruhiko et al., 2005).
Endosulfan residues in the agricultural soils of VR, HN (UV) and LJ(LV) were dominated by the sulfate metabolite due to the samplingconducted during February, at the end of the application period oftechnical endosulfan (Aizen et al., 2009). Thus, the half-life of the pa-rental compounds of 3–4 months, assumes a high metabolism rate.
Composition differences of HCH isomers in the environment couldindicate different contamination sources. HCHs were present in almostall sampling sites, with the predominance of γ-isomer (higher 90%)which indicates the use of lindane in the area. The γ-HCH insecticidehas been widely used in Argentina to kill lice and its use was reportedfor Cordoba (Pesce and Wunderlin, 2000). Technical HCH constitutedby α-HCH (60–70%), β (5–12%), γ-HCH (10–15%) and δ-HCH (6–10%)has been used as broad spectrum pesticides for agricultural purposes,but has been banned in Argentina since 1990.
The cyclodienes, represented by heptachlor, γ- and α-chlordanes,presented a similar pattern. Concentrations were below 1 ng/g dryweight, denoting no recent contamination.
Among non-agricultural pollutants, PCBs constituted the secondgroup highlighted in the basin, with the higher levels in soils fromLIstation. The surrounding area is mainly covered by open dumping sites.Moreover, dams upstream would represent a potential source of PCBsdue to the persistence of these compounds used in electric transformersand as refrigerant until its ban in 2005. In addition a chlor-alkali factorysettled upstreamofNeuquenRiver (affluent ofNegroRiver)would be an-other possible source of PCBs to the environment (Arribére et al., 2003).
The predominance of penta- and hexa-CB at all stations reflectsthe use of Aroclor 1248 and 1254 mixture in the region as previouslyreported by Ondarza et al. (2012). Flooding events that occur duringdams' management may be responsible for the input of such com-pounds to the soil. In the rest of stations, the levels of PCBs in soilwere below 1.5 ng/g dry weight, representing a very low concern tothe environment.
Regarding PBDEs, residues were detected in all samples at levelsbelow 1 ng/g dw. A predominance of BDE 47 followed by BDE 99and BDE 100 was found. The highest PBDE levels were detected insoils from LI station (0.8 ng/g dry weight), probably related to thepresence of dumping sites. Particularly, LI station was settled veryclose (200 m) to a large area used as illegal dumping where unwantedwastes fromdomestic use including plastics and electronic wastesweredisposed. Eguchi et al. (2013) and Kwan et al. (in press) reported PBDEsas the dominant contaminants in the dumping sites in Asian developingcountries.
In the case of VR where total PBDE levels were similar to LI station,it could be related to impurities in pesticide plastic containers as wellas the input from surrounding urban settlements. In addition, thesesoils are irrigated with streamwater and fertilization practices are fre-quently carried out using sewage sludge. Wu et al., 2012 reported thepresence of PBDEs, at levels slightly higher than background soils inagricultural soils fertilized with sewage sludge. Other PBDE sourcefor these soils could be related to the input of these compoundsfrom the apple and peartrees, when leaves fall down or by rain wash-out. The “forest filter effect”, where forest canopies are seen as cumu-lative compartments was previously reported by Nizzetto et al.(2006). However, PBDE values were lower than the mean values ofsoils from Southeast Asia: Bantar Gebang (Indonesia; 0.11–255 ng/g dryweight), Phnom Phen (Cambodia; 0.55–91 ng/g dry weight), Hanoi(Vietnam; 1.2–429 ng/g dry weight) and Chennai (India; 0.82–19 ng/gdry weight; Eguchi et al., 2009). Hassanin et al. (2004) observed PBDEsin rural surface soils of UK exhibiting congener patterns similar to thepenta-BDE product, with values ranging from less than 1 to 12 ng/g.
Table 1Particle size distribution (%), TOC (%) and texture of soils (surface and profile when corresponding) along the Río Negro basin. a = distance from the coast, S = sandy, SL = sandyloam, CL = clay loam, SiL = silty loam, L = loam.
Valley km (a) Sampling station Particle size distribution (%) Total organic carbon (%TOC) Texture
Sand Coarse silt Fine silt Clay
Upper 542 HN 0–5 cm 28.96 40.39 0.36 30.29 5.13 CL5–10 cm 28. 58 41. 31 3.36 26.75 3.84 L
15–20 cm 28.29 42.37 4.05 25.27 1.65 L545 LI 0–5 cm 25.62 46.23 4.18 23.97 4.70 L451 VRa 0–12 cm 52.5 11.21 31.08 5.2 3.90 SL
12–31 cm 45.31 28 0.93 25.76 1.98 SLMiddle 366 CH 0–5 cm 34.60 23.60 28.00 13.70 2.66 LLower 273 LJ 0–5 cm 66.41 13.00 3.30 17.29 1.60 SL
15 CR 0–5 cm 3.90 12.50 48.50 35.20 3.18 SiL1.5 VI 0–4 cm 9.8 10.2 41 39.1 1.10 SiL
4–9 cm 7.6 9.1 41 42.3 1.40 CL14–23 cm 92.6 0.2 2.6 4.5 0.60 S
a Gonzalez et al. (2010).
278 K.S.B. Miglioranza et al. / Science of the Total Environment 452–453 (2013) 275–285

Author's personal copy
Moreover,Matscheko et al. (2002) reported PBDEs in Swedish agricultur-al soils with a mean value of 0.23 ng/g dry weight. These results indicatewidespread occurrence of these compounds in the environment anddenote the role of dumping sites and agricultural soil as punctual andsecondary sources of PBDEs, respectively, to the environment.
3.2. Soil profiles
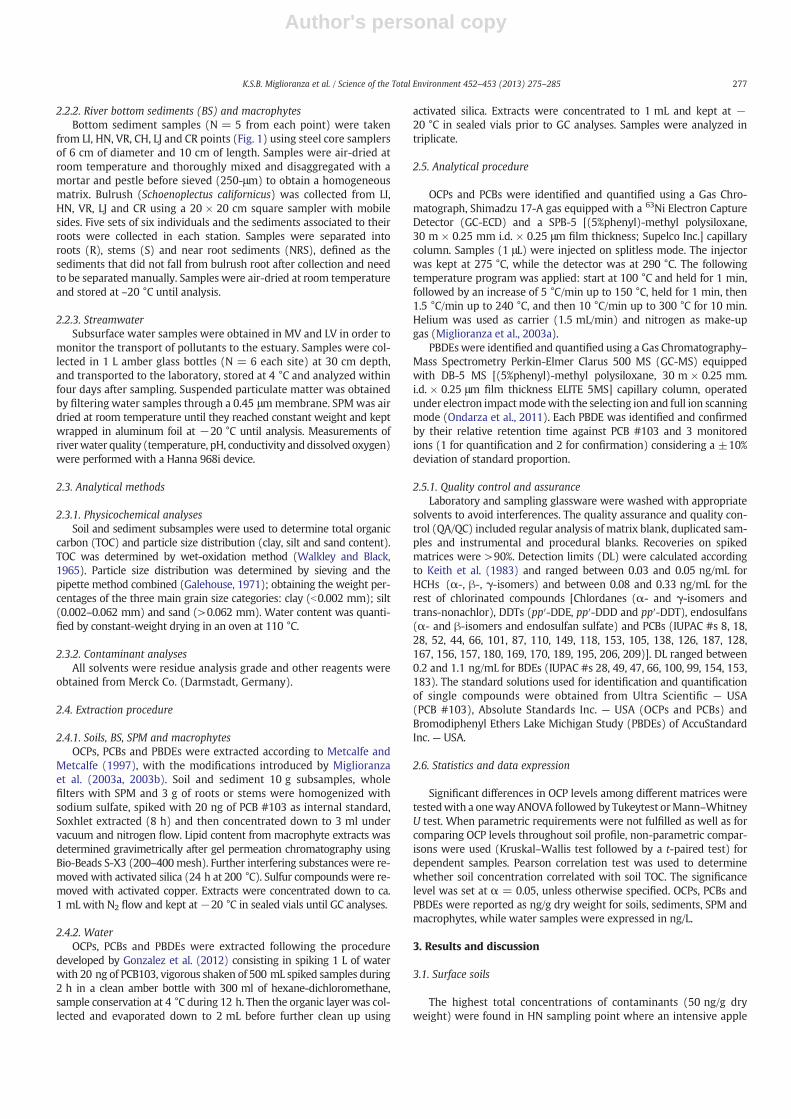
Two soils were selected, HN and VI, as agricultural and recreationalrepresentative soils,with thepurpose to understand pesticide dynamicsand historical use in the region. Moreover, these results were comparedto VR profile previously reported by Gonzalez et al. (2010). HN repre-sents small-case agricultural activity while VR has been historicallyused for fruit cultures, such as apples, pears, among others, with inten-sive pesticide application, while VI station is an area close to the estuarywith recreational land use. Similar to VR, pesticide distribution patternin HN was DDTs ≫ endosulfans > HCHs > the rest of OCPs for theupper 20 cm, although the total concentrationswere lower. Conversely,in VI soil profile, the pattern of each surface layer was DDTs > HCHs >endosulfans > the rest of OCPs, being the concentrations much lowerthan the other two profiles. Thus, the total concentration patternVR > HN > VI would be in relation with the different land uses and inthe case of VR and HN with the intensity of soil use, since DDT was themain group of pesticides in all soil samples and technical endosulfan iscurrently in use, only these two groups will be further discussed (Fig. 2).
3.2.1. DDTsAt all depths the pp′-DDE/pp′-DDT relation was >1, indicating a
non-recent use of pp′-DDT in the region. When comparing pesticidedistribution through profiles a different behavior among soils can beseen. Conversely to that observed on VR soil, where higher DDT levelswere found in surface layers decreasing through the profile, in HN aslightly pp′-DDE enrichment in deeper layers was observed. In addition,DDT levels on 0–20 cm of HN profile were one half of those on 22–30 cm fromVR. DDT leachingwas coupledwith the increase of fine par-ticles (clay) through the soil profile (Table 2). Mobility alone is not agood indicator of the deep leaching potential of a pesticide, but ratherthe combination of mobility and persistence. Similar DDT behaviorwas found in soil profiles from Pampean Region (Miglioranza et al.,2003a) with an enrichment of pesticides in deeper layers. DDT is highlyinsoluble inwater and does not readily leach through the soil profile. Itsgreatmolecular stability, with residence time in soils of at least 10 yearsand the time elapsed since the last application would allow it to reachdeeper levels by translocation with colloids (Harris et al., 2000).
As observed in VR, DDT levels in HN exceeded the values for DDTsin soils considered “clean” at the global scale (5 ng/g dry weight,Department of Soil Protection, 1994). Considering DDT sources, theuse of the acaricide dicofol in the area, which contains DDT impurities(0.1–10%), could mean a fresh pp′-DDT input. However, the amountsapplied at recommended field concentration of 48 mg/L on fruit trees(INTA, 2004), are negligible in comparison with pp′-DDE levels inthese agricultural soils.
15-20 cm
5-10 cm
0-5 cm
ng/g dry weight
0 300 600 900 1200 1500
22-30 cm
12-17 cm
6-12 cm
0-5 cm
ng/g dry weight
14-23 cm
4-9 cm
0-4 cm
ng/g dry weight
14-23 cm
4-9 cm
0-4 cm
ng/g dry weight
0 1 2 3 4 5
15-20 cm
5-10 cm
0-5 cm
ng/g dry weight
0 20 40 60
0.00 0.10 0.20 0.30 0.40 0.50 0.00 0.50 1.00 1.50
0 10 30
22-30 cm
12-17 cm
6-12 cm
0-5 cm
ng/g dry weight
-endosulfan p´p´-DDE
-endosulfan p´p´-DDD
Endosulfan sulfate p´p´-DDT
ENDOSULFANs DDTs
HN
VR
VI
20 40
Fig. 2. DDT and endosulfan concentrations, expressed as ng/g dry weight in soil profile from VR, HN and VI sampling stations of the Rio Negro basin.
279K.S.B. Miglioranza et al. / Science of the Total Environment 452–453 (2013) 275–285

Author's personal copy
VI soils showed the lowest DDT level on surface, as well as indeeper layers, considering that it is a natural soil with recreationaluse. The pp′-DDT/pp′-DDE ratios were variable depending on depth,probably by differences on degradation such as biological metabo-lism. Therefore, these results would be a consequence of backgroundsoils mainly polluted from atmospheric inputs. It is known that near-by agricultural soils may act as a source of “aged”OCPs and a fractionof them may get volatilized and dispersed, making them reservoirs ofthese pollutants and a risk to non-impacted soils (Pereira et al., 2010).
3.2.2. EndosulfansHN and VR soils showed a similar endosulfan distribution pattern,
with a predominance of E sulfate in the 0–5 cm level. It can beexplained by the fact that the high organic matter content and prob-ably a high microbial activity would lead to enhanced metabolism ofparent compounds into its more persistent and toxic sulfate metabo-lite (Weber et al., 2010). These findings are in concordance with thewidespread use of endosulfan in the area as well as the time elapsedsince its application, considering that the average life-time of the α- andβ-isomers is less than three months. The predominance of α-isomer inthe deeper layers of both agricultural soils demonstrates its higherleaching potential as a consequence of the relative high hydrophilicity(Kow 3.83; Sabljic et al., 1995) with respect to the other isomer and alow metabolic activity in the deeper layer. Conversely in VI soil, α- andβ-isomers were dominant on surface layer (0–5 cm) with decreasinglevels through the profile. Sulfatemetabolite was detected on subsurfacesoil (4–9 cm) which presents the highest levels of TOC and clay contentand consequently a greater retention capacity. This different behavior isthe result of different sources and soil characteristics. In VI, endosulfansarrive by diffuse or atmospheric sources from application areas whichare reflected on the isomers relation α-/β- > 1 of surface layer, similarto technical endosulfan mixture. Besides, soil structure and microorgan-ism density at sub-root depth, where oxygen, water content and nutri-ents availability would be optimums, represent a good scenario forα-endosulfan metabolism to endosulfan sulfate.
It is important to emphasize the opposite behavior of DDT andendosulfan groups: while the first increase or kept constant withdepth (past use), endosulfans show the highest levels at surface soils(recent use) in all soils.
3.3. River bottom sediments (BS)
Physicochemical characteristics of BS varied along the Rio Negrowith high sand levels in the UV, and increasing TOC levels in thefine fraction toward the outlet. There was no relationship betweensediment TOC content and total pollutant concentrations indicatingother factors involved in pollutant retention, such as punctual sourcesand/or differential partition of pollutants between BS and SPM.Particularly, there was an increase in SPM loads from 46 mg/l (MV)to 145 mg/L (LV). Results indicate that residue levels reflect pollutantapplication history and dissipation ratesmore than an air–soil equilibri-um, as has been reported in agricultural soils of Alabama (Harner et al.,1999) and from Georgia and South Carolina (Kannan et al., 2003). The
dominance of sand along the Rio Negro diminishing toward the outletagrees with the pollutant behavior despite worldwide research stateda non relationship between sand content and organochlorine levels.However, Drake et al. (2002) reported a good relation between sandand pp′-DDE levels in sediments supporting our results. Generally, or-ganochlorine compounds tended to accumulate in the fine grain-sizefractions, rich in organic matter, except pp′-DDE, which concentratesbasically in the coarse grain-size fractions. The highest concentrationsof OCPs, PCBs and PBDEs along the Río Negro basin were detected inupstream sediments (UV, 18.5 ng/g dry weight), decreasing graduallytoward the coast (LV, 3.1 ng/g dry weight) (Table 3). The OCP/PCB orPBDE ratio was >1 in all sampling stations denoting the predominanceof agriculture over industry and urban pollution sources following thesame behavior of soil. The assessment of DDT levels in sediments wasdirectly related to soil concentrations. Thus, higher DDT levels werefound at HN and VR stations according to the agricultural land use(Kruskal–Wallis p = 0.006). Particularly, the high pp′-DDT levelsfound in HN station (16.3 ng/g dry weight) surpassed the maximumlimit of “Lowest Effect Levels” (LOEL) for protection and managementof aquatic sediment quality in Ontario, Canada (13 ng/g dry weight,CCME, 2001). In order to identify possible sources of DDTs, the pp′-DDT/(pp′-DDT + pp′-DDE) ratio was calculated. LI and HN presentedmean ratios of 0.65, while VR 0.33 and CH 0.5. After the delta riparianzone, 300 km downstream from VR, in LJ station the ratio was 0.22.These results would indicate a non-recent use of pp′-DDT although dif-ferences among stationswere observed according to the intensive agro-chemicals use in the past. Moreover, the widely used acaricide dicofol,as was previously mentioned for soils, represents other contemporarysource of DDTs into the environment. Surprisingly, in CR station theratio was 0.9, despite being a zone of scarce agricultural activities. Thepresence of pp′-DDT in the coastal zone suggests the entering of freshinputs of pp′-DDT, either from local use or long-range transport.
Studies on OCP levels in fishes along the Río Negro also reported thepredominance of DDT group, being pp′-DDE the main compound withmean concentrations of 0.15 and 2.3 ng/g wet weight for the muscleand liver, respectively, in LV (Ondarza et al., 2010) and, 6.4 and69.0 ng/g wet weight for the muscle and liver, in MV (Ondarza et al.,2012).
VR and LI stations showed the highest concentrations of endosulfans(mean range 1.1–1.96 ng/g dry weight) being significantly differentfrom the rest of the stations, with a mean value of 0.5 ng/g dry weight(Kruskal–Wallis p = 0.04 Table 3). It is clear that despite the high useof technical endosulfan in the region, soils and sediments accumulatethe pesticide at relatively low rates, even comparing to DDT levels.The physicochemical characteristics of endosulfans lead to be moreavailable for soil erosion and less subject to adsorption by bed sedi-ments than DDTs (Miglioranza et al., 2003b). All stations, except CR,showed a predominance of β-isomer followed by α-isomer (Table 3).Beta-endosulfan appears to be mainly associated to sediments in fresh-water systems. Thus, Peterson and Batley (1993) conducted studiesabout partitioning and aquatic fate of endosulfans and demonstratedthat a major proportion is associated to sediment over time, reflectingthe relatively high Koc values (log Kocα 3.6; Kocβ 4.3), with a relativelyhigher enrichment of the β-isomer. Similar results were reported byZhang et al. (2003), Menone et al. (2004) and Miglioranza et al.(2004) showing that the α-isomer has a greater potential for aquatictransport being more available to degradation. Remobilization experi-ments indicated that α-endosulfan was more readily desorbed fromsediments than the β-isomer (Peterson and Batley, 1993). Particularlyin CR station the relation α/β was >1(Table 4). Thus, the ratio of thetwo isomers reflected technical endosulfan and was probably related toa recent use of the pesticide in close areas, rather than sediment–waterpartitioning over a longer term. Higher concentrations of α-isomerrelated to β-isomer were also found in sediments from several Jamaicanrivers and it was also related directly with recent technical endosulfanuse (Mansingh et al., 2000).
Table 2Particle size distribution (%), TOC (%), texture and pH of surface sediments from RíoNegro basin. a = distance to the coast, SL = sandy loam, CL = clay loam.
km (a) Samplingstation
Particle size distribution (%) Total organiccarbon (%TOC)
Texture pH
Sand Finesilt
Coarsesilt
Clay
542 HN 87.66 0.68 0.28 11.18 0.7 SL 7.7545 LI 83.64 0.44 3.85 12.06 0.3 SL 7.2451 VR 52.00 14.00 25.00 9.00 0.3 SL 7.1366 CH 59.50 2.82 23.67 15.00 0.8 SL 7.4273 LJ 46.15 0.77 30.32 22.76 1.2 SL 7.515 CR 30.02 0.93 40.20 28.86 1.6 CL 7.5
280 K.S.B. Miglioranza et al. / Science of the Total Environment 452–453 (2013) 275–285
Author's personal copy
A study conducted on theNamoi River, NSWAustralia, revealed endo-sulfan sorption to bottom sediment to be higher on the larger size par-ticle fractions (>63 μm diameter) compared to the finer size fractions(b24 μm). This implies particle-bound transport as well as desorptionfollowing sediment re-suspension (Leonard et al., 2001). Therefore inour study, not only the high endosulfans use in the basin, but also theparticle size distribution in bottom sediment along the river justifiesthe endosulfan distribution found.
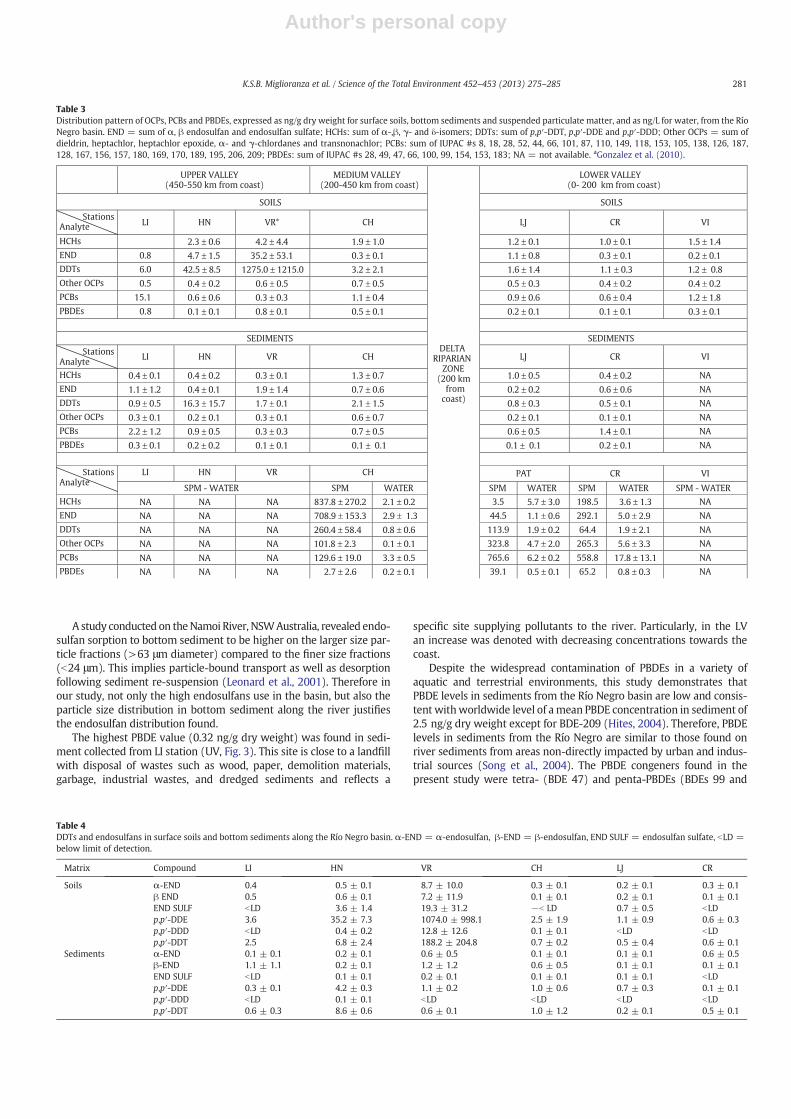
The highest PBDE value (0.32 ng/g dry weight) was found in sedi-ment collected from LI station (UV, Fig. 3). This site is close to a landfillwith disposal of wastes such as wood, paper, demolition materials,garbage, industrial wastes, and dredged sediments and reflects a
specific site supplying pollutants to the river. Particularly, in the LVan increase was denoted with decreasing concentrations towards thecoast.
Despite the widespread contamination of PBDEs in a variety ofaquatic and terrestrial environments, this study demonstrates thatPBDE levels in sediments from the Río Negro basin are low and consis-tent withworldwide level of amean PBDE concentration in sediment of2.5 ng/g dry weight except for BDE-209 (Hites, 2004). Therefore, PBDElevels in sediments from the Río Negro are similar to those found onriver sediments from areas non-directly impacted by urban and indus-trial sources (Song et al., 2004). The PBDE congeners found in thepresent study were tetra- (BDE 47) and penta-PBDEs (BDEs 99 and
Table 4DDTs and endosulfans in surface soils and bottom sediments along the Río Negro basin. α-END = α-endosulfan, β-END = β-endosulfan, END SULF = endosulfan sulfate, bLD =below limit of detection.
Matrix Compound LI HN VR CH LJ CR
Soils α-END 0.4 0.5 ± 0.1 8.7 ± 10.0 0.3 ± 0.1 0.2 ± 0.1 0.3 ± 0.1β END 0.5 0.6 ± 0.1 7.2 ± 11.9 0.1 ± 0.1 0.2 ± 0.1 0.1 ± 0.1END SULF bLD 3.6 ± 1.4 19.3 ± 31.2 −b LD 0.7 ± 0.5 bLDp,p′-DDE 3.6 35.2 ± 7.3 1074.0 ± 998.1 2.5 ± 1.9 1.1 ± 0.9 0.6 ± 0.3p,p′-DDD bLD 0.4 ± 0.2 12.8 ± 12.6 0.1 ± 0.1 bLD bLDp,p′-DDT 2.5 6.8 ± 2.4 188.2 ± 204.8 0.7 ± 0.2 0.5 ± 0.4 0.6 ± 0.1
Sediments α-END 0.1 ± 0.1 0.2 ± 0.1 0.6 ± 0.5 0.1 ± 0.1 0.1 ± 0.1 0.6 ± 0.5β-END 1.1 ± 1.1 0.2 ± 0.1 1.2 ± 1.2 0.6 ± 0.5 0.1 ± 0.1 0.1 ± 0.1END SULF bLD 0.1 ± 0.1 0.2 ± 0.1 0.1 ± 0.1 0.1 ± 0.1 bLDp,p′-DDE 0.3 ± 0.1 4.2 ± 0.3 1.1 ± 0.2 1.0 ± 0.6 0.7 ± 0.3 0.1 ± 0.1p,p′-DDD bLD 0.1 ± 0.1 bLD bLD bLD bLDp,p′-DDT 0.6 ± 0.3 8.6 ± 0.6 0.6 ± 0.1 1.0 ± 1.2 0.2 ± 0.1 0.5 ± 0.1
Table 3Distribution pattern of OCPs, PCBs and PBDEs, expressed as ng/g dry weight for surface soils, bottom sediments and suspended particulate matter, and as ng/L for water, from the RíoNegro basin. END = sum of α, β endosulfan and endosulfan sulfate; HCHs: sum of α-,β, γ- and δ-isomers; DDTs: sum of p,p′-DDT, p,p′-DDE and p,p′-DDD; Other OCPs = sum ofdieldrin, heptachlor, heptachlor epoxide, α- and γ-chlordanes and transnonachlor; PCBs: sum of IUPAC #s 8, 18, 28, 52, 44, 66, 101, 87, 110, 149, 118, 153, 105, 138, 126, 187,128, 167, 156, 157, 180, 169, 170, 189, 195, 206, 209; PBDEs: sum of IUPAC #s 28, 49, 47, 66, 100, 99, 154, 153, 183; NA = not available. aGonzalez et al. (2010).
UPPER VALLEY(450-550 km from coast)
MEDIUM VALLEY(200-450 km from coast)
LOWER VALLEY(0- 200 km from coast)
SOILS SOILS
StationsAnalyte LI HN VR* CH LJ CR VI
HCHs 2.3 ± 0.6 4.2 ± 4.4 1.9 ± 1.0 1.2 ± 0.1 1.0 ± 0.1 1.5 ± 1.4
END 0.8 4.7 ± 1.5 35.2 ± 53.1 0.3 ± 0.1 1.1 ± 0.8 0.3 ± 0.1 0.2 ± 0.1
DDTs 6.0 42.5 ± 8.5 1275.0 ± 1215.0 3.2 ± 2.1 1.6 ± 1.4 1.1 ± 0.3 1.2 ± 0.8
Other OCPs 0.5 0.4 ± 0.2 0.6 ± 0.5 0.7 ± 0.5 0.5 ± 0.3 0.4 ± 0.2 0.4 ± 0.2
PCBs 15.1 0.6 ± 0.6 0.3 ± 0.3 1.1 ± 0.4 0.9 ± 0.6 0.6 ± 0.4 1.2 ± 1.8
PBDEs 0.8 0.1 ± 0.1 0.8 ± 0.1 0.5 ± 0.1 0.2 ± 0.1 0.1 ± 0.1 0.3 ± 0.1
SEDIMENTS SEDIMENTS
StationsAnalyte LI HN VR CH LJ CR VI
HCHs 0.4 ± 0.1 0.4 ± 0.2 0.3 ± 0.1 1.3 ± 0.7 1.0 ± 0.5 0.4 ± 0.2 NA
END 1.1 ± 1.2 0.4 ± 0.1 1.9 ± 1.4 0.7 ± 0.6 0.2 ± 0.2 0.6 ± 0.6 NA
DDTs 0.9 ± 0.5 16.3 ± 15.7 1.7 ± 0.1 2.1 ± 1.5 0.8 ± 0.3 0.5 ± 0.1 NA
Other OCPs 0.3 ± 0.1 0.2 ± 0.1 0.3 ± 0.1 0.6 ± 0.7 0.2 ± 0.1 0.1 ± 0.1 NA
PCBs 2.2 ± 1.2 0.9 ± 0.5 0.3 ± 0.3 0.7 ± 0.5 0.6 ± 0.5 1.4 ± 0.1 NA
PBDEs 0.3 ± 0.1 0.2 ± 0.2 0.1 ± 0.1 0.1 ± 0.1 0.1 ± 0.1 0.2 ± 0.1 NA
LI HN VR CH PAT CR VIStationsAnalyte
SPM - WATER SPM WATER SPM WATER SPM WATER SPM - WATER
HCHs NA NA NA 837.8 ± 270.2 2.1 ± 0.2 3.5 5.7 ± 3.0 198.5 3.6 ± 1.3 NA
END NA NA NA 708.9 ± 153.3 2.9 ± 1.3 44.5 1.1 ± 0.6 292.1 5.0 ± 2.9 NA
DDTs NA NA NA 260.4 ± 58.4 0.8 ± 0.6 113.9 1.9 ± 0.2 64.4 1.9 ± 2.1 NA
Other OCPs NA NA NA 101.8 ± 2.3 0.1 ± 0.1 323.8 4.7 ± 2.0 265.3 5.6 ± 3.3 NA
PCBs NA NA NA 129.6 ± 19.0 3.3 ± 0.5 765.6 6.2 ± 0.2 558.8 17.8 ± 13.1 NA
PBDEs NA NA NA 2.7 ± 2.6 0.2 ± 0.1
DELTARIPARIAN
ZONE(200 km
from coast)
39.1 0.5 ± 0.1 65.2 0.8 ± 0.3 NA
281K.S.B. Miglioranza et al. / Science of the Total Environment 452–453 (2013) 275–285

Author's personal copy
100, Fig. 3). Penta-BDEs are the predominant congeners found in sever-al technical flame-retardant mixtures, including DE-71 and Bromkal70-5 DE (La Guardia et al., 2006), and their presence can also be indica-tive of the breakdown of larger PBDE congeners, including deca-BDE(Rahman et al., 2001). A similar distribution pattern was found in UVandMV being BDE 47 > 100 > 99. However, in LV the pattern was dif-ferent with a predominance of hexa-BDE. Although these values are notindicative of high impacted sediments, they represent a source of PBDEsfor aquatic biota as was reported by Ondarza et al. (2012) for fishes.
3.4. SPM and streamwater
The total levels of OCPs, PCBs and PBDEs in SPM were one to ten or-ders of magnitude higher than in BS in all sampling sites (Table 3).These results agree with the fact that SPM traps more efficiently hydro-phobic contaminants than BS (Liu et al., 2008). SPM significantly influ-ences contaminant transport to the aquatic environment. Hydrophobicpollutants are removed from the water column, adsorbed onto SPMdue to their high organic matter content, transported along the river
and further accumulated in bottom sediments. The resuspension of BSrepresents a secondary contamination source to overlying water.
The total pollutant levels in SPM from MV presented the highestconcentration with a mean value of 2604.5 ng/g dry weight. HCHs,endosulfans and PCBs represented the main groups being 80%of total pollutants (Table 3). Relationships α-HCH/γ-HCH (4:1),α-endosulfan:β-endosulfan:endosulfan sulfate (7:2:1), and pp′-DDT:pp′-DDE: pp′-DDD (2:2:1) were found. The relation between HCH iso-mers denotes the higher partition of γ-HCH in the water column asdissolved form. Regarding endosulfans the isomer ratio clearly indicatesa recent use of this insecticide in the surrounding area. The DDT grouprelation reflects the impact of UV soils on aquatic pollution. After thedelta, in LV the total pollutant concentrations in SPM decreased 50%(PAT station) which can be attributed to the role of macrophytes, bothfloating and rooted, on pollutant trapping.
The impact of urban areas at LV was reflected in the distributiongroups in CR station, PCBs > cyclodienes > DDTs, due to proximity tosewage and rainfall outlet. Even though the delta riparian zone waseffective in pesticide retention clearly observed in the decrease ofthese pollutants in CR station, the increase in PBDE levels could be
47 99 100
0
0,1
0,2
0,3
0,4
0,5
0,6
0,7
0,8
0,9
ng
/L
Streamwater
0
10
20
30
40
50
60
70
ng
/g d
ry w
eig
ht
Suspended particles
0
0,1
0,2
0,3
0,4
0,5
0,6
0,7
0,8
0,9
Soil SS Soil SS Soil SS Soil SS Soil SS Soil SS
LI HN VR CH LJ CR
ng
/g d
ry w
eig
ht
Soils and sediments
0
2
4
6
8
PAT CR PAT CR
LI HN VR LJ CR
ng
/g d
ry w
eig
ht
Macrophytes
Stem Root NRS Stem Root NRS Stem Root NRS Stem Root NRS Stem Root NRS
Fig. 3. Concentration of PBDEs in streamwater (ng/L), suspended particles, surface soils, surface sediments and macrophytes (ng/g dry weight) along the Río Negro basin, SS =surface sediment, NRS = near root sediment.
282 K.S.B. Miglioranza et al. / Science of the Total Environment 452–453 (2013) 275–285

Author's personal copy
due to the presence of a dumping site in Viedma city (main urban set-tlement of the basin) settled close to the sampling station. Particularly,CR station is affected by flooding episodes in the river side soils, duringexceptional tide phenomena. As a consequence, these soils stay floodedduring high tide hours, and pollutant residues are transported to themain stream when low tide takes place. Leachates from landfills havebeen identified as one of the possible sources of PBDEs in the environ-ment. Kwan et al. (in press) demonstrated that leachates of PBDEsfrom dumping sites were predominantly found in the adsorbed phase.Therefore the impact of tidal onto dumping site of Viedma could leadto more available PBDEs in the Río Negro, associated mainly to SPM.(Isla et al., 2011).
The proportion of PBDE congeners in CR station would indicate arelatively recent use of penta-BDE mixtures because of the similaritybetweenBDE-47 andBDE-100proportions, resembling the technicalmix-ture (Fig. 3). The BDE-100 is characterized by a high persistence whileBDE-47 despite being the main congener of penta-BDE mixture alsoconstitutes the most ubiquitous BDE as a result of atmospheric transport.
Pollutant levels in streamwater ranged between 9.7 and 34 ng/L,with the highest levels at CR station (Table 3). A similar distributionpattern between SPM and water was found for all studied groups indi-cating a clear relationship between both matrices where equilibriumpartition would be the main factor for pollutant distribution. Thus, inMV endosulfans (2.9 ng/L) and HCHs (2.1 ng/L) predominated, whilein LV pollutants were mainly represented by PCBs, HCHs, endosulfansand cyclodienes. As is noted, theDDT group levelswere low inwater so-lution, while BS and SPM from the same stations showed high DDTlevels, favored by its hydrophobicity and preferential adsorption on or-ganic matter and sand, particularly in the case of pp′-DDE. Endosulfanconcentrations (α-/β- > 1) were below the maximum allowablelevels for surface waters (7 ng/L National Argentinean Water Council)but they were quite similar to that from the international guidelines(3 ng/L, CCME, 2001), for biota protection, surpassing this value in CRstation (5 ng/L). Considering total concentrations of pollutant groups,the river outflow would be of 196 g/day for HCHs, 260 g/day for endo-sulfans, 99 g/day for DDTs, 290 g/day for the other OCPs, 920 g/day forPCBs and 41 g/day for PBDEs.
3.5. Macrophytes (S. californicus, bulrush)
Aquatic macrophytes that colonize littoral zones have two charac-teristics which make them good indicators of water pollution. Firstly,they react slowly and progressively to changes in nutrient conditions,
in contrast to bacteria and microalgae. Macrophytes, therefore, actas integrators of environmental conditions and thus can be used aslong-term indicators with high spatial resolution. Secondly, the coastalzonemay experience patterns of pollutant concentrations (Dave, 1992;Drake and Heaney, 1987), caused by natural or artificial inflows as wellas by non-point sources.
As a measure of absorption capacity of pollutants by macrophytes,lipid contents were determined with mean values of 1.3 in stem and0.5 in roots and non-significant differences were observed amongstations. Table 5 shows OCP, PCB and PBDE concentrations expressedas ng/g dry weight in roots and stems of S. californicus, and in nearroot sediments (NRS) collected along the Rio Negro basin.
Bulrush accumulated significant amounts of OCPs, PCBs andPBDEs. The contaminant sequestration may occur across many inter-faces, as sediments, water and air. In stems there was no relationshipbetween lipid content and pollutant concentration expressed in ng/gdry weight (Table 5). It can be speculated that other non-lipid cellu-lar components like lignin contribute substantially to chemicalpartitioning (Trapp et al., 2001). Roots presented higher contami-nant levels than stem in UV, indicating closely the distribution pat-tern of contaminants found in soils. Thus roots from VR showed thehighest total levels (62 ng/g dry weight) with 70% being representedby DDTs (pp′-DDE). Stems from HN and VR showed higher levels ofendosulfan (Kruskal–Wallis p = 0.04) as a consequence of its higherwater–sediment partition coefficient, beingmore available to uptakefrom water.
Bulrush from LI station showed a predominance of PCBs and DDTs,with similar values between them, both in roots and stem (Table 5).This pattern agrees with that found in soil. Conversely to UV sites, bul-rush from LJ station showed higher values in stem than roots, withthe following pattern: PBDEs > endosulfans > PCBs > DDTs = HCHs.It would be a result of the impact of water and SPM onto stem pollutantlevels more than point source from soil erosion, as seen for UV sites.Similar pattern was found for SPM and water in PAT station, whereenrichment of PBDE levels in both matrices was observed after the deltazone. The relation among congeners in stems (BDE 47 ≥ 100>99) re-veals the use of mainly penta-BDE mixture in the area as was observedfor SPM downstream, atmospheric deposition as well as possibledebromination process from higher brominated congeners wouldnot be discarded.
Particularly in CR station, endosulfan was the main pesticide groupfound in roots (11.7 ng/g dry weight), showing a clear accumulationpattern from sediment (BS), where the same pattern was observed.
Table 5Total concentration of OCPs, PCBs and PBDEs, expressed as ng/g dry weight, in roots and stems of Schoenoplectus californicus, and near root sediments (NRS) collected along the RioNegro basin. TOC = total organic carbon. END = sum of α., β endosulfan and endosulfan sulfate; HCHs: sum of α-, β, γ- and δ-isomers; DDTs: sum of p,p′DDT, p,p′DDE and p,p′DDD; Other OCPs = Sum of dieldrin, heptachlor, heptachlor epoxide, α- and γ-chlordanes and transnonachlor; PCBs: sum of IUPAC #s 8, 18, 28, 52, 44, 66, 101, 87, 110, 149,118, 153, 105, 138, 126, 187, 128, 167, 156, 157, 180, 169, 170, 189, 195, 206, 209; PBDEs: sum of IUPAC #s 28, 49, 47, 66, 100, 99, 154, 153, 183; bLD = below limit of detection.
Sampling site Sample type % lipid-TOC HCHs END DDTs Other OCPs PCBs PBDEs
LI Stem 1.4 1.3 ± 1.2 2.1 ± 1.2 3.2 ± 0.5 1.0 ± 0.6 4.9 ± 2.2 1.2 ± 0.1Root 0.6 1.8 ± 1.1 4.4 ± 2.3 7.5 ± 3.2 1.6 ± 1.3 7.7 ± 6.5 2.8 ± 0.2NRS 1.7 1.4 ± 0.3 0.3 ± 0.1 1.8 ± 0.6 0.4 ± 0.1 1.7 ± 3.8 0.3 ± 0.1
HN Stem 1.1 1.6 ± 0.1 4.7 ± 2.1 2.7 ± 1.0 1.0 ± 0.3 3.8 ± 0.4 1.0 ± 0.5Root 0.3 3.5 ± 2.9 5.9 ± 3.5 19.6 ± 6.4 1.0 ± 1.3 3.5 ± 4.1 2.6 ± 1.3NRS 0.5 0.1 ± 0.1 0.3 ± 0.2 1.2 ± 0.3 bLD 0.4 ± 0.4 0.1 ± 0.1
VR Stem 1.3 1.8 ± 0.9 7.9 ± 2.5 4.7 ± 0.8 1.3 ± 0.8 3.8 ± 2.1 1.3 ± 0.7Root 0.7 2.1 ± 2.6 9.8 ± 10.7 44.5 ± 49.3 1.5 ± 1.4 6.1 ± 5.6 2.2 ± 1.4NRS 0.3 0.2 ± 0.1 0.4 ± 0.1 1.3 ± 0.1 0.4 ± 0.1 1.7 ± 0.8 0.1 ± 0.1
LJ Stem 1.0 2.2 ± 0.6 4.8 ± 1.0 2.8 ± 1.0 1.7 ± 0.3 3.9 ± 1.1 6.8 ± 5.5Root 0.4 0.2 ± 0.3 0.5 ± 0.9 0.7 ± 1.3 0.1 ± 0.2 1.0 ± 1.8 0.2 ± 0.1NRS 0.8 0.2 ± 0.2 0.2 ± 0.1 0.3 ± 0.1 0.3 ± 0.1 0.4 ± 0.2 0.1 ± 0.1
CR Stem 1.5 0.8 ± 0.4 2.0 ± 0.1 3.0 ± 2.7 0.8 ± 0.4 1.6 ± 0.3 0.5 ± 0.1Root 0.2 4.6 ± 1.7 11.7 ± 0.9 1.5 ± 0.8 2.0 ± 0.6 2.4 ± 1.5 0.9 ± 0.1NRS 1.0 0.3 ± 0.2 0.2 ± 0.1 0.2 ± 0.1 0.2 ± 0.1 0.2 ± 0.1 0.1 ± 0.1
283K.S.B. Miglioranza et al. / Science of the Total Environment 452–453 (2013) 275–285

Author's personal copy
Moreover, it agrees with the high enrichment in endosulfans observed inSPM from CR (292.1 ng/g dry weight) regarding PAT (44.5 ng/g dryweight) station, located 30 km upstream.
Bulrush reflected the environmental profile of pollution since theypossess a similar distribution pattern of contaminants (OCPs > PCBs >PBDEs) found in the other matrices (sediments, soils and streamwater).Moreover, the role of riparian vegetation as pollutant filter was signifi-cantly observed in this study leading to lower pesticide concentrationsin macrophyte tissues and SPM in stations located after the delta riparianzone.
4. Conclusions
This work provided the first systemic data on the contaminationstatus of OCPs, PCBs and PBDEs in soils, sediments, SPM, streamwaterand macrophytes along the Rio Negro basin, Patagonia Argentina. Dueto historical intense pesticide application, the urban and industrialdischarges, the presence of dams, atmospheric transport and the per-sistence of OCPs, PCBs and PBDEs, residues of these compounds arepresent in Rio Negro basin, although most of them are phased-outcompounds in Argentina. The UV was the most contaminated areaalong the floodplain of the Rio Negro, where the soil can be consid-ered a hot spot of DDTs in the southern region of South America.The pp′-DDE, a persistent metabolite of pp′-DDT, was dominant inall samples, indicating input of heavily weathered pp′-DDT. The oc-currence of endosulfans with a relationα-/β-isomers > 1 in all matri-ces denotes the current use in the region. The endosulfan levels instreamwater could represent a risk to the environment since it wasfound at higher values than the maximum established limits foraquatic biota protection. PCBs were confined mainly to close areas re-lated with hydroelectric power plants and dams located in the UV,and also to urban areas. PBDEs were distributed similarly to PCBs asa result of common sources like dumping sitesand similar dynamicsin the environment. The predominance of BDE-47 in most samplesdenotes the use of penta-BDE mixture in the region; atmospheric de-position and the metabolism of higher brominated congeners are notdiscarded. Pollutant level in SPM was 1–10 fold higher than bottomsediments, with a similar distribution pattern of pollutants, showingthe high OCP, PCB and PBDE loads transported by streamwater.Macrophytes along the basin reflected efficiently soil pollution, beingS. californicus a good biomonitor for Rio Negro basin. The delta zone,located in the middle of the basin, rich in macrophytes (rooted andfree-floating) trapped OCPs, PCBs and PBDEs acting as a natural filter,reducing pollutant levels in all matrices including SPM downstream.Since pesticide use in UV contributed greatly to pesticide loads in thewhole basin, especially for DDTs, outreach efforts are needed to carryout a regional program on soil monitoring and promote betterpolicy-maker control. It should be focused to identify and classify criti-cal points of past contamination and to prevent both soil erosion andpesticide releases.
Conflict of Interest
All the authors have no conflicts of interest.
Acknowledgments
This work was supported by PICT 07-410, Agencia Nacional dePromoción Científica y Tecnológica (ANPCyT) of Argentina and by UNEP(GEF-082/06 Project BC-42). The authors also thank Mrs. F. Menna,M. Espinosa, A. Ferrante and M. Quiroz Londoño for their help duringfield sampling. G. Fillmann was sponsored by the Brazilian NationalResearch Council (CNPq PQ 314335/2009-9).
References
Aizen MA, Garibaldi LA, DondoM. Expansión de la soja y diversidad de la agricultura Argen-tina. Ecol Aust 2009;19:45–54.
Arribére MA, Ribeiro Guevara S, Sánchez RS, Gil MI, Róman Ross G, Daudare LE, et al.Heavy metals in the vicinity of a chlor-alkali factory in the upper Negro River eco-system, Northern Patagonia, Argentina. Sci Total Environ 2003;301:187–203.
Bidleman TF, Leone AD, Wong F, Van Vliet L, Szeto S, Ripley BD. Emission of legacy chlo-rinated pesticides from agricultural and orchard soils in British Columbia, Canada.Environ Toxicol Chem 2006;25:1448–57.
Borghesi N, Corsolini S, Focard S. Levels of polybrominated diphenyl ethers (PBDEs)and organochlorine pollutants in two species of Antarctic fish (Chionodracohamatus and Trematomus bernacchii). Chemosphere 2008;73:15-160.
CCME. Canadian water quality guidelines for the protection of aquatic life. Canadiansediment quality guidelines for the protection of aquatic life; 2001 [Excerpt frompublication, N° 1299, Winnipeg].
Coronato AMJ, Coronato F, Mazzoni E, Vazquez M. The physical geography of Patagoniaand Tierra del Fuego. Dev Quat Sci 2008:13–58.
Dave G. Sediment toxicity and heavy metals in eleven lime reference lakes of Sweden.Water Air Soil Pollut 1992;63:187–200.
de Wit CA. An overview of brominated flame retardants in the environment. Chemosphere2002;46:583–624.
Department of Soil Protection. The Netherlands Soil Contamination Guidelines, NetherlandsIntervention Values for Soil Remediation, Reference No. DBO/07494013, Amsterdam,The Netherlands; 1994.
Depetris PJ, Gaiero DM, Probst JL, Hartmann J, Kempe S. Biogeochemical output and ty-pology of rivers draining Patagonia's Atlantic seaboard. J Coastal Res 2005;21:835–44.
Drake JC, Heaney SI. Occurrence of phosphorus and its potential remobilization in thelittoral sediments of a productive English lake. Freshwat Biol 1987;17:513–23.
Drake DE, Eganhouseb R, McArthurc W. Physical and chemical effects of grain aggregateson the Palos Verdes margin, southern California. Cont Shelf Res 2002;22:967–86.
Eguchi A, Isobe T, Subramanian A, Sudaryanto A, Viet PH, Tana TS, et al. Contaminationby brominated flame retardants in soil samples from Asian developing countries.Organohalogen Compd 2009;71:1286–90.
Eguchi A, Isobe T, Ramu K, Tue NM, Sudaryanto A, Devanathan G, et al. Soil contamina-tion by brominated flame retardants in open waste dumping sites in Asian devel-oping countries. Chemosphere 2013;90(9):2365–71.
Galehouse JS. Sedimentation analysis In: RE Carver (ed): Procedures in sedimentarypetrology Edited by University of Georgia Georgia USA Chapter 4, 1971.
Gonzalez M, Miglioranza KSB, Aizpún JE, Isla F, Peña A. Assessing pesticides leachingand desorption by organic amendments in soils with different agricultural activitiesfrom Argentina (Pampa and Patagonia). Chemosphere 2010;81:351–8.
Gonzalez M, Miglioranza KSB, Shimabukuro V, Quiroz M, Martinez D, Aizpun J, et al.Surface and groundwater pollution by organochlorine compounds in a typical soybeansystem from the south Pampa, Argentina. Environ Earth Sci 2012;65:481–91.
Harner T, Wideman JL, Jantunen LMM, Bidleman TF, Parkhurst WJ. Residues of organ-ochlorine pesticides in Alabama soils. Environ Pollut 1999:323–32.
Harris LK, Wilson JE, Elliott CA, Bishop AD, Tomlin KV. Henning transfer of DDT andmetabolites from fruit orchard soils to American robins (Turdus migratorius) twentyyears after agricultural use of DDT in Canada. Arch Environ Contam Toxicol 2000:205–20.
Haruhiko N, Yuko H, Masahiro K, Tetsuji N, Koji A, Shin-Ichi A, et al. Concentrations andcompositions of organochlorine contaminants in sediments, soils, crustaceans,fishes and birds collected from Lake Tai Hangzhou Bay and Shanghai city regionChina. Environ Pollut 2005;133:415–29.
Hassanin A, Breivik K, Meijer SN, Steinnes E, Thomas GO, Jones KC. PBDEs in Europeanbackground soils: levels and factors controlling their distribution. Environ SciTechnol 2004;38:738–45.
Hites RA. Polybrominated diphenyl ethers in the environment and in people: a meta-analysis of concentrations. Environ Sci Technol 2004;38:945–56.
INTA. Guía de pulverizaciones para los cultivos de manzano, peral, frutales de carozo yvid. Centro Regional Patagonia Norte, Estación Experimental Agropecuaria AltoValle; 2004 [132 pp.].
Isla F,Miglioranza KSB, Ondarza PM, Shimabukuro V,MenoneM, EspinosaM, et al. Sedimentand pollutants transport along the Negro River: Patagonia, Argentina. Int J River BasinManag 2011;8(3):319–30.
Kannan K, Battula S, Loganathan BG, Hong CS, Lam WH, Villenueve DL, et al. Trace or-ganic contaminantes including toxaphene and trifluralin, in cotoon field soils fromGeorgia and South Carolina, USA. Arch Contam Toxicol 2003:30–6.
Keith LH, Crummett W, Deegan J, Libby RA, Taylor JK, Wentler G. Principles of environ-mental analysis. Anal Chem 1983;55:2210–8.
Kurt-Karakus PB, Bidleman TF, Staebler RM, Jones KC. Measurement of DDT fluxes from ahistorically treated agricultural soil in Canada. Environ Sci Technol 2006;40:4578–85.
Kwan CS, Takada H, Mizukawa K, Torii M, Koike T, Yamashita R, Rinawati, Saha M,Santiago EC. PBDEs in leachates from municipal solid waste dumping sites in trop-ical Asian countries: phase distribution and debromination. Environ Sci Pollut ResInt. in press.
La Guardia MJ, Hale RC, Harvey E. Detailed polybrominated diphenyl ether (PBDE) congenercomposition of the widely used penta-, octa-, and deca-PBDE technical flame-retardantmixtures. Environ Sci Technol 2006:6247–54.
Leonard AW, Hyne RV, Lim RP, Leigh KA, Le J, Beckett R. Fate and toxicity of endosulfanin Namoi River water and bottom sediment. J Environ Qual 2001;30:750–9.
Liu M, Cheng S, Ou D, Yang Y, Liu H, Hou L, et al. Organochlorine pesticides in surfacesediments and suspended particulate matters from the Yangtze estuary. ChinaEnviron Pollut 2008;156:168–73.
284 K.S.B. Miglioranza et al. / Science of the Total Environment 452–453 (2013) 275–285

Author's personal copy
Mansingh A, Robinson DE, Henry C, Lawrence V. Pesticide contamination of Jamaicanenvironment. II. Insecticide residues in the rivers and shrimps of Rio Cobra basin,1982–1996. Environ Monit Assess 2000;63:459–80.
Matscheko N, Tysklind M, de Wit C, Bergek S, Andersson R, Sellstro m U. Application ofsewage sludge to arable land—soil concentrations of polybrominated diphenylethers and polychlorinated dibenzo-p-dioxins, dibenzofurans, and biphenyls, andtheir accumulation in earthworms. Environ Toxicol Chem 2002;12:2515–25.
Menone ML, Miglioranza KSB, Iribarne O, de Moreno JE Aizpún, Moreno VJ. The role ofburrowing beds and burrows of the SW Atlantic intertidal crab Chasmagnathusgranulata in trapping organochlorine pesticides. Mar Pollut Bull 2004;48:240–7.
Metcalfe TL, Metcalfe CD. The trophodynamics of PCBs including mono and non-orthocongeners in the food web of north-central Lake Ontario. Sci Total Environ 1997;201:245–72.
Miglioranza KSB, Aizpun J, Moreno V. Dynamics of organochlorine pesticides in soilsfrom a southeastern region of Argentina. Environ Toxicol Chem 2003a;22:712–7.
Miglioranza KSB, de Moreno JE Aizpún, Moreno VJ. Trends in soil sciences: organochlorinepesticides in Argentinean soils. J Soils Sediment 2003b;4:264–5.
Miglioranza KSB, Aizpun De Moreno JE, Moreno VJ. Land-based sources of marine pollution:organochlorine pesticides in stream systems. Environ Sci Pollut Res 2004;11:227–32.
Miranda-Filho KC, Metcalfe TL, Metcalfe CD, Robaldo RB, Muelbert MMC, Colares EP,et al. Residues of persistent organochlorine contaminants in southern elephantseals (Mirounga leonina) from Elephant Island, Antarctica. Environ Sci Technol2007;41:3829–35.
Nizzetto L, Cassani C, Di Guardo A. Deposition of PCBs in mountains: the forest filtereffect of different forest ecosystem types. Ecotoxicol Environ Saf 2006;63:75–83.
Ondarza PM, Miglioranza KSB, Gonzalez M, Shimabukuro VM, Aizpún JE, Moreno VJ.Organochlorine compounds (OCCs) in common carp (Cyprinus carpio) from Pata-gonia Argentina. J Braz Soc Ecotoxicol 2010:41–6.
Ondarza PM, Gonzalez M, Fillmann G, Miglioranza KSB. Polybrominated diphenylethers and organochlorine compound levels in brown trout (Salmo trutta) fromArgentinean Patagonia. Chemosphere 2011;83:1597–602.
Ondarza P, GonzalezM, Fillmann G, Miglioranza KSB. Increasing levels of polybrominateddiphenyl ethers (PBDEs), endosulfans, DDTs and polychlorinated biphenyls (PCBs) inrainbow trout (Oncorhynchusmykiss) following amega-flooding episode in theNegroRiver, Argentinean Patagonia. Sci Total Environ 2012;419:233–9.
Pereira RC, Martinez MCM, Cortizas AM, Macias F. Analysis of composition, distributionand origin of hexachlorocyclohexane residues in agricultural soils from NW Spain.Sci Total Environ 2010;408:5583–91.
Pesce SF, Wunderlin DA. Use of water quality indices to verify the impact of CórdobaCity (Argentina) on Suquía River. Water Res 2000;34:2915–26.
Peterson SM, Batley GE. The fate of endosulfan in aquatic ecosystems. Environ Pollut1993;82:143–52.
Rahman F, Langford KH, Scrimshaw MD, Lester JN. Polybrominated diphenyl ether(PBDE) flame retardants. Sci Total Environ 2001;275:1-17.
Sabljic A. QSARmodels for estimating properties of persistent organic pollutants requiredin evaluation of their environmental fate and risk. Chemosphere 2001;43:363–75.
Sabljic A, GustenH, Verhaar H, Hermens J. QSARmodelling of soil sorption. Improvementsand systematics of log Koc vs. log Kow correlations. Chemosphere 1995;31:4489–514.
Scholtz MT, Bidleman TF. Modeling of the long-term fate of pesticide residues in agri-cultural soils and their surface exchange with the atmosphere: part II. Projectedlong-term fate of pesticide residues. Sci Total Environ 2006;377:61–80.
Semple KT, Morris AWJ, Paton GI. Bioavailability of hydrophobic organic contaminantsin soils: fundamental concepts and techniques for analysis. Eur J Soil Sci 2003;54:809–18.
SongW, Ford JC, Li A,MillsWJ, BuckleyDR, RockneKJ. Polybrominated diphenyl ethers in thesediments of the Great Lakes. 1. Lake Superior. Environ Sci Technol 2004;38:3286–93.
Trapp S, Miglioranza KSB, Mosbaek H. Sorption of lipophilic organic compounds to woodand implications for their environmental fate. Environ Sci Technol 2001;35:1561–6.
UNEP. Stockholm Convention. http://chm.pops.int/Convention/POPsReviewCommittee/POPRCMeetings/POPRC6/tabid/713/mctl/ViewDetails/EventModID/871/EventID/86/xmid/2887/language/es-CO/Default.aspx2011.
UNEP-Chemicals. Stockholm Convention on Persistent Organic Pollutants, United NationEnvironment Programme. Available from:http://www.pops.int2004.
Walkley AC, Black A. Organic carbon. In: Black CA, editor. Methods of soil analysis.Madison WI: American Society of Agronomy; 1965. p. 1372–5.
Wania F, Mackay D. Tracking the distribution of persistent organic pollutants. EnvironSci Technol 1996;30:390–6.
Weber J, Halsall CJ, Muir D, Teixeira C, Small J, Solomon K, et al. Endosulfan, a globalpesticide: a review of its fate in the environment and occurrence in the Arctic.Sci Total Environ 2010;408:2966–84.
Wu L, Cheng M, Li Z, Ren J, Shen L, Wang S, et al. Major nutrients, heavy metals andPBDEs in soils after long-term sewage sludge application. J Soils Sediments2012;12(4):531–41.
Zhang ZL, Hong HS, Zhou JL, Huang J, Yu G. Fate and assessment of persistent organicpollutants in water and sediment from Minjiang River estuary, Southeast China.Chemosphere 2003;52:1423–30.
285K.S.B. Miglioranza et al. / Science of the Total Environment 452–453 (2013) 275–285