author(s) h. asonen, m. lindroos, m. pessa, p. prasad, r. …... · · 2018-02-17angle-resolved...
TRANSCRIPT

Author(s)H. Asonen, M. Lindroos, M. Pessa, P. Prasad, R. S. Rao, and A. Bansil
This article is available at IRis: http://iris.lib.neu.edu/physics_fac_pubs/356

Angle-resolved photoemission study of (100), (110), and (111)surfacesof Cuo 9Alo 1. Bulk and surface electronic structure of the alloy
H. Asonen, M. Lindroos, and M. PessaDepartment of Physics, Tampere University of Technology, SF 3310-I, Tampere 10, Finland
R. Prasad, R. S. Rao, and A. BansilDepartment of Physics, Northeastern University, Boston, Massachusetts 02I15
(Received 6 January 1982)
%C present angle-resolved photoemission spectra from the low-index faces of CuAl sin-
gle crystals using 16.85- and 21.22-CV radiation, together w'th the computed bulk elec-
tronic structure of the aHoy within the framework of the muffin-tin coherent-potential
approximation (CPA). The d-band complex of Cu is found to suffer shifts of less than
Q.1 CV on agoying, whereas thc states of s-p symmetry arc lowered in energy by as muchas on the order of 1 eV. The dispersion curve of the uppermost valence band is measured
and with the extrapolation of this curve to the Fermi energy (E~), the Fermi-surface radii
along two directions in the (100) mirror plane are deduced in Cu and CuA1. Gf theknown surface states in Cu, the (1OO) Tamm state persists in the alloy but the (111)Tamm state appears only as a weak shoulder in the alloy spectra. The Shockley-statebands persist on the (110)as weH as the (111)alloy face and are estimated to accommo-date approximately O.03 electrons/atom more in the alloy compared to Cu. The Shockleystates are lowered (in relation to E~) by 0.3—OA eV as a result of alloying but the Tammstates are lowered by less than 0.1 eV. Thc CPA computations are found to be in anoverall quantitative accord with the bulk measurements and these calculations also lead toa qualitative understanding of some of the experimental results concerning surface statesin the aHoy.
I. INTRODUCTION
Angle-resolved photoemission spectroscopy(ARPES} has contributed significantly to theunderstanding of the surface and bulk electronicstructure of perfect crystals. ' The technique isnow developed to the point such that it is possibleto determine the energy of an individual occupiedBloch level directly and, in fact, such "experimen-tal" valence-band structures within 5 —10 CV ofthc Fcrnll cllcrgy llavc bccll obtalllcd fol' R llulllbcrof transition and noble metals.
Although the angle-integrated experiment hasbeen used extensively to study disordered alloys,the application of the angle-resolved technique inthis connection is quite recent. Only limitedARPES measurements on CuNi (Ref. 3},AgPd(Ref. 4), and CuAI (Refs. 5 and 6) solid solutionshave been reported to date in the literature. Itshould be noted that preparing and cleaning alloysingle crystals, necessary for ARPES, normallypresents metallurgical difficulties. For example,often during the anneal-sputter cleaning procedure,
annealing causes surface enrichment whereas subse-quent sputtering results in an amorphous state.Furthermore, it is only during the last few yearsthat the theoretical understanding of a disorderedalloy has advanced to the stage where rehable pre-dictions concerning the bulk electronic structureare possible within the framework of the averaget-matrix (ATA) alld thc co11clcnt-potclltlal (CPA)approximations. The corresponding treatment oftllc muffllll-till alloy surface (Rlso lllvolvcd 111 thcphotoemission process) is largely undeveloped atthis time, although a good deal of progress towardsunderstanding the surface electronic structure ofperfect d-band metals has been made.
In this paper we present angle-resolved uv mea-surements on the low-index faces of CttA1 singlecrystals with a nominal concentration of 10 at. %Al. Our focus is on delineating the characteristiceffects on the bulk and surface electronic structureof Cu resulting from the addition of impurities.CPA computations of the complex-energy bands inthe alloy are presented and used to interpret the ex-perirnental results. The choice of CuA1 was

ASONEN, I.INDROOS, PESSA, PRASAD, RAG, AND BANSII.
motivated by the facts that the host metal Cu hasbeen studied extensively via ARPES ' and CuAlbelongs to the important dass of Hume-Rotheryalloys. Also, the CvAl crystal permitted particu-larly easy cleaning by Ar+-ion bombardment andannealing,
An outline of this paper is as follows. Section IIdescribes the sample preparation and other experi-
mental aspects. Section III gives an account of therelevant theoretical details. Section IV presents
and discusses the angle-resolved spectra from (100),(110),and (111}faces of Cu and CuAI. The bulk
and the intrinsic surface states are considered,Icspcctlvcly, 111 Secs. IV A Rlld IV 8.
Bcforc sufillllarlzlIlg oui prlilclpal conclilsiolis,we note that the Cuo 9A10 ~ crystals showed a de-
gree of surface enrichment. More specifically, theAuger measurements prefer a surface concentrationof 13 at. % Al. For this reason and the 'fact thatthe photoemission experiment is surface sensitive,we have considered a number of theoretical results
for 13 at. % Al, in addition to the bulk computa-tions on the 10 at. % Al alloy. The calculationsfor 13 at. % Al are more appropriate for compar-ing the theoretical predictions with observations,especially in those instances where the effects of al-
loying vary strongly as a function of the impurityconcentration. This, in fact, turns out to be thecase for the spectral features associated with thestates possessing primarily an s-p character (e.g.,the conduction bands and the Fermi-surface di-
mensions). In contrast, the differences between thepredictions of the 10% and 13% computationswith regard to the d-like states are relatively small-
er and unimportant within the context of this arti-cle.
In connection with the bulk states, the k valuescorresponding to the well-defined peaks in Cu andCmA1 spectra were determined by using the tri-angulation (energy coincidence) method discussedin Ref. 11. Therefore, the theoretical and experi-mental level shifts could be compared directly fora number of initial states. [The discussion of dis-order smearing of levels would, in general, requirethe computation of photoemission intensity profiles(excepting isolated instances}, and is consideredbeyond the scope of this article. ] Our conclusionis that the RI-like states of Cu experience shifts ofless than 0.1 eV. In contrast, the levels of s-p sym-
metry are lowered by as much as on the order of 1
cV with respect to the Fermi energy.Since only two incident uv frequencies were used
to induce clcctI'on cImssion, It was not possible toprobe thc uppermost valence band along the high-
syIQmctry directions, presumably duc to the nona-vailability of final states; the dispersion curve inthe (001) mirror plane could, nonetheless, be mea-sured and, by its extrapolation to the Fermi ener-
gy, the Fermi-surface radii in Cu and CuA1 werededuced along two different directions in eachcRsc. Tlils, to ollr knowledge, ls tllc f list applica-tion of ARPES as a Fermi-surface caliper in met-als and alloys. These results, despite their prelimi-nary nature, point to the considerable potential ofARPES in this regard.
Turning to the surface electronic structure wefind„ in accord with earlier measurements, intrinsicstates of Tamm-type on the (100) and (111) facesand of Shockley-type on the (110) and (111)facesin Cu. The aforementioned surface states arefound to persist in the alloy. We associate a lower-
ing of 0.3 to 0.4 eV in the position of the Shockleystates (in relation to E~), with the effect of alloy-
ing; this is substantially greater than the corre-sponding shift (lowering) of 0.05 —0.01 eV for theTamm states. The dispersion of the Shockley-state bands on the (110) and (111)faces was mea-sured as a function of k~~ and found to be essen-
tially parabolic. On this basis, we estimate thatboth the (110) and (111)bands accommodate ap-proximately 0.03 electrons/atoms more in the alloy
compared to Cu. Many of the preceding observa-tions can be understood, at least qualitatively, interms of the bulk electronic structure of the hostIlletal and thc alloy. Such an analysis 18 presentedand used to gain insight into the characteristic dis-order effects as far as possible.
Thc cxpcriIQcnts werc carried out on a VGscientific ADES 400 spectrometer capable of x-rayphotoemission, Auger electron (AES), uv-
photoemission, and low-energy electron diffraction(LEED) measureme~ts. The present uv spectrawerc obtained at an angular resolution of 3 to 4full opening of the electron beam cone and an en-
ergy resolution of approximately 40 meV. A rare-
gas discharge lamp producing He I (21.22 eV} andNcI (16.85 cV) resonance lines was used to induceclcctron cImssion.
The CuA1 alloy single crystals were grown from99.999% pure Cu and 99.999% pure Al with theaid of the Bridgman method. The orientation ofthe crystals along the various symmetry planes wascharacterized by Laue diffraction. The composi-tion was determined by x-fay Imcroprobc analysis

to be 10 at. % Al with an error of +0.2 at. %. Noinhomogeneities were found in the x-ray mi-croanaiysis within the limit of resolution (-1 pm)of the method. We emphasize that the Cu alloyscontaining less than 9 at. % Al have been shown topossess little, if any, short-range order' and that aperiodic (superlattice) structure appears in smalldomains at the much higher concentration of 17at. % Al. ' Therefore, it is reasonable to assumethat our samples, containing 10 at. % Al, are sub-stantially disordered, although we did not investi-gate possible short-range ordering effects. In par-ticular, the comparison of our experimental resultswith the random alloy computations is a meaning-ful one.
The crystals were polished mechanically andelectrochemically and cleaned in situ by repeatedcycles of heating at 720 K for 15 to 30 min fol-lowed by argon-ion bombardment with (600—1000}-eVbeam energy for 1 to 20 min at a time.The base pressure of the spectrometer was typically5 X 10 Pa. The crystal structure and the compo-sition of the surface were monitored, respe:tively,via I.EED and AES measurements. The (100) and(110) surfaces of the alloy were easy to clean; uponannealing the Al content in the surface, as deter-mined by the AES measurements, was approxi- .
mately equal to 13 at. %. The I.EED spectra fromthese surfaces yielded sharp (1 & 1) patterns indicat-ing that these surfaces were clean and perfect.Thus annealing the samples at the end of thecleaN1ng procedure did Qot cause sny spprcclablcchange in the composition or the crystal structureof the (100) and (110) surfaces. In contrast, thecomposition and the crystal structure of the (111)surface was affected considerably by annealing andsputtering. I.om-energy AES and I.EED studiesshowed that the annealed (111)surface containedapproximately 30 at. % Al and exhibited a(v 3&(v 3) R30' Al overlayer structure. This sur-face could be converted to the normal (1&(1}con-figuration by 600-CV Ar+-ion bombardment for2.5 min. This procedure also reduced the Al con-tent in the surface region to approximately thebulk value.
Since the theoretical discussion of disorder ef-fects in this article centers primarily around thenature of the complex energy bands in CuA1, anoverview of such computations in alloys is ap-propriate here. For a detailed discussion of the
muffin-tin CPA and ATA formalisms we refer thereader to the literature. '
The single-site approximations, such as the ATAand the CPA, amount to replacing the random al-loy by sn cqu1vslcnt ordcled crystal of suitablychosen effective atoms. In particular, the quasi-particle spectrum is given by the secular equa-tion '
i iterr'(8) —8(k,E) i i=0,
where the determinant is understood to be in theangular-momentum space. Here, t,rr(E) denotesthe matrix of the on-the-energy-shell elements ofthe effective atom and 8(k,E}is the matrix of thefamihar Korringa-Kohn-Rostoker (KKR) structurefunctions. In the alloy A„81,the ATA wouldcorrespond to the simple choice
whllc flic CPA scattering 111atflx t Blllst be ob-tained by numerically solving the CPA self-consistency equation. Since the CPA treats thedisorder self-consistently, it is generally believed tobe s better approximation than the ATA. Howev-er, we note that the ATA, despite its simplicity,captures much of the dominant physics of disordersnd 1s kno%'Q 1Q many cases to bc sn adcqustc ap-proximation. "
For a Perflx:t 2 or 8 crystal, r,rr~tz or ta andEq. (1) reduces to the usual KKR equation. Equa-tion (1) thus provides a simple conceptual basis forthe band theory of random alloys. In practice, it isconvenient to fix the value of the wave vector kand solve (1) for E(k). These solutions are real ina perfect crystal but become complex in an alloy,mth the imaginary part representing disordersmearing of the quasiparticle states.
The muffin-tin potentials for Cu and Al used inthe present calculations were generated on the basisof the Mattheiss's overlapping charge-densitiesprescription. ' The atomic configurations of3d' 4s and 3s p' &vere employed for Cu and Al,respectively. In both cases, the Herman-Skillmancharge densities were overlapped on an fcc latticeof lattice constant 6.8309 a.u. The Cu muffin-tinpotential is identical to that used in Ref. 21. Theeffects of lattice expansion were incorporated as inRef. 18. The alloy muffin-tin zero was semiem-pirically raised by 0.08 Ry from its average valueof —1.1970 Ry 111 Cuo 9Alo 1', tliis ylcldcd a goodagreement between the computed and the measuredchanges (between Cu and Cuo 9A10 1) in the ener-
gy of the transition corresponding to the edge in

7078 ASONEN, LINDROOS, PESSA, PRASAD, RAO, AND BANSIL 25
8. ~ » ~E ~ ~ ~ ~ »
F
C9KLLI
Ld
4-
2-x,
W K X
FIG. 1. Complex energy bands in Cu09A10 & along the principal symmetry directions in the Brillouin zone, excludingthe effects of lattice expansion (see Ref. 26). The vertical length of shading around the bands equals two times the ima-
ginary part of the complex energies. The energy zero is taken to be —1.1497 Ry, which is the muffin-tin zero for Cu.
the ei spectrum (i.e., the vertical transition fromthe top of the Cu d bands to EF). We emphasizethat such relatively small adjustments in the poten-tials are generally expected to be necessary in thefirst-principles band theory of alloys. ' ' All com-putations are based on the use of l &2 pure-constituent phase shifts. To evaluate the KKRstructure functions B( k, E) efficiently, interpola-tions in k and E were employed.
IV. RESULTS
Figure 1 shows the CPA complex-energy solu-
tions of Eq. (1}for Cue 9A10 i in the vicinity of theFermi energy. This underlying alloy spectrum will
be used frequently in this section to interpret ourexperimental results.
A. Bulk electronic structure
The spectra for emission normal to the (100)face are displayed in Fig. 2. The energy bands inCu along the I'-X syinmetry line (relevant foranalyzing these spectra) together with the changesin these bands due to the addition of 10 at. % Alare also shown.
Figure 2(a) shows that, aside from an increasedsmoothing of the structures in the alloy spectra,the Cu and CuA1 spectra are remarkably similar.Note that, in view of Fig. 2(b) and Fig. 1, in the
energy range of 2 to 4 eV below EF (where thespectra are localized), we are primarily probing theCu d-band complex. The experimental observa-tions therefore imply that the Cu d bands sufferlittle shift on alloying. This is in accord with thetheoretical predictions of Fig. 2(c). b,i and hsbands, which are d-like, are seen to experienceshifts on the order of 0.1 eV; this is also true ofthe 6i band, except after it develops a significants-p admixture.
The preceding conclusions were further con-firmed by determining the k value correspondingto the most pronounced peak in each of the spectraof Fig. 2(a). The triangulation method permittedthis determination without any auxiliary assump-tions on the band structure. i7 Figure 2(b) showsthat the absolute agreement between the measuredand calculated levels in Cu is within a few tenthsof an eV, as is to be expected for the first-princi-ples computations in the d-band metals. Since ourfocus is on delineating the disorder effects, we didnot attempt to invoke a semiempirical adjustmentin the position of the Cud bands or use a differentCu potential. The shifts in the levels due to theaddition of impurities are generally insensitive tosuch uncertainties, and indeed Fig. 2(c} shows thatin this regard the theoretical predictions are ingood accord with the observations. In particular,the magnitudes of the measured level shifts in Fig.2(c) are quite small, as anticipated above for thed-like states.
Figures 3 and 4 summarize our results for the

707925 ANGLE RESOLVED PHOTOEMISSION STUDY OF {100),. . .
I I I I I 1 I I I I I II I I I I
I{r~ = 16.85ev) (g)I
(b)0.3-
(c)
-0.3——X2
0 -IO
LIJ
O-l -a.oLIJCQ
~ "12KLIJ
-3.0LU
r,25'
-4.0
0.6—0tlP
0-X5
X~ UJ
LIJ -0.6—Z'
I-Li
~ 4
(/) 0 3-
0- 0.3—
—X5
-5,0 E; {eV) 0{=EF)
r bandsnormal emission from the Cu{100) and CuAl{100) surfaces. (b) Energy an sh ed k' hsses ive the E-k values corresponding to e mosof Cu along the I -X direction. The crosses give e
t the~
k~
and E uncertainty. (c)vertical bars on the crosses represen eCu(100) spectra of (a); the horizontal and vedition of 10 at. % Al. For the meaning ofTheoretically computed shift for eac och of the Cu bands of (b) due to the ad ition o a . o
determined level shifts. Note that all curves in c g'in (c) iveshading see caption to ig.F' 1. Crosses represent experimentally determine eve
changes with respect to EF.
(110) and the (111)faces, respectively. Much othe discussion presented above in connec
'nnection with
Fi . 2 for the (100) surface is also applicable tothese figures with obvious modifications. The nor-
mal emission spectra in Figs. a and 4(a) are seen
to oe ric er in sbe'
h'
structure than those of Fig. 2(a.Therefore, a larger number of E vs k points coube determined experimentally along the U-X and
I I I I I I I I I I I I I I a
I{5~= 16.85eV) {a)I
I
CuAl {110)I
I
I
hler) = 21.22eV)
I
CuAl {110)I
I
I
I
I
Cu {110)I
I
-I.O—
-2.0) Up0)
UgLIJ
UpO -3.0—LLI
Q3
CL
~-4.0—z'LIJ Ul
Ul
-50
(b)
Sp
0.3— (c)
0.3—Sg0- —X 2.~ -O.3-
~ 1
& 0.3'-(3
0—~ -O3-
~ lt
0.3—LIi(/)
S~. -- X5
sU
X
-03-
0.3-
0- SqX
-0.3—
+ ' -O3--5.0 E; {eV)
X U X
e t that this figure displays results for the (110) surface. ExperimentalFIG. 3. Same as the caption to Fig. 2, except that t is igure ispspectra are for emission normal to the (110) surface.

ASONEN, I.INDROOS, PESSA, PRASAD, RAO, AAND BANSIL
&- ~e(3K~~ -S.oUJ
|as
-OQ-
OP
0.3-
Lt KLq LLj
Z' -G.5-Ld
Z
] 0.5-4
0CO
c
f L-5.0 E; feV) OtEF)
2 exce t t a is' r the {111)surface. Experimental
' . 2 exce t that this figure displays results for the {FIG. 4. Same as the caption to Fig. 2, except t a isspectra are for emission norm al to the {111)surface.
( ( j ) 1 ( ~ 1 i 1
h(s) = 21.22eV
1 )
-2 -] 9E; feV)
~~ gl l ) l l
-3 -2E; feV)
FIG. 5. Angle-resolved spectra fromom the Cu{100) andCuAl{100) surfaces for 21.22-eV radiation. 8 denotesthe emission ang e wiI 'th respect to the surface normal.
0
the I'-I. directions. [The structure at approxlmate-F' 4( ) arises from a surface state
and is considered in Sec. IV 8 below. ] Figureslearl that the Cud-2—4 taken together show clear y a
states are virtually unaffected y the addition othroughout the Brillouin zone.
fSo ar we have dealt primarily with the states oAs noted in the Introduction, we wered character. s no
s- -t e statesunable to probe experimentally the s-p-type s es
along the pfiilcipal symmetry dil'cctlons, Rppafcilt-bccausc tllcfc Rfc 110 final s'tates Rvallablc of
direct transitions at the t%'o exciting q
ly because crcfre uencies
le~el shifts Rnd disorder smearings are predjctedtheoretically for the levels of s-p symmetry. Fol
b 0.6example, Xq is lowered (with respect to Ez) yV [» 2(c)] ~«1 by09cV [Fig 4(c)l.
With this motivation the off-normal emifor the (100) face were also investigated. Itspectra or t c
crmosth bee shown previously that the uppermfilled band of s-p symmetry in Cu can be sa pln this %ay ln cth (001) mirror plane [i.e., the (001)
~ ~
plane p$881ng rothrough the center of the Bril ouin(BZ)]. Figure 5 displays representativezone
21.22-eV spectra and shows the presencC11CC Of Stfuc-tures above the d-band edge. The E-k values for
Rk in all the 21.22-eV and the 16.85-CV'an ula-spectra (not shown) were obtained by the triangu s-
hod. The results are shown in Fig. , to-gether with the corresponding calculated ban s
'
u and CHAI. As noted in the Introduction, the13% calculation is more relevant in this cdue to the observed surface enrichmen inent in the alloysamp cs. Q c1 0 the whole, we conclude from Figs.
) 3(c) 4(c), and 6 that the addition o 1 oowers - ' E b as muchlowers the s-p levels in relation to ~ y
as on the order of 1 eV.ed E-F' aB present in Fig. 7 aB the measured
k points in the (100) mirror plane. The corre-
25 ANGLE-RESOLVED PHOTOEMISSION STUDY OF (100), . . . 7081
DLLI - I.o-Q3
—2.0
Cu (expt)Cu AI (expt)
Cu (Theory)
Cuo c) AloI
( Theory )
Cup eyAIO IQ(Theory )I ~ I
I.O
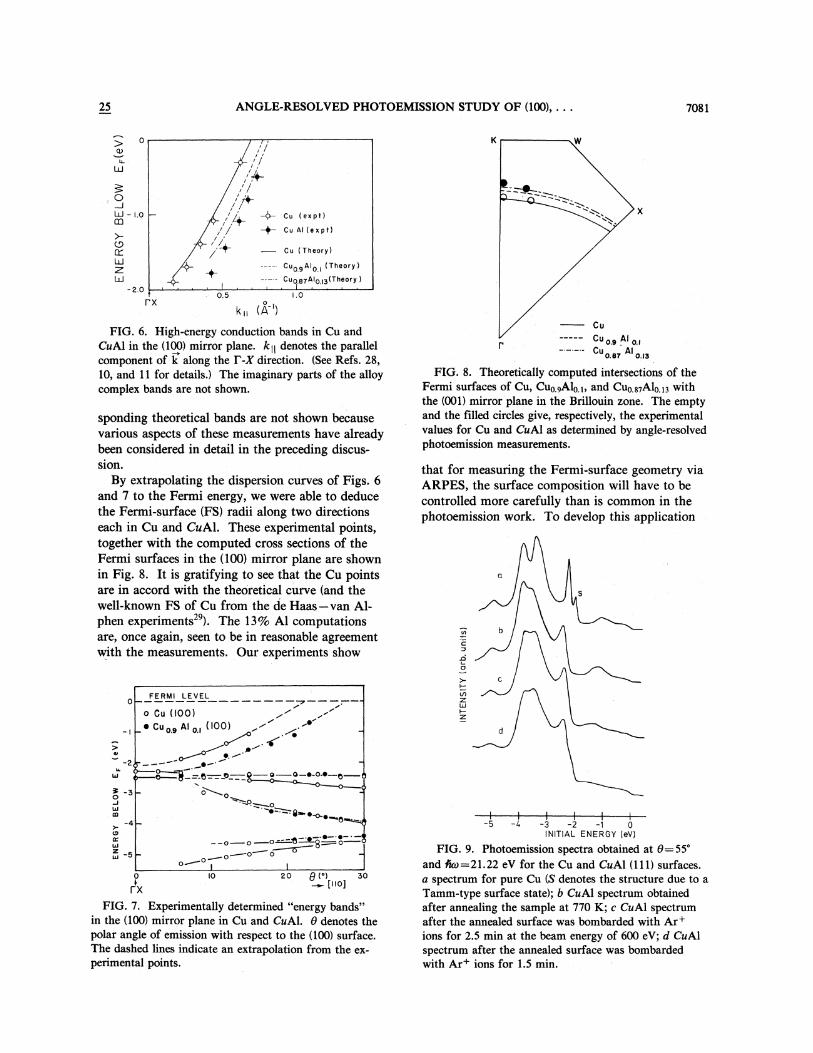
FIG. 6. High-energy conduction bands in Cu andCuAl in the (100) mirror plane. k~~ denotes the parallelcomponent of k along the I -X direction. (See Refs. 28,10, and 11 for details. ) The imaginary parts of the alloycomplex bands are not shown.
sponding theoretical bands are not shown becausevarious aspects of these measurements have alreadybeen considered in detail in the preceding discus-s2on.
By extrapolating the dispersion curves of Figs. 6and 7 to the Fermi energy, we were able to deducethe Fermi-surface (FS) radii along two directionseach in Cu and CuAl. These experimental points,together witll tllc coIllputcd closs scctlolls of thcFermi surfaces in the (100) mirror plane are shownin Fig. 8. It is gratifying to see that the Cu pointsare in accord with the theoretical curve (and thewell-known FS of Cu from the de Haas —van Al-phen experiments ). The 13% Al computationsare, once again, seen to be in reasonable agreementwith the measurements. Our experiments show
I" Cuoo AI 0,Cu Al
FIG. 8. Theoretically computed intersections of theFermi surfaces of Cu, Cup 9Alp i, and Cup 87Alp ]3 withthe (001) mirror plane in the Brillouin zone. The emptyand the filled circles give, respectively, the experimentalvalues for Cu and CuAl as determined by angle-resolvedphotoemission measurements.
that for measuring the Fermi-surface geometry viaARPES, the surface composition will have to becontrolled more carefully than is common in thephotoemission work. To develop this application
III
C
J3Ia
FERMI LEVEL0o C~ (IOO)+ Cuo Al 0, (tOO)
o.~C— =Q—0—0—0—0— OO 0
'-p~p
-2LLI
O
tLIC3
CPKLajK 5
~ O~'0-'p p~p -U
p~pO~I
20 8 (')tIIO]
0 lo 30r'x
FIG. 7. Experimentally determined "energy bands"in the (100) minor plane in Cu and CuA1. (9 denotes thepolar angle of emission with respect to the (100) surface.The dashed hnes indicate an extrapolation from the ex-perimental points.
I I I I II I I I-5 -4 -3 2 ) O
INITIAL ENERGy Iev)
FIG. 9. Photoemission spectra obtained at 8=55'and Ac@=21.22 eV for the Cu and CuA1 (111)surfaces.a spectrum for pure Cu (S denotes the structure due to aTamm-type surface state); b CuA1 spectrum obtainedafter annealing the sample at 770 K; c CuA1 spectrumafter the annealed surface was bombarded with Ar+ions for 2.5 min at the beam energy of 600 eV; d CuA1spectrum after the annealed surface was bombardedwith Ar+ ions for 1.5 min.

ASONEN, I.INDROOS, PESSA, PRASAD, RAG, AND SANSB.
of ARPES fully, the use of synchrotron source forinducing electron emission will also be necessary.
B. SUffacc clcctromc structure
Tamm-type states which are known to exist onthe (100) and (111)faces of Cu are consideredfirst. The (100) surface state persists in CuA1 attllc M symmetry polllt of thc sllrfacc Brlllolllllzone (SBZ). A detailed discussion of the level shiftand the disorder smearing of the (100) Tamm statein CuAI has already been presented in Ref. 6; thissurface state will therefore not be considered fur-ther here. The (111)Tamm state, which was re-ported to bc abscIlt 111 Rcf. 5, ls collsldcl'cd 111
greater detail. Figure 9 shows the relevant spectrafrom Cu and several alloy single crystals with dif-ferent surface treatments. Although the (111)Tamm state is seen clearly in Cu (curve tI), lt ls
only discernible as a weak shoulder around —2.1
eV in one of the alloy samples. (See curve d inFig. 9; the details of this curve are shown in Fig.10.) The close proximity of the bulk features, to-
gether with the broadening of the peaks due tovarious mechanisms (e.g., disorder, natural
linewidth, surface defects, etc.) is probably respon-
sible for the fact that the (111)Tamm state is notwell resolved in the alloy spectra.
Figure 10 indicates that the (111)Tamm state is
I 1 1 1 I i I I I, I I I
-2.80 -2,60 -2.4 -2.20 -2.00 -&.8D -&.60
ENERGY (e V)
FIG, 10. The details of the curve d in Fig. 9.
shifted to a higher binding energy by somewhatless than 0.1 eV. We have shown previously thatthe corresponding shift for the (100) Tamm stateamounts to 0.08 CV. %C conclude then that a shiftof & 0.1 CV represents a characteristic effect of al-
loying on thc Tamm states 1Q CU.
The Shockley-type states are considered now.Such states, which are known to exist on the (110}
.and (111)faces of Cu (Ref. 31}were found to per-sist on the corresponding alloy surfaces in CuAI.On the (111)surface, the Shockley state is localizedat I p01nt 1Q thc SBZ, and 1s scen 1Q thc normalemission spectra of Fig. 4. The spectra of Fig. 11further clarify the nature of this state. In partic-ular the bottom of the surface-state band is seen tobe lower by 0.4 eV for (1X 1}CuAl and by 0.8 eVfor v 3)&V 3 CuAI in comparison to Cu(111). Thesensitivity of this state to surface conditions is thusobvious. To isolate disorder effects, it is useful toconsider the Shockley states associated with the(110) surfaces of Cu and CuAI (see Fig. 12). Asemphasized in Sec. II, the (110) surface in contrastto the (111)alloy surface does not exhibit any ap-
preciable changes in the structure or the composi-tion on annealing. The dispersion curves of Fig.12 show that the bottom of the related surfacestate band (centered at I'in the SBZ, is lowered by0.33 CV by alloying. This is in good accord with
the aforementioned shift of 0.4 eV for the (1&(1)CuAl(111) surface. It is reasonable therefore toconclude that the Shockley-type states are lowered
by 0.3 to 0.4 CV on adding 13 at. % Al and thatthis shift represents a characteristic alloying effect.
Since the Shockley states are positioned within
thc gaps ln thc bulk band structuI'cs thc observed
movements 1Q thc1r positions can bc undclstoodqualitatively in terms of the host and the alloybulk electronic structures. The gaps of interest inthe present case arise from the mixing of states
possessing primarily an s-p character te.g., the I.zto 1.1 gap which is relevant for the (111)Shockleystate]. Therefore, the associated surface stateswould also possess a significant s-p character andthe changes in the energy of the bulk states of this
symmetry would be reflected in the correspondingchanges in the surface states. We calculate the L2and I i lcvcls to bc lowered by 0.9 and 1.4 cV,respectively, in Cu09A101 in relation to Cu (Ref.33); the average shift of 1.15 eV thus obtained is tobe compared with the observed value of 0.3—0,4CV.' The discrepancy may be related to the factthat a surface atom possesses a smaller number ofnearest neighbors compared to a bulk atom, and
the surface states may therefore be expected to ex-

ANGLE-RESOLVED PHOTOEMISSION STUDY OF (100), . . .
II ~ Ili ~ Illlll ll)II III I I ~ Ill I Ill lllllll1 I)IIllllllllllllll I llill IllI I I I I I I I I I I I I I
SURFACE STATE DlSPERSION FOR Cu {111}AND CuAl{111)
CX)cx
(c)/~'
~ ~
l
I
l
t
!
s!
I
l
!
s !
LT
I
l
I
j
) I I I I I I I I I ) I I I I I I I I I I I I I I I I I I I I I I 'I I I I I I ~I I I I I ~ I I I I I I I
-5 -0 -3 -2 -1 {)INITIAL ENERGY (e V)
I I
0.3 0.2 0.1I I I
0 0,1 0.2 0.3r k, (E')
FIG. 11. Normal emission spectra using 16.85-eV radiation from (111)faces of (a) Cu; (b) &3Xv 3 CuA1 with ap-proximately 30 at. /o surface concentration of Al, and (c) (1X1)CuA1 with approximately 10 at. %%uosurfac econten t ofAl. (S denotes the structure due to a Shockle -type surface state. ) (d) The dispersion curves for the Shockley-statebands for Cu(ill), (1X1) CuAl(111), and ( 3XV 3) CuAl(111).
39'36'
I—
01—
4J{
30o
2lo 0.8 1.0
35o
33o
31o
29o2725o23'
I
-1.0 E; {e'))t} 0 {EFI 0.6I Ii I I
0.8 1.0
4)) {A }
FIG. 12. Angle-resolved spectra from the (110) sur-face in (a) Cu, and (b) CuA1, for various polar angles (8)of emission using the 16.85-eV radiation. The disper-sion curves for the Shockley-state peaks in (a) and (b)are plotted in (c) and (d) for Cu(110) and CuA1(110),respectively.
perience smaller level shifts compared to therelevant bulk states.
By assuming an isotropic parabolic shape, wehave estimated the total number of electrons in theShockley-state bands of Figs. 11 and 12. On thisbasis, we obtain the following occupation numbers(in units of electrons/atom): Cu(111)=0.045,(1X1)CuA1(111)=0.075, (v 3Xv 3) CuA1(111)=0.110, Cu(110)=0.070, and CuAl(110) =0.100.By comparing Cu and CuAl both the (110) and(111)bands are seen to accommodate 0.03electrons/atom more in the alloy [using the (1X1)CuA1(111) data]. These results show that, as in thecase of level shifts considered in the precedingparagraph, the changes associated with alloying forthe Shockley states on the (110) and (111)faces aresimilar.
As indicated in the Introduction, the question ofdisorder smearing is generally considered beyondthe scope of this article. Nonetheless, it isnoteworthy in connection with Fig. 11 thatbroadening of the spectral features can be sensitiveto the surface treatment. A comparison of thecurves labeled (b) and (c) in this figure reveals, forexample, that the bombarded surface showsfeatures that are broader even though this surfacecontains less Al. This phenomenon is not related

7084 ASONEN, LINDROOS, PESSA, PRASAD, RAO, AND BANSIL 25
to disorder-induced smearing but is more likely aresult of the crystal defects introduced by bom-bardment. A similar effect of the crystal imperfec-tions was found earlier in photoemission fromAgPd single crystals.
Finally, we note that we have found an unex-
pected spectral feature at —4.65 eV in emissionfrom the alloy samples. This feature is not presentin Cu and is clearly visible in the (100) and (111)CuA1 spectra in Figs. 2 and 4. The fact that thisfeature exhibits no clear dispersion as the emissionangle or the incident frequency is varied makes itunlikely that it is associated with the bulk Bloch-type states. Furthermore, this feature is seen inthe spectra of the overlayer as well as the normalsurface and survives after oxygen absorption and
gentle Ar+-ion bombardment. For these reasons itis also unlikely to be associated with a surfacestate, even though it does lie energetically withinthe s-d hybridizational gap in the 1"-L and I -J
directions in the alloy. As emphasized in Ref. 15,the energy spectrum of the alloy will in generalcontain non-Bloch-type contributions from thecomplex impurity levels associated with a singleCu or Al atom placed in the effective medium.This possibility was investigated but no suchtheoretical single impurity levels were found in therelevant energy range. Perhaps the observed spec-tral feature around —4.65 eV is related to theproperties of clusters of more than one atom in thealloy.
ACKNOWLEDGMENTS
We thank Mrs. Paula Huttunen for her assis-tance in the experiments. Financial support fromthe Academy of Finland and the U. S. Departmentof Energy is acknowledged.
N. V. Smith, in Photoemission in Solids I, edited by M.Cardona and L. Ley (Springer, Berlin, 1978), p. 237.
2D. E. Eastman and F. J. Himpsel, in Physics of Transi
tion Metals, 1980, edited by P. Rhodes {Institute ofPhysics, Bristol, 1981), p. 115.
3P. Heimann, H. Neddermeyer, and M. Pessa, Phys.Rev. B 17, 427 (1978); P. Heimann, J. Hermanson, H.Miosga, and H. Neddermeyer, Solid State Commun.
37, 519 (1981).4M. Pessa, H. Asonen, M. Lindroos, A. Pindor, B. L.
Gyorffy, and W. Temmerman, J. Phys. F 11, L33(1981).
5H. Asonen and M. Pessa, Phys. Rev. Lett. 46, 1696(1981).
M. Pessa, H. Asonen, R. S. Rao, R. Prasad, and A.Bansil, Phys. Rev. Lett. 47, 1223 (1981).
7A. Bansil, Phys. Rev. Lett, 41, 1670 (1978};G. M.Stocks, W. M. Temmerman, and B. L. Gyorffy, Phys.Rev. Lett. 41, 339 (1978).
W. Kohn, Phys. Rev. B 11, 3756 (1975};N. Kar and P.Soven, ibid. 11, 3761 (1975).
The question of the existence of surface states on
Cuo 9Alp i(111) was discussed in Ref. 5, which report-ed that the Cu(111) Shockley state persists in the alloywhereas the Cu(111) Tamm state does not. The ob-
servation of the Tamm-type surface state on theCuo 9Alp i(100) face was reported in Ref. 6.M. Lindroos, H. Asonen, M. Pessa, and N. V. Smith,Solid State Commun. 39, 285 (1981).M. Pessa, Solid State Commun. 39, 605 (1981);E. O.Kane, Phys. Rev. Lett. 12, 97 (1964); P. O. Nilssonand N. Dahlback, Solid State Commun. 29, 303(1979).
M. S. Wechsler and R. H. Kernohan, J. Phys. Chem.Solids 7, 307 (1958); Acta Metall. 7, 599 (1959).
'3J. B. Andrews, R. J. Nastasi-Andrews, and R. E.Hummel, Phys. Rev. B 22, 1837 (1980).
~4For recent discussions and further literature citationson the subject of muffin-tin alloys, see Refs. 15through 17. An early review is to be found in Sec. IXof H. Ehrenreich and L. Schwartz, in Solid StatePhysics, edited by H. Ehrenreich, F. Seitz, and D.Turnbull (Academic, New York, 1976), Vo1. 31.
' A. Bansil, Phys. Rev. B 20, 4025 (1979); 20, 4035(1979).
' P. E. Mijnarends and A. Bansil, Phys. Rev. B 19, 2919(1979); A. Bansil, R. S. Rao, P. E. Mijnarends, and L.Schwartz, ibid. 23, 3608 (1981).
' J. S. Faulkner and G, M. Stocks, Phys. Rev. B 21,3222 (1980); B. E. A. Gordon, W. E. Temmerman,and B. L. Gyorffy, J. Phys. F 11, 821 {1981).
' A. Bansil, H. Ehrenreich, L. Schwartz, and R. E.Watson, Phys. Rev. B 9, 445 (1974).L. F. Mattheiss, Phys. Rev. 133, A1399 (1964).
20F. Herman and S. Skillman, Atomic Structure Calcula-tions (Prentice-Hall, Englewood Cliffs, New Jersey,1963).
2&R. Prasad, S. C. Papadopoulos, and A. Bansil, Phys.Rev. B 23, 2607 (1981).
2 See, in particular, footnote 40 of Ref. 21. With theaddition of 10 at. %%uoA 1, th e lattic econstan t of Cu in-creases by 0.67+o.R. J. Nastasi-Andrews and R. E. Hummel, Phys. Rev.B 16, 4314 (1977).The Brillouin-zone integrations, necessary for solvingthe muffin-tin CPA equation, were carried out by us-

25 ANGLE-RESOLVED PHOTOEMISSION STUDY OF (100), . . . 7085
ing the special directions method; the set of 21 specialdirections was employed (see Ref. 25 for details). Theparameters for interpolation of the KKR structurefunctions (in k and E) are identical to those used inRef. 15.
25R. Prasad and A. Bansil, Phys. Rev. B 21, 496 (1980).The effect of lattice expansion is not included in thecomplex-energy bands of Fig. 1. In actual compar-isons with the experiments, however, the appropriatelycorrected values are used throughout this article; inparticular, this is true of the theoretical curves inFigs. 2—4, 6, and 8.
2~Within the experimental error, the k value for each ofthe exciting frequencies was found to be the same forCu and CuA1.Note that these k points do not lie on a straight linein the Brillouin zone. For details, see Refs. 10 and11.
~~M. R. Halse, Philos. Trans. R. Soc. London, Ser. A265, 507 (1962).
P. Heimann, J. Hermanson, H. Miosga, and H.Neddermeyer, Phys. Rev. Lett. 42, 1782 (1979); Phys.Rev. B +, 3059 (1979).P. O. Gartland and B.J. Slagsvold, Phys. Rev. B 12,4047 (1975); P. Heimann, J. Hermanson, H. Miosga,and H. Neddermeyer, Surf. Sci. jg, 263 (1979).Much of Fig. 11 is reproduced from Ref. 5 for theconvenience of discussion. The (1X1)CuA1 curve in
Fig. 11(d), however, presents new measurements.The bottom of the Shockley-state band therefore con-tinues to stay well above the Lz level in the alloy.
34The shift of 0.3—0.4 eV in the Shockley-state bands ismuch larger than the corresponding shift of 0.05—0.1
eV for the Tamm states. This is consistent with ourobservation that the Shockley state possesses an s-p-
like character whereas the Tamm states arise from thebulk d states. As discussed in the text, the states of dsymmetry experience shifts of less than 0.1 eV on al-
loying.