author(s): erik olin wright and luca perrone source ...wright/published writing/marxist...
TRANSCRIPT

Marxist Class Categories and Income InequalityAuthor(s): Erik Olin Wright and Luca PerroneSource: American Sociological Review, Vol. 42, No. 1 (Feb., 1977), pp. 32-55Published by: American Sociological AssociationStable URL: http://www.jstor.org/stable/2117730Accessed: 29/11/2009 14:27
Your use of the JSTOR archive indicates your acceptance of JSTOR's Terms and Conditions of Use, available athttp://www.jstor.org/page/info/about/policies/terms.jsp. JSTOR's Terms and Conditions of Use provides, in part, that unlessyou have obtained prior permission, you may not download an entire issue of a journal or multiple copies of articles, and youmay use content in the JSTOR archive only for your personal, non-commercial use.
Please contact the publisher regarding any further use of this work. Publisher contact information may be obtained athttp://www.jstor.org/action/showPublisher?publisherCode=asa.
Each copy of any part of a JSTOR transmission must contain the same copyright notice that appears on the screen or printedpage of such transmission.
JSTOR is a not-for-profit service that helps scholars, researchers, and students discover, use, and build upon a wide range ofcontent in a trusted digital archive. We use information technology and tools to increase productivity and facilitate new formsof scholarship. For more information about JSTOR, please contact [email protected].
American Sociological Association is collaborating with JSTOR to digitize, preserve and extend access toAmerican Sociological Review.
http://www.jstor.org

32 AMERICAN SOCIOLOGICAL REVIEW
Sutherland, Edwin H. and Donald Cressey 1974 Criminology. Philadelphia: Lippincott.
Swigert, Victoria Lynn and Ronald A. Farrell 1976 Murder, Inequality and the Law: Dif-
ferential Treatment in the Legal Pro- cess. Lexington, Ma.: Heath.
Treiman, Donald Forth- Occupational Prestige in Comparative coming Perspective. New York: Seminar.
Vines, Kenneth and Herbert Jacob 1963 "Studies in judicial politics." in VIII
Tulane Studies in Political Science: 77- 98.
Westley, William A. 1953 "Violence and the police." American
Journal of Sociology 59:34-41. Wolf, Edwin D.
1964 Abstract of "Analysis of jury sentencing in capital cases: New Jersey: 1937- 1961." Rutgers Law Review 19:56-64.
Wolfgang, Marvin E. 1961 "A sociological analysis of criminal
homicide." Federal Probation 23:48- 55.
Wolfgang, Marvin E. and Franco Ferracuti 1967 The Subculture of Violence. London:
Methaen.
MARXIST CLASS CATEGORIES AND INCOME INEQUALITY *
ERIK OLIN WRIGHT
University of Wisconsin, Madison
LUCA PERRONE
University degli Studi delta Calabria, Italy University Statale di Milano, Italy
American Sociological Review 1977, Vol. 42 (February):32-55
Marxian class categories have been almost totally ignored in systematic quantitative studies of social stratification and income inequality. Occupational status or a similar variable is almost always used as the core criterion defining the individual's position in the system of stratification. This study provides a preliminary operationalization of the Marxian class categories for use in quantitative research. The three most important of these classes-workers, managers and employers-then are analyzed to see what inter- actions occur between class position and the usual variables used in predicting income (education, occupational status, age and job tenure) and between class and race-sex cate- gories. It was found that there is a substanial interaction between class position and the income returns to education; within class categories, however, there are no differences between race and sex groups in the returns to education.
In the study of social stratification, there is a major disjuncture between theoretical traditions and quantitative empirical work. Of all the theoretical traditions in sociol- ogy, social inequality probably plays the most central role in the Marxist perspec- tive. Yet, quantitative investigations of the
* We would like to express our gratitude to Robert Quinn, Graham Staines, Linda Shepherd and others at the University of Michigan Survey Research Center for their assistance throughout this study. We would also like to thank Tom Rothenberg, Arthur Stinchcombe, Barbara Heyns, Robert Kahn and Marcia Wright for their many helpful suggestions on various portions of the work, and Sam Bowles, Christopher Jencks and Otis Dudley Duncan for their written comments on an earlier version of the paper.
causes and consequences of inequality have almost totally ignored Marxian cate- gories. Marxists have been suspicious of quantitative, multivariate approaches to the study of social reality, and the practitioners of multivariate statistics generally have viewed the Marxist perspective as offering little of interest for empirical research.
The present research is an attempt to bridge this gap between the Marxist theo- retical perspective and the rapidly growing body of quantitative studies of social in- equality. The first part of the paper will discuss briefly the logic of the Marxist con- cept of class and present a preliminary op- perationalization of the Marxist criteria for class position for use in quantitative re- search. We then will examine an empirical

MARXIST CLASS CATEGORIES AND INCOME INEQUALITY 33
application of this operationalization in the study of income inequality.
THEORETICAL BACKGROUND
The Marxist Concept of "Class" 1
Few concepts in social science have been used in more diverse ways than "class." To some sociologists, class refers to cate- gories of people occupying common posi- tions within status hierarchies (Warner, 1960; Parsons, 1970:24; Williams, 1960: 98). Others define classes as conflict groups determined by their position within authority or power structures (Dahrendorf, 1959:138; Lenski, 1966:95). Sociologists within the Weberian tradition see class as identifying groups of people with common economic "life chances" determined largely by market relations (Weber, 1968:927; Giddens, 1973; Parkin, 1971:18-23). In contrast to these usages, Marxists have de- fined class primarily in terms of common structural positions within the social or- ganization of production (Bukharin, 1969: 276; Lenin, 1969:486). In contemporary American society, this means defining class in terms of positions within capitalist social relations of production.
There are three important elements of this conception of class: classes constitute common positions, those positions are re- lational and those relations are rooted in the social organization of production. To say that classes constitute positions implies, to use Przeworski's (1976:3) apt expres- sion, that there are "empty places" in the social structure which are filled by individ- uals. The analysis of class must be under- stood primarily as the analysis of such empty places, and only secondarily of the actual individuals who fill the slots. While questions of social mobility are important in a class analysis, there is a logical priority to understanding the empty places into which individuals are sorted (see Poulan- tzas, 1973:49-50; Marx, 1967: 10).
Classes are not, however, just any ''empty places" in social structure which
can be ordered in a hierarchical fashion. In the Marxist perspective, classes are not, as Barber (1957:73) would have it, "divi- sional units within systems of social stratifi- cation." Classes constitute common posi- tions within social relations of production, and this means that classes must always be understood in terms of their relationship to other classes. Thus, the theoretical starting point of a class analysis is to decode the social relations of production within a par- ticular society in order to uncover the class positions which they determine.
The traditional Marxist analysis of the class structure of capitalist society has cen- tered on three criteria underlying social relations of production: (1) ownership of the means of production; (2) purchase of the labor power of others; (3) sale of one's own labor power.2 These three criteria generate the three basic class categories of capitalist society: capitalists own their own means of production, purchase the labor power of others and do not sell their own labor power; workers do not own their own means of production and therefore cannot purchase the labor power of others, but do sell their own labor power to capi- talists; and the petty bourgeoisie do not sell their own labor power, nor (except per- haps in a very limited way) purchase the labor power of others, but do own their own means of production. For many pur- poses, especially for the analysis of mid- nineteenth century capitalism, these were probably adequate criteria, at least as a first approximation; for the analysis of contemporary capitalism, they need some important extensions.
The present analysis will focus on only one of the possible extensions of this basic typology, the emergence of an authority structure within the capitalist enterprise which is partially differentiated from own-
1 For a much more elaborate discussion of the Marxist concept of class, see Wright (1976a:20- 90; 1976b).
2 It might appear that sale of one's own labor power is equivalent to not owning the means of production and thus is a redundant criterion. However, in all class societies there are people who neither own the means of production nor sell their labor power-in precapitalist society, slaves; in capitalist society, students, many house- wives and others who do not participate directly in production.

34 AMERICAN SOCIOLOGICAL REVIEW
Table 1. Expanded Marxist Criteria for Class
Criteria for Class Position
Purchase of Control of Ownership of the Labor the Labor Sale of One's the Means of Power of Power of Own Labor Production Others Others Power
Capitalists Yes Yes Yes No Managers No No Yes Yes Workers No No No Yes Petty Bourgeoisie Yes No No No
ership. This expanded typology is pre- sented in Table 1. The traditional Marxist criterion of "employing labor power" really contains two distinct dimensions. First, being an employer gives the capitalist legal rights to the product of labor. Sec- ond, being an employer gives the capitalist control over the activities of labor, over the labor process. In nineteenth century capitalism, these two dimensions tended to be united in the entrepreneurial capitalist; today, especially in the large corporation, they tend to be partly differentiated.3 This
implies the emergence of a new social cate- gory, generally referred to as managers. Managers in this typology are wage-labor- ers who do not own their own means of production, do not formally employ work- ers, but who do control or supervise labor power. Thus they share some of the cri- teria of both workers and capitalists, which reflects the structural position of managers as a buffer between the capitalist class and working class. This enlarged typology will
3Opponents of the Marxist view of class have argued that with the institutional separation of ownership and control in the modern corpora- tion, property ownership has progressively de- clined as an important element in the structure of inequality and, thus, an analysis of capitalist social relations of production per se is unneces- sary (see especially Bell, 1973; Berle and Means, 1932; Galbraith, 1967). Of course, no one can deny the considerable growth of managerial hier- archies in the modern corporation and the gen- eral decline of the family-owned firm in favor of the joint stock company (although, as Zeitlin (1974) argues, there are considerable data to indicate that proponents of the "managerial revo- lution" thesis have grossly exaggerated these changes). The issue is not whether or not pro- fessional managers play a bigger role in running corporations today than 100 years ago, but how such managerial positions should be structurally interpreted. Obviously, if property ownership is taken to be simply a juridical category defining formal legal title to the apparatus of production, then the emergence of managers at the top of large corporations signals the demise of property relations. But proponents of the class structure perspective increasingly have stressed that own- ership must not be understood primarily in legal- istic terms. Rather, ownership of the means of production constitutes a complex system of social relationships, of enforceable rights and claims to the apparatus of production (see especially, Bali- bar, 1970; Poulantzas, 1975; Bettelheim, 1973;
De Vroey, 1975). It is a sociological question, not a formal legal one, whether the appearance of a separation of ownership and control, in fact, may hide a new integration of the two. Under- stood in this way, the main significance of the rise of managerialism is not the abolition of property relations, nor the demise of the capital- ist class but, rather, the reorganization of owner- ship structures from individual forms of capitalist ownership to more collective forms of ownership. The dominance of the capitalist class is no longer primarily mediated through personally manipu- lated individual businesses, but through collec- tively run and coordinated corporate empires (see Menshikov, 1969). Capitalist social relations of production have not been transcended; they have merely been transformed. The Marxist class structure perspective thus argues that relations of production-understood substantively, not form- ally-remain the core criteria for understanding class structure and class antagonism.
4 It is very important not to confuse this typol- ogy with Dahrendorf's (1959) conception of class as common position within authority hierarchies. Two points of contrast are especially important: in Table 1, "authority" represents only one di- mension of class relations; whereas in Dahren- dorf's analysis, authority becomes the sole cri- terion for class position. Second, in the present discussion, authority is defined specifically in terms of the social relations of production, not the social relations of any organization whatso- ever. For Dahrendorf, authority relations within churches are as much the basis of class position as authority relations within industry. For a

MARXIST CLASS CATEGORIES AND INCOME INEQUALITY 35
provide the basic conceptual framework within which the present research will be conducted.
Several brief comments about the typol- ogy in Table 1 are necessary. First, to say that this is a structural typology in which a person is placed in a class category on the basis of the four criteria does not imply that there are no ambiguous cases. For ex- ample, should a worker who in his or her spare time is a small-scale, self-employed artisan be considered a petty bourgeois producer? It is partially an empirical ques- tion rather than a purely theoretical one how neatly and unambiguously individuals can be placed into the slots. The critical point is that such ambiguity takes shape and has theoretical meaning only in its relationship to the structural categories.
Second, and perhaps more seriously, there is a certain ambiguity in the criteria themselves quite apart from the possible ambiguities of placing individuals into par- ticular slots. Two such ambiguities are particularly important. (1) There is an am- biguity in the boundary between the capi- talist and petty bourgeois classes. As de- fined in Table 1, petty bourgeois employ no labor power. This is surely an overly stringent criterion; a small shopkeeper who employs one helper is not in a differ- ent class position from a small shopkeeper who employs no one. The criterion "em- ploys labor power" thus does not provide a complete definition of the difference be- tween capitalists and the petty bourgeoisie. (2) In a complementary way, there is a certain ambiguity in the boundary between the capitalist class and the managerial cate- gory. As defined in Table 1, the president of General Motors would be called a "man- ager" rather than a capitalist, in spite of the fact that most of his income comes from the direct appropriation of profits. Clearly, for- mal legal ownership of the means of pro- duction and formal legal status as the em- ployer of labor power are not sufficient criteria to differentiate capitalists from managers. For present purposes, however,
we will ignore both of these ambiguities. The typology in Table 1 therefore should be regarded as a first approximation clearly in need of refinement rather than as a fully elaborated class typology.5
Third, to say that these are structural categories does not imply that they are completely homogeneous, without any sig- nificant internal differentiation. There are large, wealthy capitalists and small, local capitalists; top managers and foremen (the lowest level in the managerial hierarchy); highly educated, well-paid workers and marginal, poverty-stricken workers. It would be absurd to argue that class and class alone is the only important element defining an individual's place in the system of inequality. But again, the point is that these various forms of internal differentia- tion-of intra-class stratification-are to be understood theoretically in terms of their relationship to the more general struc- tural class categories.
Finally, it is very important not to think of these class categories as occupational groupings. Class, as defined in Table 1, is a way of looking at social structure en- tirely different from occupation. The term "occupation" designates positions within the technical division of labor, i.e., an oc- cupation represents a set of activities ful- filling certain technically defined functions. Class, on the other hand, designates posi- tions within the social relations of produc- tion, i.e., it designates the social relation- ship between actors. Knowing that an individual is a carpenter, for example, tells you that within the technical division of
fuller discussion of the relationship of Dahren- dorf's concept of class to a Marxist perspective, see Wright (1976a:ch. 1).
5 Many critics of the Marxist framework have argued that the fact of such ambiguities negates the value of a structural class model altogether. This is equivalent to saying that because the platypus has webbed feet and a bill, the concept of "mammal" is useless. The point is that am- biguities are ambiguities precisely because of their relationship to structurally defined cate- gories. It is, of course, important for a structural theory to provide an understanding of the am- biguities rather than to ignore them, but there is no intrinsic incompatability between a structural theory and structural ambiguities. For a more thorough discussion of ambiguities in the class structure, see the analysis of "contradictory loca- tions within class relations" in Wright (1976b). See also Carchedi (1975a; 1975b).

36 AMERICAN SOCIOLOGICAL REVIEW
Table 2. Occupational Distribution within Class Categories (Full-Time Participants in the Labor Force Only, 1969 Survey of Working Conditions)
Class Categories a
Petty Occupation Employers Managers Workers Bourgeoisie Total
Professionals and Technicians 2.9% 20.2% 12.5% 11.8% 11.1% Managers, Proprietors and Officials 72.1 17.1 1.7 41.2 14.5 Sales 2.9 4.5 5.6 2.0 4.9 Clerks 0.0 14.1 20.0 0.0 15.2 Craftsmen 6.7 21.8 14.5 9.8 16.0 Operatives 1.0 13.8 29.4 3.9 20.3 Laborers 1.0 0.8 4.5 2.0 2.8 Service Workers 1.9 6.1 10.4 2.0 7.7 Farmers 11.5 0.4 0.0 27.5 2.8 Farm Laborers 0.0 1.2 1.2 0.0 1.0
Total 100.0% 100.0% 100.0% 100.0% 100.0% N 104 491 664 51 1310
a See Table 3 for operationalizatiohs of class position in the 1969 Survey of Working Conditions.
labor he/she physically transforms lumber into buildings; but it tells you nothing about that individual's class position. A carpenter could easily be a worker, a petty bourgeois producer, a manager or even a small capitalist. The occupational distribu- tion for the various class categories is given in Table 2.
Operationalization of the Class Categories
The data for the present study come from the 1969 "Survey of Working Condi- tions" and the 1973 "Quality of Employ- ment Survey" conducted by the University of Michigan Survey Research Center.6 A number of questions from the 1969 survey enabled us to construct a class typology that was reasonably close to the Marxian typology.
1. "Most of the time on this job do you work for yourself or someone else?"
2. "If you are self-employed, are there any people who work for you and are paid by you?"
3. "Do you supervise anybody as part of your job?"
These three questions generate a total of five categories as illustrated in Table 3.7
6 The 1969 survey consisted of a national ran- dom sample of 1,533 adults 16 years and older; the 1973 sample consisted of a national random sample of 1,496 adults. In both surveys, only individuals active in the labor force were in- cluded.
7 Several comments about these categories are necessary: Employers: We are calling this category "em- ployers" rather than capitalists since most of the individuals in the sample who fall into this cate- gory are extremely small businessmen. Seventy- eight percent reported that they employed nine or fewer workers, and only eight percent said that they employed 50 or more. Managers and Workers: In response to the ques- tion about having subordinates, a majority of elementary and secondary school teachers re- sponded that they did supervise people on their jobs. This would formally place them in our man- ager category. However, with very few exceptions (such as teachers who hold administrative jobs as well as teach), teachers should be classified as workers, not managers, since they do not super- vise labor power. Therefore, we have reclassified all teachers as workers regardless of their re- sponses to the question about having subordi- nates. Petty Bourgeoisie: A pure rentier capitalist-i.e., an owner of stocks and other assets who did not employ anyone directly-would fall into the petty bourgeoisie on the basis of the criteria in Table 3. In reality, such an individual should be classified within the capitalist class, since the role of managing the flow of capital represents part of the capitalist position within social rela- tions of production. Since it is unlikely that many such individuals are included in the present sam- ple, this misclassification makes little practical difference. Ambiguous: This category does not have a clear meaning in the present study. Except for the spe- cial case of a self-employed consultant who su-

MARXIST CLASS CATEGORIES AND INCOME INEQUALITY 37
Table 3. Operationalization of the Marxist Class Typology (1969 Survey)
Operationalized Criteria for Class Position
Have Have Subordinates
Self-Employed Employees on the Job Employed N %
1. Employers Yes Yes Yesa No 110 7.4% 2. Managers No No Yes Yes 561 37.4% 3. Workers No No No Yes 739 49.2% 4. Petty Bourgeoisie Yes No No No 65 4.3% 5. Ambiguous Yes No Yes No 27 1.8%
a Three individuals reported that they were employers but had no subordinates. These individuals were included in the employer category.
EMPIRICAL APPLICATION OF THE CLASS TYPOLOGY
General Hypotheses The class categories discussed above
will be used in an empirical study of in- come inequality. There will be three fo- cuses to this investigation.
Comparison of the explanatory power of class and occupational status. Virtually all of the recent sociological work on income inequality has used occupational status, oc- cupational prestige or some closely related metric of occupations as the key mediating variable between the individual's social background and education and the indi- vidual's income. We have posed the con- cept of class, defined in terms of capitalist social relations of production, as an alter- native paradigm for understanding inequal- ity. One way (by no means the only way) of comparing these paradigms is to esti- mate a series of income regression equa- tions and then to examine the relative changes in explained variance when class and other variables are included and ex- cluded in various combinations. The ex- pectation is that class position will have at least as much an effect on an individual's income as will the individual's occupational status, and that this effect will not disap- pear when status is controlled for.
Examination of the different patterns of
income determination between classes. If class position is a critical mediating vari- able between social background and in- come, then it would be expected that class position would affect the ways in which background characteristics get transformed into income. That is, we hypothesize not only that class position has an independent impact on income from occupational posi- tion, but also that it affects the extent to which background characteristics them- selves can be "cashed in" for income. In particular, the expectation is that class position will have a strong influence on the extent to which education influences in- come.
More concretely, we predict: (a) that the returns to education will be much greater for managers than for workers and (b) that the income of employers will be higher than that of managers and workers at every level of education, but that the returns to education for employers will be less than for managers.
The reasoning behind the first hypothe- sis is as follows. For both workers and managers there should be some posi- tive returns to education for a variety of reasons: educated labor costs something to produce and, thus, the income going to educated workers and managers gener- ally will include an increment to cover those costs at least partially; educated la- bor tends generally to be in short supply relative to uneducated labor and, thus, market forces will tend to push up the in- comes of both skilled workers and man- agers.
However, because of the specific posi-
pervises other people's employees, this category probably represents a response error. Since less than two percent of the sample falls into this category, we will exclude it from all subsequent analyses.

38 AMERICAN SOCIOLOGICAL REVIEW
tion of managers within the social relations of production, there are forces which tend to increase the returns to education among managers above the returns for workers. The argument has two steps. First, be- cause of the problems of social control of managerial labor, managerial hierarchies will tend to be characterized by elaborate incentive structures. In particular, the in- come gradients associated with managerial career ladders will tend to be quite steep. This, in turn, will create steep income grad- ients associated with position within the managerial hierarchy. Second, among managers, there will tend to be a fairly close relationship between education and position within the managerial hierarchy. This association is the result of several fac- tors. (1) Higher levels of the hierarchy require certain skills that are produced (or at least certified) within the educational system. (2) The educational system social- izes people to the work norms demanded for different positions in the hierarchy. In particular, higher education develops hab- its appropriate for higher levels within the authority structure. (3) The educational system helps to legitimate the managerial hierarchy as a whole through the merito- cratic ideology of rule by experts and, thus, there will be a tendency for people with lower credentials not to be promoted above people with higher credentials. As a result of this combination of steep income gradi- ents and steep educational credential gradi- ents tied to managerial position, we expect that managers will have particularly high income returns to education. This reason- ing will be discussed in greater detail in the final section of this paper.
The second hypothesis is based on the view that the income of employers is fun- damentally a consequence of the quantity of property (capital) controlled by the em- ployer rather than the employer's educa- tion. Therefore, education should matter for the employer's income only if, among employers, there is a strong relationship between quantity of property and level of education.
It is very important to understand the logic of these comparisons of returns to education in different classes. We are not
touching directly on questions of social mobility, i.e., how people get sorted into class positions. What we are asking is: once a person gets into a class position, by whatever sorting process, does the class position itself have an impact on how much difference an individual's education is likely to make for the individual's income? We are therefore, in a sense, using regres- sion equations to tap characteristics of the structure of class itself rather than to repre- sent the status-attainment process at the individual level.8
Examination of the differences in pat- terns of income determintion between blacks and whites and between men and women within classes. One of the main preoccupations in the stratification litera- ture has been the analysis of differences in the status-attainment process among blacks and whites and, more recently, men and women. One of the most robust findings of this body of research is that blacks in gen- eral receive less income per increment in education than do whites (see Siegel, 1965; Duncan, 1969; Weiss, 1970).9 None of
8This point may be somewhat clearer if we consider a more concrete example. Suppose we wished to compare the relation of education to wages in two businesses. In one business, educa- tion is irrelevant for pay; in the second business, pay scales are closely pegged to educational credentials. There are two empirical strategies that could be adopted for revealing this pattern: formal pay scales and job requirements in the business records of the two firms can be used to estimate the returns to education; or a survey of the personnel of the businesses and use of indi- vidual-level data to estimate the returns. In either case, the resulting regression equations should be seen as characterizing the firms rather than the individuals. This becomes most obvious in a situ- ation in which education itself becomes an im- portant criterion for an individual entering one or the other of the two businesses. In such a case, the regressions of income on education within each firm would tell very little about the total relationship of education to income for in- dividuals. In our analysis, class categories are analogous to the firms, and the regression equa- tions should be interpreted as reflecting character- istics of the class positions as such.
9 The work of Stolzenberg (1975) represents a partial exception to this general finding that the returns to education are lower for black males than for white males. Stolzenberg finds that within detailed occupational categories the rate
MARXIST CLASS CATEGORIES AND INCOME INEOUALITY 39
these studies, however, has controlled for class position defined in terms of social re- lations of production. If it is true that man- agers receive much higher returns to edu- cation than workers, as hypothesized above, and if it is true that blacks are more concentrated than whites in the working class, then it would be expected that much of the differential returns to education for blacks and whites might be due to the dis- tribution of races across class categories. Therefore, we will compare the returns to education for blacks and whites within class categories in order to control for this class composition effect. We will do the same analysis for men and women.
Statistical Method
For the direct comparison of class and status the following standardized regres- sion equation will be estimated:
Income=,81 Education+,82 Age+B3 Status +,84Employer Dummy+,f5 Worker Dummy
We will then examine how much the R2 for the equation drops when the class dummy variables are excluded, when status is ex- cluded and when both are excluded.
The analysis of the interaction patterns will involve a fairly straightforward appli- cation of the analysis of covariance. We will compare the various class categories and sex and race categories within classes in terms of a series of regression equations to see (a) if they differ significantly in the
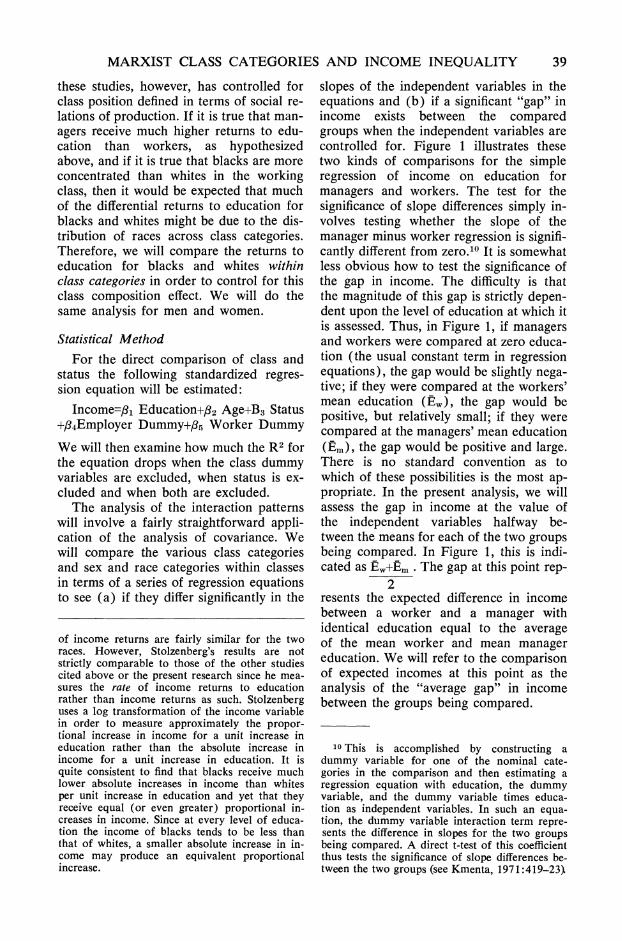
slopes of the independent variables in the equations and (b) if a significant "gap" in income exists between the compared groups when the independent variables are controlled for. Figure 1 illustrates these two kinds of comparisons for the simple regression of income on education for managers and workers. The test for the significance of slope differences simply in- volves testing whether the slope of the manager minus worker regression is signifi- cantly different from zero.10 It is somewhat less obvious how to test the significance of the gap in income. The difficulty is that the magnitude of this gap is strictly depen- dent upon the level of education at which it is assessed. Thus, in Figure 1, if managers and workers were compared at zero educa- tion (the usual constant term in regression equations), the gap would be slightly nega- tive; if they were compared at the workers' mean education (Ew ), the gap would be positive, but relatively small; if they were compared at the managers' mean education (Em), the gap would be positive and large. There is no standard convention as to which of these possibilities is the most ap- propriate. In the present analysis, we will assess the gap in income at the value of the independent variables halfway be- tween the means for each of the two groups being compared. In Figure 1, this is indi- cated as . The gap at this point rep-
2 resents the expected difference in income between a worker and a manager with identical education equal to the average of the mean worker and mean manager education. We will refer to the comparison of expected incomes at this point as the analysis of the "average gap" in income between the groups being compared.
of income returns are fairly similar for the two races. However, Stolzenberg's results are not strictly comparable to those of the other studies cited above or the present research since he mea- sures the rate of income returns to education rather than income returns as such. Stolzenberg uses a log transformation of the income variable in order to measure approximately the propor- tional increase in income for a unit increase in education rather than the absolute increase in income for a unit increase in education. It is quite consistent to find that blacks receive much lower absolute increases in income than whites per unit increase in education and yet that they receive equal (or even greater) proportional in- creases in income. Since at every level of educa- tion the income of blacks tends to be less than that of whites, a smaller absolute increase in in- come may produce an equivalent proportional increase.
10 This is accomplished by constructing a dummy variable for one of the nominal cate- gories in the comparison and then estimating a regression equation with education, the dummy variable, and the dummy variable times educa- tion as independent variables. In such an equa- tion, the dummy variable interaction term repre- sents the difference in slopes for the two groups being compared. A direct t-test of this coefficient thus tests the significance of slope differences be- tween the two groups (see Kmenta, 1971:419-23,

40 AMERICAN SOCIOLOGICAL REVIEW
Annual Income
Workers
I I
Education
w w n n
2
B = Mean worker education
n = Mean manager education = Level of education at which
the gap in income will be
2 evaluated
Figure 1. Illustration of the Method of Structural Comparisons
Since the average income gap is assessed at a different level of the independent vari- ables in each comparison, it is not possible directly to compare average income gaps for different comparisons. In order to do this, it is necessary to assess the gap at the same point on all comparisons. We will therefore also calculate a "standardized in- come gap" by assessing the gap at the level of the independent variables of the most privileged category in our analysis employers. (This is equivalent to the com- mon technique of substituting the means from a privileged group into the equations for a disadvantaged group as discussed by Duncan, 1969.) In Tables 6A and 7A, where we report the basic regression equa- tions for our analysis, this standardized income gap constitutes the difference in "adjusted constants" for the various groups."
Specification of Equations for the Analysis of Interaction Patterns
Every regression equation contains the answer to some question. The trick is for the equation which is estimated in fact to answer the question which is asked. Too often in sociological research any variable which is thought to be interesting is thrown into a regression equation without regard to its substantive relevance to the questions at hand.
There are two somewhat different ques- tions which we would like to answer in the analysis of interaction patterns:
1. Do individuals in different classes, and in different race and sex categories within classes, differ in the amount of income they can expect to receive for each additional increment of educa- tion (comparison of slopes)?
2. Do individuals who are alike in all respects except that they differ in their class position, or who differ only in their race and sex while sharing a common class position, differ in the absolute amount of income which they can expect to receive (analysis of average income gap)?
These two questions pose somewhat differ- ent issues for the correct specification of the regression equations. For the first equa- tion, ideally we would like to hold all fac- tors constant which can be considered causes of education, but not those which are consequences of education. In particu- lar, we would like to include a number of variables which describe the individual's social background and "intelligence." Un- fortunately, no such data are available in the present survey. The result is that the estimated education coefficients in our analysis inevitably will be somewhat biased upwards.'2
Ii To conduct a t-test on these various gaps, it
simply is necessary to shift the constant term in the dummy-variable interaction regressions to the desired value of the independent variables. A t-test on the constant term in such a regression then becomes a t-test of the income gap between the two groups being compared.
12 The reason why it would be desirable to have such background variables in the equation

MARXIST CLASS CATEGORIES AND INCOME INEQUALITY 41
There is certainly no unanimity on the potential biases in education coefficients created by improperly measuring or by omitting social background variables. Bowles (1972), for one, argues that such biases are likely to be substantial. There is, however, considerable research on the ef- fects of social background and education on income (Duncan, 1969; Blau and Dun- can, 1967; Jencks et al., 1972) and of measured IQ on income (Jencks et al., 1972) which suggests that the bias in the education coefficient caused by the omis- sion of the relevant background variables should not be terribly large. More impor- tantly, even if these biases are not trivial, since our main interest centers on the dif- ferences between various groups rather than the absolute values of the regression coefficients, the problem of bias should become less critical. If we are willing to assume that the bias due to the omission of background variables is in the same di- rection for both groups, then the bias in the estimate of the difference in coefficients will necessarily be less than the most bi- ased of the two individual coefficients and, generally, less than both. In the limiting case where two groups have identical bi- ases, the estimate of the difference in coeffi- cients actually will be unbiased.
Because of this absence of background variables, therefore, the core of the analy- sis of slopes will rest on comparisons of the simple regression of income on educa- tion for the various categories.
For the second question, we would like to hold constant all factors in addition to
education which have any significant im- pact on income. The list of such factors is, of course, very large and includes occupa- tional status, on-the-job training, seniority, work experience, industrial sector, geo- graphical location, migration, and so forth. For the present purposes, we will limit our- selves to three of these: job tenure, age (as a proxy for work experience) and oc- cupational status.
We are including these additional equa- tions not to provide more precise estimates of the education coefficient as such, but to see if the average gaps in income disap- pear as controls are added.'3 Again, the income gap, as we are measuring it, repre- sents the expected difference in incomes between two individuals, one from each group, that would occur if the two individ- uals had the same levels on all the inde- pendent variables equal to the averages of their respective group means. If this gap were entirely due to differences in the lev- els of education, occupational status, tenure and experience, then the gap should be- come negligible when these factors are all included in the equation.
While the actual value of the education coefficient in these expanded equations has little intrinsic interest, the magnitude of the difference between groups in the edu-
is not because they necessarily would tell us any- thing about how people get sorted into class positions, but because the class interactions could conceivably be artifacts of various unmea- sured background characteristics of the individ- uals occupying given class positions. Thus, if managers have greater returns to education than workers, it might be because they have different motivations due to higher status backgrounds. What appears as an education slope difference between managers and workers .would, in fact, turn out to be a slope difference between high status and low status backgrounds. In effect, therefore, when we compare education slopes we are comparing returns to education plus returns to all the unspecified causes of education which also influence income.
13 In certain respects, these expanded regres- sion equations provide less meaningful estimates of the effects of changes in education per se on income than does the simple regression. In par- ticular, the inclusion of occupational status intro- duces a substantial downward bias in the estimate of the education coefficient since it holds constant one of the basic mechanisms by which education influences income. The regression which contains occupational status as well as education provides an answer to a rather strange question: how much additional income could an individual ex- pect to receive for an increase in education pro- viding that this increased education did not lead to a change in occupation? The constraint of not changing occupation (or at least not changing occupational status) certainly reduces the amount of extra income per increment of education, i.e., it biases the education coefficient downward. Un- less this equation appears as part of a system of recursive equations (as in path analysis), the in- clusion of the occupational status variable in the equation clearly gives a less meaningful estimate of the effects of education per se on income than does the simple regression of income on educa- tion.

42 AMERICAN SOCIOLOGICAL REVIEW
cation coefficient in these expanded equa- tions may give some clue as to the possible mechanisms which produce the differences between classes observed in the compari- sons of the simple regressions. In particu- lar, if the inclusion of the occupational status variable wipes out any differences between classes in the slope of the educa- tion variable, it would suggest that the dif- ferences in slope in the simple regression might be subtstantially the result of the oc- cupational composition of the different class categories. Thus, while the basic pur- pose for constructing these expanded equa- tions is to examine the average income gap between groups, we will also look at the effect of including the additional variables on the differences in the education slopes.
Therefore, for each interaction com- parison, we will estimate two equations:
1. the simple regression of income on education;
2. the regression of income on educa- tion, tenure, age and occupational status.
Variables
Class. Class is measured by the criteria in Table 3. Unfortunately, in the 1973 replication of the original 1969 survey of working conditions, the question about em- ploying others was dropped from the ques- tionnaire. This means that the employer category and category 5 in Table 3 were merged, making the 1973 data somewhat less reliable in comparisons between em- ployers and other classes. We will there- fore rely on the 1969 survey for the analy- sis of interaction patterns.
Occupational status. Status was mea- sured using the standard Duncan SEI scores. However, in the 1969 survey, only decile values from the Duncan scale were coded rather than the full two-digit scale.14 In our direct comparisons of class and status, we will rely on the 1973 data in order to avoid any problems of attenuation which might result from using decile scores. By using the full status scale and a slightly less well-measured class variable in these comparisons, we are maximizing the relative explanatory power of status.
Since in the analysis of the interaction pat- terns we are less concerned with the co- efficients of the status variable as such, we will use the 1969 data in order to have the most reliable measures of class position. In any event, the results for the direct com- parisons of class and status using the 1969 data and for the interactions using the 1973 data are substantively the same as those reported below.
Annual income. Respondents were asked to indicate their total personal annual in- comes before taxes as well as the amount and frequency of their paychecks. If they failed to answer the annual income ques- tion, annual income was estimated from the response to the paycheck question. Annual income is being used rather than simply annual earnings since, for compari- sons between classes (especially between employers and other classes), the exclu- sion of unearned property income obvi- ously would understate real class differ- ences. Total income therefore should be seen sociologically as an indicator of total economic rewards regardless of economic source.
Education. Education is measured by a quasi-credential scale rather than by years of education in the following manner:
O=elementary school or less 1 completed elementary school
(grade 8) 2=some high school 3=high school completed 4=some college
14 The decile status scale used in the survey is related to the full two-digit scale as follows:
Decile Full Scale 0 01-06 1 07-13 2 14 3 15-18* 4 19-21 5 22-31* 6 32-39* 7 40-51* 8 51-65* 9 66 and over
* The decile split in these cases occurred in the middle of a category. In these situations, cases were randomly assigned above and below the 10 percent cut-off point.

MARXIST CLASS CATEGORIES AND INCOME INEQUALITY 43
5=college degree 6=post-college.
Each step on this scale represents a so- cially-recognized level of education. Al- though in practice it is highly unlikely that any of our results would have been differ- ent if years of education had been used instead of this scale, we felt that in an analysis of income determination a "cre- dential" is a more appropriate unit of education than a year.
Job tenure and age. The job tenure vari- able is a simple measure of the number of years worked on the current job. Unfortu- nately, no question was asked on the sur- vey about general work experience beyond tenure in current job. While realizing that there are some problems with age as a vari- able in an analysis of income determina- tion, age will be used as a loose proxy for general work experience.
The Sample Used in the A nalysis
For the purposes of the present research, we have restricted the analysis to those respondents who work full time, defined as 35 hours a week or more. While this re- duced the sample size somewhat, especially for women, we felt that the analysis would be more straightforward if we avoided the special problems of analyzing the market for part-time labor.
In the analysis of interaction patterns, the sample also will be limited to workers, managers and employers, the three most important classes in advanced capitalist societies. In many respects, the petty bour- geoisie represents a remnant from an earl- ier era of capitalist development and, as a class, certainly is progressively becoming less important. While this class may be of considerable interest for certain problems, we will simplify the present study by ex- cluding it from the analysis.
Finally, farmers and farm laborers (less than 4% of the total sample) are being excluded because of the difficulties of as- sessing income in kind for agricultural oc- cupations. All of the results reported below remain virtually unchanged if farmers and farm laborers are included in the analysis.
RESULTS
Direct Comparison of Occupational Status and Class Position
Table 4 presents the regressions used to assess the relative contributions of occupa- tional status and class to the explained variance in income. Table 5 presents the corresponding correlation matrix. In order to make these results as comparable as possible to the existing research on income determination and status attainment, we have restricted the sample to white males, nonfarm full-time participants in the labor force.
Education and age account for just over 15% of the variance in income. The addi- tional increment in R2 resulting from add- ing occupational status to this equation is only 4.1 %, whereas the increment from the two class dummies is 9.4%. All of the variables taken together explain just under 27% of the variance in income among white males. Looked at in a slightly dif- ferent way, when class is added to the equation containing status, the R2 increases by 7.6%, whereas when status is added to the equation containing class, the increase is only 2.3%. Status and class alone each explain just over 14% of the variance in income. These results are highly suggestive that an extremely simple version of the Marxian class typology is at least as potent a variable in predicting income as the full Duncan socioeconomic scale.
Class Comparisons
Figure 2 and Table 6 present the results of the comparison of the various class cate- gories for the simple regressions of income on education. Table 7 presents the results for the expanded regressions. Table 8 pre- sents the mean values and standard devia- tions of the variables for all the class-race- sex categories being compared.
The results shown in these tables and figures strongly support the view that class has a substantial effect on the relationship of education to income. The results can be summarized as follows.
Workers versus employers and man- agers. The education slope for workers

44 AMERICAN SOCIOLOGICAL REVIEW
Table 4. Comparison of the Explanatory Power of Occupational Status and Class (1973 Survey, White Male, Nonfarm, Full-Time Participants in the Labor Force Only)
Standardized Regression Coefficients [Dependent Variable=Annual Income]
Variables Included Decile Employer Worker in the Occupational Class Class
Regression Equation Education Age Status Dummy Dummy 2
1. All Variables .16 .19 .21 .26 -.06 .269 2. Education Only .27 .071 3. Education and Age .32 .28 .152 4. Education, Age and Status .15 .23 .26 .193 5. Education, Age and Class .28 .22 .27 -.11 .246 6. Status Only .38 .143 7. Class Only .29 -.17 .145
Comparison of Relative Changes in R2
Equations Compared Interpretation of the Comparison Increment in R2
4-3 Status Net of Education and Age .041 5-3 Class Net of Education and Age .094 1-5 Status Net of Education, Age and Class .023 1-4 Class Net of Education, Age and Status .076
was significantly flatter than for managers or for employers, and the overall level of the regression line was considerably lower in the simple regression equations (Table 6A:2-3; Figure 2A). Workers received, on the average, $1,119 less for each incre- ment in education than managers and $3,413 less than employers. The average in- come gap between workers and managers was $2,529 and between workers and em- ployers, $6,865. All of these differences were significant at the .001 level.
The addition of job tenure, age and oc- cupational status into the equations did not eliminate the average gap in income between workers and managers or em- ployers (Table 7B:2-3); i.e., most of the gap between the regression lines in Figure 2A cannot be attributed to the age-tenure- occupational status composition of the class categories.
Not only do the age, tenure and occu- pational status variables fail to close the
income gap between classes, they fail to eliminate the differences in the slopes of the education variable. Even when the con- trol variables are added, workers still re- ceive some $2,563 less income per incre- ment of education than employers, and $870 less than managers. Furthermore, workers also receive much less additional income for increments in decile occupa- tional prestige than either employers or managers; workers receive over $2,000 less for each decile of prestige than employers and $400 less for each decile than man- agers. These results further support the notion that the differences between classes cannot be considered simply artifacts of the mix of occupations in the different classes for if that were the case, the classes would not be expected to differ in the slopes of the occupational status variable itself.
Managers versus employers. The income gap between managers and employers was substantial in the simple regression equa-
Table 5. Correlation Matrix for Variables in Table 4
Variables 2 3 4 5 6 Mean
1. Income .27 .23 .38 .35 -.26 11,715 2. Education (Credentials) -. 17 .60 .05 -.09 3 . 3 3. Age .12 .15 -.21 38. 3 4. Occupational Status .15 -.31 43.3 5. Employer Class Dummy -. 30 .105 6. Worker Class Dummy .440

MARXIST CLASS CATEGORIES AND INCOME INEQUALITY 45
uS
0 C's
) CIO
LO 0
CS
CS % ~~~~0
o CS 4.
4 0
U } et~
X ~ ~~ ~ ~ ~~~~~~~~~~~~~~~~~~~~~~~ (AO
CDO G O isC
=~~~~ ~ ~ ~ ~~~~~ C ^ ^
CD
LC ) CD 5)
0
CZ
V)~~~~~~~~~~~~~~~~~~~~I CIO~~~~~~~~~~~~~~~~~~~~C
5)~~~~~~~~~~~~~~~~~~~-
0 5) C~
CS 0
U) ' U )
CZ..
CZ)
0 (n~~~~~~~~~
CS CCDCCD CD
0 CD CD~~ C
CD CD CD CS C
0 0

46 AMERICAN SOCIOLOGICAL REVIEW
Table 6A. Unstandardized Coefficients for Simple Regression of Income on Education (Nonfarm, Full-Time Participants in the Labor Force Only, 1969 Survey)
Adjusted Unstandardized Constant a Education Coefficient N
Overall Class Categories Employers $14,273 $4,091 72 Managers 9,398 1,797 452 Workers 6,756 678 628
White Males Employers 15,062 3,927 64 Managers 10,784 1,937 319 Workers 8,218 764 318
White Females Managers 5,445 1,042 94 Workers 4,875 862 230
Black Males Managers 8,796 1,766 24 Workers 7,492 670 37
Black Females Workers 5,190 1,086 35
aThe constant term is evaluated at the employers' mean level of education (3.2).
Table 6B. t-Values and Significance Levels of Average Income Gaps and Differences in Education Slopes for Various Class, Race and Sex Comparisons
t-Value for Average t-Value Differences Income for Income in Education Gap. Gap Coefficients
Overall Class Comparisons 1. Employer versus Manager $5081 5.3t 3.0*** 2. Employer versus Worker 6865 10 4-t 6. 6t 3. Manager versus Worker 2529 9. 2 6.Ot
White Males 4 Employer versus Manager 4471 4.01 2O3** 5. Employer versus Worker 6162 6.8t 4.7tL 6. Manager versus Worker 2436 6.3t 4.6t
White Females 7. Manager versus Worker 574 2.4** K 1
Black Males 8. Manager versus Worker 653 <1 1 9*
Managers 9. While Male versus Black Male 1986 1.5 <1
10. White Male versus White Female 5527 8. 6 1 .5 11. Black Male versus White Female 3351 4.2 1 .3
Workers 12. White Male versus Black Male 659 1.3 <1 13. White Female versus Black Female -230 <1 1 .2 14. White Male versus White Female 3373 16. 0 <1 15. Black Male versus Black Female 2620 5. 7ts 1 .6
a "Average Income Gap" represents the difference in expected incomes of the two groups being com- pared at an educational level equal to the average of each group's mean education. Significance levels (two-tailed test) * 10 level
**O05 level ****01 level
tO001 level.

MARXIST CLASS CATEGORIES AND INCOME INEQUALITY 47
Table 7A. Unstandardized Regression Coefficients for Expanded Regression Equations (Nonfarm, Full-Time Participants in the Labor Force Only, 1969 Survey)
Unstandardized Coefficients [Dependent Variable=Annual Income]
Decile Adjusted Occupational Job Constant Education Status Age Tenure
Overall Class Categories Employers $13,850 $3,170 $2,359 -$110 $77 Managers 10,090 1,477 570 67 43 Workers 7,512 607 147 18 25
White Males Employers 14,112 3,195 2,786 -51 23 Managers 11,246 1,555 671 71 6 Workers 8,889 729 184 33 12
White Females Managers 5,724 822 357 28 1 Workers 5,504 691 110 -2 72
Black Males Managers 10,288 2,245 -15 95 12 Workers 8,896 450 285 30 -123
Black Females Workers 5,871 1,227 33 65 -35
a The constant term is evaluated at the employer's mean levels on the independent variables: Educa- tion=3.2; Decile Status=7.0; Age=45.9; Job Tenure=11.3.
Table 7B. t-Values and Significant Levels of Average Income Gaps and Differences in Slopes for Various Class, Race and Sex Comparisons, Expanded Regression Equations
t-Values for Differences in Coefficients
t-Value Average for Decile Income Income Occupational
Gap Gap Education Status Age Tenure
Overall Class Comparisons 1. Employers versus Managers $3,883 3.9t 2.1** 2.9*** 1.8* <1 2. Employers versus Workers 4,270 5.2t 4.6t 5.2t 1.9* <1 3. Managers versus Workers 1,793 6.3t 3.8t 3. 1*** 2. 1** <1
White Males 4. Employers versus Managers 3,238 2.8*** 1.8* 2.7*** <1 <1 5. Employers versus Workers 2,909 2.6*** 3.4t 4.2t <1 <1 6. Managers versus Workers 1,557 3.9t 2.7** 2.5** 1.1 <1
White Females 7. Managers versus Workers 246 <1 <1 2.2** 1.5 1.4
Black Males 8. Managers versus Workers 379 1.8* <1 <1 <1 <1
Managers 9. White Male versus Black Male 997 <1 <1 <1 <1 <1
10. White Male versus White Female 5,365 8.3t 1.2 <1 <1 <1 11. Black Male versus White Female 3,821 4.71 1.8* <1 <1 <1
Workers 12. White Male versus Black Male 537 1.11 <1 <1 <1 <1 13. White Female versus Black Female -320 1.1 1.7* <1 2.0** 1. 7* 14. White Male versus White Female 3,352 16.2t <1 <1 2.0** 1.5 15. Black Male versus Black Female 2,377 4.5t 1.6* <1 <1 <1
See note to Table 6B. Significance levels (two-tailed test) as in Table 6B.

48 AMERICAN SOCIOLOGICAL REVIEW
Table 8. Means and Standard Deviations of Variables Used in Regression Equations
Income Education Decile Status Age Job Tenure mean (s.d.) mean (s.d.) mean (s.d.) mean (s.d.) mean (s.d.)
All Respondents $8,344 (6862) 2.96 (1.5) 5.8 (2.7) 39.6 (13.4) 6.4 (6.9)
Overall Classes 1. All Employers 15,179 (16252) 3.24 (1.4) 7.0 (1.7) 45.9 (12.2) 11.3 (8.0) la. Big Employers
(? IOEmployees) 19,188 (7918) 3.79 (1.4) 7.6 (1.4) 45.3 (12.7) 10.6 (9.6) lb. Small Employers
(<10 Employees) 12,915 (16064) 3.02 (1.3) 6.9 (1.7) 46.2 (12.3) 11.5 (7.6) 2. Managers 9,226 (6403) 3.42 (1.5) 6.6 (2.3) 41.4 (12.7) 6.3 (6.9) 3. Workers 6,145 (3180) 2.86 (1.5) 5.1 (2.8) 37.4 (14.0) 5.2 (6.1)
White Males 1. Employers 16,241 (16780) 3.24 (1.4) 7.2 (1.6) 45.1 (12.6) 11.6 (8.4) 2. Managers 10,943 (6730) 3.45 (1.5) 6.8 (2.1) 42.3 (12.5) 7.2 (7.3) 3. Workers 7,727 (3225) 2.82 (1.5) 5.0 (2.6) 38.2 (14.1) 5.7 (6.7)
White Females 1. Managers 5,188 (2790) 3.46 (1.1) 6.7 (2.1) 39.1 (13.3) 5.6 (5.6) 2. Workers 4,391 (2053) 3.06 (1.3) 5.6 (2.9) 37.0 (14.3) 4.1 (5.2)
Black Males 1. Managers 8,037 (6011) 3.02 (1.8) 5.5 (2.3) 38.1 (10.9) 7.0 (7.2) 2. Workers 6,804 (2588) 2.28 (1.7) 4.2 (2.6) 36.8 (13.5) 5.3 (6.2)
Black Females 1. Managers 5,131 (1982) 3.20 (1.8) 5.1 (2.9) 40.3 (11.9) 4.5 (4.5) 2. Workers 4,490 (2419) 2.69 (1.9) 4.4 (3.1) 33.4 (11.6) 4.5 (6.4)
tion ($5,081) and was only partially re- duced by the addition of the control variables. Contrary to our expectations, however, the slope on the education vari- able was significantly flatter for managers than employers in both regression equa- tions. Some possible interpretations of this result will be discussed in the final section of this paper.
Class comparison within the white male category. By and large, the same results are obtained for white males examined separately as for the entire sample. The education coefficients are significantly lower for white male workers than for white male managers or employers in the simple regression and in the expanded re- gression. The income gaps were also sub- stantial and statistically significant (Table 6B:5-6 and Table 7B:5-6). Thus, these class differences cannot be considered arti- facts of the race-sex composition of the class categories.
In the comparison of white male man- agers and employers, the income gap is also significant in both equations, and the education slope for managers is signifi- cantly flatter in the simple regression (Ta-
bles 6B:4 and 7B:4). In the expanded re- gression, the absolute magnitude of the difference in education slopes between white male managers and employers is es- sentially as large as for all managers and employers ($1,640 compared to $1,693), although the t-ratio of the difference drops just below the 5% significance level. The unexpected result of employers having greater returns to education than managers thus occurs among white males as well as in the entire sample. Again, these class interactions cannot be considered a conse- quence of the race and sex composition of the class categories.
Class comparisons within the black male and white female categories. Although the direction of the income gap and the differ- ences in the education slopes between man- agers and workers within the black male and white female categories are the same as within the white male category, the magni- tude of the differences tends to be smaller. Among white females the education slopes of workers and managers were not signifi- cantly different for either of the regressions and, while there was a significant income gap in the simple regression, this gap was

MARXIST CLASS CATEGORIES AND INCOME INEQUALITY 49
Table 9. Class-Race-Sex Distributions (Full-Time Participants in the Labor Force Only, 1969 Survey)
Distribution of Classes within Race-Sex Categories
White Black White Black Males Males Females Females Total
Employers 10.9% 6.6% 3.0% 0. 0% 7.9% Managers 42.9 36.8 27.7 22.9 37.5 Workers 41.5 55. 3 66.6 77.1 50.7 Petty Bourgeoisie 4.6 1.3 2.7 0.0 3.9
Total 100.0% 100.0% 100.0% 100.0% 100. 0% N 804 76 365 48 1293
Distribution of Race-Sex Categories within Classes
Petty Employers Managers Workers Bourgeoisie Total
White Males 84.6% 71.1% 50.9% 77.1% 62.5% White Females 10.6 20.8 37.0 20.8 27.9 Black Males 4.8 5.8 6.4 2.1 6.0 Black Females 0.0 2.3 5.6 0.0 3.7
Total 100.0% 100.0% 100.0% 100.0% 100.0% N 104 485 656 48 1293
almost eliminated with the addition of the control variables (Tables 6B :7 and 7B :7). Among black males, the education slopes were marginally significantly different in both regressions, but the average gap in income was not significant in either regres- sion.
Race and Sex Comparisons within Class Categories
Before examining the differences be- tween race and sex categories within classes, it is important to stress that some of the most significant race and sex effects undoubtedly operate through mechanisms which sort people into the various class categories in the first place. Both women and blacks are underrepresented in the em- ployer category, and women are under- represented in the manager category as well (see Table 9). Furthermore, the pres- ent study is limited to full-time participants in the labor force. It has been shown that, even when educational and skill levels are controlled for, blacks have considerably higher levels of involuntary unemployment than whites (Harrison, 1972). It hardly needs to be added that sexism has acted as a powerful force for keeping women out of the labor force entirely or restricting them to part-time work. When we examine the differences between sex and race categories
among workers and among managers, it should be kept in mind that these are dif- ferences which occur after the effects of racism and sexism have operated to keep some people out of the labor force alto- gether, to prevent others from finding stable full-time employment, and to influ- ence the race and sex distribution among classes of those people who are full-time participants in the labor force.
Race and sex comparisons within the manager class. Black and white male man- agers do not differ significantly in the slopes of any variables in either the simple or the expanded regressions (Tables 6B:9; 7B:9). It can reasonably be said that an increment of education has essentially the same payoff for blacks and whites, once they become managers.
There is greater ambiguity, however, in the analysis of income gaps. While in formal statistical terms, the average income gap between black and white male man- agers is not statistically different at the 5% level in either the simple or the expanded regression, the absolute magnitudes of the gaps are still large when compared to many of the other comparisons we are making. These results reflect the intrinsic ambiguity of using "significance level" as the criterion of the relative strength of the difference between groups. A low level of significance

50 AMERICAN SOCIOLOGICAL REVIEW
of a difference in coefficients can mean either that the two groups really do not differ in the coefficient or that they do dif- fer substantially, but the difference is mea- sured very imprecisely (i.e., the test is of low power).
The comparison of sexes within the man- agerial class is less problematic (Tables 6B: 10- 1; 7B:10-11). Again, there are no significant differences in the slopes of any of the variables, with the exception of the education slope in the expanded regression in the comparison of white female and black male managers. We have no explana- tion for this result. However, there is a very substantial average gap in income be- tween white female managers and both white and black male managers in both re- gression equations. With a large sample, even if it should turn out that there was a significant income gap between black and white male managers, these data strongly indicate that the sex differences among managers are considerably greater than the race differences.
Race and sex comparisons within the working class. By and large, the results for the comparisons of sex and race categories among workers are substantially the same as among managers. None of the race-sex categories differ in education slope in the simple regression and, with the marginal exception of the comparison of black and white women, none differ in the expanded regression (Tables 6B: 12-15; 7B: 12-15). Therefore, it appears that the returns to education are roughly the same for all workers regardless of race and sex.
Furthermore, within sex categories, there are also no significant income gaps be- tween blacks and whites. Therefore, as in the managerial category, we cannot reject the null hypothesis that black and white male workers have essentially the same re- gression equations, and black and white female workers have essentially the same regression equations, especially for the sim- ple regressions of income on education.
Between male and female workers of both races, however, there is a very signifi- cant average gap in income. The gap be- tween white female and white male work- ers is some $3,300 and between black
male and white female workers, over $2,600 in the simple regressions. Adding the control variables has virtually no effect on these differences. Thus again, as in the managerial category, the sex differences within the working class are much more striking than the race differences.
GENERALIZATIONS AND INTERPRETATIONS
At the most general level, the results of this study clearly show that classes defined in terms of social relations of production are consequential in American society. The differences between classes in levels of income and in the relationship between education and income are substantial, and these differences do not disappear when we control for variables such as occupational status, age, job tenure, sex or race. Fur- thermore, in terms of explained variance in income, class position is at least as pow- erful an explanatory variable as occupa- tional status.'5 A number of other more specific generalizations can be made.
The returns to education within the man- agerial category are greater than within the working class category. This result was strongly supported both for the sample as a whole and for white males taken sepa- rately in both regression equations.
This is one of the most important find- ings of the study and has considerable im- plications for the understanding of income inequality. While much more research is necessary to decipher fully this class inter- action in returns to education, we can offer some preliminary lines of interpretation. As suggested earlier, we argue that the higher returns to education among man- agers than among workers reflect the steep income gradients associated with mana-
'l It must be recognized that class itself still explains only a relatively small proportion of the total variance in income (14.5 percent in Table 4). A full model explaining income variation would have to include many other variables, such as economic sector, region of country, un- ionization, etc. The critical argument of this paper is not that class explains everything but, rather, that other variables must be examined in terms of their interactions with class position in order to unravel the nature of income deter- mination.

MARXIST CLASS CATEGORIES AND INCOME INEQUALITY 51
gerial hierarchies on the one hand, and the role of education in sorting people into different levels of the hierarchy on the other.
In both Marxist and non-Marxist tradi- tions, "wages" (and, correspondingly, in- come from wages and salaries) have been conceptualized as part of an exchange re- lationship-an unequal, asymmetrical ex- change in the Marxist perspective which hides an exploitive relation; an equal, reci- procal exchange in non-Marxist perspec- tives which reflects the marginal produc- tivity of the wage earner.
An alternative view is that wages are not merely payment for services rendered (i.e., exchange), but are also part of a structure of social control within businesses and bureaucracies. Wage differentials should be considered, in part, a political response to the problem of social order within or- ganizations rather than either simply an economic response to the human capital of the wage earner or merely the phenom- enal form of a system of surplus value extraction.
The conformity of the individual to the norms of any institution is guaranteed by a variety of threats of punishment for de- viance and promises of rewards for com- pliance. The balance between these punish- ments and inducements, and their specific forms, depends strongly upon the individ- ual's position in the process of production. For workers in the lowest skill levels, es- pecially when they are in peripheral busi- nesses, the dominant mode of control is threats of various sorts, especially the threat of being fired. For workers with higher levels of skills, particularly when they are employed in core industries, there is much more reliance on various positive inducements: progressively increasing pay and vacation time, good pensions, job pro- motions, and so on (Stone, 1974). For employees who occupy positions in the au- thority structure of an enterprise, the in- ducement mode of control is even more dominant. Repressive forms of control (such as the threat of being fired) become residual instruments used only in the last resort.
The dominance of rewards as the basic
mode of control of managers reflects a basic asymmetry of punishments and in- ducements as mechanisms of social con- trol: punishments are administered only when concrete infractions are committed and discovered. They are, therefore, gen- erally effective only for preventing bad be- havior. Punishments are not a very effec- tive strategy for encouraging responsible behavior. Rewards, on the other hand, can be doled out roughly in proportion to the quality of the individual's performance and thus can be used as a more flexible instru- ment for encouraging enthusiastic, respons- ible and even innovative behavior. In the case of workers at the bottom, there is little need for them to perform in a responsible and creative way. As with the private in the army, the employer is mainly concerned that the production line worker more or less does what he/she is told to do. Obedi- ence rather than initiative is the basic per- formance norm. But for supervisors in general, and supervisors at the middle and top levels of the management hierarchy in particular, the interests of the organization require more than dependability and me- chanical obedience. For the power of man- agers to be wielded effectively, their be- havior must be controlled by mechanisms which encourage responsibility rather than simply repress deviance from the rules. It is therefore expected that authority hier- archies will be characterized by very steep income gradients.'0
It might well be asked, what has this to do with the relationship of income to edu- cation in the manager category and the worker class? In addition to developing various skills, education can be seen as
1ha It should be noted that this interpretation of the authority hierarchy income gradient is quite different from the logic of the Davis-Moore ( 1945) interpretation. We are not arguing that there is any inherent scarcity of talent or any inherent problems of recruiting people for posi- tions in the authority hierarchy, but rather that once a person is in such a position, there is a problem of social control which is, in part, solved by the structure of income rewards. For a some- what different elaboration of this perspective which emphasizes the punishment aspect of the control apparatus rather than inducement (see Wright, 1973:314-20).

52 AMERICAN SOCIOLOGICAL REVIEW
having two complementary functions with respect to authority structures (Edwards, 1972; Bowles and Gintis, 1975). First, education serves as a legitimation for in- equalities of power and second, education helps to socialize people to the different work habits, patterns of discipline and social demands of different positions in the production process. In particular, higher levels of education tend to socialize people to the work habits appropriate for occupy- ing positions in the authority hierarchy. Among managers, it would be expected that there would be a fairly close associa- tion between their position in the authority hierarchy and their level of schooling. This association has been demonstrated by Tan- nenbaum et al. (1974:110-3). On the basis of the logic of social control elab- orated above, we would also expect that there should be a fairly close association between income and the authority hier- archy (see Tannenbaum et al., 1974:106- 8). Thus, we would predict that among managers there should be a fairly steep income gradient for educational attainment as well. This is precisely the result we have observed.
In these terms, the education coefficient for workers in Figure 2A can be thought of as the payoff to education for those peo- ple with zero authority, while the difference between the worker and manager regres- sions at each level of education reflects the extra income managers can get by cashing in their education on positions in the man- agerial hierarchy. If this interpretation of the steeper managerial returns to education is correct, then it would be predicted that, within specific levels of managerial hier- archies, the returns to education should be much closer to those of workers. Unfor- tunately, in the present study there are no data appropriate for testing this proposi- tion.
The class differences between managers and workers tend to be less marked among white women and black men than among white men. White female managers and workers differ hardly at all in returns to education, and the average gap in their income is very small in both regression equations. Although there is a significant
difference in education slopes between managers and workers among black men, the income gap is quite small.
These results suggest that black male and white female managers look more like workers than do their white male counter- parts. One partial explanation for this might be that black male and white female managers are more highly concentrated at the very bottom of managerial hierarchies than are white male managers. It would be expected that they would tend to be line supervisors of various sorts rather than middle managers, and that very few indeed would become top level managers in either private businesses or public bu- reaucracies. This would tend to depress the overall payoff for becoming a manager and reduce the differences between managers and workers. The present survey provides no data directly relevant to this hypothesis, and we have been unable to find other studies which systematically analyze the position of blacks and women in compari- son with white males in authority hier- archies.
Even when education, occupational status, age and job tenure are controlled for, employers have greater income than either managers or workers. This result occurs in spite of the fact that the em- ployers in the sample overwhelmingly are small businessment rather than large capi- talists (see footnote 7). Thus, despite the- ories of the managerial revolution, the postindustrial society and other perspec- tives which claim that authority and/or knowledge stratification has superseded property stratification, the results of the present research indicate that the class di- vision between property-holders and non- property-holders is still very real, even when only small property-holders are con- sidered.
The returns to education for small em- ployers are much greater than for workers and managers. This was an unexpected re- sult. Since employers are not paid a direct return to education but, rather, pay them- selves an income out of their profits, the income of employers should be linked to education only to the extent that the quant- ity and profitability of their property was

MARXIST CLASS CATEGORIES AND INCOME INEQUALITY 53
closely associated with the level of their education. We did not expect this to be the case but, apparently, at least for small businessmen, such a link is present.
In retrospect, this is not so terribly sur- prising. Among quite small employers, after all, differences in education would correspond to differences between shop- keepers on the one hand and doctors, law- yers and other professionals on the other. Since 78% of the employers in the present sample employ fewer than ten employees, it seems likely that the relationship of edu- cation to type of business may account for much of the steepness of the employer edu- cation coefficient. Among larger employers, it would be expected that education would make less difference in income.
There is some suggestive evidence in the present survey which supports this inter- pretation. Eighteen employers in the sam- ple stated that they employed ten or more employees. When the regression equations are run separately for this subgroup, it is found that indeed they do have much flat- ter education coefficients than employers who employed fewer than ten employees. In the simple regression, small employers received $4,285 for each increment in edu- cation whereas the larger employers re- ceived only $1,221.17 This coefficient is smaller than the one for managers. The average income gap between large and small employers, as one would expect, was relatively large-$4,155. Because of the small number of large employers, it was not possible to test formally the signifi- cance levels of these comparisons. How- ever, they do suggest that as the actual labor of an employer becomes a smaller proportion of the total labor of a business,
the education of the employer matters less as a determinant of his income. It would be expected that for truly large capitalists (employing 500 or more workers) the re- turns to education would be even smaller and the adjusted constants correspondingly higher.
The class differences between workers and employers are considerably greater than the differences between men and women or between blacks and whites within the working class. The standardized income gap between workers and employ- ers is generally two to three times as great as the standardized gap between male and female workers of either race, and the gap between black and white workers of the same sex is, at most, a tenth as large as the gap between workers and employers.18 The differences in education slopes are very small between sexes or races within the working class, but are quite substantial and highly significant between workers and em- ployers. Furthermore, race and sex groups within the working class differ by a maxi- mum of about $200 in returns for a decile increase in occupational status, whereas employers and workers differ by over $2,000. In a Marxist perspective, these re- sults are very much what would be ex- pected. In economic terms, class exploita- tion is a theoretically more fundamental division within capitalist society than is either sex or race, and thus the differences between the working class and the capital- ist class should be more substantial than the differences between male and female workers or black and white workers.
Within class categories, races and sexes appear to have very similar returns to edu- cation. These results must be considered somewhat tentative since the sample size, especially for the race comparisons, is rela- tively small. Nevertheless, it seems fairly safe to conclude that at least part of the
17 There was one outlier in the large employer group-an individual who employed more than ten workers but reported an annual income of only $3,000. This individual also happened to have a low level of education, and leaving him in the regression increased the education slope for large employers considerably (to $2,100 from $1,221).) Since it is implausible that an employer of more than ten people would actually have a real income of only $3,000 a year (presumably in this case the employer had a bad year and lived off his capital), we have excluded this indi- vidual from the regression.
18 Note that we are comparing "standardized income gaps" rather than "average income gaps" in this conclusion. It is impossible to compare average income gaps since they are assessed at a different point for each comparison. The stan- dardized income gaps, on the other hand, are assessed at the same point, mean values of the independent variables for the employer category.

54 AMERICAN SOCIOLOGICAL REVIEW
differential returns to education for blacks and whites is a consequence of the class composition of the two races. If this result is confirmed with more extensive data, it would suggest that racial discrimination operates more in sorting people into class positions in the first place than in giving them lower income for given levels of edu- cation and skills once they are in a class position.
Within class categories, the income gap between races tends to be much smaller than between sexes. The standardized in- come gap between white males and white females is nearly five times greater than between black males and white males in both the working class and the managerial category in the simple regression. The dif- ference is even greater in the expanded regressions. Again, racism may be particu- larly important in allocating people into different class categories in the first place. However, once a person is located in a class position, sex differences in income are considerably larger than race differ- ences.
Obviously, this study is only a first step in the development of a sophisticated use of structural class categories in quantita- tive research. It would be desirable in the future to use these categories in more elab- orate path models of income determination including extensive information on back- ground. It is also crucially important to examine the extent to which various class boundaries are crossed in the course of individual work-lives. While much research has been done on the movement across the blue-collar/white collar occupational "boundary," both within generations and between generations, none we have found systematically has explored the movement across structural class boundaries. The many questions concerning the internal stratification within structural classes also need to be researched. It is our hope that the present work will open up the possi- bility of bringing Marxist categories into the heart of quantitative research on social inequality as well as making quantitative research seem more relevant to Marxist social scientists. To ignore these theoretical and empirical issues is to ignore a crucial
dimension in the structure of inequality in American society.
REFERENCES Balibar, E.
1970 "The basic concepts of historical ma- terialism." Pp. 199-308 in L. Althauser and E. Balibar, Reading Capital. Lon- don: New Left Books.
Barber, B. 1957 Social Stratification. New York: Har-
court, Brace and World. Bell, D.
1973 The Coming of Post-Industrial Society. New York: Basic Books.
Berle, A. A. and G. Means 1932 The Modern Corporation and Private
Property. New York: Macmillan. Bettelheim, C.
1975 Economic Calculation and Forms of Property. New York: Monthly Review Press.
Blau, P. and 0. D. Duncan 1967 The American Occupational Structure.
New York: Wiley. Bowles, S.
1972 "Schooling and inequality from gener- ation to generation." Journal of Politi- cal Economy 80:S219-51.
Bowles, S. and H. Gintis 1975 Schooling in Capitalist America: Edu-
cational Reform and Contradictions of Economic Life. New York: Basic Books.
Bukharin, N. 1969 Historical Materialism. Ann Arbor:
Ann Arbor Paperbacks. Carchedi, G.
1975a "The economic identification of the new middle class." Economy and Society 4:1-83.
1975b "Reproduction of social classes at the level of production relations." Economy and Society 4:361-417.
Dahrendorf, R. 1959 Class and Class Conflict in Industrial
Society. Stanford, Ca.: Stanford Uni- versity Press.
Davis, K. and W. E. Moore 1945 "Some principles of stratification."
American Sociological Review 10:242- 9.
De Vroey, M. 1975 "The separation of ownership and con-
trol in large corporations." Review of Radical Political Economics 72():I- 10.
Duncan, 0. D. 1969 "Inheritance of poverty or inheritance
of race?" Pp. 85-109 in D. P. Moyni- han (ed.), On Understanding Poverty. New York: Basic Books.
Duncan, 0. D. and P. Blau 1967 The American Occupational Structure.
New York: Wiley.

MARXIST CLASS CATEGORIES AND INCOME INEQUALITY 55
Edwards, R. C. 1972 Alienation and Inequality: Capitalist
Relations of Production in Bureaucratic Enterprises. Ph.D. dissertation, Depart- ment of Economics. Harvard Univer- sity.
Galbraith, J. K. 1967 The New Industrial State. New York:
Houghton Mifflin. Giddens, Anthony
1973 The Class Structure of the Advanced Societies. New York: Barnes and Noble.
Harrison, B. 1972 "Education and underemployment in
the urban ghetto." American Economic Review 62:796-812.
Jencks, C., M. Smith, H. Acland, M. J. Bane, D. Cohen, H. Gintis, B. Heyns and S. Michelson
1972 Inequality. New York: Harper and Row.
Kmenta, J. 1971 Elements of Econometrics. New York:
Macmillan. Lenin, V.
1969 "A great beginning." Pp. 478-96 in Selected Works. London: Lawrence and Wishart.
Lenski, G. 1966 Power and Privilege. New York: Mc-
Graw-Hill. Marx, K.
1967 Capital, Vol. 1. New York: New World Paperbacks.
Menshikov, S. 1969 Millionaires and Managers. Moscow.
Progress Publishers. Parkin, F.
1971 Class Inequality and Political Order. New York: Praeger.
Parsons, T. 1970 "Equality and inequality in modern so-
society." Pp. 13-72 in E. 0. Laumann (ed.), Social Stratification: Research and Theory for the 1970s. New York: Bobbs-Merrill.
Poulantzas, N. 1973 "On social classes." New Left Review
78 :27-54. 1975 Classes in Contemporary Capitalism.
London: New Left Books.
Przeworski, A. 1976 The Process of Class Formation: From
Karl Kautsky's "Class Struggle" to Re- cent Controversies. Mimeo, Depart- ment of Political Science, University of Chicago.
Siegel, P. 1965 "On the cost of being Negro." Socio-
logical Inquiry 35:41-57. Stolzenberg, R. M.
1975 "Education, occupation and wage dif- ferences between white and black men." American Journal of Sociology 81:299- 323.
Stone, K. 1974 "The origins of job structures in the
steel industry." Review of Radical Po- itical Economics 6(2):113-73.
Tannenbaum, A. 1974 Hierarchy in Organizations. San Fran-
cisco: Jossey-Bass. Warner, W. L.
1960 Social Class in America. New York: Harper and Row.
Weber, M. 1968 Economy and Society. Gunther Ross
(ed.). New York: Bedminister. Weiss, R:
1970 "The effect of education on the earn- ings of blacks and whites." Review of Economics and Statistics 52:150-9.
Williams, R. M., Jr. 1960 American Society: A Sociological In-
terpretation. New York: Knopf. Wright, E. 0.
1973 The Politics of Punishment. New York: Harper Colophon.
1976a Class Structure and Income Inequality. Unpublished Ph.D. dissertation, De- partment of Sociology, University of California, Berkeley.
1976b "Class boundaries in advanced capitalist societies," New Left Review 98:3-41.
Zeitlin, M. 1974 "Corporate ownership and control: the
large corporation and the capitalist class." American Journal of Sociology 79:87-123.