authors asia pacific market structure chartbook - … pacific market structure chartbook 2q2017...
TRANSCRIPT

0%
2%
4%
6%
8%
10%
12%
First 30 trade days post CAS 2Q17
HIGHLIGHTS
¬ HONG KONG’S CAS VOLUME INCHES UP SINCE ITS INITIAL LAUNCH. PHASE II SCHEDULED FOR JULY 24.
¬ STOCK CONNECT IN THE SPOTLIGHT FOLLOWING THE CHINA A SHARE INCLUSION.
¬ VOLUMES START TO INCREASE ON THE BSE FOLLOWING LIQUIDITY PLAY.
Expanding the Hong Kong Closing Auction Session (CAS)
The second phase for the Hong Kong CAS planned by the HKEx is scheduled to begin July 24 and will include an additional 150 stocks from the Hang Seng Composite SmallCap index as well as short selling. Overall market feedback on the closing auction has been positive; the auction has attracted an average 6.6% of daily volume since inception, with rebalance days hitting highs between 20% and 35%.
Comparing 2Q2017 closing auction volume to the initial launch period shows a marginal increase from 4.3% to 5.6% of daily turnover. Volume in the last 15 minutes of the day has decreased from 17% pre-CAS to 9% in the most recent quarter.
CONTACT
Asia Pacific +852.2846.3500
Canada+1.416.874.0900
EMEA+44.20.7670.4000
United States+1.212.588.4000
[email protected] www.itg.com
Asia Pacific Market StructureChartbook
2Q2017
AUTHORS
Duncan BeggDirectorHead of Algo Product Management - Asia Pacific ITG Asia [email protected]
Heath MooneyDirectorSenior Sales TraderITG Asia [email protected]
Bobby SoVice PresidentProduct Manager – AlgorithmsITG Asia [email protected]
Erin StantonManaging DirectorHead of Analytical Products and ResearchITG Asia [email protected]
Clare WittsDirectorHead of Client Relationship ManagementITG Asia Pacific [email protected]
Hong Kong Volume Profile - CAS
% d
aily
vol
ume
Source: ITG
Trading period

0%
10%
20%
30%
40%
50%
60%
70%
80%
90%
100%
4Q14 1Q15 2Q15 3Q15 4Q15 1Q16 2Q16 3Q16 4Q16 1Q17
Stock Connect Non-Stock Connect
0
5
10
15
20
25
30
4Q14 1Q15 2Q15 3Q15 4Q15 1Q16 2Q16 3Q16 4Q16 1Q17
2Q2017 2
Fourth time’s the charm
The long-awaited inclusion of China A shares in the MSCI Emerging Markets Index became a reality June 20 following three failed attempts. The initial weighting is relatively small, with 222 China A share stocks making up 0.73% of the index. The inclusion is expected to attract $17 billion to $18 billion in foreign investments when it is phased in in May and August 2018.
The inclusion relies heavily upon the Hong Kong Stock Connect links, which will serve as a de facto capital control for foreign investors, given the daily limits on both northbound and southbound trading. Initial participation in Stock Connect was very light based on buy-side participation from ITG’s Global Peer universe, but participa-tion has continued to increase and now accounts for 20% to 30% of China A share volume.
Stock Connect Usage by the Buy Side
Source for all charts: ITG Global Peer database
Buy Sides Using Stock Connect
Stock Connect has increased to nearly 30% in 4Q2016.
The number of buy sides using Stock Connect has continued to rise, reaching a peak of 28 clients in 2Q2016.

0%
10%
20%
30%
40%
50%
60%
70%
80%
90%
100%
Apr May Jun Jul
BSE Volume NSE Volume
2Q2017 3
Volumes start to increase on the BSE following liquidity play
The Bombay Stock Exchange (BSE) revised its transaction charges in April to lure larger traders from the its main competitor, the National Stock Exchange of India (NSE). Prior to April, the BSE charged a flat rate based on gross turnover, but now the basis is monthly trade count. The per-trade charge decreases as the monthly trade count increases, rewarding those with larger turnover. A recent announcement sees a marginal increase in the transaction-count charge, though overall fees still remain below what the NSE charges.
The BSE’s percentage of total volume has started to increase over the past three months, reaching 16% as of July 13. It’s still too early to tell whether this trend will continue, but with the NSE market outage on July 10, coupled with the lower transac-tion charges, it is starting to look favorable for the BSE. BSE and NSE Volumes
% d
aily
vol
ume
Source: Bloomberg data

0.9 2.1 3.4 3.6 3.99.6 13.0
23.838.4
71.3
89.7
145.3
0.10
20
40
60
80
100
120
140
160
6 14 15 15 1730 30 33 54 63 72
54
195
36 14 15 17 1930 33 37 45
59 67 68
238
30
50
100
150
200
250
300
350
1Q17 2Q17
42Q2017
Expected Impact Costs for a US$100mm Market-Level Portfolio 1Q2017 vs. 2Q2017
Demand for Liquidity of a US$100mm Market-Level Portfolio as of 2Q2017
Source for all charts: ITG
REGIONAL TRADING COST SUMMARY
Expected impact costs remained flat in Japan, Australia, Hong Kong and Korea while the largest decreases—observed in Malaysia, the Philippines and Thailand—were being driven by improvements in historical volatility. Liquidity conditions improved in China, Korea, Taiwan, Thailand and the Philippines.
%M
DV
Note: The average order size in New Zealand was very large and was removed from this chart for scale purposes.
bps

2Q2017 5
POINTS OF INTEREST BY MARKET
The quarter was marked by consistent intraday volatility and decreasing spreads across many of the markets in the region. Daily volumes remained elevated in Hong Kong, Taiwan and Malaysia.
Developed
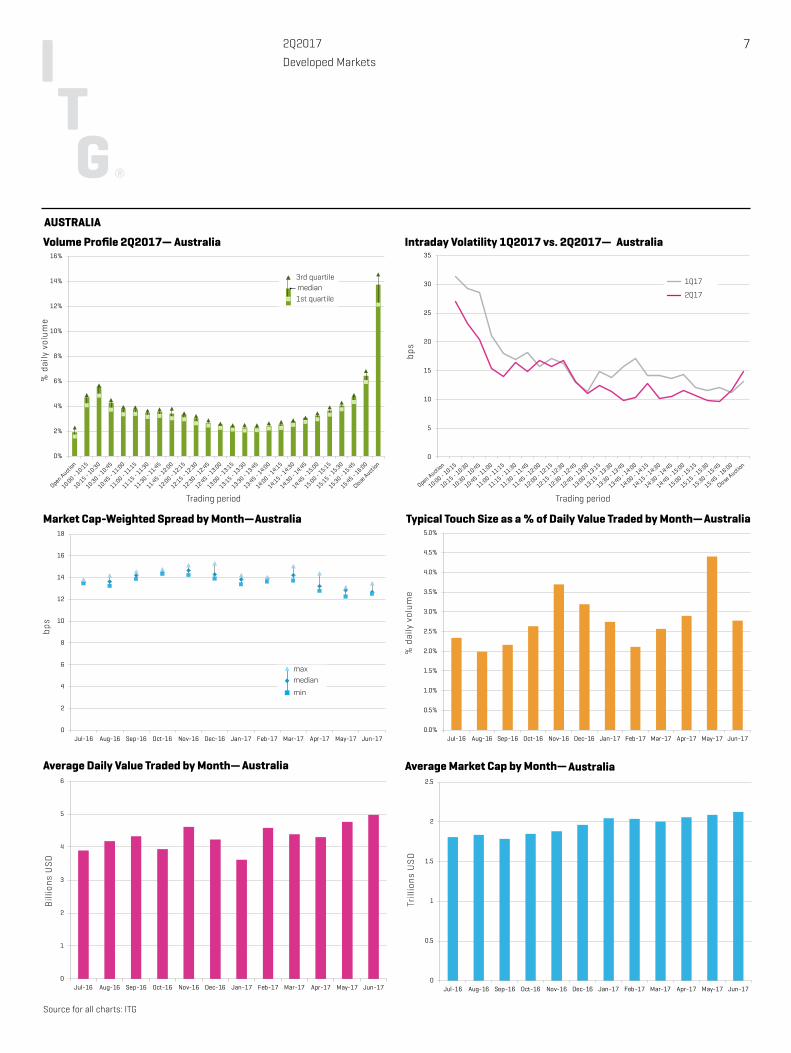
AUSTRALIA (p7): Australia was one of two markets to see a decrease in intraday volatility in Q2, and spreads reached a 12-month low at only 12.7 bps. Market cap remained over the 2 trillion mark for the second quarter in a row.
HONG KONG (p8): Intraday volatility remained consistent with that in Q1, and elevat-ed volumes continued across the quarter. Spreads have shown a gradual decrease over the past nine months, ending the quarter at just over 16 bps.
JAPAN (p9): Spreads fell month-over-month in Q2 and averaged only 4.4 bps in June. Post-lunch break volatility decreased, while 18% of volume continued to be executed in the last 15 minutes of the day.
NEW ZEALAND (p10): Intraday volumes in New Zealand continue to increase leading into the closing auction, with 30% of daily volume completing in the last hour of the day, including the auction. Spreads fell from highs seen in November 2016, averag-ing 30.7 bps in 2Q17.
SINGAPORE (p11): Average market caps continued to increase in Q2, averaging more than 950 million in June. Singapore continued to trade heavily into the close, with 18% of turnover executing in the last 15 minutes of the day, including the auction.
Semi-Developed
KOREA (p12): May and June average daily volumes reached a 12-month high, well surpassing the $8 billion mark. Spreads and volatility remained flat quarter-over-quarter.
TAIWAN (p13): Q1 and Q2 volumes remained higher than 2016 levels, and the open continued to dominate the volume curve in Taiwan, with 36% of total turnover executing in the first hour of the day, including the opening auction.

2Q2017 6
Emerging
CHINA (p14): Spreads have continued to fall in China, with June averages just over 7 bps. Average daily volume for the quarter remained around the 65 billion mark for the second quarter in a row.
INDIA (p15): Intraday volatility stepped down from Q1 levels while market cap continued to steadily approach the $2 trillion mark.
INDONESIA (p16): The gradual decrease in spreads continued in Q2, hitting below 26 bps for the first time in 12 months. Intraday volatility remained higher leading into the closing auction.
MALAYSIA (p17): Spreads also continued to decrease in Malaysia, nearing 20 bps in June. Average daily volumes remained elevated over 2016 levels.
PHILIPPINES (p18): Average daily volumes spiked in June, with a surprising 200 million in daily turnover, while spreads continued to decrease, falling under 11 bps for the first time in 12 months.
THAILAND (p19): Q2 marked the slowest quarter over the past 12 months, with average turnover reaching only 1.1 billion. Both spreads and volatility remained flat quarter-over-quarter in Thailand.
0%
2%
4%
6%
8%
10%
12%
14%
16%
0
2
4
6
8
10
12
14
16
18
Jul-16 Aug-16 Sep-16 Oct-16 Nov-16 Dec-16 Jan-17 Feb-17 Mar-17 Apr-17 May-17 Jun-17
0
5
10
15
20
25
30
35
0.0%
0.5%
1.0%
1.5%
2.0%
2.5%
3.0%
3.5%
4.0%
4.5%
5.0%
Jul-16 Aug-16 Sep-16 Oct-16 Nov-16 Dec-16 Jan-17 Feb-17 Mar-17 Apr-17 May-17 Jun-17
0
1
2
3
4
5
6
Jul-16 Aug-16 Sep-16 Oct-16 Nov-16 Dec-16 Jan-17 Feb-17 Mar-17 Apr-17 May-17 Jun-170
0.5
1
1.5
2
2.5
Jul-16 Aug-16 Sep-16 Oct-16 Nov-16 Dec-16 Jan-17 Feb-17 Mar-17 Apr-17 May-17 Jun-17
median
min
max
median1st quartile
3rd quartile 1Q17
2Q17
72Q2017
Volume Profile 2Q2017—
Market Cap-Weighted Spread by Month—
Average Daily Value Traded by Month— Average Market Cap by Month—
bps
Bill
ions
US
D
Trill
ions
US
D
Source for all charts: ITG
Intraday Volatility 1Q2017 vs. 2Q2017—
bps
Typical Touch Size as a % of Daily Value Traded by Month—
% d
aily
vol
ume
Trading period Trading period
% d
aily
vol
ume
Developed Markets
Australia
AUSTRALIA
Australia
Australia Australia
Australia Australia

0%
1%
2%
3%
4%
5%
6%
7%
8%
9%
10%
0
5
10
15
20
25
30
35
40
45
50
0
5
10
15
20
25
Jul-16 Aug-16 Sep-16 Oct-16 Nov-16 Dec-16 Jan-17 Feb-17 Mar-17 Apr-17 May-17 Jun-170.0%
0.5%
1.0%
1.5%
2.0%
2.5%
3.0%
3.5%
Jul-16 Aug-16 Sep-16 Oct-16 Nov-16 Dec-16 Jan-17 Feb-17 Mar-17 Apr-17 May-17 Jun-17
0
1
2
3
4
5
6
7
8
9
Jul-16 Aug-16 Sep-16 Oct-16 Nov-16 Dec-16 Jan-17 Feb-17 Mar-17 Apr-17 May-17 Jun-170
0.5
1
1.5
2
2.5
3
3.5
4
4.5
Jul-16 Aug-16 Sep-16 Oct-16 Nov-16 Dec-16 Jan-17 Feb-17 Mar-17 Apr-17 May-17 Jun-17
median
min
max
median1st quartile
3rd quartile 1Q17
2Q17
82Q2017
Volume Profile 2Q2017—
Market Cap-Weighted Spread by Month—
Average Daily Value Traded by Month— Average Market Cap by Month—
bps
Bill
ions
US
D
Trill
ions
US
D
Source for all charts: ITG
Intraday Volatility 1Q2017 vs. 2Q2017—
bps
Typical Touch Size as a % of Daily Value Traded by Month—
% d
aily
vol
ume
Trading period Trading period
% d
aily
vol
ume
Developed Markets
Hong Kong
HONG KONG
Hong Kong
Hong Kong Hong Kong
Hong Kong Hong Kong

0%
2%
4%
6%
8%
10%
12%
0
1
2
3
4
5
6
7
Jul-16 Aug-16 Sep-16 Oct-16 Nov-16 Dec-16 Jan-17 Feb-17 Mar-17 Apr-17 May-17 Jun-17
0
5
10
15
20
25
30
35
0.0%
0.1%
0.2%
0.3%
0.4%
0.5%
0.6%
0.7%
0.8%
Jul-16 Aug-16 Sep-16 Oct-16 Nov-16 Dec-16 Jan-17 Feb-17 Mar-17 Apr-17 May-17 Jun-17
0
5
10
15
20
25
30
Jul-16 Aug-16 Sep-16 Oct-16 Nov-16 Dec-16 Jan-17 Feb-17 Mar-17 Apr-17 May-17 Jun-170
1
2
3
4
5
6
7
Jul-16 Aug-16 Sep-16 Oct-16 Nov-16 Dec-16 Jan-17 Feb-17 Mar-17 Apr-17 May-17 Jun-17
median
min
max
median1st quartile
3rd quartile 1Q17
2Q17
92Q2017
Volume Profile 2Q2017—
Market Cap-Weighted Spread by Month—
Average Daily Value Traded by Month— Average Market Cap by Month—
bps
Bill
ions
US
D
Trill
ions
US
D
Source for all charts: ITG
Intraday Volatility 1Q2017 vs. 2Q2017—
bps
Typical Touch Size as a % of Daily Value Traded by Month—
% d
aily
vol
ume
Trading period Trading period
% d
aily
vol
ume
Developed Markets
Japan
JAPAN
Japan
Japan Japan
Japan Japan

0%
2%
4%
6%
8%
10%
12%
0
10
20
30
40
50
60
Jul-16 Aug-16 Sep-16 Oct-16 Nov-16 Dec-16 Jan-17 Feb-17 Mar-17 Apr-17 May-17 Jun-17
0
5
10
15
20
25
30
35
40
0%
5%
10%
15%
20%
25%
Jul-16 Aug-16 Sep-16 Oct-16 Nov-16 Dec-16 Jan-17 Feb-17 Mar-17 Apr-17 May-17 Jun-17
0
20
40
60
80
100
120
140
Jul-16 Aug-16 Sep-16 Oct-16 Nov-16 Dec-16 Jan-17 Feb-17 Mar-17 Apr-17 May-17 Jun-170
50
100
150
200
250
300
350
400
Jul-16 Aug-16 Sep-16 Oct-16 Nov-16 Dec-16 Jan-17 Feb-17 Mar-17 Apr-17 May-17 Jun-17
median
min
max
median1st quartile
3rd quartile 1Q17
2Q17
102Q2017
Volume Profile 2Q2017—
Market Cap-Weighted Spread by Month—
Average Daily Value Traded by Month— Average Market Cap by Month—
bps
Bill
ions
US
D
Trill
ions
US
D
Source for all charts: ITG
Intraday Volatility 1Q2017 vs. 2Q2017—
bps
Typical Touch Size as a % of Daily Value Traded by Month—
% d
aily
vol
ume
Trading period Trading period
% d
aily
vol
ume
Developed Markets
New Zealand
NEW ZEALAND
New Zealand
New Zealand New Zealand
New Zealand New Zealand
Mill
ions
US
D
Bill
ions
US
D

0
0.1
0.2
0.3
0.4
0.5
0.6
0.7
0.8
0.9
1
Jul-16 Aug-16 Sep-16 Oct-16 Nov-16 Dec-16 Jan-17 Feb-17 Mar-17 Apr-17 May-17 Jun-170
0.1
0.2
0.3
0.4
0.5
0.6
0.7
0.8
0.9
1
Jul-16 Aug-16 Sep-16 Oct-16 Nov-16 Dec-16 Jan-17 Feb-17 Mar-17 Apr-17 May-17 Jun-17
0%
2%
4%
6%
8%
10%
12%
0
5
10
15
20
25
30
35
40
45
Jul-16 Aug-16 Sep-16 Oct-16 Nov-16 Dec-16 Jan-17 Feb-17 Mar-17 Apr-17 May-17 Jun-17
0
5
10
15
20
25
30
35
0%
2%
4%
6%
8%
10%
12%
14%
Jul-16 Aug-16 Sep-16 Oct-16 Nov-16 Dec-16 Jan-17 Feb-17 Mar-17 Apr-17 May-17 Jun-17
median
min
max
median1st quartile
3rd quartile 1Q17
2Q17
112Q2017
Volume Profile 2Q2017—
Market Cap-Weighted Spread by Month—
Average Daily Value Traded by Month— Average Market Cap by Month—
bps
Bill
ions
US
D
Trill
ions
US
D
Source for all charts: ITG
Intraday Volatility 1Q2017 vs. 2Q2017—
bps
Typical Touch Size as a % of Daily Value Traded by Month—
% d
aily
vol
ume
Trading period Trading period
% d
aily
vol
ume
Developed Markets
Singapore
SINGAPORE
Singapore
Singapore Singapore
Singapore Singapore

0
10
20
30
40
50
60
0%
2%
4%
6%
8%
10%
12%
0
5
10
15
20
25
Jul-16 Aug-16 Sep-16 Oct-16 Nov-16 Dec-16 Jan-17 Feb-17 Mar-17 Apr-17 May-17 Jun-170.0%
0.2%
0.4%
0.6%
0.8%
1.0%
1.2%
1.4%
1.6%
Jul-16 Aug-16 Sep-16 Oct-16 Nov-16 Dec-16 Jan-17 Feb-17 Mar-17 Apr-17 May-17 Jun-17
0
1
2
3
4
5
6
7
8
9
10
Jul-16 Aug-16 Sep-16 Oct-16 Nov-16 Dec-16 Jan-17 Feb-17 Mar-17 Apr-17 May-17 Jun-170
0.2
0.4
0.6
0.8
1
1.2
1.4
1.6
Jul-16 Aug-16 Sep-16 Oct-16 Nov-16 Dec-16 Jan-17 Feb-17 Mar-17 Apr-17 May-17 Jun-17
median
min
max
median1st quartile
3rd quartile 1Q17
2Q17
122Q2017
Volume Profile 2Q2017—
Market Cap-Weighted Spread by Month—
Average Daily Value Traded by Month— Average Market Cap by Month—
bps
Bill
ions
US
D
Trill
ions
US
D
Source for all charts: ITG
Intraday Volatility 1Q2017 vs. 2Q2017—
bps
Typical Touch Size as a % of Daily Value Traded by Month—
% d
aily
vol
ume
Trading period Trading period
% d
aily
vol
ume
Semi-Developed Markets
Korea
KOREA
Korea Korea
Korea Korea
Korea

0%
2%
4%
6%
8%
10%
12%
14%
0
5
10
15
20
25
30
Jul-16 Aug-16 Sep-16 Oct-16 Nov-16 Dec-16 Jan-17 Feb-17 Mar-17 Apr-17 May-17 Jun-17
0
5
10
15
20
25
30
35
40
0.0%
0.5%
1.0%
1.5%
2.0%
2.5%
3.0%
3.5%
Jul-16 Aug-16 Sep-16 Oct-16 Nov-16 Dec-16 Jan-17 Feb-17 Mar-17 Apr-17 May-17 Jun-17
0
0.5
1
1.5
2
2.5
3
3.5
4
4.5
5
Jul-16 Aug-16 Sep-16 Oct-16 Nov-16 Dec-16 Jan-17 Feb-17 Mar-17 Apr-17 May-17 Jun-170
0.2
0.4
0.6
0.8
1
1.2
1.4
Jul-16 Aug-16 Sep-16 Oct-16 Nov-16 Dec-16 Jan-17 Feb-17 Mar-17 Apr-17 May-17 Jun-17
median
min
max
median1st quartile
3rd quartile 1Q17
2Q17
132Q2017
Volume Profile 2Q2017—
Market Cap-Weighted Spread by Month—
Average Daily Value Traded by Month— Average Market Cap by Month—
bps
Bill
ions
US
D
Trill
ions
US
D
Source for all charts: ITG
Intraday Volatility 1Q2017 vs. 2Q2017—
bps
Typical Touch Size as a % of Daily Value Traded by Month—
% d
aily
vol
ume
Trading period Trading period
% d
aily
vol
ume
Semi-Developed Markets
Taiwan
TAIWAN
Taiwan
Taiwan Taiwan
Taiwan Taiwan

0%
2%
4%
6%
8%
10%
12%
14%
0
2
4
6
8
10
12
Jul-16 Aug-16 Sep-16 Oct-16 Nov-16 Dec-16 Jan-17 Feb-17 Mar-17 Apr-17 May-17 Jun-17
0
5
10
15
20
25
30
35
40
45
0.00%
0.05%
0.10%
0.15%
0.20%
0.25%
0.30%
0.35%
Jul-16 Aug-16 Sep-16 Oct-16 Nov-16 Dec-16 Jan-17 Feb-17 Mar-17 Apr-17 May-17 Jun-17
0
10
20
30
40
50
60
70
80
90
100
Jul-16 Aug-16 Sep-16 Oct-16 Nov-16 Dec-16 Jan-17 Feb-17 Mar-17 Apr-17 May-17 Jun-176
6.2
6.4
6.6
6.8
7
7.2
7.4
7.6
Jul-16 Aug-16 Sep-16 Oct-16 Nov-16 Dec-16 Jan-17 Feb-17 Mar-17 Apr-17 May-17 Jun-17
median
min
max
median1st quartile
3rd quartile 1Q17
2Q17
142Q2017
Volume Profile 2Q2017—
Market Cap-Weighted Spread by Month—
Average Daily Value Traded by Month— Average Market Cap by Month—
bps
Bill
ions
US
D
Trill
ions
US
D
Source for all charts: ITG
Intraday Volatility 1Q2017 vs. 2Q2017—
bps
Typical Touch Size as a % of Daily Value Traded by Month—
% d
aily
vol
ume
Trading period Trading period
% d
aily
vol
ume
Emerging Markets
China
CHINA
China
China China
China China

0%
2%
4%
6%
8%
10%
12%
0
0.5
1
1.5
2
2.5
3
3.5
4
4.5
5
Jul-16 Aug-16 Sep-16 Oct-16 Nov-16 Dec-16 Jan-17 Feb-17 Mar-17 Apr-17 May-17 Jun-17
0
10
20
30
40
50
60
0.0%
0.1%
0.1%
0.2%
0.2%
0.3%
0.3%
0.4%
Jul-16 Aug-16 Sep-16 Oct-16 Nov-16 Dec-16 Jan-17 Feb-17 Mar-17 Apr-17 May-17 Jun-17
0
1
2
3
4
5
6
7
Jul-16 Aug-16 Sep-16 Oct-16 Nov-16 Dec-16 Jan-17 Feb-17 Mar-17 Apr-17 May-17 Jun-170
0.5
1
1.5
2
2.5
Jul-16 Aug-16 Sep-16 Oct-16 Nov-16 Dec-16 Jan-17 Feb-17 Mar-17 Apr-17 May-17 Jun-17
median
min
max
median1st quartile
3rd quartile 1Q17
2Q17
152Q2017
Volume Profile 2Q2017—
Market Cap-Weighted Spread by Month—
Average Daily Value Traded by Month— Average Market Cap by Month—
bps
Bill
ions
US
D
Trill
ions
US
D
Source for all charts: ITG
Intraday Volatility 1Q2017 vs. 2Q2017—
bps
Typical Touch Size as a % of Daily Value Traded by Month—
% d
aily
vol
ume
Trading period Trading period
% d
aily
vol
ume
Emerging Markets
India
INDIA
India
India India
India India

0%
2%
4%
6%
8%
10%
12%
0
5
10
15
20
25
30
35
Jul-16 Aug-16 Sep-16 Oct-16 Nov-16 Dec-16 Jan-17 Feb-17 Mar-17 Apr-17 May-17 Jun-17
0
10
20
30
40
50
60
70
80
0.0%
0.5%
1.0%
1.5%
2.0%
2.5%
3.0%
Jul-16 Aug-16 Sep-16 Oct-16 Nov-16 Dec-16 Jan-17 Feb-17 Mar-17 Apr-17 May-17 Jun-17
0
0.05
0.1
0.15
0.2
0.25
0.3
0.35
0.4
0.45
Jul-16 Aug-16 Sep-16 Oct-16 Nov-16 Dec-16 Jan-17 Feb-17 Mar-17 Apr-17 May-17 Jun-170
0.05
0.1
0.15
0.2
0.25
0.3
0.35
0.4
0.45
Jul-16 Aug-16 Sep-16 Oct-16 Nov-16 Dec-16 Jan-17 Feb-17 Mar-17 Apr-17 May-17 Jun-17
median
min
max
median1st quartile
3rd quartile 1Q17
2Q17
162Q2017
Volume Profile 2Q2017—
Market Cap-Weighted Spread by Month—
Average Daily Value Traded by Month— Average Market Cap by Month—
bps
Bill
ions
US
D
Trill
ions
US
D
Source for all charts: ITG
Intraday Volatility 1Q2017 vs. 2Q2017—
bps
Typical Touch Size as a % of Daily Value Traded by Month—
% d
aily
vol
ume
Trading period Trading period
% d
aily
vol
ume
Emerging Markets
Indonesia
INDONESIA
Indonesia
Indonesia Indonesia
Indonesia Indonesia

0%
2%
4%
6%
8%
10%
12%
0
5
10
15
20
25
30
Jul-16 Aug-16 Sep-16 Oct-16 Nov-16 Dec-16 Jan-17 Feb-17 Mar-17 Apr-17 May-17 Jun-17
0
5
10
15
20
25
30
35
0.0%
1.0%
2.0%
3.0%
4.0%
5.0%
6.0%
7.0%
8.0%
9.0%
10.0%
Jul-16 Aug-16 Sep-16 Oct-16 Nov-16 Dec-16 Jan-17 Feb-17 Mar-17 Apr-17 May-17 Jun-17
0
0.1
0.2
0.3
0.4
0.5
0.6
0.7
Jul-16 Aug-16 Sep-16 Oct-16 Nov-16 Dec-16 Jan-17 Feb-17 Mar-17 Apr-17 May-17 Jun-170
0.05
0.1
0.15
0.2
0.25
0.3
0.35
0.4
0.45
Jul-16 Aug-16 Sep-16 Oct-16 Nov-16 Dec-16 Jan-17 Feb-17 Mar-17 Apr-17 May-17 Jun-17
median
min
max
median1st quartile
3rd quartile 1Q17
2Q17
172Q2017
Volume Profile 2Q2017—
Market Cap-Weighted Spread by Month—
Average Daily Value Traded by Month— Average Market Cap by Month—
bps
Bill
ions
US
D
Trill
ions
US
D
Source for all charts: ITG
Intraday Volatility 1Q2017 vs. 2Q2017—
bps
Typical Touch Size as a % of Daily Value Traded by Month—
% d
aily
vol
ume
Trading period Trading period
% d
aily
vol
ume
Emerging Markets
Malaysia
MALAYSIA
Malaysia
Malaysia Malaysia
Malaysia Malaysia

0%
2%
4%
6%
8%
10%
12%
0
5
10
15
20
25
Jul-16 Aug-16 Sep-16 Oct-16 Nov-16 Dec-16 Jan-17 Feb-17 Mar-17 Apr-17 May-17 Jun-17
0
10
20
30
40
50
60
0.0%
0.2%
0.4%
0.6%
0.8%
1.0%
1.2%
1.4%
1.6%
Jul-16 Aug-16 Sep-16 Oct-16 Nov-16 Dec-16 Jan-17 Feb-17 Mar-17 Apr-17 May-17 Jun-17
0
0.05
0.1
0.15
0.2
0.25
Jul-16 Aug-16 Sep-16 Oct-16 Nov-16 Dec-16 Jan-17 Feb-17 Mar-17 Apr-17 May-17 Jun-170
0.05
0.1
0.15
0.2
0.25
0.3
0.35
Jul-16 Aug-16 Sep-16 Oct-16 Nov-16 Dec-16 Jan-17 Feb-17 Mar-17 Apr-17 May-17 Jun-17
median
min
max
median1st quartile
3rd quartile 1Q17
2Q17
182Q2017
Volume Profile 2Q2017—
Market Cap-Weighted Spread by Month—
Average Daily Value Traded by Month— Average Market Cap by Month—
bps
Bill
ions
US
D
Trill
ions
US
D
Source for all charts: ITG
Intraday Volatility 1Q2017 vs. 2Q2017—
bps
Typical Touch Size as a % of Daily Value Traded by Month—
% d
aily
vol
ume
Trading period Trading period
% d
aily
vol
ume
Emerging Markets
Philippines
PHILIPPINES
Philippines
Philippines Philippines
Philippines Philippines

0
0.2
0.4
0.6
0.8
1
1.2
Jul-16 Aug-16 Sep-16 Oct-16 Nov-16 Dec-16 Jan-17 Feb-17 Mar-17 Apr-17 May-17 Jun-17
0%
2%
4%
6%
8%
10%
12%
0
10
20
30
40
50
60
Jul-16 Aug-16 Sep-16 Oct-16 Nov-16 Dec-16 Jan-17 Feb-17 Mar-17 Apr-17 May-17 Jun-17
0
5
10
15
20
25
30
35
40
0.0%
2.0%
4.0%
6.0%
8.0%
10.0%
12.0%
Jul-16 Aug-16 Sep-16 Oct-16 Nov-16 Dec-16 Jan-17 Feb-17 Mar-17 Apr-17 May-17 Jun-17
0
0.2
0.4
0.6
0.8
1
1.2
1.4
1.6
1.8
Jul-16 Aug-16 Sep-16 Oct-16 Nov-16 Dec-16 Jan-17 Feb-17 Mar-17 Apr-17 May-17 Jun-17
median
min
max
median1st quartile
3rd quartile 1Q17
2Q17
192Q2017
Volume Profile 2Q2017—
Market Cap-Weighted Spread by Month—
Average Daily Value Traded by Month— Average Market Cap by Month—
bps
Bill
ions
US
D
Trill
ions
US
D
Source for all charts: ITG
Intraday Volatility 1Q2017 vs. 2Q2017—
bps
Typical Touch Size as a % of Daily Value Traded by Month—
% d
aily
vol
ume
Trading period Trading period
% d
aily
vol
ume
Emerging Markets
Thailand
THAILAND
Thailand
Thailand Thailand
Thailand Thailand

2Q2017 20
© 2017 Investment Technology Group, Inc. All rights reserved. Not to be reproduced or retransmitted without permission. 72017-8224
These materials are for informational purposes only, and are not intended to be used for trading or investment purposes or as an offer to sell or the solicitation of an offer to buy any security or financial product. The information contained herein has been taken from trade and statistical services and other sources we deem reliable but we do not represent that such information is accurate or complete and it should not be relied upon as such. No guarantee or warranty is made as to the reasonableness of the assumptions or the accuracy of the models or market data used by ITG or the actual results that may be achieved. These materials do not provide any form of advice (investment, tax or legal). ITG Inc. is not a registered investment adviser and does not provide investment advice or recommendations to buy or sell securities, to hire any investment adviser or to pursue any investment or trading strategy. All trademarks, service marks, and trade names not owned by ITG are the property of their respective owners. The positions taken in this document reflect the judgment of the individual author(s) and are not necessarily those of ITG.
Broker-dealer products and services are offered by: in the U.S., ITG Inc., member FINRA, SIPC; in Canada, ITG Canada Corp., member Canadian Investor Protection Fund (“CIPF”) and Investment Industry Regulatory Organization of Canada (“IIROC”); in Europe, Investment Technology Group Limited, registered in Ireland No. 283940 (“ITGL”) (the registered office of ITGL is Block A, Georges Quay, Dublin 2, Ireland). ITGL is authorized and regulated by the Central Bank of Ireland; in Asia, ITG Hong Kong Limited (SFC License No. AHD810), ITG Singapore Pte Limited (CMS License No. 100138-1), and ITG Australia Limited (AFS License No. 219582). All of the above entities are subsidiaries of Investment Technology Group, Inc. MATCHNow® is a product offering of TriAct Canada Marketplace LP (“TriAct”), member CIPF and IIROC. TriAct is a wholly owned subsidiary of ITG Canada Corp.
GLOSSARY
¬ Expected costs for a US$100mm market level portfolio—Calculated using ITG’s Agency Cost Estimator (ACE) model to estimate the market impact of investing a US$100 million portfolio in the index of the different countries*. ACE is a pretrade cost model that estimates transaction costs using a historical framework and is most often used within TCA as a sophisticated measure of order difficulty that accounts for more than just liquidity. The model uses order-specific details, including order size and trading strategy, as well as stock-specific market data—specifically 21-day median daily volume, five-day time-weighted spread, and 60-day historical volatility—and makes an important assumption of market neutrality.
¬ Demand for liquidity of a US$100mm market-level portfolio—ITG uses a 21-day median daily volume to calculate the demand of liquidity for any given order size.
¬ Volume profile—Median average of value traded in the index during the quarter, per 15-minute time bin.
¬ Intraday volatility—Quarterly median market cap-weighted calculation of change in total value of the index, per 15-minute time bin.
¬ Market cap-weighted spread—Market cap-weighted bid-ask spread of the index. Shows range of mean, median and max levels.
¬ Typical touch size as a % of daily value traded—Total bid and ask size as percentage of daily volume of all stocks in the market, turnover weighted.
¬ Average daily value traded—Quarterly mean average daily value traded in the market.
¬ Average market cap—Mean quarterly average market capitalization (calculated based on close price).
* COUNTRY INDICES USED FOR ANALYSIS:
AUS ASX 200 KOR KOSPI 200
CHN Shanghai Shenzhen CSI 300 MYS Kuala Lumpur Composite Index
HKG HSCI NZL NZX 50 Index Gross
IDN Jakarta LQ45 PHI PSEi Index
IND NIFTY 50 SGP Straits Times
JPN TOPIX THA Thailand SET 50 Index