author zill, nicholas; 'and other's title - eric resume ed 395 052 ud 030 865 author zill,...
TRANSCRIPT

DOCUMENT RESUME
ED 395 052 UD 030 865
AUTHOR Zill, Nicholas; 'And Other's
TITLE Adolescent Time Use, Risky Behavior, and Outcomes: AnAnalysis of National Data.
INSTITUTION Westat, Inc., Rockville, MD.
SPONS AGENCY Department of Health and Human Services, Washington,D.C.
PUB DATE 11 Sep 95
CONTRACT HHS-100-92-0005(WI)NOTE 138p.
PUB TYPE Reports Evaluative/Feasibility (142)
EDRS PRICE MF01/PC06 Plus Postage.
DESCRI.PTORS *Adolescents; Behavior Patterns; *ExtracurricularActivities; High Risk Students; High Schools; *HighSchool Seniors; Homevork; Longitudinal Studies;National Surveys; Prevention; RecreationalActivities; *Risk; Skill Development; *TimeManagement; Youth Programs
IDENTIFIERS Longitudinal Study of American Youth; Monitoring theFuture; National Education Longitudinal Study J988
ABSTRACTThe Monitoring the Future survey of high school
seniors, the Longitudinal Study of American Youth, and the NationalEducation Longitudinal Study of 1988 were used to provide informationabout adolescents' time use, their risky behaviors, and the outcomesof time-use patterns in the late 1980s and the.early 1990s. Spending
significant portions of their discretionary time in constructiveactivities may develop useful skills and lessen adolescents' chancesol engaging in risky behavior. Data confirmed that relatively fewU.S. adolescents were spending significant portions of their freetime in constructive activities. Overall, they devoted little time tohomework, and, although many reported participating in noncompulsoryactivities at school, most spent relatively little time in suchactivities. In addition, relatively few spent time in organizedactivities not connected to the school. Findings indicated thatorganized youth activities can help deter risky behavior inadolescence and young adulthood, but that the effectiveness of theactivity depends on the extent to which it develops skills, createschallenges, and provides fulfilling experiences for teenparticipants. Appendixes discuss data sources and analysis, andecological systems theory and social control theory. (Contains 28figures, 18 tables, and 39 references.) (SLD)
***********************************************************************
Reproductions supplied by EDRS are the best that can be madefrom the original document.
***********************************************************************

Adolescent Time Use, Risky Behavior, and Outcomes:An Analysis of National Data
U.S. DEPARTMENT OF EDUCATIONOffice of Educational Resaarcti and Improvement
EDUCATIONAL RESOURCES INFORMATION
KrCENTER (ERIC)
This document has been reproduced asreceived horn the person or organizationoriginating it.
0 Minor changes have been made toimprovereproduction quality.
Points et view or opinions stated in thisdocument do nol necessarily represent
OERI position or policy.
Nicholas ZillChristine Winquist NordLaura Spencer Loomis
Westat,1650 Research Blvd.
Rockville, MD 20850
4-)
q,) CONTRACT NO: HHS-100-92-0)05 (WI)DELIVERY ORDER NO: 14CHILDREN AND YOUTH DATA ANALYSIS PROJECTS
o DELIVERY DATE: September 11, 1995cf)
PERMISSION TO REPRODUCE ANDDISSEMINATE THIS MATERIAL-
HAS BEEN GRANTED BY
TO THE EDUCATIONAL RESOURCESINFORMATION CENTER (ERIC)

EXECUTIVE SUMMARY
Participating in positive, goal-directed activities gives teenagers a chance to develop
skills, build character, and sample different fields of human endeavor. It may also lessen .
their chances of engaging in risky behaviors, such as drug use or delinquency, by occupying
idle time, strengthening commitment to school and other conventional institutions, and
exposing teens to beneficial peer and adult influen_es. There has been considerable debate,
however, as to how effective youth programs are in preventing miibehavior: More evidence
is needed as to how today's teenagers spend their time and whether constructive activities
help to deter problem behavior.
The present study made use of several large-scale data bases to examine the time-use
patterns of American adolescents in the late 1980s and early 1990s, compare them with those
exhibited by young people 10 to 20 Years ago, and test whether participation in
extracurricular activities reduces the chances that young people will engage in various risky
behaviors. The data analyzed came from Monitoring the Future (an annual survey of high
school seniors), the Longitudinal Study of American Youth, the National Education
Longitudinal Study begun in 1988, and an earlier longitudinal study called High School and
Beyond. The risky behaviors studied were dropping out of school, having children while
still teenagers, being delinquent, smoking, using marijuana or cocaine, and binge drinking.
The study found that U.S. teenagers have a lot of discretionary time available to them
and, for.most, that time is not being filled with activities that build their skills or characters.
For example, today's 10th grade students devote on average only one half hour per day to
homework. Less than 20 percent of them read for pleasure almost every day, only 15
percent work daily on hobbies, arts, or crafts, and just 5 percent routinely use personal
computers for schoolwork or recreation. Less than a third attend religious activities once a
week or more, about a fifth participate in youth groups or organized recreational programs
that often, and a similar fraction take weekly classes outside of school in music, art,
language, or dance. One in eight takes weekly sports lessons outside of school, while one in
fourteen volunteers or performs community service activities.

How then do teenagers spend the considerable amounts of- free time at their disposal?
They watch television (two and a half hours per day, on average); they talk with other teens
on the telephone (60 percent say they do so on a daily basis); and they hang out with friends
in malls and other neighborhood hangouts (64 percent do this at least one or twice a week).
As they get older, they work for pay at relatively low-skill jobs that do little to prepare them
for the more complex and demanding jobs at which they are likely to later work. Sixty
percent of U.S. 12th graders and 27 percent of 10th graders do seven or more hours of paid
work per week during the school year.
When the study compared adolescent time use in the 1990s with that in the mid-1970s
or early 1980s, overall patterns were surprisingly similar. The changes found were mostly in
a negative direction as far as constructive use of time was concerned. For example, high
school students in 1990 spent no more time doing homework than earlier cohorts did, despite
taking courses that were supposedly more rigorous. Teenagers in the 1990s were less likely
to read books, do household chores, or attend religious services on a regular basis than their
predecessors were. Compared to the early 1980s, fewer students in the 1990s participated in
band, orchestra or chorus in school, in traditional hobby clubs such as photography or chess,
or in cheerleading or drill team. On the other hand, almost as many went out for varsity
sports, and slightly more took part in academic clubs, such as science, computer, or foreign
language clubs, math team, or debating society. Overall, however, the increased emphasis
on academic§ that haS supposedly dominated American education in recent years has not
resulted in much apparent change in intellectual effort or gtudying behavior among American
adolescents.
Not only is the time use of the average American teenager relatively unproductive,
there is considerable inequality in the extent to which different groups of teens use their free
time in constructive as opposed to idle or detrimental ways. Young people from families
with low levels of parent education or family income, who would seems to be most in need of
organized skill-building and character-nurturing activities, were found to be least likely to
engage in such activities. Likewise, students whose parents were uninvolved in the PTA and
other school-related activities did not participate in constructive free-time activities as often,

nor spend as much time doing homework, as students with involved parents. Students
enrolled in general or vocational/technical programs in high school had much less exposure
to extracurricular activities than students enrolled in academic or college-preparatory
programs.
The time-use patterns of 10th graders were predictive of what they would be doing
one year after high school. Those who were "homework-focused" were twice as likely to be
enrolled full time in postsecondary school as those who were focused on paid employment as
10th graders. Conversely, those in the latter group were twice as likely as those in the
former to be employed full time after high school. However, the link between doing more
paid work as a teenager and full-time employment as a young adult was weaker than the
association between doing more homework and full-time collez:f.. enrollment. This indicates
that the jobs that adolescents hold are not giving them the skills or experience necessary to
obtain stable full-time employment after high school.
Time-use patterns of 10th graders were also predictive of whether they would engage
in a variety' of risky behaviors. For example, compared to those who reported spending 1-4
hours per week in extracurricular activities: students who reported spending no time in
school-sponsored activities were 57 percent more likely to have dropped out by the time they
would have been seniors; 49 percent more likely to have used drugs; 37 percent more likely
to have become teen parents; 35 percent more likely to have smoked cigarettes; and 27
percent more likely to have been arrested. These significant negative relationships Were
found after controlling for related family, school, and student characteristics such as parent
education and income levels, parent involvement in school-related activities, and students'
grades. Up to a point, students who spent more time (5-19 hours per week) in
extracurricular activities were even less likely to engage in risky behavior. However, there
was not as great a deterrent effect among those who spent large amounts of time (20 or more
hours per week) in extracurricular pursuits.
One behavior that proved an exception to the rule that extracurricular participation
reduced risky conduct was binge drinking. After other factors were controlled, time in
in

extracurricular activities did not show a significant relationship with underage drinking. The
difference may be due to the greater social acceptability of drinking in adult society,
compared with cocaine or marijuana use, or to another finding Of the study. This was that
one form of extracurricular activity -- varsity sports -- actually seented to predispose young
people to binge drinking.
When data on adolescent time use and risky behavior were analyzed separately for
males and females, similar relationships were found. One difference was that the'deterrent
effect of extracurricular participation on teen childbearing was more clearly evident axnng
females than males. Similar relationships were also observed when the number of activi s
in which students participated was used as a measure of extracurricular involvement instead\of hours per week.
Participation in two specific forms of extracurricular activity, varsity sports and music
or drama, showed somewhat different relationships to later risky behavior. Students who
participated in varsity sports were less likely than non-participants to drop out of school or
become smokers by their senior years. On the other hand, student athletes were significantly
more likely to have engaged in binge drinking, as noted above. Also, male (but not female)
athletes were more likely to have become teen parents. By contrast, students who
participated in band, orchestra, chorus, or in a school play or musical were significantly less
likely than non-participants to engage in nearly all the problem behaviors: dropping out of
school, being arrested, becoming smokers, using drugs, or engaging in binge drinking.
Female (but not male) performers were also less likely than non-performers to have become
teen parents.
The findings indicate that organized youth activities can help to deter risky behavior
in adolescence and young adulthood. However, the effectiveness of an activity depends ilot
just on the degree to which it occupies idle time, but also on the extent. to which it develops
skills, creates challenges, and provides fulfilling experiences for teen participants. It depends
as well on the attitudes that other,participants have about engaging in specific high-risk
iv

\
<,-
behaviors. If the group code encourages some forms of risky behavior, such as binge
drinking or sexual promiscuity, participation in the activity may be counterproductive.
v
1.-t
1
\\

Table of Contents
EXECUTIVE SUMMARY
INTRODUCTION 1
Why Adolescent Time Use Is Important 2
How Many Use Their Free Time Productively9 6
Why Youthful Time Use May Have Changed 8
Why Adolescent Tune Use May Vary With Family Characteristics 11
Does Time Spent on Homework and Paid Work Help Prepare Adolescents forHigher Education and Adult Employment? 13
Does Participation In Constructive Activities Prevent Risky Behavior? 14
Summary of Hypotheses About Adolescent Time Use 16
FINDINGS 18
How American Adolescents Spend Their Time 18
How Adolescent Time Use Patterns Have Changed 25
How Adolescent Time Use Varies With Family Characteristics 28
How Adolescent Time Use Relates To Postsecondary Schooling andEmployment 35
Adolescent Time Use and Involvement in Risky Behaviors 39
SUMMARY AND DISCUSSION 50
IMPLICATIONS FOR FUTURE RESEARCH AND POLICY DEVELOPMENT . 57
BIBLIOGRAPHY 61
APPENDDC A:- DATA SOURCES AND ANALYSIS METHODS 65
Monitoring the Future (MTF) 65
Longitudinal Study of American Youth (LSAY) 65NatiOnal Educational Longitudinal Study (NELS:88) 69
APPENDIX B 74
aological Systems Theory 74Social Control Theory 75
LIST OF FIGURES 76
LIST OF TABLES 78
vi

INTRODUCTION
Adolescence is a period of growth and vulnerability. Although the majority of young
people successfully navigate the path between childhood and adulthood, a substantial minority
do not. Some portion of youth drop out of school; become involved with drugs; become
parents while still in their teens; or engage in other risky behaviors such as binge drinking
and smoking that put their futures in jeopardy. Research has shown that youth who are
involved in one risky behavior are more likely to be engaged in others and this combination
of activities further jeopardizes their futures. Moreover, many behaviors that are begun
during adolescence will extend into adulthood (Willard and Schoenborn, 1995;
Csikszentmihalyi and Larson, 1984).
Much research has been done on diop out, drug use, and delinquency (Elliott,
Huizinga, and Ageton, 1985; Rutter and Giller, 1983). But a great deal remains to be
learned about why youth become involved in risky behaviors and 'what steps could be taken
to deter their involvement. There is considerable controversy about how effective youth
programs are at pr9moting positive development and preventing misbehavior.
One way to better understand young people's development and their involvement in
risky behaviors is to look at how they spend their time (Medrich et al., 1982; Carnegie
Corporation, 1992). Information on adolescent time use is relatively meager, however, and
often based on small, unrepresentative samples (Medrich, 1991). Definitive answers are
lacking to questions such as the following:
How do adolescents spend their time?
How have adolescent time-use patterns changed in the last two decades, as societyhas changed in many ways that affect the lives of children and youth?
U How do adolescent time-use patterns vary across demographic groups?
Does involvement in organized activities like school sports deter youth fromengaging in risky behaviors?

This project sought to provide more information on these issues by analyzing dat,1
from three national data sets. These were Monitoring the Future (MTF), an annual survey of
U.S. high school seniors, the Longitudinal Study of American Youth (ISAY), and the
National Educational Longitudinal Study of 1988 (NELS:88). The latter two are panel
studies that follow cohorts of young people from middle school through high school, college,
and beyond. The data sources and analysis methods are described in more detail in
Appendix A.
Data from all three studies were used to provide a composite picture of adolescent
time-use patterns in the late 1980s and early 1990s. MTF was used to examine whether high
school seniors' involvement in selected activities had changed over the 16-year period
between 1976 and 1992. Information on change over time was also obtained by comparing
findings from the NELS with results of High School and Beyond, a similar panel study
conducted by the U.S. Department of Education a decade earlier. The LSAY and NELS
were used to examine how activity participation patterns and levels vary across demographic
groups. They were also used to determine associations between participation in activities
such as homework, working for pay, and extracurricular activities in school, and criterion
measures such as school achievement, dropping out of school, becoming a school-aged
parent, drinking large quantities of alcohol, and smoking cigarettes.
Why Adolescent Time Use Is Important
There axe several theories that provide systematic ways of thinking about why
adolescent time use may be important for youth development and the prevention of
detrimental behaviors. Two of the more useful theories are the ecological systems theory of
youth development (Bronfenbrenner, 1979, 1986), whiCh has helped shape a great deal of
research on the family and child development (Berk, 1993), and social control theory
(Hirschi, 1969), which has been widely used in studies of delinquency (Rutter and Giller,
1983). (The main tenets of both of these theories are summarized in Appendix B).
2
ft,
o

Ecological systems theory posits that a young person's development is the result of a
coniplex interplay between the youth's own natural endowment and environmental factors
that range from immediate influences such as parents and peers to more distal influences such
as the community. The theory recognizes that the types of activities and interactions that
youths have available to them depend on family resources and the wealth and political
'organization of the community. Social control theory assumes that without restraining
forces, most people would engage in. some forms of behavior proscribed by society. The
restraining forces that keep most people from deviating are attachment (or a bond) to
conventional society usually through attachment to one or more persons or to an institution
such as a school, commitment to conventional goals, involvement in conventional activities,
and belief in a conventional value system. The following discussion of adolescent time we
grows out of both of these theoretical perspectives.
How adolescents spend their time when they are not in school can make a difference
for their development in several ways. Spending significant portions of their discretionary
time in constructive activities, whether on their own or in organized groups, gives teenagers
a chance to develop skills, build character, and sample different fields of human endeavor.
It may also lesseniheir chances of engaging in risky behavior.
Skill Development
When young people take part in activitieiplike music or art lessons, drama or dance,
competitive sports, photography or computer clubs, restoring old cars, and so on, they learn
skills that are rarely taught in their regular classrooms. Other activities, such as science or
foreign language clubs, math team, debating society, school newspaper, yearbook, or literary
magazine, apply, strengthen, and extc...r.d academic skills. Some of what they learn in these
activities may be of use to them in their later careers. But even if the skills are not of
practical benefit, getting better at something is inherently rewarding to humans of all ages
and helps to foster a sense of competence and control over one's destiny (Csikszentmihalyi,
1990). The need to feel a sense of self-worth may be particularly important for adolescents,
1 i3

who are striving to establish their adult identities and who, as they enter the teen years, tend
to have low levels of self-esteem (Harter, 1990).
Character Building
Not only do goal-directed activities help to develop skills in young people, they may
also foster positive character traits. Both individual and group activities can teach the
importance of vigilance, hard work, attention to detail, repeated practice, patience, and
persistence in the faCe of setbacks. Group activities encourage cooperation and teamwork,
sacrificing personal convenience for group goals, seeing the other's viewpoint, and learning
how to follow and lead. All of these qualities can be of benefit to young people in their
studies, their jobs, and their personal lives, as well as help them to become responsible and
successful adults.
Sampling Different Fields
Voluntary activities (including different kinds of paid work) are important because
they enable young people to "try out" different fields of endeavor. From this they may learn
what working conditions are like in each field, whether they enjoy participating in the
activity, and how good they are at it. This may open up career possibilities previously not
thought of by tho youth, and help him or her to make wiser choices as to future course work
and employment. Activity sampling may be done not only by direct participation, but also
by reading works of fiction or non-fiction that depict a given.vocation or enterprise fully and
accurately.
Having the opportunity. to do this kind of activity sampling seems especially important
for young people who are not doing well in conventional academic studies. Such sampling
may enable these young people to discover a field in which they can be successful, or at least
give them a fuller sense of what their options are. Furthermore, after they experience the
drudgery associated with many unskilled jobs, or the often harsh realities of athletic or
4

artistic competition, some previously indifferent students may return to their schoolwork with
renewed interest.
Preventing Risky Behavior
There are at least three ways in which adolescents' time-use patterns might affect
their chances of avoiding risky behaviors like dropping out, bearing children as an unmarried
teen, engaging in delinquency, smoking, or abusing drugs or alcohol. The mechanisms can
be called time displacement, commitment building, and group pressure. Time displacement
is the widely-held notion that if a young person spends a great deal of time in beneficial or
harmless activities, he or she will not have much time left to get into mischief. Time
displacement is referred to as "involvement in conventional activities" in Hirschi's social
control theory (Hirschi, 1969, pp. 21-23).
Commitment building refers to the argument that participation in constructive
activities, by developing skills, creating aspirations, and providing rewarding experiences,
strengthens young people's commitment to conventional institutions (like school) and
traditional career pathwaYs (like becoming a professional musician or athlete rather than a
drug dealer). This, in turn, makes it less likely that the young persons involved will engage
in behavior (like dropping out) that would mean they can no longer participate in the
enjoyable activity and might endanger their chances of fulfilling the aspirations they have
acquired (Hirschi, 1969, pp. 20-21).
Group pressitire is the idea that participation in teams, clubs, or other group activities
promotes a sense of membership or belonging. With this comes a reluctance to disappoint
adult leaders or other youthful members of the team or club by engaging in behaviors that
are frowned on by the group or might be detrimental to its success. Of course, this
mechanism can be counterproductive if the group code actually encourages some forms of
risky behavior, like use of performance-enhancing drugs, postgame binge drinking, or sexual
promiscuity (Hirschi, 1969, pp. 16-19; Rutter and Gil ler, 1983, pp. 248-251).
5 1 :;

These presumed mechanistris are not necessarily contradictory to one another, but
they do lead to somewhat different hypotileses about which aspects of-activity participation
are most important for preventing (or promoting) high-risk behavior. These are discussed
below in the section called, Does Participation In Constructive Activities Prevent Risky
Behavior?
How Many Use Their Free Time Productively?
Given all these reasons why it might be beneficial for young people to engage in
positive, goal-directed activities during the hours when they are not in school, the first
research question asked in this study is:
How many of today's adolescents in the United States do, in fact, spendsignificant portions of their free time in constructive activities?
Based on previous research on adolescent time use, the answer to this question has to
be: Not many. For example, one study based on 24-hour recall time diaries found that
American children and youth had plenty of discretionary time (40 percent of weekday hours
and 50 percent of weekend hours), but comparatively little of it was spent studying, working
in the labor market, playing sports, doing other outside activities, reading, participating in
hobbies, or doing art activities (Timmer et al., 1985).1 According to their diaries, on
weekdays, youth aged 12-17 spent an average of about 33 minutes studying, about 14-28
minutes working, about 10-12.minutes reading, and 40-46 minutes playing sports. By
contrast, they spent about two hours per weekday watching TV. On weekends, youth spent
more time working at jobs (an average of 29-48 minutes per day), doing outdoor activities
(about 25 minutes), and watching TV (over 2.5 hours) and less time studying (15-30
minutes). Visiting with friends also tended to increase during the weekend, especially among
The study collected data about 492 children and youth aged 3-17. It was based on a 1981-82follow-up to a 1975-76 national time-use survey. Because of problems relocating families and arelatively low completion rate, the sample could not be regarded as fully representative of U.S.households with children and youth (Juster & Stafford, 1985, pp. 515-518).
6

older adolescents. Nearly an hour (56 minutes) per weekend day was spent socializing with
friends by youth aged 15-17 years.
Another national time-diary study conducted in 1985 by John Robinson at the
University of Maryland produced similar results (Robinson, 1991).2 It found that American
adolescents aged 12-17 spent an average of two-and-a-half hours per day watching television,
but only 27 minutes a day doing homework, 11 minutes a day reading for curiosity or
pleasure, and 9 minutes a day pursuing hobbies or arts and crafts. (All these averages are
for weekday and weekend days combined). Activities that occupied significant portions of
teenagers' free time included visiting with friends (38 minutes a day), playing sports (28
minutes a day), playing cards or board games (24 minutes), talking with friends in person or
on the telephone (22 minutes a day), and social travel (18 minutes).
A different technique, the "Experience Sampling Method," was used to study the time
use patterns of a diverse sample of 75 adolescents from a community on the outskirts of
Chicago (Csikszentinihalyi and Larson, 1984).3 This study, like the ones by Timmer and
Robinson, found that about 60 percent of the adolescents' time was taken up by productive
(e.g., studying, working, or being at school) or maintenance activities. Approximately 40
percent of the adolescents' waking hours was leisure or discretionary time, and a large
portion of this time (approximately 40 percent) was spent socializing. Another substantial
segment (nearly 20 percent) was spent watching television. Relatively little time was spent
reading for pleasure, playing sports or games, listening to music, or doing art or hobbies.
These earlier studies provide fascinating insights into youthful time use in the United
States. However, they are based on limited and not fully representative samples of the
2 The 1985 Americans' Use of Time Project collected 24-hour recall time diaries from 418
respondents aged 12 to 17. The teens were part of a larger national sample that included adult
respondents as well.
3 To learn how adolescents spent their waking hours, how they felt about the activities they were
involved in, and whom they were with, teen participants were asked to carry electronic pagers for a
week and to record what they were doing and how they felt about it whenever they were beeped.
The participants were randomly beeped throughout their waking hours, with each person being beeped
approximately 40 to 50 times during the study week.
7o

adolescent population. Furthermore, the portrait of adolescent activities they provide is.now
a decade or more old. Although the data analyzed in the present study do not provide as
richly detailed a picture of teenage time use, the picture is based 'on large, probability
samples of the youth population. Moreover, the picture these data provide is fresher, dating
from the early 1990s. But based on the earlier studies, the first hypothesis tO be tested with
these data is that only a relatively small minority of U.S. adolescents spend significant
portions of their free time in constructive activities.
Why Youthful Time Use May Have Changed
The second mor research question addressed in this study is:
How have uthful time-use patterns changecl over the last decade-and,a-half (that
is, between the mid-1970s and the early I990s)?
Major changes have occurred in U.S. society, in American family life, and in the
nation's schools during the last three decades. These include:
demographic changes, such as the growing racial and ethnic diversity of the youthpopulation, declines in average family size, and a shrinking of the adolescent and
young adult segments of the population, relative to other segments, as a result ofthe "birth dearth" of the 1970s (U.S. Department of EducatiOn, 1993b, pp. 12-15
and 22-23);
family life changes, such as increases in divorce, unmarried childbearing, andmaternal employment (U.S. Department of Education, 1993b, pp. 18-19, 24-25,42-43), but also a rise in parent education levels, especially among African-Americans (Select Committee on Children, 1989, pp. 62-63);
a economic changes, such as stagnant or declining wage rates, especially for youngworkers with limited skills, a smaller payoff for having a high school diploma and
a bigger payoff for a college degree, greater income inequality, ,and increases inchild poverty (Zill and Nord, 1994);
cultural changes, such as the feminist movement, and a shift in the traits thatparents value in their children, with parents nowadays placing more emphasis onindependence and autonomy, whereAs parents in the past 'placed more emphasis onconformity (Alwin, 1988); also, a ge.ieral weakening of societal pressures to
8

conform to prescribed behaviors and greater tolerance fOr a variety of lifestyles
(Nord and Zill, 1991);
educational changes, such as the "back to basics" movement, increases in theexpectations of both parents and youth themselves as to how far they will go inschool (U.S. Department of Education, 1993b, pp. 136-137; Zill and Nord,1994), greater numbers of high school students in college-preparatory programs(U.S. Department of Education, 1993b, pp. 60-61); higher college attendancerates but not college completion rates (Zill and Robinson, 1995; U.S. Departmentof Education, -1993b,lip. 64-65); and,
a technological changes like the spread of home video players and cable TV,personal,computers, and video games (U.S. Bureau of the Census, 1993; Tables
900 and 1281).
A number of these developments might be expected to have impacts on the daily lives
and time-use patterns of U.S. adolescents. The problem is that different developments seem
to have varying or even conflicting implications for youthful time use, and there is no grand
theory that would enable one to combine the disparate influences into one integrated
hypothesis about how adolescent activity patterns have evolved. There are, however, two
contrasting hypotheses that seem to emerge from some of the educational developments
enumerated above. One is that today's high school students should be spending more time
studying, doing homework and participating in academic clubs, than their counterparts of ten
or fifteen years ago. The reasons for predicting this are the higher educational aspirations of
today's youth (and their parents), the fact that more of them are enrolled in college-
preparatory programs and taking challenging courses like intermediate algebra (U.S.
Department of Education, 1995a), and a supposed commitment on the part of schools to
require pupils,to demonstrate at least minimal competence in core academic subjects before
they are promoted or graduate from high school.
On the other hand, there are reasons to question the argument that time in academic
pursuits is increasing. Because today's college-age cohort is smaller than in the past, many
colleges are aggressively recruiting students to fill their freshman classes. The consequence
is that it is relatively easy for a high school graduate to get into some college nowadays;
demonstrated high achievement is not a prerequisite (though it still is at the most prestigious
9

and selective universities). Indeed, many.colleges now give rettedial courses to freshmen,
teaching skills that were once thought to be mandatory for high school graduates.
There has also been grade inflation in American high schools, with many more
students getting A's and B's than did so in the past (Astir' et aL , 1988). With the
expectation that nearly everyone should complete high school, school administrators are
reluctant to flunk anyone out. One result is that students in many high schools can get away
with not doing all their homework. Further, with more young people in single-parent
families, stepfamilies, and homes in which both parents are employed, parental supervision
of their adolescent's homework completion may be less extensive than it was in the past
(Muller, 1993; Muller and Kerbow, 1993).- Or so the counterargument goes. 'Thus, the
contrasting hypothesis is that the average amount of time high school students spend doing.
homework and studying has not have increased, even if teachers are assigning more
homework now.
Another expectation is that today's adolescents should be- spending less time in school-
sponsored extracurricular activities that are not academically oriented, like band or chorus
and art, drama, or hobby clubs. It is widely believed that many school systems have cut
back on these.activities due to budgetary constraints and a relatively narrow vision of what
"the basics" of education should be. On the other hand, there is survey evidence that a
variety of extracurricular activities remains available to almost all students in public high
schools in the U.S. (O'Brien and Rollefson, 1995). The problem may really be that fewer
students are choosing to become involved in nonacademic activities (U.S. Department of
Education, 1993a, 1995b, pp. 30-31).
With more young people coming from single-parent and,dual-career families
households, it might be expected that greater numbers of adolescents would be participating
in organized activities- outside of school. However, unless these activities were community
sponsored, they would only be available to farnilies that could afford them. ManT urban
communities have cut back on their youth recreation programs due to the same kind of
budgetary pressures that have affected the schools.
101 F,

Why Adolescent Time Use May Vary With Family Characteristics
Hypotheses about how adolescent time use varies by socioeconomic (SES) level and
by other family, school, and youth characteristics, were derived from ecological systems
theory and previous reSearch on leisure activities of adults and youth. Ecological systems
theory points out that characteristics of the family and community resources shape the types
of activities that youths have available t9 them. Youths living in low-income urban and rural
areas, for example, often have fewer community programs available to them and their
parents lack the fmancial resources to pay for privately run programs (Carnbgie
Corporation, 1992). Thus, ycaths in such areas may be more likely to report "hanging out"
and other forms of non-productive time use than youth from wealthier settings.
But it is not merely a matter of money. Previous research on leisure activity patterns
has found that education level is often a stronger predictor of adult time use than family
income or community wealth (Robinson, 1977). Parents with more education are more likely
to take advantage of the programs and facilities for young people that do exist in a given
school and community. Also, they are more likely than parents with limited schoolmg to
encourage their children to participate in skill-building activities and teach them how to take
advantage of what is available in their schools and neighborhoods. Thus, compared to youth
from lower-SES faMilies, those from middle-class and upper-SES families benefit from
greater informational and fmancial resources within the family itself, greater school and
community resources, on average, and from behavior patterns that take maximum advantage
of the .programs and facilities that are available to them.
11 1 5
Socioeconomic Level of Family and Student-Participation In Extracurricular
Activities and Paid Work
The first hypothesis about variations in time use is, then, that students from higher-
SES families will be more likely than those from lower-SES families to spend .significant
portions of their disci-etionary time in constructive activities of various sorts: doing
homework, reading, participating in extracurricular activities at school, and taking various
lessens or participating in clubs and teams outside of school. The same sort of relationship
should be seen with family characteristics that help to define socioeconomic status, such as
parent education level and family income.
On the other hand, students from lower-SES families will hie more likely to spend
significant portions of their out-of-school time working for pay. The reason for this is tfiat
lower-SO families have greater fmancial need and are less able or willing to have their sons
and daughters invest time in skill-building activities that may have a greater value in the long
term, but less payoff in the short run.
Parent Involvement as a Predictor of Activity Participation
A third hypothesis is that, no matter what their family's socioeconomic level might
be, adolescents whose parehts are highly involved in school-related activities will tend to
participate in extracurricular activities in and out of school more than students whose parents
are relatively uninvolved. This hypothesis derives from the principle that student
involvement in constructive activities tends to mirror that of parents (Zill ahd Nord, 1994).
The hypothesis also stems from a repeated finding in previous research on'time use and
activity participation, what John Robinson (1977) has called the principle of "the more, the
more." That is, individuals and families who are active in one area of leisure or cultural
activity tend to be more, not less active in other areas. Individual differences in energy or
activity level, or in learned behavior patterns, seem to be far more important and predictive
of activity participation than conitraints growing out of the fact that there are only so many
hours in the day.
12

All three of these hypotheses lead one to the rather gloomy conclusion that those
students who are most in need of constructive free-time activities are least lilcely to be
engaging in those activities. This is not to say that efforts to provide disadvantaged students
with constructive activities are having no effect. Rather, despite these efforts, it is to be
expected that inequalities in participation levels still exist, and these inequalities tend to favor
students who come from advantaged and involved families.
Does Time Spent on Homework and Paid Work Help Prepare Adolescents for Higher
Education and Adult Employment?
School work and employment are often viewed as fundamental for preparing
adolescents for adulthood. Homework is not only necessary for reinforcing what is learned
in school and for success in school, but it can also encourage the development of time
management skills, discipline, responsibility, and personal interests for future educational or
employment pursuits. It may also be a reflection of the extent to which students perceive the
work they do in school as being important for their future success. That is, it may be a sign
of their commitment to their educational and ultimately occupational goals.
Adolescents' experience with the world of work can be seen through two separate
lenses. From one perspective, it can lead to the development of important skills.° Even
though most adolescents are working at non-skilled jobs to earn some spending money, to
contribute to their family's income, or to save money for the future, they are also learning
about responsibility, how to interact with others in a business setting, and the types of jobs
or industries in which they would like to be employed as adults. From a different
perspectiVe, time spent on work is competing with time that could be spent studying or
honing academic skills. Students who spend more time working for pay than studying may
be expressing their disaffection for school as well as their attraction to paid employment.
Given the patterns of association between students' characteristics and the amount of
time they spend on homework and paid work, it is important to learn whether the amount of
time spent on these activities makes any significant difference for adolescents as far as post-
13

high school enrollment and employment are concerned. This issue is examined with
longitudinal data from the LSAY. The hypothesis tested is that students who spend more
time studying than working.will be more likely than other students to be enrolW in
postsecondary education after high school, whereas students who spend more time working
than doing homework will be less likely to be enrolled in school and more likely to be
working full-time after high school.
Does Participation In Constructive Activities Prevent Risky Behavior?
The availability in two of the data sets analyzed for this study of information on the
same individual adolescents over a multiYear period make it possible to examine the
relationship between activity participation in mid-adolescence and the occurrence or non-
occurrence of several risky behaviors in later adolescence. The major hypothesis tested is
that adolescents who participated in constructive activities during their sophomore years in
high school are less likely to have engaged in various risky behaviors, such as dropping out,
having a child, smoking, drinking heavily, using drugs, or engaging in delinquent conduct,
by their senior years in high school, (or, for dropouts, the years in which they would have
been seniors had they stayed in school and progressed at the usual pace). Not only should
this inverse relationship be observed, it should also hold up after controlling for related
factors, such as the socioeconomic level of the family, the degree of parental involvement in
school-related activities, and the student's prior academic performance. These factors relate
positively to participation in constructive activities and negatively to high-risk behavior, and
so could be responsible for an apparent inverse relationship between activity participation and
risky behavior.
Understanding How Prevention May Be Occurring
In addition to testing whether participation in constructive activities seems to prevent
risky behavior, the analyses sought to gain some insights into how aCtivity participation might
be working to deter such behavior. Three possible mechanisms were mentioned earlier:
time displacement, commitment building, and group pressure. Although specific hypotheses
14

based on these hypothetical mechanisms were not formulated and tested, comparisons were
made that shed some light on whether each of the mechanisms was operating and on their
relative importance. The following paragraphs briefly describe some of these comparisons
and the reasons for making them.
Total time spent in activities versus specific types of activities undertaken. If time
displacement is the mechanism by which risky behavior is being prevented, then the amount
of time the adolescent spends in activities should be more important than the specific
activities in which he or she participates (provided the activities are positive or at least
neutral in character). The more time the youth spends in such pursuits, the less should be
his or her chances of engaging in risky behavior, according to the time displacement theory.
However, if some activities are more effective than others at deterring risky behavior, or if
the likelihood of risky behavior does not decline steadily as time in constructive activities
increases, that would indicate that other mechanisms are at work instead of, or in addition to,
time displacement.
Comparisons among different types of activities. If the prevention of risky
behavior depends on the adolescent's commitment to conventional institutions and career
pathways, then the amount of time spent in constructive activities is less important than the
extent to which those activities develop skills, nurture aspirations, and bolster the youth's
sense of self-worth and self-efficacy. Activities that lead to these kinds of personal
development should be more of a deterrent to high-risk behavior than those that do not.
Comparisons among different foram of risky behavior. According to the
presumptions underlying the group pressure mechanism, the important thing about an activity
is the sense of group belonging it engenders, and the beliefs held by group leaders and
members. If the group code opposes a specific form of risky behavior, lilce smoking or
illegal drug use, then participation in the activity will act as a deterrent to that risky
behavior. If, on the other hand, group members do not disapprove of the risky behavior, or
worse, have favorable attitudes toward it, then participation will not prevent the behavior and
nr - actually encourage it.
15

Unfortunately, the large-scale data sets containing measures of youth time use provide
little information about the attitudes and values of the other group members. Thus, it is not
possible to directly examine the relationship of member beliefs to the deterrence of risky
behavior. Some indirect evidence is provided, though, by comparing how much deterrence
occurs with respect to different forms of risky behavior.
We know, for example, that the consumption of alcohol is generally considered an
acceptable form of adult behavior in U.S. society, and that American adolescents view1
drinking is less harmful than use of cocaine or marijuana or tobacco (Johnston, O'Malley,
and Bachman, 1984, p. 93). Thus, if participation in organized youth activities has less of
an effect on binge drinking than it does on using marijuana or cocaine or smoking tobacco,
that result would lend credence to the notion that group pressures are important in enabling
group activities to deter risky behavior.
Summary of Hypotheses About Adolescent Time Use
In summary, here is a list of the hypotheses about adolescent time use that were tested
with data from the three national studies:
1) Based on the results of previous research, relatively few U.S. adolescents are
spending significant portions of their free time in constructive activities.
2) Because more of them are enrolled in college-preparatory programs, high school
students in the 1990s are spending more time studying and_participating in academic
clubs than did students in the 1970s and 1980s. However, a competing hypothesis is
that because it is relatively easy to get into college and high schools are reluctant to
flunk anyone out, high school students in the 1990s are not spending any more time
studying than did students in the 1970s and 1980s,
3) Because of the "back to basics" movement and decreased emphasis on arts and crafts,
high school students in the 1990s are spending less time in non-academic
169 4

extracurricular activities, like band or chorus and art, drama, or hobby clubs than
students in the 1970s and early 1980s did.
4) Students from families with higher socioeconomic statuses are more likely to spend
significant portions of their free time in constructive activities of various sorts than
students from families with ldWer socioeconomic statuses.
5) Students from families with lower socioeconomic statuses are more likely to spend
significant portions of their free time working for pay than are students froni families
wit higher socioeconomic statuses.
6) Students whose parents are highly involved in school-related activities are more likely
to participate in constructive extracurricular activities in and out of school than
students whose parents display low levels of involvement.
7) High school students who spend more time studying than working will be more likely
than other students to be enrolled in postsecondary education after high school,
whereas those who spend more time working than doing homework will be less likely
to be enrolled in school and more likely to be working full-time after high school.
8) High school students who participate in extracurricular activities are less likely to
engage in various risky behaviors, such as dropping out, having a child, smoking,
binge drinking, using drugs, or erv aging in delinquent conduct, by the time they are
(or, for dropouts, would have been) in twelfth grade.
17

FINDINGS
The description of adolescent time use in the United States and the results of the
hypothesis tests are presented in four sections. The first part is an overall profile of teenage
activity patterns, based on data from all three national studies. The second uses data from
National Education Longitudinal Study, an earlier study called High School and Beyond,
and Monitoring the Future to document how adolescent time-use patterns have changed (or
remained the same) during the last two decades. Differences in time use across
socioeconomic groups and by parent involvement and student achievement levels are
presented in the third section. The fourth and final part presents fmdings on the relationship
of adolescent activity patterns to postsecondary school enrollment and employment, and to
later risky behaviors.
How American Adolescents Spend Their Time
Today's teenagers have a lot of discretionary time available to them. For most teens,
that free time is not being filled with activities that build their skills or characters. American
high school students go to school about six hours a day five days a week (U.S. Department
of Education, 1994, p. 316). They are not doing a great deal of homework: less than half an
hour a day. They spend relatively little time in school-sponsored extracurricular activities or
in lessons, classes, or organized group activities outside of school. Their parents do not
demand much of them in the way of household chores. Few work for pay outside the home
until they are in their junior or senior year of high school.
How then are teenagers spending the considerable amounts of free time at their
disposal? They are watching television. They are talking with friends on the telephone or
hanging out with them in malls and other neighborhood hangouts. For the most part, they
are not reading for pleasure or to satisfy their curiosity atiout the world. They are not
pursuing hobbies or spending a lot of time working on computers. As they get older, they
re working for pay at relatively low-skill jobs that do little to prepare them for the more
complex and demanding jobs at which they are later likely to work.
18

In short, the data from the three large-scale studies done in the late 1980s and early
1990s confirm the hypothesis derived from smaller-scale, more intensive studies of
adolescent time ,use done in the early and middle 1980s (Csikszentmihalyi and Larson, 1984;
Timmer et al., 1985: Robiiiion, 1991): relatively few U.S. adolescents are spending
significant portions of their free time in constructive activities. The following sections
describe specific findings about leisure-time activities, time spent in homework and work for
pay, involvement in school-sponsored extracurricular activities, and participation in organized
activities outside of school.
Relative frequency of various leisure-time activities
Data from the 1990 round of the National Education Longitudinal Study (NELS) show
the frequency with which 10th graders engage in various leisure time activities. According
to the students' own reports, socializing with friends and watching television are daily
pursuits of most 10th graders, whereas relatively few read for pleasure, work on hobbies or
crafts, or interact with adults on a daily basis (Figure 1). Sixty percent of 10th graders
report talking with friends on the telephone almost every day, while only 18 percent report
reading for pleasure almost every day and 15 percent report working on hobbies, art, or
crafts that often.
It is also interesting to note that only 30 percent of 10th graders report talking or
doing things with their mothers or fathers almost every day (compared to the 60 percent who
talk with their friends almost every day). However, two-thirds of 10th graders talk or do
things with their parents at least once or twice a week. Only 11 percent report talking or
doing things with other adults on a daily basis, and less than half (41 percent) interact with
other adults as much as once or twice a week or more (Figure 1).
For those who believe that technological advances and the world of computers are
offering young people more stimulating activities fur their free time, the NELS data offer a
less rosy view. Only 5 percent of the 10th graders report using personal computers almost
19

every day, and not many more (15 percent) use computers at least once or twice a week. In
general, adolescents do not spend their leisure time learning new skills.
A similar time-use profile is obtained from the reports of high school seniors in the
1992 round of the Monitoring the Future (MTF) survey (Figure 2). Majorities of seniors
report watching television, getting together with friends, engaging in sports or exercise,
working around the house, yard, or car, and riding around in cars for fun at least once a
week. But only minorities of seniors report playing an instrument or doing arts or craft
work or creative writing that often. While a majority say they read books, magazines, or
newspapers at least once a week, less than half do so on a daily basis.
Time spent doing homework and working for pay
Despite their high educational aspirations, American 'youth devote very little time to
homework. The survey data do not reveal whether this is because teachers do not assign
much homework or because many students do not bother to do all that is assigned. Probably
both play a part. In the Longitudinal Study of American Youth (LSAY); well over half of
.junior high and high school students reported spending less than 7 hours per week on
homework (Figure 3). In a typical week in 1987-1989, two-thirds of 7th and 9th graders,
and approximately 60 percent of 10th and 12th graders, spent less than one hour per day on
homework. Less than 10 percent of the junior high school students and less than 15 percent
of the high school students spent as much as two hours per day on homework. These figures
parallel those found by Timmer and her colleagues (1985) and Robinson (1991) in the early
and middle 1980s. They are also generally consistent with student reports on homework in
the NELS and MTF. Indeed, as described below in the section on changes over time in
adolescent activity patterns, the NELS data depict students as spending even less time on
homework -- about 3 hours per week for the average 10th grader than the LSAY data do.
Interestingly, the difference in the amount of time spent on homey, ork between the
younger and older students is quite small. One might expect high school seniors to spend
substantially more time on homework than freshmen or sophomores, but the LSAY data
20
r
indicate this is not the case. The percentage of students spending at least 1 hour per day
doing homework increases only from 30 percent in 7th grade to 35 percent in 9th grade, to
around 40 percent in 10th and 12th grades.
In contrast, the LSAY data show that the amount of time students spend working for
pay changes substantially as they-get older (Figure 3). Nearly three-quarters of 10th graders
are woiking less than 7 hours per week, and most of theo are not working for pay at all.
However, _by 12th grade, more than half -- 60 percent -- of 12th graders are working at least
7 hours per week. The percentage of students working 14 or more hours per week increases
dramatically from 16 percent in 10th grade to 49 percent in 12th grade. ks noted earlier,
however, many of the jobs that occupy the time of adolescents are low-skilled ones that
involve little interaction with adults.
Participation in extracurricular activities at school
Although a majority of high school students report participating in noncompulsory
activities at school, most spend relatively little time in such activities. According to data
from the National Education Longitudinal Study (NELS), in 1990 the typical 10th grade
student in the U.S. spent less than an hour a week in school-sponsored extracurricular
activities. Forty percent of the students said they spent no time in these activities in an
average week, and 35 percent reported spending 4 or fewer hours. One-quarter reported
spending a total of 5 or more hours per week in various teams or clubs. Only 2 percent said
they participated 20 hours or more in school-sponsored activities (Figure 4).
Participation in activities increases by the time students reach their senior year in high
school, but not by much. In 1992, the NELS found that the typical 12th grade student in the
U.S. spent about two hours per week in extracurricular activities. Almost a third spent no
time. About a third participated between one and four hours per week. More than a third
(36 percent) spent 5 or more hours in these activities. Five percent of seniors were very
heavy participators, devoting 20 hours or more per week to the clubs or teams of their
choice.
2 1

Number of activities. Although 40 percent of 10th graders in the NELS said they
spend no time in club or team activities in a typical week, when given a list of specific
activities, all but 20 percent reported that they had taken part in at least one of the types of
activity on the list during the current academic year. Nearly a third said they had taken part
in just one type activity, while nearly a quarter reported taking part in two different
activities. Another quarter report involveMent in three or more activities (Figure 4).
Specific activities. Sports were the most popular type of extracurricular activity, with
a surprisingly high 46 percent of 10th grade students in the NELS reporting that they took
part in at least one interscholastic sport at the varsity, junior varsity, or freshman team
level." Nearly 14 percent reported participating in intramural sports, making a total of 52
percent who reported some form of athletic involvement. Just over 30 percent of 10th grade
students reported involvement in some form of academic club, such as ones focused on art,
science, math, computers, debating, or a foreign language. More than a quarter were
involved in a musical or dramatic activity, sueh as the school band, orchestra, or chorus, or
the/production of a school play ot musical.
About 12 percent of 10th grade students reported that they participated in a service
club, such as AFS or Key club, and a similar number were members of a vocation education
or professional club, such as Future Farmers, Homemakers, or Teachers of America. Nine
percent worked on the school yearbook, newspaper, or literary magazine. Slightly more than
7 percent served in student government, and a similar number participated in a hobby club,
such as a chess or photography club (Figure 5).
A similar picture of the relative frequency with which students participate in different
extracurricular activities was obtained from high school seniors by the Monitoring The
Future survey (Figure 6). As in the NELS, team sports were the most popular activity, with
nearly 40 percent of the 12th grade students surveyed in 1992 reporting that they had
The NELS questionnaire listed seven different team sports from baseball to volleyball, sixdifferent individual sports from cross-country to wrestling, as well as allowing for the reporting ofother, unspecified team or individual sports. It is possible that some of the students who reportedtaking part in varsity sports tried out, for a team, but did not make it.
22(;

partkipated in school athletic teams to a "considerable" or "great" extent during the current
school year.' More than half said they had participated in team sports for two or more
years during some period of their high school career. As in the NELS, about one-quarter of
the students reported participating in music or performing arts activities during the current
year; 40 percent of the seniors said they took part in such activities at some point.
Compared to the 10th grade students gurveyed in the NELS, fewer of the 12th grade
students in MTF -- 14 percent -- reported participation in academic clubs.' But more than a
third of the 12th grade students reported participation in other clubs or activities. Twelve
percent of the 12th grade students reported working on the school newspaper or yearbook,
and 11 percent said they served on the student council. These figures were close to the
comparable percentages for 10th grade students in the NELS.
Looking at the "half empty" portion of the glass, it is noteworthy that well over half
of all high school seniors surveyed in the 1992 MTF were not currently participating, nor
had they ever participated in music or performing arts, student council, or the school
newspaper or yearbook. Almost half of the 12th grade students were not participating in
sports, and approximately one-third had never taken part in sports activities. Finally, about
one-third\of seniors did not participate in any other school club or activity, nor had they done
so in the pas In sum, a substantial proportion of today's high school seniors are not
currently participating in school activities and a sizable proportion have never participated in
such activities during their high school careers.
5 The question used in Monitoring The Future mentioned "athletic teams," but did not list specifickinds of teams, as the sports question in the National Education Longitudinal Study did. There wasalso no separate question on intramural teams.
6 This may be because only science, math, and language were given as examples of academicclubs in the MTF questionnaire, whereas other types, such as art or debating, were not mentioned.
233
4

Participation in lessons, classes, and group activities outside of school
Considerable numbers of American adolescents report involvement in some organized
youth activities outside of school, with organized sports and religious or religion-related
activities being the most common forms of participation. Here too, however, it is usually
only a minority of young people who participate. In the NELS, 10th grade students reported
in 1990 on the frequency with which they took part in various lessons, classes, and group
activities outside of school (Figure 7). Forty-seven percent reported attending religious
activities, with less than one-third reporting that they did so at least once a week. Thirty-
seven percent of the 10th grade students attended community youth groups or recreational
programs, but only one-fifth did so on a weekly basis.
Participation in non-school based lessons or classes in which young people learn
artistic or athletic skills was less common. About one-quarter of 10th grade students took
classes in music, art, language, or dance, while about one-fifth took lessons in sports such as
tennis, swimming, or karate. It was also about one-in-five students who did volunteer or
community service work, with only 7 percent doing so on a regular, weekly basis.
In Monitoring The Future, 12th grade students were asked about organized non-school
activities in which they had ever participated for two or more years. In 1992, nearly half of
the students reported that they had been involved in organized sports for such an extended
period, and 43 percent had participated this long in a church group or other religion-related
activity (Figure 8). About one-third had participated in scouting for a two-year or longer
period, but less than one-fifth had taken part in a vocational club, such as 4-H, and only one-
tenth had belonged to a Boys or Girls Club for a similar period.
Although the above reports on the types of activities that adolescents engage in and
the amounts of time they devote to these activities are derived from several different data sets
collected at different points in. time and using diffeient methodologies, the basic conclusions
remain the same. American adolescents are spending very little time on activities that
strengthen their ties to society or provide them with the necessary skills to succeed in school
24

and in the labor force. There is clearly ample room to more fully engage students in the
lives of their sehools and in constructive activities outside of school.
How Adolescent Time Use Patterns Have Changed
Are today's teenagers doing more homework and studying to go along with their
higher educational aspirations and their more frequent enrollment in college-preparatory
programs? No,' they are not. Comparisons of student time-use reports from the 1990s with
parallel reports from the mid-1970s or early 1980s show more constancy than change. The
changes that have occurred are more likely to be.in a negative rather than a positive direction
as far as intellectual effort and constructive use of time are concerned.
In 1990, for example, 10th grade students in the NELS were asked to estimate the
total number of hours per week they spent doing homework outside of school. In 1980, a
large national sample of 10th grade students was asked a similar question as part of a study
called High School and Beyond.' The average (median) 10th grade student in 1990 reported
spending about three hours per week doing homework for all subjects, and so did the average
10th grade student in 1980. The percentage reporting some homework time, but less than 5
hours per week declined slightly, from 63 percent to 59 percent, while the percentage
reporting 10 or more hours of homework per week increased, but just barely, from 11
percent to 14 percent (Figure 9). This is hardly a bold leap forward in student diligence.
Reports from 12th grade students in two rounds of the Monitoring the Future survey
conducted 16 years apart display a similar lack of change in homework hours. Forty-six
percent of 12th grade students in 1976 reported spending 5 or more hours per week on
homework, and so did 46 percent of 12th grade students in 1992 (Figure 10). On the oilier
hand, 39 percent of 12th grade students in 1976 reported reading 6 or more books during the
year that were not assigned by teachers, whereas only 26 percent of 12th grade students
reported doing this much voluntary reading in 1992 (Figure 10).
7 The question wordings and answer categories were somewhat different in the two studies.Response categories were combined to make them more comparable.
253 ,)

In both 1976 and 1992, large majorities of 12th grade students reported watching
television daily: 71 percent in 1976 and 74 percent in 1992. Reports of weekly television
watching remained stable at 95 percent. The percentage of 12th graders who watched
significant amounts of television (i.e., 2 or more hours each weekday) decreased somewhat,
but remained very high, from 1976 (69 percent) to 1992 (62 percent). Obviously; American
students are spending a great deal more time watching television thandoing homework.
They are also spending more time working at jobs than doing homework, at least
when they are high school seniors. Virtually the same percentage of 12th grade students
reported working 6 or more hours per week during the school year at paid or unpaid jobs: 63
percent in 1976 and 64 percent in 1992 (Figure 10). There was also little change between
1976 and 1992 in the proportions of 12th grade students who, on a daily or weekly basis, got
together with friends, participated in sports or exercising, spent time alone, rode around in a
car for fun, played an instrument or sang,, went shopping or window shopping, or did art or
craft work (Figures 11 and 12).
Areas in which significant change in time use did occur between 1976 and 1992
included the following:
reading of books, magazines, or newspapers, where the number of 12th gradestudents who read daily declined from 59 percent to 47 percent;
working around the house, yard, garden, or car, where the number who didhousehold chores daily declined from 41 percent to 29 percent, while the numberdoing chores at least once a week fell from 78 percent to 68 percent;
attending religious services, where the number going at least once a week declinedfrom 41 percent to 32 percent.
Two leisure-time activities that have become more frequent are going to parties and
creative writing: the percentage of 12th grade students who report partying with friends at
least one a week increased from 31. percent in 1972 to 38 percent in 1992. The proportion
,doing some creative writing once a week or more often climbed from 15 percent in 1976 to
22 percent in 1992 (Figure 12).
263 4

Apart from the modea increase in creative writing, there was one other small sign of
growth in academically-oriented activity. The proportion of 10th grade students participating
in academic clubs at school increased by a fifth, from 26 percent to 31 percent, between
1980 and 1990. The inCrease was observed when reports of participation in specific types of
extracurricular activities in the NELS survey of 10th grade students were compared with
responses to similar questions in the High School and Beyond base year survey of 10th grade
students (Figure 13). On the other hand, the same comparison showed that participation in
band, orchestra, or chorus was down b'y nearly a third, from 31 percent in 1980 to 22
percent in 1990. Also, involvement in traditional hobby clubs, such as photography or
chess, was down by two-thirds, from 21 percent in 1980 to 7 percent in 1990.
The reason for these declines is not altogether clear. Many people believe that fewer
high schools are offering organized music, art, drama, and :lobby activities because of budget
cutbacks and policies that downplay the arts itaavor of science, math, and other "core"
subjects. As noted earlier, however, survey evidence indicates that such programs remain
available in most public high schools (O'Brien and Rollefson, 1995). The growth of personal
computers in schools may have been partly responsible for the decline in traditi nal hobby
clubs. (Computer clubs were counted as "academic" activities in the NELS ta ations).
Levels of participation in school-sponsored athletic teams were comparable to those reported
by 10th grade students a decade earlier. Participation in cheerleading and drill teams was
down by a third over the decade, however (Figure 13).,
Overall, then, the increased emphasis on academics that supposedly governed
American public schools during the 1980s has not resulted in much apparent change in one
important area of student behavior: studying. As we have seen, high school students are
spending no more time on homework than they did ten or fifteen years ago, and they are
spending less time reading than they did in the past. The data seem to lend support to those
who argue that there is not much pressure on American students to work harder; because it is
relatively hard to flunk out of high school, and relatively easy to get into college.

r.
The fmding that today's adolescents are spending less time in non-academic
extracurricular activities, such as band, orchestra, chorus, drama, and art or hobby clubs,
may be a response to the increased emphasis on "back to basics" and mathematics and
science. But it hardly seems like a positive development, except from a very narrow view of
what conkitutes constructive use of adolescents' time.
How Adolescent Time Use Varies With Family Characteristics
Are teenagers from families that are socially or economically advantaged more likely
to spend time in-corfstructive activities than teenagers from less advantaged families, as
would be expected from both ecological systems theory and previous time use research?
Data from the LSAY on time spent on homework and data from the NELS on participation
in school-sponsored extracurricular activities both show considerable variation across
socioeconomic groups, with teens from higher status families spending a good deal more
time in constructive activities than those from lower status families. Parent involvement in
school-related activities, however, is even more strongly associated with constructive time
use by students.
Homework time
In 1987, the LSAY found that 41 percent of all 10th grade students in the U.S. spent
7 or more hour's on homework in a typical week, and 13 percent spent 14 or more hours.
Among 10th graders from families in the lowest socioeconomic (SES) quartile, only one-third
studied at home for at least 7 hours per week and just 8 percent studied for 14 or more hours
per week. By contrast, among students from families in the highest SES quartile, over half
(55 percent) did 7 or more hours of homework and 18 percent did 14 or more hours of
homework each week (Figure 14).
Similarly, students whose parents had relatively low levels of educational attainment
spent relatively little time on homework each week. About one-third of students whose
parents' highest level of education was a high school diploma or -less spent at least 7 hours
28

per week on homework, compared to about half (48 percent) of those who had at least one
parent with a college degree (Figure 14).
Parent involvement. Among 10th graders whose parents were not very involved in
school activities or communication with teachers, 28 percent did homework for 7 or more
hours per week and only 4 percent spent 14 or more hours per week on homework. In
contrast, more than half (56 percent) of 10th graders with ,highly involved parents spent at
least 7 hours and 16 percent spend at least 14 hours studying at home each week (Figure 14).
This suggests that the amount of time students spend on homework is not only a reflection of
the amount of homework assigned by their teachers, but is also indicative of the extent to
which parents encourage their children to do homework.
Family structure. The number of parents present in the home was also associated
with time spent on homework. A larger proportion of 10th graders with two parents at home
(45 percent) than with one parent at home (36 percent) spent at least an hour per day on
homework (Figure 14). This difference partly reflects the higher income and education
levels that two-parent families tend to have, relative to single-parent famllies. It may also
reflect the availability of a second parent to encourage the student to do homework.
School and student characteristics. Other characteristics associated with significant
variations in time spent on homework included the type of program in which the student was
enrolled, the student's grade point average, the sex of the student, and the region of the
country and the urbanicity of the area in which the family lived. Students in general or
vocational and technical Oroirams in school spent far less time studying at home than those
in academic or college preparatory programs. Regrettably, though perhaps not surprisingly,
students who received relatively poor grades spent less time on homework than those who
received higher giades (Figure 15).
Other demographic characteristics. On average, female students spent more time
on homework than male students. Students residing in thd Western region of the U.S. spent
somewhat more time on homework than those in the Northeast or Midwest. Likewise,
29 3

students from families that lived in the suburbs of major metropolitan areas devoted more
time to homework than either those who lived in central cities or those>living outside of
major metropolitan areas (Figure 15).
Time in extracurricular activities at school
Students who come from more advantaged family backgrounds- are more likely to be
involved in school-sponsored clubs and teams than those from less advantaged families. This
is true whether advantage is measured by the socioeconomic quartile in which the family
falls, parent education level, family income, welfare receipt, language minority status, sinele-
parent status, or racial or ethnic background. Parent involvement in school-related activities
shows an even stronger relationship with student time in extracurricular activities than does
the socioeconomic level of the family.
Advantaged versus disadvantaged families. In 1990, the NELS found that 60
percent of all 10th grade students in the U.S. spent at least one hour per week in school-
sponsored extracurricular activities, and 25 percent devoted 5 or more hours per week to
such activities. However, 10th graders whose families were in the highest socioeconomic
quartile were half again more likely to spend at least one hour in extracurricular activities
than those whose families were in the lowest quartile (72 percent of the former did so,
'compared to 48 percent of the latter), and more than twice as likely to devote 5 or more
hours to such activities (34 percent of the former group did so, compared to 14 percent of
the latter) (Figure 16).
Similar differences in extracurricular participation were found between students from
families with relatively high levels of parent education or family income, compared to those
from families with low levels of education or income (Figure 16). Time in extracurricular
activities was found to be lower, on average, among students from families receiving
welfare, compared to those not receiving such benefits; among students from language-
minority families, compared to those from families in which at least one parent spoke
English at home; among students from single-parent families or stepfamilies, compared to
303

those from families in which both birth parents were present in the household; and among
students from black or Hispanic families, compared to those from white or Asian families
(Figure.16).
Involved versus uninvolved parents. Parents who were highly involved in school-
related activities were likely to have children, who were highly involved. Conversely, when
parents displayed low levels of involvement in their children's schooling, the student was apt
to be disengaged from school-sponsored activities as well. Compared to high-school
sophomores whose parents had low involvement in school-related activities, those whose
parents were highly involved were twice as likely to participate in clubs or teams for at least
one hour per week, and four times as likely to engage in extracurricular activities for 5 or
more hours per week (Figure 16).
School and student characteristics. Students who are enrolled in academic or
college-preparatory programs in school are more likely to participate in extracurricular
activities than those who are enrolled in general or vocational/technical programs. Only
around half of 10th giaders in general or vocational/technical programs spent one hour or
more per week in extracurricular activities, whereas more than three-quarters of those in
academic or college-preparatory programs spent some time in these activities. Twice as
many of the college-prep students as of the vocational education students (33 percent versus
16 percent) participated in club or team activities for 5 or more hours per week (Figure 17).
Students who have done well in school, as evidenced by their grades in junior high
school, are more likely to be involved in extracurricular tivities. Compared to 10th
graders whose 8th grade averages were in the lowest qu , those whose averages were in
the highest quartile were almost three times as likely to spend 5 or more hours per week in
extracurricular activities (13 percent versus 36 percent) (Figure 17).
Participation in extracurricular activities tends to be more widespread in private than
in public schools. Tenth grade students in private schools that were not religion-affiliated
were. one-third more likely than 10th graders in public schools to spend at least one hour per
31

week in extracurricular activities (80 percent verstr, 60 percent) and half again as likely to
spend 5 or more hours per week in extracurricular activities (37 percent versus 24 percent).
Tenth graders in Catholic and other religion-affiliated private schools fell in between: they
were more likely to participate than public-school students, but less likely than students in
other private high schools (Figure 17).
Tenth grade students in schools with high percentages of minority students (50 percent
or more) were somewhat less likely to participate in extracurricular activities than students in
schools with relatively low minority enrollments (less than 25%). However, these
differences were not as substantial as the public school-private school contrasts (Figure 17).
Other demographic characteristics. Time spent in extracurricular activities showed
relatively little variation by sex of student, region of the country. or central city -"ersus
suburban versus non-metropolitan-residence (Figure 17).
Extracurricular participation among 12th grade students. The 1992 round of the
NELS found that amounts of time spent in extracurricular activities among 12th grade
students in the U.S. were generally higher than those observed among 10th gradc Audents in
1990. Despite this difference in average level, the patterns of variation in participation
across groups were very similar to those observed among the 10th graders (Figure 17 supp.).
Time spent working for pay
Inasmuch as the majority of 10th graders are not working for pay or working very
few hours per week, data on the amounts of time 12th graders spent working for pay
illustrate how family, school, and student characteristics relate to teenagers' participation in
the paid labor force. These data come front the 1989 round of the LSAY. The LSAY found
that 61 percent of 12th grade students in the U.S. worked at least 7 hours per week, while 49
percent worked 14 or more hours per week.
32 46

In a number of respects, the patterns found with respect to paid work are the opposite
of those seen with respect to time spent on homework and in extxacurricular activities. That
is, characteristics associated with students spending relatively little time on homework or in
club and team activities were associated with larger amounts of time spent working for pay.
The differences are most apparent when looking at paid work for 14 or more hours per
week, suggesting that working fox fewer hours is common to most groups of high school
seniors.
Advantaged versus disadvantaged families. Students from relatively disadvantaged
family backgrounds were more likely to be working for pay for 14 hours or more per week.
This is not surprising, given that students from less advantaged families have more of an
economic need to work than students from wealthier families. Specifically, students in the
lower three SES quartiles differed from those in the highest quartile: slightly over 50
percent of 12th graders in the second or lower quartiles were working at least 14 hours per
week compared to 40 percent of those in the highest SES quartile (Figure 18).
Parent educational attainment was also associated with the amount of time students
spent working for pay each week. Over half of 12th graders whose parents' highest
educational attainment was a high school diploma or less were working at least 14 hours per
week, compared to 43 percent of those having at least one parent with a college degree, and
39 percent of those with a parent who had earned an advanced degree. On the other hand,
students from two-parent and single-parent families differed very little in the amounts of time
they spent working for pay (Figure 18).
Involved versus uninvolved parents. Twelfth grade students whose parents
displayed low or moderately low levels of involvement in school-related activities were more
likely to be working a considerable number of hours per week than those with moderately or
highly involved parents. Fifty-five percent of the former two groups were working 14 or
more hours per week, compared with 43 percent of the latter two groups (Figure 18).
33

School and student characteristics. Students enrolled in academic or college-
preparatory programs were only slightly less likely to be working 14 or more hours per week
than students enrolled in general or vocational/technical programs. On the other hand, only
about a third of students whose averages were mostly A's or mostly A's and B's worked 14
or more hours per week, compared with half or more of those with lower grade point
averages (Figure 19).
Other demographic characteristics. Female 12th grade students were slightly more
likely to be working for pay than male students, but differences were slight. Students living
in the Northeast were most likely to be working 14 or more hours per week, whereas those
living in the West were least likely (57 percent versus 40 percent). Those in the Midwest or
South were intermediate, with about half working 14 or more hours per week. Students in
large central cities or their suburbs were more likely to be working 14 or more hours per
week than those living outside of major metropolitan areas (Figure 19).
Summary
To summarin, the results from the LSAY and NELS confirmed all three of the
hypotheses posed earlier about the relationship of family characteristics to adolescent time
use patterns. First, students from families with higher levels of education or income were
more likely than those from families with lower education or income levels to spend
significant portions of their discretionary time in constructive activities. This pattern was
found with respect to both studying at home and participation in extracurricular activities.
Second, students from families with lower education and income levels were more
likely to spend substantial portions of their out-of-school time working for pay than were
students from families with higher education or income levels. Third, students whose
parents were highly involved in school-related activities spent more time doing homework
and engaging in extracurricular activities than did students whose parents were relatively
uninvolved with school. Students in the latter group were more likely to spend their free
time working for pay.
34

These findings all support the larger conclusion that students who are most in need of
constructive free-time activities, because of their relatively disadvantaged family
backgrounds, are least likely to be engaging in these activities. This conclusion is reinforced
by results showing more constructive use of free time by students in private as opposed to
public schools, those in academic as opposed to general or vocational programs, and those
with higher as opposed to lower grade-point averages.
How Adolescent Time Use Relates To Postsecondary Schooling and Employment
Given the patterns of association between family and students characteristics and the
amount of time they spend on homework and paid work, it is important to know whether the
amounts of time students spend on these activities affect their chances of postsecondary
school enrollment or employment. To examine these issues, 10th and 12th grade students
from the LSAY were classified into four groups according to the amounts of time they
reported spending on homework and working for pay. The groupings were as follows:
1) High homework hours, High work hours;
2) High homework hours, Low work hours;
3) Low homework hours, High work hours; and
4) Low homework hours, Low work hours.
In this classification, a "high" number of hours is 7 or more per week and a "low" number
of hours is less than 7 per week. The percentages of the sample falling into these categories
in 10th grade were: 1) "involved in both," 11 percent; 2) "homework focused," 31 percent;
3) "work focused," 16 percent; and 4) "involved in neither," 43 percent.
The results from the longitudinal analysis show that the patterns of time students spent
on homework and paid work in 10th grade were reflected in their postsecondary school
enrollment statuses and employment statuses one year after high school graduation. Those
who were "homework-focused" in 10th grade were most likely to be enrolled full-time in
35

postsecondary school one year after high school graduation; 65 percent of this group went on
to be enrolled full-time (Figure 20).
By contrast, only 32 percent of the "work-focused" students in 10th grade went on to
be enrolled full-time right after high school. They were the least likely of the four groups to
be enrolled full-time, and to be enrolled in school at all. Half of those in the "work-focused"
group were not enrolled one year after the nominal time for high school graduation. The
other two groups fell between the "homework-focused" and "work-focused" groups, with the
"involved in both" group having higher rates of full-time enrollment (55 percent) and overall
enrollment (66 percent) than the "involved in neither" group (45 percent of whom were
enrolled full-time, and 59 percent of whom were enrolled 'all).
Relationship to post-high school employment. As would be expected, the
homework/paid work grouping shows a different relationship .with post-high school
employment than with postsecondary school enrollment. Those students who were "work-
focused" in 10th grade were most likely to be working full-time after high school graduation,
with 36 percent working full-time. Those least likely to be employed full-time were the
students who were "homework-focused" in 10th grade; only 15 percent of them were
working full-time one year after high school graduation (Figure 20).
As noted above, the largest group of 10th graders fell into the category of those
spending little time on both homework and paid work. Full-time employment was reported
among 20 percent of students from this group one year after high school graduation. .In
conjunction with the fmdings for school enrollment, the results suggest that about one-third
of the "involved in neither" students were not enrolled nor employed fulli-time one year after
high school graduation. This is similar to the percentage neither employed nor enrolled full-
time observed for the "work- focused" group, (32 percent), but relatively high compared to
the comparable proportions from the "involved in both" group (24 percent) and the
"homework-focused" group (20 percent).
36

- It appears to be the case that the association between doing more homework and full-
time college enrollment is stronger than the assOciation between doing more 'paid work and
full-time employment. This indicates that the jobs that "work-focused" adolescents hold are
not giving them the skills or experience necessary to obtain stable full-time employment after
high school. It also suggests that schools may need to take a larger role in helping to
prepare non-college-bound students for employment after high school.
Time Use in 12th Grade and Postsecondary Schooling and Employment
The combination of time spent on homework and paid work among 1241-grade
students in the LSAY showed a similar relationship to postsecondary school enrollment and
employment. The percentage of students falling into each of the four homework/work
groups was as follows:
1) High homework hours, High work hours: 22%;
, 2) High homewoik hours, Low work hours: 15%;
3) Low homework hours, High work hours: 39%;
4) Low homework hours, Low work hours: 24%.
\ Given the age- and grade-related rise in adolescent employment noted.earlier, it is not
surprising that the percentages of students classified into the "high work" groups increased
between 10th and 12th grade. By the 12th grade, the largest group of students (39 percent)
consisted of. those who were spending more time working than doing homework (i.e, "work-
focused"), while the smallest group (15 percent) consisted of those spending more time on
homework than work (i.e., "homework-focused"). However, even with this shifting-
distribution of student time use, the relationships with enrollment and employment after high
school were very similar to those observed with respect to 10th grade patterns of homework
and paid work (Figure 21).
Most students who spent a relatively large amount of time on homework in the 12th
grade were enrolled full-time in college right after high school. Those who were combining
37 4 5

homework and work in the 12th grade appeared lilcely to combine work and school after
graduation as well. A relatively high percentage of the "involved in both" group was
enrolled full-time in postsecondary school (60 percent) and a rather high percentage was
working part time (46 percent) after high school. The two groups who spent little time on
homework in the 12th grade were most likely not to be enrolled at all in-postsecondary
education, but about half did go on to full-time enrollment. Full-time employment right after
high school was most common among the work-focused 12th graders. As before, however,
the association between more time working in high school and full-time employment post-
high school was not as strong as that between doing more homework in high school and
going on to enroll in college full-time. Again, it appears that many of the students who are
not preparing for postsecondary eduation are not obtaining full-time jobs after high school.
Homework and work time and inyolvement in risky behaviors
The association between adolescent time use and later involvement in risky behaviors
was examined primarily with data from the NELS, because that data set had information on a
richer set of problem behaviors than did the LSAY. Nonetheless, there was information in
the LSAY on cutting classes, smoking, and dropping out by the 12th grade. Thi relationship
of each these behaviors to time spent doing homework and paid work was examined. The
findings were that the 10th graders most likely to be engaging in these problem behaviors
were those who were "work-focused." Among those spending little time on homework and a
larger amount of time working for pay, 40 percent 'cut classes now and then while in 10th
grade, 24 percent were smokers in 11 th grade, and 20 percent were dropouts by what would
have been their senior year in high school (Figure 20).
By comparison, the "homework-focused" students were least likely to be engaging in
risky behaviors. Among those spending more time on homework than paid work, 20 percent
cut classes now and then, only 7 percent were smokers in llth grade, and only 5 percent
were dropouts by the 12th grade. Interestingly, 10th graders at the opposite ends of the
spectrum as far as time studying at home and working for pay, i.e., those spending 7 or
more hours on both and those spending 7 or more hours on neither, appeared very similar in
38
4f;
terms of the proportions who went on to engage in risky behaviors. The problem behavior
frequencies for the "involved in both" and "involved in neither" groups lie in-between those
observed for the "work-focused" and "homework-focused" groups (Figure 20).
The relationships of homework and work time among 12th-grade students to their
participation in risky behaviors were very similar to those observed with the 10th-grade
groups. The work-focused students in 12th grade were the ones most likely to be cutting
classes and smoking cigarettes, while the homework-focused students were least likely to be
doing these things. The "involved in both" and "involved in neither" groups were
intermediate with respect to smoking, but comparable to the homework-focused group with
respect to cutting classes (Figure 21).
Adolescent Time Use and Involvement in Risky Behaviors
Data from three waves of the National Education Longitudinal Study that began in
1988 were used to examine the relationship between adolescent time use and the occurrence
of risky behaviors like drug use, delinquency, and teen parenthood. In relting time use to
the development of risky, behaviors, seven different types of problem behaviors or behavior-
linked events were analyzed. The occurrence of the behaviors and events was assessed from
student self-reports in questionnaires they filled out either as students in the 10th grade (in
1990) and 12th grade (in 1992) or as students in the 10th grade and dropouts in 1992. The
criterion events and their overall frequencies of occurrence were as follows:
1) dropping out of school between the 10th and 12th grades:
2) having been suspended in the current school year:
3) having or expecting a child:
4) having been arrested in the last year:
5) currently smoking at least one cigarette daily:
6) having used marijuana or cocaine in the last 12 months:
7) having had 5 or more drinks in a row in the past two weeks:
39 4
11 percent;
8 percent;
8 percent;
6 percent;
27 percent;
26 percent;
41 percent.

Participation in extracurricular activities, was assessed as of the 10th grade, when all
of the young people in the panel under study were still students. The relationships between
risky behaviors and three different aspects of activity participation were analyzed. These
were:
1) the total time that the student spent in school-sponsored extracurricular activities
in a typical week;
2) the number of different activities in which the student was involved; and,
3) the specific, types of activitiesin which the student participated (e.g., in varsity orjunior' varsity sports; intramural sports; band, orchestra, chorus, or school play ormusical; vocational clubs such as Future Farmers of America; and so on).
Relationship of total time spent in extracurrictilar activities to the development of
problem behaviors
Young people who were minimally involved in extracurricular activities were more
likely than other youth to drop out of school and to exhibit a variety of risky behaviors, such
as smoking, illicit drug use, delinquency, and teen parenthood. Greater involvement in
extracurricular, activities was generally associated with lower rates of engaging in risky
behaviors. However, differences between students who devoted sizable amounts of time to
extracurricular activities (5-19 hours per week) and those who devoted low-to-moderate
amounts of lime (1-4 hours per week) were often small and not always statistically reliable.
Furthermore, there appeared to be a curvilinear relationship such that young people who
devoted very substantial amounts of time (20 hours or more) to extracurricular activities were
more apt to exhibit risky behaviors than those who devoted sizable but not extreme amounts
of time to the activities (Figure 22).
To illustrate: compared to 10th grade students who reported spending a high number
of hours (5-19) per week in extracurricular activities, those who reported spending no time in
school-sponsored activities were:

six times more likely to have dropped out of school by the time they would have
been seniors;
three times more likely to have been suspended in their sophomore or senior
years;
two-and-a-half times more likely to have become teen parents by their senior
years;
twice as likely to have been arrested by their senior years; and,
about three-quarters more likely to have smoked cigarettes or used drugs as
sophomores or seniors.
The contrasts between the non-particiflators and those who devoted low-to-moderate
amounts of time to extracurricular activities were not as great as those with high
participators, but they were still marked. For example, students in the former group were:
twice as likely to have been suspended or to have droPped out of school;
a about half again as likely to have used illicit drugs or been arrested; and,
more than a third more likely to have smoked cigarettes or become teen parentsby their senior years.
One risky behavior (out of the seven examined) showed a less pronounced relationship
with total time in extracurricular activities than the others. That was binge drinking. The
proportion of students who had engaged in binge drinking was almost a fifth lower among
students who had high involvement in extracurricular activities than among extracurricular
non-participators. Although statistically significant, this was a coRsiderably smaller
difference than those observed with the other risky behaviors. Furthermore, as shown
below, the binge drinking difference did not remain significant when other, related factors
were controlled. The fact that binge drinking behaved differently than the other risky
behaviors may have to do with the greater social acceptability of drinking in adult society,
compared with cocaine or marijuana use. In addition, as described below, one form of
extracurricular activity -- team sports -- seems actually to predispose young people to binge
drinking.
41

Controlling for related factors
The lower incidence of risky behaviors-among young people who are involved in
extracurricular activities may be wholly or partly due to the fact that, as shown above,
students who participate in these activities are more likely to have gotten good grades in
school in the past and to be currently enrolled in college-preparatory programs. Participators
are also more likely than non-participators to come from families that are well-educated,
prosperous, and involved in school-related activities themselves. It may be these related
factors, rather than extracurricular participation as such, that help to protect the young people
from potentially detrimental behaviors like droppIng out, smoking, and drug use.
Multivariate analysis methods were used to control at least partly for the 'effects of
family, student, and school characteristics and to reveal whether any association between
extracurricular participation and risky behaviors remained after these related influences were
taken into account.' Family characteristics entered into the analysis were the education level
of the student's more educated parent,. and*whether the faMily's socioeconomic status fell
into the first (lowest) quartile, or the 2nd, 3rd, or 4th (highest) quartile, as estimated from
information about the parentsf occupations and household possessions. Also entered were
whether the family had received welfare in the last year, and whether the parents spoke a
language other than English as their main language at home. Family structure was taken into
account by coding whether the parents or guardians present in the home with the student
were the biological or adoptive mother and father (reference group), the mother only, the
mother and a stepfather, the father only, the father and a stepmother, or if neither biological
parent was present.
The level of parent involvement in school-related activities was assessed from student
responses to a series of questions about the parents meeting with teachers, going to PTA
meetings, etc., and ertered into the analysis. Based on their responses; students' families
were categorized as displaying low, moderate (reference group), or high levels of
Multiple logistic regression was the analytic method used. The regression analyses aresummarized in Tables 1 through 18.
42C

involvement, or they were put into a missing information category on the in/gement
variable to avoid throwing out the substantial number of cases for whom this was true.
Student characteristics entered into the analysis were the student's sex, and whether
the student's racial and ethnic background was black, Hispanic, Asian or Pacific Islander, or
white non-Hispanic (reference group). Also included were whether the student's grade point
average in the eighth grade was in the first (lowest) quartile, or the 2nd, 3rd, or 4th (highest)
quartile, and whether, in the 10th grade, the student was enrolled in a general high school
program, a vocational/technical program, an academic or college-preparatory program
(reference group), or some other type of program.
Two school characteristics were taken into account in the analysis: whether the-school
was a private-religion affiliated school, a private school that was not affiliated with a
religion, or a public school (reference group); and whether the school had a high proportion
(50 percent or more) of minority students, a medium proportion (25-49 percent), or a low
proportion (reference group).
The results of the multivariate analyses showed that both hours per week of
extracurricular participation and the control variables were associated with the occurrence of
the problem behaviors (Figure 23 and Tables I and 2). Most of the family, student, and
school characteristics were significantly related to the probability that a student would engage
in problem behaviors like dropping out, becoming a teen parent, or using drugs. Although
the pattern of relationships was fairly similar from one problem behavior to the next, the
strengtfi of specific predictors varied somewhat across the different behaviors. Dropptg out
was most strongly related to the combined Set of participation and background characteristics,
whereas binge drinking was least strongly related. Becoming a teen parent, getting arrested,
becoming a smoker, and using drugs fell in between these poles in terms of the strength of
tl:e overall association with the predictor set.
When the related characteristics were taken into account, the strength of the
association between hours per week of extracurricular participation and the occurrence of a
43

problem behavior was generally diminished. However, a significant negative relationship
between participation and risky behavior remained in almost all cases. The one exception
was with respect to binge drinking, which did not show a significant relationship with hours
of participation after the other factors were controlled (Figure 23).
The most consistent finding was that sophomores who spent no time participating in
extracurricular activities had a higher chance of exhibiting risky behaviors than those who
..Spent low-to-moderate amounts of time (less than 5 hours per week) in such activities. The
non-participators were half again as likely to drop out or use drugs, a third again as likely to
become teen parents or smokers, and a quarter agahi as likely to be arrested, compared to
the low-to-moderate participators.
Sophomores who spent 5-19 hours per week in extracurricular activities had at least
as low a likelihood of engaging in the risky behaviors as thoie who spent only 1-4 hours per
week in extracurricular activities. With respect to some of the problem behaviors, the
former grouP had a significantly lower likelihood of engaging in the behaviors than did the
latter group. For example, high participators.were only half as likely as low-to-moderate
partic:pators to drop out and 80 percett as likely to become smokers. Sophomores who wete
extreme extracurricular participators (those who reported spending 20 hours or more per
wek in the activities) were not significantly 'higher nor lower than the low-to-moderate
participators in terms of their chances of engaging in risky behaviors.
Differences in the effects of extracurricular participation among males and
females
Parallel analyses were carried out for only male and only female students, to discover
whether extracurricular participation operated similarly or differently for the two sexes. The
pattern of results was generally similar (Figures 24 and 25; Tables 3 through 6). One
notable eAception involved the criterion event of becoming a teen parent.
44

Among females, the link between extracurricular non-participation and a greate
likelihood of teen parenthood was stronger than the relationship found when the sexes were
combined. Female non-participators were half again as likely as low-to-moderate
participators to have given birth by their senior years. Very heavy participators were also
more likely to have given birth than low-to-moderate participators, but this difference was
not statistically reliable. The reason for the lack of statistical significance was the small size
of the subsample of females who spent 20 or more hours per week in extracurricular
activities (Figure 25).
A similar pattern of differences was observed among males, but none of the
differences was large enough to be deemed statistically reliable. No significant relationship
between extracurricular non-participation and teen parenthood remained after controlling for
related factors (Figure 24). The difference between the sexes with respeclinhis relationship
may be because the individual male has less direct control than the individual female over
. whether or not he becomes a parent. Hence, chance plays a greater role in the occurrence of
early parenthood among males. It may also be that male students are less candid in reporting
their parenthood because the evidence is not as inescapable as it is for females.
Effects of the number of activities in which the student participates
Thus far, the analyses of the relationship between extracurricular participation and the
occurrence of risky behaviors have focused on the amount of time students spent in
extracurricular activities in a typical week. The number of different types of activities in
which the student participated during the school year is another measure of involvement.
The relationship between this measure and the qcurrence of risky behaviors was examined,
controlling for the influence of the same family,/ student, and school characteristics that were
employed earlier. As before, separate analyses! were conducted for male and female
students.
45

Once again, the most consistent finding was that students who were involved in no
activities were significantly more prone to risky behaviors than those who were involved in
at least one activity (Figure 26; Tables 7 through 10).
Students who reported involvement in no activities during a year were a smaller and
more extreme group than students who reported spending no time in extracurricular activities
in a typical week. It is not surprising, then, that the former group showed even more
pronounced tendencies to engage in risky behaviors than did the latter. For example, males
involved in no activities were twice as likely to drop out,. and two-thirds more likely to
smoke, than male students who participated in one activity. Likewise, females who'
participated in no activities during the year were sixty percent more likely to smoke or use
use drugs than females who participated in one extracurricular activity (Figure 26).
Participating in two or three or more extracurricular activities -- as opposed to only
one -- was generally not associated with a further reduction in the risk of exhibiting problem
behavior, at least not a statistically significant reduction. However, females who participated
in three or more activities were three-quarters as likely to drop out or become teen parents as
females who participated in only one activity (Figure 26).
Effects of participation in specific kinds of activities
Is one kind of extracurricular activity as good as another, as far as the prevention of
youthful problem behavior is concerned? Or are some types of activities more clearly
associated than others with lowering the risk of drop out, delinquency, and substance abuse?
Some reasons why an activity might be especially effective in helping to prevent risky
behavior are that the activity generates a lot of enthusiasm and interest in young participants,
has a strong ethical component, rewards talents and skills different than those typically
rewarded in academic work, or requires a training regimen that is incompatible with late-
night partying or substance abuse. On the othet hand, at some high schools, it is traditional
for student athletes to hold beer parties after big games. Membership on such a team might
46
54

actually encourage binge drinking and perhaPs other risky behaviors on the part of young
people.
In terms of bivariate associations, most of the school-sponsored activities for which
participation data were'collected in the NELS showed negative relationships with at least
some risky behaviors; i.e., those who participated in the organized activity were less likely to
engage in the risky behavior. Noteworthy exceptions were participation in intramural sports
(as opposed to interscholastic sports), which was largely unrelated to risky behavior, and
participation in vocational clubs, which, if anything, was positively related to some problem
behaviors, such as dropping out and becoming a teen parent. The latter may have been the
case because students who participated in vocational clubs were apt to be in the
vocational/technical or general programs in their higli -schools and, hence, had a higher risk
of engaging in early school departure and childbearing to begin with.
Three different types of activities were selected to be examined through inultivariate
analyses. As before, these analyses controlled for family, student, and school characteristics
that might be responsible for the observed correlation between activity participation and risky
behavior. The three chosen activities were participation in interscholastic sports (varsity,
junior varsity, or freshman team participation); participation in the school band, orchestra,
chorus, or in a school play or musical; and participation in vocational clubs, such as Future
Farmers of America, Future Homemakers of America, or Future Teachers of America.
Each of these activities tended to recognize and nurture skills and talents different
from those recognized in the classroom. At the same time, the.three were different in
character from one another. Also, each had a large enough participation rate to allow for
reasonably reliable estimates when separate analyses were conducted for males and females.
When multivariate analyses were carried out with the three activities, both sports and
music/dramsa participation showed significant relationships with problem behaviors, but
vocational club`participation largely did not. Thus, the analyses involving vocational clubs
are omitted from this report.
47

Effects of participation in varsity sports. Students who participated in varsity and
junior varsity sports were significantly less likely than non-participants to drop out of school
or become smokers by their senior years. Male athletes were only about four-tenths as likely
to drop out and two-thirds as likely to smoke as male non-athletes. Female athletes were six-
tenths as likely to drop out and about. 85 percent as likely to smoke as female non-athletes.
Both male and female athletes appeared to have an increased risk of having been arrested,
but these differences were not statistically reliable. Varsity _,)orts participation bore no
significant relationship to illicit drug use (Figure 27; Tables 11 through 14).
Female athletes were only two-thirds as likely to become teen mothers as female non-
athletes. On the other hand, male athletes were four-tenths more likely to report being
fathers than male non-athletes. And both male and female athletes were significantly more
likely to have engaged in binge drinking than their non-athlete counterparts. The males were
half again as likely, whereas the females were more than quarter more likely to have done
so (Figure 27).
Involvement in sports seems clearly beneficial in reducing the chances that a young
person will leave school or harm his or her athletic performance by taking up smoking. But
the carousing and macho behavior patterns that are sometimes associated with team sports in
U.S. high schools seem to pose some risks for student athletes. They increase young
people's chances of taking part in group bouts of excessive drinking of beer and other forms
of alcohol. Such drinking is hazardous in itself and contributes to unsafe sexual activity,
motor vehicle accidents, and violence. It can also help to nurture longer-term patterns of
heavy drinking which may have serious health consequences in later life.
Effects of participation in music and drama activities. Students who participated
in band, orchestra, chorus, or in a school play or musical were significantly less likely than
non-participants to drop out of school, be arrested, become smokers, use drugs, or engage in
binge drinking by their senior years (Figure 28; Tables 15 through 18).
48

Male music and drama performers were only about three-quarters as likely as non-
participants to drop out, be arrested, smoke, or use drugs, and only about seven-tenths as
likely to engage in binge drinking as male non-performers. Female music and drama
performers were only two-thirds as likely to drop out, be arrested, smoke or use drugs, and
only three-quarters as likely to .drink heavily, as female non-performers. In addition, female
performers were only about eight-tenths as likely as non-performers to become teen mothers.
Music and drama participation bore no significant relationship to teen parenthood among
male students (Figure 28).
In sum, participation in school-sponsored music and drama activities is linked to
lower risk of a range of problem behaviors. Unlike the case with varsity sports, music and
drama participation is not associated with a greater risk of binge drinking. Just the opposite
was found to be true. Given these favorable links between music or drama and student
behavior, it seems particularly unfortunate that participation in these types of activities by
high school sophomores declined markedly in the last decade. With renewed emphasis on
the importance of music and the arts in the high school curriculum, the next decade may see
some resurgence in student participation in these kinds of school-sponsored acti(rities.
49
rt )

SUMMARY AND DISCUSSION
This study made use of several large-scale data bases to examine the time-use patterns
of American adolescents in the late 1980s and early 1990s, compare them with those
exhibited by young people 10 to 20 years ago, and test whether participation in
extracurricular activities reduces the chances that young people will engage in various risky
behaviors. The data analyzed came from Monitoring the Future (an annual survey of high
school seniors), the Longitudinal Study of American Youth, the National Education
Longitudinal Study begun in 1988, and an earlier longitudinal study called High School and
Beyiind. The risky behaviors studied were dropping out of school, having children while
still teenagers, being delinquent, smoking; using marijuana or cocaine, and binge drinking.
The study found that U.S. teenagers have a lot of discretionary time available to them
and, for most, that time is not being filled with activities that build their skills or characters.
On average, today's 10th grade students devote only one half hour per day to homework.
Less than 20 percent of them read for pleasure almost every day, only 15 percent work daily
on hobbies, arts, or crafts, and just 5 percent routinely use personal computers for
schoolwork or recreation. Less than a third attend religious activities once a weekor more,
About a fifth participate in youth groups or organized recreational programs that often, and a
similar fraction take weekly classes outside of school in music, art, language, or dance. One
in eight takes weekly sports lessons outside of school, while one in fourteen volunteers or
performs community service activities.
How then do teenagers spend the considerable amounts of free time at their disposal?
They watch television (two and a half hours per day, on average); they talk with other teens
on the telephone (60 percent say they do so on a daily basis); and they hang out with friends
in malls and other neighborhood hangouts (64 percent do this at least one or twice a week).
As they get older, they work for pay at relatively low-skill jobs that do little to prepare them
for the more complex and demanding jobs at which they are likely to later work. Sixty
percent of U.S. 12th graders and 27 percent of 10th graders do seven or more hours of paid
work per week during the school year.
505

When the study compared adolescent time use in the 1990s with that in the mid-1970s
or early 1980s, overall patterns were surprisingly similar. The changes found, were mostly in
a negative direction as far as constructive use of time was concerned. For example, high
school students in 1990 spent no more time doing homework than earlier cohorts did, despite
taking courses that were supposedly more rigorous. Teenagers in the 1990s were less likely
to read books, do household chores, or attend religious services on a regular basis than their
predecessors were. Compared to the early 1980s, fewer students in the 1990s participated in
band, orchestra or chorus in school, in traditional hobby clubs such as photography or chess,
or in cheerleading or drill team. On the other hand, almost as many went out for varsity
sports, and slightly more took fart in academic clubs, such as science, comput6r, or foreign
language clubs, math team, or debating society. Overall, however, the increased emphasis
on academics that has supposedly dominated American education in recent years has not
resulted in much apparent change in intellectual effort or studying behavior among American
adolescents.
Not only is the time use of the average American teenager relatively unproductive,
there is considerable inequality in the extent to which different groups of teens use their free
time in constructive as opposed to idle or detrimental ways. Young people from families
with low levels of parent education or family income, who would seem to be most in need of
organized skill-building and character-nurturing activities, were found to be least likely to
engage in such activities. Likewise, students whose parents were uninvolved in the PTA and
other school-related activities did not participate in constructive free-time activities as often,
nor spend as much time doing homework, as students with involved parents. Students
enrolled in general or vocational/technical programs in high school had much less exposure
to extracurricular activities than students enrolled in academic or college-preparatory
programs.
The time-use patterns of 10th graders were predictive of what they would be doing
one year after high school. Those who were "homewolk-focused" were twice as likely to be
enrolled full time in postsecondary school as those who were focused on paid employment as
10th graders. Conversely, those in the latter group were twice as likely as those in the
51 rs .
former to be emploed full time after high school. However, the link between doing more
paid work as a teenager and full-time employment as a young adult was weaker than the
association between doing more homework and full-time college enrollment. This indicates
that the jobs that adolescents hold are not giving them the skills or experience necessary to
\ obtain stable full-time employment after high school.
Time-use patterns of 10th graders were also predictive of whether they would engage
in a, variety of risky behaviors. For example, compared to those who reported.spending 1-4
hours per week in extracurricular activities, students who reported spending no time in
school-sponsored activities were 57 percent more likely to have dropped out by the time they
would have been seniors; 49 percent more likely to have used drugs; 37 percent more likely
to have become teen parents; 35 percent more likely to have smoked cigarettes; and 27
percent ',more likely to have been arrested. These significant negative relationships were
found after controlling for related family, school, and student characteristics such as parent
education and income levels, parent involvement in school-related ictivities, and students'
grades. Up to a point, students who spent more time (5-19 hours per week) in
extracurricular activities were even less likely to engagt in risky behavior. However, there
was not as great a deterrent effect among those who spent large amounts of time (20 or more
hours per week) in extracurricular pursuits.
One behavior that proved an exception to the rule that extracurricular participation'
reduced risky conduct was binge drinking. After other factors were controlled, time in
extracurricular activities did not show a significant relationship with underage drinking. The
difference may be due to the greater social acceptability of drinking in adult society,
compared with cocaine or marijuana use, or to another finding of the study. This was that
one form of extracurricular activity -- varsity sports -- actiially seemed to predispose young
people to binge drinking.
When data on adolescent time use and risky behavior were analyzed separately for
males and females, similar relationships were found. One difference was that the deterrent
effect of extracurricular participation on teen childbearing was more clearly evident among
52
(SG

females then males. Similar relationships were also observed when the number of activities
in which students participated was used as a measure of extracurricular involvement instead
of hours per week. \,
Participation in two specifi\c\forms of extracurricular activity, varsity sports and music
or drama, showed somewhat different relationships to later risky behavior. Students who
participated in varsity sports were less likely than non-participants to drop out of school or
become smokers by their senior years. On the other hand, student athletes were significantly
more likely to have engaged in binge drinking, as noted abOve. Also, male (but,not female)
athletes were more likely to have become teen parents. By contrast, students who
participated in band, orchestra, chorus, or in a school play or musical were significantly-less
likefy than non-participants to engage in nearly all the problem behaviors: dropping out of
school, being arrested, becoming smokers, using drugs, or engaging in binge drinking.
Female (but not male) performers were also less likely than non-performers to have become
teen parents.
How risky behavior is prevented
The findings indicate that organized youth activities can help to prevent risky behavior
in adolescence and young adulthood. They also provide some insights into how participation
might be working to deter such behavior. For example, as noted in the introduction, if time
displacement is the mechanism by which risky behavior is being prevented, then the more
time the youth spends in constructive pursuits, the less should be his or her chances of
engaging in risky behavior.
The results showed that, in most instances, more time in extracurricular activities did
mean a lower chance of risky behavior. However, the decline was not a steady one.
Students who spent a great deal of time in extracurricular pursuits (20 hours or more) stood
at least as great a chance of engaging in risky behaviors as those who spent-minimal amounts
of time (1-4 hours) in extracurricular activities. This indicates that other mechanisms were at
work in addition to time displacement.
53
6

One alternative or complementary mechanism is commitment building, which was
also discussed in the introduction. If this mechanism is operating, activities that develop
skills, nurture aspirations, and bolster the youth's sense of self-worth and self-efficacy should
be more of a deterrent to high-risk behavior than activities that do less of theSe things. A
finding that seems consistent with this hypothesized distinction was that participation in
varsity sports was associated with reduced frequencies of dropping out and smoking, whereas
participation in intramural sports was not.
Being able to participate in varsity sports usually means that the student has developed
a sufficient degree of athletic skill to "make the team." A varsity team member typically
gets more coaching and spends more time practicing than a member of an intrarnural team
does; there is more emphasis on performing to the best of his or her abilities. The varsity
team member is competing for the school against other schools, and his or her efforts are
actively supported and appreciated by the_ student body, parents, and faculty. These
characteristics should make varsity sports more of a boost to the Student's sense of self-worth
and commitment to the school than intramural sports. The observed differences in dropout
and smoking rates were consistent with the differences expected on the basis of the
commitment-building notion.
At the same time, participation in varsity sports was Associated with higher rates of
binge drinking and (for male athletes) teen parenthood. These 'findings seem to point to
another mechanism discussed in the introduction, namely, group pressure. According to this
notion, the important thing about an activity is the sense of group belonging it engenders,
and the beliefs held by group leaders and members. If the group code opposes a specific
form of risky behavior -- like smoking because it is deleterious to athletic performance --
then participation in the activity will act as a deterrent to that risky behavior.
If, on the other hand, group members do not disapprove of the risky behavior, or
even endorse it, then participation will not prevent the behavior and may actually increase its
likelihood. Presumably, this is what happened with respect to varsity sports and binge
drinking. The survey data do not indicate explicitly that sports team members endorsed
54

drinking, but it is certainly a commonly-held belief that many student athletes drink and
many varsity sports teams hold beer/parties after big games. Thus, while the survey results
do not prove the group pressure hypothesis, they lend credence to this explanation of risky
behavior prevention.
Further research is needed to test the different mechanisms of risky behavior
prevention more explicitly. Such research would require information not only about the
activities in which a young person participates, but also about what the young person gets out
of each activity in the way of challenges and satisfactions. It would also.require information
about the attitudes and beliefs of the other young people who take part in the activity.
Existing data sets on adolescent time use do not meet these demanding requirements, so new
data collection efforts would be needed.
Increasing constructive time use among U.S. adolescents
The findings of the present study regarding the beneficial effects of extracurricular
participation for teenagers are reinforced by those of other recent studies that have shown
links between involvement in extracurricular activities and success in school (Finn,.1993;
Lamborn et aL, 1992; O'Brien and Rollefson, 1995) and reduced rates of unhealthful
behavior (Escabedo et al., 1993). One caveat, though, is that none of these studies has used
an experiniental design involving random assignment to treatment or control conditions.
Thus, the possibility still exists that the observed relationships between extracurricular
participation and positive youth outcomes are correlational rather than causal in nature.
Despite this limitation, the findings seem sufficiently promising to warrant a call for
demonstration projects aimed at increasing the amount of time U.S. adolescents spend in
constructive group activities, such as community service efforts, amateur musical or dramatic
productions, environmental improvement activities, and science or technology projects. The
survey data show that more productive use of discretionary time is needed among American
adolescents from virtually all social and economic groups, but especially among young
people from families with lower education and income levels, and those who are not enrolled
55 f, .-0 .)

in college-preparatory programs in school. Such projects could be sponsored by schools,
religious or community organizations, or other public or private agencies. Wherever
feasible, they should include evaluations of the short- and longer-term effects of activity
participation on youth development and behavior.
National surveys indicate that a range of extracurricular activities is available to
almost all students in public high schools in the United States (O'Brien and Rollefson, 1995).
,Research is needed to clarify why young people from lower-SES families and students in
vocational or general programs do not take more advantage of existing opportunities for
extracurricular participation.
The activities in which young people are encouraged to participate should be designed
with the fmdings of the present study in mind. It seems likely, if not yet certain, that the
effectiveness of an activity in preventing adolescent misbehavior depends not just on the
degree to which it occupies idle time, but also on the extent to which it develops skills,
raises aspirations, and provides fulfilling experiences for teen participants. It depends as
well on the attitudes that other participants have about engaging in specific high-risk
behaviors. If the group code encourages some forms of risky behavior, such as binge
drinking or sexual promiscuity, participation in the activity may well be counterproductive.
56

IMPLICATIONS FOR FUTURE RESEARCH AND POLICY DEVELOPMENT
The findings of this study have several implications for future research and the
development of public or priVate programs aimed at iellucing the prevalence of risky
behaviors among young people and improving their educational and occupational outcomes.
The rapid technological, economic, and cultural changes that American society is undergoing
point to a need for continued monitoring of how American adolescents are spending their
time outside of school.. There is a particular need to assess whether adequate opportunities
for constructive time use are being afforded to young people from families lower down on
the socioeconomic scale and to those who are not doing well in regular school. We should
also ask whether these young people are taking advantage of the opportunities for
extracurricular participation that are available to them. If not, why not?
Recurring Time-Use Surveys
In order to answer such questions, a program of recurring national surveys focused on
youthful time use is called for. These studies should be conducted/it least once every five
years, with longitudinal follow-up of the sample youths during the intervening years. The
studies could be carried out relatively economically if they weie conducted as supplements to
existing survey programs, such as Monitoring the Future, the National Health Interview
Survey or the Youth Risk Behavior Surveys of the Centers for Disease Control and
Prevention, the Adolescent Health Survey (ADD Health) administered by the National
Institute of Child Health and Human Development, or the National Education Loi4gitudinal
Studies or the National Household Education Survey of the National Center for Education
Statistics.
Gathering information needed to test theories
If these studies are to advance our understanding of the causes and conbequences of
youthful time use, they should gather supplementary information that would allow, theoretical
perspectives like ecological systems theory and social control theory to be tested more
57

thoroughly. For example, the surveys should gather more data on the ecological contexts in
which different patterns of activity participation and time use occur. In particular, surveys
should find out about the availability of different types of activities in sample schools and
neighborhoods, about possible barriers to participation (such as school rules requiring a
certain academic average before students are allowed to take part in sports or other
extracurricular activities), and about the time, monetary, and opportunity costs of
participation for different groups of young people. Parent support of youth activities should
also be assessed. If possible, ecological data should come from or be verified by
independent sources (such as school administrators) and not be based solely on the reports of
youths themselves.
In addition, the surveys should collect more information about the commitment-
building and group-influence aspects of activity participation. To what extent did
participation in a specific activity develop skills, create aspirations, nurture positive character
traits, provide rewarding experiences, and strengthen the young person's dedication to
productive pursuits? Did the youth feel a sense of camaraderie and belonging while
participating in the activity? To what degree were the opinions of other group members or
the adult leader important to the youth? What were the attitudei of other group members
with respect to such matters as staying in school, working hard for good grades, going on to
college, as well as in regard to drinking, smoking, drug use, teen childbearing, and
delinquent conduct?
In large measure, these questions would have to be answered by the youth him- or
herself. To avoid circularity, though, it would be good if the information were at least partly
based on independent sources, such as parents, teachers or coaches, and other members of
the group. Contacting and interviewing additional informants such as these would add to the
cost of time-use surveys, of course. But the information obtained would greatly increase the
confidence one could place in the findings.
The survey program should have a longitudinal component that gathers data about the
youth's subsequent educational attainment and employment, as well as the occurrence of
58
G6

risky behaviors such as those examined in the present study. It would then be possible to
verify the negative relationships between participation in constructive activities and later
problem behavior and test more adequately the differing theoretical explanations of why this
protective effect is observed.
Measuring time use more accurately
In addition to collecting supplementary data that are theoretically relevant, new
studies should strive to measurd adolescent time use with greater accuracy. Two ways of
doing this are the 24-hour recall diaries used in earlier studies at the University of Michigan
(Juster and Stafford, 1985) and the University of Maryland (Robinson, 1991), and the
Experience Sampling Method used at the University of Chicago (Csikszentmihalyi and
Larson, 1984), which involves "beeping" teenagers at random times. Both methods are more
time-consuming and costly to administer and analyze than summary questions about time use
such as those analyzed in the present study.. But the methods are likely to produce more
accurate pictures of actual time use patterns, ones that are less tainted by errors of memory
and social desirability bias. A reasonable cotspromise might be to apply one of these
methods in a subsample of a large national study that relied primarily on summary
questionnaires. This would allow researchers to "calibrate" the questionnaire responses and
obtain some of the benefits of greater measurement accuracy, while keefilkg overall study
costs at a manageable level.
Evaluation Studies
The effects of participation in constructive activities on youth development could be
appraised more rigorously by carrying out a program of longitudinal evaluation studies
involving random assignment of young adolescents to treatment or control conditions. The
studies would be conducted at several demonstration sites around the country. The
"treatment" would be an opportunity to participate for a year or more in a special youth
activity, organized by the local school district or a neighborhood organization. The activity
might be a club, a team, a musical or drama group, or a youth service organization. The
59

activity would be specially designed to try to build commitment and expose the young people
involved to positive peer and adult influences.
The demonstration projects should begin in early adolescence (ages 13- i4)_ and follow
young people in both experimental and control groups for four-to-six years, until they are in
their late teens. Follow-up information about school enrollment and academic performance,
employment, parent status, and involvement in risky behaviors should be collected annually
or bienniilly. The data gathered should include information abbut the ecoktical contexts of
the young people's lives.
Once the protective effect of activity participation had been demonstrated
experimentally, it would be desirable to conduct further rounds of studies that varied the
design of the special youth activities in order to determine which aspects were critical for
successful prevention of risky betaviot. It would also be desirable to go beyond
demonstration projects and develop public policies and private initiatives that would make the
proven youth programs available to large numbers of young people across the nation.
60

BIBLIOGRAPHY
Alwin, D.P. (1988). From obedience to autonomy: Changes in traits desired in children,
1924-1978. Public Opinion Quarterly, 52(1), 33-52.
Astir), A.W., Green, K.C., Korn. W.S., &Mit, M., & Berz, E.R. (1988). The Americanfreshman: National norms for fall 1988. Los Angeles: Higher Education Research Institute,
Graduate School of Education, UCLA.
Berk, L.E. (1993). Infants, children, and adolescents. Botton: Allyn and Bacon.
Bronfenbrenner, U. (1979). The ecology of human development: Everiments by nature anddesign. Cambridge, MA: Harvard University Press.
Bronfenbrenner, U. (1986). Ecology of the family as a context for human development:
Research perspectives. Experimental Psychology, 22(6), 723-742.
Burt, M.R., Resnick, G., & Matheson, N. (1992). Comprehecive service integrationprograms for at risk yokth. Final report prepared for the Assisant Secretary for Planning and
Evaluation, Department of Health and Human Services. Washington, DC: Urban Institute
Carnegie Corporation. (1992). A matter of time: Risk and opportunity in the non-schoolhours. New York: Carnegie Corporation, Carnegie Council on Adolescent Development.
Csikszentmihalyi, M. (1990). Flow: The psychology of optimal experience. New York:
Harper & Row.
Csikszentmihalyi, M., & Larson, R. (1984). Being adolescent: Conflict wid growth in the
teenage years. New York: Basic Books.
Elliott, D.S., Huizinga, D., & Ageton, S.S. (1985). Explaining delinquency and drug use.
Beverly Hills: Sage Publications.
Elliott, G.R., & Feldman, S.S. (1990). Capturing the adolescent experience. In S.S.Feldman & G.R. Elliott (Eds.), At the threshold: The developing adolescent (pp. 1-13).Cambridge: Harvard University Press.
Escabedo, L.G., Marcus, S.D., Holtzman, D., & Giovino, G.A. (1993). Sportsparticipation, age at smoking initiation, and the risk of smoking among U.S. high schoolstudents. Journal of the American Medical Association, 269(11), 1391-95.
Finn, J.D. (1993). School engagement and students at risk. Washington, DC: NationalCenter for Education Statistics.
61
BEST COPY AVAILABLE

Harter, S. (1990). Self and identity development. In S.S. Feldman & Q.R. Elliott (Eds.), Atthe threshold: The developing adolescent (pp. 352-387). Cambridge: Harvard University
Press.
Hirschi, T. (1969). Causes of delinquency. Berkeley: University of California Press.
Johnson, L.D., O'Malley, P.M., & Bachman, J.G. (1984). Highlights from drugs andAmerican high school students, 1975-1983. Rockville, MD: National Institute on DrugAbuse, Public Health Service, U.S. Department of Health and Human Services.
Juster, F.T., & Stafford, F.P. (1985). Time, goods, and well-being. Ann Arbor: Institute forSocial Research, University of Michigan.,
Lamborn, S.D., Brown, B.B., Mounts, N.S., & Steinberg, L. (1992). Putting school inperspective: The influence of family, peers, extracurricular participation, and part-time work
on academic engagement. In F.M. Neuman (Ed.), Student engagement and achievement inAmerican secondary schools, New York: Teachers College Press.
Medrich, E.A. (with the assistance of C. Marzke). (1991). Young adolescents anddiscretionary time use: The nature of life outside school. Unpublished paper commissioned bythe Carnegie Council on Adolescent Development for its Task Force on Youth Development
and Community Programs.
Medrich, E.A., Roizen, J., Rubin, V., & Buckley, S. (1982). The serious business ofgrowing up: A study of children's lives outside of school. Berkeley: University of California
Press.
Muller, C. (1993). Parent involvement and academic achievement: An analysis of familyresources available to the child. In B. Schneider & J.S. Coleman (Eds.), Parents, theirchildren, and schools (pp. 77-113). Boulder, CO: Westview Press.
Muller, C., & Kerbow, D. (1993). Parent involvement in the home, school, and community.In B. Schneider & J.S. Coleman (Eds.), Parents, their children, and schools. Boulder, CO:Westview Press.
Nightingale, E.O., & Wolverton, L. (1993). Adolescent rolelessness in modern society. InR. Takanishi (Ed.), Adolescence in the 1990s: Risk and opportunity (pp. 14-28). New York:Teachers College Press, Teachers College, Columbia University.
Nord, C.W., & Zill, N. (1994 American households in demographic perspective. Paperprepared for the Council on Families in America, Institute of American Values, New York.
O'Brien, E., & Rollefson, M. (1995). Extracurricular participation and student engagement(NCES 95-741). Washington, DC: U.S. Department of Education, Office of EducationalResearch and Improvement, National Center for Education Statistics.
62r,

Robinson, J.P. (1977). How Americans use time. New York: Praeger.
Robinson, J.P. (1991). It's 10 o'clock. Do you know where- your teenager is? American
Demographics (October), 8.
Rutter, M., & Giller, H. (1983). Juvenile delinquency: Trends and perspectives. New York:
Guilford Press.
Timmer, S.G., Eccles, J., & O'Brien, K. (1985). How children use tune. In F.T. Juster &F.P. Stafford (Eds.), Time, goods, and well-being (pp. 353-382). Ann Arbor: Institute forSocial Research, The University of Michigan.
U.S. Bureau of the Census. (1993). Statistical abstract of the United States: 1993 (113th
ed.). Washington, DC: GPO.
U.S. Department of Education, Office of Educational Research and Improvement, NationalCenter for Education Statistics. (1993a). America's high school sophomores: A ten yearcomparison. Washington, DC: GPO.
U.S. Department of Education, Office of Educational Research and Improvement, NationalCenter for Education Statistics. (1993b). Youth indicators 1993. Washington, DC: GPO.
U.S. Department of Education, Office of Educational Research and Improvement, NationalCenter for Education Statistics. (1994). Reading literacy in the United States. Technicalreport. Washington, DC: GPO.
U.S. Department of Education, Office of Educational Research and Improvement, NationalCenter for Education Statistics. (1995a). High school students ten years after "A Nation atRisk." Findings from The Condition of Education 1994 (No. 1) (NCES 95-764). Washington,
DC: GPO.
U.S. Department of Education, Office of Educational Research and Improvement, NationalCenter for Education Statistics. (1995b). Trends among high school seniors, 1972-1992.(NCES 95-380). Washington, DC: GPO.
U.S. House of Representatives Select Committee on Children Youth and Families. (1989).U.S. children and their families: Current conditions and recent trends, 1989 (third edition).Washington, DC: GPO.
Willard, J.C., & Schoenborn, C.A. (1995). Relationship between cigarette smoking andother unhealthy behaviors among our nation's youth: United States, 1992. Advance Datafrom Vital and Health Statistics (No. 263). Hyattsville, MD: National Center for Health
Statistics.
Zill, N., & Nord, C.W. (1994). Running in place: How American families are faring in achanging economy and an individualistic society. Washington, DC: Child Trends.
63 7 i

Zill, N., & Robinson, Jr. (1995). The Generation X difference. American Demographics,
17(4), 24-33.
64

APPENDIX A: DATA SOURCES AND ANALYSIS METHODS
Monitoring the Future (MTF)
Monitoring the Future is a national survey of high school seniors conducted by the
Institute of Survey Research at the University of Michigan. It is designed to describe and
explain changes in many iniportari values, behaviors, and lifestyle orientations of American
youth. It also gathers extensive information on the prevalence and incidence of illicit drug
use among high school seniors. The survey questionnaires are self-administered and are
completed anonymously by participating students in their schools. MTF was first fielded in
1975 and has been conducted annually since that time. The sample size has varied from year
to year, but has generally been over 15,000 seniors. Published volumes that provide basic
tabulations of the data collected are released annually, with a lag of several years after the
time of data collection.
MTF was chosen for this project because it can be used to gain a sense of trends in
high school seniors' use of time over the last 15 to 20 years. Although seniors are a select
group of all adolescents, tracking changes in their reported time use over the past two
decades provides clues as to how the lives of adolescents have changed. Much of the
available information can be tracked from 1976 to 1992, although some items are available
only since the mid-eighties. From the published volumes, trends in reported time use can be
tracked for all seniors and separately by sex, race, four-year college plans, and illicit drug
use.
Longitudinal Study of American Youth (LSAY)
The LSAY is a national longitudinal panel study of students in public middle and high
schools, sponsored by the National Science Foundation. The purpose of the study was to
measure students' evolving attitudes toward science and mathematics as fields of study in
school and as future career fields. The base year questionnaires for the LSAY were
administered in 1987 when Cohort 1 was in 10th grade and Cohort 2 was in 7th grade. In
65

the base year, 2,800 'Completed questionnaires were obtained from 10th graders in Cohort 1
and 3,100 questionnaires from 7th graders in Cohort 2. Each cohort was subsequently
surveyed in the 1988, 1989, 1990, and 1991 school years. Data from student questionnaires
are supplemented by data from parent, math and science teacher, and school principal
questionnaires. The majority of data pertinent to students' use of time comes from students
themselves.
A notable limitation of the LSAY data set is that minority racial and ethnic groups
were not oversampled for this study. As a result, data identifying the race or ethnicity of
students are not made available on the public use file in an effort to limit the misuse of this
information. While permission w use these data was obtained from the study director,
reliable estimates of students' time use based upon their race or ethnicity cannot be generated
from this data set. Nevertheless, other indicators of students' socioeconomic status are
readily available, including parents' educational attainment and a composite variable
measuring the soc o nonalc status of students' families.
Measures used from the LSAY
The LSAY data were primarily used to examine the amount of time adolescents spend
on homework and working at a job for pay, as well as the relationship between these
activities and students' characteristics, engaging in risky behaviors, and post-high school
employment and school enrollment. The data measuring time doing homework and working
for pay were gathered with the following student questionnaire item:
In a typical week, how many hours do you spend...
a. Doing homework?b. Watching tv?r. Listening to music?d. Working for pay?
Doing household chores?f. Dating?
The answer to this question is open-ended, that is, students provided their answers to this
question without the use of precoded response categories. Responses were categorized for
the analyses according to what was appropriate given the overall response distribution, and
66

for ease in substantive interpretation. This item was asked of both Cohort 1 and Cohort 2
students in the fall of 1987 and in the fall of 1989. Thus, the data presented in this report
are based upon information gathered from the two cohorts of students who together form a
"synthetic" cohort: 7th graders in 1987 and 9th graders in 1989 from Cohort 1; lOth graders
in 1987 and 12th graders in 1989 from Cohort 2.
While it would,be ideal to follow the same cohort over time from 7th to 12th grade,
the LSAY data do not allow for such an analysis. Student reports of time spent working for
pay were obtained only in the 1987 and 4989 survey waves for both Cohorts 1 and 2.
Information on homework time was obtained from students in Cohort 2 in the 10th and 11th
grades; however, the question wording and response categories are quite different from that
shown above, making over-time comparisons within Cohort 2 difficult.
Several of the variables used to measure LSAY students' personal and family
characteristics warrant some explanation as well. For the most part, throughout the analyses
the grade level of the student characteristic variables matchei the grade level of the variables
indicating time spent doing homework or work:mg for pay. Students' program at school is
classified into the categorits of "general," "academic," and "other." In this classification,
"gademic" refers to programs geared toward preparing students for college. "Other"
programs are a mix of programs labeled as being vocatibnal, technical, trade, or
business/office related. Students' grades are thosk for all subjects combined for the previous
year. In survey waves after 1987, students were asked to provide their grades separately for
their English, math, science, and social studies classes. In these cases, an unweighted
average of these grades was taken to represent the students' overall grades for the previous
year. The region variable indicates the U.S. Census regions in which the students' schools
were located; the urbanicity variable is also an indicator of the locations of students'
schools.
The variable indicating students' socioeconomic status is a composite variable on the
LSAY public data file that utilizes the most recent information on parents' highest education
and parents' highest occupational status, as well as an index of 1988 household possessions
67

(i.e., daily newspaper, specific place to do homework, typewriter, own room, weekly news
magazine). Parents' educational attainment indicates the higher level of education attained
by either the mother or father. It was obtained from the most recent report by the parents
themselves; however, if the self-report was not available, spouses' or students' reports were
utilized. The number of parents in the students' households was derived from parent
reports of their current marital status.
The parent involvement variable is based on data obtained from the parent
questionnaires administered during the same school year as the student questionnaires. It is
an indicator that sums the number of school-related activities or communications that the
parent respondent or spouse was reported to have been involved in during the current school
year. This indicator consists of three items: visiting the school to talk with a teacher or
principal, doing volunteer work in the school, and attending a school event such as a sports
event or concert. Parents participating in all three activities were coded "3" to indicate high
parental involvement, and parents participating in none of these activities were coded "0" to
indicate low parental involvement.
After the Cohort 1 students left high school (June 1990 for most), followup interviews
were administered by telephone. These telephone interviews yielded the information
regarding the student's postsecondarY enrollment status and employment status in 1991,
one year after most graduated from high school. For some of the nonrespondents, -the
employment and enrollment status information was obtained from parents or relatives of the
student.
The results of the crosstabulation analyses presented are based on data weighted with
the students' relative weights, which sum to the total sample size. Thus, we have adjusted
for each students' probability of being included in the LSAY study. Also, for each graph
and table presented, the differences observed are statistically significant at the .05 level,
unless othei wise noted.
68
C
National Educational Longitudinal Study (NELS:88)
The NELS is a national longitudinal panel study of students in eighth grade in 1988,
sponsored by National Center for Education Statistics of the U.S. Department of Education.
The purpose of the NELS is to eXamine trends among secondary school students and
students' transition into postsecondary school and labor force employment. In 1988, the
NELS study first administered questionnaires to a nationwide sample of 24,599 eighth grade
students attending public and private schools. Two followup questionnaires have been
administered to date, when the students were in 10th and 12th grades (or had dropped out of
school). For the first followup survey in 1990, students were subsampled according to the
number of base year students in their school. For the second followup in 1992, all first
followup sample members were eligible. There were about 20,000 completed student
questionnaires and 900 dropout questionnaires obtained in 1990; and 21,000 completed
student questionnaires and 2,000 dropout questionnaires in 1992.
In addition to the student and dropout questionnaire data, information is also available
from parent questionnaires, standardized achievement tests administered to the students,
teacher ratings on the students' academic performance and behavior, and school administrator
reports on school and community characteristics. The data in this report pertaining to
adolescents' use of time was derived from student self-reports.
Measures used from the NELS:88
The NELS:88 data were used for analyses related to students' participation in school-
sponored extracurricular activities in the 10th grade. The student questionnaire item used to
gather data regarding the amount of time spent in extracurricular activities is
In a typical week, how much total time do you spend on all SCHOOL-SPONSORED extracurricular activities?
Students recorded their answers into precoded response categories ranging from "none' to
"20 hours or more."
69

The variables measuring participation in specific types of extracurricular activities
during the 10th grade school year were constructed as follows. The variable measuring
participatidn in varsity sports is a composite of several variables in the NELS:88 that
measure participation in individual sports (e.g., baseball/softball, basketball, football,
soccer), and whether such participation was at a junior varsity, varsity, or intramural level.
If a student indicated participation in any one of the sports listed, at either the junior varsity
or varsity level, then he ot<she was coded as participating in a varsity sport. The variable
measuring participation in a ihusical group or a school play or mutiail during the 10th
grade school year was constructed by combining information from two miables. One
indicated whether or not the student participated in a "band, orchestra, chorus, choir, or
other music group" and the other indicated whether the student participated in a "school play
or musical." The data for the variablindicating participation in a vocational club was
gathered by asking if the student particited in "FTA, FHA, FFA, or other vocation
education or professional club" during the s hool year.
The variable measuring the total number 6 different school-sponsored
extracurricular activities in which 10th grade studen participated is a sum of involvement
in the following activities:
a a varsity sport;an intramural sport;cheerleading or drill team;band, orchestra, chorus, choir, or another music group, or a school play ormusical;an academic club;school yearbook, newspaper, or literary magazine;student government;a vocational club;a service club; ora hobby club.
This variable has the potential to range from 0 to 11. However, only 4% of 10th graders
reported participating in more than 4 types of activities.
There are several variables measuring students' personal and family characteristics
that are used in the bivariate analyses to describe the types of students who spend time with
their parents and who spend time participating in school-sponsored extracurricular activities.
70

For the bivariate analyses, these student characteristic variables are measured either at the
base year or the year at which the time use variable is measured. Many of these variables
are also used as controls in the multivariate logistic regression analyses of extracurricular
activities. For the most part, the control variables measured at the 8th grade relate to the
students' personal or family characteristics. Those measured at the 10th grade are primarily
related to the students' schools, and are used to control for the types Of schools that may be
more likely to offer or encourage participation in school-sponsored extracurricular activities.
The derivation and consiruction of these student characteristic variables are explained below.
Variables measuring students' personal and family characteristics include the type of
grades received in 8th grade. This is an indicator of the quartiles n which the student's
grades in math, science, English, and social studies fell. This composite variable is found on
the public data base and was constructed using an unweighted average of grades received in
each subject. The family's socioeconomic status quartile is a composite variable on the
NELS:88 data base utilizing base year information from the parelit or student questionnaires
pertaining to parents' education level, parents' occupations, and family incomes. The family
income variable was derived from parent reports in the base year and in 1992 (student's
senior year). Students' reports provided data regarding the famiily's receipt of welfare over
the past 2 years; this was measured in 10th and 12th grade; it ),vas unavailable in the 8th
grade survey wave. The variable measuring parents' educatilin pertains to the higher level
of either parent and was taken from the most recent parent reliort. Family structure in the
8th and 10th grades is based upon student reports of the relationships of persons living in
their household; the 12th grade variable is based upon parent:report.s.
The student's race and ethnicity is based on a student self-identification and
combines information about race and Hispanic origin. Students classified as white, black, or
Asian are those of the indicated race who are not Hispanic. Hispanic students can be of any
race. The variable measuring whether the student comes from a language minority family
is a base year indicator of whether or not the student comes from a home in which a
language other than English is typically spoken. This is a composite variable on the
NELS:88 data base and is derived from either student or teacher reports.
71
a

Variables measuring students' school-related characteristics include their school
program. "Academic" programs refer to those geared toward college preparation and
"other" programs largely include vocational and technical programs. The type of school
control and the percent minority variables were taken from school administrator reports.
The region and urbanicity variables indicate the U.S. Census region and the urbanicity of
the location of the student's school.
The measure of parent involvement in school is a count of school-rela4d activities 6r
communications in which the student's parents were involved. The 10th grade variable is
based upon an item asking students whether their parents did any of the following things
during the first half of their 10th grade school year: "attended a school meeting," "phone or
speak to your teacher or counselor," "attend a school event in which you participated," or
"act as a volunteer at your school." The parent involvement measure ranges from 0 (low
involvement) to 4 (high involvement). For the logistic regression analyses of extracurricular
activities, this variable was dummy coded into variables indicating high (3 or 4 activities),
medium ( 1 or 2 activities), and low (0 activities) involvement. Possibly because this is a
student report, there was a relatively large percentage of missing values on this variable
(17%). To avoid dropping this substantial proportion of cases from the multivariate
analyses, a dummy variable indicating whether or not data were missing on this variable was
included in the logistic regression models.
The 12th grade variable measuring parent involvement that is used in bivariate
analyses is somewhat different than the 10th grade variable because the same parent
involvement questions were not asked in the senior year questionnaire. Instead, the 12th
grade indicator of parent involvement is based upon parent reports of whether they contacted
the school about their teen's school performance or post-high school plans, whether they
helped with school fundraising or did volunteer work, or attended school activities with their
tNnagers. The construction of this variable is similar to that of the 10th grade variable--it is
a count of the number of these activities in which parents reported participating. Thus it
ranges from 0 (indicating low involvement) to 3 (indicating 1-ii^h involvement).
7 2

The variables indicating participation in risky behaviors that are used in the NELS:88
data analyses include measurements at the 10th and 12th grade. A student classified as a
binge drinker reported in 1990 or 1992 that he or she had had 5 or more drinks in a row in
the past two weeks. A drink is defmed for respondents as "a glass of wine, a bottle of beer,
a shot glass of liquor, or a mixed drink." Students classified as "drug users" reported in
1990 or 1992 that they had used marijuana or cocaine in the past 12 months. Students
classified as "smokers" reported in 1990 or 1992 that they smoked at least one cigarette
daily. Those classified as dropping out of school did so after being interviewed in 1990 as
a student. The suspension from school variable identifies students who were suspended
from school in the current school year. Students classified as having been arrested reported
in 1990 or 1992 that they had been arrested that year. Students classified as currently
having a child or expecting a child reported in either 1990 or 1992 that this was their
situation.
The analyses presented in this report using the NELS:88 data were conducted using
the panel of students responding to all three waves of the survey. The number of students
who responded to all three waves is 16,489. This was done so that over-time analyses of
time use and analyses predicting outcomes over time were based upon the same set of
students at each grade level. A weight was available in the data set for this panel of
students, so that the analyses based upon the NELS:88 are weighted according to students'
relative probability of being included in the smdy. Unfortunately, such a weight based on
the panel of consistent respondents was not available on the LSAY data set, so that it was not
feasible to also restrict the LSAY analyses to students participating to all waves of the survey
and at the same time adjust the data to account for students' selection probabilities. Thus,
only the latter was done, and respondents at each wave were used in the LSAY analyses.
730 t.

APPENDIX B
Ecoloecal Systems Theory
The ecological systems theory of youth development posits that a young person's
development is the result of a complex interplay between the youth's own natural endowment
and a variety of social systems and environmental factors that move from immediate
influences such as the home to more distal influences such as the community
(Bronfenbrenner, 1979, 1986). The theory recognizes that youth are influenced not only by
the direct effect of personal interactions with others, but also by the interaction that the
others have with each other. The teenager benefits, for example, if a parent has strong
connections to his or her school and teachers. Even systems_ and settings that do not directly
involve the youth may affect his.or her well-being. An example is the parents' workplaces,
which can affect the health and well-being of the parents, and through them, that of the
adolescent. Also, the community's wealth and political organization help to determine the
types of health and welfare services that are available to the family. The customs, values.
and laws of society influence all the different layers of interaction. In general, however.
those factors that are closest to the child will have the greatest influence on him or her.3
The same complex set of influences that help to shape human development also shape
and constrain how adolescents spend their time (Medrich et al., 1982). Laws and school
regulations dictate the hours that students are supposed to spend in school. Characteristics of
the family and community resources shape the types of activities that youths have available to
them. Youths living in low-income urban and rural areas, for example, often have fewer
community programs available to them and their parents lack the financial resources to pay
for privately run programs (Burt, Resnick, & Matheson, 1992). Youths in such areas may
be more likely to report "hanging out" and other forms of non-productive time use than
youth from wealthier settings.
74

Social Control Theory
Although many theories of delinquency attempt to understand why people deviate
from conventional behavior, social control theory attempts to explain why people adhere to
conventional behavior. Underlying social control theory is the assumption that without
restraining forces or with only weak restraining forces most people would engage in some
forms of behavior proscribed or deemed inappropriate by society. The restraining forces that
keep most people from deviating are attachment (or a bond) to conventional society usually
through attachment to one or more persons, such as parents, or to an institution, such as a
school, commitment to conventional goals, involvement in conventional activities, and belief
in a conventional value system (Hirschi, 1969).
Attachment implies that persons care about the opinions and expectations of those to
whom they are.attached. They strive to meet their expectations and do not behave in ways
that would disappoint them. Underlying commitment is the notion that persons care about the
consequences of their actions. They are sufficiently invested in the goals of society (such as
obtaining an education or having a reputation for honesty) that they do not want to risk
losing what they have already acquired. The restraining influence of commitment resides not
only in the fear of loing what has already been acquired but also what may yet be acquired.
Thus, aspiration., and the expectation that those aspirations can be attained are important if
commitment is to be an effective restraining force. Hirschi (1969) initially assumed that
involvement in conventional activities meant that a pecson did not have the time to be
involved in non-conventional ones. His subsequent work and that-of others found that this
assumption may be too simple. however (Rutter and Gil ler, 1983). Social control theory
does not delve into how belief in conventional values comes into being. But it posits that
when persons do not believe in the generally accepted rules of society, they will be more
susceptible to committing delinquent acts. Some have suggested that highly stressed families
and sociall!. .lisorganized communities may do a poor job of instilling and supporting
cooventional beliefs (Elliott et al, 1985). Even among prison inmates, however, surveys
have found that a majority of people see the need for adherence to rules (Rutter and Gil ler,
1983).
75

LIST OF FIGURES
Figure 1. Frequency with which 10th grade students engage in various leisure-timeactivities, 1990
Figure 2. Percentage of 12th grade students reporting engaging in various leisure-timeactivities almost every day and at least once a week, 1992
Figure 3. Hours spent pdr week on homework and work for pay in a typical week, 7ththrough 12th grade students, 1987-1989
Figure 4. Percentage of 10th grade students participating in extracurricular activities, bynumber of hours per week and number of different activities in year, 1990
Figure 5. Percentage of 10th grade students participating in specific types ofextracurricular activities, 1990
Figure 6. Participation in extracurricular activities by 12th grade students, 1992
Figure 7. Frequency with which 10th grade students take part in lessons, classes, andgroup activities, 1990
Figure 8. Participation in organized nonschool activities by 12th grade students, 1992
Figure 9. Amount of time per week spent on homework by 10th grade students, 1980 and1990
Figure 10. Percentage of 12th grade students spending significant amounts of time watchingtelevision, working, doing homework, and reading,,1976 and 1992
Figure 11. Percentage of 12th grade students reporting engaging in selected activities"almost every day," 1976 and 1992
Figure 12. Percentage of 12th grade students reporting engaging in selected activities "atleast once a week," 1976 and 1992
Figure 13. Percentage of 10th grade students participating in selected school-sponsoredextracurricular activities, 1980 and 1990
Figure 14. Relationship of family characteristics to time 10th grade students spend onhomework, 1987
Figure 15. Relationship of school and other demographic characteristics to time 10th gradestudents spend on homework, 1987
Figure 16. Relationship of farbily characteristics to time 10th grade students spend inextracurricular activities, 1990
76S4
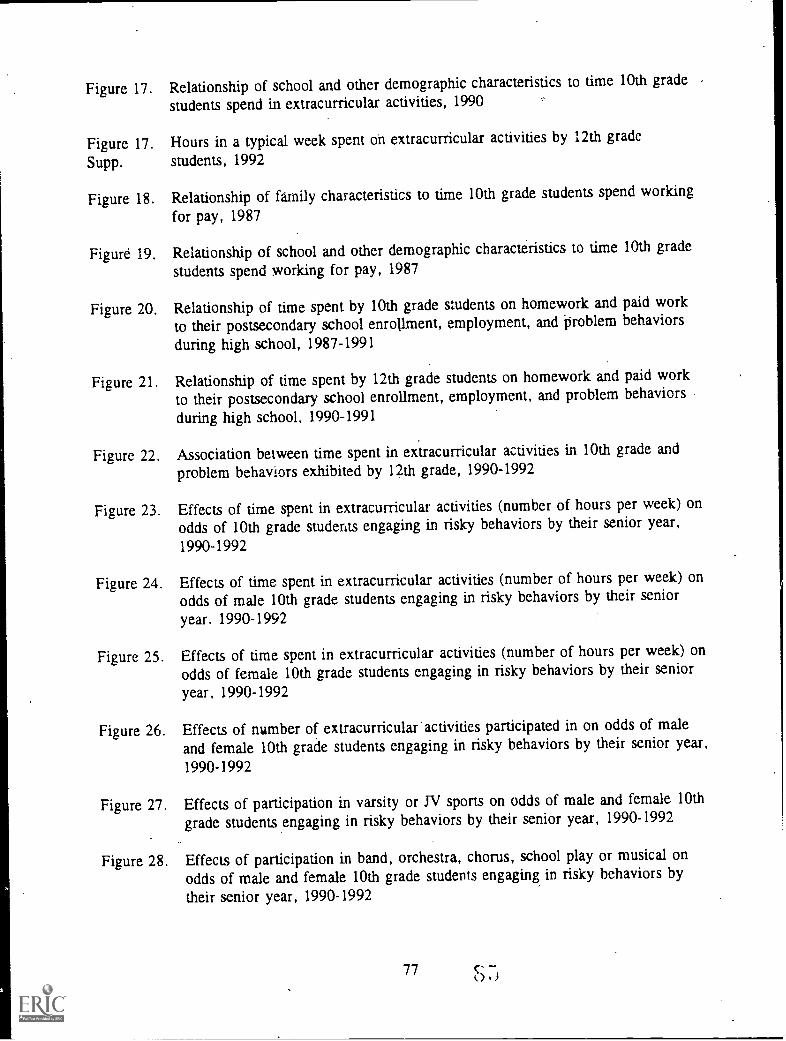
Figure 17. Relationship of school and other demographic characteristics to time 10th grade
students spend in extracurricular activities, 1990
Figure 17. Hours in a typical week spent on extracurricular activities by 12th grade
Supp. students, 1992
Figure 18. Relationship of family characteristics to time 10th grade students spend working
for pay, 1987
Figure 19. Relationship of school and other demographic characteristics to time 10th grade
students spend working for pay, 1987
Figure 20. Relationship of time spent by 10th grade students on homework and paid work
to their postsecondary school enrollment, employment, and problem behaviorsduring high school, 1987-1991
Figure 21. Relationship of time spent by 12th grade students on homework and paid work
to their postsecondary school enrollment, employment, and problem behaviors
during high school. 1990-1991
Figure 22. Association between time spent in extracurricular activities in 10th grade andproblem behaviors exhibited by 12th grade, 1990-1992
Figure 23. Effects of time spent in extracurricular activities (number of hours per week) onodds of 10th grade students engaging in risky behaviors by their senior year,
1990-1992
Figure 24. Effects of time spent in extracurricular activities (number of hours per week) onodds of male 10th grade students engaging in risky behaviors by their senior
year, 1990-1992
Figure 25. Effects of time spent in extracurricular activities (number of hours per week) onodds of female 10th grade students engaging in risky behaviors by their senior
year, 1990-1992
Figure 26. Effects of number of extracurricular activities participated in on odds of maleand female 10th grade students engaging in risky behaviors by their senior year,
1990-1992
Figure 27. Effects of participation in varsity or JV sports on odds of male and female 10thgrade students engaging in risky behaviors by their senior year, 1990-1992
Figure 28. Effects of participation in band, orchestra, chorus, school play or musical onodds of male and female 10th grade students engaging in risky behaviors by
their senior year, 1990-1992

LIST OF TABLES
Table 1.
Table 2.
Table 3.
Table 4.
Table 5.
Table 6.
Table 7.
Table 8.
School dropout, teen parenthood, and student arrest predicted from 10th gradeparticipation in extracurricular activities (number of hours per week) and otherstudent, family, and school characteristics, both sexes (multiple logistic
regression).
Smoking, drug use, and binge drinking predicted from 10th grade participationin extracurricular activities (number of hours per week) and other student,family, and school characteristics, both sexes (multiple logistic regression).
School dropout, teen parenthood, and student arrest predicted from 10th gradeparticipation in extracurricular activities (number of hours per week) and otherstudent, family, and school characteristics, males (multiple logistic regression).
Smoking, drug use, and binge drinking predicted from 10th grade participationin extracurricular activities (number of hours per week) and other student,family, and school characteristics, \males (multiple logistic regression).
School dropout, teen parenthood, and student arrest predicted from 10th gradeparticipation in extracurricular activities (number of hours per week) and otherstudent, family; and school characteristics, females (multiple logisticregression).
Smoking, drug use, and binge drinking predicted from 10th grade participationin extracurricular activities (number of hours per week) arid other student,family, and school characteristics, females (multiple logistic regression).
School dropout, teen parenthood, and student arrest predicted from 10th gradeparticipation in extracurricular activities and other student, family, and schoolcharacteristics, males (multiple logistic regression).
Smoking, drug use, and binge drinking predicted from 10th grade participationin extracurricular activities and other student, family, and school characteristics,males (multiple logistic regression).
Table 9. School dropout, teen parenthood, and student arrest predicted from 10th gradeparticipation in extracurricular activities and other student, family, and schoolcharacteristics, females (multiple logistic regression).
Table 10. Smoking, drug use, and binge drinking predicted from 10th grade participationin extracurricular activities and other student, family, and school characteristics,females (multiple logistic regression).
Table 11. School dropout, teen parenthood, and student arrest predicted from 10th gradeparticipation in varsity sports and other student, family, and schoolcharacteristics, males (multiple logistic regression).
78

Table 12. Smoking, drug use, and binge dtinking predicte4 from 10th grade participationin varsity sports and other student, family, and school charactetistics, males(multiple logistic regression).
Table 13.
Table 14.
Table 15.
Table 16.
School dropout, teen parenthood, and student arrest predicted from 10th gradeparticipation in-varsity sports and other student, family, and schoolcharacteristics, females (multiple logistic regression).
Smoking, drug use, and binge drinking predicted from 10th grade participationin varsity sports and. other student, family, and school characteristics, females
(multiple logistic regression).School dropout, teen parenthood, and student arrest predicted from 10th gradeparticipation in band, orchestrk, chorus, school play or musical and otherstudent, family, and school characteristics, males (multiple logistic regression).
Smoking, drug use, and binge drinking predicted from 10th grade participationin band, orchestra, chorus, school play or musical and other student, family,and school characteristics, males (multiple logistic regression).
Table 17. School dropout, teen parenthood, and student arrest predicted from 10th gradeparticipation in band, orchestra, chorus, school play or musical and otherstudent, family, and school characteristics, females (multiple logistic
regression).
Table 18. Smoking, drug use, and binge drinking predicted from 10th grade participationin band, orchstra, chorus, school play or musical and other student, family,and school characteristics, females (multiple logistic regression).
79_

Figure 1: Frequency with which 10th grade students engage in various leisure-time activities, 1990
How often per week:
0 Rarely or never D Lest than once a week 1-2 times per week "'Almost every day
Talking w/friendson the telephone
Visiting w/friendsat a local hangout
Talking or, doingthings with yourmother or father
Driving or ridingaround (alone orw/friends)
Playing ball orsports w/friends
Reading for pleasure
Working on hobbies,art, or crafts on own
Talking or doing. -things w/other adults
Using personalcomputers
9% 11%
47% 17%
25% 19% /%111111111
31% 22%
36% 23%
35% 24%
27% 32%
.111111M
Source: N. Zill, C.W. Nord, & L.S. Loomis. Analysis of data from the National EducationalLongitudinal Study of '1988, First Followup Survey 1990.

Figure 2: Percentage of 12th grade students reporting engaging in variousleisure-time activities almost every day and at least once a week, 1992
[1] almost every day Mat least once a week
Watch TV imminimummilim74% 95%
Get together w/friends 88%
Read books, magazines, j 47%or newspapers 79%
Sports/exercise I1 46%
72%
Work around house, 29%yard, garden, car, etc. 68%
Ride around 1 33%in car for fun 65%
-1611Play instrument/sing 29%6 40%
Shopping or 6acimi.window-shopping 38%
Art or craft work
Creative writing
25%
22%
Source: N. Zill, C.W. Nord, & L.S. Loomis. Analysis of data from Monitoring the Future, 1992.
%J.)

Figure 3: Hours spent per week on homework and work for pay in a typical week,
7th through 12th grade students, 1987-89
Homework
7th grade
9th grade
10th grade
12th grade
Number\ of hours:
0 Less than 7 la 7 or more II14 or more
30%8%
\\:\ , ",
9%35%
I 58%\%,q4*.
13%41%
1 69%
65%
I 62%\,""' ,
s,.. \ .",
Work for pay
14%38%
74%10th grade
12th grade
,
16%27%
\IN: 60%
Source: N. Zill, C.W. Nord, & L.S. Loomis. Analysis of data from the Longitudinal Survey ofAmerican Youth, Cohorts 1 and 2, 1987 and 1989.

Figure 4: Percentage of 10th grade students participating in extracurricular activities,by number of hours per week and number of different activities in year, 1990
Hours per week:
None
1-4 hours
5-19 hours-
20 hours or more
Number of activitiesin year:
None
One
Two
23%
20%
24%
Three or more 24%
35%
32%
40%
Source: N. Zi 11, C.W. Nord. & L.S. Loomis. Analysis of data from the National EducationalLongitudinal Study of 1988. First Followup Survey, 1990.

Figure 5: Percentage of 10th grade students participating in specific typesof extracurricular activities, 1990
Varsity or JV sports
Academic clubs
Band, orchestra,chorus, school play/musical
Intramural sports
Service clubs
Vocational clubs
Cheer leading,drill team
Yearbook, newspaper,literary magazine
Student government
Hobby clubs
14%
12%
9%
12%
9%
7%
7%
46%
hea
Source: N. Zill. C.W. Nord, & L.S. Loomis. Ana lytis of data from the National EducationalLongitudinal Study of 1988. First Followup Survey, 1990.

Figure 6: Participation in extracurricular activities by 12th grade students, 1992
Extent of participation:
[.] considerable or great Meyer for 2 or moreduring current year years
Athletic teams
Other clubs/activities I
Music/performing artsI 24%
Academic clubs
=, I 1 11%Student council
1;12%School newspaper/yrbk 8%
21%
1 36%
40%
46%
Source: N. 7.in, C.W. Nord. & L.S. Loomis. Analysis of data from Monitoring the Future, 1992
("'
55%

Figure 7: Frequency with which 10th grade students take part inlessons, classes, and group activities, 1990
How often per week:
0 Rarely or never 0Less than once a week al At least once a week
Attending religiousactivities
Attending youth groupsor recreational programs
Taking classes: musicart, language, dance
Taking sports lessonskarate, tennis, etc.
Volunteering orperformingcommunity services
53% 16%
63% 17%
74% 16.71111111111
79% I 14% 1111
Source: N. Zill, C.W. Nord, & L.S. Loomis. Analysis of data from the National EducationalLongitudinal Study of 1988, First Followup Survey 1990.
94

Figure 8: Participation in organized nonschool activities by 12th grade students, 1992
Percent ever participating 2 or more years:
Sports
Church groups
Scouting
Vocational clubs
Boys/Girls clubs 10%
19%
31%
46%
43%
Source: N. Zill, C.W. Nord, & L.S. Loomis. Analysis of data from Monitonng the Future, 1992.
n7,

Figure 9: Amount of time per week spent on homework by 10th grade students,1980 and 1990
5 or morehours:30%
Less than5 hours
None 1111111980 1990
S..ourt.-c N C Nom; & 1 S I Jai ti .
1.oludjn31 Sithj%, 19IF, 1-trs: 1.-1L.:AuF :1...n.r. 1-, 4-1 11,4' Yt ^ & ItçSThomore Cohort 100. time \ear Sume.
5 or morehours:33%

Figure 10: Percentage of 12th grade students spending significant amounts
of time watching television, working, doing homework, and reading, 1976 and 1992
0 1976 1211992
Percent watching 2or more hours of TV 69%
on average weekday
Percent working atpaid or unpaid job6 or more hrslwkduring school year
Percent spending5 or more hrslwkon. homework
Percent reading 6or more bookslyear(not assigned)
39%
46%46%
63%64%
Source: N. Zill, C.W. Nord, & L.S. Loomis. Analysis of data from Monitoring the Future, 1976, 1992.
n7

Figure 11: Percentage of 12th grade students reporting engagingin selected activities "almost every day," 1976 and 1992
Watch TV
Get together w/friends
n1976 1111992
Read books, magazines, 59%or newspapers 47%
Sports/exercise
Spend time alone
Ride aroundin car for fun
Work around house,yard, garden, car, etc.
Play instrument/sing
Art or craft work
Creative writing
44%46%
40%
33%33%
6%
12%
7%
14%
28%29%
41%
41%
Source; N. Zill. C.W. Nord. & L.S. Loomis. Analysis of data from Monitoring the Future, 1976. 1992.

Figure 12: Percentage of 12th grade students reporting engagingin selected activities "at least once a week," 1976 and 1992
E 1976 A 1992
Watch TV I
I 94%95%
Get together w/friends L 8888:
Sports/exercise68%
72%
Work around house, 1 78%yard garden, car, etc. 68%
Ride aroundin car for fun
Play instrument/sing
Parties
38%40%
Shopping or 1 39%window-shopping 38%
Attendreligious services
Art or. craft work
Creative writing
25%.25%
15%22%
65%65%
Source: N. Zill, C.W. Nord, & L.S. Loomis. Analysis of data from Monitoring the Future, 1976, 1992.
;

Figure 13: Percentage of 10th grade students participating in selected school-sponsoredextracurricular activities, 1980 and 1990
Athletics
Academic clubs
Band, orchestra,chorus
Vocational clubs
Cheer leading,drill team
Hobby clubs
0 1980 011990
Source: N. Zill, C W. Nord, & L.S. Loomis. Analysis of data from High School and Beyond,Sophomore Cohort, 1980, and the National Educational Longitudinal Study of 1988,First Followup Survey, 1990.
OG

I
I
A
a I II
is II
II
se
\ ,;,
\;S. *,\
\.;;;;;
SI
I At

Figure 15: Relationship of school and other demographic characteristicsto time 10th grade students spend on homework, 1987
Sex: Female
Male
School program: General
Academic
Other
Overall grades:Mostly A's/A's & B's
Mostly B's
Mostly B's & C's
Mostly C's or below
Region: Northeast
Midwest
South
West
Urbanicity: Urban
Suburban
Rural
Percent of students who spendEl 14 or more 07 or more
hours per week
31%
;. 8%
37%
34%
46%
55%
23%
13% 46%
\;6% 25%
36%
10%
10%
38%
39%
41%
1\\ 19%
\`. 39%
16%
37%
Source: N. Zill, C.W. Nord, & L.S. Loomis. Analysis of data from the Longitudinal Survey ofAmerican Youth, Cohort 1, 1987. 1
/
49%
47%
58%

Figure 16: Relationship of family characteristicsto time 10th grade students spend in extracurricular activities, 1990
SES quartile:
Total
1 (Low)
2
3
4 (High)
Parent education:< High school
Percent of students who spend5 or more DI. or more
hours per week
25%
14% 48%
60%
56%
27% 63%
-12% 44%
High school 1111111111 19% 1 54%
Some college
College graduate
MA/equivalent
PhD/MD/other
Family income:< $5,000
$5,000-9,999
$10,000-19,999
$20,000-34,999
$35,000-49,999
$50,000-74,999
$75,000+
Welfare receipt Yesin last 2 years: No
25% 60%
72%
70%
76%
71%
36%
' 11% 41%
12% 46%
24%
55%
58%
28% 64%
30% 68%
39%
48%
(continued)
61%
78%
Source: N. Zill, C.W. Nord, & L.S. Loomis. Analysis of data from the National EducationalLongitudinal Study of 1988, First Followup Survey, 1990.
4 fl

Figure 16: (continued) Relationship of family characteristicsto time 10th grade students spend in extracurricular activities, 1990
English spokenat home:
No
Yes
Percent of students who spend5 or more 01 or more
hours per week
51%
62%
Family structure:Mother & father
Mother & stepfather
Father & stepmother
65%28%
20% 55%
22% 54%
Mother only 19% 53%
Father only 15% 53%
Racelethnicity:
White non-Hispanic 27% 63%
Black non-Hispanic 55%
Hispanic 52%17%
Asian : 22% 57%
Parent involvement:0 (Low)
1
2
3
4 (High)
S`Ns
\\ 9% 40%
48%
25% 61%
80%
82%
Source: N. Zill, C.W. Nord, & L.S. Loomis. Analysis of data from the National Educational.Longitudinal Study of 1988, First Followup Survey, 1990.
C 4

27%
22%
59%
62%
33%
22%
13% 42%
18%
56%
52%
53%
26% 63%
73%
24% 60%
66%
Percent of students who spend5 or more D1 or more
hours per week
Figure 17: Relationship of school and other demographic characteristicsto time 10th grade students spend in extracurricular activities, 1990
Sex: Male
Female
School program: Academic
General
VOc/Tech
Grade quartile 1 (Low)in 8th grade:
2
3
4 (High)
School type: Public
Private-religious
Private-nonreligious
School minority %:75%-100%
37%
55%
.50%-74% 20% 54%
25%-49% 23% 60%
10% -24% 63%
28% 65%
Region: Northeast 24% 59%
Midwest 65%
South 22% 60%
West 57%
Urbanicity: Urban 22% 59%
Suburban
Rural
111111111111111111111
26%
62%
63%
77%
80%
Sourcc: N. Zill, C.W. Nord, & L.S. Loomis. Analysis of data from the National EducationalLongitudinal Study of 1988, First Followup Survey, 1990.
4 r,I t)

II I
. S
6 1111
. \\\WV4'",,t,\M' . ,
N -. ..,-:, ,, ,:< i .
.
\
\;\4k\ e .
;\ # . .
I
I
Vsw,-\\
-\.\'N,`.\\
\
I .
.
47%

a II S
. I.S S
I I I
I /
//
1111 \\
\\\ \\a \
';`
\
I
. e.

Figure 17 Supp. (continued): Hours in a typical week spent on extracurricular activitiesby 12th grade students, 1992
School type: Public
Private-Rel
Private-Nonrel
Region: Northeast
Northcentral
South
West
Percent of students who spend5 or more Ell or more
hours per week
35%
50% 57%
61%
33%
36%
67%
66%
67%
64%
69%
Source: N till. C W Nord, & L.S Loomis Analysis of data from the National EducationalLongitudinal Study of 1988, Second 1-ollowup Survey, 1992.

Figure 18: Relationship of family characteristicsto time 10th grade students spend working for pay, 1987
Total
SES quartile: Top
2nd
3rd
Bottom
Parent education:< High school
Percent of students who spend14 or more 07 or more
hours per week
\Ns;
40% 56%
52%
61%
53%
62%
59%
55%
64%
64%
Some college
High school 54% 64%
48% . 57%
College gi'aduate
Advanced degree
Parents in hh: One
Two
Parent involvement: 0 (Low)
1
2
3 (High)
11331111111
39%
57%
54%
50%
43%
60%
61%
57% 69%*
55%
55%
58%
65%
Source. N. Zill, C.W. Nord, & L.S. Loomis. Analysis of data from the Longitudinal Survey ofAmerican Youth, Cohort 1, 1987. r.

. a . e
I . II a 6 . :
0
' S
":
-
; ,
e N
.
,
\ s.;',
I
51%
46%
35%
57%
SO%
40%
\
41%
52%

1 .5 II SS.SS. f
SIP
II
SI
GOO
'
. 11' S
5
,
s S.
I
mirk,
MN NWIn IV
War,,MVP
MEV,
MP,
lag
I

Figure 21. Relationship of time spent by 12th grade students on homeWork and paid work to theirpostsecondary school enrollment, employment, and problem behaviors during high school, 1990-1991
High hm/High work hrs 0High hm/Low work hrs
Low hm/High work hrs RLow hm/Low work hrs
Enrollment status in 1991:
Full time student
Part time student
Not enrolled
Employment status in 1991:
Full time
Part time
Unemployed
Not in labor force
Problem behaviors duringhigh school:
Cut classes now and then
Smoked cigarettes dailyin 11th grade
I
N \,..\NN.k:N SN'Is%N. NN\ \'N'N'N.\\NNN: `:NN"
16%
26%
,
I
50%
69%
Source: N. Zill, C.W. Nord, 84. L.S. Loomis. Analysis of data from the Longitudinal Survey ofAmerican Youth, Cohort 1, 1990 and 1991.
1 1 es,

Figure 22: Associafion between time spent in extracurricular activities in 10th gradeand problem behaviors exhibited by 12th grade, 1990-1992
Hours per week spent in extracurricular activities:
None 1-4 5-19 III 20 or more
Problem behaviors:
Drop out
Suspended
Teen parent
Arrested
Smoker
Drug user
Binge drinker
9%3%
.6%
12%
9%6%
4%7%
18%
25%19%
22%
34%
34%
Source: N. Zill, C.W. Nord, & L.S. Loomis. Analysis of data from the National EducationalLongitudinal Study of 1988, First and Second Foliot l u Surveys, 1990 and 1992.

Figure 23: Effects of time spent in extracurricular activities (number of hours per week)on odds of 10th grade students engaging in risky behaviors by their senior year, 1990-1992
School dropout
No time per week
1-4 hours
5-19 hours
20 or more hours
Teen parent
Ever arrested
Ever smoker
Used drugs
No time per week
1-4 hours
5-19 hours
20 or more hours
No time per week
1-4 hours
5-19 hours
20 or more hours
No time per week
1-4 hours
5-19 hours
20 or more hours
No time per week
1-4 hours
5-19 hours
20 or more hours
Binge drinkingNo time per week
1-4 hours
5-19 hours
20 or more hours
.45*1
.761
.79
(1.00)
1.57*
1 1.37*
.93 E
(1.00)
(1.00)
1.27*
.80*1
.98 {
(1.00)
11.63
1.42
1 1.35*
.92 E.84
.94 E
(1.00)
-J 1.04
(1.00)
1.02
1.49*
.287 1.00Odds Ratios
Reduced odds (Equal Log Scale)
* = reliably greater (or less than) 1.00
Source: N. Zill, C.W Nord, & L.S. Loomis. Analysis of data from the National EducationalLongitudinal Study of 1988, First and Second Followup Surveys, 1990 and 1992.
Increased odds
14
3.49
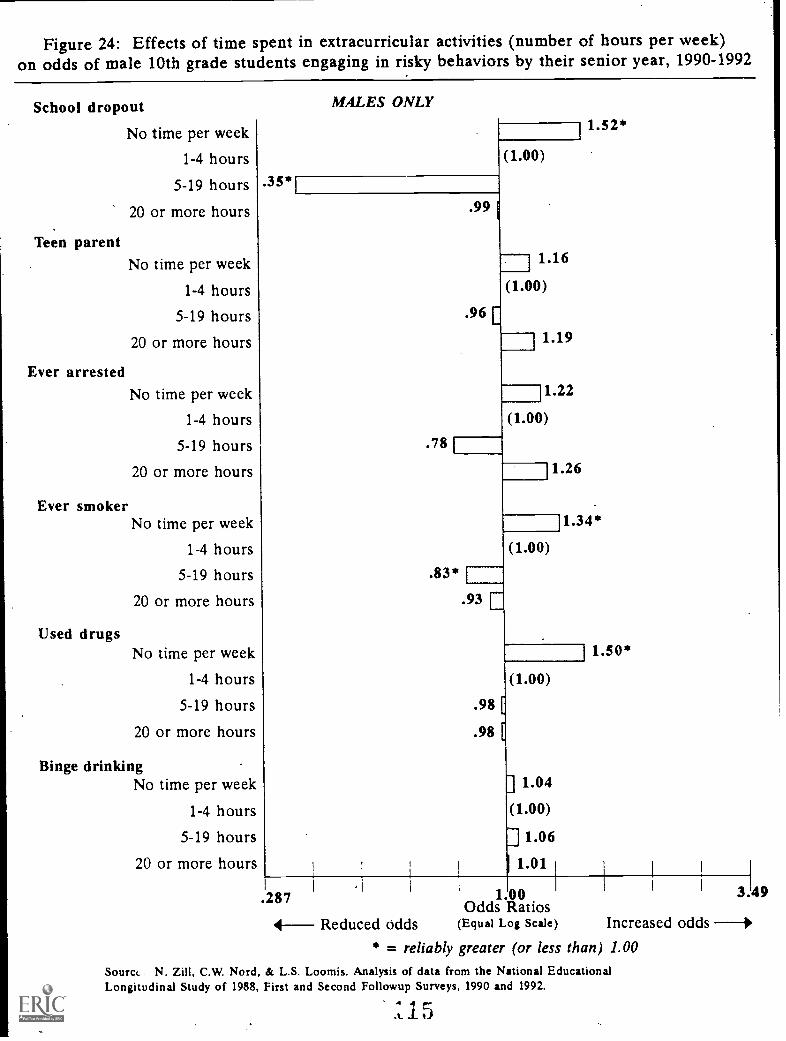
Figure 24: Effects of time spent in extracurricular activities (number of hours per week)on odds of male 10th grade students engaging in risky behaviors by their senior year, 1990-1992
School dropout
No time per week
1-4 hours
5-19 hours
20 or more hours
Teen parentNo time per week
1-4 hours
5-19 hours
20 or more hours
Ever arrestedNo time per week
1-4 hours
5-19 hours
20 or more hours
Ever smoker
Used drugs
No time per week
1-4 hours
5-19 hours
20 or more hours
No time per week
1-4 hours
5-19 hours
20 or more hours
Binge drinkingNo time per week
1-4 hours
5-19 hours
20 or more hours
.35*
MALES ONLY
(1.00)
.99
1.16
(1.00)
.96 E
1 1.22
(1.00)
.781
11.26
.83* 1
.93 E
.287
4 Reduced odds
(1.00)
1.52*
11.34*
(1.00)
.98 [
.98 {
1.50*
1.04
(1.00)
1.06
1.01
.11.00 349Odds Ratios
(Equal Log Scale) Increased odds
* = reliably greater (or less than) 1.00Sourcc N. Zill, C.W. Nord, & L.S. Loomis. Analysis of data from the National EducationalLongitudinal Study of 1988, First and Second Followup Surveys, 1990 and 1992.
1 J

Figure 25: Effects of time spent in extracurricular activities (number of hours per week)on odds of female 10th grade students engaging in risky behviors by their senior year, 1990-1992
School dropout
Teen parent
Ever arrested
Ever smoker
Used drugs
No time per week
1-4 hours
5-19 hours
20 or more hours
No time per week
1-4 hours
5-19 hours
20 or more hours
No time per week
1-4 hours
5-19 hours
20 or more hours
No time per week
1-4 hours
5-19 hours
20 or more hours
No time per week
1-4 hours
5-19 hours
20 or more hours
Binge drinkingNo time per week
1-4 hours
5-19 hours
20 or more hours
FEMALES ONLY
.42
.58*
.90 I
.82
.75* I
1.63*
(1.00)
1.50*
(1.00)
I 1.92
1.46
(1.00)
2.50
1.38*
(1.00)
1.00
(1.00)
.78 1
1.08
. 7
(1.00)
1.53*
.287
4-- Reduced odds
1 00Odds Ratios
(Equal Log Scale)
I
3.149
Increased odds 4* = reliably greater (or less than) 1.00
Source: N. Zill, C.W. Nord, & L.S. Loomis. Analysis of data from the National EducationalLongitudinal Study of 1988, First and Second Followup Surveys, 1990 and 1992.
4 "1- I. tj

Figure 26: Effects of number of extracurricular activities participated in on odds ofmale and female 10th grade students engaging in risky behaviors by their senior year, 1990-1992
SchOol dropoutNo activities
2 activities
3 or more activities
Teen parentNo activities
2 activities
3 or more activities
Ever arrestedNo activities
2 activities
3 or more activities
Males El Females
4---- Reduced odds
1.00Odds Ratios
(Equal Log Scale) Increased odds
* = reliably greater (or less than) 1.00
Source: N. Zill, C.W. Nord, & L.S. Loomis. Analysis of data from the National EducationalLongitudinal Study of 1988. First and Second Followup Surveys, 1990 and 1992.
3.149

Figure 26: (continued) Effects of number of extracurricular activities participated in on oddsof male and female 10th grade students engaging in risky behaviors by their senior year, 1990-1992
Ever smokerNo activities
2 activities
3 or more activities
Used drugsNo activities
2 activities
3 or more activities
Binge drinkingNo activities
2 activities
3 or more activities
D Males E Females
.99.94
1.00
.91 MI
.84
.86
.90
.86
.96
.93
1.06
1.09
1.64*
1.61*
1.30*1.62*
1.28*
1.18
.287
4---- Reduced odds
1.00Odds Ratios
(Equal Log Scale)
I 3. 49
Increased odds ---+* = reliably greater (or less than) 1.00
Source: N. Zill, C.W. Nord, & L.S. Loomis. Analysis of data from thc National EducationalLongitudinal Study of 1988, First and Second Followup Surveys, 1990 and 1992.
-41. 15

Figure 27: Effects of participation in varsity or JV sports on odds of male and female10th grade students engaging in risky behaviors by their senior year, 1990-1992
Dropout
Teen parent
Ever arrested
Ever smoker
Drug use
Binge drinking
.42*
Males Females
.65*
.92
1.05
.287 I
4-- Reduced odds
1.00Odds Ratios
(Equal Log Scale)
3.149
Increased odds ---
* = reliably greater (or less than) 1.00
Source: N. Zill, C.W. Nord, & L.S. Loomis. Analysis of data from the National EducationalLongitudinal Study of 1988, First and Second Followup Surveys, 1990 and 1992.
.4, 1

Figure 28: Effects of participation in band, orchestra, chorus, school play or musical on oddsof male and female 10th grade students engaging in risky behaviors by their senior year, 1990-1992
Dropout
Teen parent
Ever arrested
Ever smoker
Drug use
Binge drinking
0 Males Females
1.10
.63*
.78*
.287
4-- Reduced odds
I LobOdds-Ratios
(Equal Log Scale) Increased odds
3.49
* = reliably greater (or less than) 1.00
Source: N. Zill, C.W. Nord, & L.S. Loomis. Analysis of data from the National EducationalLongitudinal Study of 1988, First and Second Followup Surveys, 1990 and 1992.
9 n-1

Table 1. School Dropout, Teen Parenthood, and Student Arrest Predicted from 10th Grade Participation in
Extracurricular Activities (Number of Hours per Week) and Other Student, Family, and School Characteristics,
Both Sexes (Mulitple Logistic Regression)
School Dropout Teen Parent Ever Arrested
Regression Odds Regession Odds Regression Odds
Predictor Variables Coefficient Ratio Coefficient Ratio Coefficient Ratio
Student Participation.**No time per week .45 ** 1.57 .32 1.37 .24 * 1.27
5-19 hours per week -.81 ** .45 -.07 .93 -.24 + .79
20 or more hours per week -.28 .76 .49 1.63 .35 1.42
Sex .10 1.10 .75 ** 2.12 -1.44 ** .24
Student's Grades and School ProgramGrade quartile (8th grade) -.40 ** .67 -.33 ** .72 -.34 *4 .71
cteneral program .97 **
Vocationalltechnical program 1.23 **2.633.42
.68 **
.84 **1.98
2.33
.34 **
.39 **
1.40
1.48
Other program 1.05 *" 2.86 .75 ** 2.12 40 * 1.49
Family SESParent education -.15 ** .86 -.20 ** .82 -.14 * .87
SES quartile -.24 ** .79 -.19 ** .83 .15 * 1.16
Welfare receipt .34 + 1.41 .37 * 1.44 .15 1.16
Language minority -.24 + .79 -.13 .88 .05 1.05
Parent InvolvementLow -.33 ** .72 -.04 .97 .18 1.20
High -.15 .86 -.06 .94 -.22 + .81
Missing -.02 .98 .36 ** 1.43 -.06 .94
Family StructureMother only .32 ** 1.38 .13 1.14 .12 1.13
Mother-stepfather .73 ** 2.07 .86 ** 2.36 .48 ** 1.61
Father only 1.12 ** 3.07 .73 ** 2.07 .55 ** 1.73
Father-stepmother .70 ** 2.01 -.61 + .54 .26 1.29
Neither parent .90 ** 2.47 .65 ** 1.92 .07 1.07
Ethnic BackgroundBlack - 47 ** .63 .72 ** 2.05 -.24 .79
Hispanic .00 1.00 .14 1.15 -.38 * .68
Asian -.45 .64 .18 1.19 -.78 .76
Type of SchoolPrivate religious -.73 ** .48 -.82 ** .44 03 1.03
Other private 1 02 ** 2.78 -.38 .68 .43 1.54
High minority enrollment .52 ** 1.68 .27 * 1.31 .09 1.10
Medium minority enrollment .36 ** 1 43 .32 ** 1.38 .07 1.07
Intercept -1.65 ** -2.36 ** -1.73 **
Multiple R (Somer's D) 61 ** .56 ** 47 **
**p=<.01;*p=<.05;+p=<.10Source: N. Zill, C.W. Nord, & L.S. Loomis Analysis of data from the National Educational Longitudinal Stud, of 1988.
First and Second Followups, 1990 and 1992.0 4
I I.. LBEST COPY AVAILABLE

Jor
Table 2. Smoking, Drug Use, and Binge Drinking Predicted from 10th Grade Participation in _AtraculimcuAlts... a
(Number of Hours per Week) and Other Student, Family, and School Characteristics, Both Sexes (Multiple Logistic Regression)
Ever Smoker Used Drugs Binge Drinking
Regression Odds Regression Odds Regression Odds
Predictor Variables Coefficient Ratio Coefficient Ratio Coefficient Ratio
Student ParticipationNo time per week 30 ** 1.35 40 ** 1.49 04 1.04
5-19 hours per week -.23 ** 80 -.09 .92 .02 1.02
20 or more hours per week - 03 98 - 18 84 - 06 .94
Sex - 01 99 - 33 ** 72 - 61 ** 54
Student's Grades and School ProgramGrade quartile (8th grade) -.29 ** 75 -.27 ** 76 -.27 ** .77
General program .25 ** 1.29 .02 1.02 .23 ** 1.26
Vocational/technical program .34 ** 1.41 -.03 .97 .23 ** 1.26
Other program .40 ** 1 49 -.02 .98 34 ** 1.40
Family SESParent education - 06 + .95 -.01 .99 -.10 ** .91
SES quartile .07 * 1.07 15 ** 1.17 07 * 1.07
Welfare receipt .18 1.20 .30 + 1.34 -.11 .90
Language minority -.48 ** .62 -.37 ** .69 -.35 ** .71
Parent InvolvementLow .08 1 09 .01 1.01 .03 1.03
High - 26 ** .77 -.24 ** 79 -.08 .92
Missing -.29 ** 75 -.19 * .82 .07 1.07
Family StructureMother only .12 + 1.13 .42 ** 1.53 .06 1.07
Mother-stepfather .31 ** 1 37 .42 ** 1.52 .07 1.07
Father only .30 * 1.36 85 ** 2.34 .45 ** 1.57
Father-stepmother .52 ** I 68 46 ** 1.59 .12 1.13
Neither parent .54 ** 1 71 47 ** 1.60 08 1.08
Ethnic BackgroundBlack -1 47 ** .23 - 75 ** .47 -.70 ** .50
Hispanic - 10 91 .20 + 1 22 .20 * 1 22
Asian -.57 ** 57 -.50 ** .61 -.66 ** .52
Type of SchoolPrivate religious .24 ** 1.27 - 02 .98 18 * 1.20
Other private .46 * 1.59 34 4- 1.40 .32 + 1.37
High minority enrollment -.24 ** 78 -.0 .91 -.17 * .85
Medium minority enrollment .01 1.01 .21 ** 1.23 -.00 1.00
Interc, pt -.32 * -.75 ** .69 **
Multiple R (Somer's D) 36 ** .33 ** .30 **
**p-=<.01,*p=<.05,+p=<.10Source: N. Zill. C.W. Nord, & L.S. Loomis. Analysis of data from the National Educational Longitudinal Study of 1988.
First and Sccond Followups, 1990 and 1992

Table 3. School Dropout, Teen Parenthood, and Student Arrest Predicted from 10th Grade Participation in
Extracurricular Acthities (Number of Hours per Week) and Other Student, Family, and School Characteristics,
Males (Mulitple Logistic Regression)
School Dropout Teen Parent Ever Arrested
Regression Odds Regresiion Odds Regression Odds
Predictor Variables Coefficient Ratio Coefficient Ratio Coefficient Ratio
Student ParticipationNo time per week .42 ** 1.52 .15 1.16 .20 + 1.22
5-19 hours per week 1.06 ** .35 -.04 .96 -.24 + .78
20 or more hours per week -.01 .99 .18 1.19 .23 1.26
Student's Grades and School ProgramGrade quartile (8th grade) -.42 ** .65 -.28 ** .75 -.32 ** .72
General program 1.08 ** 2.93 .61 ** 1.84 .30 * 1.35
Vocauonalitechnical program 1 41 ** 4.09 .96 ** 2.62 .50 ** 1.65
Other program 1.13 ** 3.09 .94 *' 2.56 .37 + 1.45
Family SESParent education - 11 .90 -.16 + .85 -.18 ** .83
SES quartile -.19 * .82 -.17 + .85 .20 ** 1.22
Welfare receipt 42 1.52 .35 1.42 .07 1.07
Language minority - 48 * .62 -.24 .79 .23 1.26
Parent InvolvementLow -.25 + 78 -.06 .94 .33 * 1.39
High -.14 .87 .19 1.20 -.15 .87
Missing -.06 .94 .63 ** 1.88 .02 1.02
Family StructureMother only .47 ** 1.59 -.07 94 .25 + 1.29
Mother-stepfather .73 ** 2.08 .55 ** 1.74 .37 * 1.45
Father only 1.23 ** 3.41 .42 1.53 .38 1.46
Father-stepmother 82 ** 2.28 -.77 .46 .36 1.43
Neither parent .94 "* 2.56 .04 1.04 .20 1.22
Ethnic BackgroundBlack -.48 ** 62 .66 ** 1.93 -.18 .83
Hispanic 15 1 16 .21 1.23 -.50 * .61
Asian - 80 + 45 .57 1.77 -.50 .61
Type of SchoolPrivate religious -.99 ** .37 -.75 + .47 .15 1.16
Other private 1.71 ** 5.53 -.14 .87 .58 1.78
High minority enrollment .68 ** 1 97 .55 ** 1.73 .17 1.19
Medium minonty enrollment .48 ** 1.61 .42 " 1.52 .09 1.10
Intercept -1 98 ** -2 61 ** -1.86 **
Multiple R (Somer's D) 61 ** .50 ** .30 **
** p = <.0l..*p=< 05:+p=<.10Source. N. Zill. C.W. Nord.. & L.S. Loomis. Analysis of data from the National Educational Longitudinal Study of 1988.
First and Sccond Followups, 1990 and 1992.

Table 4. Smoking, Drug Use, and Binge Drinking Predicted from lath Grade Participation in Extracurricular Activities
(Number of Hours per Week) and Other Student, Family, and School Characteristics, Males (Multiple Logistic Regression)
Ever Smoker Used Drugs Binge Drinking
RegressionPredictor Variables Coefficient
OddsRatio
RegressionCoefficient
OddsRatio
RegressionCoefficient
OddsRatio
Student ParticipationNo time per week .30 ** 1.34 .41 ** 1.50 .03 1.04
5-19 hours per week -.19 * .83 -.02 .98 .06 1.06
20 or more hours per week -.08 .93 -.13 .88 .01 1.01
Student's Grades and School ProgramGrade quartile (8th grade) -.23 ** .79 -.31 * * .73 -.29 '''4' .75
General program .31 ** 1.37 .03 1.03 .12 + 1.13
Vocational/technical program .48 ** 1.62 .07 1.08 .14 1,15
Other program. .34 * 1.40 -.26 .77 .20 1.22
Family SESParent education -.08 + .92 -.07 .94 -.19 ** .83
SES quartile .09 * 1.10 22 ** 1.24 .10 * 1.11
Welfare receipt .51 * 1.67 .56 ** 1.75 .10 1.11
Language minority -.37 ** .69 -.47 ** .63 -.48 ** .62
Parent InvolvementLow .29 ** 1.33 .10 1.10 -.02 .98
High -.00 1.00 -.04 .96 .04 1.04
Missing -.07 .93 .18 + 1.20 .33 ** 1.39
Family StructureMother only .09 1.10 .38 ** 1.47 .01 1.01
Mother-stepfather .30 ** 1.35 .40 ** 1.49 .20 * 1.23
Father only .00 1.01 .51 ** 1.66 .39 * 1.48
Father-stepmother .60 ** 1.82 .25 1.28 .37 + 1.45
Neither parent .37 + 1.45 .55 * 1.73 .07 1.07
Ethnic BackgroundBlack -1.26 ** .28 -.61 ** .54 -.74 ** .48
Hispanic -.04 .96 .41 ** 1.50 .18 1.20
Asian -.62 ** .54 -.33 .72 -.67 ** .51
Type of SchoolPrivate re1igious .45 ** 1.57 .14 1.15 .13 1.14
Other private .54 * 1.72 .60 * 1.83 .30 1.35
High minority enrollment -.17 + .85 -.04 .96 -.06 .94
Medium minority enrollment .01 1.01 .15 1.16 -.03 .97
Intercept - 65 ** -.80 ** .91 **
Multiple R (Somer's D) .32 **
'1'sp=<.01:*p=<.0.5:+p=<.10Source: N. Zill, C.W. Nord, & L.S. Loomis. Analysis of data from the National Educational Longitudinal Study of 1988,
First and Second Followups, 1990 and 1992.
.29 ** .26 **

.
Table 5. School Dropout, Teen Parenthood, and Student Arrest Predicted from 10th Grade Participauon in
Extracurricular Activities (Number of Hours per Week) and Other Student, Family, and School Characteristics,
Females (Mulitple Logistic Regression)
School Dropout Teen Parent Ever Arrested
RegressionPredictor Variables Coefficient
OddsRatio
RegressionCoefficient
OddsRatio
RegressionCoefficient
OddsRatio
Student ParticipationNo time per week .49 ** 1.63 .41 ** 1.50 .38 + 1.46
5-19 hours per week -.55 ** .58 -.11 .`90 -.19 .82
20 or more hours per week -.86 .42 .65 1.92 , .92 2.50
Student's Grades and School ProgramGrade quartile (8th grade) -.38
General program .90
**
**
.69
2.46
-.36.73
**
to*
.70
2.07
-.42'.46
**
*
.661.58
Vocational/technical program 1.08 ** 2.96 .74 ** 2.10 -.16 .85
Other program 1.03 ** 2.79 .62 ** 1.86 .41 1.50
Family SESParent education -.19 ** .83 -.22 ** .81 -.01 .99
SES quartile -.29 ** .75 -.20 ** .82 -.01 .99
Welfare receipt .28 1.32 .33 1.39 .28 1.32
Language minority -.06 .94 -.06 .94 -.74 .48
Parent InvolvementLow -.38 ** .68 -.05 .96 -.23 .79
High -.15 .86 -.19 .83 -.45 + .64
Missing .02 1.02 .15 1.17 -.39 .68
Family StructureMother only .20 1.22 .27 * 1.31 -.31 .73
Mother-stepfather .73 ** 2.07 1.00 ** 2.72 .67 ** 1.95
Father only .90 ** 2.46 1.01 ** 2.75 1.25 ** 3.48
Father-stepmother .59 + 1.81 -.49 .62 -.25 .78
Neither parent .89 ** 2.43 1.02 ** 2.78 -.60 .55
Ethnic BackgroundBlack -.48 ** .62 .73 ** 2.08 -.49 .61
Hispanic -.09 .92 .10 1.11 .03 1.04
Asian -.16 .85 -.23 .80 .36 1.44
Type of SchoolPrivate religious -.54 + .58 -.86 ** .42 -.64 .53
Other private -.79 .45 -.69 .50 -1.06 .35
High minority enrollment .40 ** 1.49 .12 1.13 -.16 .85
Medium minority enrollment .26 + 1.30 .27 + 1.31 -.02 .98
Intercept -1.27 ** -1.48 ** -2.78 **
Multiple R (Somer's D) 62 ** .59 ** .35 "
Source: N. Zill, C.W. Nord, & L.S. Loomis. Analysis of data from the National Educational Longitudinal Study of 1988,
First and Second Followups, 1990 and 1992.
I
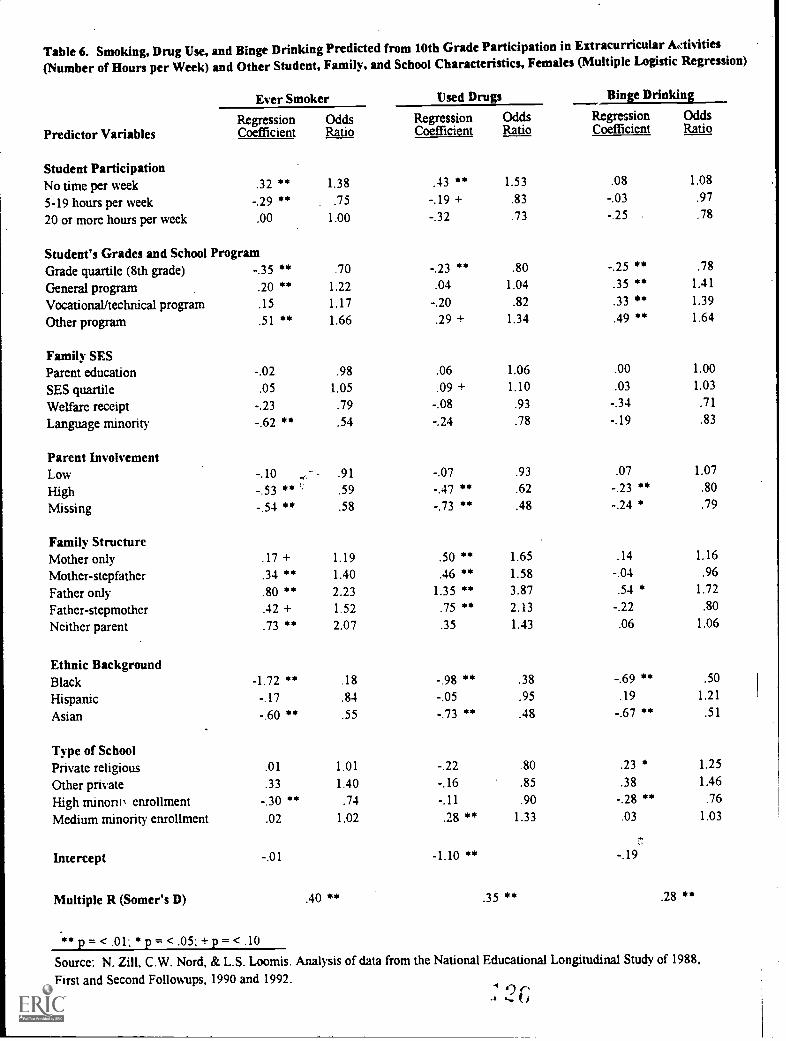
Table 6. Smoking, Drug Use, and Binge Drinking Predicted from 10th Grade Participation in Extracurricular Aethities
(Number of Hours per Week) and Other Student, Family, and School Characteristics, Females (Multiple Logistic Regression)
Ever Smoker Used Drugs Binge Drinking
RegressionPredictor Variables Coefficient
OddsRatio
RegressionCoefficient
OddsRatio
RegressionCoefficient
OddsRatio
Student ParticipationNo time per week .32 ** 1.38 .43 ** 1.53 .08 1.08
5-19 hours per week -.29 ** .75 -.19 + .83 -.03 .97
20 or more hours per week .00 1.00 -.32 .73 -.25 .78
Student's Grades and School ProgramGrade quartile (8th grade) -.35 ** .70 -.23 ** .80 -.25 ** .78
General program .20 ** 1.22 .04 1.04 .35 ** 1.41
Vocational/technical program .15 1.17 -.20 .82 .33 ** 1.39
Other program .51 ** 1.66 .29 + 1.34 .49 ** 1.64
Family SESParent education -.02 .98 .06 1.06 .00 1.00
SES quartile .05 1.05 .09 + 1.10 .03 1.03
Welfare receipt -.23 .79 -.08 .93 -.34 .71
Language minority -.62 ** .54 -.24 .78 -.19 .83
Parent InvolvementLow -.10 .,- - .91 -.07 .93 .07 1.07
High -.53 ** ' .59 -.47 ** .62 -.23 ** .80
Missing -.54 ** .58 -.73 ** .48 -.24 * .79
Family StructureMother only .17 + 1.19 .50 ** 1.65 .14 1.16
Mother-stepfather .34 ** 1.40 .46 ** 1.58 -.04 .96
Father only .80 ** 2.23 1.35 ** 3.87 .54 * 1.72
Father-stepmother .42 + 1.52 .75 ** 2.13 -.22 .80
Neither parent .73 ** 2.07 .35 1.43 .06 1.06
Ethnic BackgroundBlack -1.72 ** .18 -.98 ** .38 -.69 ** .50
Hispanic -.17 .84 -.05 .95 .19 1.21
Asian -.60 ** .55 -.73 ** .48 -.67 ** .51
Type of SchoolPrivate religious .01 1.01 -.22 .80 .23 * 1.25
Other private .33 1.40 -.16 .85 .38 1.46
High minoro, enrollment -.30 ** .74 -.11 .90 -.28 ** .76
Medium minority enrollment .02 1.02 .28 ** 1.33 .03 1.03
Imercept -.01 -1.10 ** -.19
Multiple R (Somer's D) .40 ** .35 ** .28 **
**p = < .01; *p = < .05; + p = < .10
Source: N. Zill, C.W. Nord, & L.S. Loomis. Analysis of data from the National Educational Longitudinal Study of 1988,
First and Second Followups, 1990 and 1992. 4
*-4
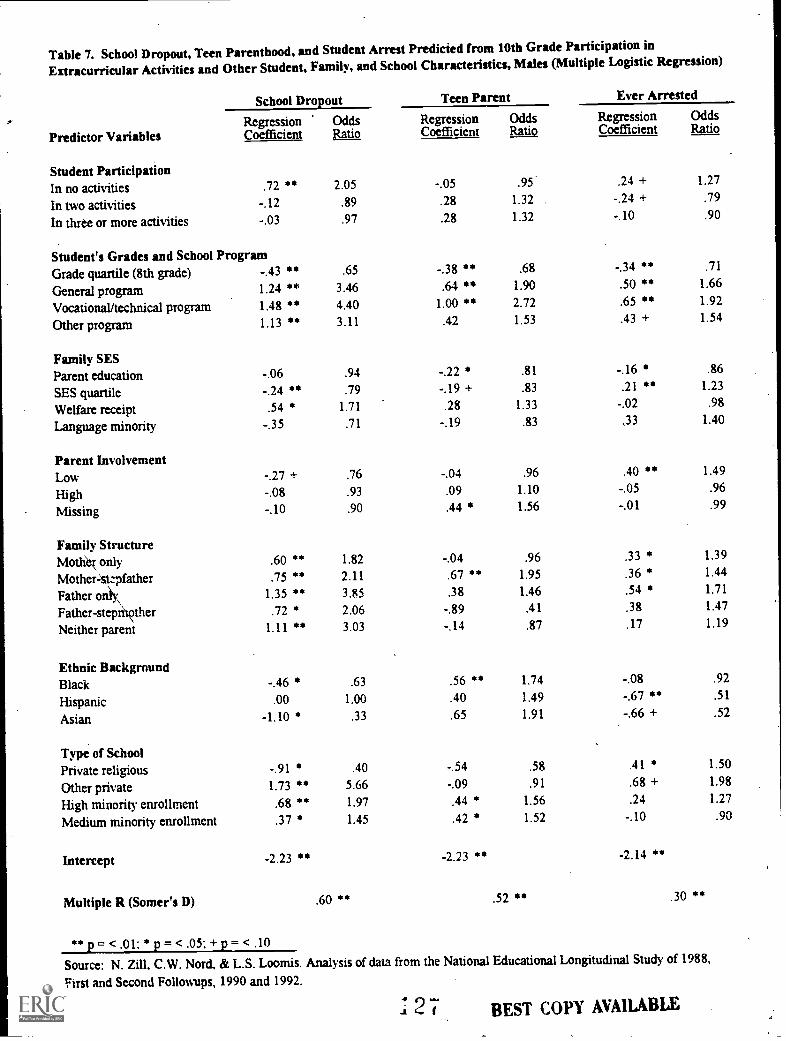
Table 7. School Dropout, Teen Parenthood, and Student Arrest Predicted from 10th Grade Participation in
Extracurricular Activities and Other Student, Family, and School Characteristics, Males (Multiple Logistic Regression)
School Dropout Teen Parent Ever Arrested
RegressionPredictor Variables Coefficient
OddsRatio
RegressionCoefficient
OddsLtaj_io
RegressionCoefficient
OddsRatio
Student ParticipationIn no activities .72 ** 2.05 -.05 .95 .24 + 1.27
In two activities -.12 .89 .28 1.32 -.24 + .79
In three or more activities -.03 .97 .28 1.32 -.10 .90
Student's Grades and School ProgramGrade quartile (8th grade) -.43 ** .65 -.38 ** .68 -.34 ** .71
General program 1.24 ** 3.46 .64 ** 1.90 .50 ** 1.66
Vocational/technical program 1.48 ** 4.40 1.00 ** 2.72 .65 ** 1.92
Other program 1.13 ** 3.11 .42 1.53 .43 + 1.54
Family SESParent education -.06 .94 -.22 * .81 -.16 * .86
SES quartile -.24 ** .79 -.19 + .83 .21 ** 1.23
Welfare receipt .54 * 1.71 .28 1.33 -.02 .98
Language minority -.35 .71 -.19 .83 .33 1.40
Parent InvolvementLow -.27 + .76 -.04 .96 .40 ** 1.49
High -.08 .93 .09 1.10 -.05 .96
Missing -.10 .90 .44 * 1.56 -.01 .99
Family StructureMother only .60 ** 1.82 -.04 .96 .33 * 1.39
Mother=stzpfather .75 ** 2.11 .67 ** 1.95 .36 * 1.44
Father onk 1.35 ** 3.85 .38 1.46 .54 * 1.71
Father-step ther .72 * 2.06 -.89 .41 .38 1.47
Neither parent 1.11 ** 3.03 -.14 .87 .17 1.19
Ethnic BackgroundBlack -.46 * .63 .56 ** 1.74 -.08 .92
Hispanic .00 1.00 .40 1.49 -.67 ** .51
Asian -1.10 * .33 .65 1.91 -.66 + .52
Type of SchoolPrivate religious -.91 * .40 -.54 .58 .41 * 1.50
Other private 1.73 ** 5.66 -.09 .91 .68 + 1.98
High minority enrollment .68 ** 1.97 .44 * 1.56 .24 1.27
Medium minority enrollment .37 * 1.45 .42 * 1.52 -.10 .90
Intercept -2.23 ** -2.23 ** -2.14 **
Multiple R (Somer's D) .60 ** .52 30 **
**p=<.01..*p=<.05;+p=<.10Source: N. Zill, C.W. Nord, & L.S. Loomis. Analysis of data from the National Educational Longitudinal Study of 1988,
First and Second Followups, 1990 and 1992.
-! 9 'jL, I BEST COPY AVAILABLE

Table 8. Smoking, Drug Use, and Binge Drinking Predicted from 10th Grade Participation inExtracurricular Activities and Other Student, Family, and School Characteristics, Males (Multiple Lofistic Regression)
Ever Smoker Used Drugs Binge Drinking
RegressionPredictor Variables Coefficient
OddsRatio
.RegressionCoefficient
OddsRatio
RegressionCoefficient
OddsRatio
Student ParticipationIn no activities .50 ** 1.64 .26 ** 1.30 .06 1.06
In two activities -.01 .99 -.18 + .84 -.04 .96
In three or more activities -.00 1.00 -.10 .90 -.08 .93
Student's Grades and School ProgramGrade quartile (8th grade) -.25 ** .78 -.33 ** .72 -.29 ** .75
General program .36 ** 1.43 .09 1.10 .12 1.12
Vocational/teclmical program .51 ** 1.67 .18 1.20 .16 1.17
Other program .41 ** 1.51 -.33 + .72 .06 1.06
Family SESParent education -.07 .93 -.05 .95 -.17 ** .85
SES quartile .08 1.09 .20 ** 1.23 .11 * 1.11
Welfare receipt .51 * 1.67 .66 ** 1.94 .17 1.18
Language minority -.40 ** .67 -.48 ** .62 -.50 ** .61
Parent InvolvementLow .24 * 1.27 .14 1.15 -.07 .94
High -.06 .94 -.10 .90 .03 1.03
Missing -.10 .90 .13 1.14 .20 * 1.22
Family StructureMother only .10 1.11 .48 ** 1.61 .03 1.03
Mother-stepfather .22 + 1.24 .34 ** 1.40 .21 + 1.23
Father only .02 1.02 .44 * 1.55 .39 * 1.48
Father-stepmother .55 ** 1.73 .19 1.20 .28 1.33
Neither parent .35 1.41 .46 + 1.58 .09 1.10
Ethnic BackgroundBlack -1.23 ** .29 -.63 ** .53 -.79 ** .45
Hispanic .01 1.01 .41 * 1.50 .27 + 1.31
Asian -.54 * .58 -.22 .80 -.61 ** .54
Type of SchoolPrivate religious .39 ** 1.48 .24 + 1.27 .10 1.10
Other private .60 * 1.82 .69 ** 1.99 .31 1.37
High minority enrollment -.18 + .83 .02 1.02 -.07 .93
Medium minority enrollment .04 1.04 .12 1.13 -.05 .95
Intercept -.66 ** -.66 ** .87 **
Multiple R (Somer's D) .31 *4. .28 ** .25 **
Source: N. Zill, C.W. Nord, & L.S. Loomis. Analysis of data from the National Educational Longitudinal Study of 1988,
First and Second Followups, 1990 and 1992.
I of.

Table 9. School Dropout, Teen Parenthood, and Student Arrest Predicted frOm 10th Grade Participation in
Extracurricular Activities and Other Student, Family, and School Characteristics, Females (Multiple Logistic Regression)
School Dropout Teen Parent Ever Arrested
RegressionPredictor Variables Coefficient
OddsRatio
RegressionCoefficient
OddsRatio
RegressionCoefficient
OddsRatio
Student ParticipationIn no activities .55 ** 1.73 .17 1.18 .47 + 1.61
In two activities -.12 .89 -.27 + .76 -.07 .93
In three or more activities -.35 * .71 -.33 * .72 .10 1.11
Student's Grades and School ProgramGrade quartile (8th grade) -.37 ** .69 -.37 ** .69 -.39 ** .68
General program .91 ** 2.49 .72 ** 2.06 .39 1.48
Vocational/technical program 1.07 ** 2.92 .82 ** 2.27 -.24 .79
Other program 1.01 ** 2.76 .50 * 1.64 .46 1.59
Family SESParent education -.28 ** .76 -.26 ** .77 -.23 .80
SES quartile -.21 ** .81 -.17 * .84 .22 1.24
Welfare receipt .53 * 1.71 .42 + 1.53 L.08 .92-
Language minority .02 1.02 -.10 .90 -.77 .46
Parent InvolvementLow -.34 * .71 -.03 .97 -.10 .90
High -.20 .82 -.24 .79 -.38 .68
Missing -.01 .99 .13 1.14 -.12 89
Family StructureMother only .31 " 1.36 .37 ** 1.45 -.39 .68
Mother-stepfather .70 **A 2.02 .98 ** 2.68 .68 " 1.98
Father only 1.05 ** 2.85 1.13 ** 3.09 1.37 ** 3.94
Father-stepmother .71 * 2.04 -.47 .63 -.62 .54
Neither parent .78 ** 2.18 1.09 ** 2.96 -.55 .58
Ethnic BackgroundBlack -.37 * .69 .79 ** 2.21 -.36 .70
Hispanic -.17 .84 .10 1.11 .19 1.21
Asian -.24 .79 -.13 .88 -.17 .84
Type of SchoolPrivate religious -.48 .62 -.82 * .44 -.61 .54
Other private -.66 .52 -.62 .54 -.99 .37
High minority enrollment .39 " 1.48 .09 1.09 -.19 .83
Medium minority enrollment .26 1.29 .33 * 1.39 .10 1.11
Intercept -1.17 ** -1.14 ** -2.86 5*
Multiple R (Somer's D) .61 ** .59 ** .35 **
**p=<.01;*p=<.05;+p=<.10Source: N. Zill, C.W. Nord, & L.S. Loomis. Analysis of data from the National Educational Longitudinal Study of 1988.First and Second Followups, 1990 and 1992.
-I 9 (7'

Table 10. Smoking, Drug Use, and Binge Drinking Predicted from 10th Grade Participation inExtracurricular Activities and Other Student, Family, and School Characteristics, Females (Multiple Logistic Regression)
Ever Smoker Used Drugs Binge Drinking
Regression Odds Regression Odds Regression OddsPredictor Variables Coefficient Ratio Coefficient Ratio Coefficient Ratio
Student ParticipationIn no activities .47 ** 1.61 .48 ** 1.62 .24 ** 1.28
In two activities -.06 .94 -.15 .86 .08 1.09
In three or more activities -.09 .91 -.15 . .86 .17 + 1.18
Student's Grades and School ProgramGrade quartile (8th grade) -.35 ** .70 -.23 ** .79 -.24 ** .79
General program .21 ** 1.23 .02 1.02 .37 ** 1.44
Vocational/technical program .18 . 1.20 -.19 .83 .38 ** 1.46
Other program .54 ** 1.71 .32 + 1.38 .54 ** 1.72
Family.SESParent education -.07 .93 .03 1.03 -.02 .98
SES quartile .09 + 1.10 .11 + 1.11 .08 + 1.08
Welfare receipt -.06 .94 .03 1.03 -.22 .81
Language minority -.66 ** .52 -.33 + .72 -.22 .80
Parent InvolvementLow -.12 .89 -.09 .91 .06 1.06
High -.58 ** .56 -.53 ** .59 -.27 ** .76
Missing -.48 ** .62 -.67 ** .51 -.20 4' .82
Family StructureMother only .26 * 1.29 .50 ** 1.64 .19 * 1.21
Mother-stepfather .32 ** 1.38 .45 ** 1.57 -.02 .98
Father only .92 ** 2.50 1.26 ** 3.53 .59 * 1.80
Father-stepmother .53 * 1.70 .78 ** 2.19 -.22 .80
Neither parent .66 ** 1.93 .34 1.40 .01 1.01
Ethnic BackgroundBlack -1.76 ** .17 -.97 ** .38 -.63 ** .53
Hispanic -.16 .86 -.03 .97 .17 1.19
Asian -.47 * .63 -.68 ** .51 -.63 ** .53
Type of SchoolPrivate religious -.06 .95 -.31 * .73 .20 + 1.22
Other private .36 1.44 -.21 .81 .33 1.39
High minority enrollment -.34 ** .71 -.14 .87 -.23 * .79
Medium minority enrollment -.01 .99 .26 * 1.30 .05 1.05
Intercept .04 -.87 ** -.38 *
Multiple R (Somer's D) .40 ** .34 ** .27 **
** p = < .01; * p = < .05; + p = < .10
Source: N. Zill, C.W. Nord, & L.S. Loomis. Analysis of data from the National Educational Longitudinal Study of 1988,First and Second Followups, 1990 and 1992.
i;

Table 11. School Dropout, Teen Parenthood, and Student Arrest Predicted from 10th Grade Participation in Varsity Sports
and Other Student, Family, and School Characteristics, Males (Multiple Logistic Regression)
School Dropout Teen Parent Ever Arrested
RegressionCoefficient
OddsRatio
RegressionCoefficient
OddsRatio
RegressionCoefficient
OddsRatio
Predictor Variables
Student ParticipationIn varsity or N sports 86 ** .42 .32 * 1.38 .14 1.15
Student's Grades and School ProgramGrade quartile (8th grade) -.47 ** .62 -.32 ** .72 -.36 ** .70
General program 1.09 ** 2.97 55 ** 1.74 .36 ** 1.43
Vocational/technical program 1.31 ** 3.69 1.09 ** 2.99 .61 ** 1.84
Other program .92 ** 2.52 .81 ** 2.24 .38 + 1.47
Family SESParent education -.09 .92 -.23 * .79 -.23 ** .80
SES quartile -.24 ** .79 -.10 .91 .21 ** 1.23
Welfare receipt .38 1.47 .26 1.30 .02 1.02
Language minority -.71 ** .49 -.17 .85 .31 1.36
Parent InvolvementLow -.25 + .78 .12 1.13 .43 ** 1.53
High -.12 .89 .03 1.03 -.26 * .77
Missing .09 1.09 .51 ** 1.67 -.10 .90
Family Structure ftMother only .49 ** 1.63 .03 1.03 .25 + 1.28
Mother-stepfather .68 ** 1.98 .52 ** 1.69 .36 * 1.44
Father only. 1.30 ** 3.66 .20 1.23 .36 1.43
Father-stepmother .83 ** 2.29 -.51 .60 .32 1.37
Neither parent 1.01 ** 2.74 .14 1.16 .20 1.22
Ethnic BackgroundBlack -.35 * .70 .64 ** 1.90 -.29 + .75
Hispanic .48 * 1.62 .27 1.32 -.67 ** .51
Asian -.50 .61 .60 1.82 -.49 . .61
Type of SchoolPrivate religious -.80 * .45 -.73 + .48 .23 1.26
Other private 1.70 ** 5.46 -.21 .81 .54 1.72
High minority enrollment .67 ** 1.95 .45 * 1.56 .23 + 1.26
Medium minority enrollment .44 ** 1.55 .33 + 1.39 .04 1.04
Intercept -1.41 ** -2.54 ** -1.71 **
Multiple R (Somer's D)
p=< .01; *p = < .05; +p = < .10
.61 ** .50 ** .29 **
Source: N. Zill, C.W. Nord, & L.S. Loomis. Analysis of data from the National Educational Longitudinal Studyof 1988,
First and Second Followups, 1990 and 1992.
BEST COPY AVAILABLE
4,31

Tnble 12. Smoking, Drug Use, and Binge Drinking Predicted from 10th Grade Participation in Varsity Sports
and Other Student, Family, and School Characteristics, Males (Multiple Logistic Regression)
Ever Smoker Used Drugs Binge Drinking
RegressionCoefficient
OddsRatio
RegressionCoefficient
OddsRatio
RegressionCoefficient
OddsRatio
Predictor Variables
Student ParticipationIn varsity or JV sports -.44 ** .65 -.09 .92 .42 ** 1.52
Student's Grades and School ProgramGrade quartile (8th grade) -.26 ** .77 -.34 ** .71 -.31 ** .73
General program .33 ** 1.39 .05 1.05 .14 * 1.15
Vocational/technical program .50 ** 1.65 .07 1.07 .20 + 1.22
Other program .32 * 1.38 -.37 * .69 .18 1.20
Family SESParent education -.09 + .92 -.06 .94 -.18 ** .83
SES quartile .10 * 1.11 .20 ** 1.22 .10 * 1.11
Welfare receipt .55 ** 1.74 .66 ** 1.93 .13 1.14
Language minority -.35 * .71 -.49 ** .61 -.50 **- .61
Parent InvolvementLow .31 ** 1.36 .17 + 1.19 .04 1.04
High -.02 .98 -.12 .89 -.03 .97
Missing -.11 .90 .13 1.14 .27 ** 1.31
Family StructureMother only .09 1.09 .39 ** 1.47 .02 1.02
Mother-stepfather .27 ** 1.31 .35 ** 1.42 .19 + 1.21
Father only -.04 .96 .48 * 1.61 .38 * 1.46
Father-stepmother .42 * 1.52 .12 1.12 .35 + 1.43
Neither parent .32 1.38 .48 * 1.61 .08 1.08
Ethnic BackgroundBlack -1.32 ** .27 -.67 ** .51 -.88 ** .42
Hispanic -.05 .95 .42 ** 1.52 .18 1.20
Asian -.58 ** .56 -.23 .80 -.63 ** .53
Type of SchoolPrivate religious .46 ** 1.58 .19 1.21 .11 1.11
Other private .68 ** 1.98 .71 ** 2.04 .37 1.44
High minority enrollment -.17 + .84 .02 1.02 .02 1.02
Medium minority enrollment .02 1.02 .13 1.14 -.04 .97
Intercept -.30 + -.46 ** .75 **
Multiple R (Somer's D) .32 ** .26 *1 .27 **
** p = < .01; * p = < .05; + p = < .10
Source: N. Zill, C.W. Nord, & L.S. Loomis. Analysis of data from the National Educational Longitudinal Study of 1988,
First and Second Followups, 1990 and 1992.

Table 13. School Dropout, Teen Parenthood, and Student Arrest Predicted from 10th Grade Participation in Varsity Sports
and Other Student, Family, and School Characteristics, Females (Multiple Logistic Regression)
School Dropout Teen Parent Ever Arrested
RegressionCoefficient
Odds RegressionCoefficient
OddsRatio
RegressionCoefficient
OddsRatio
Predictor Variables
Student ParticipationIn varsity or JV sports -.51 ** .60 -.40 ** .67 .34 + 1.40
Student's Grades and School ProgramGrade quartile (8th grade) -.42 ** .66 -.38 ** .69 -.48 ** .62
General program .95 ** 2.59 .78 ** 2.17 .48 * 1.62
Vocational/technical program 1.08 ** 2.94 .78 ** 2.18 -.20 .82
Other program 1.07 ** 2.91 .63 ** 1.87 .53 1.69
Family SESParent education -.21 ** .81 -.25 ** .78 -.04 .96
SES quartile -.28 ** .76 -.17 * .84 -.01 .99
Welfare receipt .43 + 1.53 .40 + 1.50 -.31 .74
Language minority -.03 .97 -.09 .92 -.69 .50
Parent InvolvementLow -.34 * .71 -.02 .98 -.09 .92
High -.30 * .74 -.22 .81 -.54 * .58
Missing -.00 1.00 .14 1.15 -.34 .71
Family StructureMother only .26 + 1.30 .33 * 1.39 -.39 .68
Mother-stepfather .71 ** 2.04 .97 ** 2.64 .68 ** 1.97
Father only 1.00 ** 2.73 1.10 ** 3.00 1.44 ** 4.20
Father-stepmother .69 * 1.99 -.46 .63 -.26 .77
Neither parent .85 ** 2.35 1.01 ** 2.76 -.58 .56
Ethnic BackgroundBlack -.45 * .64 .80 ** 2.22 -.36 .70
Hispanic -.08 .92 .13 1.14 .10 1.10
Asian -.09 .92 -.13 .88 .12 1.13
Type of SchoolPrivate religious -.49 + .61 -.83 ** .44 -.57 .57
Other private -.71 49 -.66 .52 -1.12 .33
High minority enrollment .40 ** 1.49 .09 1.09 -.18 .84
Medium minority enrollment .21 1.23 .26 + 1.30 .03 1.03
Intercept -.88 ** .42 -1.15 ** -2.58 **
Multiple R (Son!r's D) .61 ** .59 ** .35 **
** p = < .01; * p = < .05; + p = < .10
Source: N. Zill, C.W. Nord, & L.S. Loomis. Analysis of data from the National Educational Longitudinal Study of 1988,First and Sccond Followups, 1990 and 1992.

Table 14. Smoking, Drug Use, and Binge Drinking Predicted from 10th Grade Participation in Varsity Sports
and Other Student, Family, and School Characteristics, Females (Multiple Logistic Regression)
Ever Smoker Used Drugs Binge Drinking
RegressionCoefficient
OddsRatio
RegressionCoefficient
OddsRatio
RegressionCoefficient
OddsRatio
Predictor Variables
Student ParticipationIn varsity or JV sports -.14 * 87 .05 1.05 .24 ** 1.27
Student's Grades and School ProgramGrade quartile (8th grade) -.39 ** .68 -.27 ** .76 -.25 ** .78
General program .21 ** 1.24 .09 1.10 .39 ** 1.47
Vocational/technical program .14 1.16 -.18 .84 .36 ** 1.43
Other program .51 ** 1.66 .35 * 1.42 .56 ** 1.75
Family SESParent education -.04 .96 .04 1.04 -.03 .98
SES quartile .07 1.07 .09 + 1.10 .06 1.06
Welfare receipt -.15 .86 -.01 .99 -.20 .82
Language minority -.61 ** .54 -.23 .80 -.21 .81
Parent InvolvementLow - 05 .96 .01 1.01 .12 1.13
High -.63 ** .54 -.60 ** .55 -.28 ** .76
Missing -.55 ** .58 -.72 **. .49 -.23 * .80
Family StructureMother only .26 ** 1.30 .54 ** 1.71 .19 * 1.21
Mother-stepfather .35 ** 1.43 .48 ** 1.62 -.01 .99
Father only .92 ** 2.52 1.38 ** 3.96 .64 ** 1.89
Father-stepmother .49 * 1.63 .79 ** 2.19 -.22 .80
Neither parent .72 ** 2.06 .39 1.48 .05 1.06
Ethnic BackgroundBlack -1.66 ** .19 -.95 ** .39 -.65 ** .52
Hispanic -.14 .87 -.05 .95 .19 1.21
Asian -.48 ' .62 -.69 ** .50 -.65 ** .52
Type of SchoolPrivate religions .06 1.07 -.18 .84 .24 * 1.27
Other private .37 1.45 -.14 .87 .38 1.46
High minority enrollment -.33 ** .72 -.11 .90 -.25 ** .78
Medium minority enrollment -.04 .96 .27 ** 1.31 .03 1.03
Intercept .23 -.84 ** -.29 +
Multiple R (Somer's D) .39 ** .32 ** .28 **
**p=<.01;.*p=< 05,+p=<.10Source: N. Zill, C.W. Nord, & L.S. Loomis. Analysis of data from the National Educational Longitudinal Study of 1988,First and Second Followups, 1990 and 1992.

Table 15. Schoct Drotiout, Teen Parenthood, and Student Arrest Predicted from 10th Grade Participation in Band, Orchestra,Chorus, School Play or Musical, and Other Student, Family, and School Characteristics, Males (Multiple Logistic Regression)
School Dropout Teen Parent Ever Arrested
RegressionPredictor Variables Coefficient
OddsRatio
RegressionCoefficient
OddsRatio
RegressionCoefficient
OddsRatio
Studen2 ParticipationIn band, orchestra, chorus,
school play or musical -.33 * .72 .09 1.10 -.26 * .77
Student's Grades and School ProgramGrade quartile (8th grade) -.46 ** .63 -.30 ** .74 -.34 ** .71
General program 1.20 *** 3.32 .63 ** 1.88 .34 ** 1.40
Vocational/technical program 1.49 ** 4.45 .97 ** 2.64 .52 ** 1.69
Other nrogram 1.26 ** 3.52 .97 ** 2.63 .44 * 1.55
Family SESParent education -.10 .90 -.16 + .85 -.18 ** .84
SES quartile -.21 ** .81 -.19 * .83 .20 ** 1.22
Welfare receipt .41 1.51 .29 1.34 .02 1.02
Language minority -.34 .71 -.20 .82 .25 1.29
Parent InvolvementLow -.15 .86 .01 1.01 .38 ** 1.46
High -.24 + .79 .15 1.16 -.18 .83
Missing -.09 .92 .64 ** 1.91 -.02 .99
Family Structure .
Mother only .56 ** 1.75 -.05 .95 .26 + 1.30
Mother-stepfather .67 ** 1.96 .53 ** 1.70 .32 * 1.38
Father only 1.26 ** 3.52 .43 1.53 .35 1.42
Father-stepmother .80 ** 2.22 -.79 .45 .38 1.46
Neither parent .93 ** 2.53 -.05 .95 .21 1.24
Ethnic BackgroundBlaric . -.48 ** .62 .58 ** 1.78 -.14 .87
Hispanic .02 1.02 .16 1.17 -.51 * .60
Asian -1.09 * .34 .56 1.75 -.58 + .56
Type of SchoolPrivate religious -.89 * .41 -.76 + .47 .20 1.22
Other private 1.57 ** 4.81 -.19 .82 .52 1.68
High minority enrollment .76 ** 2.14 .59 ** 1.80 .20 1.22
Medium minority enrollment ..44 ** 1.56 .48 * 1.61 .08 1.08
Intercept -1.87 *5 -2.51 ** -1.78 **
Multiple R (Somer's D) .58 ** .50 ** .29 **
*sp=<.01; 5 p.;=<.05;+p=<.10Source'. N. Zill, C.W. Nord, & L.S. Loomis. Analysis of data from the National Educational Longitudinal Study of 1988,First and Second Followups, 1990 and 1992.
,1J q

Table 16. Smoking, Drug Use, and Binge Drinking Predicted from 10th Grade Participation in Band, Orchestra,Chorus, School Play or Musical, and Other Student, Family, an 1 School Characteristics, Males (Multiple Logistic Regression)
Ever Smoker Used Drugs Binge Drinking
RegressionPredictor Variables Coefficient
OddsRatio
RegressionCoefficient
OddsRatio
RegressionCoefficient
OddsRatio
Student ParticipationIn Band, Orchestra, Chorus,
School Play or Musical -.25 ** 78 - 33 ** 72 - 37 ** .69
Student's Grades and School ProgramGrade quartile (8th grade) -.26 * .77 . - 34 ** .72 -.27 ** 76
General program 36 ** 1.43 .08 1.09 .13 + 1.14
Vocational/technical progranf .52 ** 1.67 .09 1.09 .14 1.16
Other program .43 ** 1.54 -.21 .81 .24 + 1.28
Family SESParent education -.09 + 92 -.06 .95 -.19 ** .83
SES quartile .09 + 1.09 .20 ** 1-.22 .11 * 1.11
Welfare receipt .54 ** 1.71 .66 ** 1.94 .16 1.18
Language minority -.37 ** .69 -.43 ** 65 -.48 ** .62
Parent InvolvementLow .33 ** 1.39 .18 + 1.20 -.05 .95
High -.05 95 -.09 .92 .09 1.10
Missing -.09 92 .14 1.16 .33 ** 1.39
Family StructureMother only .11 1.11 .38 ** 1.47 .01 1,01
Mother-stepfather .27 ** 1.31 .35 ** 1.42 .20 * 1.22
ikather only -.06 .94 46 * 1.59 .34 + 1.40
Father-stepmother .46 * 1.58 .22 1.25 .40 " 1.49
Neither parent .38 + 1 47 .53 * 1.71 .12 1.13
Ethnic BackgroundBlack -1.28 ** 28 -.63 ** 53 -.80 ** .45
Hispanic -.03 97 .37 * 1.45 .19 1.21
Asian - 57 ** .57 -.32 72 -.64 ** .53
Type of SchoolPrivate religious .42 ** 1.53 .16 1.18 .11 1.12
Other private .66 ** 1.93 .72 ** 2.05 .41 + 1.50
High minority enrollment - 14 .87 .00 1 00 -.07 .93
Medium minority enrollment .01 1.01 .13 1.14 - 05 .95
Intercept - 46 ** -.53 ** .95 **
Multiple R (Somer's D) 30 27 *4' .27 **
**p=<.01,*p=<.05,4-p=<.l0Source. N. Zill, C.W. Nord, & L.S. Loomis. Analysis of data from the National Educational Longitudinal Study of 1988,First and Second Followups, 1990 and 1992
o)

Table 17. School Dropout, Teen Parenthood, and Student Arrest Predicted from 10th Grade Participation in Band, Orchestra,
Chorus, School Play or Musical, and Other Student, Family, and School Characteristics, Females (Multiple Logistic Regression)
School Dropout Teen Parent Ever Arrested
RegressionPredictor Variables Coefficient
OddsRatio
RegressionCoefficient
OddsRatio
RegressionCoefficient
OddsRatio
Student ParticipationIn band, orchestra, chorus,
school play or musical -.41 ** 66 -.25 * .78 - 46 * .63
Student's Grades and School ProgramGrade quartile (8th grade) -.41 ** .66 -.38 ** .68 -.41 ** .66
General program .92 ** 2.52 .75 ** 2.12 .44 + 1.55
Vocationaliteehnical program 1.11 ** 3.04 .74 ** 2.10 -.22 .80
Other program 1.08 ** 2.94 .65 ** 1.91 .50 1.66
Family SESParent education -.24 ** .79 -.24 ** 79 -.16 .85
SES quartile -.26 ** .77 -.20 ** .82 .15 1.16
Welfare receipt .35 1.41 .36 1.44 .45 1.56
Language minority -.10 .91 -.10 .90 -.72 .49
Parent InvolvementLow -.29 * .75 .01 1.01 -.12 .88
High -.24 .79 -.24 4- .79 -.37 .69
Missing .03 1.04 .15 1 16 -.24 .79
Family StructureMother only .28 ' 1.32 .32 " 1.38 -.18 .84
Mother-stepfather .77 ** 2.15 .99 ** 2.70 .75 ** 2.12
Father only 1.06 ** 2.90 1.14 ** 3.12 1.40 ** 4.06
Father-stepmother .77 * 2.15 - 44 .64 -.06 .94
Neither parent .86 ** 2.36 1 01 ** 2.76 -.54 .58
Ethnic BackgroundBlack -.42 * .66 .77 ** 2.16 -.36 .70.
Hispanic -.09 .91 .09 1.10 .13 1.14
Asian -.14 .87 -.22 .80 44 1.55
Type of SchoolPrivate religious -.52 + .60 -.84 ** .43 -.60 .55
Other private -.79 .45 -.72 .49 -1.08 .34
High minority enrollment .44 ** 1.55 .14 1.15 -.15 .86
Mcdium minority enrollment .30 * 1.35 .29 * 1 33 .02 1.02
Intercept -.94 ** -1.17 ** -2.67 **
Multiple R (Somer's D) 60 ** 58 ** 36 **
**p=<.01;*p=,<.05:+p=<.10Source: N. Zill, C.W. Nord, & L.S. Loomis. Analysis of data from the National Educational Longitudinal Study of 1988,First and Second Followups, 1990 and 1992.
4
%)
-

Table 18. Smoking, Drug Use, and Binge Drinking Predicted from 10th Grade Participation in Band, Orchestra, Chorus,
School Play or Musical, and Other Student, Family, and School Characteristics, Females (Multiple Logistic Regression)
Ever Smoker Used Drugs Binge Drinking
RegressionPredictor Variables Coefficient
OddsRatio
RegressionCoefficient
OddsRatio
RegressionCoefficient
OddsRatio
Student ParticipationIn Band, Orchestra, Chorus,
School Play or Musical -.37 ** .69 -.42 ** .66 -.29 ** .75
Studtzt's Grades and School ProgramGrade quartile (8th grade) -.38 ** .68 -.27 ** .77 -.25 ** .78
General program .23 ** 1.26 .09 1.09 .36 ** 1.43
Vocational/technical program .16 1.1- -.22 .80 .32 ** 1.38
Other program .55 ** 1.73 .35 * 1.42 .52 ** 1.68
Family SESParent education -.04 .96 .05 1.06 -.01 .99
SES quartile .06 1.06 .08 1.08 .05 1.05
Welfare receipt -.19 .83 -.04 .96 -.31 .74
Language minority -.62 ** .54 -.25 .78 -.18 .84
Parent InvolvementLow -.06 .94 -.03 .97 .06 1.06
High -.57 ** .56 -.53 ** .59 -.22 ** .80
Missing -.49 ** .62 -.68 ** .51 -.22 * .80
Family StructureMother only .22 1.24 .51 ** 1.66 .14 1.15
Mother-stepfather .31 ** 1.37 .44 ** 1.56 -.05 .95
Father only .88 ** 2.40 1.31 ** 3.72 .53 * 1.70
Father-stepmother .48 * 1.62 .77 ** 2.16 -.25 .78
Neither parent .71 ** 2.03 .35 1.42 .04 1.04
Ethnic BackgroundBlack -1.69 ** .19 -.94 ** .39 -.64 ** .53
Hispanic -.15 .86 -.03 .97 .19 1.21
Asian -.56 * .57 -.72 ** .49 -.67 ** .51
Type of SchoolPrivate religious -.03 .98 -.21 .81 .19 + 1.21
Other private .29 1.34 -.18 .84 .37 1.45
High minority enrollment -.30 ** .74 -.11 .90 -.27 ** .76
Medium minority enrollment .01 1.01 .28 ** 1.32 .01 1.01
Intercept .26 -.72 ** -.12
Multiple R (Somer's D) .40 ** 33 ** .29 **
**p=<.01;*p=<.05;+p=<.10Source: N. Zill, C.W. Nord, & L.S. Loomis. Analysis of data from the National Educational Longitudinal Study of 1988,First and Second Followups, 1990 and 1992.