author proof a simulation study on lte handover and the
TRANSCRIPT

A Simulation Study on LTE Handoverand the Impact of Cell Size
Muhammad Tayyab1(&), George P. Koudouridis2,and Xavier Gelabert2
1 Huawei Technologies Finland Oy, Itämerenkatu 9, 00180 Helsinki, [email protected]
2 Huawei Technologies Sweden AB, Skalholtsgatan 9, 16494 Kista, Sweden
Abstract. In this paper we address the impact of cell size on the handoverprocedure in a Long Term Evolution (LTE) network. In particular, we highlightthe potential problems that may occur when small cell densification is applied.In addition, the impact of the User Equipment (UE) speed is also analyzed.System level simulations are provided using a detailed LTE network simulatoraccounting for multiple points-of-failure and channel modeling compliant withLTE standards. We conclude that a certain cell size can be found around whichany increase or decrease of the cell size brings performance degradations due todifferent limitations in the uplink. The performance is also degraded as UEspeed increases, especially for small cell sizes. And for large cell sizes, we notethat low speed UEs handover failures may rise due to the inability to “escape”from a poor radio condition area.
Keywords: LTE � Handover � Performance evaluation � Simulation
1 Introduction
While the development of future cellular networks is often driven by the need forincreased bit rates to support data-hungry applications, of equal importance is toprovide reliable handover (HO) mechanisms as this directly impacts on the perceivedquality of experience (QoE) for the end user. This is particularly true when, in order toprovide such increased bit rates, we resort to the deployment of small cell networks inorder to boost the capacity in a given area [1]. Cell densification has proven to be aspectral efficient method to increase capacity and has received large attention in recentyears (see [2] and references therein). In addition to high data rate demands, networkswill need to provide their services to users on the move, probably more so and at higherspeeds with the appearance of new transport paradigms such as self-driving vehicleswhere the user, no longer at the steering wheel, may use that time for digital contentconsumption. With this in mind, in this paper we will address the impact of cell densityand UE speed on the handover procedure in a Long Term Evolution (LTE) network.
While the study of the impact of cell size on the handover procedure is not new, thevast majority of the existing works are devoted to analyze the impact of small celldensification as opposed to a wider analysis covering a range of inter site distances (ISD).Moreover, a large number of works adopt a theoretical approach and, while interesting
AQ1
© ICST Institute for Computer Sciences, Social Informatics and Telecommunications Engineering 2019Published by Springer Nature Switzerland AG 2019. All Rights ReservedV. Sucasas et al. (Eds.): BROADNETS 2018, LNICST 263, pp. 1–11, 2019.https://doi.org/10.1007/978-3-030-05195-2_39
Au
tho
r P
roo
f

insights can be provided, there is sometimes a lack offidelity with respect to the standardwhich causes that some effects are not appropriately captured. In particular the field ofStochastic Geometry has been in recent years used to model the impact of handover indense small cell networks see for example [3–6]. Such works lack on capturing effectssuch as handover failures, and consequent re-establishment and cell-reselection proce-dures, Radio Link Control (RLC) failures and corresponding retransmissions, etc. Inaddition, a simulation-based approach is more appropriate to capture the details of theLTE standard. In [7], the performance of handover in dense small HetNets is discussed,i.e. considering an overlapping deployment of both macro and pico cells. In [8], authorsexamine and evaluate the impact of small cell deployments on mobility performance inLTE-systems. Analysis is done through system level simulations in various scenarioswith macro and small cell overlaid deployments. In this paper we focus not only on theproblems caused by higher densification but also the problems faced when the cell sizeincreases. Detailed system level simulations considering a wide range of potential failurepoints are provided.
The rest of the paper is organized as follows: Sect. 2 provides an overview of thehandover mechanism in LTE. Section 3 discusses the simulator implementation andmodelling aspects. In Sect. 4, numerical results and discussion are given on the per-formance of LTE handover. Section 5 provides some concluding remarks.
2 Handover Mechanism in LTE
Handover (HO) management is a relevant research point in cellular networks. Theoverall HO decision procedure in LTE is illustrated in Fig. 1 [9], and consists of fourmajor steps. Firstly, the UE performs downlink (DL) signal strength measurementsfrom both the serving eNBs and other neighboring eNBs. Within the context of HO theserving eNB is referred to as the source eNB or serving cell, while the neighboringeNBs are referred to as the target eNBs or target cell. In the second step these mea-surements are processed at the UE, and in the third step a measurement reports(measReport) is transferred to the serving eNB. In the fourth and final step, based onthe measReport, the serving eNB makes the HO decision and sends a HO requestmessage to the target eNB.
Fig. 1. HO process in 3GPP LTE [9].
2 M. Tayyab et al.
Au
tho
r P
roo
f

The UE and eNB actions related to Radio Resource Management (RRM) proce-dures for the HO execution constitute the mechanisms for mobility control. In general,mobility control is divided into two stages, mobility control in RRC_IDLE state, whichis referred to as cell reselection, and mobility control in RRC_CONNECTED state,which is referred to as handover. In this paper, we are focusing on mobility inRRC_CONNECTED state.
2.1 Mobility Control in RRC_CONNECTED (Handover)
There are two different types of actions that a UE has to perform in RRC_CON-NECTED according to the requirements. The first type is, upon measuring and iden-tifying a better neighboring cell than the serving cell, UE reports to the serving eNBand access the target cell on reception of HO command (from serving eNB). The UEperforms signal strength measurements over specific reference signal received power(RSRP) from the serving cell as well as the neighboring cells. After processing themeasurements, including filtering at layers L1 and L3, if an entry condition is fulfilled,a measurement report (measReport) is triggered to the serving cell. A3 event is used asentry condition to see if the filtered RSRP of the target cell is better than that of theserving cell plus a hysteresis margin (called A3 offset). The entry condition has to bemaintained during a time defined by the Time to Trigger (TTT) timer. Once themeasReport is correctly received at the serving cell, the HO preparation phase betweentarget and serving cell starts which also includes admission control procedures. Uponsuccessful admission, the target cell acknowledges the HO request sent by the servingcell and prepares for HO. Data forwarding starts between the serving and target cell anda HO command (HOcmd) is sent from the serving cell to the UE. Upon successfulreception of the HOcmd, the HO execution phase starts in which the UE accesses thetarget cell, by means of a random Access Channel (RACH) procedure, and delivers aHO confirmation (HOconf) message. Random access procedure takes two differentforms, contention-based and contention-free RACH. In contention based RACH pro-cedure, UE selects a random preamble and start transmission to the target eNB. Butthere is a chance of preamble collision due to the same preamble from multiple UEs.So, the network has to go through an additional process called contention resolutionwhich is time consuming. In contention-free RACH procedure, the network informseach UE regarding when and which preamble it has to use. To initiate the contention-free RACH process, UE should be in connected mode before the RACH process as inHO case. In order to achieve a good compromise between HO reliability and HOfrequency, HO optimization deals with the adjustment of the TTT, A3 offset, and theL3 filter coefficient K [7].
The second type of action is the detection of the radio link failure (RLF) bymonitoring the DL quality of the serving cell. Upon RLF detection, the UE selects thebest target cell and gets its information for RRC connection re-establishment.
Evaluation of Radio Link Failure (RLF)In RRC connected state, radio link monitoring enables the UE to determine whether it isin-sync or out-of-sync with respect to its serving cell. On getting consecutive number ofout-of-sync indications, UE starts an RLF timer `T310´ as shown in Fig. 2. Both in-sync
A Simulation Study on LTE Handover and the Impact of Cell Size 3
Au
tho
r P
roo
f

and out-of-sync (N311 and N310) counters are configured by the network based on theassociated in-sync threshold Qin and out-of-sync threshold Qout corresponding to 2% and10% Block Error Rate (BLER), respectively. The timer stops when a number of con-secutive in-sync (N311) indications are reported (case 2 in Fig. 2). If T310 expires, RLFoccurs and UE turns off its transmission to avoid interference and try to re-establish aconnection within a UE connection re-establishment delay (case 1 in Fig. 2). If the DLradio link quality becomes worse than Qout within a 200 ms period, then out-of-syncoccurs. Whilst, in-sync occurs when the DL radio link quality becomes better than Qin
within a 100 ms period. These occurrences are reported by the UE to the physical layerand higher layers which may apply L3 filtering for evaluation of RLF [10].
An overall view of the HO procedure is shown in Fig. 3 [11], which can be dividedinto 3 phases: HO preparation (0–6), HO execution (7–11) and HO completion (12–14).
3 System Simulation Models
The used LTE simulator considers a hexagonal grid of 16 tri-sectored eNBs. Cell wrap-around feature is included in order to ensure fair interference conditions across thescenario. UEs are randomly placed over the scenario and the mobility model is suchthat UEs move at fixed speed in straight lines with random directions [0°, 360°].
As for traffic loading, UEs with UL full-buffer traffic are assumed, thus contributingto UL interference towards other UEs. DL interference is artificially generated bysetting the transmission power on a number of randomly selected Physical ResourceBlocks (PRBs) given a specific load level (in our case a fully loaded case is assumed).
The simulator implements the main features of the Packet Data ConvergenceProtocol (PDCP), Radio Link Control (RLC), Medium Access Control (MAC) andphysical (PHY) layers including, inter alia, segmentation, Automatic Repeat Request(ARQ) at RLC level, and MAC scheduling with chase combined Hybrid-ARQ(HARQ). For the PHY layer, look-up tables are used which map bit error rate(BER) values to measured subcarrier Signal-to-Interference-and-noise-ratio (SINR)values (via the EESM, Effective Exponential SNR Mapping) in order to account forerrors over the wireless link.
Fig. 2. RLF detection
4 M. Tayyab et al.
Au
tho
r P
roo
f

The HO model considers the modelling of L3 RRC signaling over the radio access,including measurement reports, handover command and handover confirmation. L2signaling (UL and DL allocation) is also captured by modelling the PDCCH. Both L2and L3 signaling are subject to channel impairments and thus prone to RLC failures.
Moreover, see Sect. 2.1, RLFs are also considered in the simulator with fullmodeling of the in-sync/out-of-sync states via counters N310, N311 and timer T310.
Summarizing, handover failures (HOF) are captured in the simulator falling into thefollowing categories, with failure points being defined in Table 1.
1. RLF declared by L1 at the UE after timer T310 expiry [12, Sect. 7.3].2. RLC is unable to deliver a Radio Resource Control (RRC) message after a (max.)
number of transmission attempts. Applies to measReport and HOconf messages.3. RACH failure after timer T304 expiry [12, Sect. 7.3].
The main simulation assumptions are summarized in Table 2.
2. Measurement Reports
4. Handover request
6. Handover Request Ack
7. HO Command
Data Forwarding
12. HO confirm
11. Synchronisation (RACH)
packet data
packet data
packet data
s-eNB t-eNBUE MME sGW
Mea
sure
men
ts
8. Detach from s-cell and
synchronize to t-cell
9. Deliver buffered and in transit
packets to t-BS
5. Admission Control
3. HO decisionH
OPr
epar
atio
n
10. Buffer packets from s-BS
HO
Exe
cutio
n
13. Switch DL path
14. Release ResourcesH
O C
ompl
etio
n
1. MeasurementsLegend
L3 signalling
L1/L2 signalling
User Data
Fig. 3. Intra MME/SG HO procedure (adapted from [11]).
A Simulation Study on LTE Handover and the Impact of Cell Size 5
Au
tho
r P
roo
f

4 Performance Evaluation
In this section we provide a numerical evaluation of the HO procedure under differentconditions of cell density and UE speed. First, we start with some metric definitions.
4.1 Metrics
HO performance metric definition follows the guidelines in [15, Sect. 5.4.2]. The HOrate (HOR), measured in HO events/s, is defined as the total number of triggered HOevents divided by the simulation time (60 s). Similarly, the HO failure ratio (HOFR),measured in %, is defined as the total number of HO failure events divided by the totalnumber of triggered HO events. The ping pong rate (PPR) is defined as the number ofping pong events during a given period of time. In turn, we define a ping pong event asthe occurrence of a HO between a source cell and a target cell, followed by another HOto the original source cell, all this happening under a predefined time set to 3 s. Finally,we define the mean time between handovers (MTBH) as the ratio between the totalsimulation time and the number of triggered HO events.
Table 1. Simulated failure points.
Failure point Description
F0 T310 expiry before measReport triggeredF1 T310 expiry before measReport receivedF2 RLC measReport transmission errorF3 T310 expiry before HOcmd transmissionF4 T310 expiry before HOcmd receptionF5 RACH failure after T304 expiryF6 T310 expiry before HOconf receivedF7 RLC HOconf transmission error
Table 2. Simulation parameters and assumptions.
Feature Implementation
Network topology Hexagonal grid of 16 � 3 = 48 cells (wrap-around included)Inter-site distance From the set {125, 250, 375, 500, 625, 750, 1000, 1250} mBandwidth 5 MHz FDD at 2.6 GHzeNB DL power 43 dBmAntenna patterns 3D model specified in [13], Table A.2.1.1.2-2Channel model 6 tap model, Typical Urban (TU)Shadowing Log-normal Shadowing Mean 0 dB, Standard deviation: 8 dBPropagation model L ¼ 130:5þ 37:6 log10 Rð Þ, R in kmUE speed From the set {3, 30, 60, 120} km/hRLF detection by L1 of UE T310 = 1 s, N310 = 1, N311 = 1 as specified in [12]
Qin = −4.8 dB; Qout = −7.2 dB as specified in [14]HO parameters TTT = 64 ms, A3 offset = 3 dB, L3 filter coefficient K = 4
6 M. Tayyab et al.
Au
tho
r P
roo
f

4.2 Numerical Evaluation
Figure 4 illustrates the handover rate (measured in number of HOs per second) againstthe ISD and for different UE speeds. As expected, increasing the density of eNBs(lower ISD) results in an increase of HOs due to the increased number of cell borders.This rate notably increases when the ISD falls below 250 m. Also expected is theincrease of the HO rate with UE speed. In addition, an increase of the HO rate is alsonoted for increased ISD values, see ISD = {750, 1000, 1250}. The reason for this willbecome apparent when analyzing the different channel conditions impacting thesedeployments.
Next we drive our attention to the handover failure ratio (HFR), i.e. the percentageof those handovers which for one reason or another experienced problems and couldnot be completed seamlessly. Figure 5 illustrates the HFR against the ISD for differentUE speeds. Both lowering and increasing the ISD have negative effects, i.e. increasedHFR. For low ISD, failure arises due to adverse channel conditions due to excessiveinterference from neighbor UEs. Further insights on this will be provided later on. Inaddition, increasing UE speed contributes to HFR for lower ISDs (125 m, 250 m and375 m). We can argue that for small cells, higher UE speeds will cause moving awayfrom the source cell which may cause problems during handover. For larger ISDs,1 km and above, HFR also increases. This is again due to channel adversity as it willbecome apparent later on. In this case however, we note how the UE speed impact isreversed as compared to the low ISD case. For larger cells, “higher UE speed helps toescape from the cell border”. Noteworthy, despite suffering handover failure, LTEimplements re-establishment/cell-reselection mechanisms so as to recover the con-nection with the UE. However, this re-establishment comes at the cost of increaseddelay and interruption time.
Figure 6 shows the HO failure breakdown per type F0 to F7. An overall trend isthat failures seem to concentrate on UL transmission errors (RLC timer/max. retrans-missions expires). For high ISDs, a common failure is that of RACH failure which is
Fig. 4. Handover Rate (HOs/s) againstthe ISD for different speed values.
Fig. 5. Handover Failure Ratio (HOFR)in % against the ISD for different speedvalues.
A Simulation Study on LTE Handover and the Impact of Cell Size 7
Au
tho
r P
roo
f

due to the poor UL radio conditions for UEs close to cell borders in large cells. Notablyat medium to high ISDs, higher failures are noted for lower speeds, indicating that thelow speed is not enough to “escape” from these areas with poor conditions. F4 (T310expiry before HOcmd reception) is very frequent when ISD is small and low when theISD increases, whereas F5 (RACH failure after T304 expiry) is very frequent for largeISD and very low for small ISDs. The motivation is that, for small cell sizes, the UEsthat are able to transmit the measurement report subsequently move out of the servingcell coverage and thus the HO command, sent by the serving cell, cannot reach the UE.For the RACH failures due to T304 expiry for large cells, the UEs transmitted power atthe border of the cell compromises the success of the handover.
To find an explanation to the different HO failure cases we resort to the uplinkinterference and uplink signal-to-noise plus interference ratio. Below the uplinkinterference-over-thermal noise ratio and the uplink SINR are plotted in Figs. 7 and 8respectively. As we see, low ISD (i.e. 125 m) suffer from sever interference in theuplink since UEs are more likely to be closer to each other. However, these same UEsat lower ISDs suffer from better UL SINR conditions (see Fig. 8), since UEs are closerto the eNBs and thus the received power at those can partially compensate for theinterference. On the contrary, deployments with larger ISD suffer less interference.
The ping pong rate is presented in Fig. 9. Ping pong events reflect the channelvariability conditions, which cause HOs between two neighboring cells given suc-cessive A3 events being triggered. Ping pong events can also appear as the conse-quence of failed HOs to neighboring cells, and the subsequent efforts to reconnect theUE to neighboring cells even if not the most adequate at that time. Accordingly, bothlow and high ISDs seem to be prone to ping pong events due to channel qualityimpairments and subsequent HO failures (as already noted in Figs. 6, 7 and 8). Anequivalent metric to the ping pong rate is that of the mean elapsed time betweenhandovers (MTBH) which is illustrated in Fig. 10. More frequent handovers (i.e. lowerMTBH) is noted for both low and high ISD values for the same reasons explainedabove. As expected, increasing UE speed results in both increased ping pong eventsand lower MTBH.
Fig. 6. Handover Failure Ratio (HOFR) in % against the ISD for different speed values. HOfailure type breakdown: F0…F7.
8 M. Tayyab et al.
Au
tho
r P
roo
f

In the above, we have addressed the HO performance in terms of HOF and its causes.Noteworthy, LTE implements reestablishment and cell reselection mechanisms so as torecover from the suffered failures in the shortest time possible. Hence, noting that duringpart of the HO process, including the reestablishment procedure, the data plane will beunable to deliver packets to and from the UE, it seems reasonable to measure the elapsedtime of this event. To this end, we define the HO interruption time (HOIT) as the timewhereby the user plane is unable to deliver packets to and from the UE.
Figure 11 shows the empirical cumulative density function (CDF) for the HOIT fordifferent UE speeds and fixed ISD of 250 m. We observe how lower UE speeds benefitfrom lower HO interruption times, since fewer failures during the handover process arenoted in this case (see e.g. Fig. 6). Note also how the HO interruption time is lowerbounded thus preventing the curves to reach the 0 ms mark.
Next in Fig. 12 we show the empirical CDF of the HOIT for different ISDs and fora fixed UE speed of 30 km/h. Not surprisingly, HOIT increases both when the ISD is
Fig. 7. UL interference-over-thermal noiseratio for different ISD values. UE speed is30 km/h.
Fig. 8. UL signal to interference plus noiseratio (SINR) for different ISD values. UEspeed is 30 km/h.
Fig. 9. Ping pong rate against ISD fordifferent speed values.
Fig. 10. Mean time between HOs (MTBH)against ISD for different speed values.
A Simulation Study on LTE Handover and the Impact of Cell Size 9
Au
tho
r P
roo
f
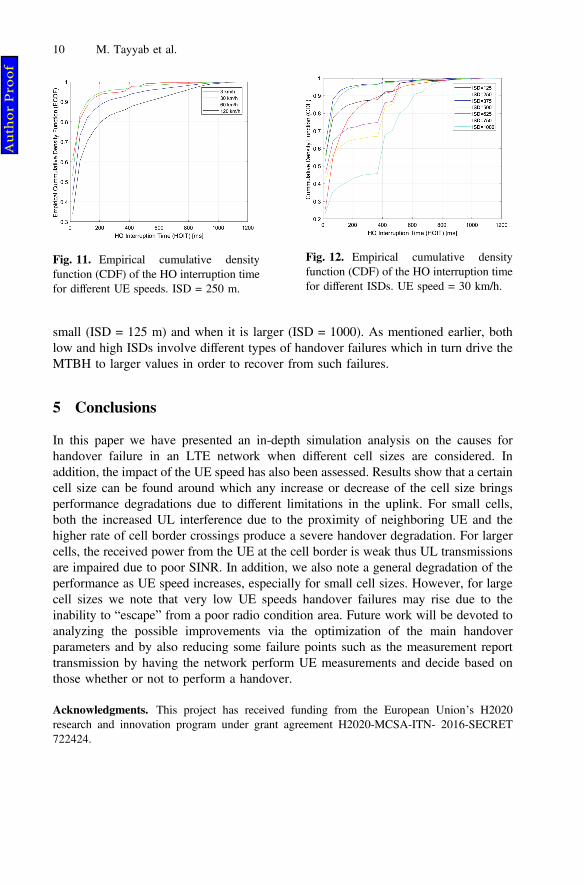
small (ISD = 125 m) and when it is larger (ISD = 1000). As mentioned earlier, bothlow and high ISDs involve different types of handover failures which in turn drive theMTBH to larger values in order to recover from such failures.
5 Conclusions
In this paper we have presented an in-depth simulation analysis on the causes forhandover failure in an LTE network when different cell sizes are considered. Inaddition, the impact of the UE speed has also been assessed. Results show that a certaincell size can be found around which any increase or decrease of the cell size bringsperformance degradations due to different limitations in the uplink. For small cells,both the increased UL interference due to the proximity of neighboring UE and thehigher rate of cell border crossings produce a severe handover degradation. For largercells, the received power from the UE at the cell border is weak thus UL transmissionsare impaired due to poor SINR. In addition, we also note a general degradation of theperformance as UE speed increases, especially for small cell sizes. However, for largecell sizes we note that very low UE speeds handover failures may rise due to theinability to “escape” from a poor radio condition area. Future work will be devoted toanalyzing the possible improvements via the optimization of the main handoverparameters and by also reducing some failure points such as the measurement reporttransmission by having the network perform UE measurements and decide based onthose whether or not to perform a handover.
Acknowledgments. This project has received funding from the European Union’s H2020research and innovation program under grant agreement H2020-MCSA-ITN- 2016-SECRET722424.
Fig. 11. Empirical cumulative densityfunction (CDF) of the HO interruption timefor different UE speeds. ISD = 250 m.
Fig. 12. Empirical cumulative densityfunction (CDF) of the HO interruption timefor different ISDs. UE speed = 30 km/h.
10 M. Tayyab et al.
Au
tho
r P
roo
f

References
1. Gelabert, X., Legg, P., Qvarfordt, C.: Small cell densification requirements in high capacityfuture cellular networks. In: 2013 IEEE International Conference on CommunicationsWorkshops (ICC), pp. 1112–1116 (2013)
2. Anpalagan, A., Bennis, M., Vannithamby, R.: Design and Deployment of Small CellNetworks. Cambridge University Press, Cambridge (2015)
3. Arshad, R., et al.: Handover management in 5G and beyond: a topology aware skippingapproach. IEEE Access 4, 9073 (2016)
4. Arshad, R., et al.: Handover management in dense cellular networks: a stochastic geometryapproach. In: 2016 IEEE International Conference on Communications (ICC) (2016)
5. Lin, X., Ganti, R.K., Fleming, P.J., Andrews, J.G.: Towards understanding the fundamentalsof mobility in cellular networks. IEEE Trans. Wirel. Commun. 12(4), 1686–1698 (2013)
6. Bao, W., Liang, B.: Stochastic geometric analysis of user mobility in heterogeneous wirelessnetworks. IEEE J. Sel. Areas Commun. 33(10), 2212–2225 (2015)
7. Gelabert, X., Zhou, G., Legg, P.: Mobility performance and suitability of macro cell power-off in LTE dense small cell HetNets. In: IEEE 18th International Workshop on ComputerAided Modeling and Design of Communication Links and Networks (CAMAD), pp. 99–103(2013)
8. Yamamoto, T., Konishi, S.: Impact of small cell deployments on mobility performance inLTE-advanced systems. In: 2013 IEEE 24th International Symposium on Personal, Indoorand Mobile Radio Communications (PIMRC Workshops), pp. 189–193 (2013)
9. Ulvan, A., Bestak, R., Ulvan, M.: The study of handover procedure in LTE-based femtocellnetwork. In: Third Joint IFIP IEEE Wireless and Mobile Networking Conference (WMNC),October 2010
10. Sesia, S., Toufik, I., Baker, M.: LTE the UMTS Long Term Evolution: From Theory toPractice, 2nd edn., pp. 503–529. Wiley, Chichester (2011)
11. 3GPP TS 36.300. (E-UTRA) and (E-UTRAN); Overall description; Stage 2 (Release 15),V15.0.0, Section 10, pp. 93–143, December 2017
12. 3GPP TS 36.331. E-UTRA Radio Resource Control (RRC); Protocol specification (Release9), v9.2.0, March 2010
13. 3GPP TR 36.814. Further advancements for E-UTRA physical layer aspects (Release 9),V9.0.0, March 2011
14. 3GPP TS 36.133. Requirements for support of radio resource management (Release 9),v9.15.0, March 2013
15. 3GPP TR 36.839 V11.1.0. Mobility enhancements in heterogeneous networks (Release 11),December 2012
A Simulation Study on LTE Handover and the Impact of Cell Size 11
Au
tho
r P
roo
f