author: hutter, michael j title: sc2 green sand additive ... · pdf file2 hutter, michael j....
TRANSCRIPT

1
Author: Hutter, Michael J
Title: SC2 Green Sand Additive Trial The accompanying research report is submitted to the University of Wisconsin-Stout, Graduate School in partial
completion of the requirements for the
Graduate Degree/ Major: MS Technology Management
Research Adviser: James Keyes, PHD
Submission Term/Year: Spring, 2012
Number of Pages: 42
Style Manual Used: American Psychological Association, 6th
edition
I understand that this research report must be officially approved by the Graduate School and
that an electronic copy of the approved version will be made available through the University
Library website
I attest that the research report is my original work (that any copyrightable materials have been
used with the permission of the original authors), and as such, it is automatically protected by the
laws, rules, and regulations of the U.S. Copyright Office.
My research adviser has approved the content and quality of this paper.
STUDENT:
NAME Michael Hutter DATE: 5/6/12
ADVISER:
NAME James Keyes, Ph.D DATE: 5/10/2012
----------------------------------------------------------------------------------------------------------------------------- ----
This section for MS Plan A Thesis or EdS Thesis/Field Project papers only
Committee members (other than your adviser who is listed in the section above)
1. CMTE MEMBER’S NAME: DATE:
2. CMTE MEMBER’S NAME: DATE:
3. CMTE MEMBER’S NAME: DATE:
----------------------------------------------------------------------------------------------------------------------------- ----
This section to be completed by the Graduate School
This final research report has been approved by the Graduate School.
Director, Office of Graduate Studies: DATE:

2
Hutter, Michael J. SC2 Green Sand Additive Trial.
Abstract
This research was done to reduce sand inclusions that were creating higher scrap rates in a
foundry. To improve the scrap rate the Six Sigma DMAIC model was used. After reviewing the
data it was determined that the biggest contributor to scrap defects was sand inclusions. To
combat this issue a sand trial was run with a sand additive to determine if that would decrease
sand inclusions in the scrap rate. The conclusions of this study discuss the possible reasons for
the data that was obtained and possible steps for the future.

3
Acknowledgments
I would like to thank my adviser Dr. James Keyes for his dedication, patience, and
persistence. I would also like to thank Scott Honeyman and Carpenter Brothers Inc. for their
support and assistance on the sand trial. Finally, I would like thank my wife Louise and my son
Brad for their love and support with everything.

4
Table of Contents
.................................................................................................................................................... Page
Abstract ............................................................................................................................................2
List of Figures ..................................................................................................................................6
Chapter I: Introduction ....................................................................................................................7
Statement of the Problem .....................................................................................................8
Purpose of the Study ............................................................................................................8
Assumptions of the Study ....................................................................................................9
Definition of Terms..............................................................................................................9
Limitations .........................................................................................................................10
Methodology ......................................................................................................................11
Chapter II: Literature Review ........................................................................................................13
Chapter III: Methodology ..............................................................................................................22
Define .................................................................................................................................22
Measure ..............................................................................................................................23
Data Collection ..................................................................................................................24
Sand Testing.......................................................................................................................25
Data Analysis .....................................................................................................................28
Control ...............................................................................................................................29
Summary ............................................................................................................................30
Chapter IV: Results ........................................................................................................................31
Results of Define Phase ....................................................................................................31
Results of Sand Trial .........................................................................................................33

5
Results of Analyze Phase ..................................................................................................36
Summary ...........................................................................................................................36
Chapter V: Discussion ...................................................................................................................37
Recommendations ...............................................................................................................37
Limitations .........................................................................................................................39
Conclusions and Implications ............................................................................................40
Further Research Recommendations ................................................................................40
Summary ...........................................................................................................................41
References ......................................................................................................................................42
6
List of Figures
Figure 1: Example of checksheet of a scrap casting report..……………………………23
Figure 2: Quality Results of data collected during casting this…………………………25
Figure 3: Control Defects Data………………………….....……………………………32
Figure 4: Control Data……………………………………..……………………………33
Figure 5: SC2 Trial Run Data……………………………...……………………………33
Figure 6: SC2 Defect Data..……………………………………..………………………35

7
Chapter 1: Introduction
Pier Foundry & Pattern Shop, Inc. is a family owned and operated job shop that was
established in 1889 under the name of Johnson Foundry. The foundry changed hands around the
time of the First World War when the name was changed to Pier Foundry. The original foundry
is one of the oldest Twin Cities foundries still in operation. When Pier Foundry & Pattern Shop,
Inc. was established it was a small wooden structure with cupola melting, as was common during
that time period. Cupola melting is when a furnace is used for melting iron or other metals in a
large quantity and is mainly used in foundries or steel works.
While the foundry started with cupola melting over a century ago, there are now a variety
of services offered. Pier Foundry & Pattern Shop, Inc. services currently include a pattern shop,
a core department, a molding department, a cleaning and grinding department, a testing and
quality department, and a machine shop. There are currently 93 employees working at the
foundry. Pier Foundry has the capability of producing castings that range in size from ounces to
one thousand pounds. They can also complete production runs from a single piece up to twenty
thousand pieces. The production time ranges from two to four weeks. Pier Foundry is an
International Standards Organization (ISO) certified provider of grey iron, ductile iron and
austempered ductile iron castings.
Pier Foundry is currently owned by the Grilz family. The company has been in the
family for three generations, with the fourth generation currently working for the company. The
president, Matt Grilz, has worked many positions in the company and had the opportunity of
working alongside with his grandfather, a pattern maker, before he retired. This experience has
allowed Matt to skillfully and effectively learn the trade as well as the business.

8
The company has evolved significantly over the years. While Pier Foundry started as a
small stove grate foundry, the company has become a highly automated production foundry.
Today Pier Foundry is one of the most efficient and modern jobbing shops in the Upper
Midwest.
With over one hundred and twenty years of manufacturing experience, Pier Foundry has
a rich history and understands that experience is invaluable. They have also taken the initiative
to invest in the future by embracing change and new technology to continue to expand and grow.
As with any manufacturing facility, producing quality products is an important part of the
process. Pier Foundry offers both green sand and no bake molding. With green sand molding
there is the possibility of the sand corrupting the casting making it an unusable product or scrap,
also referred to as sand inclusion.
Statement of the Problem
Pier Foundry has scrap castings and is continually looking at ways to reduce their scrap
rate. The biggest contributor to sand inclusions occurs in the iron castings during the production
process. When there are sand inclusions in the castings they cannot be sold. Creating castings
that cannot be sold because of sand inclusions cuts into the company’s profit margin. This cost
can be measured in both production time and iron scrap costs.
Purpose of Study
The purpose of this trial was to evaluate the results of a supplier’s additive to determine if
it could decrease the number of sand defects that Pier Foundry sees in the production of castings.
Reducing the number of defects is important for several reasons. First, it will increase
production capacity; second, it will reduce lead times; and third, it will increase the percentage of
on time delivery.

9
This trial was performed under normal operating conditions. This means that the trial
was run on a normal production day and was supervised by the performance of the machines.
Prior to running the trial, sand conditions were checked with the company’s standard operating
lab tests. To ensure quality, a second sample was taken and sent to an outside lab for control
purposes. The same tests were performed multiple times during the trial, and a second sand
sample was taken to send to an outside lab for independent testing. At the conclusion of the test
several of the results were discussed. The sand test results were reviewed as well as the physical
condition of the parts run during the test.
Assumptions of the Study
This study assumed that there was a more effective way to create iron castings with sand
moldings to have fewer sand inclusions. While the current method does provide the quality
needed to meet the customer’s demands, there was a cost associated with the scrap that was
made during the production. This study based the results of past scrap percentages compared to
this experimental production run and the results that were produced after several trials.
Definition of Terms
Castings. A product made when iron is poured into a mold.
Data. “Factual information used as a basis for reasoning, discussion, or calculation;
often refers to quantitative information.” (Harry, 1997 p. K.3)
Defect. “Any instance or occurrence where the product or service fails to meet customer
requirements.” (Pande et al, 2000, p. 395)
DMAIC. “Acronym for a Process Improvement/Management System which stands for
Define, Measure, Analyze, Improve, and Control; lends structure to Process Improvement,
Design or Redesign applications. (Pande et. al., 2000, p. 396)

10
Green Sand Molding. Process of a machine packing Green Sand around a pattern to
make a mold.
Green Sand. A mixture of sand, bond, and water used in molding.
Pareto Diagram. “A chart which ranks, or places in order, common occurrences.”
(Harry, 1997 p. K.5)
Process Improvement. A documented process that is continually monitored to ensure
that measures are providing information to continue improvement.
Quality. “The characteristics of a product or service that bear on its ability to satisfy
stated or implied needs.” (Summers, 2003 p. 725)
Sand Inclusions. A surface defect on the casting from loose sand in the mold.
Scrap. A casting that does not meet the quality level needed to be sold.
SC2. A sand additive that is a mixture of Red Iron Oxide and Dextrin.
Six Sigma. “1. Level of process performance equivalent to producing only 3.4 defects for
every one million opportunities or operations. 2. Term used to describe Process Improvement
initiatives using sigma-based process measures and/or striving for Six Sigma-level
performance.” (Pande et. al., 2000, p.403)
Variation. “Any quantifiable difference between individual measurements; such
differences can be classified as being due to common causes (random) or special causes
(assignable).” (Harry, 1997 p. K.8)
Limitations of Study
This trial was limited by the amount of sample material that was available. It was also
limited due to the production schedule. Pier Foundry & Pattern Shop, Inc. was not able to dictate
which machine received the treated sand. In order to overcome this, all machines were run on

11
the SC2 additive once the trial began. The workers adding the SC2 additive had to overcome
several adverse conditions in the Muller Room making it difficult to add the material into the
system. Some of the adverse conditions included high level of airborne particulate, tight
working space, a limited amount of time between batches, and having to lift material above the
head multiple times.
Methodology
The method used for this sand trial was a Six Sigma tool known as DMAIC (Define,
Measure, Analyze, Improve, and Control). This tool was chosen because it takes a logical
systematic approach to solving a problem using facts from start to finish. In the define stage the
current defect data was analyzed. This was done to determine which defect was the biggest
contributor to scrap. After the data was collected, the different defects were discussed in our
scrap meeting. After the meeting the scrap team discussed the data and started working on the
solution for the biggest factor.
The second phase in Six Sigma is the measure phase. In this part of the process the
defect was studied from several angles. The approach was used to determine what was really
causing the problems that were being seen. Any foundry’s green sand system is very complex.
This complexity must always be kept in balance or the green sand system will cause production
trouble. There are tradeoffs in the sand system, properties have to be given up in order to gain
results in a different area. This issue was compounded with the diverse machines that are being
run. An example of this was that some machines prefer drier sand and some machines prefer
wetter sand, in order to produce exceptional results.
After the trial was run and the data was collected the trial moved into the next Six Sigma
phase, the analyze phase. During this part of the trial the sand test results were reviewed. The

12
information gathered during the trial run was discussed to interpret the results. Also, the data
that had been collected from the castings that were run on the machines during the trial were
analyzed. Along with the effectiveness of the SC2 additive (a sand additive that is a mixture of
Red Iron Oxide and Dextrin,) the analysis had to determine if using this would be cost effective
in the existing system.
The next Six Sigma phase is the improve stage. At this part of the trial the data on how
the production had run was reviewed. Another review included what could have been done
differently to produce better results. The data that was gathered was reviewed to determine what
the next step should be. Some of the options included whether a sand additive (SC2) should be
used, run another trial, try something else, or continue on the current path. At this point during
the trial the data gathered from the analyze phase was combined with this stage. The combined
data was thoroughly reviewed. This combined data drove the decision into the control phase.
In this last stage of Six Sigma, the control phase, the recommendations from the previous
step were taken and monitored. Samples were continued to be sent out for analysis. The results
of these analyses were tracked to monitor the changes that were made based on the previous
stages. Continuous improvement was an ongoing challenge and will be continued by trying new
ideas and products to produce the company and its customers the best product.

13
Chapter II: Literature Review
Each green sand system is unique, and in order to prepare for the sand trial research was
done to understand how the quality process would be controlled. There are many different items
that can be adjusted in the green sand system. Finding the right combination that would give the
most benefit and works well at an acceptable cost takes research and trials. It does not work to
simply state that because Company A uses product X and had good result that if Company B
uses product X the same good results would occur. Several things were studied and the DMAIC
model was used to ensure that the trial would run successfully, and the results analyzed for
success before the implementation would occur.
DMAIC
Quality control is an important focus in any manufacturing industry. In an effort to
duplicate an object in a consistent manner several methods have been developed over the years.
One way a foundry researches ideas for continued improvements is by using a process called Six
Sigma. The DMAIC Six Sigma improvement model has 5 parts. The following summary of Six
Sigma is based on “The Six Sigma Way,” by Peter S. Pande, Robert P. Neuman, and Roland R.
Cavanaght (2000). The DMAIC model applies both process improvement and process
design/redesign the theories.
Define. The first stage of the DMAIC process is define. The process improvement part
of this model includes identifying the problem. The process design/redesign part of this model
can be either a broad overview of the problem or specific to one part of the problem. Another
process improvement part is defining requirements. The third part of define process is setting a
goal. In the process design/redesign piece clarifying the scope and customer requirements is
required. (Pande, et. al., 2000).

14
One way to analyze data is to use a Pareto chart. “The Six Sigma Revolution,” by George
Eckes (2001) discusses the beneficial information that can be learned from data that is shown by
using a histogram. A Pareto chart is a chart that arranges data from highest to lowest. Ekes uses
an example by using the Pareto chart to determine why clients are late in paying bills. When
reviewing the data in the Pareto chart they were able to learn that the reason was attributed to
Free Loan. (Eckes 2001)
Measure. The second part of the DMAIC Six Sigma improvement model is measure.
One part of the process improvement piece is validating the problem or process. Another part is
refining the problem or goal. The third piece is measuring the key steps or inputs. The process
design/redesign part of the measure step has two parts. The first is measuring performance
requirements already defined. The second is gathering process efficiency data. (Pande, et. al.,
2000).
There are several methods for collecting data. “Quality” by Donna S.C. Summers (2003)
gives two examples. The first example is a check sheet. This is a list of defects or problems that
are being looked at and every time that defect or problem happens a check is listed by it and then
totaled. (p. 42) The check sheet is effective because it is an easy way to accurately track data.
The second example given by Summers (2003) is another example of a Pareto Chart
showing the number and they type of problem or defect being monitored.
Analyze. The third piece of DMAIC Six Sigma improvement model is analyze. The
process improvement part of analyze can be summarized in three parts. The first part is
developing a hypothesis. The second part is identifying root causes. The third is validating the
hypothesis. The process design/redesign part of analyze has three main parts. The first part is to

15
identify best practices. The next part is to assess the process design. The third part is to refine
the requirements. (Pande, et. al., 2000).
Eckes (2001) discusses three phases to root cause analysis. They are open, narrow and
close. Open root cause analysis consists of brainstorming to come up with all the possible ideas
that could explain the problem. Narrow root cause analysis consists of looking at all the possible
ideas and reduces them down to a manageable number of possible solutions. Close root cause
analysis consists of looking at the list generated by the narrow root cause analysis, and reducing
them down to a vital few. (Eckes 2001) Eckes states that the only way to properly complete an
analysis is for all three sections to be complete otherwise, the problem is missing an area of focus
and the correct solution will not be found.
Improve. The fourth piece of the DMAIC Six Sigma improvement model is improve.
Part of the process improvement piece is to develop ideas to remove root causes. Another part is
to test the solutions. The last part is to standardize solutions and then measure results. The
process design/redesign part of measure has two parts; the first being to design a new process,
which includes challenging assumptions and trying creative solutions. The second part is to
implement the new process, structures and systems. (Pande, et. al., 2000).
This phase is when the ideas that have been formulated are put into action. This is
important because it takes the ideas and data that have been previously collected and acts upon
them to make change. After putting the solution into action the results are reviewed. If no
improvements are made, going back and identifying another solution would need to be done. If
there are improvements made the next phase of the DMAIC model would be utilized.
Control. The last piece of the DMAIC Six Sigma improvement model is control. One
part of the process improvement piece is establishing a standard measurement to maintain

16
performance. The other part is to correct problems as needed. The process design/redesign part
of measure also has two parts. The first part is to establish measurements and reviews to
maintain performance. The second part is to correct problems as needed. (Pande, et. al., 2000).
Once a solution has been determined it is important to have guidelines or procedures to
follow to ensure that the performance is maintained. After going through the process most
procedures are standardized. (Eckes, 2001)
A foundry’s green sand system is as unique as the foundry itself. In other words not
every foundry can run the same sand properties successfully; the properties of the sand must be
tailored to each individual foundry. The ultimate goal is to make a quality product at the lowest
price and how each foundry reaches this goal is up to them. One of the most common ways
foundries do this is by using supplementary additives and clay modifiers, which will be
discussed in more detail.
Carbon Additives
One example of a carbon additive is seacoal. Seacoal is a bituminous coal. “The
material is called ‘seacoal’, because years ago in Great Britain, it was obtained from mines that
extended from the land to a coal seam underneath the sea.” (Frink, 2004, p. V-1) When seacoal
comes in contact with molten metal it heats up and cokes causing it to expand and fill in the gaps
between the sand grains. Cokes or coking is a term used to describe the expansion that occurs to
the coal when it is heated. This is helpful in preventing burn-in and also can give the casting a
better surface finish. One of the downfalls of seacoal is the amount of volatile matter that is
given off when it burns, and it is this reason that foundries are trying to find an additive to
replace or reduce the amount of seacoal that is being used.

17
Another example of a carbon additive is causticized lignite. Causticized lignite is a softer
and more friable form of coal that is also more fibrous than seacoal. Because of this fibrous
property it also has a greater ability to absorb moisture similar to the way cellulose absorbs
moisture. Causticized lignite also reduces the viscosity of the system thus increasing the
flowability of the sand which allows the system to run higher clay levels. “Because of
causticized lignite’s ability to reduce viscosity, it is strongly suggested that the material be used
as an additive to sand systems using Western bentonite as the principal clay component.” (Frink,
2004, p. V-3)
A third example of carbon additive is Gilsonite. Gilsonite is a hydrocarbon that is high in
volatiles, twice the amount of seacoal. Gilsonite does not coke like seacoal so it will not expand.
Gilsonite has a high level of volatiles that can improve surface finish. (Frink, 2004, p. V-3)
A fourth example of carbon additive is cellulose. Examples of cellulose are wood flour,
cob flour, rice hulls, peanut shells, and oat hulls. Cellulose-containing materials are water-
absorbent rather than water-soluble. They will absorb the “free water” and keep it from
participating in the clay/water relationship. They also coat the sand grains disrupting the
structural integrity and hinder the formation of strong clusters. “System sands that contain
cellulose exhibit better “static flow”. This is the flow of material without an external force.”
(Frink, 2004, p. V-4) The use of cellulose is reported to improve flowability, improve mold
collapsibility at shakeout, control expansion defects, and reduce hot tears and cracks.
A fifth example of carbon additive is cereals and starches. “Cereal additives are
produced by processing cereal grains to obtain flours partially composed of water-soluble
starches and dextrins.” (Frink, 2004, p. V-4) Cereals combine with the “free water” and act like
a glue between the clay and sand improving the green strengths. Care must be taken not to use

18
too much or gas pinholes may become a problem. The gas is from the cereal breaking down from
the heat of the molten metal during pouring and solidification. “System sands that contain
cereals tend to have better “dynamic flow”. This is the flow of the material under an external
force, such as a squeeze head.” (Frink, 2004, p. V-4) Other characteristics of using a cereal are
an increased stiffness, reduced friability, and an increase in the sand’s ability to draw pockets.
A sixth example of carbon additive is Dextrin. Dextrin is a sugar-based material that is
very water soluble but does not add as much strength as a cereal. Dextrin will move with the
moisture from the interior to the exterior of the mold, hardening and strengthening the surface of
the mold as it air dries.
A seventh example of carbon additive is glutrin and goulac. Glutrin and goulac are trade
names of a byproduct of the paper industry that acts much in the same ways as dextrin.
SC2
This is a dextrin based additive that is manufactured by John Winter & Company Ltd. Per
their website is a list of the properties:
Improves the moulding properties of Greensand
Reduces friability and moisture loss
Promotes improved pattern strip and better mould quality
Increases permeability and improves surface finish
Vastly reduced sand inclusion defects (John Winter & Company LTD, n.d,
retrieved January 11, 2012)
Since the SC2 additive is a relatively new product there is no data available that shows results
from a study.

19
Clay
Clay is used as a bonding agent and there are there are two main types. Western
(Sodium) Bentonite does not absorb water fast, but once it is absorbed it holds the water longer.
Southern (Sodium) Bentonite absorbs water fast, but once it is absorbed the water evaporates
quickly. Western Bentonite “increases sand durability and toughness, and molds made with it
develop sharp, strong mold edges and corners.” (Frink, 2004, p. III-5) Southern Bentonite
improves the flowability of the sand into the mold. By improving the flowability of the sand,
blow pressure can be reduced which means the molds are harder packed with less pressure.
(Frink, 2004, p. III-5) Because of the unique properties of each clay, most foundries use a
combination of each depending on the end product.
Clay Modifiers
An example of a clay modifier is Soda Ash and Sodium Hydroxide. Soda Ash is
generally used for the following reasons:
To reduce or minimize the encapsulation of additives and inert fines.
To control pH, by allowing the sand system to perform in a somewhat basic
environment. (Bentonites react best in a somewhat basic environment.)
To control variations in water quality.
To assist dispersion of bentonite and to reduce large clumping at shakeout. (Frink, 2004,
p. V-5)
Clay producers have been working to improve the properties of their clay to reduce the need
for these additives, but sodium carbonate (soda ash) and sodium hydroxide are effective at
raising the pH value of the sand system. These additives have been more effective in the cases

20
of thin-section castings; in the case of thick-sectioned castings they may have a tendency to
increase burnt-on sand and metal penetration.
Sand
“In order to make a green sand mold, it is necessary to have, at a minimum, three
ingredients: sand, water, and binder (clay).” (Frink, 2004, p. I-1) Sand is the main ingredient in a
green sand mold. There are several types of sand that can be used and several things to consider
when choosing sand and the general requirements for the foundry industry are:
Thermal and dimensional stability at the temperature of casting (usually above the
melting point of metal)
Correct particle size and shape
Correct distribution of particle size
Chemically inert to molten metals
Consistent chemistry, pH, and cleanliness
Readily available (i.e. inexpensive)
Free from volatiles that could produce gas defects in castings (Frink, 2004, p. I-1)
While there are several types of sand, this review will focus on Silica. This is the sand
that was used in this particular trial. This is the main type of sand that most foundries use when
making molds. Silica sands are the most abundant sand found in nature, therefore making it one
of the most cost effective sands. “In the United States, silica sand is often divided into two
types, lake sand and washed silica sand.” (Frink, 2004, p. I-2) Most lake sand in the United
States is mined from the Great Lakes and requires little processing. The sands that are mined
from the Great Lakes tend to be angular to sub-angular in shape. There are three ways of
describing foundry sands. The first is sub angular and is referred to as LSSA-Low silica content.

21
The second is round grain and called HSR-High silica content. The last is sub-angular to angular
and referred to as HSSA-High silica content. Most foundries that use a green sand system use
sub-angular sand. This is because this shape of sand does not have sharp edges and have more
grain to grain contact than some of the other sands. (Frink, 2004)
Summary
The sand system is the heart of the foundry and keeping it in control is critical to making
a quality casting. On the surface it is a very simple process: add sand, clay, water, and mix; from
there it starts to get complicated. Very subtle changes can produce a 2% scrap rate to over 15%
scrap rate. The main goal is to have a robust system that can handle minor changes without
seeing dramatic effects, and the proper controls in place to give you signs for when you need to
make changes. One of the ways of making a green sand system more robust is by the use of
additives. Each additive has its own set of strengths and weaknesses and you need to choose
those that are right for each given situation. The more robust the system, the less of a need there
will be to adjust for external changes such as temperature, humidity, sand to metal ratio, type of
molding machine, etc. Just because an additive is supposed to help with certain properties
doesn’t mean that it always will, and as stated before, every green sand system is different. Each
company will need to be careful when doing the root cause analysis because defects that appear
to be the same may actually have different root causes.
In the following chapter the study will show how the DMAIC model was used in the
stand trial to define the problem, measure the data, analyze the data, and make improvements.
By utilizing the DMAIC model each stage can be reviewed in detail to determine what the next
step should be.

22
Chapter III: Methodology
This study focused on casting defects, the main issue being sand-related defects. There
are many different causes of sand-related defects and there are many different ways to prevent
them. One way to help prevent a sand-related defect is to use a sand additive. There are several
different types of sand additives.
Many of these sand additives were reviewed to see what may help increase the robustness
of the “sand system”. By increasing the robustness of the sand system the margin of error
becomes better. Increasing the margin of error allowed for in the system will decrease the
number of defects that came out of the system.
In a jobbing shop it is important to have as much robustness as possible built into the
system. This is because of the wide array of jobs that are run on a daily basis. It is much more
difficult to get a job to run perfectly when the number of parts produced is very low, while, it is
easier to get a job to run well when it is on the machine several times a year and has higher
volume runs. This enables more data to be collected to help focus on the area that needs
improvement.
The sand trial that was done was based on data that indicated the highest defect in the
jobs run was due to sand inclusions. Once this problem was identified it was decided to try a
sand additive, SC2 in this case, to see if that additive would reduce the amount of sand defects.
The data was collected and analyzed to see if the SC2 additive was a cost effective solution to
reducing sand defects in both small and large jobs.
Define Phase
The DMIAC model applies both process improvement and process design/redesign
theories. The process improvement part of this model includes identifying the problem. To

23
define the problem, data from previously run jobs was used. This data determined that the
biggest contributor to defects was sand inclusions. The data used from previously run jobs also
determined which jobs were ideal to run during the sand trial. These jobs were jobs that already
had a history of sand defects and had previously collected data.
Below is the blank checksheet (Figure 1) that the data is entered into. From this, data
was tracked including the amount of scrap from each day and each part number. Also this data
was used to calculate the lost sales dollars. This checksheet was filled out throughout the day to
keep the data up to date and to give the needed feedback to the production scheduling.
SCRAP CASTINGS REPORT
date
Gr
ay
or
Du
cti
le
Or
de
r Q
ty.
Da
te
Cu
sto
me
r
Pa
rt
Nu
mb
er
Mo
ld M
ac
hin
e
Sc
ra
p Q
ty.
Un
it P
ric
e
To
tal
Ca
sti
ng
We
igh
t
Sc
ra
p W
t.
Ba
d C
or
e
Blo
w
Br
ok
en
Co
ld I
ro
n
Cr
us
h
Ga
s
No
Co
re
Po
ur
ed
Sh
or
t
Ru
n O
ut
Sa
nd
In
Mo
ld
Sh
ift
Sh
rin
k
Sla
g
Sw
ell
Te
ar
Up
Oth
er
O=
Ov
er
ru
n;
S=
Sa
mp
le
Figure 1. A blank checksheet example that tracks the amount of scrap after a job was run
on the green stand system.
Measure Phase
This study used DMIAC model and methodology to help collect and then process the
data used for the study. The sand trial was run to help determine the root problem of sand
defects and to see if an additive would decrease the amount of sand defects. This was measured

24
by the amount of scrap produced after the jobs were run. There were no variations that needed to
be taken into account.
After the data was collected, it was charted to see if the same defect was the major
contributor; the percentages of the defect were also calculated to see where the defect rate was
before and after the trial. If there is an improvement above the normal variation then the cost
will need to be calculated to see if the additive is actually a cost effective solution to the
problem.
Data Collection
In order to make sure all of the data was collected properly there were several
departments involved in the process. Two people measured and added the SC2 additive to the
return sand belt that feeds the Muller. One person supervised the jobs being run on the machine.
Two people collected the data in the laboratory. The last person involved was the person at the
end of line where the parts come off the line to be cleaned; this person helped to sort out the
defective parts from the good parts.
As the test was being run the two people in the lab were responsible for making
adjustments to the Muller controls as needed. In this sand trial, operators were not able to keep
ahead of the adjustments due to time restraints. The testing is standardized so that the sand is
taken from the same spot each time. There are also guidelines to ensure that the sand is taken
and tested within a certain time frame to ensure that the sand has not dried out which would
adversely affect the testing. The equipment used had all been calibrated so that the testing done
remained constant.
When the SC2 additive was introduced to the green sand system, it brought the moisture
level down. It also brought down the compactability and green strength. In order to correct the

25
moisture level, the compactability at the Hartley control center was adjusted to bring up the level
of moisture. The result brought up the compatibility, but did not help the green strength. The
green strength continued on a downward trend throughout the trial.
Date Time temp.˚ Machine Compact Moisture Green Avail. Working Spec Meth Muller Perm Comments
Strength Bond Bond Weight Blue Eff. Test
Figure 2. An example of the data collected during a job being run on a green sand
system by the lab to track quality results.
Sand Testing
The process for completing the sand testing is based on industry standards. The following
is the testing that Pier Foundry and Pattern Shop uses, and was used in this trial. This testing
method is out of their ISO manual. (Garlough, 2003)
The process for Quality Sand Testing – Moisture is as follows:
1.0 Equipment:
-Dietert Moisture Teller-a forced air drying apparatus
-Sample pan (500 mesh filter bottom) and lifting spoon
-Ohaus scale- Weight scale weighing to +/- .01 gram
2.0 Test Procedure:
1. Obtain a representative sample from one of the molding lines. The sample is
collected with a gallon covered plastic can and tested promptly.
2. Tare scale with sample pan on it.
3. Weigh up 100.00 grams of sample while spreading out thin and evenly.

26
4. Remove sample and pan to dryer and dry at temperature for 4 minutes or as needed to
achieve constant weight.
5. Remove from dryer and promptly weigh.
6. This sample may be saved for further testing such as MB clay, LOI, or AFS clay.
3.0 Calculation of Results
Initial weight-final weight= % moisture
e.g. 100.00 -96.40=3.60%
The process for Quality Sand Testing – Compatibility is as follows:
1.0 Equipment:
-AFS standard sand rammer
-Standard specimen tube, base cap, and stripping post
-Parting agent and swab
-Tube filler accessory with #4 sieve and strike-off blade
2.0 Test Procedure:
1. Swab and clean specimen tube and base.
2. Assemble and place under tube filler.
3. Spoon rough amount of sand specimen onto sieve and carefully riddle sand with side
to side motion to fill tube to overfull.
4. Gently strike off excess sand.
5. Gently and carefully transfer full tube to sand rammer, raising rammer to set in place.
6. Gently lower rammer.
7. Compact with 3 revolution of handle (allowing hammer to fall freely).

27
8. Specimen is removed and set on display shelf. Compatibility % is read from shelf
ruling and recorded.
The process for Quality Sand Testing – Compression Strength Green Sand is as follows:
1.0 Equipment:
-AFS standard sand rammer
-Standard specimen tube, base cap, and stripping post
-Parting agent and swab
-weighing/funnel pan
-Dietert Universal Tester
2.0 Test Procedure:
1. Swab and clean specimen tube and base.
2. Tare out scale with weighing pan.
3. Spoon amount of sand onto pan to make 2” high sand test sample. This amount is the
specimen weight.
4. Remove weighing pan and sand from scale and transfer to specimen tube. This sand
is carefully jarred off and brushed off weighing pan into specimen tube.
5. Gently and carefully transfer tube to sand rammer, raising rammer to set in place.
6. Gently lower rammer.
7. Compact with 3 revolution of handle (allowing hammer to fall freely).
8. Specimen should be 2.00 inches high judged by measurement scale on rammer.
9. This specimen is place in Tester. Magnetic indicator is set at zero on testing arm.
Tester is turned on and loaded to failure of sand specimen.
10. Record measurement off dry compression scale of indicator.

28
3.0 Calculations
-Use Bond Calculator to calculate available and working bond; by entering in green
compressive strength, % water, and % compactability.
The above processes were used both before and after the sand trial was completed. This
was done to ensure that the results would be constant and of high quality.
Analysis Phase
In this phase the data that was collected in the sand trial run was reviewed to determine if
there was a benefit to using the SC2 additive in the green sand system. The data that was
gathered was compared with the previously collected data to see if there was an improvement in
the sand related defects.
Part Defect Analysis
Collecting the data on part defects was done by the quality technician that works in the
cleaning department. The Wheelabrator operator visually inspects parts to see if there are any
visible defects. If any defects were present they were placed into a quarantine bin. After the
parts were put into the quarantine bin the quality technician inspected parts for defects. The
quality technician went through the parts and determined what kind of defect the part suffered
from, the quantity of the defects, and tracked the defects through the use of a database.
Improvement Phase
The Improvement phase in this sand trial run was used to look at the data collected in
both previously run jobs and the job run with the SC2 additive to see if there were alternative
improvements that could be made in the future. The information collected is a part of the
improvement process and included additional sand trials and brainstorming to come up with
other possibilities to decrease sand defects.

29
If no improvement was seen then it would be time to back up and determine why there
was no improvement and also what the next step would be to make an improvement. This would
include going back to the analysis phase and going over the sources of the variation to find the
true root cause of the defect.
Cost of Additive
This sand trial run used half of a pallet of SC2 additive at a cost of 85 cents per pound.
The amount of SC2 additive used for this trial was enough to run jobs for about four hours.
Once the system has been fully treated it would be maintained at a rate of .05% which would be
a cost of $510.00 per day. Prior to running the SC2 additive in the jobs the system would need to
be “slugged” (larger than normal addition rate to treat the entire system). This is needed to raise
the level of the SC2 additive. Once the additive was in the system it would need a smaller
amount to maintain the level for future runs.
Control Phase
The “control” phase reviews the data that was collected during the sand trial run. There
was already an existing process for running the job so the only marked difference between the
two sets of data regarding the sand related defects was whether the job had that SC2 additive or
not. If the trial was a success then the process would need to be modified for the needed
changes. One of the keys to controlling the process changes is regular follow up and monitoring
of the output. Too many times a change is implemented and not followed through to see if it is
effective on an ongoing basis. Data needs to be collected and analyzed on a regular schedule to
keep the changes on track and to verify the effectiveness.

30
Summary
This section focuses on the data that was collected both before the sand trial was run and
during the sand trial. Data was analyzed from previous runs to determine the highest defect rate
which were caused by sand defects. The goal was to see if the SC2 additive would decrease the
percentage of sand related defects in a job. The data was collected was through standardized
testing and the same process was used as the regular testing for the green sand jobs. The cost of
the SC2 additive was considered to see if the cost of the additive would be outweighed by the
reduction of sand defects. This information will be used in determining the next step for future
evaluations and suggestions for further improvements.

31
Chapter IV: Results
This study used the Six Sigma DMAIC model to determine what solutions could be used
to reduce scrap rate. The Pareto chart model was used to determine the biggest contributor to
scrap rate. After researching different ways to improve the scrap rate it was decided to run a
sand trial with a SC2 additive. This was to determine if the additive would decrease the sand
defects that were contributing to the scrape rate. The goal of this trial was to look at the major
contributors to the scrap rate and to see what the best solutions to reduce the scrape rate were.
Sand inclusions in the iron castings during the production process were the biggest factor
in scrap rates and were costing the company both production time and money. The purpose of
this trial was to evaluate the results after using a sand additive to determine if it could decrease
the number of sand defects that were being seen in the production of castings. The expected
results were that the sand additive would decrease the amount of sand inclusions that were being
found in the scrape rate.
Results of the Define Phase
Once the problem was defined a goal was set to reduce sand defects in the green sand
system that has been used. The next step was to look for a solution to this problem; it was
discussed with several suppliers. After that it was discussed with a technical representative. This
technical representative was brought in to go over the green sand system that was currently being
used. After reviewing the process it was decided to try to increase the toughness of the sand. In
order to accomplish this, a sand trial was set up. The goal was to run the sand trial test with a
SC2 additive.
After reviewing the data it was input into a Pareto chart (Figure 1). A Pareto chart is a
quality tool that shows the theory that the twenty percent of the data that has the greatest impact

32
on eighty percent of the data in chart form. The data in the Pareto chart was arranged in most
significant to least significant and after reviewing the data it was determined that the biggest
cause of sand related defects was sand inclusions. Once the problem was defined a goal was set
to reduce sand defects in the green sand system currently being used, so a sand supplier was
contacted and possible solutions were discussed. A technical representative was brought in to go
over the green sand system that was currently being used. The options were discussed internally
and a decision was made to try the supplier’s recommendation of the SC2 sand additive. The
SC2 additive was chosen to see if the additive would decrease sand inclusions and decrease the
scrape rate. The SC2 additive was expected to have a positive impact to decrease the amount of
sand inclusions on a job.
Figure 3. Define stage.
This figure illustrates a Pareto chart used to define the number of defects found in
the scrap and the cause of the scrap defect after a job had been run on the green sand
system. After reviewing the Pareto chart it was determined that the biggest cause of scrap
defects was sand inclusions.
33
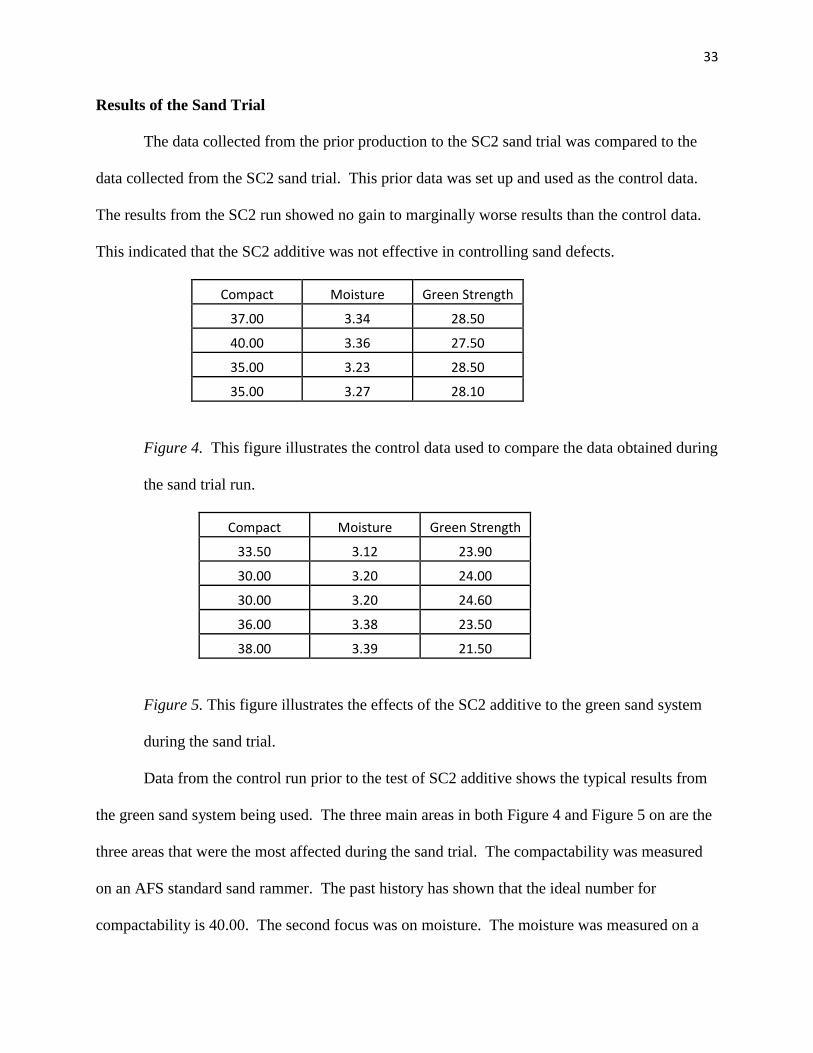
Results of the Sand Trial
The data collected from the prior production to the SC2 sand trial was compared to the
data collected from the SC2 sand trial. This prior data was set up and used as the control data.
The results from the SC2 run showed no gain to marginally worse results than the control data.
This indicated that the SC2 additive was not effective in controlling sand defects.
Compact Moisture Green Strength
37.00 3.34 28.50
40.00 3.36 27.50
35.00 3.23 28.50
35.00 3.27 28.10
Figure 4. This figure illustrates the control data used to compare the data obtained during
the sand trial run.
Compact Moisture Green Strength
33.50 3.12 23.90
30.00 3.20 24.00
30.00 3.20 24.60
36.00 3.38 23.50
38.00 3.39 21.50
Figure 5. This figure illustrates the effects of the SC2 additive to the green sand system
during the sand trial.
Data from the control run prior to the test of SC2 additive shows the typical results from
the green sand system being used. The three main areas in both Figure 4 and Figure 5 on are the
three areas that were the most affected during the sand trial. The compactability was measured
on an AFS standard sand rammer. The past history has shown that the ideal number for
compactability is 40.00. The second focus was on moisture. The moisture was measured on a

34
Dietert Moisture Teller. Past history based on internal specifications have shown the ideal
number for moisture is 3.30. The third focus was on green strength. The green strength was
measured on an AFS standard sand rammer. Internal specifications have shown that the ideal
number for green strength is 28.00.
Figure 5 shows the lab results during the SC2 sand trial. As in Figure 4, the three areas
most affected by the SC2 additive are listed. During the sand trial and adding the SC2 additive it
was determined that the SC2 pulls moisture away from the clay. The SC2 additive is a moisture
scavenger because the SC2 additive takes on the moisture more readily than the clay. Without
moisture the clay is not activated and caused the green strength to drop. As adjustments were
made during the trial more moisture was added to the batch, the moisture levels increased but the
green strength was not able to recover.
The lab data from the control run had an average compactability of 36.75%, moisture of
3.3%, and green strength of 28.15 pounds per square inch (PSI). Moisture and green strength
were both almost exactly at nominal and the compactability was just a few points below nominal,
but based on prior history was still acceptable. The SC2 additive trial data had an average
compactability of 33.5%, moisture of 3.53%, and green strength of 23.5 PSI. While the average
compactability was only a few points lower than the control data, the average score does not tell
the entire story; at one point the score was 10 points below nominal. The past history has shown
that the ideal number, or nominal number, for compactability should be 40.00 PSI. The moisture
level tracked close to the compactability level, which started low and recovered as adjustments
were made. The green strength was the number that stood out during the testing. The green
strength level started out low and instead of recovering continued to decline. While the cause
was unclear, it could have been from the addition rate being too high for the green sand system.

35
The green strength was expected to go down, but also to recover as adjustments were made, not
to continue to decrease. The green strength 23.5 PSI average was cause for concern and the
quality of the run would have to be verified in the castings.
Lab tests always have been a moving target that has been constantly chased as conditions
change. They were not meant to be used as a pass/fail system, but more for guidance; as
something moves away from the target, adjustments are made to bring it back toward nominal.
The deciding factor to whether or not the sand system was in control during the sand trial would
be the castings and the customer’s satisfaction that were purchasing them.
Figure 6 shows the scrape results from the SC2 sand trial.
Figure 6. SC2 Defects.
This figure illustrates that scrap defects that occurred during the sand trial while running
the green sand system with the SC2 additive. The compactability was also affected by the SC2
additive. During the sand trial the compactability decreased. When more moisture was added to
the batch, the compactability was able to recover.
0102030405060708090100
0
20
40
60
80
100
120
140
San
d In
Mo
ld
Shif
t
Shri
nk
Tear
Up
Ru
n O
ut
Oth
er
Cru
sh
Co
ld Ir
on
Bad
Co
re
Blo
w
Bro
ken
Gas
No
Co
re
Po
ure
d S
ho
rt
Slag
Swel
l
SC2 Defects
# Defects
%

36
The green strength had the worst results after the SC2 additive. Even when more
moisture was added and the compactability and moisture levels were able to recover, the green
strength continued to weaken.
Results of the Analyze Phase
The results of the SC2 additive sand trial were put into a Pareto chart, the same type of
Pareto chart as the control data from before the trial. The largest defect by percentage for the
control data from Figure 3 was the sand defects at 33.1%; the largest defect by percentage for the
SC2 additive sand trial from Figure 6 was also sand defects at 37.2%. Not only did the SC2
additive not decrease the percentage of sand related defects, but actually increased the defects
slightly. In both the control data and the data from the SC2 additive sand trial, the sand defects
were the main contributor to the scrap rate.
The difference seen between the control and the SC2 additive could be attributed to
standard variation. It was determined that there was not enough benefit to the SC2 additive after
the sand trial. Since the results were so slight any additional cost would not be cost effective to
future jobs.
Summary
The results from the sand trial were not what was expected. While this was a limited sand
trial, the results indicated that additional SC2 additive trials would not be cost effective. The
additional expenses related to a more inclusive sand trial with the SC2 additive based on the data
to date would not be justified. Based on the limited data gathered other solutions to reducing
sand defects would be recommended.
In the next chapter a summary of the findings of this sand trial will be discussed
including the limitations of the sand trial and recommendations for future research.

37
Chapter V: Discussion
The SC2 additive is a relatively new product in the fact that there were no published sand
trials to review before running this sand trial. The sand trail was run without major disruptions
and went as it had been planned. The information regarding the SC2 additive was obtained thru
the supplier.
While there were no specific trials regarding the SC2 additive, a literature review was
done on other sand trials to broaden the understanding of what types of things would need to be
monitored and reviewed during the sand trial run. With this information and the information
gathered with the DMAIC model a comprehensive understanding of running a sand trial was
obtained.
Recommendations
The lab results showed a decline in the green strength from a 28.15 PSI in the control run
to a 23.5 PSI in the SC2 additive run. While this was a less than desirable result, it did not mean
that the SC2 additive trial was a failure. To determine the results the casting defects must be
looked at. The sand in mold defects during the control run was 33.1% and the sand in mold
defects during the SC2 additive run was 37.2%; these numbers along with the drop in the
average green strength revealed that the SC2 additive was not successful in this instance. If the
SC2 additive were used under similar circumstances, in order to reduce the sand in mold defects,
the green strength would need to be higher.
In days past, before all foundries had standardized lab testing tools, foundrymen used to
mix the sand manually and go by the feel of the sand. One of the things that they were trying to
achieve was to give the sand a “silky” feel. It was a common belief that if the sand felt silky then
it would flow better and make better molds, or so it seemed. When asked to quantify this no data

38
or any sort of answer has even been given to support this belief. During the SC2 additive trial
the machine operators that work with machines and the sand noted that the sand had a better feel
to it, a silky feel and commented that it seemed to fill the molds better. While it was not verified
in this sand trial that the SC2 was effective, there is some data that it may warrant another
attempt.
While the results of this trial do not support the use of the SC2 additive it may have been
more beneficial if this trail would have been run with a different set of control data. The first
recommendation would be to run the trial with parts that have a better run history, an example
would be parts that have had larger runs and have had a history of less sand inclusions. The
main reason for this would be because the better the control data is the more reliable the data.
The more reliable the data is, the easier and more accurate it would be to predict how the control
data would react during the trial.
Another recommendation would be to run a longer sand trial with the SC2 additive. The
goal of a longer run would be to give the system a chance to stabilize. The ideal time would be
long enough to run at least one full run of the sand system, which is about 10 hours. By running
a longer trial it would ensure that the proper settings were being used on the Hartley and the
Muller. This would also provide more data to be reviewed.
Recommendation two would be for an improvement in the delivery system of the SC2
additive. Two issues arose during the trial regarding the delivery system. The first one was
adding the SC2 additive up by the catwalk. There was no scale that could be put up there during
the sand trial. A line was drawn into a bucket so that the same amount of the SC2 sand additive
could be added every time. The drawback to this method was that the line that was drawn in the
bucket became hard to see after the first addition of the SC2 additive. This made it difficult to

39
precisely measure each addition after the first one. If the SC2 additive is going to be added up
by the catwalk a scale to accurately measure the mix is needed. The other solution to this
problem would be to add the SC2 additive into the premix (bond). There would be several
positives by having the SC2 additive premeasured and already in the premix. One main positive
is that the SC2 additive would already absorb some moisture from the clay. This would help
with controlling the moisture levels and the SC2 additive, as it would not be as much of a shock
to the sand system.
The down side of adding the SC2 into the premix is that it would have to be added at the
plant that supplies the premix. This means that a delivery would be a full truck load and the
whole load with the SC2 additive would have to run through the green sand system. If the SC2
additive is added into the premix and the results are unfavorable it is much more difficult to
correct as the SC2 would not be able to be stopped until the premix is fully used.
A third recommendation for future trials would be to reduce the addition amount of the
SC2 that was added. Instead of adding the SC2 at a highest level recommended by the supplier
and “shocking” the system as happened in this trial, add it gradually and start at a lower amount.
By starting with the SC2 additive at a lower amount and then gradually adding it to the sand
system better control would be kept. Another benefit would be that it would be easier to make
and keep ahead of the adjustments if it is a gradual increase.
Limitations
The largest limitation was the limited amount of data that was able to be collected from
running the sand trial. Part of the cause of the limited data was the short amount of time that was
used to run the sand trial with the SC2 additive. Because of the short amount of time there was
only a small number of jobs that could be run, which was approximately four hours of

40
production. During the trial not even half of the sand in the system was treated with the SC2
additive. In a typical shift, which is ten hours, approximately 300 tons of sand is used.
Conclusions and Implications
The findings from the sand trial would indicate that there is not a benefit to using the SC2
additive. Since there was no reduction in the sand inclusions in the scrape rate, there was no data
to support that the SC2 additive is the solution needed to solve the problem. Since the results
when the SC2 additive was used did not show it was effective there will be no change in the
system that is currently being run. Instead of using SC2 additive to decrease scrape rates other
solutions will be sought.
Further Research Recommendations
While the sand trials with the SC2 additive were not positive due to the limitations of the
study, more research on the SC2 additive could be done. By perfecting the delivery system to
ensure a constant amount of SC2 additive is used the data would be more accurate and any trends
in the data would be easier to identify.
Starting with a smaller amount of the SC2 and gradually adding it to the sand system
would be the easiest way to properly gauge how the SC2 is reacting to the established sand
system. By incorporating the SC2 gradually into the system it would be easier to adapt to the
changes caused by the additive. This would make it easier to determine what the correct amount
of the SC2 additive would be for the sand system.
By making smaller, less dramatic changes to the existing sand system the results would
be better controlled; the data collected would be of better use. This would be due to the fact that
the smaller changes to the existing system would be easier to control and regulate to get the best
results.

41
Summary
There are foundries that use a SC2 sand additive and it may work well in a different
application. SC2 additive did not work well in this trial and it could be because of some of the
issues that were previously stated. This trial is a good point to start at looking into SC2 additive
but there is much more that needs to be looked into and tested. Foundries are always trying to
come up with cost effective solutions to making ever increasingly difficult castings while
keeping the quality at a high constant level. Just because SC2 additive did not work for this trial
does not mean that it will not work well in a different sand system, running different machines,
and making different parts. There are just too many variables that come into play in different
green sand foundries to base overall performance on one sand trial.

42
References
Eckes, George (2001) The Six Sigma Revolution: How General Electric and Others Turned
Process into Profits. New York: John Wiley & Sons, Inc.
Frink, Karen (2004) Principles of Sand Control. Schaumburg, Illinois: American Foundry
Society, Inc./Cast Metals Institute, Inc.
Garlough, Gary (2003) The Pier Foundry ISO Manual. Minnesota: Pier Foundry & Pattern Shop,
Inc.
Harry W. Dietert Co. (1950) Sand Control. Detroit, MI: Author.
Harry, Mikel J PH.D (1997) The Vision of Six Sigma: Tools and Methods for Breakthrough.
Arizona: Tri Star Publishing
Harry, Mikel J PH.D (1997) The Vision of Six Sigma: Application Resources.
Arizona: Tri Star Publishing
John Winter Foundry and Dental Supplier. (n.d.) John Winter Foundry and Dental Supplier.
Retrieved January 11, 2012, from http://www.johnwinter.co.uk/
Pande, P. S., Newman, R. P, & Cavanagh, R. R. (2000) The Six Sigma Way: How GE, Motorola,
and Other Top Companies are Honing Their Performance. New York: Mc-Graw Hill
Summers, Donna C.S. (2003) Quality: Third Edition. New Jersey: Prentice Hall.