australia's state of the forests report 2008...australia’s state of the forests report 2008...
TRANSCRIPT

Prepared by the Montreal Process Implementation Group for Australia on behalf of the Australian, state and territory governments
Australia’s State of the Forests ReportFive-yearly report 2008
www.daff.gov.au/forestsaustralia
Funding for this publication has been provided by the Australian Government
Australia’s State of the Forests R
eport | Five-yearly report 2008
Prepared by the Montreal Process Implementation Group for Australia on behalf of the Australian, state and territory governments
Australia’s State of the Forests ReportFive-yearly report 2008
D E P A R T M E N T O F A G R I C U L T U R E , F I S H E R I E S A N D F O R E S T R Y
© Commonwealth of Australia 2008
ISBN: 1 921192 24 0
This work is copyright. Apart from any use as permitted under the Copyright Act 1968, no part may be reproduced by any process without prior written permission from the Commonwealth. Requests and inquiries concerning reproduction and rights should be addressed to the Commonwealth Copyright Administration, Attorney-General’s Department, Robert Garran Offi ces, National Circuit, Barton ACT 2600 or posted at www.ag.gov.au/cca.
The Australian Government acting through the Bureau of Rural Sciences has exercised due care and skill in the preparation and compilation of the information and data set out in this publication. Notwithstanding, to the maximum extent permitted by law, the Bureau of Rural Sciences, its employees and advisers disclaim all liability, including expense or cost incurred by any person as a result of accessing, using or relying upon any of the information or data set out in this publication.
Postal address:Bureau of Rural SciencesGPO Box 858, Canberra ACT 2601
Copies available from:BRS Publication SalesGPO Box 858, Canberra ACT 2601Ph: 1800 020 157 | Fax: 02 6272 4747Email: [email protected]: www.daff.gov.au/forestsaustralia
Preferred way to cite this publication:Montreal Process Implementation Group for Australia (2008). Australia’s State of the Forests Report 2008.Bureau of Rural Sciences, Canberra.
Author:Montreal Process Implementation Group for Australia
Edited by: Biotext, Canberra
Cover and title page logo: Logo of the Montreal Process Working Group on Criteria and Indicators of the Conservation and Sustainable Management of Temperate and Boreal Forests
Cover photo: Northern NSW forest at dawn, iStockphotoBack cover photos: Michael F. Ryan
Graphic design: Fusebox Design, MelbournePrinted by: National Capital Printing, Canberra
Argyle apple (Eucalyptus cinerea) blossom.
Mic
hae
l F. R
yan
Australia’s State of the Forests Report 2008 iii
Foreword
The nation’s forests are valued for their role in conserving our unique wildlife, sequestering carbon, supplying fresh water and meeting many social and cultural needs. Moreover, forests provide the resource base for industries that employ thousands of people across Australia, particularly in rural and regional areas.
Australia’s State of the Forests Report 2008 is the third report of its kind. It fulfi ls a commitment, made through the 1992 National Forest Policy Statement, to provide the Australian public with a forest sustainability report every fi ve years and meets international reporting requirements under the Montreal process. It canvasses the situation in all the forests of Australia, including the tall forests of eastern and southwestern Australia and the open forests and woodlands of northern and interior Australia. It provides the most comprehensive review yet of the state of our forests.
This report highlights Australia’s world-class forest conservation reserve network that helps to protect native forests, including more than 70% of known old-growth forests. Moreover, production forests outside this network are subject to a closely monitored sustainable forest management regime. This regime is supported by codes of practice for harvesting and environmental management and, increasingly, by the independent certifi cation of high-quality forest management.
The report shows the important economic contribution from Australia’s forests. The forestry and forest products industries are worth $19 billion yearly, and they directly employ more than 120,000 people nationwide. Other forest-related industries, such as honey production,
ecotourism and handicrafts make substantial contributions to many rural economies. The evidence of the sustainability of these industries contained in this report should encourage us all to use Australian forest products with confi dence and pride.
The report also alerts us to some of the challenges ahead. Predicted changes in climate, for example, could have profound effects on forests, forest production and the incidence and severity of fi re, pests and diseases. The data presented here will help us deal with such challenges.
Australia’s State of the Forests Report 2008 is the result of close collaboration among the governments of Australia. Data collated and published by state and territory agencies provide greater detail about the state of the forests in each jurisdiction and helped inform this report. I thank the many agencies and individuals who contributed.
I hope this report will enlighten community debate about the role, management and future of Australia’s forests. I expect it to be an essential reference for policy makers and the wider community.
Dr Colin GrantExecutive DirectorBureau of Rural SciencesMay 2008
iv Australia’s State of the Forests Report 2008
Acknowledgments
Montreal Process Implementation Group for Australia
The Montreal Process Implementation Group for Australia provided national leadership and coordination for Australia’s State of the Forests Report 2008 (SOFR 2008). Contributing members were Andrew Wilson (Chair), Phil Link and Tony Hunn (Australian Government Department of Agriculture, Fisheries and Forestry – DAFF); Adam Gerrand, Phil Pritchard and Claire Howell (Bureau of Rural Sciences – BRS); John Raison (CSIRO Forest Biosciences); Owen Price (Northern Territory Department of Planning and Infrastructure); Kris Gounder (Forests NSW); Michael Davis (New South Wales Department of Environment and Climate Change – DECC); Detlev Vogt (South Australian Department of Primary Industries and Resources – PIRSA); Graham Wilkinson (Tasmanian Forest Practices Authority – FPA), Peter Taylor (Private Forests Tasmania); Cain Trist (Victorian Department of Sustainability and Environment – DSE); and Geoff Stoneman (Western Australian Department of Environment and Conservation – DEC).
National Forest Inventory Steering Committee
The National Forest Inventory (NFI) Steering Committee compiled key datasets for SOFR 2008. Contributing members were Andrew Wilson (Co-chair, DAFF); Cain Trist (Co-chair, DSE, Victoria); Jenny Boshier (Australian Government Department of the Environment, Water, Heritage and the Arts – DEWHA); Adam Gerrand, Geoff Dunn and Mark Parsons (BRS); Margaret Kitchin (Australian Capital Territory Government Wildlife Research and Monitoring); Mike Welch (Forests NSW); Dave Howe (Northern Territory Department of Natural Resources, Environment and the Arts); Bruce Wilson (Queensland Environmental Protection Agency); Detlev Vogt (PIRSA); Martin Stone (Forestry Tasmania); and Martin Rayner (DEC).
SOFR 2008 Drafting Group
The SOFR 2008 Drafting Group developed the text of the report in partnership with BRS. Participants in the drafting group were Phil Pritchard (Chair, BRS); Phil Link and Andrew Wilson (DAFF); Annette Bleys (DEWHA); John Davidson and Adam Gerrand (BRS); Kris Gounder (Forests NSW); Amy Ho and Detlev Vogt (PIRSA); Gary King (consultant to the FPA); Gordon Hickey, Cain Trist and Dugal Wallace (DSE); and Juanita Renwick (DEC).
Forest Industries Branch, Department of Agriculture, Fisheries and Forestry
The Forest Industries Branch of DAFF is responsible for forestry policy development and program delivery for the Australian Government, including national SOFRs. Contributions to SOFR 2008 were made by Jonathan Barker, Tim Bull, Simon Chinnock, Clair Dupont, Joanne Erskine, Garry Grant, Tony Hunn, Phil Link, Ben Pryor, Richard Mason, Tony Nicholson, Fintán O’Laighin and Andrew Wilson.
Bureau of Rural Sciences and expert authors
The Land and Forest Sciences Programme within BRS was responsible for the preparation of SOFR 2008. Contributions to the report were made by Julie Allais, Tim Clancy, Michael Colagrossi, Stuart Davey, John Davidson, Robert Dillon, Geoff Dunn, Margie Eddington, Ian Frakes, Mijo Gavran, Adam Gerrand, Claire Howell, Georgina Kelley, Shannon Kelson, Martin Mutendeuzi, Mark Parsons, Phil Pritchard, Julia Smith, Richard Thackway and Alana Wilkes. Expert authors were Gary King (Criterion 4) and Charles Darwin University (Bruce Campbell and Tony Griffi ths) (non-wood forest products).
Other contributors
Robert Waterworth (DEWHA); Michelle McGranahan and Tracey Lutton (BRS); Vanessa Wilson and Verity Mardling (DECC); Felicity Smith (Department of Environment and Heritage, South Australia); Tracee Perry (PIRSA); David Adams, Sharon Occhipinti and Kate Shanahan (DSE); staff from VicForests, the Victorian Department of Primary Industries and Parks Victoria; and Pat Collins (DEC).
Science editor
Alastair Sarre
The contributions of all the above to the production of SOFR 2008 are gratefully acknowledged.

Australia’s State of the Forests Report 2008 v
Contents
Foreword iii
Acknowledgments iv
Executive summary vii
Introduction xiii
Criterion 1: Conservation of biological diversity 1
Indicator 1.1aArea of forest by forest type and tenure 3
Indicator 1.1bArea of forest by growth stage 15
Indicator 1.1cArea of forest in protected area categories 20
Indicator 1.1dFragmentation of forest cover 28
Indicator 1.2aForest dwelling species for which ecological information is available 34
Indicator 1.2bThe status of forest dwelling species at risk of not maintaining viable breeding populations, as determined by legislation or scientifi c assessment 37
Indicator 1.2cRepresentative species from a range of habitats monitored at scales relevant to regional forest management 42
Indicator 1.3aForest associated species at risk from isolation and the loss of genetic variation, and conservation efforts for those species 47
Indicator 1.3bNative forest and plantations of indigenous timber specieswhich have genetic resource conservation mechanisms in place 50
Criterion 2: Maintenance of productive capacity of forest ecosystems 53
Indicator 2.1aNative forest available for wood production, area harvested, and growing stock of merchantable and non merchantable tree species 54
Indicator 2.1bAge class and growing stock of plantations 56
Indicator 2.1cAnnual removal of wood products compared to the volume determined to be sustainable for native forests, and future yields for plantations 58
Indicator 2.1dAnnual removal of non-wood forest products compared to the level determined to be sustainable 63
Indicator 2.1eThe area of native forest harvested and the proportion of that effectively regenerated, and the area of plantation harvested and the proportion of that effectively re-established 66
Criterion 3: Maintenance of ecosystem health and vitality 69
Indicator 3.1aScale and impact of agents and processes affecting forest health and vitality 70
Indicator 3.1bArea of forest burnt by planned and unplanned fi re 79
Criterion 4: Conservation and maintenance of soil and water resources 87
Indicator 4.1aArea of forest land managed primarily for protective functions 88
Indicator 4.1bManagement of the risk of soil erosion in forests 92
Indicator 4.1cManagement of the risks to soil physical properties in forests 98
Indicator 4.1dManagement of the risks to water quantity from forests 102
Indicator 4.1eManagement of the risks to water quality in forests 106
Criterion 5: Maintenance of forest contribution to global carbon cycles 111
Indicator 5.1aContribution of forest ecosystems and forest industries to the global greenhouse gas balance 112
Criterion 6: Maintenance and enhancement of long term multiple socio-economic benefi ts to meet the needs of societies 123
Indicator 6.1aValue and volume of wood and wood products 125
Indicator 6.1b Values, quantities and use of non-wood forest products 129
Indicator 6.1cValue of forest-based services 134
Indicator 6.1dProduction and consumption and import/export of wood, wood products and non-wood products 137
Indicator 6.1eDegree of recycling of forest products 141
Indicator 6.2aInvestment and expenditure in forest management 144
vi Australia’s State of the Forests Report 2008
Indicator 6.2bInvestment in research, development, extension and use of new and improved technologies 146
Indicator 6.3aArea of forest available for public recreation/tourism 149
Indicator 6.3bRange and use of recreation/tourism activities available 151
Indicator 6.4aArea of forest to which Indigenous people have use and rights that protect their special values and are recognised through formal and informal management regimes 155
Indicator 6.4bRegistered places of non-Indigenous cultural value in forests that are formally managed to protect those values 160
Indicator 6.4cThe extent to which Indigenous values are protected, maintained and enhanced through Indigenous participation in forest management 163
Indicator 6.4dThe importance of forests to people 166
Indicator 6.5aDirect and indirect employment in the forest sector 168
Indicator 6.5bWage rates and injury rates within the forest sector 171
Indicator 6.5cResilience of forest dependent communities to changing social and economic conditions 175
Indicator 6.5dResilience of forest dependent Indigenous communities to changing social and economic conditions 180
Criterion 7: Legal, institutional and economic framework for forest conservation and sustainable management 183
Indicator 7.1aExtent to which the legal framework supports the conservation and sustainable management of forests 185
Indicator 7.1bExtent to which the institutional framework supports the conservation and sustainable management of forests 190
Indicator 7.1cExtent to which the economic framework supports the conservation and sustainable management of forests 194
Indicator 7.1dCapacity to measure and monitor changes in the conservation and sustainable management of forests 198
Indicator 7.1eCapacity to conduct and apply research and development aimed at improving forest management and delivery of forest goods and services 203
Appendixes
Appendix AComparison of international Montreal Process indicators with those used in SOFR 2003 and SOFR 2008 207
Appendix BIndicator 1.1d – Fragmentation metrics 215
Appendix CIndicator 1.3a – Forest associated species at risk from isolation and the loss of genetic variation, and conservation efforts for those species 219
Appendix DImpacts of animals, plant pests and pathogens on ecosystem health 220
Appendix EState and territory legislation related to the harvesting of non-wood forest products 224
Tables 226
Figures 229
Case studies 231
Acronyms and abbreviations 232
Glossary 233
Unit abbreviations 237
References and further reading 238
Index 246
Australia’s State of the Forests Report 2008 vii
Executive summary
In this report, 7 criteria and 44 indicators provide a framework and methodology for describing and evaluating progress towards forest sustainability at the national level. The criteria are:
1. conservation of biological diversity
2. maintenance of productive capacity of forest ecosystems
3. maintenance of ecosystem health and vitality
4. conservation and maintenance of soil and water resources
5. maintenance of forest contribution to global carbon cycles
6. maintenance and enhancement of long-term multiple socioeconomic benefi ts to meet the needs of societies
7. legal, institutional and economic framework for forest conservation and sustainable management.
These criteria are the same as those developed by the international-level Montreal Process Working Group on Criteria and Indicators for the Conservation and Sustainable Management of Temperate and Boreal Forests, which comprises representatives of 12 governments, including the Australian Government. The national-level Montreal Process Implementation Group for Australia, which comprises representatives of the Australian, state and territory governments, devised the 44 indicators used to track progress across these criteria. The remainder of this summary synthesises major trends for the period from 2001–02 to 2005–06.
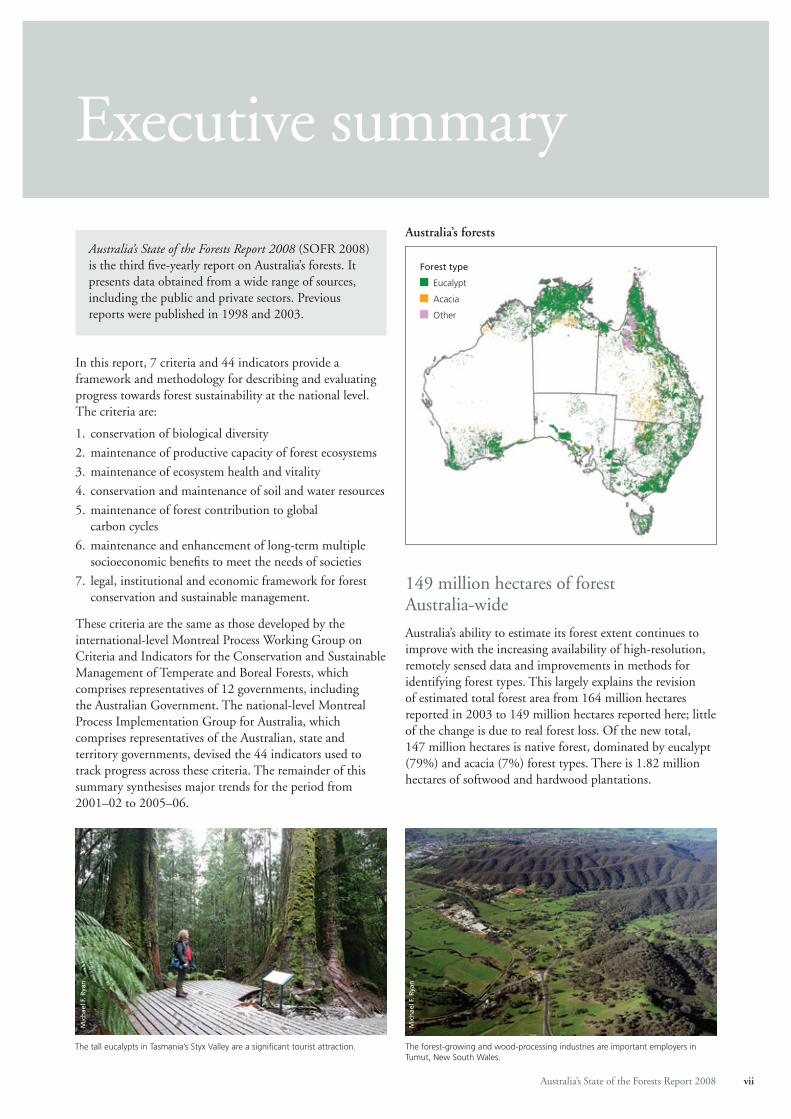
149 million hectares of forest Australia-wide
Australia’s ability to estimate its forest extent continues to improve with the increasing availability of high-resolution, remotely sensed data and improvements in methods for identifying forest types. This largely explains the revision of estimated total forest area from 164 million hectares reported in 2003 to 149 million hectares reported here; little of the change is due to real forest loss. Of the new total, 147 million hectares is native forest, dominated by eucalypt (79%) and acacia (7%) forest types. There is 1.82 million hectares of softwood and hardwood plantations.
Australia’s forests Australia’s State of the Forests Report 2008 (SOFR 2008) is the third fi ve-yearly report on Australia’s forests. It presents data obtained from a wide range of sources, including the public and private sectors. Previous reports were published in 1998 and 2003.
Forest type
Eucalypt
Acacia
Other
The forest-growing and wood-processing industries are important employers in Tumut, New South Wales.
Mic
hae
l F. R
yan
The tall eucalypts in Tasmania’s Styx Valley are a signifi cant tourist attraction.
Mic
hae
l F. R
yan
viii Australia’s State of the Forests Report 2008
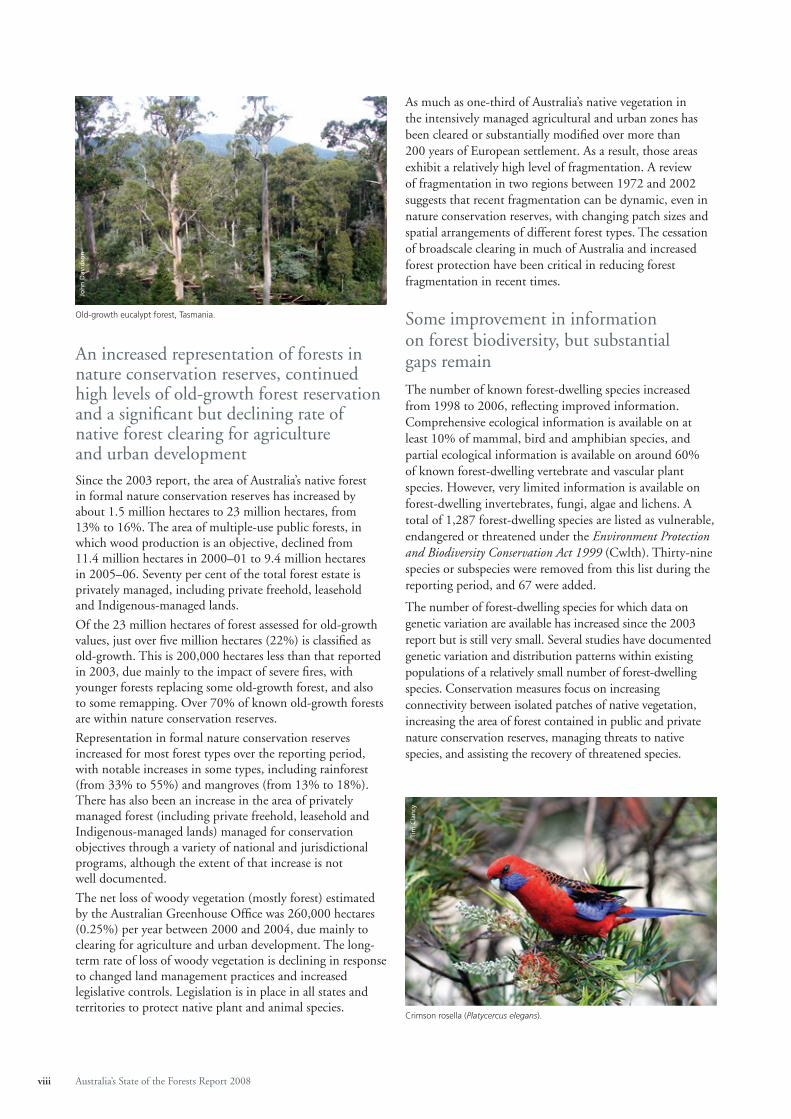
An increased representation of forests in nature conservation reserves, continued high levels of old-growth forest reservation and a signifi cant but declining rate of native forest clearing for agriculture and urban developmentSince the 2003 report, the area of Australia’s native forest in formal nature conservation reserves has increased by about 1.5 million hectares to 23 million hectares, from 13% to 16%. The area of multiple-use public forests, in which wood production is an objective, declined from 11.4 million hectares in 2000–01 to 9.4 million hectares in 2005–06. Seventy per cent of the total forest estate is privately managed, including private freehold, leasehold and Indigenous-managed lands.
Of the 23 million hectares of forest assessed for old-growth values, just over fi ve million hectares (22%) is classifi ed as old-growth. This is 200,000 hectares less than that reported in 2003, due mainly to the impact of severe fi res, with younger forests replacing some old-growth forest, and also to some remapping. Over 70% of known old-growth forests are within nature conservation reserves.
Representation in formal nature conservation reserves increased for most forest types over the reporting period, with notable increases in some types, including rainforest (from 33% to 55%) and mangroves (from 13% to 18%). There has also been an increase in the area of privately managed forest (including private freehold, leasehold and Indigenous-managed lands) managed for conservation objectives through a variety of national and jurisdictional programs, although the extent of that increase is not well documented.
The net loss of woody vegetation (mostly forest) estimated by the Australian Greenhouse Offi ce was 260,000 hectares (0.25%) per year between 2000 and 2004, due mainly to clearing for agriculture and urban development. The long-term rate of loss of woody vegetation is declining in response to changed land management practices and increased legislative controls. Legislation is in place in all states and territories to protect native plant and animal species.
Old-growth eucalypt forest, Tasmania.
Joh
n D
avid
son
Crimson rosella (Platycercus elegans).
Tim
Cla
ncy
As much as one-third of Australia’s native vegetation in the intensively managed agricultural and urban zones has been cleared or substantially modifi ed over more than 200 years of European settlement. As a result, those areas exhibit a relatively high level of fragmentation. A review of fragmentation in two regions between 1972 and 2002 suggests that recent fragmentation can be dynamic, even in nature conservation reserves, with changing patch sizes and spatial arrangements of different forest types. The cessation of broadscale clearing in much of Australia and increased forest protection have been critical in reducing forest fragmentation in recent times.
Some improvement in information on forest biodiversity, but substantial gaps remain
The number of known forest-dwelling species increased from 1998 to 2006, refl ecting improved information. Comprehensive ecological information is available on at least 10% of mammal, bird and amphibian species, and partial ecological information is available on around 60% of known forest-dwelling vertebrate and vascular plant species. However, very limited information is available on forest-dwelling invertebrates, fungi, algae and lichens. A total of 1,287 forest-dwelling species are listed as vulnerable, endangered or threatened under the Environment Protection and Biodiversity Conservation Act 1999 (Cwlth). Thirty-nine species or subspecies were removed from this list during the reporting period, and 67 were added.
The number of forest-dwelling species for which data on genetic variation are available has increased since the 2003 report but is still very small. Several studies have documented genetic variation and distribution patterns within existing populations of a relatively small number of forest-dwelling species. Conservation measures focus on increasing connectivity between isolated patches of native vegetation, increasing the area of forest contained in public and private nature conservation reserves, managing threats to native species, and assisting the recovery of threatened species.
Australia’s State of the Forests Report 2008 ix
Genetic resource conservation plans exist for more than 40 native timber and oil-producing species, a 70% increase on the number reported in 2003. The increase includes species used in farm forestry in drier environments. Tree-breeding and genetic improvement programs are expanding the scope for conserving native forest genetic resources, including of non-commercial endangered species.
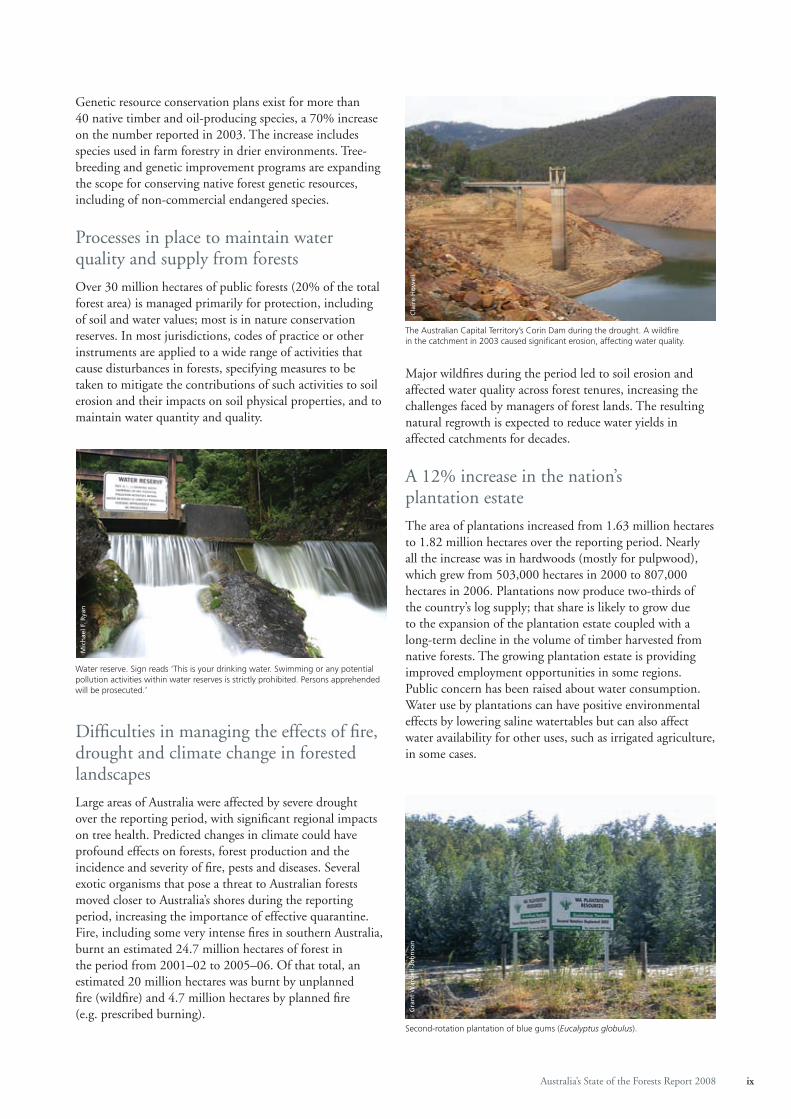
Processes in place to maintain water quality and supply from forests
Over 30 million hectares of public forests (20% of the total forest area) is managed primarily for protection, including of soil and water values; most is in nature conservation reserves. In most jurisdictions, codes of practice or other instruments are applied to a wide range of activities that cause disturbances in forests, specifying measures to be taken to mitigate the contributions of such activities to soil erosion and their impacts on soil physical properties, and to maintain water quantity and quality.
Diffi culties in managing the effects of fi re, drought and climate change in forested landscapes
Large areas of Australia were affected by severe drought over the reporting period, with signifi cant regional impacts on tree health. Predicted changes in climate could have profound effects on forests, forest production and the incidence and severity of fi re, pests and diseases. Several exotic organisms that pose a threat to Australian forests moved closer to Australia’s shores during the reporting period, increasing the importance of effective quarantine. Fire, including some very intense fi res in southern Australia, burnt an estimated 24.7 million hectares of forest in the period from 2001–02 to 2005–06. Of that total, an estimated 20 million hectares was burnt by unplanned fi re (wildfi re) and 4.7 million hectares by planned fi re (e.g. prescribed burning).
Water reserve. Sign reads ‘This is your drinking water. Swimming or any potential pollution activities within water reserves is strictly prohibited. Persons apprehended will be prosecuted.’
Mic
hae
l F. R
yan
Major wildfi res during the period led to soil erosion and affected water quality across forest tenures, increasing the challenges faced by managers of forest lands. The resulting natural regrowth is expected to reduce water yields in affected catchments for decades.
A 12% increase in the nation’s plantation estate
The area of plantations increased from 1.63 million hectares to 1.82 million hectares over the reporting period. Nearly all the increase was in hardwoods (mostly for pulpwood), which grew from 503,000 hectares in 2000 to 807,000 hectares in 2006. Plantations now produce two-thirds of the country’s log supply; that share is likely to grow due to the expansion of the plantation estate coupled with a long-term decline in the volume of timber harvested from native forests. The growing plantation estate is providing improved employment opportunities in some regions. Public concern has been raised about water consumption. Water use by plantations can have positive environmental effects by lowering saline watertables but can also affect water availability for other uses, such as irrigated agriculture, in some cases.
The Australian Capital Territory’s Corin Dam during the drought. A wildfi re in the catchment in 2003 caused signifi cant erosion, affecting water quality.
Cla
ire
Ho
wel
l
Second-rotation plantation of blue gums (Eucalyptus globulus).
Gra
nt
War
del
l-Jo
hn
son
x Australia’s State of the Forests Report 2008
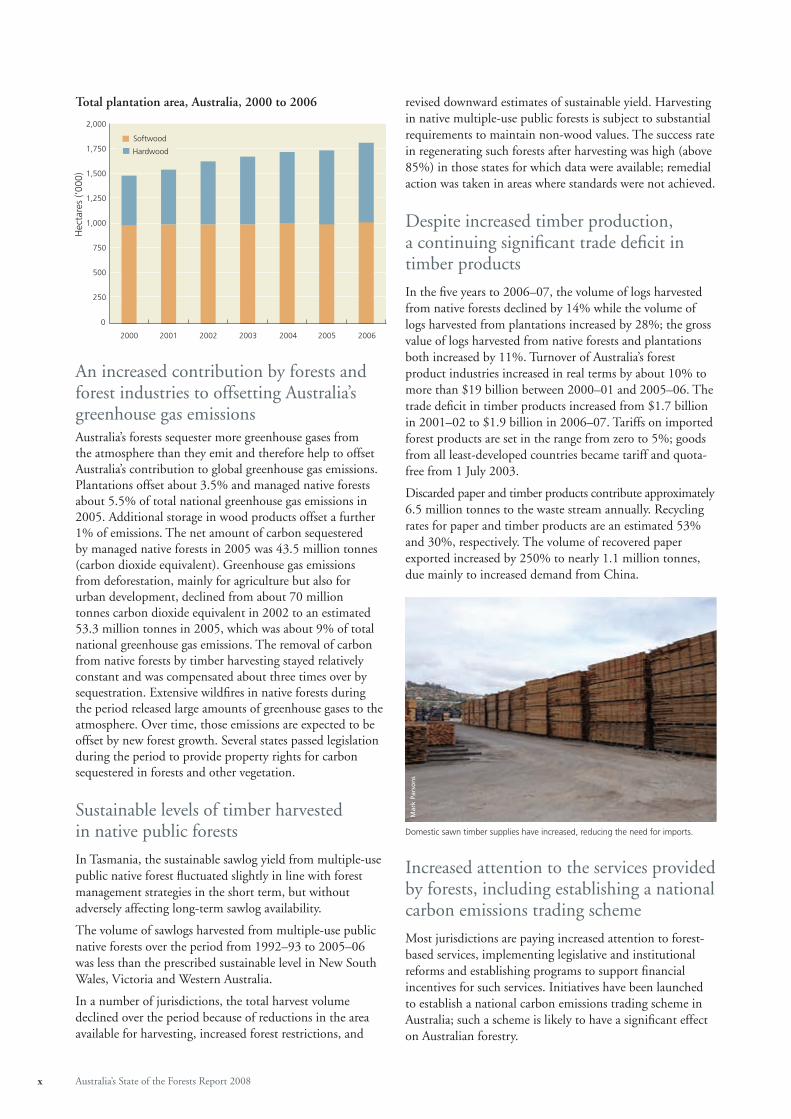
An increased contribution by forests and forest industries to offsetting Australia’s greenhouse gas emissionsAustralia’s forests sequester more greenhouse gases from the atmosphere than they emit and therefore help to offset Australia’s contribution to global greenhouse gas emissions. Plantations offset about 3.5% and managed native forests about 5.5% of total national greenhouse gas emissions in 2005. Additional storage in wood products offset a further 1% of emissions. The net amount of carbon sequestered by managed native forests in 2005 was 43.5 million tonnes (carbon dioxide equivalent). Greenhouse gas emissions from deforestation, mainly for agriculture but also for urban development, declined from about 70 million tonnes carbon dioxide equivalent in 2002 to an estimated 53.3 million tonnes in 2005, which was about 9% of total national greenhouse gas emissions. The removal of carbon from native forests by timber harvesting stayed relatively constant and was compensated about three times over by sequestration. Extensive wildfi res in native forests during the period released large amounts of greenhouse gases to the atmosphere. Over time, those emissions are expected to be offset by new forest growth. Several states passed legislation during the period to provide property rights for carbon sequestered in forests and other vegetation.
Sustainable levels of timber harvested in native public forests
In Tasmania, the sustainable sawlog yield from multiple-use public native forest fl uctuated slightly in line with forest management strategies in the short term, but without adversely affecting long-term sawlog availability.
The volume of sawlogs harvested from multiple-use public native forests over the period from 1992–93 to 2005–06 was less than the prescribed sustainable level in New South Wales, Victoria and Western Australia.
In a number of jurisdictions, the total harvest volume declined over the period because of reductions in the area available for harvesting, increased forest restrictions, and
0
1,500
1,750
2,000
1,250
1,000
750
500
250
2000 2001 2002 2003 2004 2005 2006
Hardwood
Softwood
Hec
tare
s (’0
00)
Total plantation area, Australia, 2000 to 2006 revised downward estimates of sustainable yield. Harvesting in native multiple-use public forests is subject to substantial requirements to maintain non-wood values. The success rate in regenerating such forests after harvesting was high (above 85%) in those states for which data were available; remedial action was taken in areas where standards were not achieved.
Despite increased timber production, a continuing signifi cant trade defi cit in timber products
In the fi ve years to 2006–07, the volume of logs harvested from native forests declined by 14% while the volume of logs harvested from plantations increased by 28%; the gross value of logs harvested from native forests and plantations both increased by 11%. Turnover of Australia’s forest product industries increased in real terms by about 10% to more than $19 billion between 2000–01 and 2005–06. The trade defi cit in timber products increased from $1.7 billion in 2001–02 to $1.9 billion in 2006–07. Tariffs on imported forest products are set in the range from zero to 5%; goods from all least-developed countries became tariff and quota-free from 1 July 2003.
Discarded paper and timber products contribute approximately 6.5 million tonnes to the waste stream annually. Recycling rates for paper and timber products are an estimated 53% and 30%, respectively. The volume of recovered paper exported increased by 250% to nearly 1.1 million tonnes, due mainly to increased demand from China.
Increased attention to the services provided by forests, including establishing a national carbon emissions trading scheme
Most jurisdictions are paying increased attention to forest-based services, implementing legislative and institutional reforms and establishing programs to support fi nancial incentives for such services. Initiatives have been launched to establish a national carbon emissions trading scheme in Australia; such a scheme is likely to have a signifi cant effect on Australian forestry.
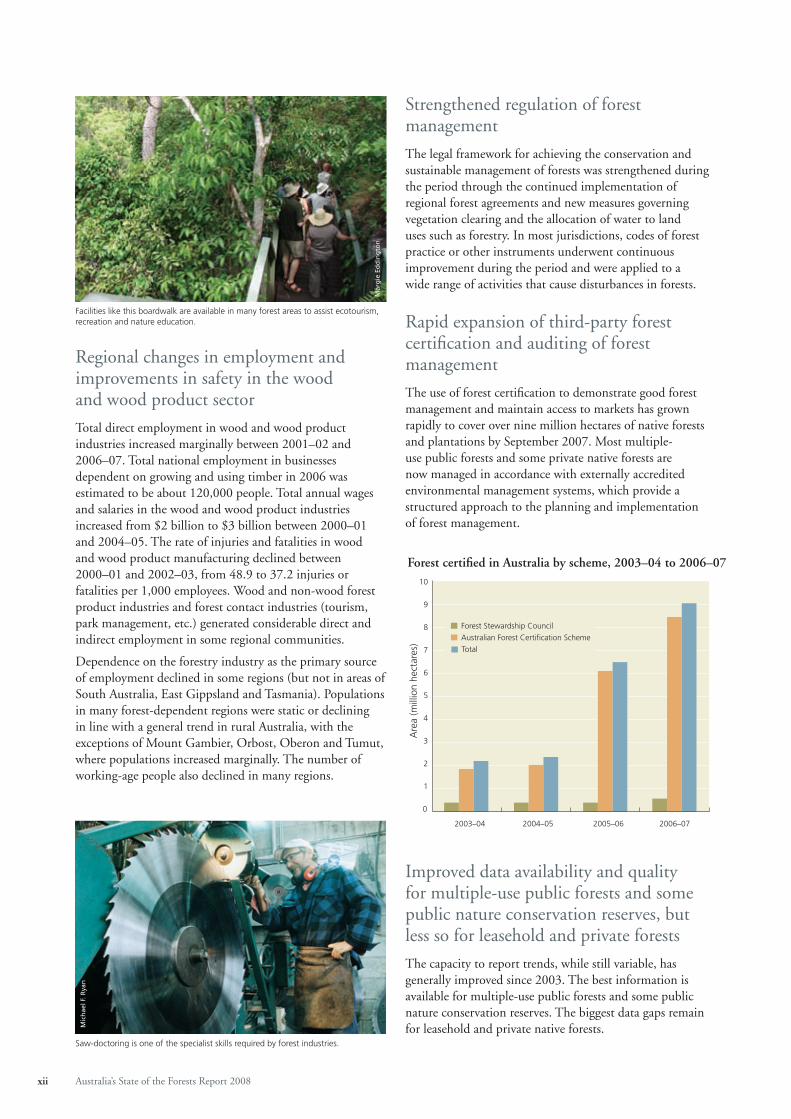
Domestic sawn timber supplies have increased, reducing the need for imports.
Mar
k Pa
rso
ns

Australia’s State of the Forests Report 2008 xi
Involvement of Indigenous people in forest management
Indigenous-managed land includes more than 21 million hectares of forest, which is 13% of Australia’s total forest area. Australia has an Indigenous Forestry Strategy. Most state and territory land management agencies have targets for Indigenous employment, helping to build capacity in Indigenous communities. Legislative arrangements in all jurisdictions aim to ensure the identifi cation and protection of Indigenous sites and places of signifi cance. Mechanisms are being maintained to facilitate Indigenous participation in the forest sector and to provide economic benefi ts to Indigenous communities. The number of Indigenous people employed in government agencies responsible for nature conservation and commercial timber production increased over the period, and there was also a greater presence of Indigenous people in natural resource management committees and other forest stakeholder forums. Indigenous Australians continue to rely heavily on the use of non-wood forest products for customary purposes (such as food and medicine) and commercial uses (such as arts and crafts). The recognition of native title through mechanisms such as Indigenous land-use agreements strengthened the potential value of forests for Indigenous people and the resilience of Indigenous communities.
Investments in plantations, wood product manufacturing facilities and research
Investment in plantation expansion increased from 2002 to 2006, totalling an estimated $902 million, while investment in new or improved wood and wood product manufacturing facilities amounted to several billion dollars. Reported annual expenditure on national forest-related research and development decreased by $17.5 million to $198.5 million between 2000–01 and 2004–05; of this total, annual investment in manufacturing-related research increased from $79 million to $108 million. Investment in nationally reported research on forest growing for wood production and forest-related environmental research declined.
Indigenous people manage about 21 million hectares of forests, using them for a wide range of customary and commercial activities.
Ric
har
d T
hac
kway
To improve overall collaboration and the coordination of forest research, Australian, state and territory agencies developed the following set of nationally critical research priorities: the impact of climate change on forest management; the role of forests in managing Australia’s water resources; managing Australia’s forests for multiple objectives; forest health and biosecurity; and forest products.
State and territory policies, such as disincentives for land-clearing, incentives for improving management practices in private native forests, and carbon-credit schemes, have encouraged investment in forest conservation and the forest growing and timber processing industries. Governments have also developed market-based mechanisms and incentives to promote reforestation and improved forest management as a way of protecting catchment values, particularly in agricultural landscapes. Six environmental assets are accounted for in national and sector balance sheets, including plantation timber and standing native timber available for harvesting. The values of those two assets grew at average annual rates of 5.6% and 3.8%, respectively, over the period from 1997 to 2005.
Forests are the subject of considerable community debate in Australia. The expansion of the plantation estate and the proposed development of new wood processing infrastructure, including pulp mills, have potentially signifi cant employment benefi ts but are also accompanied by community concerns about their perceived social and environmental consequences.
Strategies in place to actively manage forest areas for recreation
Forest management agencies have strategies in place to actively manage forest areas of high recreation and tourism use. Most publicly owned multiple-use and nature conservation reserve forests are available to the general public for recreation and tourism, and many facilities such as visitor recreation centres and tree-top walks were established or improved during the period. For those forests for which data were available, the number of areas, tracks and sites available for recreation and tourism activities increased or remained the same over the reporting period.
Export woodchip mill, Burnie, northeast Tasmania.
Mic
hae
l F. R
yan
xii Australia’s State of the Forests Report 2008
Regional changes in employment and improvements in safety in the wood and wood product sector
Total direct employment in wood and wood product industries increased marginally between 2001–02 and 2006–07. Total national employment in businesses dependent on growing and using timber in 2006 was estimated to be about 120,000 people. Total annual wages and salaries in the wood and wood product industries increased from $2 billion to $3 billion between 2000–01 and 2004–05. The rate of injuries and fatalities in wood and wood product manufacturing declined between 2000–01 and 2002–03, from 48.9 to 37.2 injuries or fatalities per 1,000 employees. Wood and non-wood forest product industries and forest contact industries (tourism, park management, etc.) generated considerable direct and indirect employment in some regional communities.
Dependence on the forestry industry as the primary source of employment declined in some regions (but not in areas of South Australia, East Gippsland and Tasmania). Populations in many forest-dependent regions were static or declining in line with a general trend in rural Australia, with the exceptions of Mount Gambier, Orbost, Oberon and Tumut, where populations increased marginally. The number of working-age people also declined in many regions.
Facilities like this boardwalk are available in many forest areas to assist ecotourism, recreation and nature education.
Mar
gie
Ed
din
gto
n
Strengthened regulation of forest management
The legal framework for achieving the conservation and sustainable management of forests was strengthened during the period through the continued implementation of regional forest agreements and new measures governing vegetation clearing and the allocation of water to land uses such as forestry. In most jurisdictions, codes of forest practice or other instruments underwent continuous improvement during the period and were applied to a wide range of activities that cause disturbances in forests.
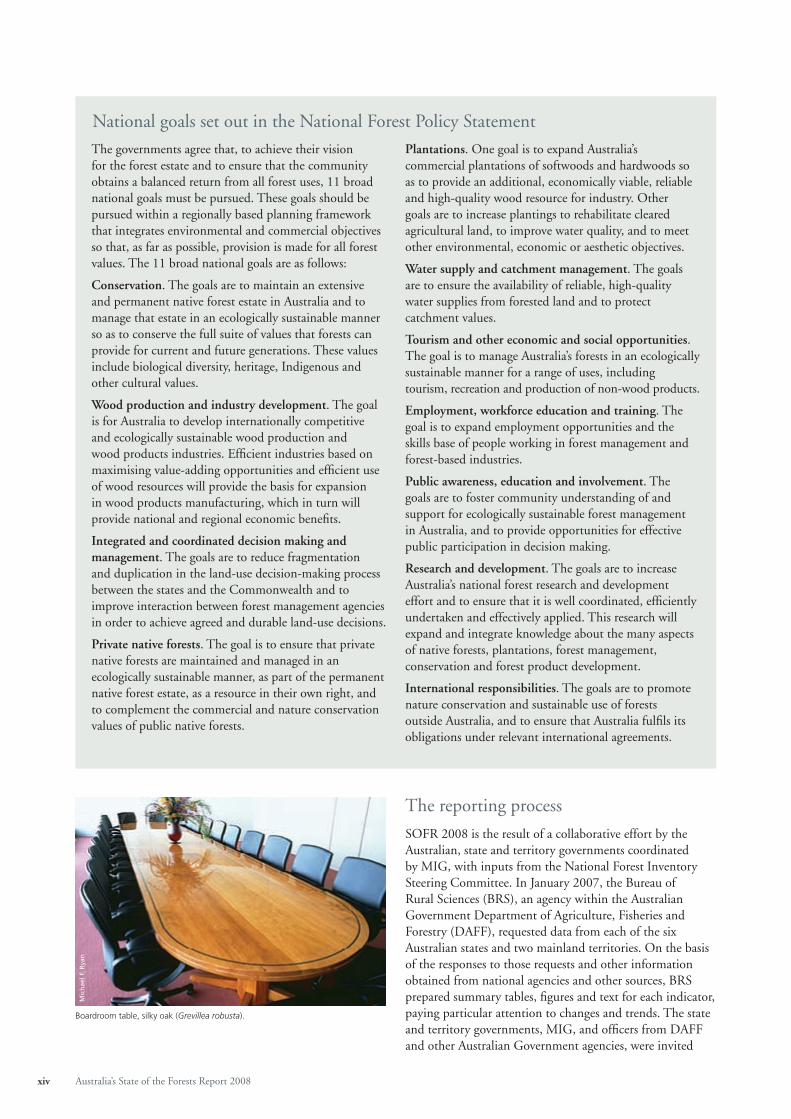
Rapid expansion of third-party forest certifi cation and auditing of forest management
The use of forest certifi cation to demonstrate good forest management and maintain access to markets has grown rapidly to cover over nine million hectares of native forests and plantations by September 2007. Most multiple-use public forests and some private native forests are now managed in accordance with externally accredited environmental management systems, which provide a structured approach to the planning and implementation of forest management.
Saw-doctoring is one of the specialist skills required by forest industries.
Mic
hae
l F. R
yan
0
6
7
8
9
10
5
4
3
2
1
2003–04 2004–05 2005–06 2006–07
Are
a (m
illio
n he
ctar
es)
Forest Stewardship Council
Australian Forest Certification Scheme
Total
Forest certifi ed in Australia by scheme, 2003–04 to 2006–07
Improved data availability and quality for multiple-use public forests and some public nature conservation reserves, but less so for leasehold and private forests
The capacity to report trends, while still variable, has generally improved since 2003. The best information is available for multiple-use public forests and some public nature conservation reserves. The biggest data gaps remain for leasehold and private native forests.

Australia’s State of the Forests Report 2008 xiii
Introduction
This is the third report on the state of Australia’s forests. Its purpose is to keep the public informed about Australia’s forests, to show how they might be changing, and to indicate positive and negative trends. It also helps Australia to report the state of its forests to the world.
In 1992, the Australian Government and state and territory governments issued a National Forest Policy Statement1, which set out a vision and goals, objectives and policies for Australia’s forests and committed governments to prepare a national State of the Forests Report (SOFR) every fi ve years. The fi rst two such reports – referred to here as SOFR 1998 and SOFR 2003 – were published in 1998 and 2003. This report – Australia’s State of the Forests Report 2008 – is referred to as SOFR 2008.
Criteria and indicators
Forests are complex ecosystems that provide a wide and dynamic array of environmental and socioeconomic benefi ts and services. The essential aim of sustainable forest management is to maintain the broad range of forest values in perpetuity, but assessing progress towards this aim is diffi cult. Criteria and indicators are used to simplify the task by characterising the essential components of sustainable forest management. They are intended to provide a common understanding of what is meant by sustainable forest management and a common framework for describing, assessing and evaluating a country’s progress towards sustainability at the national level.2
Most methods of sustainability assessment follow a broadly similar approach involving an analytical hierarchy, in which information is organised so that each individual component contributes to the understanding of a larger theme or question. The individual components (‘indicators’) may then be examined in terms of their contribution to key sustainability measures, which, in Australia’s approach, consist of the following criteria:
• conservation of biological diversity
• maintenance of productive capacity of forest ecosystems
• maintenance of ecosystem health and vitality
• conservation and maintenance of soil and water resources
• maintenance of forest contribution to global carbon cycles
• maintenance and enhancement of long-term multiple socioeconomic benefi ts to meet the needs of societies
• legal, institutional and economic framework for forest conservation and sustainable management.
These criteria are the same as those developed by the international-level Montreal Process Working Group on Criteria and Indicators for the Conservation and Sustainable Management of Temperate and Boreal Forests, known as the Montreal Process Working Group, which was formed in 1994 by countries with temperate and boreal forests. Members of the working group are Argentina, Australia, Canada, Chile, China, Japan, the Republic of Korea, Mexico, New Zealand, the Russian Federation, the United States of America and Uruguay; the Montreal Process indicators are therefore applied across 90% of the world’s temperate and boreal forests.
Australia has accepted the criteria developed by the Montreal Process Working Group and adapted the indicators to better suit the country’s unique forests. Seventy-four indicators were devised and used as the basis of reporting in SOFR 2003 (SOFR 1998 did not use the criteria-and-indicators approach). The indicators have been developed in the context of contemporary forest regulations, international agreements and current national and state policies,3 such as the National Forest Policy Statement. Principles recognised in the development and implementation of the indicators include the precautionary principle; intergenerational equity; public participation; transparency and access to information; international good citizenship; and industry and regional development.
However, some of these indicators proved diffi cult to measure and some were repetitive. The national-level Montreal Process Implementation Group for Australia (MIG), reviewed the list of indicators in 2005 with the aim of eliminating duplication, ambiguity and gaps. As a result of that review, the list of indicators was reduced to 44.4 The reduction in the number of indicators helps to streamline this report.
The criteria and indicators used in this report characterise the essential components of sustainable forest management. Measured over time, they can help to inform forest managers, owners and other stakeholders about the state of the forests and the benefi ts and risks associated with their management, and assist in measuring progress towards the 11 national goals set out in the National Forest Policy Statement (see box on next page).
1 Commonwealth of Australia (1992).2 Montreal Process Working Group on Criteria and Indicators for the
Conservation and Sustainable Management of Temperate and Boreal Forests (1995).
3 Howell et al (2008).4 Appendix A compares the indicators used in this report to those
used in SOFR 2003 and lists the closest equivalent indicators of the international Montreal Process Working Group.
xiv Australia’s State of the Forests Report 2008
The governments agree that, to achieve their vision for the forest estate and to ensure that the community obtains a balanced return from all forest uses, 11 broad national goals must be pursued. These goals should be pursued within a regionally based planning framework that integrates environmental and commercial objectives so that, as far as possible, provision is made for all forest values. The 11 broad national goals are as follows:
Conservation. The goals are to maintain an extensive and permanent native forest estate in Australia and to manage that estate in an ecologically sustainable manner so as to conserve the full suite of values that forests can provide for current and future generations. These values include biological diversity, heritage, Indigenous and other cultural values.
Wood production and industry development. The goal is for Australia to develop internationally competitive and ecologically sustainable wood production and wood products industries. Effi cient industries based on maximising value-adding opportunities and effi cient use of wood resources will provide the basis for expansion in wood products manufacturing, which in turn will provide national and regional economic benefi ts.
Integrated and coordinated decision making and management. The goals are to reduce fragmentation and duplication in the land-use decision-making process between the states and the Commonwealth and to improve interaction between forest management agencies in order to achieve agreed and durable land-use decisions.
Private native forests. The goal is to ensure that private native forests are maintained and managed in an ecologically sustainable manner, as part of the permanent native forest estate, as a resource in their own right, and to complement the commercial and nature conservation values of public native forests.
Plantations. One goal is to expand Australia’s commercial plantations of softwoods and hardwoods so as to provide an additional, economically viable, reliable and high-quality wood resource for industry. Other goals are to increase plantings to rehabilitate cleared agricultural land, to improve water quality, and to meet other environmental, economic or aesthetic objectives.
Water supply and catchment management. The goals are to ensure the availability of reliable, high-quality water supplies from forested land and to protect catchment values.
Tourism and other economic and social opportunities. The goal is to manage Australia’s forests in an ecologically sustainable manner for a range of uses, including tourism, recreation and production of non-wood products.
Employment, workforce education and training. The goal is to expand employment opportunities and the skills base of people working in forest management and forest-based industries.
Public awareness, education and involvement. The goals are to foster community understanding of and support for ecologically sustainable forest management in Australia, and to provide opportunities for effective public participation in decision making.
Research and development. The goals are to increase Australia’s national forest research and development effort and to ensure that it is well coordinated, effi ciently undertaken and effectively applied. This research will expand and integrate knowledge about the many aspects of native forests, plantations, forest management, conservation and forest product development.
International responsibilities. The goals are to promote nature conservation and sustainable use of forests outside Australia, and to ensure that Australia fulfi ls its obligations under relevant international agreements.
National goals set out in the National Forest Policy Statement
The reporting process
SOFR 2008 is the result of a collaborative effort by the Australian, state and territory governments coordinated by MIG, with inputs from the National Forest Inventory Steering Committee. In January 2007, the Bureau of Rural Sciences (BRS), an agency within the Australian Government Department of Agriculture, Fisheries and Forestry (DAFF), requested data from each of the six Australian states and two mainland territories. On the basis of the responses to those requests and other information obtained from national agencies and other sources, BRS prepared summary tables, fi gures and text for each indicator, paying particular attention to changes and trends. The state and territory governments, MIG, and offi cers from DAFF and other Australian Government agencies, were invited
Boardroom table, silky oak (Grevillea robusta).
Mic
hae
l F. R
yan
Australia’s State of the Forests Report 2008 xv
to participate in a drafting group, which met three times in 2007 to review manuscripts and provide supplementary information.
The draft report was approved by MIG in November 2007 and endorsed by the Forest and Forest Products Council in December 2007. The data contained in this report remain the property of the custodian, which is usually a state and territory agency or industry body, or a national organisation for those indicators for which nationally collected data were used. Data were not available for some indicators and for some jurisdictions; therefore, some tables, fi gures and textual information given in this report are not comprehensive.
Since – or coinciding with – SOFR 2003, many states and territories have prepared their own SOFRs and/or addressed forest-related issues in ‘state of the environment’ (SoE) or other reports. Victoria has committed to producing a SOFR every fi ve years and published its fi rst in 2005; that report contained data current to 2003 organised according to the seven criteria used in the national SOFR. Forests NSW has published an annual Social, Environmental and Economic (Seeing) Report since 2003 to document the outcomes of the agency’s decision making in terms of social, environmental and economic goals. The Tasmanian and Australian governments published the Sustainability Indicators for Tasmanian Forests 2001–2006 report in 2007. South Australia’s fourth SoE report, published in 2003, addressed a number of forest-related issues, as did Western Australia’s most recent SoE report, published in 2007. Some jurisdictions have other reports that complement and inform the forest reporting processes. For example, Victoria produces a fi ve-yearly ‘state of the parks’ report, which analyses the condition of the state’s nature conservation reserves; New South Wales produces its ‘state of the parks’ report every three years. The Australian Government publishes a fi ve-yearly SoE report – most recently in 2006.
These reporting processes greatly assisted the provision of relevant data for the national-level SOFR 2008. Moreover, as the capacity of the states and territories to report against the Montreal Process criteria and indicators improves, so too does the national capacity, because data collected at the state and territory level increasingly feed directly into the national SOFR process.
The SOFR series
Australia’s national SOFRs should be viewed as a series that, over time, constitutes a system for monitoring, assessing and reporting on the state of Australia’s forests. Using such a system, it is possible to determine the direction of change in a range of parameters and the implications of such change for forest sustainability.
In general, SOFR 2008 reports data for the fi ve-year period from 2001–02 to 2005–06 and compares these with those reported in SOFR 2003, which had a nominal reporting period of 1996–07 to 2000–01. Given the varied nature of the data sources, however, it was not always possible to collate information for the specifi ed period; information
on actual data coverage is provided in each indicator. The emphasis in this report is on change over the reporting period. In addition, some contextual information contained in SOFR 1998 and SOFR 2003 is summarised here; readers are directed to those reports for additional background information on the timber industry, the conservation movement and the development of plantations.
Context
What is a forest?
The defi nition of forest used in this report is the same as that used in SOFR 1998 and SOFR 2003:
An area, incorporating all living and non-living components, that is dominated by trees having usually a single stem and a mature or potentially mature stand height exceeding two metres and with existing or potential crown cover of overstorey strata about equal to or greater than 20%. This includes Australia’s diverse native forests and plantations, regardless of age. It is also suffi ciently broad to encompass areas of trees that are sometimes described as woodlands.
Under this defi nition, a large part of Australia’s mallee qualifi es as forest, as do very large areas of tropical savanna and woodland, where trees are spread out in the landscape. What many people would traditionally regard as forests – expanses of tall, closely spaced trees – comprise a relatively small part of the country’s total forest estate.
This report uses the National Forest Policy Statement defi nition of plantations:
Intensively managed stands of trees of either native or exotic species created by the regular placement of seedlings or seeds.
Forest types
The distribution of forests across Australia is broadly determined by climate and soil properties, although other factors such as the fi re regime are also important. Two-thirds of the country’s forests have sparse crown cover, meaning
Mountain ash (Eucalyptus regnans), 1939 regrowth.
Mic
hae
l F. R
yan
xvi Australia’s State of the Forests Report 2008
that, when viewed from above, tree canopies cover 20–50% of the ground surface (Figure 3, Indicator 1.1a).
Australia’s forests are dominated by angiosperms (fl owering plants); trees from this division of the plant kingdom are also called hardwoods. By far the most common forest type in Australia is eucalypt, followed by acacia and melaleuca; native conifers (also called softwoods) such as hoop pine (Araucaria cunninghamii), bunya pine (Araucaria bidwillii) and King Billy pine (Athrotaxis selaginoides) dominate some forests, but the total area of those forests is insuffi cient to constitute a major forest type. Indicator 1.1a reports on the nature and extent of Australia’s forest types and changes in them compared to SOFR 2003.
Origins
The origins of Australia’s forests can be traced to the beginning of the Cretaceous period, when the supercontinent Gondwana began to fragment into Africa, South America, India, Australia/Antarctica and many smaller islands. Although this happened at least 135 million years ago, similarities can still be found in the fl ora and fauna of these now widely separated lands.
But there are also large differences. Over the intervening millennia, Australia has evolved a new biota. About 38 million years ago, it broke away from Antarctica and shifted northwards, colliding with Asia about 13 million years ago. During Australia’s northward journey, the climate became progressively warmer and drier, and the vegetation adapted accordingly. Cool and warm rainforests were replaced by sclerophyllous genera such as Eucalyptus and Acacia – plants that have hard, spiky or shiny leaves to reduce moisture loss, and are adapted to a regime of frequent fi re. Gondwanan fl ora survived in isolated pockets, such as remnant cool temperate rainforests in eastern Australia, the wet tropical rainforests of northeastern Queensland, isolated areas of the Northern Territory, and the Kimberley, but over much of the continent, forests were replaced by non-forest vegetation and desert.
Over the past two million years, the forest estate has expanded and contracted as the climate has fl uctuated between warm-and-wet and cool-and-dry periods. New species have also arrived, fi rst from Asia and later from almost all parts of the world. Of all the newcomers, humans have undoubtedly had the biggest impact.
Indigenous Australians are thought to have occupied the continent for at least 60,000 years. Over millennia, their use of fi re as a land-management and hunting tool probably had a major effect on vegetation structure and composition, including forests, although the extent of this effect is still debated.
Europeans began their settlement of Australia in 1788 when the British established a small colony on the east coast. In the decades that followed, colonists sought out and cleared land for agriculture and urban development, introduced intensive farming and grazing and many new plant and animal species, and altered forest fi re regimes.
Much of Australia is now affected in some way by the impacts of European settlement.
It is diffi cult to know the extent of changes that have occurred in the area and distribution of forests since European colonisation. One estimate suggests that about 25% of the total forest estate existing before European settlement has been cleared.5 Thus, Australia retains about three-quarters of its original forest estate, although in many cases in a modifi ed form.
The jurisdictions
In 1901, the six British colonies of New South Wales, Queensland, South Australia, Tasmania, Victoria and Western Australia formed a federation, becoming the component states of the Commonwealth of Australia. Today, the nation has three main levels of government: Commonwealth or federal (referred to in this report as the Australian Government or the national government), state/territory (two mainland territories, the Northern Territory and the Australian Capital Territory, are self-administered) and local. The traditional law-making and land management processes of Aboriginal and Torres Strait Islander people (referred to collectively in this report as Indigenous people) also apply in some areas. In this report, the term ‘jurisdictions’ is used to collectively denote the Australian, state and territory governments, or subgroups of them.
The Australian Constitution explicitly defi nes the areas of Australian Government, or federal, responsibility. In practice these cover foreign affairs and international agreements, defence, quarantine, the issuing of export licences for major resource developments, fi scal decisions and taxation. The management of land and natural resources, including forests, is largely the domain of the state and territory governments. However, the Australian Government is responsible for meeting the country’s international obligations through the conventions and treaties to which it is party and has the constitutional power to make decisions on land management in fulfi lment of those obligations. It rarely exercises this power, although it reserves the right to do so on matters of national importance.
Regional forest agreements
A key element of the approach adopted in the 1992 National Forest Policy Statement involved the negotiation of regional forest agreements (RFAs) between the Australian and certain state governments. RFAs are 20-year plans for the conservation and sustainable management of certain areas of Australia’s native forests; they are designed to provide certainty for forest-based industries, forest-dependent communities and conservation. They use a science-based methodology to determine forest allocation for different uses and forest management strategies and are
5 ASEC (2006).
Australia’s State of the Forests Report 2008 xvii
the result of substantial scientifi c study, consultation and negotiation covering a diverse range of interests.
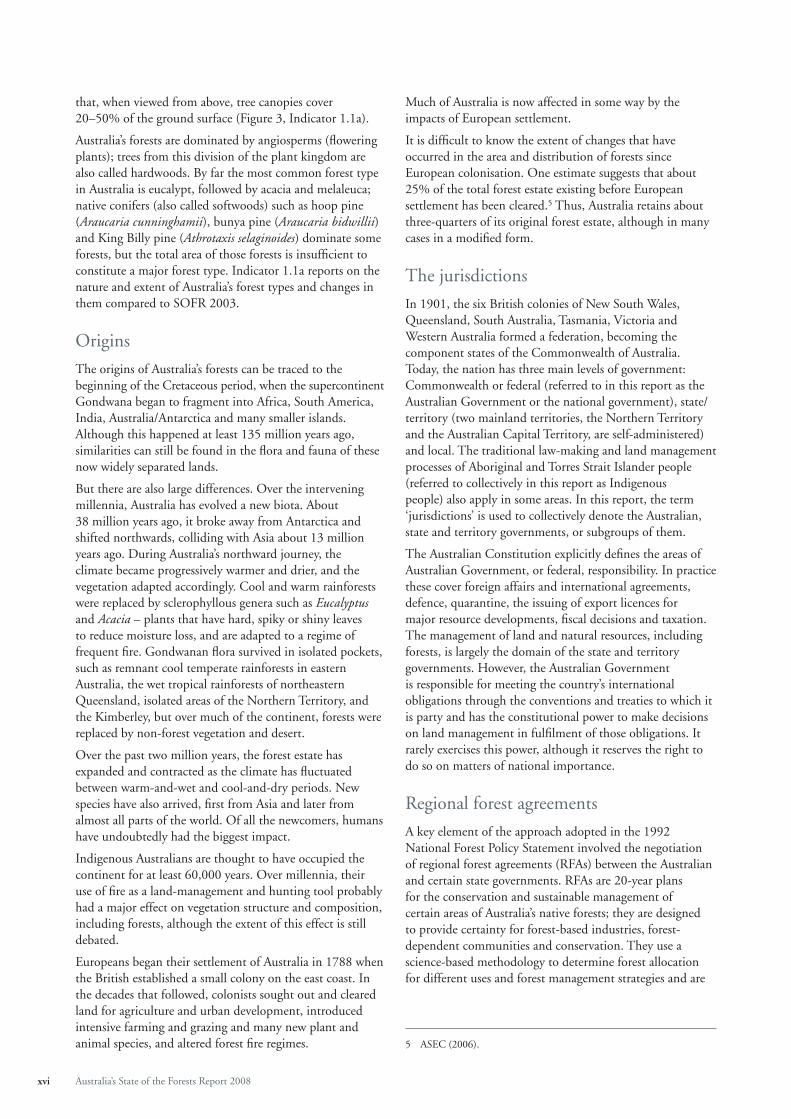
Ten RFAs have been negotiated bilaterally between the Australian Government and four of the six state governments (New South Wales, Victoria, Western Australia and Tasmania – Figure 1). The Australian and Tasmanian governments are also party to the Tasmanian Community Forest Agreement, which complements the Tasmanian RFA. The protection provided by Australia’s RFAs is given legal status through the Regional Forest Agreements Act 2002 (Cwlth). The Australian and Queensland governments completed a comprehensive regional assessment for southeast Queensland but did not sign an RFA. Queensland has a ‘statewide forests process’ for the long-term assessment and planning of the public forest estate that will result in a signifi cant expansion of conservation areas. The process involves key stakeholders and the community and is intended to result in forest agreements aimed at providing certainty to the forest industry, protecting environmental values and ensuring ecologically sustainable management of forests.
Land ownership and tenure
The question of tenure is important in forest management because the owner of the land (and in most cases the forest) has primary responsibility for its management. When the British arrived in Australia, they claimed all land as the property of government (‘Crown land’). Over time, a large part of the Crown estate has been leased, sold or otherwise allocated by government to private use. Unassigned areas remain the property of state governments or the Australian
Government under various designations, including multiple-use public forest (usually called ‘state public forest’), timber reserves, nature conservation reserves (including national parks) and vacant Crown land.
The six tenure classes used for native forests in this report have been amalgamated from the wide range of classes used by various jurisdictions. The six classes can be further grouped as public and private:
Public
Multiple-use public forests. Publicly owned state forest, timber reserves and other forest areas on which a range of forest values is managed, including timber harvesting, water supply, conservation of biodiversity, recreation and environmental protection. They are managed by state and territory agencies in accordance with state/territory Acts and regulations.
Nature conservation reserves. Crown lands that are formally reserved for environmental, conservation and recreational purposes. They include national parks, nature reserves, state and territory recreation and conservation areas, formal reserves in state forests, and Crown lands reserved to protect water-supply catchments. They do not include informal reserves and those pending gazettal. The harvesting of timber and non-timber forest products generally is not permitted.
Forest on ‘other Crown land’. Forest on Crown land reserved for a variety of purposes including utilities, scientifi c research, education, stock routes, mining, use by the defence forces and use by Indigenous communities.
Figure 1: Regional forest agreement regions
Legend
Western Australia
West Victoria
Northeast Victoria
Central Highlands Victoria
Gippsland Victoria
East Gippsland Victoria
Tasmania
Southern New South Wales
Eden New South Wales
North East New South Wales
xviii Australia’s State of the Forests Report 2008
Private
Private forest. Forest on land held under freehold title and under private ownership. It includes land held under freehold title with special conditions attached for designated Indigenous communities.
Leasehold forest. Forest on Crown land held under leasehold title and generally regarded as privately managed. It includes land held under leasehold title with special conditions attached for designated Indigenous communities.
Unresolved tenure. Some forests where data are insuffi cient to determine ownership status.
There are notable differences in the ownership of different forest types. The drier, sparse woodland forests make up almost 100 million hectares, half of which is on leasehold land and another quarter on private land. There have also been signifi cant recent changes in land tenure. In particular, as a result of decisions by courts recognising Indigenous land claims, signifi cant areas of former Crown land are now owned by Indigenous people. In other areas, multiple-use public forests have been reassigned as nature conservation reserves, in most cases excluding extractive uses such as timber production (see Indicator 1.1a).
How to use this report
This report is organised by the seven criteria of forest conservation and management, within which various indicators address specifi c forest parameters. A summary of key points is given at the start of each indicator. At the head of each criterion, a short introduction explains the scope and lists some of the most important fi ndings for that criterion, derived from the key points arising from the relevant indicators. Case studies are used to illustrate the indicators and to provide complementary information; additional case studies and resource material are available on the report’s website (www.daff.gov.au/forestsaustralia).
A list of references and further reading is at the back of the report.
While the indicators are designed to be read as a suite, readers interested in particular aspects of Australia’s forest estate and its management may wish to focus on specifi c indicators, which have been written in such a way that they can be read as stand-alone papers (although references have been grouped at the end of the report). Those looking for a quick overview of the state of Australia’s forests should start with the executive summary at the front of the report.
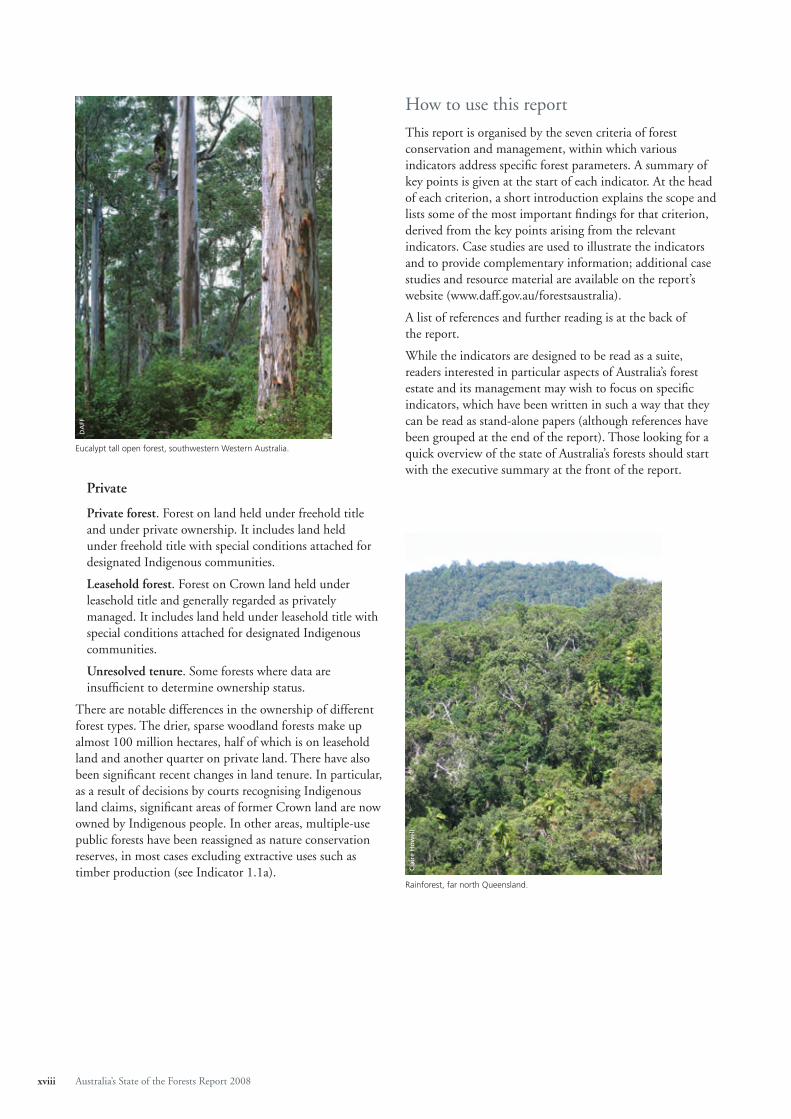
Rainforest, far north Queensland.
Cla
ire
Ho
wel
l
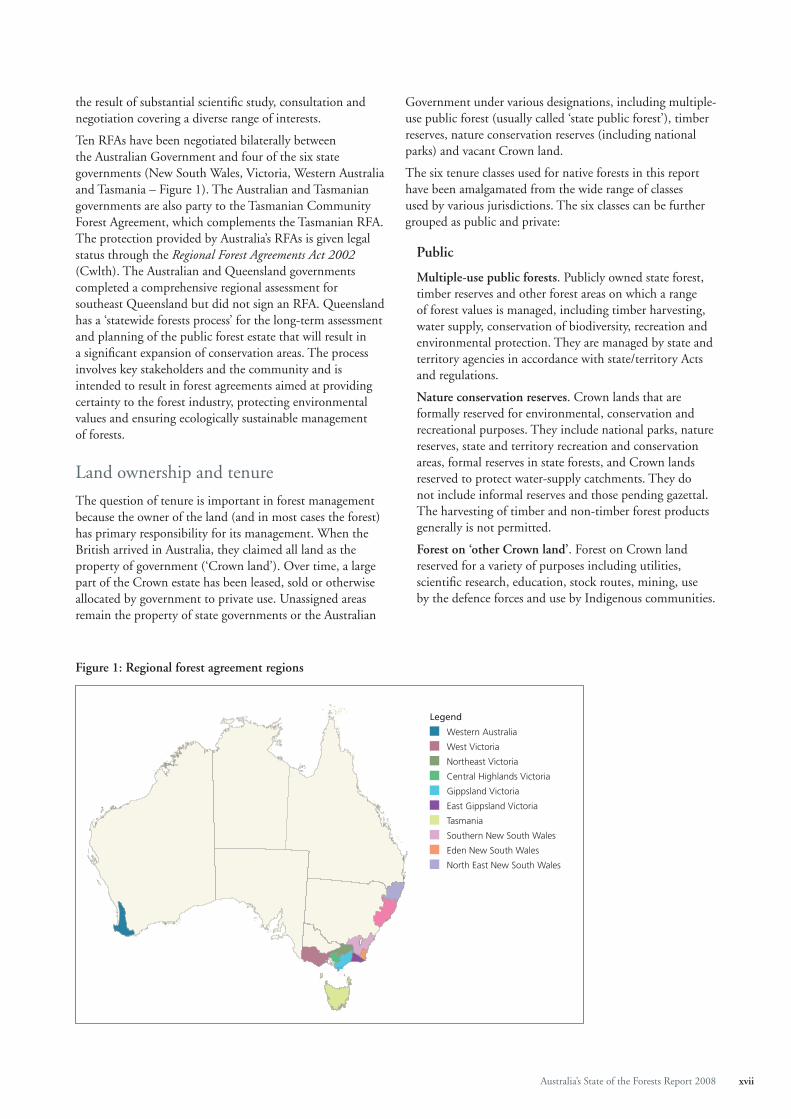
Eucalypt tall open forest, southwestern Western Australia.
DA
FF