australia's gender equality scorecard 2016-17 · pdf fileaustralia’s gender...
TRANSCRIPT

Australia’s gender equality scorecardKey findings from the Workplace Gender Equality Agency’s 2016-17 reporting data
November 2017
About the Workplace Gender Equality Agency’s dataset
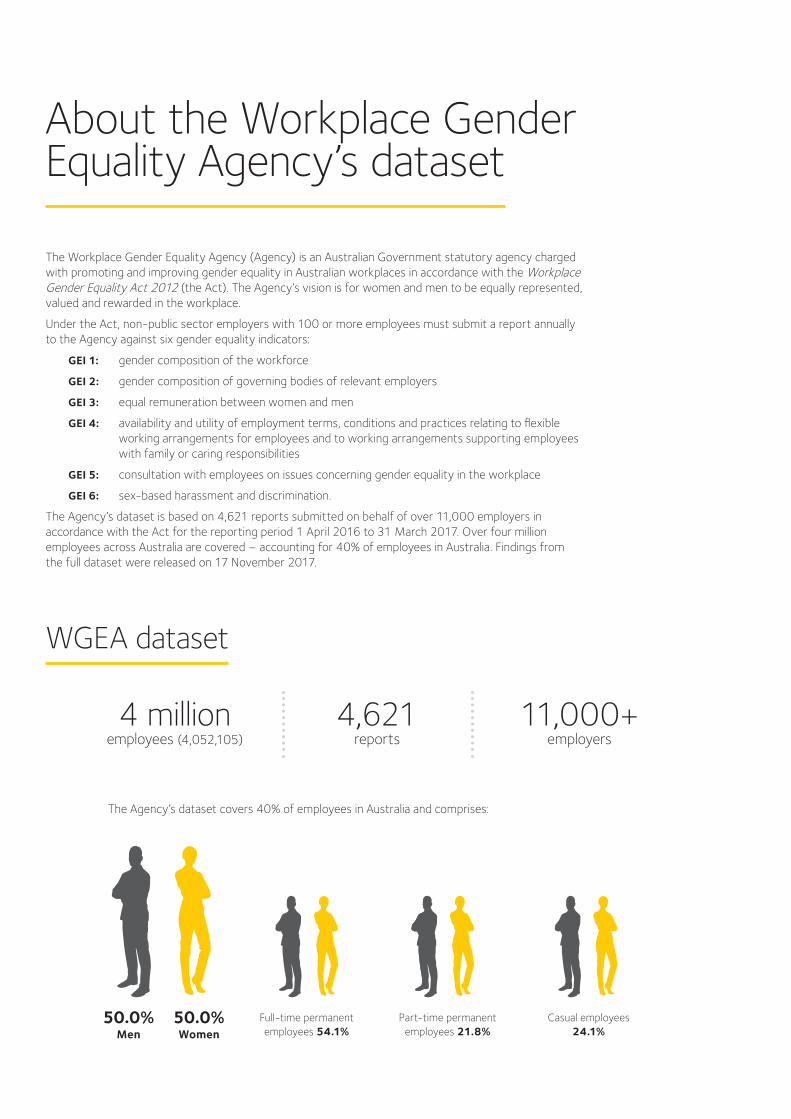
The Workplace Gender Equality Agency (Agency) is an Australian Government statutory agency charged with promoting and improving gender equality in Australian workplaces in accordance with the Workplace Gender Equality Act 2012 (the Act). The Agency’s vision is for women and men to be equally represented, valued and rewarded in the workplace.
Under the Act, non-public sector employers with 100 or more employees must submit a report annually to the Agency against six gender equality indicators:
GEI 1: gender composition of the workforce
GEI 2: gender composition of governing bodies of relevant employers
GEI 3: equal remuneration between women and men
GEI 4: availability and utility of employment terms, conditions and practices relating to flexible working arrangements for employees and to working arrangements supporting employees with family or caring responsibilities
GEI 5: consultation with employees on issues concerning gender equality in the workplace
GEI 6: sex-based harassment and discrimination.
The Agency’s dataset is based on 4,621 reports submitted on behalf of over 11,000 employers in accordance with the Act for the reporting period 1 April 2016 to 31 March 2017. Over four million employees across Australia are covered – accounting for 40% of employees in Australia. Findings from the full dataset were released on 17 November 2017.
WGEA dataset
The Agency’s dataset covers 40% of employees in Australia and comprises:
4 million employees (4,052,105)
4,621 reports
11,000+ employers
50.0% Men
50.0% Women
Full-time permanent employees 54.1%
Part-time permanent employees 21.8%
Casual employees 24.1%
Progress update
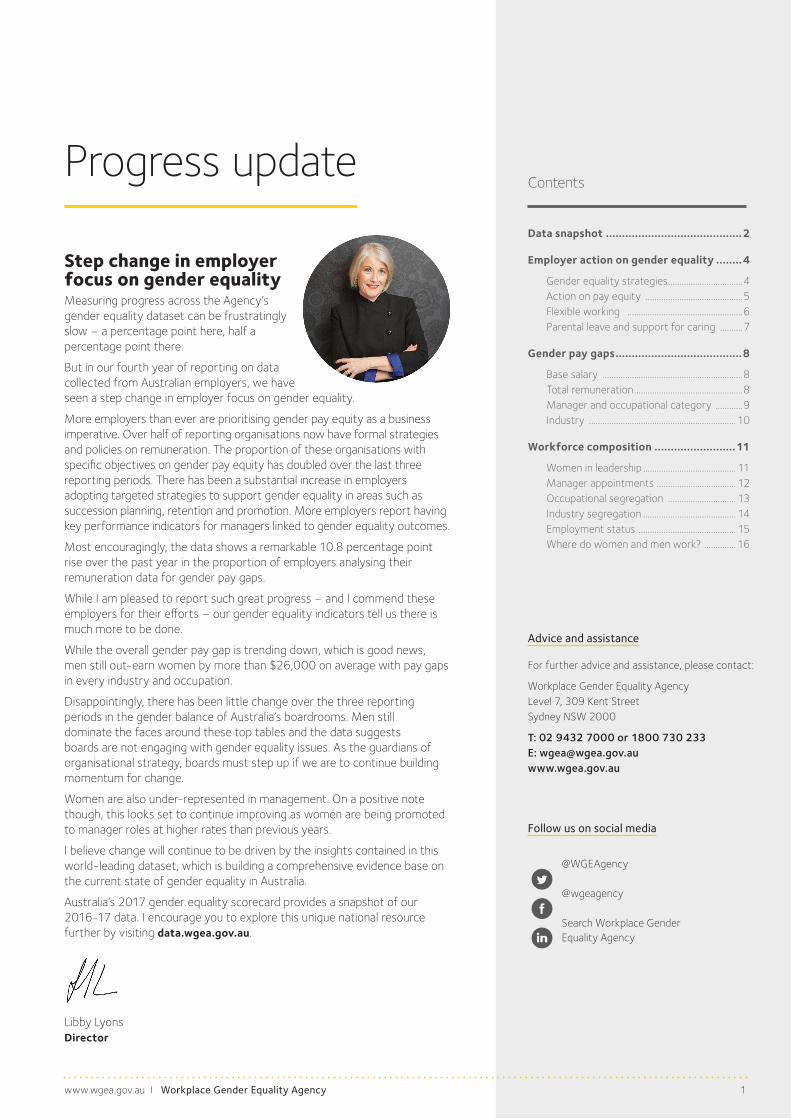
Step change in employer focus on gender equality Measuring progress across the Agency’s gender equality dataset can be frustratingly slow – a percentage point here, half a percentage point there.
But in our fourth year of reporting on data collected from Australian employers, we have seen a step change in employer focus on gender equality.
More employers than ever are prioritising gender pay equity as a business imperative. Over half of reporting organisations now have formal strategies and policies on remuneration. The proportion of these organisations with specific objectives on gender pay equity has doubled over the last three reporting periods. There has been a substantial increase in employers adopting targeted strategies to support gender equality in areas such as succession planning, retention and promotion. More employers report having key performance indicators for managers linked to gender equality outcomes.
Most encouragingly, the data shows a remarkable 10.8 percentage point rise over the past year in the proportion of employers analysing their remuneration data for gender pay gaps.
While I am pleased to report such great progress – and I commend these employers for their efforts – our gender equality indicators tell us there is much more to be done.
While the overall gender pay gap is trending down, which is good news, men still out-earn women by more than $26,000 on average with pay gaps in every industry and occupation.
Disappointingly, there has been little change over the three reporting periods in the gender balance of Australia’s boardrooms. Men still dominate the faces around these top tables and the data suggests boards are not engaging with gender equality issues. As the guardians of organisational strategy, boards must step up if we are to continue building momentum for change.
Women are also under-represented in management. On a positive note though, this looks set to continue improving as women are being promoted to manager roles at higher rates than previous years.
I believe change will continue to be driven by the insights contained in this world-leading dataset, which is building a comprehensive evidence base on the current state of gender equality in Australia.
Australia’s 2017 gender equality scorecard provides a snapshot of our 2016-17 data. I encourage you to explore this unique national resource further by visiting data.wgea.gov.au.
Libby Lyons Director
Contents......................................................
Data snapshot ..........................................2
Employer action on gender equality ........4
Gender equality strategies .................................4 Action on pay equity ...........................................5 Flexible working ...................................................6 Parental leave and support for caring ..........7
Gender pay gaps .......................................8
Base salary ..............................................................8 Total remuneration ................................................8 Manager and occupational category ............9 Industry ................................................................. 10
Workforce composition .........................11
Women in leadership ......................................... 11 Manager appointments ................................... 12 Occupational segregation .............................. 13 Industry segregation ......................................... 14 Employment status ........................................... 15 Where do women and men work? .............. 16
Advice and assistance
For further advice and assistance, please contact:
Workplace Gender Equality Agency Level 7, 309 Kent Street Sydney NSW 2000
T: 02 9432 7000 or 1800 730 233 E: [email protected] www.wgea.gov.au
Follow us on social media
@WGEAgency
@wgeagency
Search Workplace Gender Equality Agency
1www.wgea.gov.au I Workplace Gender Equality Agency
www.wgea.gov.au I Workplace Gender Equality Agency 2
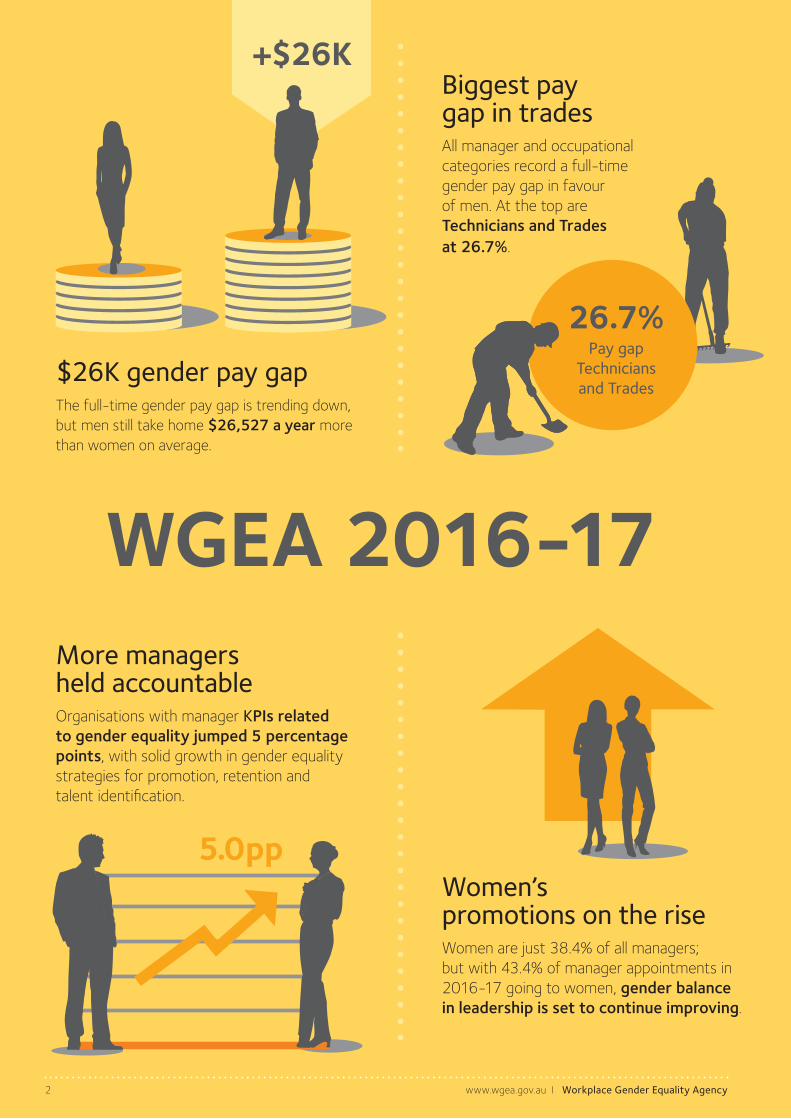
$26K gender pay gap The full-time gender pay gap is trending down, but men still take home $26,527 a year more than women on average.
Biggest pay gap in trades All manager and occupational categories record a full-time gender pay gap in favour of men. At the top are Technicians and Trades at 26.7%.
+$26K
WGEA 2016-17 Data Snapshot
26.7%Pay gap
Technicians and Trades
More managers held accountable Organisations with manager KPIs related to gender equality jumped 5 percentage points, with solid growth in gender equality strategies for promotion, retention and talent identification.
5.0ppWomen’s promotions on the rise Women are just 38.4% of all managers; but with 43.4% of manager appointments in 2016-17 going to women, gender balance in leadership is set to continue improving.

Finance nearly loses pay gap crown Financial and Insurance Services still has the highest gender pay gap at 31.9%, but it is declining year-on-year. At 31.4%, Rental, Hiring and Real Estate Services has increased this year and nearly caught up.
3www.wgea.gov.au I Workplace Gender Equality Agency
Employers promote flexible workMore employers have a policy or strategy for flexible working (up 5.3pp to 68.3%) but only about a quarter offer manager training on flexibility.
68.3%
WGEA 2016-17 Data Snapshot
31.4% ▲ 31.9% ▼
Rental, Hiring and Real Estate
Services
Financial and Insurance Services
Employers act on pay equity Employers analysing their pay data for gender pay gaps has jumped nearly 11 percentage points in a year to 37.7%.
10.8pp
Gender equality missing at the
board table
Female representation on boards is static (24.9%) and few management teams are reporting pay equity metrics to the board.

www.wgea.gov.au I Workplace Gender Equality Agency 4
Gender equality strategies
Employers focus on gender equality
The data shows substantial improvements in employer focus on workplace gender equality across a number of areas over the past 12 months.
The proportion of organisations with an overall gender equality strategy and/or policy has increased only modestly (up 0.9pp to 71.5%).
However, there have been large gains in employers with targeted policies or strategies in place to support gender equality in succession planning, talent identification, retention and promotions.
The proportion of employers with Key Performance Indicators (KPIs) for managers relating to gender equality has increased by an encouraging 5.0pp over the past 12 months. However, it is still less than three in ten of all employers so there is much room for improvement.
Employer action on gender equality
Promotions
Talent identification
Retention
Succession planning
KPIs for managers
2013-14
70
60
50
40
30
20
10
0
2014-15 2015-16 2016-17
Chart 1 Percentage of organisations with policies and/or strategies to support gender equality in specific human resource functions
www.wgea.gov.au I Workplace Gender Equality Agency 5
Action on pay equity
More organisations prioritise pay equity
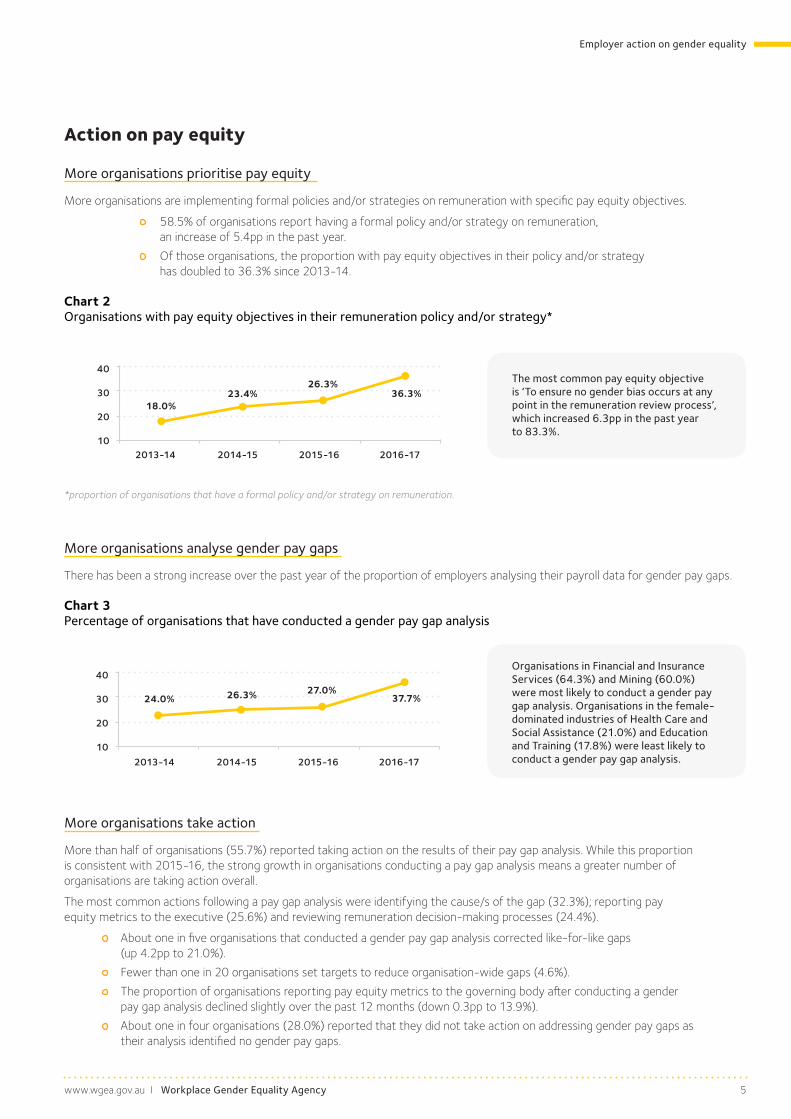
More organisations are implementing formal policies and/or strategies on remuneration with specific pay equity objectives.
58.5% of organisations report having a formal policy and/or strategy on remuneration, an increase of 5.4pp in the past year.
Of those organisations, the proportion with pay equity objectives in their policy and/or strategy has doubled to 36.3% since 2013-14.
Chart 2 Organisations with pay equity objectives in their remuneration policy and/or strategy*
*proportion of organisations that have a formal policy and/or strategy on remuneration.
More organisations analyse gender pay gaps
There has been a strong increase over the past year of the proportion of employers analysing their payroll data for gender pay gaps.
Chart 3 Percentage of organisations that have conducted a gender pay gap analysis
More organisations take action
More than half of organisations (55.7%) reported taking action on the results of their pay gap analysis. While this proportion is consistent with 2015-16, the strong growth in organisations conducting a pay gap analysis means a greater number of organisations are taking action overall.
The most common actions following a pay gap analysis were identifying the cause/s of the gap (32.3%); reporting pay equity metrics to the executive (25.6%) and reviewing remuneration decision-making processes (24.4%).
About one in five organisations that conducted a gender pay gap analysis corrected like-for-like gaps (up 4.2pp to 21.0%).
Fewer than one in 20 organisations set targets to reduce organisation-wide gaps (4.6%).
The proportion of organisations reporting pay equity metrics to the governing body after conducting a gender pay gap analysis declined slightly over the past 12 months (down 0.3pp to 13.9%).
About one in four organisations (28.0%) reported that they did not take action on addressing gender pay gaps as their analysis identified no gender pay gaps.
The most common pay equity objective is ‘To ensure no gender bias occurs at any point in the remuneration review process’, which increased 6.3pp in the past year to 83.3%.
Organisations in Financial and Insurance Services (64.3%) and Mining (60.0%) were most likely to conduct a gender pay gap analysis. Organisations in the female-dominated industries of Health Care and Social Assistance (21.0%) and Education and Training (17.8%) were least likely to conduct a gender pay gap analysis. 2013-14
40
30
20
102014-15 2015-16 2016-17
24.0% 26.3% 27.0%37.7%
2013-14
40
30
20
102014-15 2015-16 2016-17
18.0%23.4%
26.3%36.3%
Employer action on gender equality
www.wgea.gov.au I Workplace Gender Equality Agency 6
Flexible working
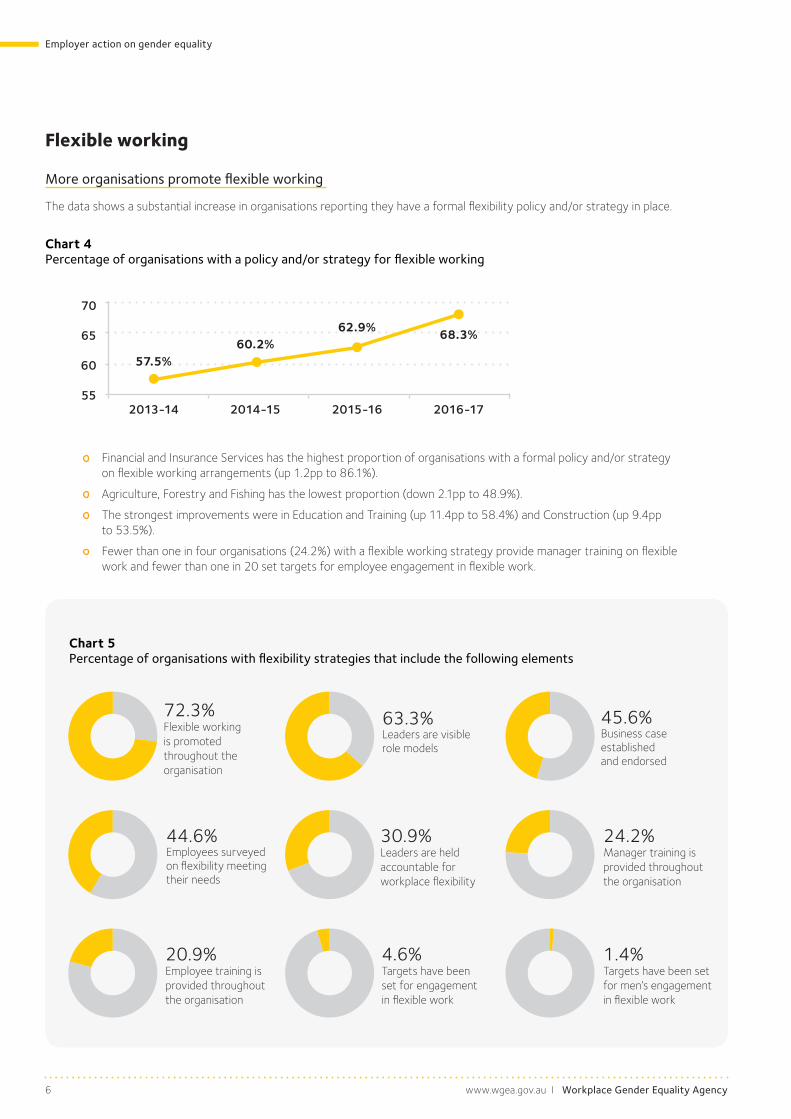
More organisations promote flexible working
The data shows a substantial increase in organisations reporting they have a formal flexibility policy and/or strategy in place.
Chart 4 Percentage of organisations with a policy and/or strategy for flexible working
Financial and Insurance Services has the highest proportion of organisations with a formal policy and/or strategy on flexible working arrangements (up 1.2pp to 86.1%).
Agriculture, Forestry and Fishing has the lowest proportion (down 2.1pp to 48.9%).
The strongest improvements were in Education and Training (up 11.4pp to 58.4%) and Construction (up 9.4pp to 53.5%).
Fewer than one in four organisations (24.2%) with a flexible working strategy provide manager training on flexible work and fewer than one in 20 set targets for employee engagement in flexible work.
Employer action on gender equality
45.6%Business case established and endorsed
24.2%Manager training is provided throughout the organisation
63.3%Leaders are visible role models
20.9%Employee training is provided throughout the organisation
Chart 5 Percentage of organisations with flexibility strategies that include the following elements
30.9%Leaders are held accountable for workplace flexibility
4.6%Targets have been set for engagement in flexible work
1.4%Targets have been set for men’s engagement in flexible work
72.3%Flexible working is promoted throughout the organisation
44.6%Employees surveyed on flexibility meeting their needs
2013-14
70
65
60
552014-15 2015-16 2016-17
57.5%60.2%
62.9% 68.3%

www.wgea.gov.au I Workplace Gender Equality Agency 7
Parental leave and support for caring
Access to paid parental leave varies
Fewer than half of employers offer paid parental leave in addition to the government scheme. Provision of paid parental leave varies significantly by industry and organisation size.
In 2016-17, 45.9% of employers offered paid parental leave for primary carers.
Primary carer’s leave is most commonly offered in Electricity, Gas, Water and Waste Services (78.7% of employers) and Education and Training (78.5%); and least commonly offered in Accommodation and Food Services (20.2%) and Retail Trade (20.4%).
Primary carer’s leave is most commonly available in large organisations: 67.2% of organisations with 5000+ employees offer it, compared with 39.7% of organisations with fewer than 250 employees.
Average length of paid primary carer’s leave offered is 10.1 weeks.
Women utilised 95.3% of all primary carer’s leave.
39.3% of employers offered paid parental leave for secondary carers.
Average length of paid secondary carer’s leave offered is 7.3 days.
Men utilised 94.8% of all secondary carer’s leave.
Overall, 74.3% of all periods of paid parental leave were utilised by women.
Women more likely to leave work during parental leave
Ceasing employment during parental leave declined for both women and men over the past year. Women were seven times as likely as men to leave the workplace during parental leave.
8.6% of women on parental leave ceased employment (down 1.2pp since 2015-16).
1.2% of men on parental leave ceased employment (down 0.8pp).
Mixed progress on support for caring
There is substantial growth in organisations reporting they have a formal policy and/or strategy to support employees with family and caring responsibilities (up 5.5pp to 62.0%).
However, for the second year in a row, the proportion of employers offering non-leave based measures to support employees with caring responsibilities has declined (down 4.4pp over two years to 51.9%).
The most common non-leave based measures are breastfeeding facilities (32.9%) and referral services to support employees with family and/or caring responsibilities (24.7%).
Just 3.4% of employers offer employer-subsidised childcare and 3.7% offer return to work bonuses on return from parental leave.
Domestic violence
More organisations support employees experiencing domestic violence
More employers have a formal policy and/or strategy to support employees who are experiencing family or domestic violence, up 3.8pp to 43.1% over the last year. The industry with the strongest increase was Construction, up 10.4pp since last year.
Over eight in 10 (81.9%) employers offered other forms of support, especially flexible working arrangements (61.0%), access to unpaid leave (59.6%) and referral to appropriate domestic violence support services for expert advice (34.9%).
Employer action on gender equality
www.wgea.gov.au I Workplace Gender Equality Agency 8
Gender pay gap
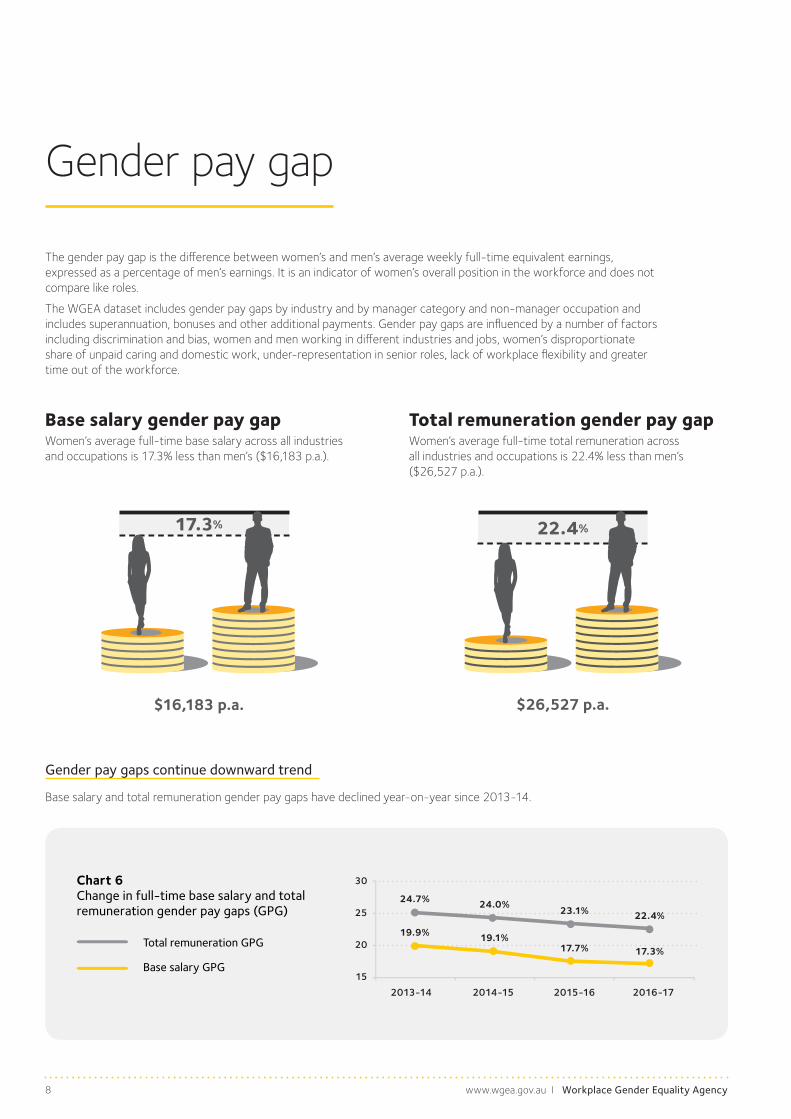
The gender pay gap is the difference between women’s and men’s average weekly full-time equivalent earnings, expressed as a percentage of men’s earnings. It is an indicator of women’s overall position in the workforce and does not compare like roles.
The WGEA dataset includes gender pay gaps by industry and by manager category and non-manager occupation and includes superannuation, bonuses and other additional payments. Gender pay gaps are influenced by a number of factors including discrimination and bias, women and men working in different industries and jobs, women’s disproportionate share of unpaid caring and domestic work, under-representation in senior roles, lack of workplace flexibility and greater time out of the workforce.
Total remuneration GPG
Base salary GPG
Chart 6 Change in full-time base salary and total remuneration gender pay gaps (GPG)
2013-14
30
25
20
15
2014-15 2015-16 2016-17
24.7%
19.9%
24.0%
19.1%17.7%
22.4%
17.3%
23.1%
Gender pay gaps continue downward trend
Base salary and total remuneration gender pay gaps have declined year-on-year since 2013-14.
Base salary gender pay gapWomen’s average full-time base salary across all industries and occupations is 17.3% less than men’s ($16,183 p.a.).
17.3%
$16,183 p.a.
Total remuneration gender pay gap Women’s average full-time total remuneration across all industries and occupations is 22.4% less than men’s ($26,527 p.a.).
22.4%
$26,527 p.a.
www.wgea.gov.au I Workplace Gender Equality Agency 9
Gender pay gaps by manager category and non-manager occupation
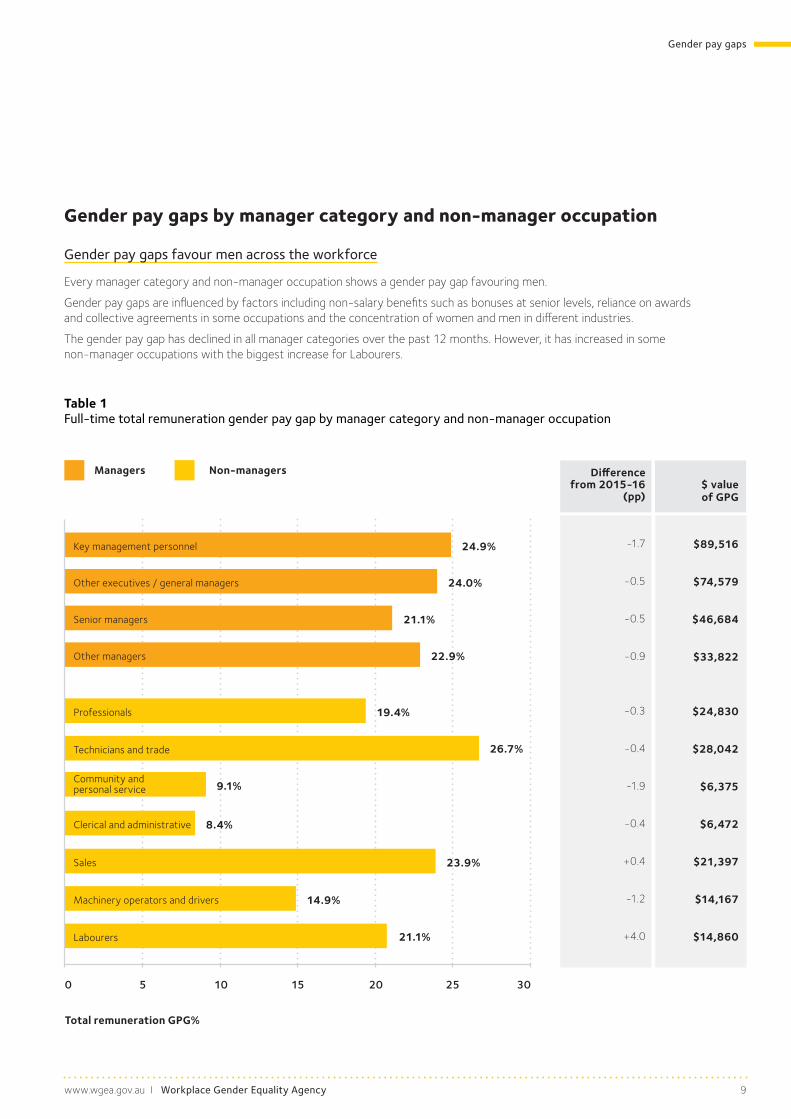
Gender pay gaps favour men across the workforce
Every manager category and non-manager occupation shows a gender pay gap favouring men.
Gender pay gaps are influenced by factors including non-salary benefits such as bonuses at senior levels, reliance on awards and collective agreements in some occupations and the concentration of women and men in different industries.
The gender pay gap has declined in all manager categories over the past 12 months. However, it has increased in some non-manager occupations with the biggest increase for Labourers.
Table 1 Full-time total remuneration gender pay gap by manager category and non-manager occupation
Gender pay gaps
Key management personnel
Other executives / general managers
Senior managers
Other managers
Professionals
Technicians and trade
Community and personal service
Clerical and administrative
Sales
Machinery operators and drivers
Labourers
Total remuneration GPG%
Managers Non-managers
0 5 10 15 20 25 30
Difference from 2015-16
(pp)
-1.7
-0.5
-0.5
-0.9
-0.3
-0.4
-1.9
-0.4
+0.4
-1.2
+4.0
$ value of GPG
$89,516
$74,579
$46,684
$33,822
$24,830
$28,042
$6,375
$6,472
$21,397
$14,167
$14,860
24.9%
24.0%
21.1%
22.9%
19.4%
26.7%
9.1%
8.4%
23.9%
14.9%
21.1%
www.wgea.gov.au I Workplace Gender Equality Agency 10
Gender pay gaps by industry
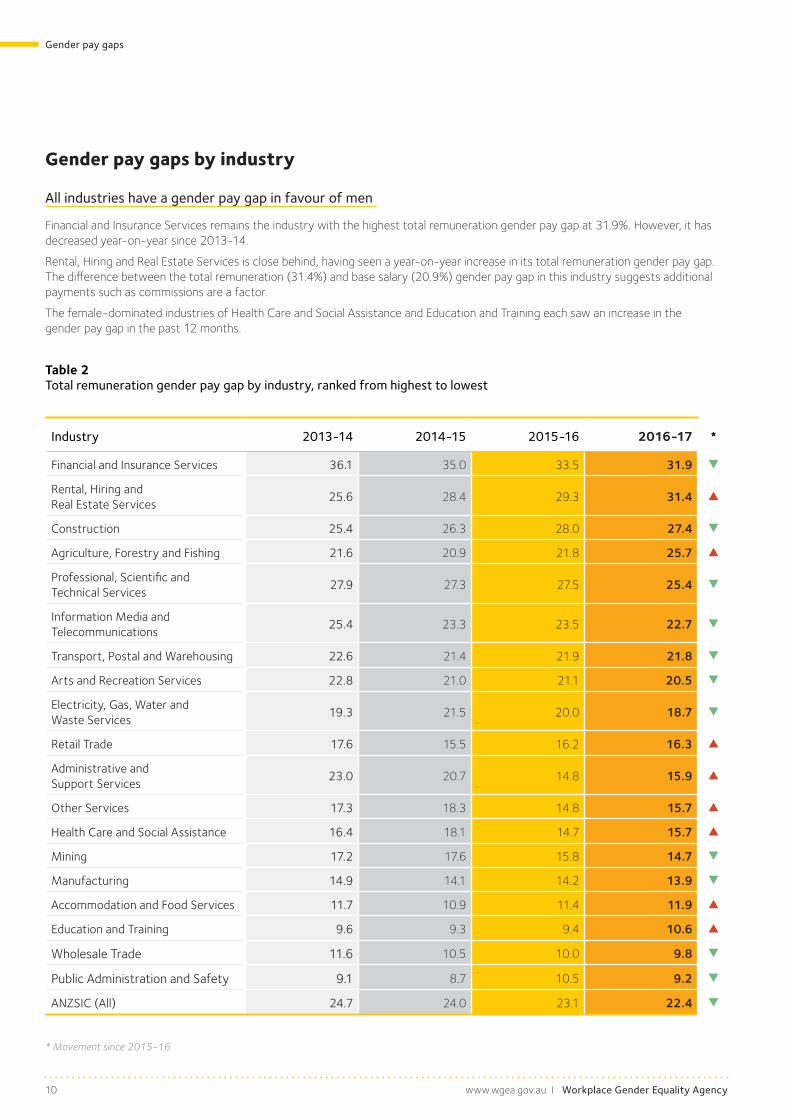
All industries have a gender pay gap in favour of men
Financial and Insurance Services remains the industry with the highest total remuneration gender pay gap at 31.9%. However, it has decreased year-on-year since 2013-14.
Rental, Hiring and Real Estate Services is close behind, having seen a year-on-year increase in its total remuneration gender pay gap. The difference between the total remuneration (31.4%) and base salary (20.9%) gender pay gap in this industry suggests additional payments such as commissions are a factor.
The female-dominated industries of Health Care and Social Assistance and Education and Training each saw an increase in the gender pay gap in the past 12 months.
Table 2 Total remuneration gender pay gap by industry, ranked from highest to lowest
Industry 2013-14 2014-15 2015-16 2016-17 *
Financial and Insurance Services 36.1 35.0 33.5 31.9 ▼
Rental, Hiring and Real Estate Services
25.6 28.4 29.3 31.4 ▲
Construction 25.4 26.3 28.0 27.4 ▼
Agriculture, Forestry and Fishing 21.6 20.9 21.8 25.7 ▲
Professional, Scientific and Technical Services
27.9 27.3 27.5 25.4 ▼
Information Media and Telecommunications
25.4 23.3 23.5 22.7 ▼
Transport, Postal and Warehousing 22.6 21.4 21.9 21.8 ▼
Arts and Recreation Services 22.8 21.0 21.1 20.5 ▼
Electricity, Gas, Water and Waste Services
19.3 21.5 20.0 18.7 ▼
Retail Trade 17.6 15.5 16.2 16.3 ▲
Administrative and Support Services
23.0 20.7 14.8 15.9 ▲
Other Services 17.3 18.3 14.8 15.7 ▲
Health Care and Social Assistance 16.4 18.1 14.7 15.7 ▲
Mining 17.2 17.6 15.8 14.7 ▼
Manufacturing 14.9 14.1 14.2 13.9 ▼
Accommodation and Food Services 11.7 10.9 11.4 11.9 ▲
Education and Training 9.6 9.3 9.4 10.6 ▲
Wholesale Trade 11.6 10.5 10.0 9.8 ▼
Public Administration and Safety 9.1 8.7 10.5 9.2 ▼
ANZSIC (All) 24.7 24.0 23.1 22.4 ▼
* Movement since 2015-16
Gender pay gaps

www.wgea.gov.au I Workplace Gender Equality Agency 11
Workforce composition
Women in leadership
The most senior roles are heavily male-dominated
The representation of women declines with seniority. However, the representation of women across all manager categories has grown consistently since 2013-14.
Chart 7 Proportion of women by manager category
Female managers overall 38.4% (up from 35.9% in 2013-14)
6.3% of all managers are employed on a part-time basis
CEO / Head of Business
Other executives / general managers
Senior managers
Other managers
Key management personnel (KMP)
Men Women
34.9%2016-2017
2015-16 34.1%2014-15 33.0%2013–14 31.7%
30.4%2016-2017
2015-16 30.1%2014-15 29.3%2013–14 27.8%
29.7%2016-2017
2015-16 28.5%2014-15 27.4%2013–14 26.1%
16.5%2016-2017
2015-16 16.3%2014-15 15.4%2013–14 15.7%
41.9%2016-2017
2015-16 40.8%2014-15 40.0%2013–14 39.8%
www.wgea.gov.au I Workplace Gender Equality Agency 12
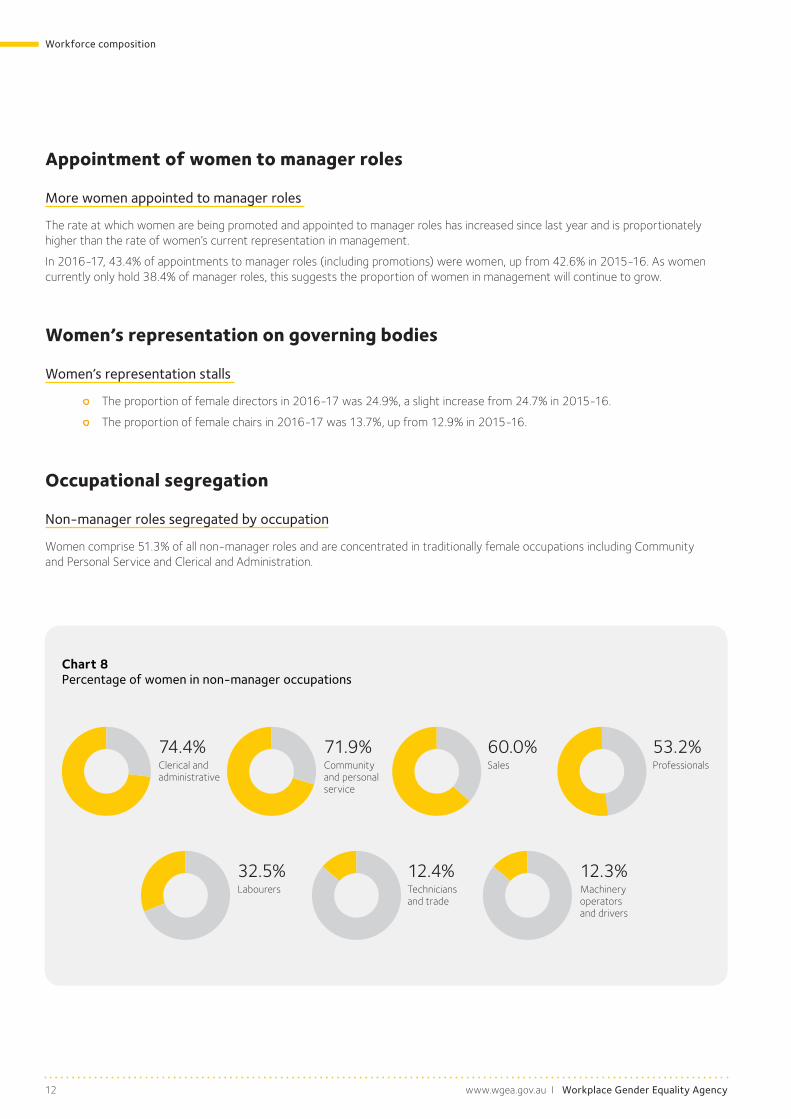
Chart 8 Percentage of women in non-manager occupations
Appointment of women to manager roles
More women appointed to manager roles
The rate at which women are being promoted and appointed to manager roles has increased since last year and is proportionately higher than the rate of women’s current representation in management.
In 2016-17, 43.4% of appointments to manager roles (including promotions) were women, up from 42.6% in 2015-16. As women currently only hold 38.4% of manager roles, this suggests the proportion of women in management will continue to grow.
Women’s representation on governing bodies
Women’s representation stalls
The proportion of female directors in 2016-17 was 24.9%, a slight increase from 24.7% in 2015-16.
The proportion of female chairs in 2016-17 was 13.7%, up from 12.9% in 2015-16.
Occupational segregation
Non-manager roles segregated by occupation
Women comprise 51.3% of all non-manager roles and are concentrated in traditionally female occupations including Community and Personal Service and Clerical and Administration.
Workforce composition
74.4%Clerical and administrative
60.0%Sales
53.2%Professionals
12.4%Technicians and trade
12.3%Machinery operators and drivers
32.5%Labourers
71.9%Community and personal service

www.wgea.gov.au I Workplace Gender Equality Agency 13
Women in management by industry
Increases in women managers across most industries
Women’s management representation has increased in most industries, including Education and Training which has passed 50% women in management for the first time, and Construction which has consistently had the lowest representation of women in management.
Table 3 Proportion of women in management by industry, from highest to lowest
Industry 2013-14 2014-15 2015-16 2016-17 *
Health Care and Social Assistance 69.3 70.3 70.2 70.3 ▲
Education and Training 48.4 49.2 49.7 51.2 ▲
Retail Trade 46.3 47.0 47.9 48.1 ▲
Accommodation and Food Services 47.7 44.4 44.3 45.0 ▲
Administrative and Support Services
49.8 49.2 43.1 44.7 ▲
Financial and Insurance Services 37.3 37.9 37.8 38.5 ▲
Other Services 39.5 38.8 38.4 38.0 ▼
Arts and Recreation Services 32.2 33.5 33.8 35.1 ▲
Rental, Hiring and Real Estate Services
32.5 32.6 32.9 33.8 ▲
Professional, Scientific and Technical Services
30.9 31.6 32.5 33.3 ▲
Information Media and Telecommunications
31.0 32.0 32.4 32.1 ▼
Wholesale Trade 22.3 23.8 27.0 25.8 ▼
Transport, Postal and Warehousing 23.7 23.7 24.6 25.6 ▲
Manufacturing 21.2 21.4 22.5 23.0 ▲
Electricity, Gas, Water and Waste Services
19.8 21.5 22.2 22.2 =
Public Administration and Safety 16.9 16.8 16.7 19.2 ▲
Agriculture, Forestry and Fishing 16.7 17.0 17.7 17.0 ▼
Mining 14.0 14.6 15.3 16.3 ▲
Construction 10.8 10.9 10.9 12.0 ▲
* Movement since 2015-16
Workforce composition
www.wgea.gov.au I Workplace Gender Equality Agency 14
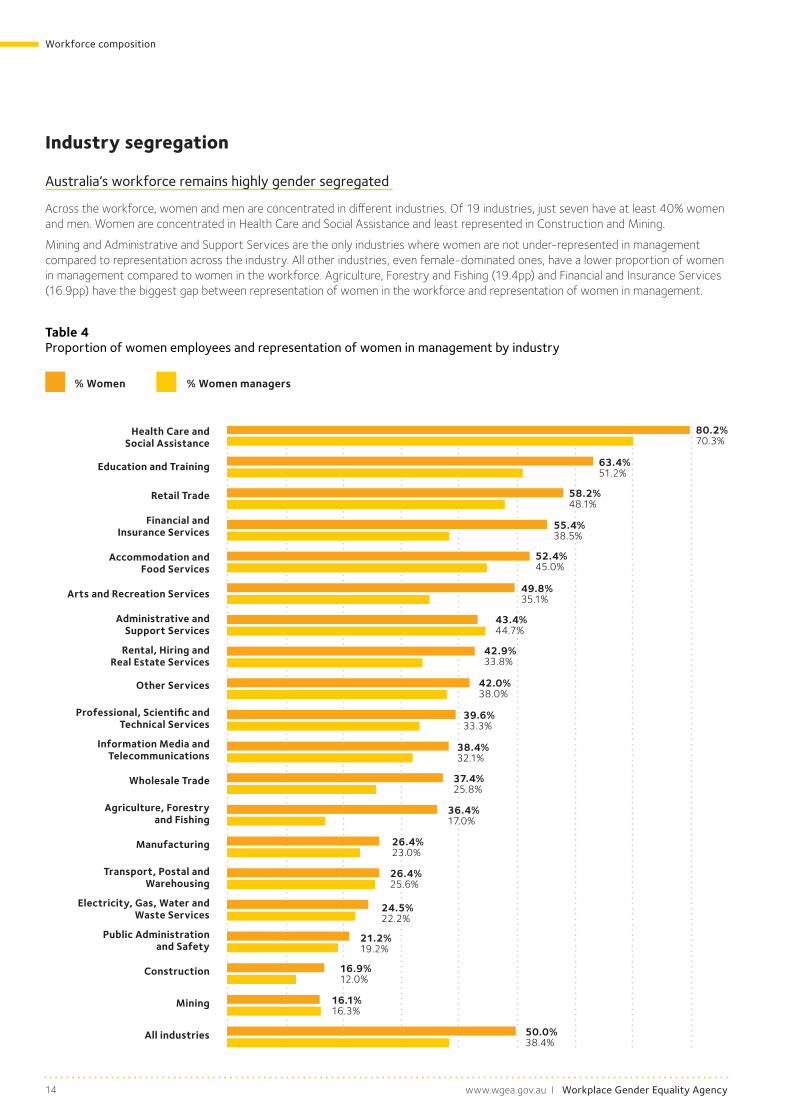
Industry segregation
Australia’s workforce remains highly gender segregated
Across the workforce, women and men are concentrated in different industries. Of 19 industries, just seven have at least 40% women and men. Women are concentrated in Health Care and Social Assistance and least represented in Construction and Mining.
Mining and Administrative and Support Services are the only industries where women are not under-represented in management compared to representation across the industry. All other industries, even female-dominated ones, have a lower proportion of women in management compared to women in the workforce. Agriculture, Forestry and Fishing (19.4pp) and Financial and Insurance Services (16.9pp) have the biggest gap between representation of women in the workforce and representation of women in management.
Table 4 Proportion of women employees and representation of women in management by industry
Workforce composition
Health Care and Social Assistance
Education and Training
Retail Trade
Financial and Insurance Services
Accommodation and Food Services
Arts and Recreation Services
Administrative and Support Services
Rental, Hiring and Real Estate Services
Other Services
Professional, Scientific and Technical Services
Information Media and Telecommunications
Wholesale Trade
Agriculture, Forestry and Fishing
Manufacturing
Transport, Postal and Warehousing
Electricity, Gas, Water and Waste Services
Public Administration and Safety
Construction
Mining
All industries
% Women managers% Women
80.2%70.3%
63.4%51.2%
58.2%48.1%
55.4% 38.5%
52.4%45.0%
49.8% 35.1%
43.4% 44.7%
42.9%33.8%
42.0% 38.0%
39.6% 33.3%
38.4% 32.1%
37.4% 25.8%
36.4%17.0%
26.4% 23.0%
26.4% 25.6%
24.5% 22.2%
21.2%19.2%
16.9% 12.0%
16.1% 16.3%
50.0% 38.4%

www.wgea.gov.au I Workplace Gender Equality Agency 15
Australian workforce by employment status
Women and men work differently
Chart 9 Chart 10 Female employees by employment status Male employees by employment status
Decline in full-time male jobs
The Agency’s 2016-17 dataset covers 4,052,105 employees in total - an additional 26,801 employees compared with 2015-16.
Representation of women in the dataset has increased, reaching an even balance (50.0%) for the first time.
Retail Trade is the largest industry represented. Health Care and Social Assistance is the second largest industry represented and has recorded the strongest year-on-year growth in employee numbers since 2013-14.
Compared with 2015-16, the 2016-17 dataset shows a decline in full-time male jobs matched by growth in part-time and casual male jobs. Male full-time job losses were greatest in Mining and Manufacturing. Female jobs have grown across all employment categories, with the strongest growth in part-time work.
Workforce composition
20.1%Full-time female(down 0.1pp)
16.4%Part-time female(up 0.3pp)
13.5%Casual female(up 0.1pp)
33.9%Full-time male
(down 0.8pp)
10.7%Casual
male(up 0.4pp)
5.4%Part-time male
(up 0.1pp)
Chart 11 Workforce composition by gender and employment status
40.2%Full-time female
26.9%Casual female
32.9%Part-time female
67.9%Full-time male
21.4%Casual male
10.7%Part-time male

www.wgea.gov.au I Workplace Gender Equality Agency 16
Where do women and men work?
Women
Across the Agency’s dataset, women’s workforce participation is concentrated in a few large industries. Health Care and Social Assistance is by far the largest employer of women, followed by Retail Trade.
Chart 12 Number of women employed by industry
Retail Trade388,080Accommodation
and Food Services106,311
Agriculture, Forestry and Fishing 10,090
Health Care and Social Assistance Services
503,157
Arts and Recreation Services43,639
Construction20,528
Education and Training
258,785
Financial and Insurance Services151,114
Information Media and Telecommunications49,440
Manufacturing89,265
Mining21,962
Other Services26,034
Professional, Scientific and Technical Services109,657
Public Administration and Safety 4,822
Rental, Hiring and Real Estate Services17,906
Transport, Postal and Warehousing51,644
Wholesale Trade43,377
Administrative and Support
Services120,029
Electricity, Gas, Water and Waste Services 10,372
Workforce composition
www.wgea.gov.au I Workplace Gender Equality Agency 17
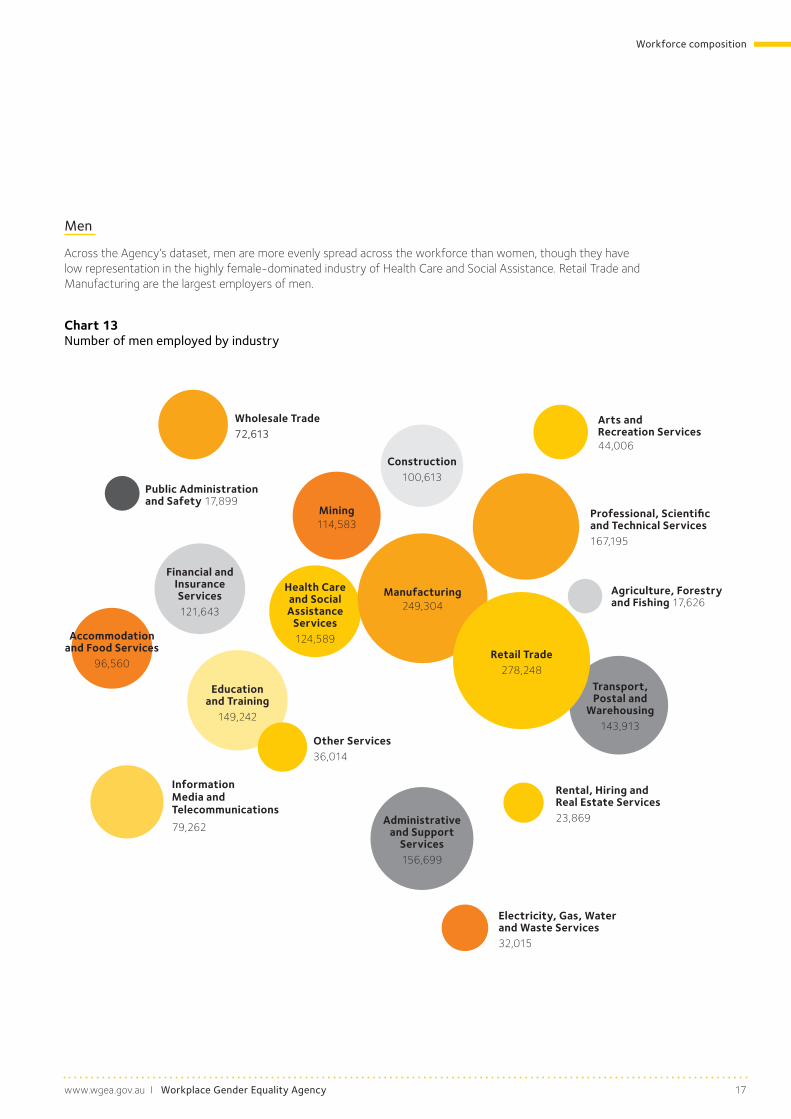
Professional, Scientific and Technical Services167,195
Health Care and Social Assistance
Services 124,589
Men
Across the Agency’s dataset, men are more evenly spread across the workforce than women, though they have low representation in the highly female-dominated industry of Health Care and Social Assistance. Retail Trade and Manufacturing are the largest employers of men.
Chart 13 Number of men employed by industry
Wholesale Trade72,613
Workforce composition
Administrative and Support
Services156,699
Agriculture, Forestry and Fishing 17,626
Arts and Recreation Services44,006
Construction100,613
Education and Training
149,242
Electricity, Gas, Water and Waste Services 32,015
Financial and Insurance Services121,643
Information Media and Telecommunications79,262
Manufacturing249,304
Mining114,583
Other Services36,014
Public Administration and Safety 17,899
Rental, Hiring and Real Estate Services23,869
Transport, Postal and
Warehousing143,913
Accommodation and Food Services
96,560Retail Trade
278,248
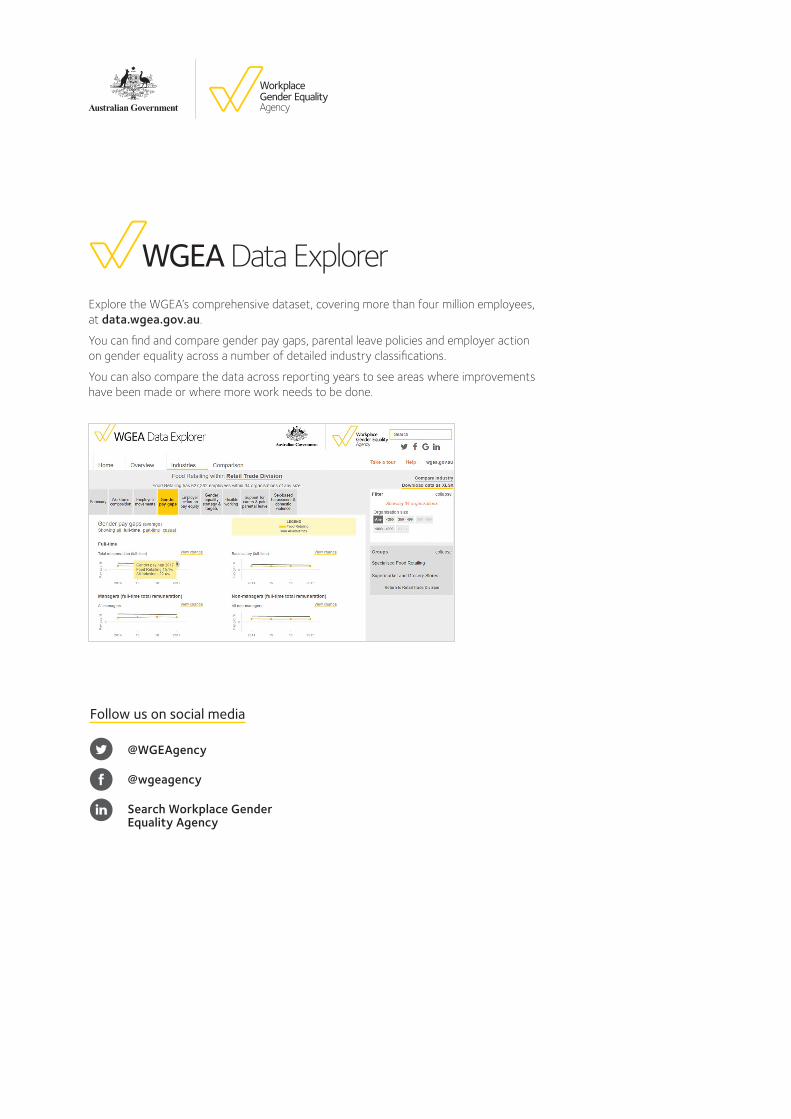
Follow us on social media
@WGEAgency
@wgeagency
Search Workplace Gender Equality Agency
Explore the WGEA’s comprehensive dataset, covering more than four million employees, at data.wgea.gov.au.
You can find and compare gender pay gaps, parental leave policies and employer action on gender equality across a number of detailed industry classifications.
You can also compare the data across reporting years to see areas where improvements have been made or where more work needs to be done.