australian water markets report 2017–18
TRANSCRIPT

1Australian Water Markets Report 2017–18 Southern Murray–Darling Basin Section
Australian Water Markets Report 2017–18
SOUTHERN MURRAY–DARLING BASIN SECTION

Australian Water Markets Report 2017–18: Southern Murray–Darling Basin Section
ISSN: 2207-1733
Published by the Bureau of Meteorology 2019
GPO Box 1289 Melbourne, Vic 3001 Tel: 03 9669 4000 Fax: 03 9669 4699
[email protected] www.bom.gov.au
With the exception of logos, photographs and the map of the Murray–Darling Basin on page 5, this publication is licensed under a Creative Commons Attribution 3.0 Australia Licence. The terms and conditions of the licence are available at creativecommons.org/licenses/by/3.0/au
Attribution for this publication should be: © Commonwealth of Australia (Bureau of Meteorology) 2019
The map of the Murray–Darling Basin on page 5 is based on material sourced from the Murray–Darling Basin Authority. It is available under a Creative Commons Attribution 4.0 International licence. The terms of that licence are at: creativecommons.org/licenses/by/4.0
Photographs © individual copyright holders 2019, as follows:
Cover: Aerial view of Lake Eildon and Goulburn river, Victoria (tsvibrav, iStock)
Key Messages: Aerial panoramic view of lake Burrinjuck and forested hills at sunset, New South Wales (tsvibrav, iStock)
References: Vic Murray red cliffs (zetter, iStock)

3Australian Water Markets Report 2017–18 Southern Murray–Darling Basin Section
CONTENTS
Key messages: Southern Murray–Darling Basin 4
Introduction 5
Water availability 6
Water markets in the southern MDB
– Supply and demand 7
Water supply-side factors 9
Water demand-side factors 12
Irrigation water demand 13
Environmental water 15
Surface water allocation markets 16
Inter-regional allocation trade 20
Commercial inter-regional trades 20
Environmental trades 20
Trade restrictions 21
Surface water entitlement markets 23
New water products 24
2018–19 so far (July – December 2018) 26
Water availability 26
Water storage levels 26
Allocations 26
Surface water allocation markets 27
Surface water entitlement markets 27
References 28

KEY MESSAGESSOUTHERN MURRAY–DARLING BASIN
• The 2017–18 season started with relatively high
water availability in terms of water storage levels,
allocations and carryover
• The second half of 2017–18 experienced
dry conditions with only small increases to
announced allocations. Allocation prices
increased in response
• The demand for water to irrigate higher value
commodities such as perennial plantings
(e.g. almonds) and cotton put upward pressure
on water prices during 2017–18
• There were record high volumes of allocation
traded with Commonwealth Environmental
Water Office environmental transfers
accounting for about 27 per cent of total
allocation trade volumes
• The imposition of water trade restrictions,
especially those relating to trade into the
Murrumbidgee water system, contributed to
notable price differences in parts of the southern
Murray–Darling Basin
• There were record low volumes of surface
water entitlements traded during 2017–18
but entitlements traded at a record high
average price
• Looking at the 2018–19 season so far, an
uncertain climate outlook has influenced
water trading with prices for allocations and
entitlements having increased further.

5Australian Water Markets Report 2017–18 Southern Murray–Darling Basin Section
INTRODUCTION
The southern Murray–Darling Basin (MDB) is Australia’s
most significant water market comprising about
80–90 per cent of all trading activity. It is widely
regarded as one of the more sophisticated water
markets in the world. It is unique because of a high
degree of hydrological connectivity allowing for relatively
unconstrained water trading between systems and
across state boundaries. It is the largest interconnected
river system in Australia, comprising around
40–50 per cent of Australian irrigated agriculture and
40–50 per cent of water used on Australian farms
(around 1 million hectares and 3800–4500 gigalitres
respectively (ABS 2016, 2017, 2018)). Based on 2014–15
data, the southern MDB region generated $5.3 billion in
gross value of irrigated production (ABARES 2018).
Water traded in the southern MDB in 2017–18 was
estimated to be worth around $1.4 billion (Bureau of
Meteorology 2018).
For this report, the southern MDB includes the
Murray, Murrumbidgee, Lachlan and Lower Darling
systems in southern New South Wales; the Murray,
Goulburn, Broken, Loddon, Campaspe, Ovens and
Wimmera–Mallee systems in northern Victoria;
and the Murray and Eastern Mount Lofty Ranges
systems in South Australia.
Water trading data presented in this report is available
on the Bureau of Meteorology’s Water Markets
Dashboard (www.bom.gov.au/water/dashboards/#/
water-markets/national/state/at).
Figure 1: Southern Murray–Darling Basin. Source: Murray–Darling Basin Authority
6Australian Water Markets Report 2017–18 Southern Murray–Darling Basin Section
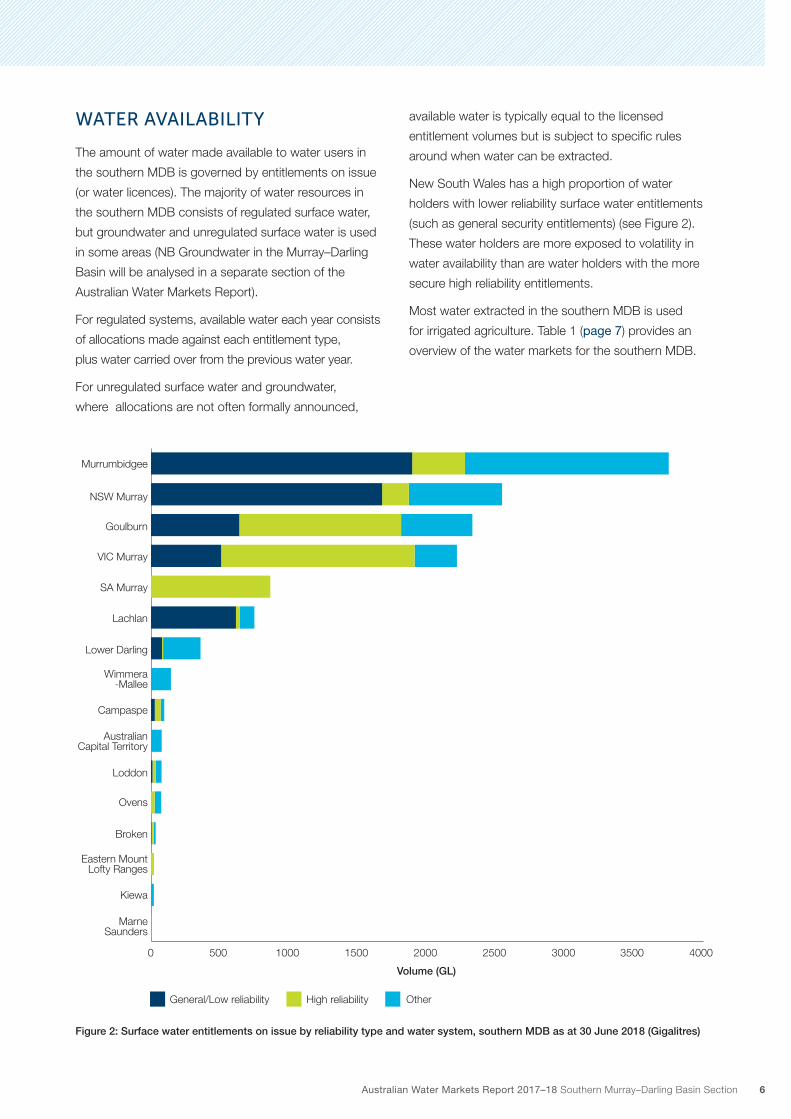
WATER AVAILABILITY
The amount of water made available to water users in
the southern MDB is governed by entitlements on issue
(or water licences). The majority of water resources in
the southern MDB consists of regulated surface water,
but groundwater and unregulated surface water is used
in some areas (NB Groundwater in the Murray–Darling
Basin will be analysed in a separate section of the
Australian Water Markets Report).
For regulated systems, available water each year consists
of allocations made against each entitlement type,
plus water carried over from the previous water year.
For unregulated surface water and groundwater,
where allocations are not often formally announced,
available water is typically equal to the licensed
entitlement volumes but is subject to specific rules
around when water can be extracted.
New South Wales has a high proportion of water
holders with lower reliability surface water entitlements
(such as general security entitlements) (see Figure 2).
These water holders are more exposed to volatility in
water availability than are water holders with the more
secure high reliability entitlements.
Most water extracted in the southern MDB is used
for irrigated agriculture. Table 1 (page 7) provides an
overview of the water markets for the southern MDB.
Figure 2: Surface water entitlements on issue by reliability type and water system, southern MDB as at 30 June 2018 (Gigalitres)
0 500 1000 1500 2000 2500 3000 3500 4000
Marne Saunders
Kiewa
Eastern MountLofty Ranges
Broken
Ovens
Loddon
AustralianCapital Territory
Campaspe
Wimmera-Mallee
Lower Darling
Lachlan
SA Murray
VIC Murray
Goulburn
NSW Murray
Murrumbidgee
General/Low reliability High reliability Other
Volume (GL)
7Australian Water Markets Report 2017–18 Southern Murray–Darling Basin Section
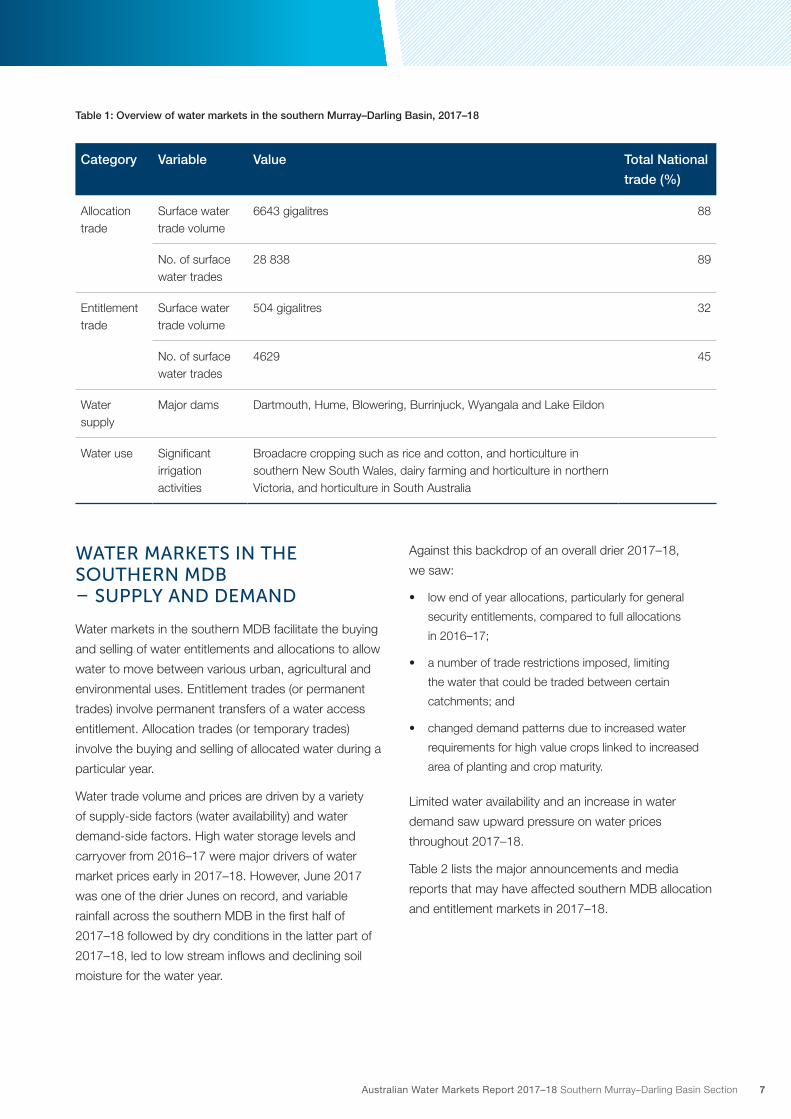
Table 1: Overview of water markets in the southern Murray–Darling Basin, 2017–18
Category Variable Value Total National
trade (%)
Allocation trade
Surface water trade volume
6643 gigalitres 88
No. of surface water trades
28 838 89
Entitlement trade
Surface water trade volume
504 gigalitres 32
No. of surface water trades
4629 45
Water supply
Major dams Dartmouth, Hume, Blowering, Burrinjuck, Wyangala and Lake Eildon
Water use Significant irrigation activities
Broadacre cropping such as rice and cotton, and horticulture in southern New South Wales, dairy farming and horticulture in northern Victoria, and horticulture in South Australia
WATER MARKETS IN THE SOUTHERN MDB – SUPPLY AND DEMAND
Water markets in the southern MDB facilitate the buying
and selling of water entitlements and allocations to allow
water to move between various urban, agricultural and
environmental uses. Entitlement trades (or permanent
trades) involve permanent transfers of a water access
entitlement. Allocation trades (or temporary trades)
involve the buying and selling of allocated water during a
particular year.
Water trade volume and prices are driven by a variety
of supply-side factors (water availability) and water
demand-side factors. High water storage levels and
carryover from 2016–17 were major drivers of water
market prices early in 2017–18. However, June 2017
was one of the drier Junes on record, and variable
rainfall across the southern MDB in the first half of
2017–18 followed by dry conditions in the latter part of
2017–18, led to low stream inflows and declining soil
moisture for the water year.
Against this backdrop of an overall drier 2017–18,
we saw:
• low end of year allocations, particularly for general
security entitlements, compared to full allocations
in 2016–17;
• a number of trade restrictions imposed, limiting
the water that could be traded between certain
catchments; and
• changed demand patterns due to increased water
requirements for high value crops linked to increased
area of planting and crop maturity.
Limited water availability and an increase in water
demand saw upward pressure on water prices
throughout 2017–18.
Table 2 lists the major announcements and media
reports that may have affected southern MDB allocation
and entitlement markets in 2017–18.

8Australian Water Markets Report 2017–18 Southern Murray–Darling Basin Section
Table 2: Water market news and announcements, southern Murray–Darling Basin, 2017–18
Date Description
1 July 2017 Following record rainfall and inflows over spring 2016, southern MDB storages opened at an average of 70 per cent capacity, compared to 38 per cent in the previous year.
1 July 2017 Due to these relatively high storage levels, opening allocations across the southern MDB were generally higher than in 2016–17:
• NSW Department of Industry announced:
- Murrumbidgee high security opened at 95 per cent and general security at 17 per cent
- NSW Murray high security opened at 97 per cent and general security at 11 per cent
• Goulburn-Murray Water determined that Victorian Murray high reliability would open at 66 per cent and Goulburn high reliability would open at 36 per cent
• SA Department for Environment and Water announced River Murray entitlement holders would receive a 100 per cent allocation
• Average carryover across NSW was around 30 per cent.
1 July 2017 Trade restrictions put in place from NSW to Victoria due to the risk of spill in Victoria being greater than 50 per cent. Trade into Victoria from NSW limited to back-trade in the Murray.
5 July 2017 Bureau of Meteorology El Niño outlook at neutral with no clear bias towards an El Niño or La Niña event evident. No clear climate signal led to uncertainty about water trading decision-making.
Mid July 2017 The Goulburn intervalley trade (IVT) limit was reached, restricting trade out of the Goulburn system.
15 Sep 2017 NSW Department of Industry increased allocations to NSW Murray and Murrumbidgee general security entitlements to 28 and 33 per cent respectively.
2 Oct 2017 Goulburn-Murray Water increased allocations to Victorian Murray and Goulburn high reliability entitlements to 100 and 81 per cent respectively.
20 Oct 2017 WaterNSW restricted trade into the Murrumbidgee for the first time since September 2013 following strong demand, particularly from Murrumbidgee cotton growers. Net trade balance of 0-100 GL is permitted out of the Murrumbidgee catchment.
10 Nov 2017 Trade restrictions into Victoria ease following the risk of spill in the Victorian Murray system dropping below 50 per cent. With the risk of spill less than 50 per cent, a net trade of 200 GL from NSW into Victoria was permitted.
1 Dec 2017 Goulburn-Murray Water increased allocations to Goulburn high reliability entitlements to 100 per cent.
15 Dec 2017 NSW Murray High Security entitlement traded at over $4000/ML recorded on the NSW State Register (the highest price paid to date for this entitlement type).
15 Dec 2017 NSW Department of Industry increased allocations to NSW Murray general security entitlements to 46 per cent.
15 Jan 2018 The Goulburn IVT limit began to ease following delivery of water from the Goulburn system to the Murray.
15 Mar 2018 NSW Department of Industry increased allocations to NSW Murray and Murrumbidgee general security entitlements to 51 and 38 per cent respectively.
16 Apr 2018 SA Department of Environment and Water announced water allocations for the 2018–19 water year to open at 100 per cent.
30 Apr 2018 Trade shuts down between NSW and Victoria and into and out of the Murrumbidgee ahead of the end of the 2017–18 water year. Inter-valley trade between remaining NSW catchments continues.

9Australian Water Markets Report 2017–18 Southern Murray–Darling Basin Section
Date Description
15 May 2018 NSW Department of Industry increased allocations to Murrumbidgee general security entitlements to 45 per cent.
31 May 2018 All trade within NSW shuts down for the 2017–18 water year.
5 Jun 2018 Murray–Darling Basin Authority releases its strategic priorities including:
• the accurate reporting of water trade prices,
• auditing the compliance and enforcement framework of unauthorised water take, and
• looking at how reporting of real-time usage could help protect the environment.
Jun 2018 Murrumbidgee high security entitlement traded for $4200/ML and general security entitlement traded at $2080/ML recorded on the NSW State Register (record high prices paid to date for these entitlement types).
30 Jun 2018 Southern MDB storages at 59 per cent (average capacity) at the end/close of the water year.
WATER SUPPLY-SIDE FACTORS
Rainfall in the southern MDB averaged 395 millimetres
in 2017–18, 30 per cent lower than in 2016–17 and
seven per cent lower than the 18 year median (Figure 3).
Following a dry 2017 winter, some areas in southern
NSW and Victoria then experienced the wettest
December day on record, and although the rainfall was
not sustained for a long period, the summer rainfall was
generally above average for much of the southern MDB.
By contrast, in autumn 2018 the southern MDB saw
below or very much below average rainfall.
Figure 3: Average annual rainfall, southern Murray–Darling Basin, 2000–01 to 2017–18
Average annual rainfall Median
Mill
imet
res
200
400
600
800
1000
2017
–18
2016
–17
2015
–16
2014
–15
2013
–14
2012
–13
2011
–12
2010
–11
2009
–10
2008
–09
2007
–08
2006
–07
2005
–06
2004
–05
2003
–04
2002
–03
2001
–02
2000
–01

10Australian Water Markets Report 2017–18 Southern Murray–Darling Basin Section
Murray system inflows in 2017–18 were well below
average and substantially lower than inflows in 2016–17
(see Figure 4). This was reflected in a decrease in
average storage volumes, from 70 per cent in the
southern MDB at the start of the year to 59 per cent on
30 June 2018 (Table 2). Storage volumes in the Murray
(Hume and Dartmouth) ended the year at 68 per cent.
The Murrumbidgee (Blowering and Burrinjuck) finished
the water year with 57 per cent and the Goulburn
(Eildon and Waranga) at 51 per cent.
Figure 4: Ranked Murray inflows, 1891–92 to 2017–18. Data source: Murray–Darling Basin Authority
Year
s o
f in
tere
st
Gigalitres of inflow per year, ranked from highest to lowest
Gig
alitres
1956–57 48 363
2016–17 16 568
2000–01 13 044
2017–18 4860
2014–15 4546
2006–07 914

11Australian Water Markets Report 2017–18 Southern Murray–Darling Basin Section
Figure 5 shows total water allocations to regulated
surface water entitlements in the southern MDB, with
and without carryover from previous years. In 2017–18,
total water allocations decreased by 26 per cent from
the previous year. The impact of this decrease was
lessened by the availability of carryover, with total water
availability (allocation + carryover) only decreasing by
15 per cent compared to 2016–17.
Figure 5: Water allocation volumes in the southern Murray–Darling Basin, 2007–08 to 2017–18
0
2000
4000
6000
8000
10 000
Gig
alitr
es
Allocation plus carryover Allocation
2007
2009
2008
2010
2011
2012
2013
2014
2015
2016
2017
2018
All high reliability surface water entitlements in the
southern MDB received full or nearly full allocations
in 2017–18. Reflecting the declining water availability
in 2017–18, general security entitlements in the
Murrumbidgee and NSW Murray were 45 per cent and
51 per cent compared to full allocations in the previous
year (Figure 6, page 12). Allocations to low security
entitlements in the Goulburn and Victorian Murray are
often zero as allocations are only made when there is
enough water available to meet existing commitments.

12Australian Water Markets Report 2017–18 Southern Murray–Darling Basin Section
NSW Murray—General
%
20
40
60
80
100
%
20
40
60
80
100
%
20
40
60
80
100
%
20
40
60
80
100
%
20
40
60
80
100
%
20
40
60
80
100
%
20
40
60
80
100
%
20
40
60
80
100
%
20
40
60
80
100
%
20
40
60
80
100
%
20
40
60
80
100
%
20
40
60
80
100
NSW Murrumbidgee—High
Vic. Goulburn—Low Vic. Goulburn—HighNSW Lower Darling—General NSW Lower Darling—High
NSW Murray—High NSW Murrumbidgee—General
Vic. Murray—Low Vic. Murray—High
2007
–08
2009
–10
2011
–12
2013
–14
2015
–16
2017
–18
2007
–08
2009
–10
2011
–12
2013
–14
2015
–16
2017
–18
2007
–08
2009
–10
2011
–12
2013
–14
2015
–16
2017
–18
2007
–08
2009
–10
2011
–12
2013
–14
2015
–16
2017
–18
Vic. Loddon—High SA Murray—High
Figure 6: Allocations for major entitlement types, southern Murray–Darling Basin, 2007–08 to 2017–18
WATER DEMAND-SIDE FACTORS
The southern MDB has diverse climatic and soil
conditions catering to a range of seasonal crops,
permanent plantings and livestock. Seasonal crops
such as rice have traditionally been grown in the
Murrumbidgee and parts of the NSW Murray while
further downstream in the NSW and Victorian Murray
perennial tree nuts including almonds, hazelnuts
and walnuts are key irrigated agricultural industries.
Horticulture, such as grapes, is a key industry in the
SA Murray region and dairy maintains a strong
presence in the Goulburn system.
Water users typically differ in their flexibility to change
water use from year to year. At one end of the spectrum,
irrigators with long-lived plantings such as trees and
vines have inelastic water demand and a higher
willingness to pay for water. Irrigators with smaller
margin annual crops such as rice have lower willingness
to pay and more elastic water demand.
Structural changes within irrigated agriculture buoyed by
strong commodity prices have created changing patterns
and competing demand for water in recent years.
13Australian Water Markets Report 2017–18 Southern Murray–Darling Basin Section
This structural shift was marked by the geographic
spread of high value crops, most notably the increasing
popularity in recent years of short season cotton replacing
more traditional rice crops in the Murrumbidgee. The area
planted to perennial tree nuts also continued to expand
strongly, particularly in the lower Murray. The planting of
higher value crops placed a premium on high and general
reliability water entitlement prices, as well as allocation
prices, with irrigators willing to pay higher prices to
protect their investments.
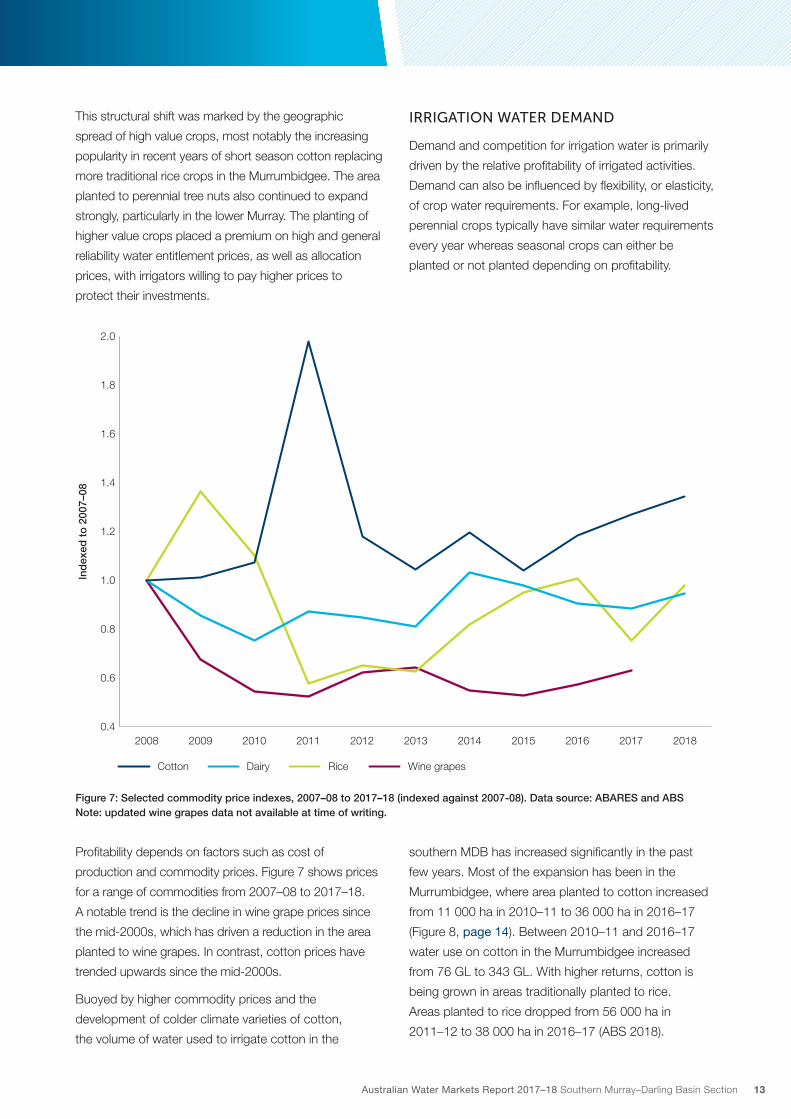
IRRIGATION WATER DEMAND
Demand and competition for irrigation water is primarily
driven by the relative profitability of irrigated activities.
Demand can also be influenced by flexibility, or elasticity,
of crop water requirements. For example, long-lived
perennial crops typically have similar water requirements
every year whereas seasonal crops can either be
planted or not planted depending on profitability.
Figure 7: Selected commodity price indexes, 2007–08 to 2017–18 (indexed against 2007-08). Data source: ABARES and ABS Note: updated wine grapes data not available at time of writing.
0.4
0.6
0.8
1.0
1.2
1.4
1.6
1.8
2.0
20182017201620152014201320122011201020092008
Cotton Dairy
Ind
exed
to
200
7–08
Rice Wine grapes
Profitability depends on factors such as cost of
production and commodity prices. Figure 7 shows prices
for a range of commodities from 2007–08 to 2017–18.
A notable trend is the decline in wine grape prices since
the mid-2000s, which has driven a reduction in the area
planted to wine grapes. In contrast, cotton prices have
trended upwards since the mid-2000s.
Buoyed by higher commodity prices and the
development of colder climate varieties of cotton,
the volume of water used to irrigate cotton in the
southern MDB has increased significantly in the past
few years. Most of the expansion has been in the
Murrumbidgee, where area planted to cotton increased
from 11 000 ha in 2010–11 to 36 000 ha in 2016–17
(Figure 8, page 14). Between 2010–11 and 2016–17
water use on cotton in the Murrumbidgee increased
from 76 GL to 343 GL. With higher returns, cotton is
being grown in areas traditionally planted to rice.
Areas planted to rice dropped from 56 000 ha in
2011–12 to 38 000 ha in 2016–17 (ABS 2018).

14Australian Water Markets Report 2017–18 Southern Murray–Darling Basin Section
0
10 000
20 000
30 000
40 000
50 000
60 000
2016–172015–162014–152013–142012–132011–122010–11
Hec
tare
s
CottonRice
Figure 8: Murrumbidgee region, Total area planted, 2010–11 to 2016–17. Data source: ABS 2018
Increasing commodity prices for almonds have helped
drive an expansion in perennial tree nut plantings (Figure 9).
Almond prices more than doubled between 2008 and 2014
on the back of consumer growth in emerging markets
in India and China and drought conditions in California,
the global production leader. After 2014, increased global
production to meet the rise in demand from emerging
markets, resulted in a price correction.
$A/k
gH
ectares
0
5000
10 000
15 000
20 000
25 000
30 000
35 000
40 000
45 000
20172016201520142013201220112010200920080
2
4
6
8
10
12
$A/kg (left axis)Area planted (ha)
Figure 9: Almond prices ($A/kg) and area planted to almonds, 2008 to 2017. Data source: United States Department of Agriculture – National Agricultural Statistics Service; Almond Board of Australia. Note: Prices shown are nominal. Figure shows calendar years.

15Australian Water Markets Report 2017–18 Southern Murray–Darling Basin Section
Across Australia, the area planted to almonds has
increased from 3546 ha in 2000 to 39 662 ha in 2017,
making Australia the world’s second largest almond
growing region. Almonds are now Australia’s most
valuable horticultural export. Of the 11.5 million almond
trees in Australia, 68 per cent are in Victoria, 20 per cent
in South Australia and 12 per cent in New South Wales
(ABA 2018). Increased water use by nut growers in the
Victorian lower Murray is largely due to the expansion of
area planted to almonds.
Water requirements for the lower Murray area are likely
to increase over time given the significant increase
in area planted to almonds. This has implications for
future water trade and water management relating to
flow capacity. For example, with increasing demand
for delivery of water downstream, periods of trade
restrictions could become more common due to the
need to manage system capacity constraints or to limit
third party impacts.
ENVIRONMENTAL WATER
The Commonwealth Government has acquired water
entitlements for the environment to ensure the ongoing
vitality and health of the river systems within the
Murray–Darling Basin. Under the Murray–Darling Basin
Plan the Commonwealth has committed to acquiring
an equivalent to 2750 GL of water for environmental
purposes. The Commonwealth has developed programs
where the water entitlements can be acquired through
either direct purchase or water efficiency measures,
including on- and off-farm water infrastructure projects.
In September 2015, the Commonwealth placed a
1500 GL cap on the volume of water that could be
acquired through direct purchase across the MDB.
The impact of the cap on direct purchases and shift
to water efficiency measures can be demonstrated
through Figure 10. Direct water purchases were the only,
or major, way that the Commonwealth acquired water
entitlements from 2007–08 to 2011–12. From 2012–13
most water acquisitions have been through efficiency
measures including infrastructure upgrades.
In the southern MDB, between 2007–08 and 2017–18
the Commonwealth has acquired 1590 GL of water
entitlements (long-term average annual yield) for
environmental use. This includes 2.4 GL secured in
2017–18, compared to 82 GL in 2016–17 (Figure 10).
Water entitlements secured in 2017–18 came entirely
from investments in water-saving infrastructure.
Figure 10: Annual Commonwealth environmental water recovery, southern Murray–Darling Basin, 2007–08 to 2017–18 (Long Term Average Yield), excluding the Lachlan and Wimmera–Mallee
Purchases Infrastructure
0
100
200
300
400
500
2017–182016–172015–162014–152013–142012–132011–122010–112009–102008–092007–08
Gig
alitr
es

16Australian Water Markets Report 2017–18 Southern Murray–Darling Basin Section
SURFACE WATER ALLOCATION MARKETS
There were record high volumes of allocation trades
during 2017–18 (see Figure 11). A trade is defined as
a transfer of ownership from one legal entity to another
with or without change of location. The volume of
allocation trades includes:
• commercial trades between unrelated parties (i.e. an
arm’s-length transaction where market price is paid);
• trades between related parties (e.g. between family
members or between different properties with same
owner(s)) – trade price reported may not reflect actual
market rate; and
• environmental trades or transfers to facilitate
environmental water deliveries (e.g. trade from the
Commonwealth Environmental Water Office (CEWO) to
a delivery partner) – these trades have $0 reported.
Figure 11 shows there is still a need to improve
price reporting to allow price discovery for all market
participants as there is a significant proportion of
trades with ‘non-market rate’ prices reported even after
accounting for environmental trades. Trades with
‘non-market rate’ pricing:
• are recorded with no price information;
• are non-financial trades for the purpose of
environmental watering, moving water between related
accounts or for managing carryover;
• have prices that are well below market value (less than
$5/ML); or
• have prices that are unreasonably above market value
(over $1000/ML).
Figure 11: Surface water allocation volumes by trade price reported, southern Murray–Darling Basin, 2008–09 to 2017–18
Prices between $5 and $1000/ML Non-market rate prices reported
0
1000
2000
3000
4000
5000
6000
7000
2017–182016–172015–162014–152013–142012–132011–122010–112009–102008–09
Gig
alitr
es
17Australian Water Markets Report 2017–18 Southern Murray–Darling Basin Section
In both 2016–17 and 2017–18, 72 per cent of traded
volumes met the above criteria. Excluding transfers for
the purpose of environmental watering (30 per cent and
27 per cent, respectively), the total percentage of
allocation trades with ‘non-market rate’ prices reported
was 42 per cent in 2016–17 and 45 per cent in 2017–18.
Environmental water holders are legitimate water
market participants with allocation trading an important
mechanism to allow delivery of water to environmental
assets throughout the southern MDB (environmental
transfers are discussed in more detail below).
However when calculating volume weighted average
prices (VWAP) shown in this report, $0 trades such
as environmental transfers and other ‘non-market
rate’ price trades have been excluded to get good
representation of the market prices being paid for water.
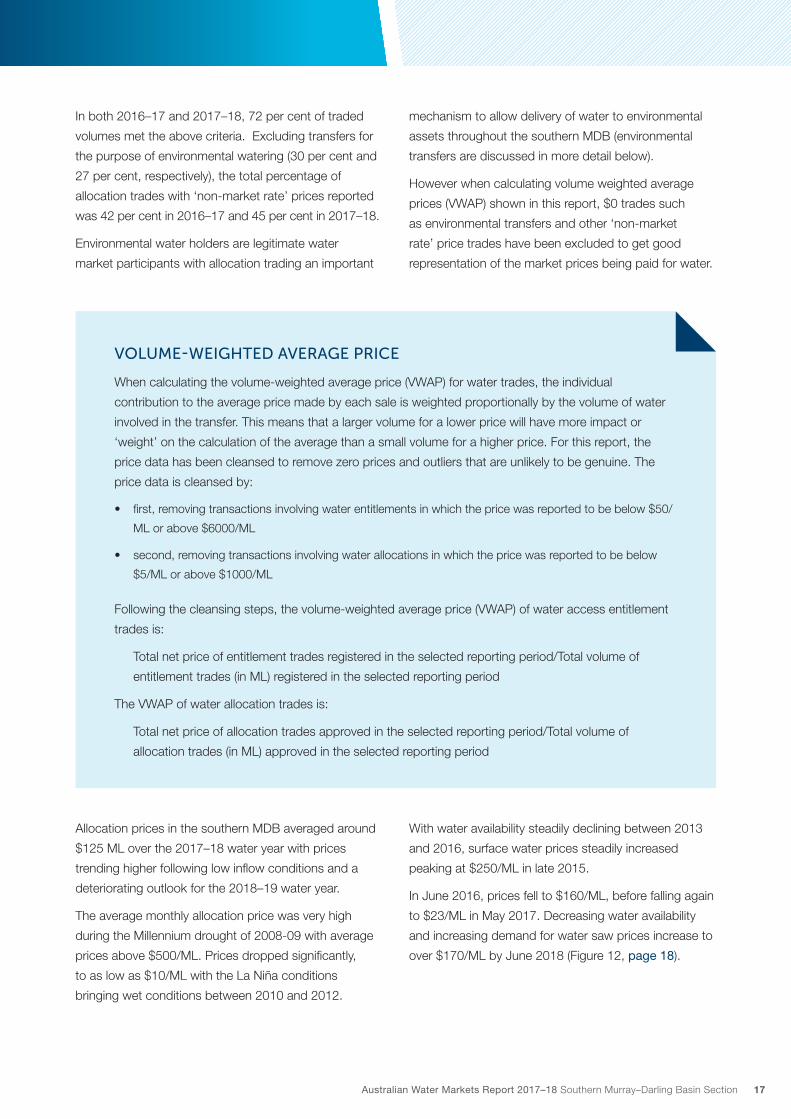
VOLUME-WEIGHTED AVERAGE PRICE
When calculating the volume-weighted average price (VWAP) for water trades, the individual
contribution to the average price made by each sale is weighted proportionally by the volume of water
involved in the transfer. This means that a larger volume for a lower price will have more impact or
‘weight’ on the calculation of the average than a small volume for a higher price. For this report, the
price data has been cleansed to remove zero prices and outliers that are unlikely to be genuine. The
price data is cleansed by:
• first, removing transactions involving water entitlements in which the price was reported to be below $50/
ML or above $6000/ML
• second, removing transactions involving water allocations in which the price was reported to be below
$5/ML or above $1000/ML
Following the cleansing steps, the volume-weighted average price (VWAP) of water access entitlement
trades is:
Total net price of entitlement trades registered in the selected reporting period/Total volume of
entitlement trades (in ML) registered in the selected reporting period
The VWAP of water allocation trades is:
Total net price of allocation trades approved in the selected reporting period/Total volume of
allocation trades (in ML) approved in the selected reporting period
Allocation prices in the southern MDB averaged around
$125 ML over the 2017–18 water year with prices
trending higher following low inflow conditions and a
deteriorating outlook for the 2018–19 water year.
The average monthly allocation price was very high
during the Millennium drought of 2008-09 with average
prices above $500/ML. Prices dropped significantly,
to as low as $10/ML with the La Niña conditions
bringing wet conditions between 2010 and 2012.
With water availability steadily declining between 2013
and 2016, surface water prices steadily increased
peaking at $250/ML in late 2015.
In June 2016, prices fell to $160/ML, before falling again
to $23/ML in May 2017. Decreasing water availability
and increasing demand for water saw prices increase to
over $170/ML by June 2018 (Figure 12, page 18).

18Australian Water Markets Report 2017–18 Southern Murray–Darling Basin Section
$/M
L
0
100
200
300
400
500
600
Mar–18
Nov–1
7
Jul–1
7
Mar–17
Nov–1
6
Jul–1
6
Mar–16
Nov–1
5
Jul–1
5
Mar–15
Nov–1
4
Jul–1
4
Mar–14
Nov–1
3
Jul–1
3
Mar–13
Nov–1
2
Jul–1
2
Mar–12
Nov–1
1
Jul–1
1
Mar–11
Nov–1
0
Jul–1
0
Mar–10
Nov–0
9
Jul–0
9
Mar–09
Nov–0
8
Jul–0
8
Figure 12: Allocation prices, southern MDB (monthly volume-weighted average price)
The main driver of allocation prices in the southern
MDB is allocations, which are highly dependent on
the volume of water held in storage (Figure 13).
Inflows across southern MDB storages increased
storage levels significantly in the first half of 2017–18 but
then decreased over the 2017–18 summer to finish the
year about 10 per cent lower than the previous year.
Sto
rage
vol
ume
%
0
50
100
150
200
250
300
Storage volume (%) Allocation price (monthly VWAP)($/ML) (right axis)
$/ML
0
10
20
30
40
50
60
70
80
90
100
Apr–1
8
Oct–17
Apr–1
7
Oct–16
Apr–1
6
Oct–15
Apr–1
5
Oct–14
Apr–1
4
Oct–13
Apr–1
3
Oct–12
Figure 13: Average allocation price against average storage volume, southern MDB 2012–13 to 2017–18
There were sharp increases in prices in July 2017 that
coincided with a record number and volume of commercial
trades for a July period with almost twice the volume
traded compared to July 2016 (Figure 14, page 19).
This could have resulted from uncertainty about the
direction of water availability for the season ahead
leading to some irrigators looking to secure water early
in the water year.

19Australian Water Markets Report 2017–18 Southern Murray–Darling Basin Section
Gig
alitr
es $/ML
0
50
100
150
200
250
Jun 1
8
May 18
Apr 18
Mar 18
Feb 1
8
Jan 1
8
Dec 17
Nov 17
Oct 17
Sep 17
Aug 17
Jul 1
7
Jun 1
7
May 17
Apr 17
Mar 17
Feb 1
7
Jan 1
7
Dec 16
Nov 16
Oct 16
Sep 16
Aug 16
Jul 1
6
Allocation price (monthly VWAP) ($/ML) (right axis)Volume traded (with 'market rate' prices reported) (GL)
0
20
40
60
80
100
120
140
160
180
200
Figure 14: Allocation trade volumes and average price (commercial trades), southern MDB, 2016 – 2018
Over the past decade, there has been a high
degree of correlation in the allocation prices among
major water systems across the southern MDB.
The variations that did occur were largely due to trade
restrictions. For example, during 2015–16 and 2016–17,
the Murrumbidgee intervalley trade (IVT) limit was
binding, meaning that the volume of trade out of the
Murrumbidgee region was restricted. Figure 15
shows that allocations traded at a discount during this
period compared to other parts of the southern MDB.
Further discussion on the impact of trade restrictions is
covered later in this report.
Figure 15: Allocation prices, selected water systems (3-monthly VWAP)
0
100
200
300
400
500
600Sum
mer 20
17–1
8
Wint
er 20
17–1
8
Summer
2016
–17
Wint
er 20
16–1
7
Summer
2015
–16
Wint
er 20
15–1
6
Summer
2014
–15
Wint
er 20
14–1
5
Summer
2013
–14
Wint
er 20
13–1
4
Summer
2012
–13
Wint
er 20
12–1
3
Summer
2011
–12
Wint
er 20
11–1
2
Summer
2010
–11
Wint
er 20
10–1
1
Summer
2009
–10
Wint
er 20
09–1
0
Summer
2008
–09
Wint
er 20
08–0
9
Murrumbidgee NSW Murray Vic Murray
GoulburnSA Murray
$/M
L

20Australian Water Markets Report 2017–18 Southern Murray–Darling Basin Section
INTER-REGIONAL ALLOCATION TRADE
In 2017–18 the total amount of water moving between
systems in the southern MDB increased by 7 per cent
compared to 2016–17.
This was less than the total increase in trade volume
(9 per cent increase) due in part to the number of trade
restrictions in place throughout the year, including the
Barmah Choke, Goulburn IVT and Murrumbidgee IVT
(see further discussion on restrictions below).
COMMERCIAL INTER-REGIONAL TRADES
In 2017–18, the Victorian Murray region was a large
net exporter of water allocations with net outward trade
of around 247 GL, excluding identified environmental
trades (Figure 16).
In contrast to 2016–17, the Murrumbidgee and the
NSW Murray were importers for water allocations in
2017–18 reflecting the strong demand for water to
produce crops like cotton and perennial plantings.
In fact, the Murrumbidgee’s IVT was binding to restrict
the levels of water trade imports in 2017–18, whereas
in both 2015–16 and 2016–17 trade restrictions
were in place to limit the volumes of exports from the
Murrumbidgee (see trade restrictions discussion below).
ENVIRONMENTAL TRADES
Identified environmental trades (or transfers) accounted
for around 29 per cent of total inter-regional water trade
in 2017–18. Environmental transfers tend to move in a
downstream direction, with large volumes flowing into
the SA Murray and out of the Victorian Murray region
(see Figure 16).
Figure 16: Surface water allocation net inter-regional trade flows, southern Murray–Darling Basin, 2017–18
Gig
alitr
esN
et imp
ort
Net exp
ort
-800
-600
-400
-200
0
200
400
600
800
SA
Goulburn*
Vic Murray
Lower DarlingMurrumbidgeeNSW Murray
Excludes environmental trades Environmental trades

21Australian Water Markets Report 2017–18 Southern Murray–Darling Basin Section
The Commonwealth Environmental Water Office (CEWO)
is one of several environmental water holders that
regularly transfer allocations between southern MDB
regions. Other major environmental water holders include
the Victorian Environmental Water Holder, the Living
Murray and the NSW Office of Environment and Heritage.
Environmental trades within the southern MDB facilitate
the use of water to improve the health of rivers,
floodplains and wetlands with decisions guided by
the Murray–Darling Basin Plan environmental watering
strategy (CEWO 2018).
TRADE RESTRICTIONS
Trade restrictions can be imposed to guard against
third party impacts such as environmental harm,
or can occur when physical or hydrological limitations
within the interconnected river system are reached
and become binding. This results in a restriction in the
volume of water that can be traded from one catchment
to another.
Catchments consequently become separated from
the remainder of the interconnected southern MDB
while trade is restricted. Separated catchments can
experience price differentials reflecting underlying supply
and demand factors driving prices to a higher or lower
level than the remainder of the southern MDB.
Restrictions in 2017–18 contributed to Murrumbidgee
allocation prices being around $20/ML higher than in
the NSW and Victorian Murray and $30/ML higher than
in the SA Murray. The combined influences of lower
allocations in the Murrumbidgee and higher demand
from the growth in area under cotton plantings, drove
prices higher. In previous years, trade restrictions on
water traded out of the Murrumbidgee (100 GL IVT
balance limit) combined with lower within-catchment
demand for water, led to a price discount occurring in
the Murrumbidgee. In 2016–17, restrictions contributed
to allocation prices in the Murrumbidgee being around
$18/ML lower than in the southern connected system
(Figure 17).
Figure 17: Allocation price divergence between southern MDB and Murrumbidgee (3-monthly VWAP), 2008–09 to 2017–18
SMDB average Murrumbidgee
$/M
L
0
100
200
300
400
500
600
Autumn 2
017–
18
Wint
er 20
17–1
8
Spring
2016
–17
Summer
2015
–16
Autumn 2
014–
15
Wint
er 20
14–1
5
Spring
2013
–14
Summer
2012
–13
Autumn 2
011–
12
Wint
er 20
11–1
2
Spring
2010
–11
Summer
2009
–10
Autumn 2
008–
09
Wint
er 20
08–0
9
22Australian Water Markets Report 2017–18 Southern Murray–Darling Basin Section
The Barmah Choke, the Goulburn and Murrumbidgee
intervalley trade (IVT) limits and the New South Wales
to Victoria trade restriction are all examples of trade
restrictions in the southern MDB. All were binding for
significant periods throughout 2017–18.
The Murray–Darling Basin Authority manages the
restriction around the Barmah Choke. The Choke is a
naturally occurring narrow stretch of the River Murray
near Echuca, which restricts flow to 10 GL per day.
The restriction limits trade from upstream to downstream
of the Choke to protect water delivery to existing
entitlement holders and for environmental reasons
(MDBA 2018). Trade through the Barmah Choke was
restricted for most of 2017–18.
The volume of trade from the Goulburn, Campaspe,
Broken and Loddon systems to other systems is
limited when outward trade exceeds a net of 200 GL.
This limit is to ensure current and future security of
supply to existing entitlement holders. The upper limit of
the Goulburn IVT was reached in July 2017 due to water
still owed to the Murray from the previous year, as well
as water traded out of the Goulburn (DELWP 2018a).
The limit began to ease from 15 January 2018 following
the commencement of deliveries from the Goulburn to
the Victorian Murray to support river operations.
The NSW to Victoria trade limit is designed to protect
allocations to Victorian Murray entitlement holders.
Victoria has limited storage space in the Victorian share
of Dartmouth and Hume dams to store water traded
in from NSW. If Victoria cannot store that water, it may
‘internally spill’ to the NSW share of the storage or
down the river. This would mean less water available
for Victorian Murray entitlement holders.
The NSW to Victoria limit restricts allocation trade from
NSW to Victoria to the lesser of 200 GL net annual
volume or a volume that keeps the risk of spill in
Victoria’s share of the Murray system to below
50 per cent (DELWP 2018b).
The NSW to Victoria limit took effect from the
commencement of the 2017–18 water year due to a
high risk of spill in Victoria. This limit restricted the trade
of water from NSW into Victoria to volumes offset by
water traded from Victoria to NSW. The NSW to Victoria
limit was eased on 10 November 2017 following the
declaration of a low risk of spill in Victoria.
The Murrumbidgee IVT limits trade from the
Murrumbidgee to a balance of between 0 and 100 GL.
A maximum balance of 100 GL is applied due to the
volume of water that can be physically transferred out
of the valley via Balranald per year without incurring
excessive transmission losses (WaterNSW 2018).
The Murrumbidgee IVT limit restricted trade for most
of 2017–18 due to strong demand, especially from
cotton growers, driving demand for water trade into
the Murrumbidgee. Trade into the Murrumbidgee was
restricted on 20 October 2017 for the first time since
September 2013. The net direction of trade into the
Murrumbidgee in 2017–18 was in contrast to the
previous several years where the Murrumbidgee was a
net exporter in terms of water traded, with trade out of
the Murrumbidgee restricted.
In the future, increased water demand in the
downstream Victorian and NSW Murray regions,
due to the expansion of crops such as almonds,
could exacerbate the impact these trade restrictions
have on water prices.

23Australian Water Markets Report 2017–18 Southern Murray–Darling Basin Section
SURFACE WATER ENTITLEMENT MARKETS
In 2017–18, southern MDB surface water entitlement
prices increased by about 20 per cent compared to
2016–17 (Figure 18). Several factors could have driven
this increase, most notably the increased value of
irrigated crops, which drives demand for irrigation
water. Area planted to cotton has expanded in the
Murrumbidgee in recent years, further driving competition
for water. A growing recognition of long-term climate
trends—particularly a reduction in average winter rainfall
and streamflow in the region since the mid 1990s
—may also be driving entitlement price increases
(Hughes et al, 2016).
At the same time as entitlement prices were increasing,
the volume of entitlement traded was the lowest on
record. The decline in volume could in part reflect
the decrease in the acquisition of entitlements by the
Commonwealth as part of the Murray–Darling Basin
Plan since 2013-14. Some irrigators are also preferring
to rely on the allocation market to secure their annual
water needs as opposed to purchasing more costly
long-term entitlements.
Water entitlement prices are specific to particular
water systems, resource types and reliability classes.
Figure 19, page 24 shows that better water reliability
leads to higher prices. As a result, high security prices
are higher than general security prices, and general
security prices are higher than low security prices.
High security prices are generally similar among water
systems, but NSW high security prices tend to be higher
than other high reliability prices. This is because NSW
high security entitlements are among the most reliable in
the southern MDB.
Prices of individual entitlement types are also affected
by the location of the entitlement, catchment-specific
rules, carryover rights that the entitlement affords,
trade restrictions, and value of crops grown in particular
regions. In 2017–18, NSW Murray and Murrumbidgee
high and general security entitlement prices increased,
driven by irrigators securing water for higher value
crops such as horticultural trees and cotton. All other
major entitlement types experienced fairly stable prices
between 2016–17 and 2017–18.
Figure 18: Entitlement trade volume and price (annual VWAP index), 2007–08 to 2017–18
0
200
400
600
800
1000
1200
1400
Gig
alitr
es $/ML
0
200
400
600
800
1000
1200
1400
1600
1800
2000
2017–182016–172015–162014–152013–142012–132011–122010–112009–102008–092007–08
Entitlement price (annual VWAP) ($/ML) (right axis)Volume traded (GL)

24Australian Water Markets Report 2017–18 Southern Murray–Darling Basin Section
Murrumbidgee high
Loddon high
NSW Murray high Vic Murray high Goulburn high
Vic Murray low
SA High
Lachlan general Goulburn low
NSW Murray general
0
500
1000
1500
2000
2500
3000
3500
4000
Murrumbidgee general
$/M
L
2009
–10
2009
–11
2009
–12
2009
–13
2009
–14
2009
–15
2009
–16
2009
–17
2009
–18
Figure 19: Price index, selected entitlement classes (annual VWAP index), 2008–09 to 2017–18
NEW WATER PRODUCTS
Increasingly water markets (particularly in the
southern MDB) have been developing new solutions
to problems, including the adoption of new water
products (Table 3, page 25). Most of these products
are contractual arrangements between individuals.
They are executed using standard allocation or
entitlement transfers and fulfil needs not addressed
by existing temporary or permanent water products.
These new water products allow greater inter-temporal
risk management and cash flow management.
In 2016–17 and 2017–18, broker promotion and
changing water availability led to a substantial increase
in the popularity of these products. In the same period,
Australia’s first water exchange traded fund was
launched on the Australian Stock Exchange,
allowing investors easier access to water assets
than ever before.
Longstanding products include delivery entitlements
within irrigation districts, pipe capacity and water leases.
Relatively newer products include forwards, deferred
delivery and parking (see Table 3 (page 25) for product
descriptions). Many of these products have existed
for several years, but uptake has been limited. These
products may be used for regulated and unregulated
surface water, and for groundwater where applicable.
Standardised versions of these products are offered by
the larger brokers or on exchanges and brokers often
offer several or all of these products. For this reason,
brokers may use different terms to describe the same
water product. An options market does not appear to
be operating in the region.

25Australian Water Markets Report 2017–18 Southern Murray–Darling Basin Section
Table 3: New agricultural water products, southern Murray–Darling Basin
Water product
Description
Delivery rights
An agreed right to receive or withdraw a volume of water at a defined point on the river system. Typically, a delivery right would be sold by an irrigation infrastructure operator and bought by an irrigator. Within irrigation districts, owners of water rights often have a defined portion of capacity. In several irrigation schemes, this capacity is owned and traded. In some cases, delivery rights also represent share ownership in an irrigation cooperative.
Pipe capacity An access right to a defined capacity within a river system to transport water from an agreed receipt point to a delivery point. The defined capacity could be offered by an irrigation infrastructure operator to an irrigator.
Forwards An agreement between a buyer and seller to exchange a predetermined volume of water at a future date at an agreed price. Involves a contracted transaction for a future date in another water year. The conditions of forwards are unique and are usually defined by the offering seller. Forwards are commonly only contracted within a one- to three-year period.
Multi-forward In some cases, forwards for multiple delivery dates can be combined into a single agreement.
Deferred delivery
A type of forward contract that sets the agreed delivery date and date of payment later in the same water year. For example, an agreement can be made at the start of the water year to have water delivered during summer.
Entitlement lease
A short- to long-term agreement where the lessor or owner of an entitlement agrees to provide or lease a defined volume of allocations under an entitlement to a lessee, typically for a period of one to three years at a predetermined price. Involves long-term lending of entitlements for a fixed price over several years. Leasing has been around for several years and some businesses specialise in providing water leases.
Parking An arrangement where storage capacity associated with an entitlement is sold for a single season. By transferring an agreed amount to the seller’s account, the water is carried over, then transferred back in the following water year. Current practice is that the buyer carries evaporation deductions, spill losses and any regulation risk as if they were using their own entitlements. For this reason, parking prices may vary between catchments depending on perceived risk.
Derivatives The buying or selling or a water product where the price is referenced to an underlying price in a catchment. A range of products have been mooted for development or yet to be launched. Where the products developed involve the physical delivery of water under the terms of the agreement then technically, they would not be classified as a derivative.
These water market products have generated little or
no publicly available data on volumes, number of trades,
conditions or who is transacting. This could affect the
future reliability of water trade data. For example,
a forward contract appears on a state water register
on the delivery date, not the date of agreement and it is
unclear whether these transactions are recorded with
the delivery price or as a zero-dollar transaction.
These contracted products may appear on private broker
or private exchange websites, but the details are not
collected by water market operators and therefore do
not appear on public water market registers beyond the
allocation or entitlement trade at execution. As a result of
this information gap, the growing use of forward contracts
is likely to make allocation trade registers less reliable.
The limited private sources documenting some of
these new products suggest that they grew quickly
in 2016–17 and 2017–18. They represent a small
proportion of all water transactions compared with
allocation and entitlement trade. However, in 2016–17
water availability and irrigators’ desire to save water,
resulted in these new products becoming increasingly
popular. This was especially the case in the later part
of the water year, when opportunities to use or trade
excess water fell. Some broker websites showed a
doubling of forward contracts from 2015–16 to 2016–17
and are beginning to show more information on these
products (ABARES 2018; Ruralco Water, 2018).

26Australian Water Markets Report 2017–18 Southern Murray–Darling Basin Section
2018–19 SO FAR (JULY – DECEMBER 2018)
WATER AVAILABILITY
There is significant uncertainty about how much water
will be available during 2018–19. While the Bureau
issued an El Niño Alert since mid-2018, atmospheric
indicators of ENSO mostly remained neutral. A late
forming El Niño will have a weaker influence over the
summer period, but what will mostly drive the climate
outlook will be the local effects such as the ocean
temperatures around Australia.
Rainfall from July to December 2018 has been below
average across most of the southern MDB.
WATER STORAGE LEVELS
The draw down for the summer irrigation period
has begun with most major dams in the southern
MDB at lower levels than on 30 June 2018 (Table 4).
The 2019 winter period will be important for stored
water availability, as winter is typically when storages
in the southern MDB replenish. Many storages are
currently only half or less than half full. All storages are
lower than this time last year.
Table 4: Major water storages, southern MDB
Storage 30 June 2018 31 December 2018 Same time last year (Dec 2017)
Hume 43% 39% 71%
Dartmouth 89% 72% 91%
Eildon 54% 55% 74%
Burrinjuck 40% 44% 67%
Blowering 69% 44% 50%
Wyangala 61% 43% 81%
ALLOCATIONS
High security entitlements have received close to full
allocation (Table 5). For general or low reliability security
entitlements, only the Murrumbidgee system has
received any allocation to date with 7 per cent. Carryover
is available in the NSW Murray (about 30 per cent) and
the Murrumbidgee (23 per cent) meaning there is some
water available for irrigation and/or trading.
Table 5: Allocation announcements, selected water systems southern MDB (as at 31 December 2018)
Water system High Security General or Low Security
Murrumbidgee 95% 7%
NSW Murray 97% 0%
VIC Murray 100% 0%
Goulburn 93% 0%
SA Murray 100% NA
Lachlan 100% 0%

27Australian Water Markets Report 2017–18 Southern Murray–Darling Basin Section
SURFACE WATER ALLOCATION MARKETS
With declining water availability due to low allocations
and decreasing water storage levels, allocation trade
prices have jumped from about $170/ML in June 2018
to a price of $350/ML in December 2018. As Figure 20
shows, current allocation prices have not been
seen since the height of the Millennium drought in
2008–2009.
Figure 20: Average allocation prices, southern MDB 2008–09 to Nov 2018 (monthly VWAP)
0
100
200
300
400
500
600
Jul 1
8
Nov 17
Mar 17
Jul 1
6
Nov 15
Mar 15
Jul 1
4
Nov 13
Mar 13
Jul 1
2
Nov11
Mar 11
Jul 1
0
Nov 09
Mar 09
Jul 0
8
Allocation price (monthly VWAP) ($/ML) Allocation price (monthly VWAP) ($/ML)
$/M
L
SURFACE WATER ENTITLEMENT MARKETS
For most major entitlement types, the first six months
of 2018–19 have seen a significant increase in prices
compared to 2017–18 average prices (Table 6).
For NSW Murray and Murrumbidgee high security
entitlements, record prices of around $5,000/ML
have been paid.
Table 6: Entitlement prices 2017–18 vs 2018–19 (July–Dec) selected water systems, southern MDB ($VWAP)
Water system High Security General or Low Security
2017–18 2018–19* % change 2017–18 2018–19* % change
Murrumbidgee $3654 $4942 35% $1566 $970 -38%
NSW Murray $3526 $5023 42% $1296 $1975 52%
VIC Murray $2315 $2879 24% $318 $521 64%
Goulburn $2246 $3121 39% $290 $524 81%
SA $2175 $3786 74% NA NA NA
*Prices for 2018–19 represent an average for July to December 2018
28Australian Water Markets Report 2017–18 Southern Murray–Darling Basin Section
REFERENCES
Almond Board of Australia (2018). Our Almond story.
www.australianalmonds.com.au/our-almond-story
[Accessed 10 September 2018].
ABARES (2018). Australian water markets report 2016–17.
www.agriculture.gov.au/abares/research-topics/water/aust-water-markets-
reports#references [Accessed 1 June 2018].
ABS (2016). Water use on Australian farms 2014–15.
www.abs.gov.au/AUSSTATS/[email protected]/Lookup/4618.0Main+Features102014-
15?OpenDocument [Accessed 1 July 2018].
ABS (2017). Water use on Australian farms 2015–16. www.abs.gov.au/
AUSSTATS/[email protected]/DetailsPage/4618.02015-16?OpenDocument
[Accessed 1 July 2018].
ABS (2018). Water use on Australian farms 2016–17. www.abs.gov.au/
ausstats/[email protected]/mf/4618.0 [Accessed 10 September 2018].
Bureau of Meteorology (2018). Water Markets Dashboard. www.bom.gov.au/
water/dashboards/#/water-markets/national/state/at
[Accessed 10 December 2018].
Commonwealth Environmental Water Office (2018). Commonwealth
Environmental Water Office. www.environment.gov.au/water/cewo
[Accessed 1 December 2018].
DELWP (2018a). Understanding the Goulburn to Murray Trade Limit.
http://waterregister.vic.gov.au/about/news/218-understanding-goulburn-to-
murray-trade-limit [Accessed 13 December 2018].
DELWP (2018b). Understanding the NSW to Victoria Trade Limit.
http://waterregister.vic.gov.au/about/news/195-understanding-the-nsw-to-
victoria-trade-limit [Accessed 13 December 2018].
Hughes, N, Gupta, M & Rathakumar, K (2016). Lessons from the water market.
Australian Bureau of Agricultural and Resource Economics and Sciences,
Canberra.
MDBA (2018). Barmah Choke trade balance and restrictions.
www.mdba.gov.au/managing-water/water-markets-trade/interstate-water-
trade/barmah-choke-trade-balance [Accessed 1 November 2018].
Ruralco Water (2018). Ruralco Forward Water Markets.
www.ruralcowater.com.au/waterreports.aspx [Accessed 22 January 2018].
United States Department of Agriculture – National Agricultural Statistics
Service (2018). California Almond Objective Measurement Report.
www.nass.usda.gov/Statistics_by_State/California/Publications/Specialty_and_
Other_Releases/Almond/index.php [Accessed 10 September 2018].
WaterNSW (2018). Murrumbidgee IVT- Background.
www.waternsw.com.au/customer-service/ordering-trading-and-pricing/trading/
murrumbidgee#stay [Accessed 13 December 2018].

29Australian Water Markets Report 2017–18 Southern Murray–Darling Basin Section

190225-2