australian startup salary guide 2018 - thinkandgrowinc.com · australian startup salary guide 2018...
TRANSCRIPT

1Australian Startup Salary Guide 2018
Australian Startup Salary Guide 2018

2Australian Startup Salary Guide 2018
Think & Grow and StartupAUS would like to thank the venture capital funds listed below for their support in pulling together all the necessary data. In particular we would like to thank Lauren Capelin from Reinventure for the amazing work she did. This report would not be possible without Lauren and Reinventure’s help.
Supporters

3Australian Startup Salary Guide 2018
Contents
Introduction 4
Executive summary 5
Findings & Analysis 6
Engineering Leadership 6
CEOs and Founders 8
Product 10
HR / People & Culture 12
Data Science 14
Design 16
Other Observations 18
Conclusion 19
Methodology 20
Appendix – Full data tables 21
Customer Support 21
Data 22
Design 23
Engineering 24
Executive General Management 26
Finance 27
HR / People & Culture 28
Marketing 29
Operations 31
Product 32
Sales 33
4Australian Startup Salary Guide 2018
Across Australia, hiring top talent is challenging for many startups, amidst the backdrop of a highly competitive global talent market. While salary surveys are routine across industries, as well as popular self-reported salary sites such as Glassdoor or Stack Overflow, a comprehensive guide that acknowledges access to cash (via revenues or funding) for startups in Australia is hard to come by. Until now.
The recent StartupAUS Talent Gap Report identified a potential future shortage in key tech roles, including data science, product, UX, engineering and business development; roles that are crucial for startup growth and success. The rarity of these roles has led to fierce competition for the world’s best talent, and it is now time to figure out how we boost tech talent development in Australia.
Remaining competitive on salaries is key to securing top talent in such times.
At the current pace of technological change, it is universally acknowledged that engineering talent is in exceptionally high demand and in low supply (US State of Startups 2017 report). In Australia, competition is particularly intense for talent, with global technology giants exporting skilled developers from Australia, and large Australian corporates hiring technical talent for their teams.
Overall, it is a good time to be a startup in Australia. With improved funding conditions, R&D tax incentives, and an increasing community, the playground is ripe for innovation. Until now, however, there has been no cohesive and thorough report on what employees should be paid depending on the lifecycle of their company.
Without this data, how can employers structure total packages in line with the current pace of change and the fiercely competitive talent market? In addition, with talent planning and budgeting currently being based on best guess estimates, there’s a high risk of losing candidates at the offer stage, and/or blowing the budget.
Think & Grow was founded in 2015 to help technology-driven businesses grow by hiring great people. Over 90% of our clients are venture-backed startups, and speaking with the founders and their investors daily, we are very aware of the challenges that Australian startups face when competing for international talent. Our business is committed to playing a vital role in creating a successful and sustainable ecosystem that establishes Australia firmly on the global tech stage.
To provide more transparency, we have carried out research into salary and compensation levels in partnership with StartupAUS, a not-for-profit startup advocacy group. In July 2018, remuneration packages of more than 2500 individuals were analysed to compile this guide. The data was provided by more than 350 respondents in an online survey and from 47 venture capital-backed companies that shared company-wide compensation data for their business. All participants provided data which included base salary, benefits and incentives such as equity as well as the size of their company, funding and job title.
We are sharing our findings in this report to benefit the whole community and further enable a thriving startup ecosystem. Our aim is to:
• Enable founders to be well informed on what they should be paying their employees and to be able to forward plan
• Help employees determine if they are paid fairly, and also what their career path potential earnings could be
• Assist investors to better advise and understand the funding needs of their investments.
We hope you find this guide helpful.
Alex McCauley, CEOStartupAUS
Anthony Sochan, PartnerThink & Grow
Introduction

5Australian Startup Salary Guide 2018
The research highlights the difference between startups at different levels of capital raising: in terms of the variety and seniority of roles, as well as the salaries and equity offered. We can clearly see how companies undergo restructuring and expansion in terms of management roles as they raise higher amounts of capital.
The findings show that the more capital raised, the greater a company’s ability to adjust salary packages to their advantage.
= “higher valuation” = “ability to be more flexible with salary packages” = “equity being offered at every level”.
There are significant differences between B2B and B2C firms in terms of the kinds of roles being hired for. B2B firms are much more likely to be hiring senior engineers than B2C startups. Very few B2C firms hire product managers in the early stages, but this changes as they grow and mature.
Early startups are reluctant to hire certain roles, such as HR. There’s a slight increase as capital raised rises, but many startups may be holding back progress by avoiding hiring a HR leader, both in terms of failing to hire the talent they need and retaining the talent they already have.
The small number of roles in data science, with no hires in B2C companies, may indicate affordability issues, particularly for early stage startups. These skills are in high demand globally, and frequently command salaries above those of C-level roles.
Large corporations often need to pay more money for digital experts and technical staff because the work can be more transformational than product focused. Startups need to be mindful that a high-risk venture needs high returns, even if the work is more product focused. That means rewarding people with more long-term benefits, generally in the form of equity. There needs to be education around appropriate package structures for individuals looking to make the leap from corporate to startup world.
Although Australian startups will struggle to emulate the packages on offer in Silicon Valley, there are many ways in which they can compete. First and foremost the role, opportunity and company must be attractive. Being global from Day 1, having a unique value proposition and amazing corporate culture are all ways in which we can compete. The other less tangible benefits to working in Australia range from lifestyle to considerably more generous vacation than the US.
“I f you’re a startup and you try to compete like-for-like, you won’t generally be able afford it. So instead we look at the longer term benefits for people working for your business, and the intangible benefits. These might include culture, stock, or having a seat at the leadership table. Often these intangible benefits are the most important to people, but there will still be a minimum number that people need to make that jump.”
Anthony Sochan, Think & Grow
Executive summary
6Australian Startup Salary Guide 2018
Engineers
Engineers represented one of the largest respondent groups, with 297 total respondents, of which a large majority were from B2B rather than B2C companies.
Among $0-5m startups, equity spread for C-level roles was 2% to 2.62%, and with $5-10m startups this fell to .46% to 2.03%. For companies that have raised $10-50m, the equity spread was wider, 1% to 4%.
It is no secret that software engineers are critical to driving the success of startups. They top the list of hardest to fill jobs in the US, and beyond 2018 will be no different. Not only is there a scarcity of this talent, but of top quality talent with a formal and deep understanding of software engineering.
Australia is globally recognised for its elite education system, with institutes such as ANU, University of Melbourne, UNSW and University of Sydney being ranked in the Top 50 globally for Computer Science and Information Systems courses. So the foundations are promising, however, with a closer look at this salary data, grads and junior engineers are nowhere to be found.
Findings & Analysis
In the medium term, we can import talent from overseas, but in the longer term we need to grow talent locally, partnering with universities to do this. In order to create a self-sustaining ecosystem, we need to take a longer-term view as to how we are creating and mentoring the next generation cohort of engineers of top talent. It is encouraging to see the launch of programs such as UTS Startups, Cicada Innovations and INCUBATE, which show that universities are recognising their role as the driving force in Australia’s startup economy. But while the outlook is promising, in the short term, the bridge between university and real life in early stage startups is still to be connected.
Engineering Leadership
As startups continue to grow and the engineering organisation becomes more complex, it begs the question: how should this function be led and managed? A ton of literature exists about the Spotify and Netflix models: ultimately they both point to an intrinsic link between process, skills and culture.
A question that is often asked is when do you hire someone to run your engineering function? The data suggests that a non-founder is running the engineering function at an early stage (0-$5 million) and this trend is consistent through the lifecycle of the businesses that were surveyed. How much influence a founder has over engineering would likely vary from organisation to organisation.
Capital raised: $0-5m Equity spread for C-level roles – 2% to 2.62%
Out of 53 roles, only two roles were within a B2C business. A possible explanatory factor would be that B2B transactions are more technical and startups that go down this path need help with technical components of their product.
Capital raised: $5-10m Equity spread for C-level roles – .46% to 2.03%
This category of startups was similar to $0-5m in the number of roles, possibly due to the fact that most of the roles are within B2B firms that require more technical/specialised knowledge.
C-level roles, on average, have a higher base and lower equity as capital raised increases. Similarly, senior and mid-level engineers saw around a $20,000 increase to the top end of their range.
Conversely, junior engineers saw their range bottom out, with the starting salary falling $23,000, but at the higher end it dropped by $10,000 to $100,000 [1] . This can possibly be attributed to a preference for more senior engineers over juniors within the businesses we surveyed. The merits of this approach are a contentious point and a point of debate.
Capital raised: $10-50m Equity spread for C-level roles – 1% to 4%
Of the 77 total roles, 30% were in B2C firms, of which 43% (10 out of 23) were senior to C-level roles. This indicates that although B2C firms are in short supply, based on our data, they don’t shy away from hiring individuals with relevant skills once they receive funding. This seems to be limited to the $10-50m range for now, as roles in the other ranges are in much shorter supply relative to roles at B2B firms.
The available data points to an explanation based on “more capital raised” = “higher valuation” = “ability to be more flexible with salary packages” = “equity being offered at every level”.
It’s also worth considering whether employees joined the business at or around its inception, and therefore had a salary and equity growth to reflect that, or they joined the firm after it grew and started on a higher package. The minimum salaries for every role except QA/Test engineer grew by an average of around $10,000.

7Australian Startup Salary Guide 2018
“ If you are a startup, you live or die by the quality of the technology you have in your business. You can’t afford to make mistakes when hiring tech talent.”
Anthony Sochan, Think & Grow
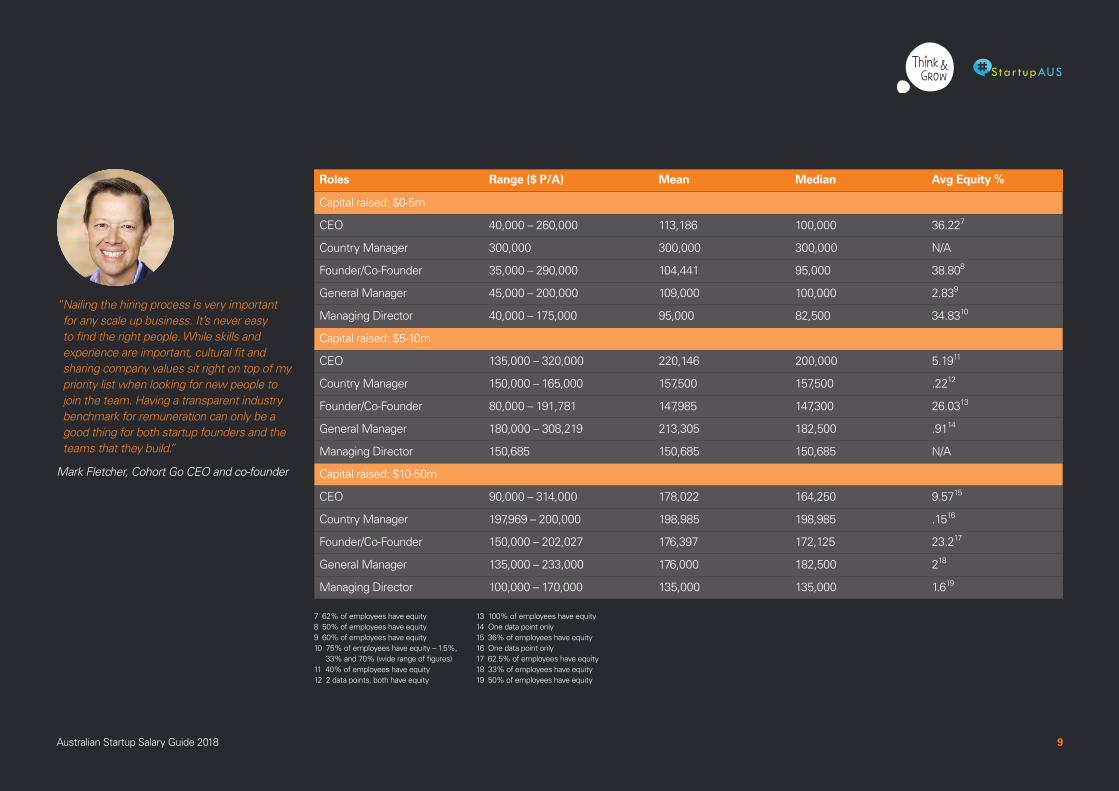
Roles Range ($ P/A) Mean Median Avg Equity %
Capital raised: $0-5m
CTO/VP Engineering 60,000 – 175,000 130,750 140,000 2.21
Head of Engineering 136,500 – 162,000 150,875 152,500 3.72
Capital raised: $5-10m
CTO/VP Engineering 136,986 – 273,750 194,819 200,000 1.33
Head of Engineering 100,000 – 160,000 100,000 160,000 3.54
Capital raised: $10-50m
CTO/VP Engineering 109,500 – 300,000 192,961 200,000 1.885
Head of Engineering 145,000 – 220,000 182,500 182,500 .366
1 37.5% of employees have equity 2 50% of employee have equity3 43% of employees have equity 4 Only one data point5 54% of employees have equity 6 2 data points, both have equity
7Australian Startup Salary Guide 2018

8Australian Startup Salary Guide 2018
CEOs and Founders
One interesting debate is whether the founder should be the CEO of a startup? What role functionally should they play in an organisation? This debate has been ongoing with plenty of literature and discussion of the topic. In his article If, Why, and How Founders Should Hire a “Professional” CEO, Reid Hoffman, the founder of LinkedIn, concludes: “You always do want a founder-CEO. But that person doesn’t always have to be the founding CEO. Being there at the start isn’t the only path to being a founder. “Founder” is a state of mind, not a job description, and if done right, even CEOs who join after day one can become founders.”
Fundamentally, the CEO and the founder possess two distinct sets of traits and skills. The founder sets the vision, rolls up their sleeves, builds the products; builds the teams and goes out and sells those products. A CEO positions a business for scale, delegates effectively and empowers their team, spending most of their time coaching and planning. It is certainly possible that one can wear both hats, but that does not mean they always should.
Founders-cum-CEOs include Jeff Bezos, Mark Zuckerberg and Reid Hastings who have both the entrepreneurial vision and ability to operate at scale.
Capital raised: $0-5m Equity spread for roles
• CEO – 12% to 70%
• Founder/Co-Founder – 3% to 95%
• General Manager – 1.5% to 5%
• Managing Director – 1.5% to 70%
At this stage and size of a company, we would expect high equity for each role, except general managers. It’s difficult to differentiate between CEO and founder, since some respondents ticked both boxes: this may explain the skews in base and equity. The assumption would be that a lower base + higher equity for a CEO indicates that they are also the founder.
Capital raised: $5-10m Equity spread for roles
• CEO – 2.42% to 12.5%
• Country Manager - .18% to .25%
• Founder/Co-Founder – 10% to 45%
• General Manager – .91%
Here we observed a decrease in equity holdings for each role, dramatically for CEOs, unlike that for founders, possibly because of the increased shift in startups hiring a professional CEO, with founders moving into specialised functions or advisory board positions.
There was an increase in salary with respect to the minimum paid and higher mean and median.
Capital raised: $10-50m Equity spread for roles
• CEO – 1% to 15%
• Country Manager – .15%
• Founder/Co-founder – 12.50% to 37.40%
• General Manager – 2%
• Managing Director – 1.6%
As capital raised increases, there is a clear decrease in the amount of equity held by founders. However, there is an increase in the salaries as well – the range is a mid-range six figure salary whose mean and median are quite close together. This indicates that founders are paying themselves quite competitively.
HOW TO HIRE C-LEVEL TALENT FOR STARTUPS
1. Understand who you need
2. Embrace the change
3. Plan the hiring process
4. Hire fast movers
Jonathan Jeffries, Think & Grow
“ Great founders and CEOs are always vigilant about managing overheads, which of course in the early days is largely due to headcount and salaries. Good, comparable salary data that would help CEOs make staff planning decisions has been notoriously difficult to obtain in the startup world, which can lead to either overly lean or unnecessarily generous compensation packages, as well as variable ESOP allocations which can create problems down the track. Being able to provide visibility into appropriate compensation benchmarks of startups at similar stages of growth is a positive contribution to a healthy startup ecosystem and community.”
Lauren Capelin, Reinventure head of venture community
9Australian Startup Salary Guide 2018
Roles Range ($ P/A) Mean Median Avg Equity %
Capital raised: $0-5m
CEO 40,000 – 260,000 113,186 100,000 36.227
Country Manager 300,000 300,000 300,000 N/A
Founder/Co-Founder 35,000 – 290,000 104,441 95,000 38.808
General Manager 45,000 – 200,000 109,000 100,000 2.839
Managing Director 40,000 – 175,000 95,000 82,500 34.8310
Capital raised: $5-10m
CEO 135,000 – 320,000 220,146 200,000 5.1911
Country Manager 150,000 – 165,000 157,500 157,500 .2212
Founder/Co-Founder 80,000 – 191,781 147,985 147,300 26.0313
General Manager 180,000 – 308,219 213,305 182,500 .9114
Managing Director 150,685 150,685 150,685 N/A
Capital raised: $10-50m
CEO 90,000 – 314,000 178,022 164,250 9.5715
Country Manager 197,969 – 200,000 198,985 198,985 .1516
Founder/Co-Founder 150,000 – 202,027 176,397 172,125 23.217
General Manager 135,000 – 233,000 176,000 182,500 218
Managing Director 100,000 – 170,000 135,000 135,000 1.619
“ Nailing the hiring process is very important for any scale up business. It’s never easy to find the right people. While skills and experience are important, cultural fit and sharing company values sit right on top of my priority list when looking for new people to join the team. Having a transparent industry benchmark for remuneration can only be a good thing for both startup founders and the teams that they build.”
Mark Fletcher, Cohort Go CEO and co-founder
7 62% of employees have equity 8 50% of employees have equity9 60% of employees have equity10 75% of employees have equity – 1.5%,
33% and 70% (wide range of figures)11 40% of employees have equity 12 2 data points, both have equity
13 100% of employees have equity14 One data point only15 36% of employees have equity 16 One data point only 17 62.5% of employees have equity18 33% of employees have equity 19 50% of employees have equity
9Australian Startup Salary Guide 2018

10Australian Startup Salary Guide 2018
Product
Our survey results demonstrate that at an early stage ($0-5 million), there are very few product management resources, usually as this is “owned” by the founder at this point. As the company scales, the teams start to be fleshed out across different levels of product management. We can also see that as the business grows, evidence that the founder (or a key early stage employee) is no longer performing the “chief product” or “VP of product” role but is instead performing some other function within the business. This is evidenced by the sharp drop in equity at those latter stages.
As the product function grows and becomes more complex, we hypothesise that businesses are needing to bring on professional product leaders to run this function. The virtues and vices of not doing this well are well documented. According to Ben Horowitz from a16z:
“ Product CEO Paradox: The only thing that will wreck a company faster than the product CEO being highly engaged in the product is the product CEO disengaging from the product.”
In the recent Talent Gap Report by StartupAUS, product was documented as one of “the most pressing focus for startups... dominating overall talent conversations”. Noting that very few junior product individuals were hired in earlier stage companies, where is the next cohort of leaders going to come from? Aside from moving the scarce number of current PMs from one startup to another, StartupAUS suggests that to solve this “talent gap”, we need to look at migration (hiring product leaders from overseas) and education (better connecting of universities to startups).
Adrienne Tan, co-founder of product management consultancy Brainmates, had this to say:
“ From what we’ve observed, ‘demand is greater than supply’, and Australian Startups are investing significant time and resources looking for that experienced, ‘can do’ product manager to help scale their products.”
Capital raised: $0-5m
For early stage startups, there were 15 roles, nine at senior/C-level. One CPO had equity at 14%, the other two had zero, by which we may assume this person was a founder.
Capital raised: $5-10m
For this sector, six out of 16 roles were senior/C-level. The majority were product managers, and B2B. There was only one B2C role.
Capital raised: $10-50m
At this size of company, more B2C startups are hiring product managers. There were eight B2C roles, of which five were at C-level.
The equity spread for a chief product officer ranged from .09% to .99%
TOP MISTAKES FOUNDERS MAKE WHEN HIRING
• Informal or poor interview process
• Hiring for cultural fit over skills
• Asking bad interview questions
• Undervaluing global experience
• Not considering diversity
Anthony Sochan, Think & Grow
“ The importance of a salary guide cannot be underestimated. Often employers don’t have access to what other firms of a similar size are paying their staff and it can be challenging to get this information. Startups can’t usually compete dollar-for-dollar with the corporate world, but add other incentives to the salary package such as equity to attract staff. Still, the base salary guide is very important so both employers, employees and potential employees know where they stand and what to expect.”
Vu Tran, GO1.com co-founder

11Australian Startup Salary Guide 2018
Roles Range ($ P/A) Mean Median Avg Equity %
Capital raised: $0-5m
Chief Product Officer 60,000 – 152,000 117,333 140,000 1420
VP/Head of Product 90,000 – 200,000 142,500 140,000 221
Senior Product Manager 70,000 – 110,000 90,000 90,000 N/A
Product Manager 46,800 – 150,000 84,200 70,000 N/A
Junior Product Manager 45,000 – 52,000 48,500 48,500 N/A
Chief Product Officer 60,000 – 152,000 117,333 140,000 1422
Capital raised: $5-10m
Chief Product Officer 145,000 – 180,000 162,500 162,500 .6923
VP/Head of Product 87,671 – 183,000 135,335 135,335 N/A
Senior Product Manager 67,000 – 78,100 72,550 72,550 .2224
Product Manager 55,000 – 135,000 99,888 95,000 .1325
Junior Product Manager 130,000 – 164,000 149,750 152,500 .2526
Product Analyst 51,767 51,767 51,767 N/A
Capital raised: $10-50m
Chief Product Officer 170,000 – 275,000 206,250 190,000 .4727
VP/Head of Product 142,000 – 235,000 199,250 210,000 .728
Senior Product Manager 105,000 – 150,000 133,750 140,000 .1129
Product Manager 80,000 – 150,000 118,738 120,000 .1130
Junior Product Manager 115,000 115,000 115,000 .131
Product Owner 60,000 – 163,942 111,971 111,971 .132
Product Analyst 65,000 65,000 65,000 N/A
“ It’s crucial to hire the right team when building a startup. You must find a balance between skillset and cultural fit. Founders need to set a clear vision and identify new hires who align with and are inspired by what you’re trying to achieve. Practically, it would be useful to have a guide on the going rates in our industry, which also suggests how one might attract and afford the staff they need and how to secure new staff if you aren’t able to pay the industry standard. If the salaries you offer are way below the industry benchmark, you risk losing top employees to other firms if you don’t have a roadmap to show how the employee will progress, grow and be well remunerated. No matter how attractive it might be to work for a tech startup, that gloss wears off and when it does, you need a solid plan for employee reward, retention and growth.”
Ruth Hatherley, Moneycatcha CEO and founder
20 33% of employees have equity 21 25% of employees have equity22 33% of employees have equity 23 100% of employees have equity 24 50% of employees have equity25 75% of employees have equity26 75% of employees have equity
27 100% of employees have equity 28 100% of employees have equity29 57% of employees have equity30 71% of employees have equity31 One data point32 50% of employees have equity
11Australian Startup Salary Guide 2018

12Australian Startup Salary Guide 2018
HR / People & Culture
“ An organisation is a machine consisting of two major parts: culture and people” - Ray Dalio, Principles
Our survey does not reveal the extent to which businesses are investing in culture and people but the data does reveal that there are very few people in HR roles in early stage startups in Australia currently. Generally a HR professional is hired as a direct result of the number of employees or hiring needs. However we do see an increase in HR professionals as capital revenue raised increases, likely resulting in more employees and/or more aggressive hiring needs (in some cases).
Globally, tech companies have had notably fewer HR roles. Data shows that tech startups with 100 or fewer employees have half as many HR professionals as the same-size companies in other industries.
While there has traditionally been resistance to HR in startups, perhaps because it is viewed as adding cost and slowing decision-making, other research shows that it can raise a company’s survival rate. Companies with bureaucratic personnel departments were nearly 40% less likely to fail than the norm, and nearly 40% more likely to go public, according to a report in the California Management Review.
Internal personnel roles are also shown to result in better hiring diversity: Project Include, a non-profit that uses data and advocacy to accelerate diversity and inclusion solutions in the tech industry, recommends making HR one of the first 25 hires.
Twitter co-founder Evan Williams said his biggest mistake at the company was a HR-related one, specifically, under hiring in quantity and experience. If startups aren’t hiring internal HR roles, they will need outside assistance with this function in order to build a solid platform for managing sustainable growth. In the US, 23% of small businesses fail, according to the US Bureau of Labor, and this can be attributed to not having the right team.
As soon as there’s someone in an HR role, or a people and culture leader, they can start to place some structure around salary packages. This means that you don’t have senior engineers on very different salaries - they’re all normalised at a similar level.
“ Startups are by their nature new and different. This obviously makes them exciting and interesting, but it also means that when trying to work out fair and reasonable salary and remuneration, everyone is a little in the dark. With this information, founders and employees now understand the ballpark they’re operating in before customising to suit their particular situation. That’s really valuable in making sure they’re on the right track from the start.”
Alex McCauley, StartupAUS CEO

13Australian Startup Salary Guide 2018 13Australian Startup Salary Guide 2018
Roles Range ($ P/A) Mean Median Avg Equity %
Capital raised: $0-5m
Chief People Officer 175,000 175,000 175,000 N/A
Recruiter 80,000 80,000 80,000 N/A
Capital raised: $5-10m
Chief People Officer 120,000 120,000 120,000 N/A
Manager 65,023 – 75,000 70,012 70,012 N/A
Capital raised: $10-50m
Chief People Officer 165,000 165,000 165,000 .233
Head of People and Culture 105,000 – 200,000 143,666 126,000 .534
Head of Talent 150,000 150,000 150,000 N/A
Employee Engagement 72,000 – 75,000 73,500 73,500 .1135
Manager 70,000 – 120,000 95,000 95,000 .236
Recruiter 105,000 – 120,000 112,500 112,500 .237
“ An entrepreneur must never forget that it’s outstanding teams who build outstanding companies.”
Imogen Baxter, Square Peg Capital head of community
33 One data point34 33% of employees have equity35 100% of employees have equity – 2 points, both have equity36 50% of employees have equity37 50% of employees have equity
14Australian Startup Salary Guide 2018
Data Science
Data science is one of the fastest growing fields of work globally, and this remarkable growth is creating unprecedented demand that has yet to be fulfilled. A report by PwC reveals that there will be an additional 2.7m new jobs forecasted globally by 2020 in data science and analytics.
Capital raised: $0-5m
The findings showed that startups don’t necessarily need employees that specialise in data-related skills at this early stage. There were no B2C firms hiring anyone in these roles.
Knowing when to hire a data scientist is a key challenge for startups. Data infrastructure needs to be in place, or ready for the data hire to set up. Then there’s the issue of not having a tonne of data to work with yet, but not knowing how and what to collect without having a data scientist.
Capital raised: $10-50m
Employees in this range, irrespective of seniority, received some combination of equity along with their base salary. Barring the data engineer that received a bonus, no other employee received any bonus: equity was the preferred additional compensation. A third of these roles were with B2C firms.
Globally, there has been a recent surge in hiring for data roles, with highly qualified data scientists among the most sought-after professionals. Some data science PhDs command upwards of USD $300,000 from consulting firms, putting them beyond startup budgets.
In Australia, top dollar is paid for more bespoke technical skills such as natural language processing, social network analysis and optimisation, as well as machine learning and artificial intelligence (AI), cloud, big data and text mining.
Given the wide variety of disciplines that fall under the data science umbrella, finding the best data scientist for your organisation can be a real challenge. Identifying candidates with the right combination of technical and analytical skills is only part of the battle; the variety of fields from which they may be drawn poses a recruitment and remuneration challenge. Good salary data from across many disciplines is essential to ensure that high-quality candidates can be attracted and compensated fairly and competitively.
Deciding when to add a data scientist into your organisation is a difficult choice for many startups. Ideally, you should recruit them early enough for them to influence the types and scope of data that is collected. By waiting too long you risk having to restart your data collection before you get a meaningful data set. By recruiting too early, you risk wasting money waiting for meaningful data to be accumulated.

15Australian Startup Salary Guide 2018
Roles Range ($ P/A) Mean Median Avg Equity %
Capital raised: $0-5m
Analyst 47,286 47,286 47,286 N/A
Chief Data Officer 65,000 65,000 65,000 N/A
Data Engineer 49,400 – 180,000 106,466 90,000 239
Data Scientist 100,000 – 120,000 110,000 110,000 3340
Senior Data Scientist 55,328 – 135,000 95,164 95,164 N/A
Capital raised: $10-50m
Chief Data Officer 185,000 185,000 185,000 .4641
Data Engineer 85,000 – 130,000 108,333 110,000 .1442
Data Scientist 73,596 – 163,000 106,649 95,000 .143
Senior Data Scientist 110,000 – 180,000 136,666 120,000 .1544
“ The goal here is bench-marking and transparency. Startups and all of the organisations operating with them in the ecosystem now have the tool they need to maximise their ability to attract and retain talent.”
Alex McCauley, StartupAUS CEO
38 No data was provided for the $5-10m capital raised sector39 33.33% of employees got some equity – note minimal employees throughout the division. 40 CAUTION: 1) survey data, 2) 1 data point, and 3) industry of firm not specified 41 Only one data point42 Every employee received some equity43 75% of employees received equity 44 Every employee received some equity
15Australian Startup Salary Guide 2018
16Australian Startup Salary Guide 2018
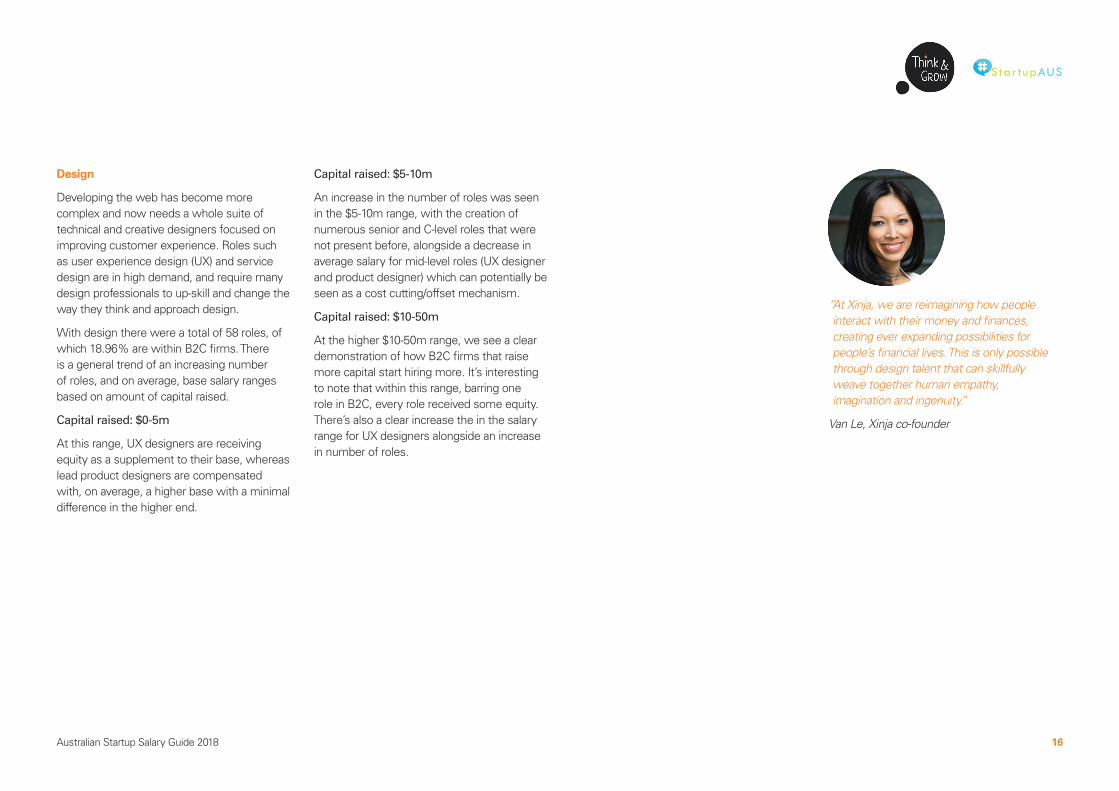
Design
Developing the web has become more complex and now needs a whole suite of technical and creative designers focused on improving customer experience. Roles such as user experience design (UX) and service design are in high demand, and require many design professionals to up-skill and change the way they think and approach design.
With design there were a total of 58 roles, of which 18.96% are within B2C firms. There is a general trend of an increasing number of roles, and on average, base salary ranges based on amount of capital raised.
Capital raised: $0-5m
At this range, UX designers are receiving equity as a supplement to their base, whereas lead product designers are compensated with, on average, a higher base with a minimal difference in the higher end.
Capital raised: $5-10m
An increase in the number of roles was seen in the $5-10m range, with the creation of numerous senior and C-level roles that were not present before, alongside a decrease in average salary for mid-level roles (UX designer and product designer) which can potentially be seen as a cost cutting/offset mechanism.
Capital raised: $10-50m
At the higher $10-50m range, we see a clear demonstration of how B2C firms that raise more capital start hiring more. It’s interesting to note that within this range, barring one role in B2C, every role received some equity. There’s also a clear increase the in the salary range for UX designers alongside an increase in number of roles.
“ At Xinja, we are reimagining how people interact with their money and finances, creating ever expanding possibilities for people’s financial lives. This is only possible through design talent that can skillfully weave together human empathy, imagination and ingenuity.”
Van Le, Xinja co-founder

17Australian Startup Salary Guide 2018
Roles Range ($ P/A) Mean Median Avg Equity %
Capital raised: $0-5m
Lead Product Designer 95,000 – 117,500 106,250 106,250 N/A
Product Designer 35,000 – 80,000 57,500 57,500 N/A
UX Designer 72,000 – 110,000 94,250 97,500 6.9645
Capital raised: $5-10m
Chief Design Officer 140,000 – 150,000 146,666 150,000 N/A
Head/VP of UX/Design 150,000 150,000 150,000 .146
Lead Product Designer 65,754 – 139,000 92,251 72,000 .0347
Capital raised: $10-50m
Chief Design Officer 260,000 260,000 260,000 .9648
Head/VP of UX/Design 160,000 – 260,000 193,333 160,000 .3949
Lead Product Designer 143,000 143,000 143,000 N/A
“ Who you hire and how you setup your team are two of the biggest levers you have in your business. Being strategic and data- oriented in people operations has a direct impact to your bottom line. There is evidence to show that CEOs that acknowledge this and make this a priority – win”.
Mahesh Muralidhar, Airtasker head of people operations
45 75% of employees received equity – anomaly: UX researcher considered under UX designer received 20% equity compared to .45 for other employees. If removed, average equity = .45%.
46 One data point47 33% of employees received equity 48 One data point49 100% of employees received equity
17Australian Startup Salary Guide 2018
18Australian Startup Salary Guide 2018
Other Observations
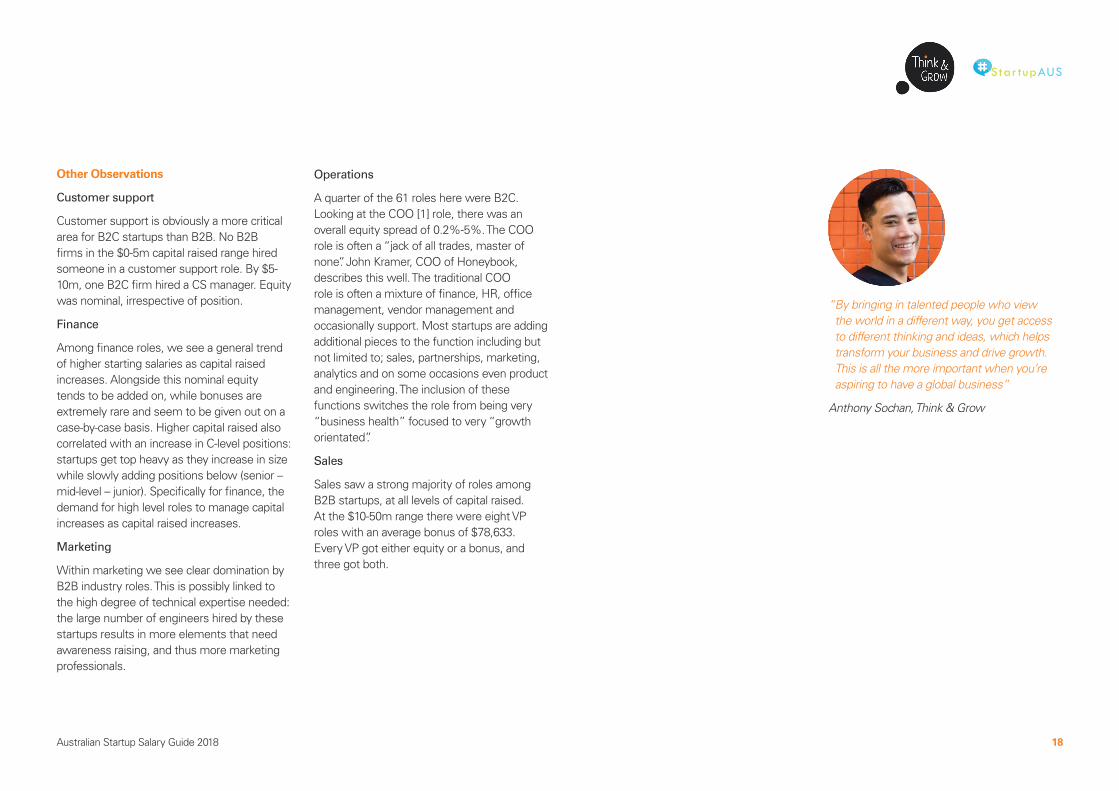
Customer support
Customer support is obviously a more critical area for B2C startups than B2B. No B2B firms in the $0-5m capital raised range hired someone in a customer support role. By $5-10m, one B2C firm hired a CS manager. Equity was nominal, irrespective of position.
Finance
Among finance roles, we see a general trend of higher starting salaries as capital raised increases. Alongside this nominal equity tends to be added on, while bonuses are extremely rare and seem to be given out on a case-by-case basis. Higher capital raised also correlated with an increase in C-level positions: startups get top heavy as they increase in size while slowly adding positions below (senior – mid-level – junior). Specifically for finance, the demand for high level roles to manage capital increases as capital raised increases.
Marketing
Within marketing we see clear domination by B2B industry roles. This is possibly linked to the high degree of technical expertise needed: the large number of engineers hired by these startups results in more elements that need awareness raising, and thus more marketing professionals.
Operations
A quarter of the 61 roles here were B2C. Looking at the COO [1] role, there was an overall equity spread of 0.2%-5%. The COO role is often a “jack of all trades, master of none”. John Kramer, COO of Honeybook, describes this well. The traditional COO role is often a mixture of finance, HR, office management, vendor management and occasionally support. Most startups are adding additional pieces to the function including but not limited to; sales, partnerships, marketing, analytics and on some occasions even product and engineering. The inclusion of these functions switches the role from being very “business health” focused to very “growth orientated”.
Sales
Sales saw a strong majority of roles among B2B startups, at all levels of capital raised. At the $10-50m range there were eight VP roles with an average bonus of $78,633. Every VP got either equity or a bonus, and three got both.
“ By bringing in talented people who view the world in a different way, you get access to different thinking and ideas, which helps transform your business and drive growth. This is all the more important when you’re aspiring to have a global business”
Anthony Sochan, Think & Grow

19Australian Startup Salary Guide 2018
Conclusion
Understanding how candidates think about their package is an important rst step for companies in building strong and lasting relationships with new employees and ensuring they secure top talent.
The efforts to understand the state of remuneration amongst our startup ecosystem highlights an important milestone in Australia’s continued efforts for global recognition of its top tech talent. In a sector where many of the jobs are less than a decade old, a continued understanding and breakdown of salary benchmarks is key to the sector’s success.
When entering the startup world, salary is one facet of the discussion, with the broader education around equity/shares/options and potential upside, yet to be largely understood. Although this guide aims to give transparency to founders on what market rates are, understanding an individual’s personal situation, motivation, lifestyle and values should never be neglected throughout the hiring process in order to secure top talent.
Although this report has taken the first steps in creating an industry-wide salary guide, it is by no means comprehensive at this stage. This report aims to evolve every year, with increasing amount of data from new companies and those graduating through to higher funding rounds.
With increased data samples, the greater accuracy of the results, particularly as we continue to upskill our local talent and relocate those from overseas, continue to build on the progress of the Australian technology world to date.
The benefits of hiring from overseas
• Global experience
• Profile raising/PR advantage
• Investor credibility
Jonathan Jeffries, Think & Grow
“ Australia is not yet a primary tech market, compared to the US and some other countries. Australian companies can make it big: just look at Canva and Atlassian. But to get there, and specifically to get into the mindset of getting there, they’re going to need the support of global talent and experience at a senior level.”
Anthony Sochan, Think & Grow

20Australian Startup Salary Guide 2018
In July 2018, remuneration packages of more than 2500 individuals were analysed to compile this guide. The data was provided by more than 350 respondents in an online survey and from 47 venture capital-backed companies that shared company-wide compensation data for their business. The VCs are Airtree Ventures, Blackbird Ventures, Blacksheep Capital, Carthona Capital, Full Circle, Reinventure, Rampersand and Square Peg Capital. All participants provided data which included base salary, benefits and incentives such as equity as well as the size of their company, funding and job title.
Methodology
• Salary data is base salary – see commentary and additional notes for references to bonuses, total target pay and comparisons with respect to location and industry serviced
• Average Equity % only considers the employees receiving equity – see relevant footnotes for the proportion of employees that received equity
• Median a better representation for average salary because it discounts the anomalies (large or small)
» Mean > Median = right skew – few larger values on the right (long right tail) with other points being clustered around the median
» Median > Mean = left skew – few smaller values on the left (long left tail) with other points being clustered around the mean – large ‘middle class’.
“ Building a business is really tough and hiring great people is consistently the #1 concern. Pragmatic benchmarking tools like this are incredibly useful to empower decision-making and compete for top talent.”
Emily Close, Airtree Ventures head of venture community and business development

21Australian Startup Salary Guide 2018
Appendix – Full data tables
Roles Range ($ P/A) Mean Median Avg Equity %
Capital raised: $0-5m
Head of Customer Support 65,000 – 140,000 94,425 87125 .8150
Customer Service Manager 75,000 – 93,000 84,000 84,000 N/A
Support Officer 65,000 – 86,700 77,233 80,000 N/A
Capital raised: $5-10m
Head of Customer Support 75,000 – 205,000 140,000 140,000 .0851
Customer Service Manager 60,000 – 150,000 84,836 74,160 .0152
Support Officer 50,229 – 80,000 60,645 60,000 .153
Capital raised: $10-50m
Head of Customer Support 90,000 – 180,000 125,000 111,000 .2954
Customer Service Manager 65,000 – 150,000 83,166 70,000 .155
Support Officer 54,750 – 80,000 62,065 60,000 N/A
Customer Support
Notes: 46 employees under this division of which 8.69% of roles were in B2B firms. Only 4 roles were with B2C firms.
50 60% of employees received some equity. 51 66.66% of employees received some equity. 52 Only 1 employee received any equity. 53 Only 1 employee received any equity. 54 71% of employees received some equity. 55 33.33% of employees received some equity.

22Australian Startup Salary Guide 2018
Roles Range ($ P/A) Mean Median Avg Equity %
Capital raised: $0-5m
Analyst 47,286 47,286 47,286 N/A
Chief Data Officer 65,000 65,000 65,000 N/A
Data Engineer 49,400 – 180,000 106,466 90,000 256
Data Scientist 100,000 – 120,000 110,000 110,000 3357
Senior Data Scientist 55,328 – 135,000 95,164 95,164 N/A
Head of Data 64,062 64,062 64,062 N/A
Capital raised: $10-50m
Chief Data Officer 185,000 185,000 185,000 .4658
Data Engineer 85,000 – 130,000 108,333 110,000 .1459
Data Scientist 73,596 – 163,000 106,649 95,000 .160
Senior Data Scientist 110,000 – 180,000 136,666 120,000 .1561
Head of Data 150,000 150,000 150,000 .462
Data
Notes: 24 total roles of which 16.66% were within B2C firms. Relative to other divisions, individuals with a skillset pertaining to data were not hired often, even in firms that raised $10-50m.
56 33.33% of employees got some equity – note minimal employees throughout the division.
57 CAUTION: 1) survey data, 2) 1 data point, and 3) industry of firm not specified
58 Only one data point59 Every employee received some equity60 75% of employees received equity 61 Every employee received some equity62 Only one data point

23Australian Startup Salary Guide 2018
Roles Range ($ P/A) Mean Median Avg Equity %
Capital raised: $0-5m
Lead Product Designer 95,000 – 117,500 106,250 106,250 N/A
Product Designer 35,000 – 80,000 57,500 57,500 N/A
UX Designer 72,000 – 110,000 94,250 97,500 6.9663
Visual/Interaction Designer 80,000 80,000 80,000 N/A
Capital raised: $10-50m
Chief Design Officer 140,000 – 150,000 46,666 150,000 N/A
Head/VP of UX/Design 150,000 150,000 150,000 .164
Lead Product Designer 65,754 – 139,000 92,251 72,000 .0365
Senior Product Designer 115,000 115,000 115,000 N/A
Product Designer 40,000 – 55,000 47,500 47,500 N/A
Senior UX Designer 115,000 – 132,000 123,500 123,500 N/A
UX Designer 42,000 – 102,000 78,177 76,530 N/A
Visual/Interaction Designer 42,000 – 132,000 84,000 81,000 N/A
Capital raised: $10-50m
Chief Design Officer 260,000 260,000 260,000 .9666
Head/VP of UX/Design 160,000 – 260,000 193,333 160,000 .3967
Lead Product Designer 143,000 143,000 143,000 N/A
Senior Product Designer 130,000 130,000 130,000 N/A
Product Designer 82,000 82,000 82,000 .0868
Senior UX Designer 100,000 – 145,000 125,428 130,500 .0969
UX Designer 90,000 – 142,500 107,750 105,000 .0770
Visual/Interaction Designer 55,000 – 100,000 72,833 63,500 .0371
Design
Notes: Total 58 roles of which 18.96% are within B2C firms. General trend of increasing number of roles, and on average, base salary ranges based on amount of capital raised.
63 75% of employees received equity – anomaly: UX researcher considered under UX designer received 20% equity compared to .45 for other employees. If removed, average equity = .45%.
64 One data point65 33% of employees received equity 66 One data point67 100% of employees received equity 68 One data point69 71% of employees have Equity70 30% of employees have equity 71 One data point

24Australian Startup Salary Guide 2018
Roles Range ($ P/A) Mean Median Avg Equity %
Capital raised: $0-5m
CTO/VP Engineering 60,000 – 175,000 130,750 140,000 2.2172
Head of Engineering 136,500 – 162,000 150,875 152,500 3.773
Engineering Manager 150,000 150,000 150,000 N/A
Senior DevOps Engineer 130,000 130,000 130,000 N/A
Senior QA / Test Engineer 125,460 125,460 125,460 N/A
Senior Engineer 73,000 – 140,000 113,222 115,000 3.7474
Lead Engineer 55,000 – 160,000 113,666 120,000 1.8375
Lead Front End Engineer 130,000 130,000 130,000 N/A
DevOps Engineer 69,160 69,160 69,160 N/A
Mid-level Engineer 55,000 – 103,000 80,528 85,613 N/A
Mid-level Front End Engineer 75,900 75,900 75,900 N/A
Junior Engineer 65,000 – 110,000 74,285 65,000 .4876
Junior Hardware Engineer 72,000 – 80,000 76,000 76,000 N/A
QA / Test Engineer 65,000 65,000 65,000 N/A
Capital raised: $5-10m
CTO/VP Engineering 136,986 – 273,750 194,819 200,000 1.3377
Head of Engineering 100,000 – 160,000 100,000 160,000 .578
Engineering Manager 143,000 – 154,000 148,500 148,500 N/A
Senior Engineer 82,000 – 160,000 127,381 135,000 .1879
Senior DevOps Engineer 105,023 105,023 105,023 N/A
Senior QA / Test Engineer 125,460 125,460 125,460 N/A
Senior Front End Engineer 115,000 115,000 115,000 .0380
Lead Engineer 100,000 – 150,000 123,666 121,000 .2781
DevOps Engineer 100,000 – 130,000 15,000 115,000 .0182
Engineering
Notes: 187 total roles of which 19% are in B2C firms. As for other divisions, these roles are dominated by B2B firms as well.
72 37.5% of employees have equity 73 50% of employee have74 55% of employees have equity. Anomaly: 14.52% - possibly
explained by the individual circumstances/needs of the business. Average equity without this point is: 1.05%
75 44% of employees have equity 76 43% of employees have equity77 43% of employees have equity 78 Only one data point79 81% of employees have equity80 50% of employees have equity81 Only one data point82 75% of employees have equity

25Australian Startup Salary Guide 2018
Roles Range ($ P/A) Mean Median Avg Equity %
Capital raised: $5-10m
Mid-level Engineer 60,000 – 120,000 94,400 92,000 N/A
Mid-level Hardware Engineer 66,000 – 80,366 73,183 73,183 N/A
Mid-level Front End Engineer 86,175 – 120,000 100,392 95,000 .0483
Junior Engineer 42,000 – 100,000 85,000 90,000 .0184
Junior Front End Engineer 54,795 – 75,000 64,898 64,898 N/A
QA / Test Engineer 65,000 – 150,000 119,000 120,000 .0185
Capital raised: $10-50m
CTO/VP Engineering 109,500 – 300,000 192,961 200,000 1.8886
Head of Engineering 145,000 – 220,000 182,500 182,500 .3687
Engineering Manager 130,000 – 178,333 155,833 157,500 .1688
Senior Engineer 100,000 – 154,000 135,775 140,981 .1689
Senior DevOps Engineer 130,000 – 164,000 149,750 152,500 .2590
Senior QA / Test Engineer 93,075 – 150,000 117,691 110,000 .1491
Senior Front End Engineer 115,000 – 150,000 130,333 126,000 .1192
Lead Engineer 135,000 – 154,000 146,000 147,500 .2293
Lead Front End Engineer 151,000 151,000 151,000 .5794
DevOps Engineer 123,333 123,333 123,333 .6195
Mid-level Engineer 85,000 – 125,000 101,551 100,000 .396
Mid-level Hardware Engineer 81,000 81,000 81,000 .4197
Mid-level Front End Engineer 75,000 – 125,000 98,666 93,500 .0998
Junior Engineer 65,000 – 120,000 79,865 75,825 .0799
Junior Front End Engineer 75,000 – 85,000 80,000 80,000 .04100
QA / Test Engineer 60,225 – 120,000 90,545 90,000 .01101
Scrum/Iteration Master 160,000 160,000 160,000 .1102
Engineering
Continued
Notes: 187 total roles of which 19% are in B2C firms. As the other divisions, these roles are dominated by B2B firms as well.
83 66% of employees have equity84 Only one data point85 60% of employees have equity86 54% of employees have equity 87 2 data points, both have equity88 75% of employees have equity89 78% of employees have equity90 75% of employees have equity91 66% of employees have equity92 66% of employees have equity93 75% of employees have equity94 Only one data point95 Only one data point96 78% of employees have equity97 Only one data point98 50% of employees have equity99 60% of employees have equity 100 50% of employees have equity 101 60% of employees have equity102 Only one data point
26Australian Startup Salary Guide 2018
Roles Range ($ P/A) Mean Median Avg Equity %
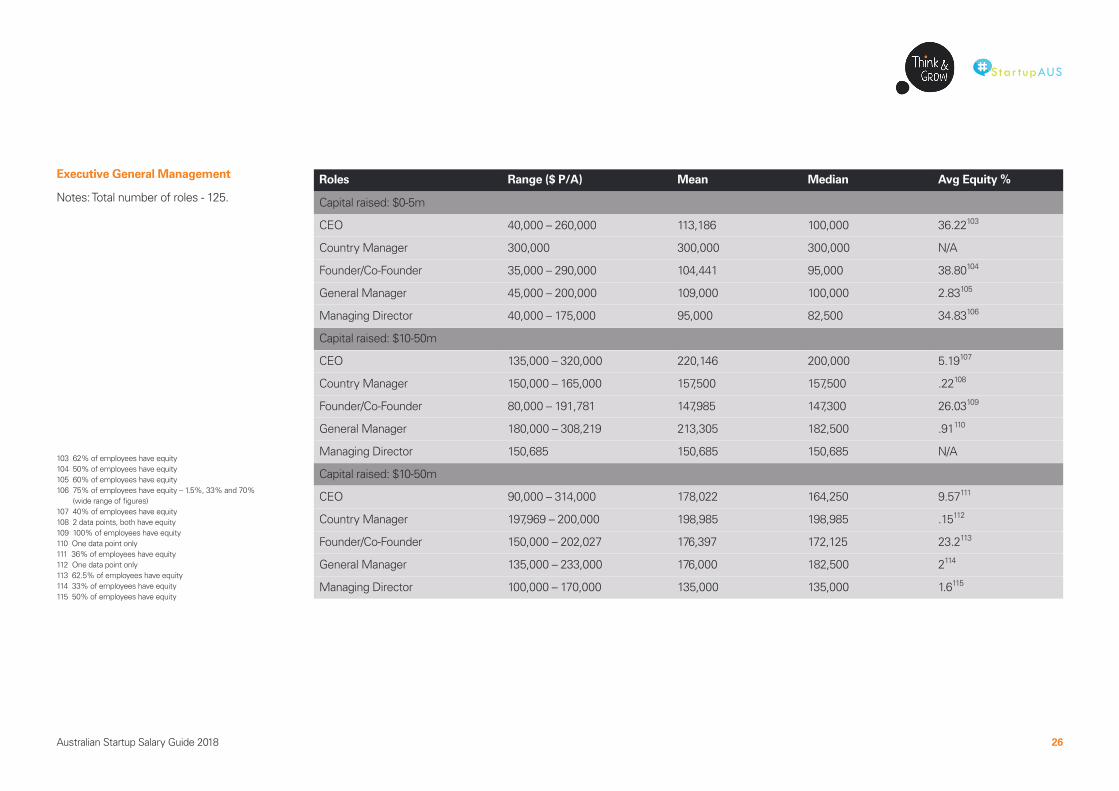
Capital raised: $0-5m
CEO 40,000 – 260,000 113,186 100,000 36.22103
Country Manager 300,000 300,000 300,000 N/A
Founder/Co-Founder 35,000 – 290,000 104,441 95,000 38.80104
General Manager 45,000 – 200,000 109,000 100,000 2.83105
Managing Director 40,000 – 175,000 95,000 82,500 34.83106
Capital raised: $10-50m
CEO 135,000 – 320,000 220,146 200,000 5.19107
Country Manager 150,000 – 165,000 157,500 157,500 .22108
Founder/Co-Founder 80,000 – 191,781 147,985 147,300 26.03109
General Manager 180,000 – 308,219 213,305 182,500 .91110
Managing Director 150,685 150,685 150,685 N/A
Capital raised: $10-50m
CEO 90,000 – 314,000 178,022 164,250 9.57111
Country Manager 197,969 – 200,000 198,985 198,985 .15112
Founder/Co-Founder 150,000 – 202,027 176,397 172,125 23.2113
General Manager 135,000 – 233,000 176,000 182,500 2114
Managing Director 100,000 – 170,000 135,000 135,000 1.6115
Executive General Management
Notes: Total number of roles - 125.
103 62% of employees have equity 104 50% of employees have equity105 60% of employees have equity106 75% of employees have equity – 1.5%, 33% and 70%
(wide range of figures)107 40% of employees have equity 108 2 data points, both have equity109 100% of employees have equity110 One data point only111 36% of employees have equity 112 One data point only 113 62.5% of employees have equity114 33% of employees have equity 115 50% of employees have equity

27Australian Startup Salary Guide 2018
Roles Range ($ P/A) Mean Median Avg Equity %
Capital raised: $0-5m
CFO 130,000 – 250,000 190,000 190,000 3116
Accountant 60,000 – 70,000 65,000 65,000 N/A
Analyst 50,000 50,000 50,000 N/A
Financial Controller 103,531 103,531 103,531 N/A
Capital raised: $10-50m
CFO 108,000 – 170,000 139,000 139,000 N/A
VP/Head of Finance 145,000 – 187,500 166,250 166,250 1.06117
Accountant 60,000 – 82,000 147,985 147,300 23.2118
Financial Controller 90,000 – 140,0005 110,000 100,000 .05119
Capital raised: $10-50m
CFO 150,000 – 250,000 183,708 176,125 .64120
VP/Head of Finance 160,000 – 164,250 162,125 162,125 .42121
Accountant 56,000 – 127,854 94,570 90,000 .06122
Financial Controller 85,000 – 160,000 122,000 130,000 .3123
Analyst 62,333 – 85,000 1,108 68,550 .34124
Finance
Notes: Total 38 roles of which 20% in B2C firms.
116 100% of employees have equity 117 100% of employees have equity118 62.5% of employees have equity119 33% of employees have equity120 33% of employees have equity 121 2 points both have equity 122 60% of employees have equity123 60% of employees have equity124 25% of employees have equity

28Australian Startup Salary Guide 2018
Roles Range ($ P/A) Mean Median Avg Equity %
Capital raised: $0-5m
Chief People Officer 175,000 175,000 175,000 N/A
Recruiter 80,000 80,000 80,000 N/A
Capital raised: $10-50m
Chief People Officer 120,000 120,000 120,000 N/A
Manager 65,023 – 75,000 70,012 70,012 N/A
Capital raised: $10-50m
Chief People Officer 165,000 165,000 165,000 .2125
Head of People and Culture 105,000 – 200,000 143,666 126,000 .5126
Head of Talent 150,000 150,000 150,000 N/A
Employee Engagement 72,000 – 75,000 73,500 73,500 .11127
Manager 70,000 – 120,000 95,000 95,000 .2128
Recruiter 105,000 – 120,000 112,500 112,500 .2129
HR / People & Culture
Notes: 16 total roles of which one was in a B2C firm.
125 One data point126 33% of employees have equity127 100% of employees have equity – 2 points, both have equity128 50% of employees have equity129 50% of employees have equity
29Australian Startup Salary Guide 2018
Roles Range ($ P/A) Mean Median Avg Equity %
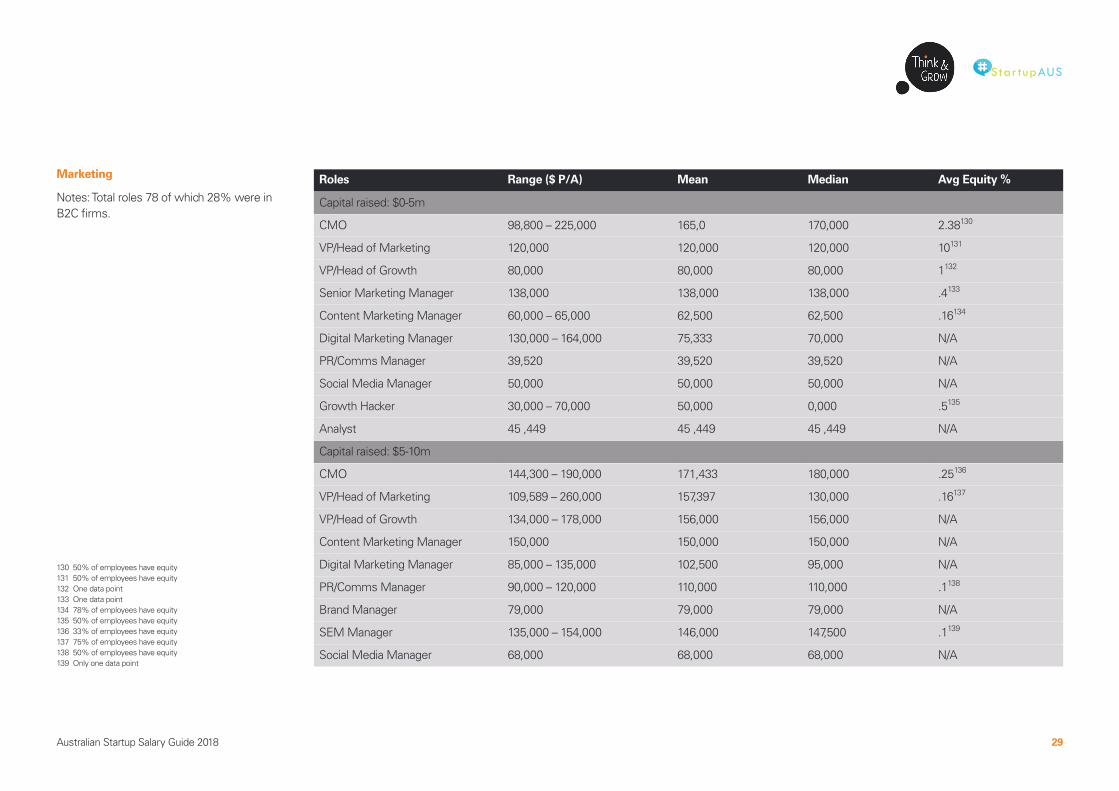
Capital raised: $0-5m
CMO 98,800 – 225,000 165,0 170,000 2.38130
VP/Head of Marketing 120,000 120,000 120,000 10131
VP/Head of Growth 80,000 80,000 80,000 1132
Senior Marketing Manager 138,000 138,000 138,000 .4133
Content Marketing Manager 60,000 – 65,000 62,500 62,500 .16134
Digital Marketing Manager 130,000 – 164,000 75,333 70,000 N/A
PR/Comms Manager 39,520 39,520 39,520 N/A
Social Media Manager 50,000 50,000 50,000 N/A
Growth Hacker 30,000 – 70,000 50,000 0,000 .5135
Analyst 45 ,449 45 ,449 45 ,449 N/A
Capital raised: $5-10m
CMO 144,300 – 190,000 171,433 180,000 .25136
VP/Head of Marketing 109,589 – 260,000 157,397 130,000 .16137
VP/Head of Growth 134,000 – 178,000 156,000 156,000 N/A
Content Marketing Manager 150,000 150,000 150,000 N/A
Digital Marketing Manager 85,000 – 135,000 102,500 95,000 N/A
PR/Comms Manager 90,000 – 120,000 110,000 110,000 .1138
Brand Manager 79,000 79,000 79,000 N/A
SEM Manager 135,000 – 154,000 146,000 147,500 .1139
Social Media Manager 68,000 68,000 68,000 N/A
Marketing
Notes: Total roles 78 of which 28% were in B2C firms.
130 50% of employees have equity 131 50% of employees have equity 132 One data point133 One data point134 78% of employees have equity135 50% of employees have equity136 33% of employees have equity 137 75% of employees have equity138 50% of employees have equity139 Only one data point

30Australian Startup Salary Guide 2018
Marketing
Continued
Notes: Total roles 78 of which 28% were in B2C firms
Roles Range ($ P/A) Mean Median Avg Equity %
Capital raised: $5-10m
CMO 165,000 – 260,000 216,666 195,000 1.39140
VP/Head of Marketing 140,000 – 218,000 171,753 180,000 .16141
VP/Head of Growth 155,000 – 165,000 160,000 160,000 .2142
Content Marketing Manager 64,000 – 130,000 91,722 90,000 .06143
Digital Marketing Manager 76,000 – 140,000 106,871 105,000 .09144
PR/Comms Manager 85,000 – 140,000 112,627 112,880 .07145
SEM Manager 95,000 95,000 95,000 .06146
SEO Manager 120,000 120,000 120,000 N/A
Social Media Manager 90,000 90,000 90,000 .07147
Growth Hacker 135,000 135,000 135,000 N/A
Analyst 56,000 56,000 56,000 N/A
140 100% of employees have equity 141 75% of employees have equity142 2 data points, both have equity143 62% of employees have equity144 60% of employees have equity145 33% of employees have equity146 Only one data point147 Only one data point

31Australian Startup Salary Guide 2018
Roles Range ($ P/A) Mean Median Avg Equity %
Capital raised: $0-5m
COO 50,000 – 175,000 108,125 100,000 2.48148
VP/Head of Operations 75,000 75,000 75,000 N/A
Office Manager 55,000 –71,400 63,345 65,000 .4149
Operations Manager 49,400 – 150,000 86,680 75,000 .5150
Capital raised: $10-50m
COO 88,000 – 200,000 143,390 150,000 1.4151
Head of Strategy/Strategy Manager 145,000 145,000 145,000 N/A
Officer Manager 50,000 50,000 50,000 N/A
Operations Manager 75,000 – 165,000 113,333 100,000 .5152
Capital raised: $10-50m
COO 130,000 – 272,518 185,360 180,000 2.08153
VP/Head of Operations 80,000 – 216,230 145,256 160,000 1.16154
Head of Strategy/Strategy Manager 14,000 – 250,000 191,666 185,000 .26155
Director of Operations (AU) 115,000 115,000 115,000 .21156
Director of Operations (US) 152,320 152,320 152,320 N/A
General Counsel 75,000 – 175,000 130,000 140,000 .18157
Office Manager 67,000 – 120,000 83,166 78,500 .03158
Operations Manager 60,000 – 143,000 105,750 110,000 .45159
Sales Operations 122,400 122,400 122,400 .14160
Operations
Notes: Total 61 roles – 25% in B2C firms.
148 62% of employees have equity149 20% of employees have equity150 20% of employees have equity151 60% of employees have equity 152 33% of employees have equity153 71% of employees have equity 154 100% of employees have equity155 66% of employees have equity156 Only one data point157 66% of employees have equity158 66% of employees have equity159 75% of employees have equity160 Only one data point

32Australian Startup Salary Guide 2018
Roles Range ($ P/A) Mean Median Avg Equity %
Capital raised: $0-5m
Chief Product Officer 60,000 – 152,000 117,333 140,000 14161
VP/Head of Product 90,000 – 200,000 142,500 140,000 2162
Senior Product Manager 70,000 – 110,000 90,000 90,000 N/A
Product Manager 46,800 – 150,000 84,200 70,000 N/A
Junior Product Manager 45,000 – 52,000 48,500 48,500 N/A
Capital raised: $10-50m
Chief Product Officer 145,000 – 180,000 162,500 162,500 .69163
VP/Head of Product 87,671 – 183,000 135,335 135,335 N/A
Senior Product Manager 67,000 – 78,100 72,550 72,550 .22164
Product Manager 55,000 – 135,000 99,888 95,000 .13165
Junior Product Manager 130,000 – 164,000 149,750 152,500 .25166
Product Analyst 51,767 51,767 51,767 N/A
Capital raised: $10-50m
Chief Product Officer 170,000 – 275,000 206,250 190,000 .47167
VP/Head of Product 142,000 – 235,000 199,250 210,000 .7168
Senior Product Manager 105,000 – 150,000 133,750 140,000 .11169
Product Manager 80,000 – 150,000 118,738 120,000 .11170
Junior Product Manager 115,000 115,000 115,000 .1171
Product Owner 60,000 – 163,942 111,971 111,971 .1172
Product Analyst 65,000 65,000 65,000 N/A
Product
Notes: Total 58 roles, 9 in B2C firms.
161 33% of employees have equity 162 25% of employees have equity163 100% of employees have equity 164 50% of employees have equity165 75% of employees have equity166 75% of employees have equity167 100% of employees have equity 168 100% of employees have equity169 57% of employees have equity170 71% of employees have equity171 One data point172 50% of employees have equity
33Australian Startup Salary Guide 2018
Roles Range ($ P/A) Mean Median Avg Equity %
Capital raised: $0-5m
Chief Revenue Officer 90,000 – 200,000 147,500 150,000 2173
VP/Head of Sales 105,000 – 160,000 135,000 150,000 3.60174
Head of Growth 87,000 87,000 87,000 1.35175
Business Development Manager 100,000 – 154,000 109,166 100,000 .1176
Customer Success Manager 130,000 – 164,000 81,511 75,000 N/A
Inside Sales 50,000 – 85,000 71,667 80,000 .1177
Sales Support 62,586 62,586 62,586 N/A
Capital raised: $10-50m
VP/Head of Sales 100,460 – 200,000 150,132 164,000 3.42178
Business Development Manager 65,000 – 119,260 85,028 80,000 .29179
Account Manager 80,000 – 140,000 102,200 86,000 .04180
Customer Success Manager 70,000 – 90,600 83,533 90,000 .22181
Sales Support 50,229 – 60,000 55,114 55,114 N/A
Pre-Sales Engineer 90,000 90,000 90,000 N/A
Capital raised: $10-50m
Chief Revenue Officer 200,000 – 436,601 285,533 220,000 .78182
VP/Head of Sales 130,000 – 228,000 173,487 167,125 .29183
Business Development Manager 75,000 – 140,000 110,000 120,000 1.71184
Account Manager 65,000 – 125,000 84,526 80,000 .07185
Customer Success Manager 70,000 – 200,000 104,785 95,000 .07186
Inside Sales 55,000 – 105,000 68,222 62,560 .12187
Sales Support 65,000 – 73,000 69,000 69,000 .04188
Pre-Sales Engineer 88,400 – 188,074 138,824 140,000 .07189
Sales
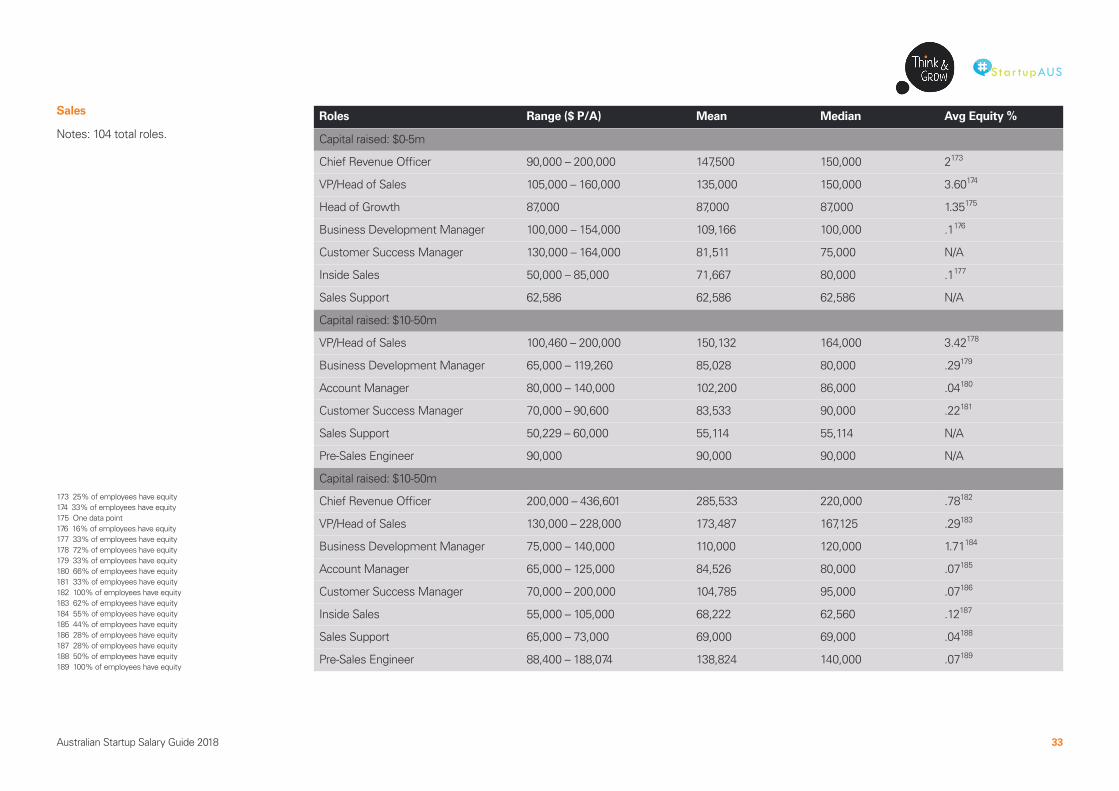
Notes: 104 total roles.
173 25% of employees have equity 174 33% of employees have equity175 One data point176 16% of employees have equity177 33% of employees have equity178 72% of employees have equity179 33% of employees have equity180 66% of employees have equity181 33% of employees have equity182 100% of employees have equity 183 62% of employees have equity184 55% of employees have equity185 44% of employees have equity186 28% of employees have equity187 28% of employees have equity188 50% of employees have equity 189 100% of employees have equity

34Australian Startup Salary Guide 2018
StartupAus startupaus.org [email protected]
Sydney 223 Liverpool St, Darlinghurst NSW 2010 +61 401 388 061
Melbourne 2/287 Collins St, Melbourne VIC 3000 +61 421 731 610
London 24 Endell St, London WC2H 9HQ, UK +44 7739 973 938
E-mail [email protected]
Download the guide: thinkandgrowinc.com/resourcelibrary/
Thank you to our contributors: Sophia Witherington, Yashraj Shukla, and Kicker Communications