australian resources, energy & utilities conference/media/files/w/worleyparsons/... ·...
TRANSCRIPT

Australian Resources, Energy & Utilities Conference
Australasian Energy
WorleyParsonsBrian Evans – Managing Director, Hydrocarbons
19 June 2009
19 June 2009

19 June 2009

Presentation Elements
Update on WorleyParsons
Energy & LNG Markets
Our Energy Customers
Global Project Trends & Challenges
Conclusions
19 June 2009
Update on WorleyParsons
Minerals & Metals
Power
Infrastructure &Environment
Hydrocarbons
19 June 2009

Operating Across an Asset’s Lifecycle
Leading global professional services provider to the energy, resource, and complex process industriesWorleyParsons experience covers all five phases of the asset lifecycle
19 June 2009

Customer Sector Groups
HydrocarbonsUpstreamFixed Offshore Production FacilitiesFloating & Deepwater SolutionsOffshore P/L & Subsea SystemsOnshore P/L & Receiving TerminalsOnshore Oil & Gas Production FacilitiesHeavy Oil & Oil SandsLNGDownstreamRefining & PetrochemicalsSulphur ManagementSpecialty Chemicals
Power
Advanced CoalCoalGas Turbine Based Power Plants NuclearRenewable EnergyTransmission Networks
Infrastructure & Environment
Coastal & MarineWater & Wastewater TransportEnvironment
Minerals& Metals
Base MetalsCoalChemicalsFerrous MetalsAluminaAluminiumIron OreGas Cleaning
Cross-Sector synergies being captured
19 June 2009
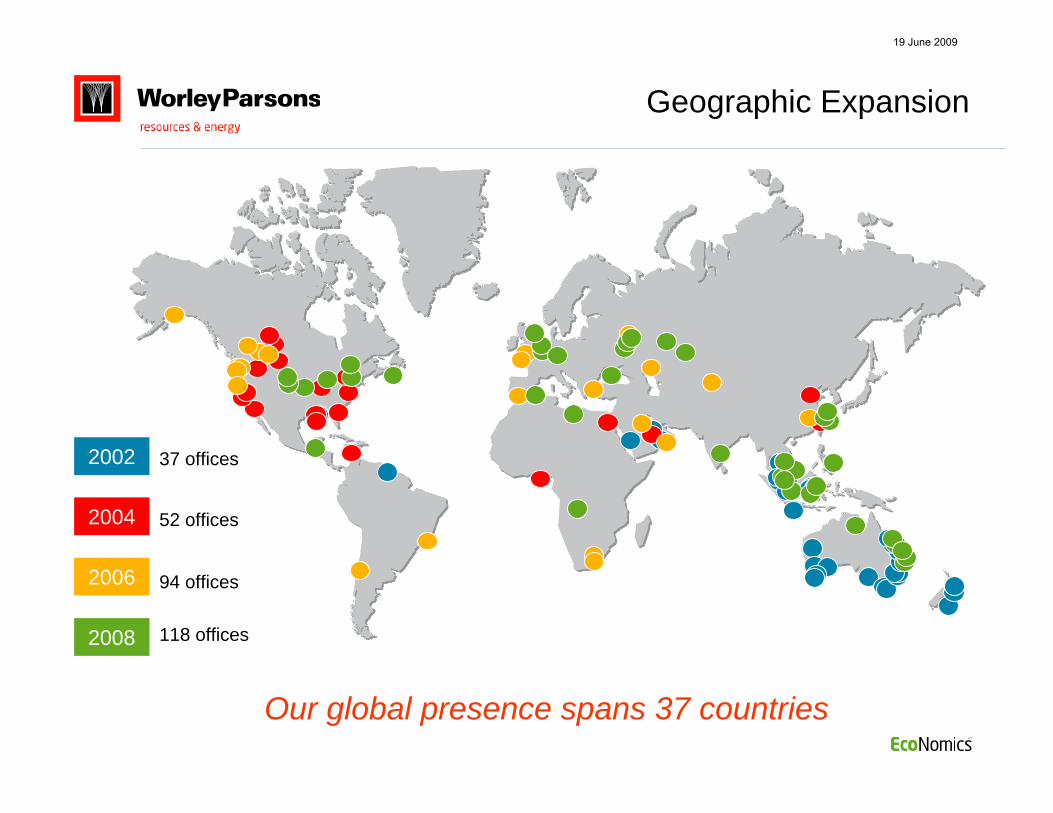
Geographic Expansion
2002 37 offices
2004 52 offices
2006 94 offices
2008 118 offices
Our global presence spans 37 countries
19 June 2009
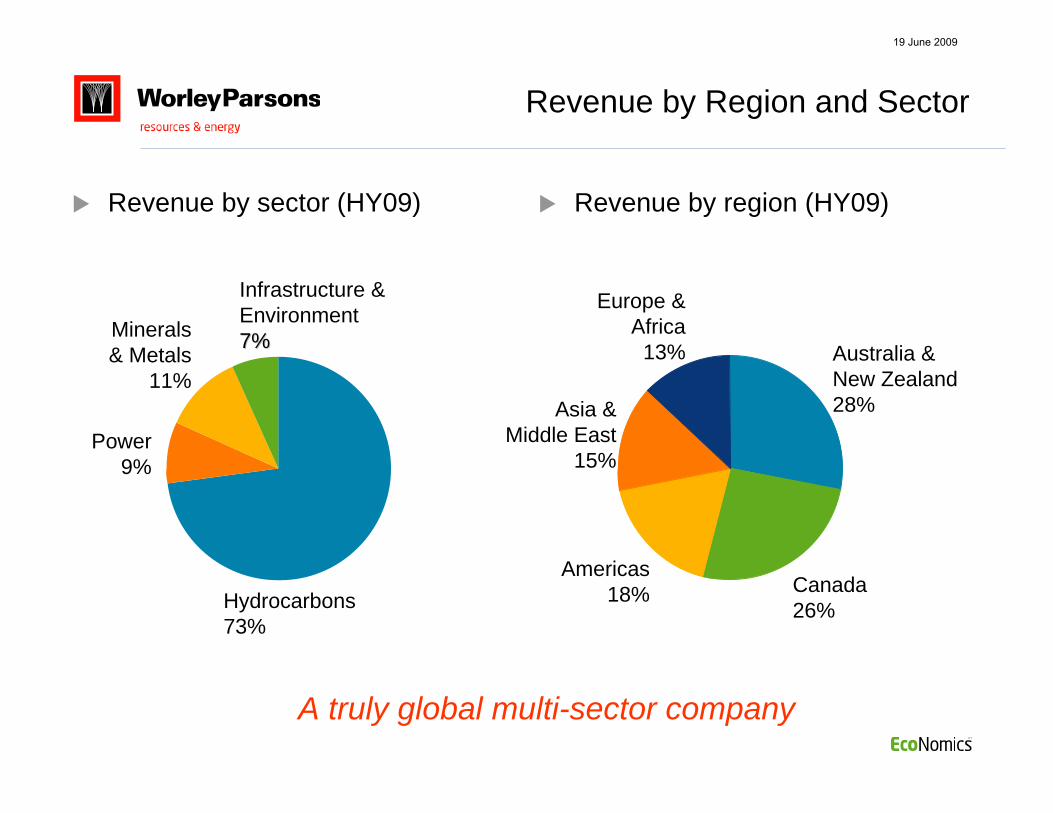
Revenue by Region and Sector
Revenue by sector (HY09) Revenue by region (HY09)
Hydrocarbons73%
Power9%
Minerals& Metals
11%
Infrastructure &Environment7%7%
Europe &Africa
13% Australia &New Zealand28%Asia &
Middle East15%
Americas18% Canada
26%
A truly global multi-sector company
19 June 2009

Long Term Contracts and Asset Services
Long term, asset service contracts are a key part of our businessImprove is a service focused on improving our customers’ business outcomesIt is a tailored service to meet the needs of individual sites
0
20
40
60
80
100
120
140
160
2002 2003 2004 2005 2006 2007 2008
No
of Im
prov
eC
ontr
acts
A strategically important part of our business
19 June 2009
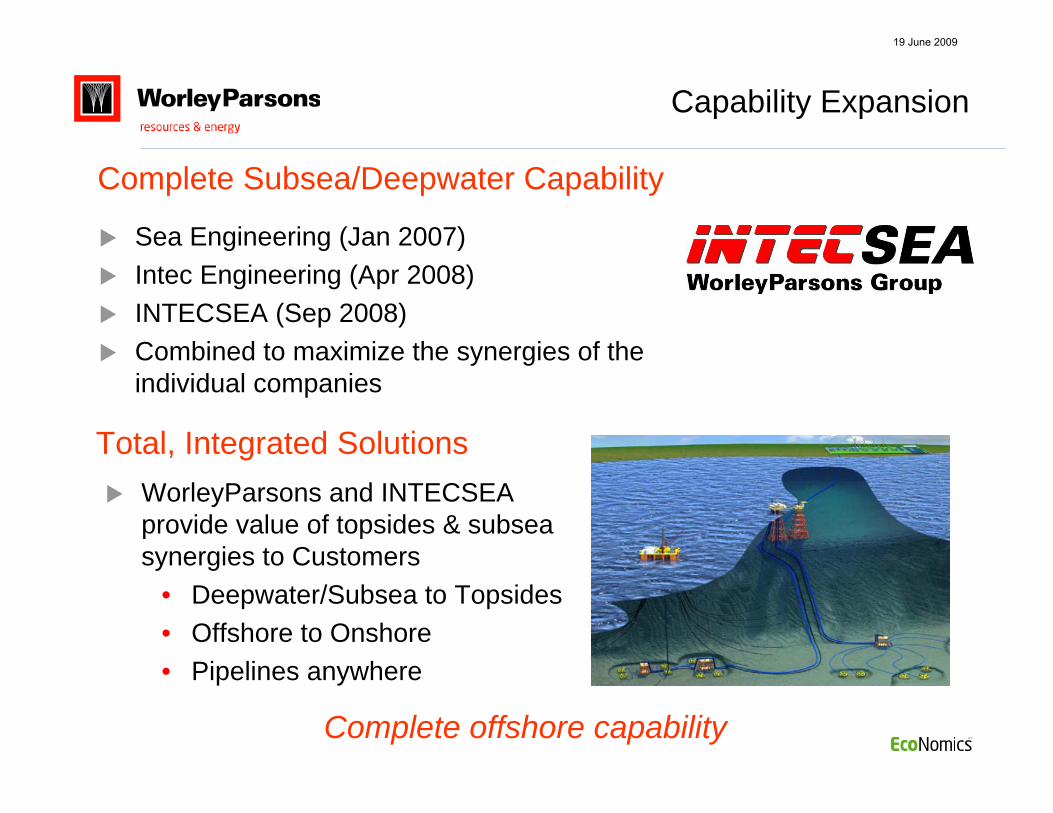
Sea Engineering (Jan 2007)Intec Engineering (Apr 2008)INTECSEA (Sep 2008)Combined to maximize the synergies of the individual companies
WorleyParsons and INTECSEA provide value of topsides & subsea synergies to Customers
• Deepwater/Subsea to Topsides• Offshore to Onshore• Pipelines anywhere
Capability Expansion
Complete Subsea/Deepwater Capability
Total, Integrated Solutions
Complete offshore capability
19 June 2009

Offshore: Floating LNG (FLNG)
Greenfield
Delivering Gas Solutions
BrownfieldOnshore LNG
LNG Re-Gasification
Deepwater
Sour
Difficult Gas
Involved across all phases of Gas & LNG
Arctic
19 June 2009
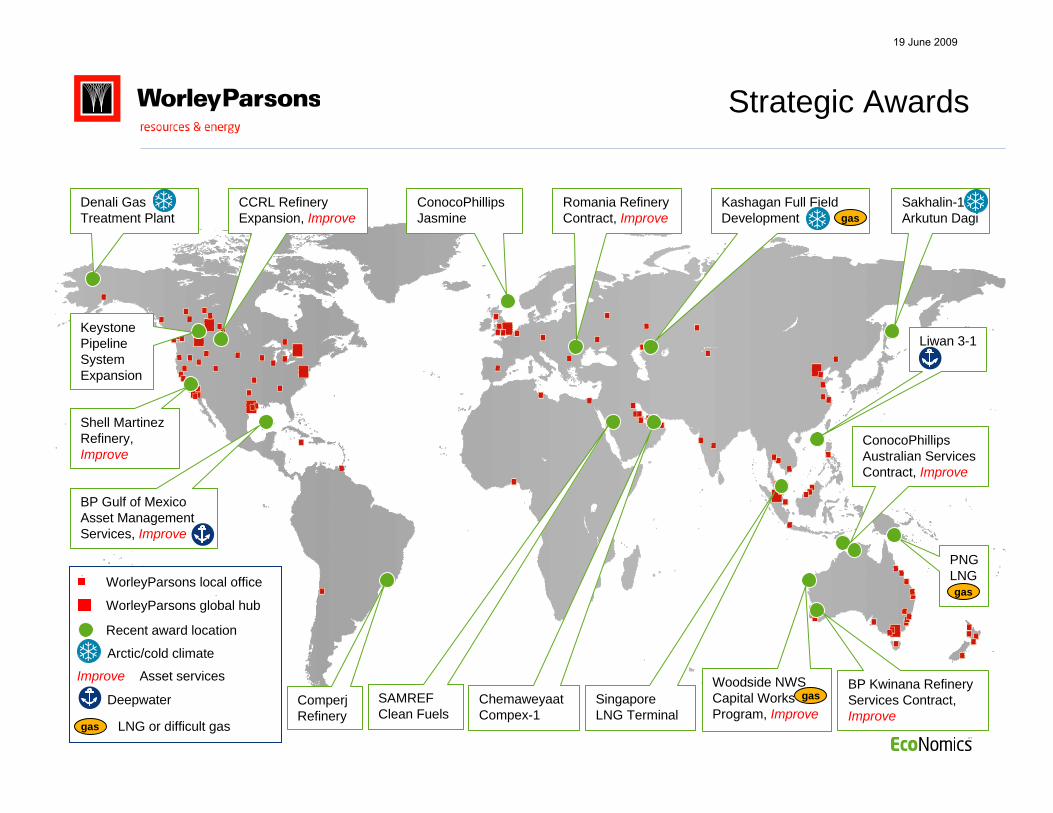
Strategic Awards
Keystone Pipeline System Expansion
CCRL Refinery Expansion, Improve
Shell Martinez Refinery,Improve
ComperjRefinery
SAMREF Clean Fuels
ConocoPhillips Jasmine
Romania Refinery Contract, Improve
Woodside NWS Capital Works Program, Improve
BP Kwinana Refinery Services Contract, Improve
ConocoPhillips Australian Services Contract, Improve
Liwan 3-1
WorleyParsons local office
WorleyParsons global hub
Recent award location
Denali Gas Treatment Plant
Kashagan Full Field Development
Sakhalin-1 Arkutun Dagi
Arctic/cold climate
Improve Asset services
Deepwater
BP Gulf of Mexico Asset Management Services, Improve
PNG LNG
gas LNG or difficult gas
gas
gas
gas
Chemaweyaat Compex-1
Singapore LNG Terminal
19 June 2009

Energy & LNG Markets
19 June 2009

Global energy demand growth has reduced, however long-term fundamentals are unchanged
Demand for oil & gas will continue to be strong over medium-term
Difficult and challenging hydrocarbons remain the new frontiers, with gas becoming the greener fuel choice
Sources: Douglas-Westwood
Energy Trends
Fundamentals remain sound
Global Energy Demand
Global population
Primary energy consumption
Billio
ns o
f Peo
ple
Billio
n To
ns O
il Eq
uiva
lent
Global Energy Supply
Onshore
Offshore-shallow
DeepwaterM
illion
Bar
rels
per
day Biofuels
CTLGTLOil ShalesOil SandsRefinery Gain
19 June 2009
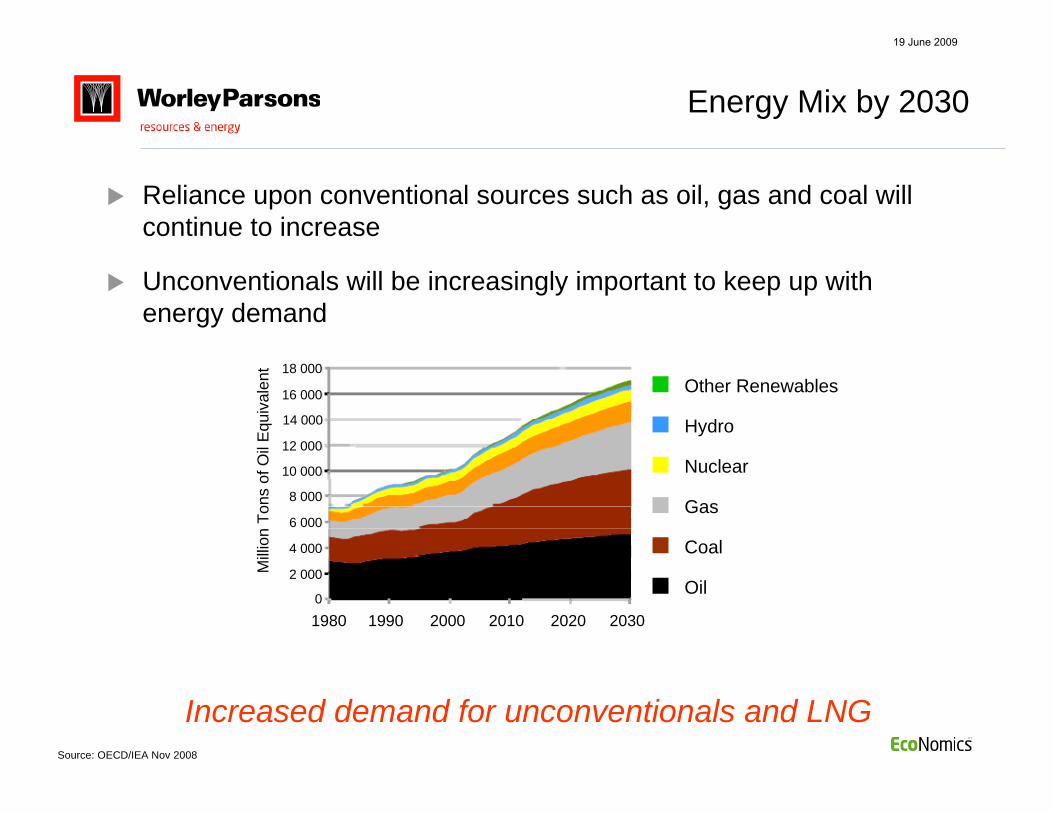
Reliance upon conventional sources such as oil, gas and coal will continue to increase
Unconventionals will be increasingly important to keep up with energy demand
Source: OECD/IEA Nov 2008
Energy Mix by 2030
Increased demand for unconventionals and LNG
Other Renewables
Hydro
Nuclear
Gas
Coal
Oil
Milli
on T
ons
of O
il Eq
uiva
lent
1980 1990 2000 2010 2020 2030
18 000
16 000
14 000
12 000
10 000
8 000
6 000
4 000
2 000
0
19 June 2009

Major sources of demandinclude Western Europeand North America
Sources: EIA, BP Statistical Review of World Energy 2009
Major sources of supply growth include Australia, Middle East and Africa
Supply Demand
Gas will account for 22% of global energy use by 2030 (source EIA)
and will be key in supporting global demand growth for cleaner energy
Europe & Eurasia
North America
Middle East
Africa
Asia Pacific
Gas Markets
Australia and PNG are key future sources of gas
2000
2005
1995
1990 2000
2005
1995
1990
250
750
500
1000
Sup
ply
(Bcm
)
1000
1500
500
2000
Dem
and
(Bcm
)
19 June 2009

LNG Limited/ArrowFisherman’s Landing
GLNG (Santos/Petronas)GLNG
BG GroupQueensland Curtis (QCLNG)
Energy World CorporationAbbot Point
Australia Pacific LNG(ConocoPhillips/Origin Energy)APLNG
ExxonMobilScarborough
ChevronGreater Gorgon
ConocoPhillipsDarwin LNG(operating)
ExxonMobil/Oil SearchPNG LNG
InterOil/Petromin PNGLiquid Niugini Gas (Elk 1&2)
WoodsidePluto Trains 2/3
WoodsidePluto
(in construction)
WoodsideBrowse
WoodsideNWSV Trains 1-5
(operating)
WoodsideSunrise
ChevronWheatstone
ShellPrelude
INPEXIchthys
Australia and PNG LNG Footprint
Offshore Conventional Gas to LNG Projects
Coal Seam Methane to LNG Projects
Onshore Conventional Gas to LNG Projects
WorleyParsons Involvement
Many competing projects in the region
19 June 2009

Our Energy Customers
19 June 2009
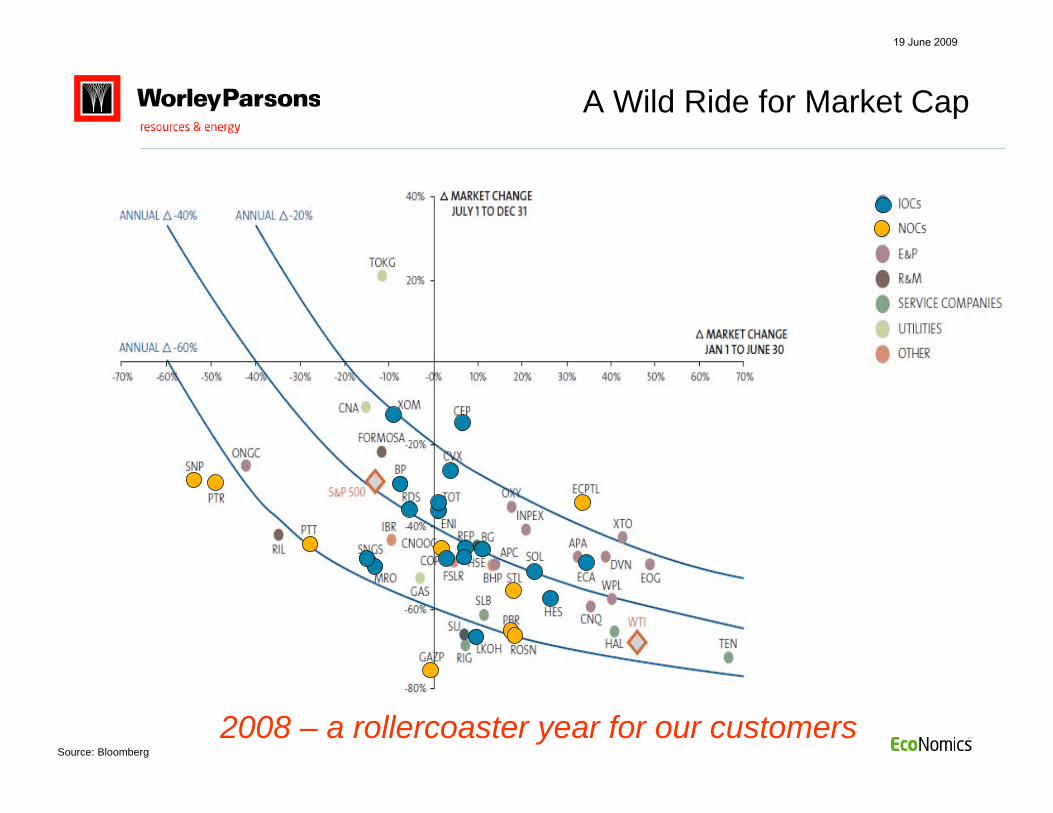
A Wild Ride for Market Cap
2008 – a rollercoaster year for our customersSource: Bloomberg
19 June 2009

Capital budgets for IOCs & NOCs vary compared to 2008 Majority allocated to Upstream
Customer 2009 Capital Budgets
2009 Capital Budgets
-40%
-30%
-20%
-10%
0%
10%
20%
30%
40%
5 10 15 20 25 30 35
Capital Budget (US$ Billion)
Cha
nge
from
200
8
Capital spend among our best customers is stable
IOC
NOC
Top 15 HC Customer
19 June 2009
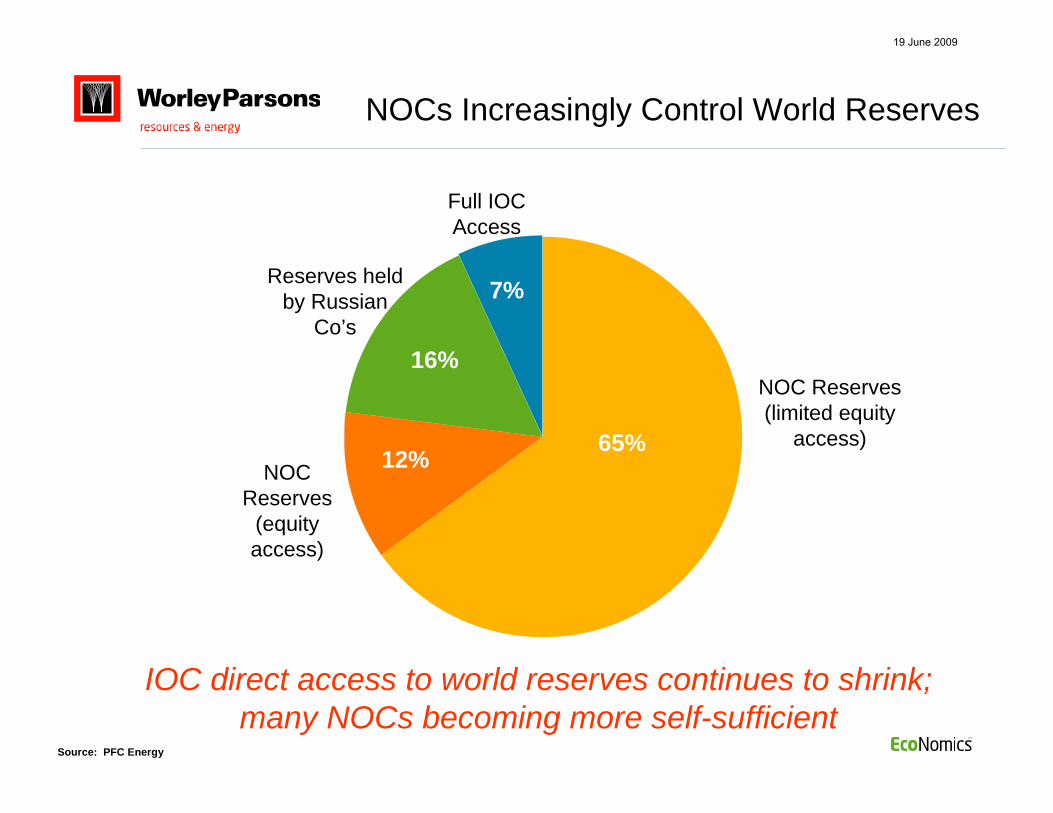
Source: PFC Energy
NOCs Increasingly Control World Reserves
65%
7%
16%
12%
NOC Reserves(limited equity
access)
Full IOCAccess
Reserves held by Russian
Co’s
NOC Reserves
(equity access)
IOC direct access to world reserves continues to shrink;many NOCs becoming more self-sufficient
19 June 2009

Hydrocarbons Customer Base
We have a broad global multi-national hydrocarbons customer baseand a comprehensive geographic presence to provide local services
IntegratedOil Companies
(IOCs) Independents
NationalOil Companies
(NOCs)
50 – 60% Revenue
25 – 30% Revenue
15 – 20% Revenue
Strategically, we are growing our work with NOCs
19 June 2009

Global Project Trends & Challenges
19 June 2009

Significant increase in mega-projects (> $1 Billion) in last few yearsProject Complexity Increases Difficult Oil: Unconventional sources & Politics More Consortia/JVs/Alliances between Owners
and Contractors Remote geographic locations, harsh environments
Global Financial Crisis Effects Emphasis on efficiency Long term positioning Reserves replacement impacted - reduced drilling Oil Sands in Canada hit hard
Project Environment Has Changed
19 June 2009
Project Environment Has Changed(continued)
Current Supply Trends Increased margin pressure Reduced equipment, steel, and labour costs Reduced delivery times Reduced workforce in some areas
Have we reached the bottom yet?
19 June 2009
Conclusions
19 June 2009

Currently, at or near bottom of supplier market; oil price is rebounding; gas pricing should recover, mid-termBut, strong pressure on margins is continuing, so far….Over the last few weeks, customers are beginning to talk about re-initiating some of their larger projects (fearing that they will miss the bottom, and again be in the queue)Forecast growth in Australian LNG is result of forecast strong long-term global energy demand; many LNG project opportunities exist todayWorleyParsons has complete and global offshore, gas & LNG, and asset lifecycle project capabilities
Conclusions
19 June 2009

Outlook
Despite some projects and sectors being affected by the global economic crisis the outlook in other sectors remains positive.
We expect some recently announced contract awards, amongst the largest in the company’s history, will support earnings in the 2010 financial year and beyond. We continue to benefit from a lower Australian dollar compared to other currencies. Currently we expect to report good growth for the 2009 financial year.
The Company continues to evaluate opportunities for new business growth that will add value to our existing capabilities and provide value to our shareholders.
19 June 2009