australian macroeconomic performance and policies in … · australian macroeconomic performance...
TRANSCRIPT

32 David Gruen and Glenn Stevens
Australian Macroeconomic Performanceand Policies in the 1990s
David Gruen and Glenn Stevens1
1. IntroductionA decade ago, in July 1990, the Australian economy had just entered a severe
recession. Real GDP slowed in the first half of 1990, and then began to fall in thesecond half of the year. The rate of unemployment in mid 1990 was around63/4 per cent but rose sharply in the following year. The rate of inflation was around6 per cent, but was about to decline quickly, to levels not seen since the early 1960s.For many, the decline in inflation was completely unexpected, and many believedfor several years that it could not last.
The recovery from the recession began some time in the September quarter of1991. It was initially slow and tentative, with the result that the unemployment rate,instead of falling rapidly as had occurred in the early phase of recovery in 1983, infact continued to rise until late 1992. Pessimism about the prospects for theAustralian economy, and particularly about unemployment, became intense in thatperiod.
Yet as of mid 2000, the economy has recorded nine years of continual growth,averaging about 4 per cent per year, the longest expansion in the Australian economysince the 1960s, and a performance similar in many respects to that in the United States.Per capita growth in GDP was noticeably higher than in the preceding two decades,helped by a marked lift in productivity growth. The rate of unemployment hasdeclined, albeit gradually, to within sight of previous cyclical lows. At the same time,the CPI inflation rate has averaged less than 3 per cent for a decade. Equally, thevariability of both inflation and GDP growth have declined compared with thepreceding two decades.
In looking back over a decade, there are two basic approaches that might be taken.One is chronological – to treat the important trends and episodes in order, in the formof a historical narrative. It can be taken for granted – it is by the present authors atany rate – that capitalist economies display cyclical behaviour. A narrative chronologywould trace out the evolution of these forces. This has its value, but many of theepisodes – particularly the early 1990s recession and the immediate aftermath –have been treated at length before.
An alternative approach is to take the period as a whole, to ask in what ways theperformance of the economy was noteworthy. How was it different to earlierperiods? What were the changes to the underlying structure of the economy, and thepolicy regimes under which it operated, which affected this performance? How did
1. We are very grateful to Meredith Beechey for tireless research assistance, to Guy Debelle andNicholas Gruen for helpful comments, and to Dominic Wilson for discussions about productivitygrowth.
33Australian Macroeconomic Performance and Policies in the 1990s
the external forces affecting the economy differ in the 1990s from those of the 1980sand 1970s? What was the nature of the policy debate, how was it different to thosein earlier periods, and why?
The latter approach is the one attempted here. Necessarily, the treatment has to bereasonably selective, but it is a more interesting approach, mostly because the 1990soutcomes tell a pretty good story.
Section 2 of the paper contains a recounting of the key macroeconomic featuresof the 1990s, with sections on output and productivity growth, inflation, the labourmarket, the balance of payments, and financial trends. Section 3 covers the policydebates, with sections on monetary policy, the current account and fiscal policy.Section 4 offers some concluding observations.
2. Features of Macroeconomic Performance in the 1990s
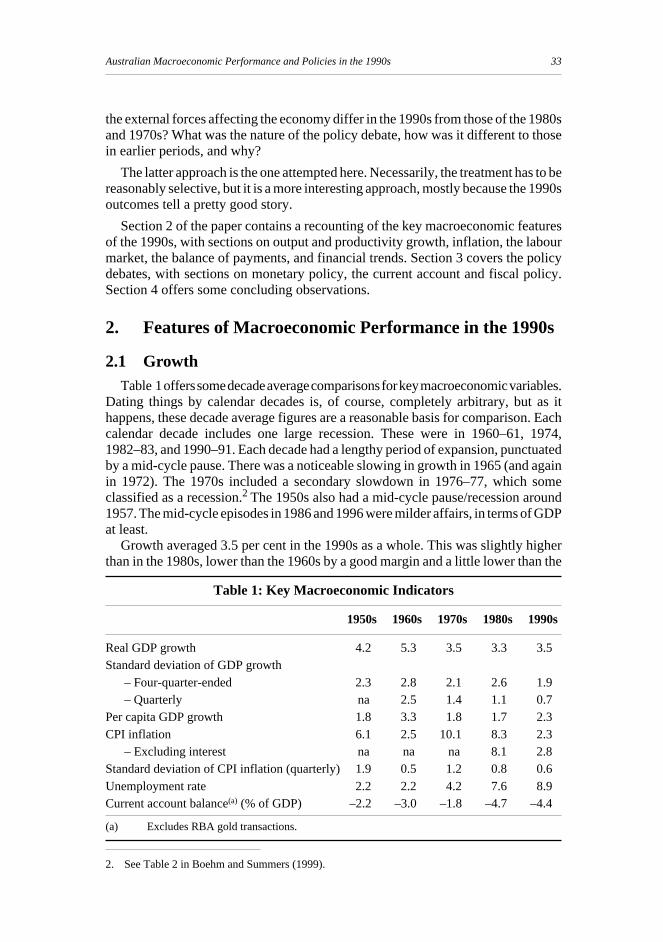
2.1 GrowthTable 1 offers some decade average comparisons for key macroeconomic variables.
Dating things by calendar decades is, of course, completely arbitrary, but as ithappens, these decade average figures are a reasonable basis for comparison. Eachcalendar decade includes one large recession. These were in 1960–61, 1974,1982–83, and 1990–91. Each decade had a lengthy period of expansion, punctuatedby a mid-cycle pause. There was a noticeable slowing in growth in 1965 (and againin 1972). The 1970s included a secondary slowdown in 1976–77, which someclassified as a recession.2 The 1950s also had a mid-cycle pause/recession around1957. The mid-cycle episodes in 1986 and 1996 were milder affairs, in terms of GDPat least.
Growth averaged 3.5 per cent in the 1990s as a whole. This was slightly higherthan in the 1980s, lower than the 1960s by a good margin and a little lower than the
Table 1: Key Macroeconomic Indicators
1950s 1960s 1970s 1980s 1990s
Real GDP growth 4.2 5.3 3.5 3.3 3.5Standard deviation of GDP growth
– Four-quarter-ended 2.3 2.8 2.1 2.6 1.9– Quarterly na 2.5 1.4 1.1 0.7
Per capita GDP growth 1.8 3.3 1.8 1.7 2.3CPI inflation 6.1 2.5 10.1 8.3 2.3
– Excluding interest na na na 8.1 2.8Standard deviation of CPI inflation (quarterly) 1.9 0.5 1.2 0.8 0.6Unemployment rate 2.2 2.2 4.2 7.6 8.9Current account balance(a) (% of GDP) –2.2 –3.0 –1.8 –4.7 –4.4
(a) Excludes RBA gold transactions.
2. See Table 2 in Boehm and Summers (1999).

34 David Gruen and Glenn Stevens
1950s. On this basis, comparing the 1990s with the 1980s, there is not much in it interms of average output growth.3 The bigger difference is in the inflation performance,to be taken up below. Before that, however, two things about growth rate a mention.
First, since population growth in the 1990s slowed, as immigration declined andbirth rates dropped, per capita growth was noticeably faster than in the 1980s. In fact,per capita GDP growth in Australia was the fastest since the 1960s, something thatAustralia shares only with Ireland among OECD countries. This reflects the quitenoticeable pick-up in productivity growth; the share of the working-age populationin work declined slightly in net terms over the decade, whereas it had risen throughthe 1980s. The acceleration in productivity growth is also taken up below.
Second, GDP growth was much less volatile in the 1990s than in any of thepreceding three decades. Table 1 shows the standard deviations of quarterly and
Figure 1: Real Gross Domestic Product1950 = 100, log scale
Note: Annual data until September 1959. Trend growth rates in each decade are shown.
2000
Per capita GDP
1.6
IndexIndex
GDP
3.3
1.8
2.1
2.7
3.9
5.4
3.3
3.6
3.9
19901980197019601950100
175
300
450
625
100
175
300
450
625
3. One issue is how such growth rates might be computed. The average growth rates in Table 1 arecomputed between the fourth quarter of 1989 and the fourth quarter of 1999, for the 1990s, withcorresponding calculations for earlier periods. An alternative is to fit a log-linear trend through thelevels, and compute the slope of the trend. Doing this yields alternative growth estimates shown inFigure 1, where the 1990s growth rate is well above the 1970s, and in per capita terms the 1990sgrowth was easily superior to performance in any post-war decade except for the 1960s.

35Australian Macroeconomic Performance and Policies in the 1990s
annual rates of GDP growth, by decade. Volatility had been declining each decade,but it fell noticeably in the 1990s, which was the only decade of the past four in whichthe standard deviation of the quarterly GDP growth rate was lower than its mean. Itis intriguing to contemplate why that occurred. Several hypotheses might beadvanced.4
One is that the weight in total output of activities which are inherently more stablehas increased. Services, for example, often thought to be relatively stable, are nowa higher share of the economy than they were, whereas agriculture, highly volatiledue to climatic events, has steadily declined in share, to be only a few per cent of GDPby the end of the 1990s. However, an examination of the data on GDP by industryreveals that the standard deviation of growth rates declined in the 1990s, as comparedwith the 1980s, in fourteen of the eighteen major categories. Among the expenditurecomponents, volatility also declined in most cases. The decline in volatility ofoverall growth does not, therefore, appear to be due only to compositional effects.
A second hypothesis, which the authors find plausible, is that the shocks hittingthe economy were smaller than they have been in the past. Such shocks could beexternal, or they could be internal, possible policy-induced. Some candidates areshown in Table 2.
Among external shocks, the most common is large shifts in the terms of trade. Thestandard deviation of the terms of trade in the 1990s is indeed considerably smaller
Table 2: Standard Deviations of Selected VariablesPer cent
1980s 1990s
US real GDP – quarterly growth 1.0 0.6World GDP – annual growth(a) 1.3 0.9Australian terms of trade 6.6 3.9Real short-term interest rates (cash rate less Treasuryunderlying inflation) 2.7 1.8(c)
Real 10-year bond rate (nominal 10-year bond lessTreasury underlying inflation) 1.6 1.2Fiscal impact (change in ratio of general government underlyingcash balance to GDP) 1.2 1.6(change in ratio of general government structural balance to GDP)(b) 1.5 1.3Real TWI 13.5 7.0Real US short-term rate (Fed funds less core inflation) 1.3 1.3
(a) Source: IMF(b) Source: OECD(c) Over the period 1993–99, the standard deviation of real short-term interest rates was 0.7.
4. One possibility is that this phenomenon reflects, in part, better measurement. If the true variance ofthe economy is constant, better measurement could reduce the degree of random error in themeasurement of growth rates, and lead to less variability in the movements between successivequarterly estimates of the level of GDP.

36 David Gruen and Glenn Stevens
than in the 1980s, and in fact smaller than in any of the three preceding decades.5 Sothis class of shock, which has historically been one of the most important factorsdriving fluctuations in the Australian economy, was a smaller source of instabilityin the 1990s.6
This may well be related to greater stability in the US economy, which also sawa decline in GDP volatility in the 1990s, as Table 2 shows. The strong correlationbetween the Australian and US GDP data – much closer than between AustralianGDP and world GDP – suggests that the smoother course of the US economy in the1990s may have been particularly important in contributing to the smootheroutcomes in Australia.7
Other shocks to be considered would be policy-induced shocks. It can be observedthat the variance of the real short-term interest rate and of the real 10-year bond ratedeclined in the 1990s. So it is apparent that monetary policy impulses have beensmaller in the 1990s. In the low-inflation period after the end of 1992, the varianceof short-term interest rates was even lower. The variance of the fiscal impact, asdefined by the change in the general government underlying cash balance, rosesomewhat in the 1990s, while the variance of the change in the OECD’s estimate ofthe structural balance fell.
One of the difficulties in drawing strong conclusions from such partial statisticsis that the various shocks interact. For example, the exchange rate moved downsharply in the mid 1980s in what, with the benefit of hindsight, appears to be aone-time shift to a lower mean. This was associated with a large decline in the termsof trade – larger than anything which occurred in the 1990s. Instability in the foreignexchange market associated with this move, compounded by the difficulties inarticulating a well-developed monetary policy framework after monetary targetinghad to be abandoned, meant that aggressive interest rate responses to exchange ratefluctuations were required on occasion. In the 1990s, policy was not faced with thesame situation. The terms of trade shocks were smaller, and the size of ‘warranted’and actual movements in the exchange rate were considerably smaller. Hence thelikelihood of complications was smaller to begin with.
At the same time, however, a more fully articulated and better understood regimefor monetary policy paid dividends in the face of shocks. During the Asian crisis, forexample, which saw a very substantial decline in the exchange rate, a macroeconomicpolicy regime which was more credible allowed monetary policy more latitude than
5. It is worth noting here that while the terms of trade swings in the 1980s are well remembered ashaving caused significant adjustment problems for the Australian economy, those in the 1970s wereconsiderably larger. Large but temporary terms of trade increases, such as in the early 1970s, bringtheir own problems, just as do declines.
6. Econometric evidence suggests that terms of trade shocks have had little impact on economicactivity in the floating rate era (Gruen and Shuetrim 1994). The exchange rate movements thataccompany them, however, can have an impact on domestic inflation, and therefore induce policyresponses which do affect activity.
7. Simon (2000) documents the decline in volatility of US growth rates, and concludes after a VARanalysis that this reflects smaller shocks in the US economy, particularly aggregate demand shocks.

37Australian Macroeconomic Performance and Policies in the 1990s
it had enjoyed during the events of the 1980s. The net result of all this is thatindividual monetary policy changes have become smaller. The 25 or occasional50 basis point movements in interest rates which have recently become the standardcurrency in monetary policy adjustments are in another league entirely from the100 or even 200 basis point movements which were common in the late 1980s andearly 1990s.
A final possible hypothesis for explaining the economy’s greater stability is theimprovements in supply structure which have occurred under the general heading of‘microeconomic reform’. These are taken up in detail in Peter Forsyth’s paper in thisvolume, but in brief things like deregulation in the financial sector, widespread tariffreductions, privatisation/corporatisation of government businesses intelecommunications, air transport, utilities, and liberalisation in labour markets havehad profound effects on the economy.
Elementary economic analysis suggests that, in themselves, the improvements insupply elasticity would be expected, for a given variance of demand disturbances,to result in more measured volatility in output (and correspondingly less in prices)than would be the case otherwise. But they would also mean that temporary demanddisturbances would elicit less aggressive responses from demand managementpolicies since they would be less likely to result in persistent inflationary pressure.So it is plausible that supply-side reforms have also contributed, indirectly, to thediminished activism of monetary policy noted above, and hence to more stableeconomic activity. It is not possible to be definitive on this without much morecomplex analysis.
2.2 ProductivityAfter the disappointing performance of the previous two decades, productivity
growth in the 1990s returned to rates last seen in the 1960s. Figure 2 shows moreprecise measures of productivity, specifically labour and multifactor productivitygrowth in the market sector of the economy since the mid 1960s. The market sector,which accounts for about two-thirds of the economy, excludes those industries forwhich output is derived directly from inputs.
Measured productivity growth varies over the business cycle, as inputs are usedmore intensively during expansions than contractions. To control for this effect, thetrend lines in the figure show the average rates of labour and multifactor productivitygrowth over economic expansions (that is, from troughs to peaks in output).8 Growthrates of both labour and multifactor productivity in the 1990s expansion are closer
8. There are some data issues that slightly complicate the analysis. The multifactor productivity datafrom the ABS are available at an annual frequency from 1964/65 to 1998/99. The labour productivitydata are available at an annual frequency from 1964/65 to the present, and at a quarterly frequencyfrom 1978:Q1 to the present. The trend lines are calculated, as closely as the data allow, from GDPtroughs to peaks. We also include a break in productivity growth in 1973/74 to allow for theworld-wide productivity slowdown at that time, even though there was no decline in Australian GDPat that time. Of course, the data begin some way into the 1960s economic expansion, and end in 1999when the expansion is continuing.

38 David Gruen and Glenn Stevens
to the rates seen in the 1960s than in the 1970s or 1980s. Estimated multifactorproductivity growth is faster in the 1990s than in the previous three decades.9
Focusing on the two most recent economic expansions, labour productivitygrowth accelerated from 1.4 to 2.9 per cent per annum. Labour productivity growth
Figure 2: Productivity in the Market Sector1998/99 = 100, log scale
Note: Trend growth rates over economic expansions are shown.
99/00
Labour productivity3.1
Index
94/9589/9084/8579/8074/7569/7064/65
Multifactorproductivity
2.1
1.4
2.9
1.6
1.0
0.9
1.8
40
60
80
100
40
60
80
100
Index
9. John Quiggin (personal communication) argues that productivity growth (particularly labourproductivity growth) in the market sector in the 1990s has been artificially boosted by the treatmentof the property and business services (PBS) sector. This sector is not part of the market sector, butmost of its output is used as input for the market sector. It has seen very strong 5.7 per cent per annumtrend growth in hours worked in the 1990s expansion, and its output is calculated assuming noproductivity growth. As there has undoubtedly been some productivity growth in this sector, inputsinto the market sector will have been understated, and market-sector productivity growth will havebeen overstated. One response to this problem is to calculate productivity growth for a broadersegment of the economy that includes the PBS sector. Doing this for the non-farm economy revealsthat labour productivity growth in the 1990s expansion was slower than for the market sector, butthe relative productivity performance in the 1970s, 1980s and 1990s expansions in the non-farmeconomy was the same as for the market sector. For the non-farm economy, the relevant numbersfor annual trend labour productivity growth are 2.0 per cent (1970s expansion), 0.8 per cent (1980s)and 2.2 per cent (1990s). Using ABS estimates for capital stock (extrapolated to the end of the 1990s)and assuming a Cobb-Douglas production function with labour hours worked and capital stock asinputs yields estimates for annual trend multifactor productivity growth in the three expansions of0.9 per cent (1970s expansion), 0.8 per cent (1980s) and 1.8 per cent (1990s) implying, as for themarket sector, that multifactor productivity growth was particularly strong in the 1990s expansion.

39Australian Macroeconomic Performance and Policies in the 1990s
in the 1980s was probably slower than it would otherwise have been because of thePrices and Incomes Accords negotiated between the trade union movement and theFederal Government at the time. Those Accords held down real wage growth, andthereby generated faster growth in employment but as a consequence labourproductivity growth was slower (Chapman 1990, Stevens 1992).
We can, in principle, abstract from this factor-substitution effect by examiningmultifactor productivity growth, which controls for different rates of growth offactor inputs. Multifactor productivity growth in the market sector accelerated from0.9 to 1.8 per cent per annum between the 1980s and 1990s expansions, suggestingthat there was a genuine pick-up in the rate of technological progress in the 1990s.10
It is of interest to see which parts of the economy account for the pick-up inproductivity growth in the 1990s. Although data for multifactor productivity byindustry sector are not available, Figure 3 shows labour productivity growth byindustry for the two most recent economic expansions. Faster labour productivitygrowth in the 1990s is a widespread phenomenon – it occurs for most of the industriesin the market sector of the Australian economy.
Interestingly, the sectors which account for the bulk of the aggregate productivitypick-up in the 1990s are not those one might have expected. The utilities (electricity,gas and water) sector experienced very rapid productivity growth in the 1990s, butno faster than the 1980s.11 The mining and communications sectors also saw rapidproductivity growth in the 1990s, but with minimal pick-up from the 1980s. Thepick-up in labour productivity growth between the two expansions appears insteadto be largely a phenomenon of the non-traded sector of the economy. The threesectors that make the largest contribution to the labour productivity pick-up –together accounting for more than 100 per cent of it despite contributing only40 per cent of hours worked in the market sector – are wholesale trade, retail tradeand construction.12
10. It is not possible to eliminate all measurement issues from the estimation of multifactor productivity(mfp). For example, the ABS currently makes no allowance for improvements in labour quality inits estimates of mfp. The experience of the US, where allowance is made, suggests however that thisrefinement would make only a small difference (see, for example, the estimates of the contributionof improved labour quality to output growth in DeLong (this volume, Table 1, p 17)). Dowrick(2000) discusses some further reasons why estimates of market-sector multifactor productivitygrowth might be biased. He also presents an econometric analysis suggesting an improvement inannual trend mfp growth in the Australian market sector of 1.4 percentage points between the period1974–1989 and the 1990s, i.e., somewhat larger than our estimate of a 0.9 percentage pointimprovement between the 1980s and 1990s expansions.
11. There was considerable structural change and deregulation in this sector, and the rapid labourproductivity growth in the 1990s is partly accounted for by job shedding, with the share of hoursworked falling from 21/2 per cent of market-sector hours in the 1980s to 11/2 per cent in the 1990s.
12. The pick-up may be overstated because at least part of the falls in measured productivity in the 1980sin these sectors is probably spurious. Falling measured labour productivity in retailing in the 1980sprobably had a lot to do with the deregulation of shopping hours at that time (Lowe 1995). This effectwould have had less impact on measured labour productivity in the 1990s because the lengtheningof retail shopping hours had largely run its course by early in the decade. In the wholesale trade and

40 David Gruen and Glenn Stevens
Overall then, labour productivity growth in the 1990s expansion appears to havebeen very strong, with the pick-up from the 1980s fairly widespread across theindustry sectors of Australian economy, but particularly strong in the non-tradedsector.
2.2.1 Is it the ‘new economy’?
How does the 1990s acceleration of productivity in Australia compare with thatin the United States? Much has been written about a ‘new economy’ in the US – theidea that the rising importance of computers, information technology, and the
Figure 3: Labour Productivity Growth in the 1980s and 1990sAnnual trend growth rates
(a) Due to data limitations, labour productivity growth in these sectors over the 1980s expansionis calculated from 1984:Q4, not 1983:Q1.
-2
0
2
4
6
8
-2
0
2
4
6
8Labour productivity growth by sector
1983:Q1 to 1990:Q2
%
-0.4
-0.2
0.0
0.2
0.4
0.6
-0.4
-0.2
0.0
0.2
0.4
0.6
%
Contribution to total labour productivity growth by sector
1991:Q2 to 1999:Q4
Agr
icul
ture
Min
ing
Man
ufac
turi
ng
Ele
ctri
city
,ga
s an
d w
ater
Con
stru
ctio
n
Who
lesa
le tr
ade
Ret
ail t
rade
Acc
omm
odat
ion,
cafe
s &
res
taur
ants
(a)
Tra
nspo
rt &
stor
age
Com
mun
icat
ion
Fina
nce
&
insu
ranc
e(a)
Cul
tura
l &
rec
serv
ices
(a)
%%
construction sectors, alternative sources of data (the Wholesale and Construction Industry Surveys)suggest some rise in labour productivity in these sectors over the 1980s, rather than the falls impliedby the data used here (which are quarterly output data from the national accounts and labour inputdata from the Labour Force Survey). These alternative sources of data are however less useful forthe 1990s. The latest published Wholesale Industry Survey is for the 1991/92 financial year. Thelatest Construction Industry Survey, for 1998/99, could be used to compare outcomes with theprevious survey for 1988/89, but the ABS cautions that the industry output data from this survey arevery imprecise. So again, the pick-up in productivity in these two industries between the economicexpansions in the two decades may be overstated.
41Australian Macroeconomic Performance and Policies in the 1990s
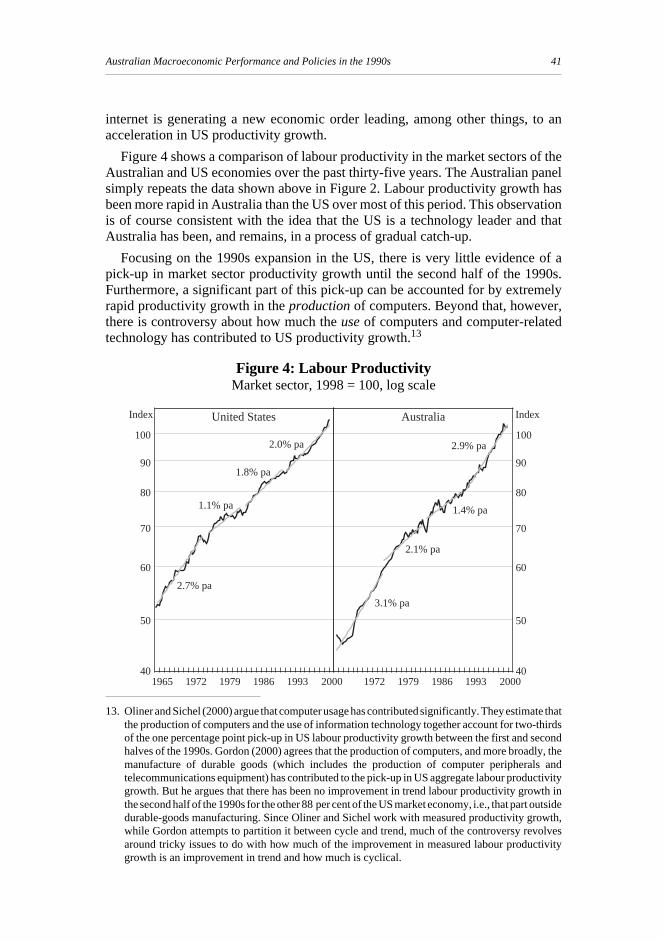
internet is generating a new economic order leading, among other things, to anacceleration in US productivity growth.
Figure 4 shows a comparison of labour productivity in the market sectors of theAustralian and US economies over the past thirty-five years. The Australian panelsimply repeats the data shown above in Figure 2. Labour productivity growth hasbeen more rapid in Australia than the US over most of this period. This observationis of course consistent with the idea that the US is a technology leader and thatAustralia has been, and remains, in a process of gradual catch-up.
Focusing on the 1990s expansion in the US, there is very little evidence of apick-up in market sector productivity growth until the second half of the 1990s.Furthermore, a significant part of this pick-up can be accounted for by extremelyrapid productivity growth in the production of computers. Beyond that, however,there is controversy about how much the use of computers and computer-relatedtechnology has contributed to US productivity growth.13
Figure 4: Labour ProductivityMarket sector, 1998 = 100, log scale
2000
United States
2.7% pa
Index IndexAustralia
1.1% pa
1.8% pa
2.0% pa
3.1% pa
2.1% pa
1.4% pa
2.9% pa
19931986197919721965 2000199319861979197240
50
60
70
80
90
100
40
50
60
70
80
90
100
13. Oliner and Sichel (2000) argue that computer usage has contributed significantly. They estimate thatthe production of computers and the use of information technology together account for two-thirdsof the one percentage point pick-up in US labour productivity growth between the first and secondhalves of the 1990s. Gordon (2000) agrees that the production of computers, and more broadly, themanufacture of durable goods (which includes the production of computer peripherals andtelecommunications equipment) has contributed to the pick-up in US aggregate labour productivitygrowth. But he argues that there has been no improvement in trend labour productivity growth inthe second half of the 1990s for the other 88 per cent of the US market economy, i.e., that part outsidedurable-goods manufacturing. Since Oliner and Sichel work with measured productivity growth,while Gordon attempts to partition it between cycle and trend, much of the controversy revolvesaround tricky issues to do with how much of the improvement in measured labour productivitygrowth is an improvement in trend and how much is cyclical.

42 David Gruen and Glenn Stevens
There are two things that are strikingly different about the 1990s productivitypick-up in Australia compared to that in the US. The first is that the Australianpick-up occurs over the whole of the 1990s expansion rather than the past four years,as in the US (Table 3). The second is that the productivity pick-up appears muchmore broadly based across the sectors of the Australian economy than it is in theUnited States.
Table 3: Labour Productivity Growth
Market sector Pick-up from Manufacturing Contribution of1980s expansion sector manufacturing to
pick-up from 1980sPer cent per annum Per cent
Australia1980s expansion 1.4 – 1.6 –1990s expansion 2.9 1.6 1.8 3Late 1990s 3.2 1.8 2.6 12United States1980s expansion 1.8 – 2.9 –1990s expansion 2.0 0.1 4.1 184Late 1990s 2.7 0.9 5.3 55
Notes: Numbers are derived by fitting trends to (log) labour productivity over the periods shown.The expansions are defined from GDP trough to peak, and therefore differ slightly betweenthe two countries. For Australia (US), the 1980s expansion is 83:Q1–90:Q2(82:Q3–90:Q2), while the 1990s expansion is 91:Q2–99:Q4 (91:Q1–99:Q4). Late 1990s(95:Q4–99:Q4) is the period identified by Gordon (2000) of faster trend labour productivitygrowth in the US market sector. Numbers differ in some cases due to rounding.
As we have seen previously in Figure 3, there has been a mild pick-up in labourproductivity growth in the Australian manufacturing sector between the 1980s and1990s expansions. But this pick-up accounts for very little of the overall pick-up inlabour productivity growth in the market sector of the Australian economy (Table 3).By contrast, much if not all of the aggregate pick-up in labour productivity growthin the US market sector between the two expansions is accounted for by the pick-upin the US manufacturing sector.
The productivity accelerations in Australia and the US in the 1990s are thereforevery different in kind. Australia produces very few computers, computer peripherals,or telecommunications equipment. In contrast to the US, therefore, productivitygrowth in Australia has been affected hardly at all by the very rapid productivitygrowth in the production of these goods. But there has been a big acceleration inproductivity across the wider Australian economy, which appears to have occurredparticularly in the non-traded sector. The 1990s Australian experience appears to beone of more rapidly approaching the technological frontier, rather than benefitingdirectly from the rapid productivity growth in the production of the component partsof the new economy.

43Australian Macroeconomic Performance and Policies in the 1990s
An important question for Australia is how much it matters to miss out on themonopoly profits that are expected to be generated in the new-economy sectors ofthe US. For one thing, it remains to be seen how large these monopoly profits willbe, before they are eroded away by new entrants. If past waves of technologicalinnovation are a guide, moreover, many of the dividends from the productivity gainsin the new economy are likely to ultimately accrue elsewhere – to other sectors ofthe US economy and to other countries. The rapid productivity growth across broadsectors of the Australian economy in the 1990s is, after all, probably an example ofthis process in action.
2.3 PricesThe 1990s marked a major break from the lamentable inflation performance of the
1970s and 1980s (Figure 5). CPI inflation peaked at around 18 per cent (and over20 per cent in underlying terms) in Australia by early 1975, after the oil shock andthe wage break-out of 1973 and 1974 – although even before this dual shock, it hadreached 10 per cent. Macroeconomic policies generally articulated a goal ofdisinflation thereafter, and successive cyclical peaks were indeed lower – about11 per cent in the early 1980s, and 9 per cent in 1985. But by the end of the 1980sinflation was still around 7 per cent, and had averaged 9 per cent over two decades.Inflation expectations remained stubbornly high.
Figure 5: Consumer Price Inflation
(a) Adjusted for the introduction of Medicare in 1984.
-5
0
5
10
15
20
25
-5
0
5
10
15
20
25
2000
% %
1995199019851980197519701965196019551950
CPI(a) Treasury underlyingrate

44 David Gruen and Glenn Stevens
As the economy slowed and then went into recession during 1990, inflation beganto fall. By the middle of 1991 it had fallen to 4 per cent. Eighteen months later, at theend of 1992, it had settled at 2 per cent in underlying terms, where it remained fora couple of years before a temporary rise in 1995 and 1996. That rise was successfullycapped and reversed by an early response from monetary policy under theinflation-targeting regime introduced in 1993. Subsequently, towards the end of the1990s, inflation ran under the target for a period.
These episodes have been treated elsewhere (Stevens 1999). What is of moreinterest here is the whole decade’s performance, where CPI inflation averaged2.3 per cent, the lowest average of any of the five post-war decades. This is a slightoverstatement of the degree of improvement since the practice between 1986 and1998 of including mortgage interest charges in the CPI meant that the downshift inthe mean inflation rate in the 1990s, because it was accompanied by a correspondingdownshift in interest rates, artificially reduced the measured rate of CPI inflationduring the period of disinflation. Even excluding interest from the CPI, however, thedecade inflation average of 2.8 per cent was much lower than in the 1970s or 1980sand comparable to the 1960s. Not only was the average inflation rate low, but thevariability of inflation and of the price level itself around its trend were also lowerthan in the preceding two decades.
This was also a feature, of course, seen in many countries around the world: globalinflation was lower and more stable in the 1990s than it had been in the precedingtwo decades. Much of this is presumably attributable to the more consistent pursuitof low inflation by policy-makers in most countries after the problems of the 1970s.Performance was also assisted, no doubt, by the fact that the large supply-side shocksin the mid and late 1970s did not recur, so that the observed transitional output costof reducing inflation was not as great as it would have been in the 1970s.14 Indeed,as we have seen in the previous section, the latter part of the 1990s was characterisedby increasing discussion of favourable supply shocks emanating from technologicaladvance, under the general (if somewhat ambitious) heading of the ‘new economy’.
This global environment of lower and less volatile inflation clearly must havebeen advantageous in achieving better outcomes in Australia. It is noteworthy,however, that the decline in average global inflation in the 1990s continued a trendwhich had begun in the 1980s, but that Australia had not shared fully in the fall ininflation in the 1980s: the average inflation rate in Australia in the 1980s was onlymarginally lower than in the 1970s. So lower global inflation, while helpful, does notnecessarily translate into lower domestic inflation. Price stability begins at home.
Many observers would be quick to point out the role of structural change in theeconomy, particularly the lift in productivity performance in the 1990s and theopening up of product and (to some extent) labour markets to competitive forces, ascontributing to sustaining low inflation. In practice, these have made the job of
14. An alternative view of the OPEC I and II episodes is that they represented a lumpy ‘catch-up’ of oilprices to persistent inflation of the general price level over a number of years. In this view, theabsence of such shocks in the 1990s would presumably reflect the general low inflation environmentitself.
45Australian Macroeconomic Performance and Policies in the 1990s
keeping inflation low easier – once it was decided that monetary policy should bedevoted clearly to that end. This still depends, however, on monetary policy pursuingthe appropriate objective. High labour productivity growth could still coincide withhigh inflation (indeed labour productivity growth in the second half of the 1970s washigher than in the 1980s, but so was inflation). It is also possible that policies whichsuccessfully keep inflation down prompt greater efforts to generate productivitygains across the economy, though admittedly the cross-country evidence is not verysupportive of this proposition.
Surely it was the more resolute pursuit in Australia of a decline in inflation, andthe determination to keep it low once it had fallen, which made the crucial difference.The use of a flexible inflation-targeting regime has been one of the success storiesof Australian economic policy of the past twenty years. It can be immediatelyacknowledged, of course, that the international trend in this direction was influentialin pushing the RBA in the direction of inflation targeting. This is discussed later inthe paper. At this point, it is sufficient to record that Australian inflation performanceimproved dramatically in the 1990s, at the same time as economic activity continuedto grow, and in a less volatile fashion at that.
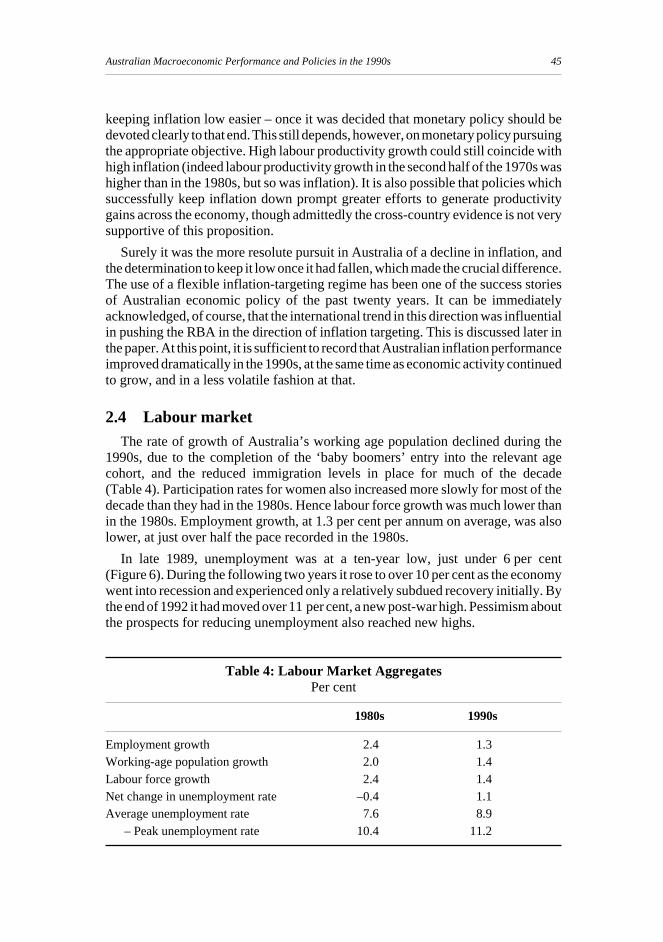
2.4 Labour marketThe rate of growth of Australia’s working age population declined during the
1990s, due to the completion of the ‘baby boomers’ entry into the relevant agecohort, and the reduced immigration levels in place for much of the decade(Table 4). Participation rates for women also increased more slowly for most of thedecade than they had in the 1980s. Hence labour force growth was much lower thanin the 1980s. Employment growth, at 1.3 per cent per annum on average, was alsolower, at just over half the pace recorded in the 1980s.
In late 1989, unemployment was at a ten-year low, just under 6 per cent(Figure 6). During the following two years it rose to over 10 per cent as the economywent into recession and experienced only a relatively subdued recovery initially. Bythe end of 1992 it had moved over 11 per cent, a new post-war high. Pessimism aboutthe prospects for reducing unemployment also reached new highs.
Table 4: Labour Market AggregatesPer cent
1980s 1990s
Employment growth 2.4 1.3Working-age population growth 2.0 1.4Labour force growth 2.4 1.4Net change in unemployment rate –0.4 1.1Average unemployment rate 7.6 8.9
– Peak unemployment rate 10.4 11.2

46 David Gruen and Glenn Stevens
However, unemployment did begin to decline in 1994. In rough parallel to theexperience of the 1980s, it fell to about 81/2 per cent by late 1995, rose slightly, thenbegan to fall again in 1997 and continued to do so until early 2000, by which timeit was around 63/4 per cent. Still, the average unemployment rate in the 1990s washigher than in the 1980s.
The 1990s demonstrated again what had been seen in the 1980s and 1970s: thatunemployment rises very quickly in periods of recession, and tends to fall muchmore slowly in recovery. A comparison with the United States is revealing. The peakUS unemployment rate in the 1980s was over 10 per cent – very similar to Australianexperience in 1983. But the peak 9 years later in mid 1992 was 7.8 per cent,compared with Australia’s at over 11 per cent. The rate of decline in unemploymentafter the early 1990s recessions in the two economies was almost identical. Evenrecognising the more flexible, and more brutal, nature of the US labour market, andleaving aside the question of whether or not the very low unemployment ratesreached in the US in the past couple of years will be sustained, one observation standsout. It is that a major part of the difference between the two experiences is simply thatthe early 1990s recession in the US was relatively shallow, and in Australia (at leastin its labour-market dimension), relatively deep. Avoiding deep downturns, even if
Figure 6: Labour Market
20000
2
4
6
8
10
0
2
4
6
8
10
%Unemployment
%
Per cent oflabour force
Per cent of working-agepopulation
19901980197019601950
Log scale
Working-agepopulation
M M
Labour force
Employment
5
9
15
5
9
15

47Australian Macroeconomic Performance and Policies in the 1990s
shallow ones cannot be avoided, appears to make a large difference to the time pathof unemployment rates. There is at least the hope that in this respect, the first decadeof the twenty-first century might turn out to be a much better one for thelabour market than the 1990s. Further issues in the labour market are taken up inPeter Dawkins’ paper in this volume.
2.5 The balance of paymentsFigure 7 and Table 5 summarise the key developments in Australia’s balance of
payments over the past five decades. Even though the 1960s and early 1970s turnedout to be a relatively benign period on average for Australia’s external accounts,there were quite large swings. The secular decline in the terms of trade is apparent,something which continued in the 1990s.
As has already been noted, however, the terms of trade were less volatile in the1990s than they had been in earlier decades. Moreover, while they were lower onaverage than in the 1980s, the extent of the decline was smaller than had to beabsorbed in the 1980s.
Figure 7: Balance of Payments
Note: Decade averages are shown for the terms of trade and current account balance.
2000
Terms of trade1997/98 = 100
1951/52 – 14.3%
Index
-9
-6
-3
0
3
-9
-6
-3
0
3
100
130
160
100
130
160
Index
Per centof GDP
Current account balance
128.7
115.4 112.8
100.5
97.5
-2.1
-3.0
-1.8
-4.7 -4.4
19901980197019601950
Trade and current account balance
Balance on goods andservices
1950/51 – 199.2
Per centof GDP

48 David Gruen and Glenn Stevens
The figure also shows the trade and current account balances. On the back of verystrong growth in export volumes, the trade deficit declined significantly on averagein the 1990s. The average rate of growth of export volumes in the 1990s was thehighest of any post-war decade. Growth in manufactures and services outpaced thatof the more traditional resource and rural products (although this was also true in the1980s). The Asian crisis, together with the ensuing decline in global growth and asmall fall in the terms of trade, resulted in a loss of export income equivalent to2–3 per cent of a year’s GDP. As of the time of writing, it was apparent that a strongrecovery in exports was under way. Whether this will be sufficient to make up theearlier loss, restoring the trade balance to its earlier trend, remains to be seen.
The current account deficit averaged around 41/2 per cent of GDP in the 1990s,much the same as its 1980s outcome.15 Cyclical fluctuations have been of the sameorder of magnitude across the two decades, with about 3 and 6 per cent of GDP
15. Edey and Gower (this volume) present inflation-adjusted estimates of the current account balancein their Table 1. Their estimates, 3.8 per cent of GDP in the 1980s and 3.2 per cent in the 1990s,suggest quite a significant fall in the inflation-adjusted current account deficit to GDP ratio betweenthe two decades. These inflation-adjusted numbers are calculated using ABS estimates of thecurrency denomination of Australia’s net external debt. It seems clear, however, that a significantportion of the foreign-currency-denominated part of this debt is hedged, in a way that cannot becaptured in the official statistics. That portion is then effectively A$-denominated, which affects theappropriate inflation adjustment. If, as seems plausible, much of the foreign-currency-denominatedportion is hedged, the inflation-adjusted current account deficit to GDP ratios are roughly the samein the two decades (Luke Gower, personal communication).
Table 5: Balance of Payment AggregatesAverage annual growth rates, per cent
1970s 1980s 1990s
Exports of goods and services 5.3 4.1 8.1– Resources na 5.7 6.7– Rural na –2.4 7.0– Manufactured na 8.9 12.2– Services 4.5 6.3 7.8
Imports of goods and services 3.3 6.6 6.5– Consumption na na 7.4– Capital na na 10.1– Intermediate and other (a) na na 7.0– Services 3.6 6.5 2.2
Balance of trade (a) (b) 0.0 –2.1 –0.9Current account (a) (b) –1.8 –4.7 –4.4
(a) Excludes RBA gold transactions.(b) Per cent of GDP: average for decade.

49Australian Macroeconomic Performance and Policies in the 1990s
defining the lows and highs. The capital flows which were the counterpart of thecurrent account deficit changed in nature in the 1990s, with much more in the wayof equity inflows, and less in the form of debt flows. At times in the 1980s, in contrast,debt flows had more than funded the current account deficit, with net equity outflowsbeing observed. The occurrence of the Asian crisis did not appear to affect adverselyAustralia’s access to international capital markets, and capital flows actuallyincreased at that time (not without a decline in the exchange rate of course), withAustralia apparently having some ‘safe haven’ status despite the expected effect onexports.
Few observers in 1980 would have considered it likely that a current accountdeficit of 41/2 per cent of GDP could be sustained for two decades. The fact that it hasbeen – admittedly not without some exciting moments – has itself changed thenature of debate about the current account. That debate is taken up in some detailbelow.
2.6 FinanceA feature of the 1990s was the way in which the older discussion of monetary and
credit aggregates waned. Milbourne’s paper for the predecessor to this conferencein 1990 contained extensive discussion of the financial aggregates. Much of theRBA’s published work in the mid and late 1980s focused on the aggregates, as evenafter the demise of monetary targeting there was a need to demonstrate rigorouslythe case that the demand for money had become unstable.16 Around the turn of thedecade, there was much attention on credit and the linkage to asset prices, and on therole of these dynamics in exacerbating the cyclical downturn in 1990. But by the mid1990s, with the clearer focus on inflation targeting, and the restructuring of corporatebalance sheets well advanced, attention on the aggregates tended to wane.
There were, however, some important financial developments in the 1990s. Thebalance sheet of the household sector, in particular, changed dramatically in size andcomposition.
The change in size is illustrated in Table 6 and Figure 8, which show the ratio ofgross household wealth to annual disposable income for the household sector.17 Formany years, this ratio was about four. By the end of the 1990s it had risen to almostseven. Similar trends are observable in the United States and the United Kingdom.Household debt burdens also rose sharply in the 1990s, from levels which (relativeto income) were well below those in comparable countries, to levels which weremuch more in the middle of the international pack.
16. See, for example, Stevens, Thorp and Anderson (1987), Blundell-Wignall and Thorp (1987), andthe papers in Macfarlane and Stevens (1989).
17. RBA estimates of household wealth based on financial accounts and value of household dwellings(sources: ABS, CBA/HIA Housing Report, RBA); household disposable income from nationalaccounts, no exclusions; household debt from RBA measure; consumption from national accounts,includes consumption of fixed capital.

50 David Gruen and Glenn Stevens
Table 6: Household WealthPer cent, as at December
1979 1989 1999
Gross wealth % of income 362 487 683Proportion of:
– Dwellings 62 60 60– Financial 29 34 36of which:
– Equities(a) 5 10 18– Currency and deposits 14 12 9
– Other financial 9 12 9
– Other 9 7 4
(a) Includes equity held in life and superannuation funds.Source: ABS Cat No 5232.0; CBA/HIA; RBA staff estimates
Figure 8: Household Wealth
70
80
90
10
20
30
2000
Wealth
Debt to income
%
100
200
300
400
500
600
100
200
300
400
500
600
%
% %Consumption
Gross wealth to income
Consumption to gross wealth(RHS)
Consumption to income(LHS)
199019801970
51Australian Macroeconomic Performance and Policies in the 1990s
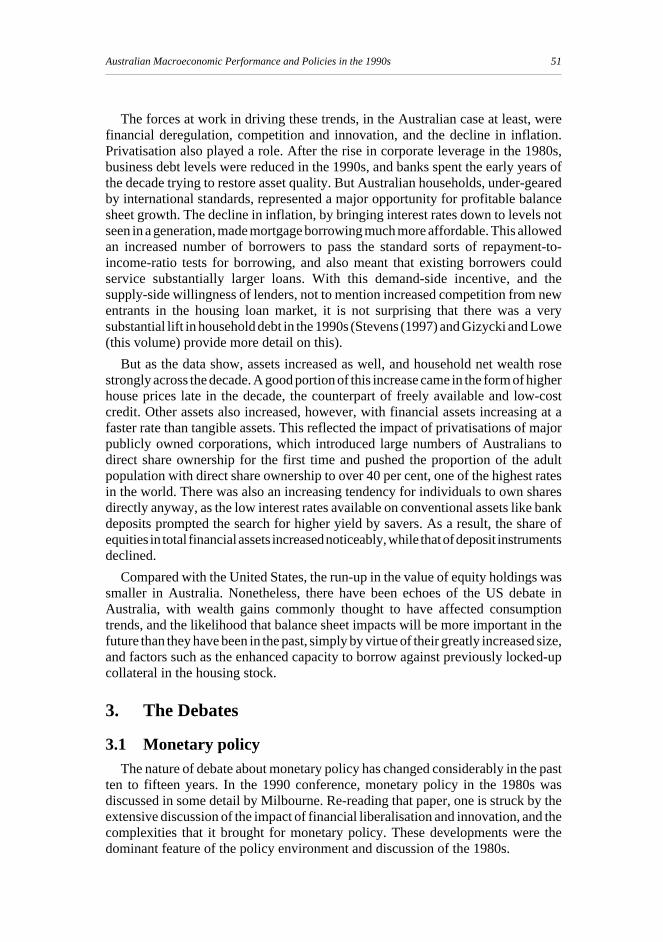
The forces at work in driving these trends, in the Australian case at least, werefinancial deregulation, competition and innovation, and the decline in inflation.Privatisation also played a role. After the rise in corporate leverage in the 1980s,business debt levels were reduced in the 1990s, and banks spent the early years ofthe decade trying to restore asset quality. But Australian households, under-gearedby international standards, represented a major opportunity for profitable balancesheet growth. The decline in inflation, by bringing interest rates down to levels notseen in a generation, made mortgage borrowing much more affordable. This allowedan increased number of borrowers to pass the standard sorts of repayment-to-income-ratio tests for borrowing, and also meant that existing borrowers couldservice substantially larger loans. With this demand-side incentive, and thesupply-side willingness of lenders, not to mention increased competition from newentrants in the housing loan market, it is not surprising that there was a verysubstantial lift in household debt in the 1990s (Stevens (1997) and Gizycki and Lowe(this volume) provide more detail on this).
But as the data show, assets increased as well, and household net wealth rosestrongly across the decade. A good portion of this increase came in the form of higherhouse prices late in the decade, the counterpart of freely available and low-costcredit. Other assets also increased, however, with financial assets increasing at afaster rate than tangible assets. This reflected the impact of privatisations of majorpublicly owned corporations, which introduced large numbers of Australians todirect share ownership for the first time and pushed the proportion of the adultpopulation with direct share ownership to over 40 per cent, one of the highest ratesin the world. There was also an increasing tendency for individuals to own sharesdirectly anyway, as the low interest rates available on conventional assets like bankdeposits prompted the search for higher yield by savers. As a result, the share ofequities in total financial assets increased noticeably, while that of deposit instrumentsdeclined.
Compared with the United States, the run-up in the value of equity holdings wassmaller in Australia. Nonetheless, there have been echoes of the US debate inAustralia, with wealth gains commonly thought to have affected consumptiontrends, and the likelihood that balance sheet impacts will be more important in thefuture than they have been in the past, simply by virtue of their greatly increased size,and factors such as the enhanced capacity to borrow against previously locked-upcollateral in the housing stock.
3. The Debates
3.1 Monetary policyThe nature of debate about monetary policy has changed considerably in the past
ten to fifteen years. In the 1990 conference, monetary policy in the 1980s wasdiscussed in some detail by Milbourne. Re-reading that paper, one is struck by theextensive discussion of the impact of financial liberalisation and innovation, and thecomplexities that it brought for monetary policy. These developments were thedominant feature of the policy environment and discussion of the 1980s.

52 David Gruen and Glenn Stevens
The prevailing monetary policy framework in operation in the first half of the1980s was that of monetary targeting, which had been in place since 1976. Theregulation of interest rates and exchange rates in the 1970s and early 1980s meant,however, that the stock of money could not be adequately controlled. It was drivenby the vagaries of capital flows, and administrative decisions on interest rates ongovernment securities. These at times made it impossible to keep financial conditionswhere they needed to be to achieve monetary policy goals.
Deregulation of the key financial prices – interest rates on government debt, andthe exchange rate – in the 1980s gave the Reserve Bank the capacity to control thecash market much more effectively. But the extensive liberalisation agenda also ledto large changes in the behaviour of financial institutions, which were now freed ofmany of the old administrative restraints, and were also facing increased competitionfrom new entrants. There was also a change in the behaviour of the non-financialprivate sector, particularly the corporate sector, whose appetite for leverage increaseddramatically. This inevitably meant large shifts in the relationships between thefinancial aggregates and the economy. Hence even as the RBA finally gainedeffective instruments, the strategy of targeting M3 broke down.
At the same time, a floating exchange rate came with its own issues. In early 1985,having just abandoned the M3 target in the face of the shifting financial relationships,monetary policy was confronted with a crisis of confidence in the Australian dollar,something which recurred periodically for some time. The Australian FinancialReview’s 9 April 1985 headline, ‘Australia’s Monetary Policy Confusion’, givessomething of the flavour of the times.
It is no surprise, therefore, that there was much discussion in the second half ofthe 1980s and the first few years of the 1990s about the impact of deregulation, thestruggle of the monetary authorities to cope with it, and the possible alternativestrategies which might be employed in response to it. Coming to terms with a floatingexchange rate in particular, which could at times be subject to very large movements,required adjustments both by the authorities and by those involved in economicactivities which were exposed to the outside world.
This was a period of transition from the idea that monetary policy proceeded bydirectly controlling some sort of quantity, with financial prices endogenous, to thenotion that it proceeded by using the short-term interest rate as the instrument, withthe financial quantities endogenous in the short to medium term (see Grenville (1997)).This appeared to take longer to be accepted in mainstream Australian discussion thanit apparently did in most other places. Admittedly, it was not until the late 1980s thatthe Reserve Bank clearly articulated this view of the process (Macfarlane andStevens 1989, Grenville 1990).
At the same time, there was a tension in the 1980s between two ideas. The first,based on the main insight of two centuries of monetary economics, was thatmonetary policy ultimately determined inflation. The quantity-theory version of thisview had been the intellectual underpinning of monetary targeting. The other was thelong-standing tradition in Australian economic policy-making and many academiccircles that wages outcomes were the proximate determinant of prices, and that

53Australian Macroeconomic Performance and Policies in the 1990s
wages could be influenced independently of monetary policy. Australia’s industrialrelations arrangements contributed to this view, and economists trained in the 1970slearned of the ‘four arms’ of economic policy, of which wages policy was one.(Exchange rate policy, at the time of the fixed exchange rate, was another.)
Even among those inclined to be critical of monetary policy for being too lax orinconsistent, this view was often central. In the issue of the AFR which carried the‘confusion’ banner quoted above, the editorial lamented at length the course of theAustralian dollar and the failures of monetary and fiscal policies. It then concludedby saying that ‘… in the end, the key is wages policy’.
This tension is evident in Milbourne’s 1990 paper, and it is notable that in thatsame conference, there was an entirely separate paper (Carmichael 1990) oninflation. ‘Money and finance’ were often discussed quite separately from inflationoutcomes. Carmichael offers a reconciliation between the ‘money’ view of inflationand the ‘wages’ view, in which monetary policy accommodates the inflationstemming from wage outcomes. In this view of the world, the wages Accords of the1980s, at the heart of the Hawke Government’s economic strategy, determined therate of wage and price expectations. Actual inflation could be made to differ fromthis by monetary policy, but only by having substantial impacts on output, monetarypolicy not having any independent capacity to affect expectations (and not beinginvited to attempt it).
In the 1990s, this view of the world gradually gave way to one in which inflationwas seen as the specific responsibility of monetary policy. This reflected partly theglobal intellectual shift towards inflation targeting, but also the shift in wagespolicies towards microeconomic, rather than macroeconomic goals, and the reducedemphasis on centralised wage setting. The extent of the contrast with the mid-1980sview of the world can perhaps be seen most clearly in the outcome of the 1997 SafetyNet Review, conducted by the Australian Industrial Relations Commission. Theprospect that monetary policy would respond to large wage increases whichthreatened inflation performance appears to have had a major impact on thedecision.18
In the wake of the early 1990s recession, the debate about monetary policy becameeven more intense. Recessions tend to cause reconsideration of all manner ofpolicies. The theme of deregulation and its effects continued through this discussion,since the distinguishing feature of the late 1980s boom and subsequent slump wasthe role of asset prices, accommodated by rapid credit expansion by newly-liberatedintermediaries, despite exceptionally high real interest rates almost all the time in thesecond half of the 1980s (see Macfarlane (1989), (1990)). That discussion did notturn back deregulation, but did result in much more attention being given toprudential supervision in the 1990s (see Gizycki and Lowe (this volume) for moredetails on this).
18. The decision included the following: ‘we have noted the Reserve Bank’s intimations of the orderof increase which, in its view, accords with its inflation target. Any increase greater than the amountwhich we grant carries a risk, in our view, of leading to a rise in interest rates. In the current stateof the economy, with a high and seemingly stationary unemployment rate and an inadequate growthrate, we are unwilling to take that risk’ (Australian Industrial Relations Commission 1997, p 50).

54 David Gruen and Glenn Stevens
The discussion in this period widened, however, beyond the quasi-technical issueof the effects of deregulation, to focus on the overall framework of monetary policy,including issues of the appropriateness of multiple objectives, the structure andgovernance of the Reserve Bank, and its independence. Many criticisms in thisperiod appear to have been motivated by a genuine frustration with perceivedfailures of policy, particularly as regards inflation control, over a long period. Thesecritics were not convinced that the decline in inflation which accompanied therecession could be sustained without far-reaching reform of the Bank. Somecommentators remained suspicious that monetary policy had not really pursued ananti-inflation strategy at all in the late 1980s and early 1990s, and had paid too muchattention to the balance of payments, to the detriment of more appropriate domesticgoals (an issue we return to in the next section).
Hence there was great debate in academic circles. A whole issue of the AustralianEconomic Review was devoted in 1990 (Creedy 1990) to publishing papers from aconference on monetary policy. Among a range of reasonably conventional papers,monetary-base targeting was advocated by McTaggart and Rogers (1990), on thegrounds that this would lessen an apparent (and in their view inappropriate) positiverelationship between the money stock and the terms of trade. Monetary-basetargeting was an idea with a very respectable pedigree amongst academic economists,but was actually practised at that time only by the Swiss National Bank (which hasin recent years adopted an inflation target instead). Hence in Australia it has tendedto be regarded as rather radical. But in another conference, with the less thaneven-handed title ‘Can Monetary Policy be Made to Work?’, organised by theInstitute for Public Affairs in December 1991 (Moore 1992), monetary-basetargeting was one of the least extreme proposals on offer. The more adventurousones included a currency board (modelled on a program being developed for Albaniaby, inter alia, Steve Hanke (Hanke, Porter and Schuler 1992)), and free banking –no central bank, but competitive moneys offered by private banks (presumablyincluding the same ones which had made the disastrous corporate loans of the1980s). Edey (1997) discusses these ideas in more detail. They never gained serioussupport, but the fact that they were raised in respectable circles at all only nine yearsago seems remarkable now.
In political and policy-making circles, more attention began to be given to themodel which combined an inflation target and clear central bank independence. InNew Zealand, the Reserve Bank was undergoing very substantial changes to itsstructure and mandate. Both there and in Canada, the idea of an explicit, numericalinflation target took shape, and was implemented. The goal was set by the government,but with the central bank given complete operational independence in pursuit of thatagreed goal. Such regimes were producing declines in inflation in those countries –though admittedly inflation was declining almost everywhere else as well. Inflationtargeting became more appealing through the 1990s, as a number of countries oneby one found the alternative anchors, and the prospect of completely unconstraineddiscretion, unsatisfactory.
In Australia in the early 1990s, inflation was also falling rapidly, a result ofdetermined application of monetary policy. But inflation had also fallen in the early

55Australian Macroeconomic Performance and Policies in the 1990s
1980s, only to rise again, so the question was whether the decline could be sustained.In the minds of many sceptics, the result was an accidental by-product of policiesreally directed at other goals. In the event, inflation continued to fall and remainedlow, and without any change to the RBA’s charter or structure. There was, however,a gradual shift towards an inflation-targeting model. This began in March 1993when Bernie Fraser as Governor gave a speech within which the outlines of the‘2–3 per cent over the course of the cycle’ inflation target can be seen (Fraser 1993).As time went by, the target was progressively firmed up, endorsed by Treasurer Willisand then endorsed much more explicitly by the present Government. The targetformulation was of the Bank’s choosing to start with, and therefore it gave someweight to the reservations about the apparent narrowness of the other models on offerat the time. This was initially at the cost that it took longer to build credibility for theregime, but had the benefit of conferring an appropriate degree of flexibility.Stevens (1999) gives an account of Australian experience with inflation targeting.As argued earlier in this paper, the stronger anti-inflation focus from the late 1980s,developing into the inflation-targeting framework since 1993, has made an importantdifference to the inflation performance, and a tangible difference to economicperformance more generally.
Issues of independence of the RBA also came to the fore in the 1990s, especiallyas the conduct of monetary policy became hotly contested in the political arenabetween 1990 and 1993. The importance of the principle of independence was neverin dispute; what was at issue was how independent the RBA had been in practice.Proposals for changing the charter to a sole focus on inflation, and strengthening theBoard’s independence emerged from various quarters. These issues are taken up atsome length in Macfarlane (1998). As it turns out, the structure and governance ofthe Bank remains unchanged, from the time of its inception in 1960. The degree offormal independence has not changed, although the extent of the perception ofindependence has increased greatly.
There was still a measure of debate about monetary policy at the end of the 1990s,but its nature was completely different to that of ten years earlier. The focus was nolonger on deregulation, and its effects on money and credit, against a backdrop of thecentrality of wages policy in thinking about the inflation outlook. Nor were the roleof monetary policy in controlling (or not) the current account, or the Bank’s bonafides on inflation any longer hotly contested issues. The more extreme ideas whichintruded to an unusual extent in the early 1990s had lost force.
The more recent discussions have been conducted on the assumption thatmonetary policy is and should be set within an inflation-targeting framework, thatthe Bank is independent of the Government in adjusting interest rates in pursuit ofthe target, and that interest rates are the instrument of policy. Critics of monetarypolicy in recent times tend mostly to have made a different judgment to the Bank’son the necessity of a policy adjustment. To be sure, some debate still continues aboutthe amount of detailed information (such as forecasts, Board minutes etc) the Bankshould or should not release, and there is the occasional foray into governance issues.But no mainstream commentators appear to be saying that the whole framework isinadequate and needs replacement, or that the Bank’s decisions are politically

56 David Gruen and Glenn Stevens
motivated. This seems a long way from the debates of ten years ago. Of course,should there be unexpected turbulence for the economy at some future time, thingsmay well change.
3.2 The current account and foreign debt
3.2.1 The 1980s: rising concerns
One of the enduring features of the economic landscape over the past fifteen yearshas been the debate about the current account deficit and the growth of Australia’sforeign debt. In this section, we discuss this debate and offer some reflections on howit evolved in the 1990s. We begin however with the 1980s, the decade in which theforeign debt debate took shape.
One of the early warnings that the debt build-up might have serious implicationswas issued by the then Head of the Department of Treasury, John Stone, in his 1984Shann Memorial Lecture ‘1929 and All That …’. Stone used the lecture to compareAustralia’s predicament at the time with the predicament discussed by Shann in theyears leading up to the Great Depression. While Stone’s remarks might have been
Figure 9: Australia’s Foreign Liabilities
2000
Net debt servicing payments
Per cent of GDP
As a per cent ofexports(RHS)
%
0
10
20
30
40
50
60
0
10
20
30
40
50
60
0
10
20
30
40
50
60
0
10
20
30
40
50
60
1
2
3
4
5
10
15
20
1
2
3
4
5
10
15
20
%
% %Net foreign liabilities
As a per cent ofGDP(LHS)
Total
Debt
Equity
1995199019851980

57Australian Macroeconomic Performance and Policies in the 1990s
thought to be unduly alarmist at the time, the debt debate did grow in intensity overthe next few years as events conspired to convince many observers that theimplications of the debt build-up might indeed be serious. Over eighteen monthsfrom the beginning of 1985, the terms of trade fell significantly, and the currencydepreciated by 40 per cent in trade-weighted terms. The current account deficit,which had averaged 41/4 per cent of GDP over the first half of the 1980s, widened to51/2 per cent in 1985 and 53/4 per cent in 1986. With the deficit financed primarily byborrowings rather than equity, the stock of foreign debt and debt servicing ratios rosesharply (see Figure 9).
Worsening assessments of Australia’s credit worthiness by the two maininternational credit rating agencies, Moody’s and Standard and Poor’s, added to thegeneral level of concern. Australian Commonwealth Government debt had longbeen rated AAA by both organisations. Between September 1986 and October 1989,however, both agencies twice lowered the long-term foreign-currency debt of theCommonwealth Government, to Aa2 and AA.
According to some, Australia risked becoming a ‘banana republic’, a phrase madefamous in the Australian context in an impromptu interview on commercial radio bythe then Treasurer, Paul Keating, in May 1986. From around that time to the end ofthe 1980s and into the 1990s, there was a broad consensus – encompassing the wholepolitical spectrum, and shared by policy-makers, economic commentators, businessleaders, and the wider community – that the current account deficit and the growingstock of foreign debt represented the most serious economic problem facingAustralia.19 Reports were written by a range of organisations, diagnosing theproblem, and suggesting solutions.20
Given the perceived seriousness of the foreign-debt problem, there was also abroad consensus that all arms of economic policy needed to play a role in respondingto it. In a renegotiated Prices and Incomes Accord with the trade union movement,award-based superannuation was introduced to contribute to private saving, and a2 per cent fall in centrally determined real wages was agreed to reduce theinflationary implications of the exchange rate depreciation. Fiscal policy wastightened progressively, with the general government underlying balance moving
19. Newspaper headlines from the time give a feeling of the level of concern: ‘Fall in Productivity LeadsEconomy to the Edge of Debt Quagmire’ (Sun-Herald, 20 November 1988), ‘Scary Arithmetic inour Debt Figures’ (The Sydney Morning Herald, 17 July 1989), ‘Australia’s debt hovering on thecliff-face of crisis’ (The Australian Financial Review, 21 September 1989); and ‘Australia Slidinginto Debt Trap Says Bank’ (The Age, 20 November 1989). Less apocalyptic prognostications werealso reported, but tended not to capture the headlines. For example, Westpac pointed out that‘contrary to the Cassandras, Australia was not on the brink of financial disaster and could expect toreap the benefits in 1990 from the strong growth in business investment of the past few years’(The Australian Financial Review, 27 December 1989).
20. Perhaps the most dramatic of these was a booklet issued in November 1989 by Macquarie Bank,entitled A Boiling Frog: Australia’s Economic Challenge. This booklet argued that Australia’sproblem with its foreign debt could be likened to that of a frog immersed in water that was initiallycold but was gradually being heated. Failing to realise the impending danger, the frog is eventuallyboiled.
58 David Gruen and Glenn Stevens
from a deficit of 31/2 per cent of GDP in 1983/84 to a surplus of over 1 per cent bythe end of the decade in 1989/90.21 There was also a widely held view that tightermonetary policy was part of the appropriate response to the external imbalance.22
Towards the end of the decade, however, the idea that large current accountdeficits and the associated build-up of foreign debt were matters of concern thatrequired a public policy response faced an intellectual challenge. In the Australiancontext, the challenge was mounted primarily by John Pitchford (1989a, 1989b,1990) and subsequently Max Corden (1991). Pitchford and Corden began with theaccounting identity linking the current account deficit to the excess of investmentover saving in the private and public sectors. Private-sector investment and savingdecisions, it was argued, were made by consenting adults, who would either reap thebenefits or incur the costs of those decisions. Public-sector decisions, and theresulting fiscal balance, should be judged on their own merits, rather than in termsof their influence on the current account. If large deficits were a symptom ofdistortions in the economy, the distortions should be tackled at their source, ratherthan providing an excuse to use monetary or fiscal policy to influence them. Thereshould be no presumption that large current account deficits were either good or bad.
When these ideas were first presented, they were treated as academic, in thepejorative sense of the word.23 But they gradually became more influential.Although many commentators continued to disagree with the policy implications ofthe consenting-adults view, the debate was increasingly conducted in the terms inwhich it had been set out by Pitchford and Corden.
3.2.2 The 1990s: the dog that didn’t bite
Concern about the current account and Australia’s foreign debt probably reacheda peak at the beginning of the new decade. At times during the 1990s – especiallywhen the deficit was rising as a proportion of GDP – the debate was again intense,but there were gradual shifts of view and refinements of argument.
An important early shift was in the analysis of the appropriate role of monetarypolicy. As previously discussed, Pitchford (and later Corden) had challenged the
21. We discuss fiscal policy in more detail in the next section of the paper. For further discussion ofsuperannuation, see Edey and Gower (this volume).
22. Judging by its public statements, the Reserve Bank shared this view at the time. In its 1988 AnnualReport, the Bank argued (p 8): ‘Australia’s external imbalance and the high level of external debtwere major issues for general economic policy throughout 1987/88. It was of some concern,therefore, that strong domestic demand boosted imports over the year. Also, in the second half ofthe year, earnings and prices appeared to be growing uncomfortably quickly, threatening thedownward course of inflation and the improving trend in the balance of payments. The tighteningof monetary policy in the second half of the year was in response to those developments’. The Bank’slater views on the subject will be discussed shortly.
23. For example, no-one from the consenting-adults school was invited to the high-profile NationalSummit on [Foreign] Debt convened in early 1990 by the Business Council of Australia, andattended by over 300 leading businesspeople. In the background report prepared for the Summit byAccess Economics (1990), the consenting-adults view was discussed, and dismissed.

59Australian Macroeconomic Performance and Policies in the 1990s
view that had been broadly held in the late 1980s that monetary policy (along withother policies) should be tightened in response to the external imbalance. Around theturn of the decade, the Reserve Bank publicly acknowledged the intellectual forceof this challenge (although not the wider implications of the consenting-adultsview). In the Bank’s 1989 Annual Report and in two speeches delivered inSeptember 1989 and June 1990 by the then Deputy Governor John Phillips, it wasargued that monetary policy’s appropriate role was to establish low inflation, andthat any structural imbalance in the balance of payments was a result of the‘community’s attitudes to savings, consumption, investment and debt’ (Phillips1989, 1990). As such, it was not a problem that could be ‘targeted directly bymonetary policy’. This position generated considerable controversy on the secondoccasion on which Phillips presented it (though curiously, not on the first) but in timeit became more generally accepted.24
By the early 1990s, there had been ample opportunity for anyone so inclined tocome to an informed view about the foreign debt build-up. Those who wereconcerned about the build-up argued that with no significant fall in the currentaccount deficit, the rising debt burden would generate rising vulnerability to thepossibility of a loss of confidence by foreign investors. They pointed to an apparentrise in the risk premium on Australian assets such as 10-year government bonds andthe downgrades by credit-rating agencies to argue that foreign investors werebecoming increasingly concerned. Some also argued that the current account wasimposing a constraint on the rate at which the Australian economy could grow, orwould be allowed to grow.25
As it turned out, economic outcomes over the remainder of the 1990s were muchmore favourable than might have been expected, especially by those who were mostconcerned about the debt build-up. From the trough of the recession in 1991:Q2 tothe end of the decade, annual output growth averaged just over 4 per cent, with littlesustained change in the current account deficit. If the external accounts wereimposing a constraint on growth, it was not a very severe one.
Furthermore, necessary adjustments were taking place in the economy. The realexchange rate in the 1990s was more than 10 per cent lower in trade-weighted terms
24. The day after Phillips’ June 1990 speech, The Australian Financial Review reported his argumentsin its lead front-page story under the headline ‘Reserve [Bank] seeks shift in gov[ernmen]t strategy’.It was clear from reactions to the speech that the arguments put by Phillips were indeed contentiousat the time.
25. Two examples give a flavour of this last argument. ‘In practice we are muddling into using loweconomic growth as a technique for ‘coping’ with Australia’s current account problems – eventhough it is widely conceded that this is an inefficient solution to the problem.’ (Gruen andGrattan 1993, p 174–175). ‘Increasing dependence on foreign savings, as reflected in growing netforeign liabilities, … place[s] an external “speed limit” on the pace at which economic growth canbe sustained’ (Budget Statements 1996, p 1-9). In a related argument, Andersen and Gruen (1995)argued that rising external liabilities/GDP would require gradual real depreciation, which in turnwould require domestic costs to rise more slowly than aggregate (traded and non-traded goods)domestic prices. To generate the required restraint in domestic costs would require a lower level ofdomestic output than would otherwise be the case, although output growth would not be affected.

60 David Gruen and Glenn Stevens
than it had been in the 1980s, and this was generating a transfer of resources into thetraded sector. Exports of goods and services over the 1990s grew at more than twicethe rate of economic output, and in contrast to the 1980s, significantly faster thanimports (see Table 5).
There was also a sharp turnaround in the method of financing the current account.Debt financing had dominated the 1980s, but this was largely replaced by equityfinancing in the 1990s. As a consequence, although the ratio of net external liabilitiesto GDP continued to rise through the 1990s, the net external debt ratio did not; itremained at about 40 per cent of GDP from 1992 to the end of the decade (seeFigure 9). This no doubt reduced the vulnerability of the domestic economy toexternal shocks, since the cost of servicing equity investments tends to vary withdomestic profitability, and so more closely reflects the economy’s capacity to pay.
After the two downgrades by both Moody’s and Standard and Poor’s in the late1980s, there were no further downgrades of Australian Commonwealth Governmentdebt by either agency. Indeed, there was an upgrade by Standard and Poor’s in May1999 to AA+. Perhaps more importantly, however, it became increasingly clear howlittle information was revealed about a country’s vulnerability to possible futurechanges in foreign-investor sentiment by its credit rating.26
Nevertheless, while credit downgrades might not provide much informationabout future vulnerability, they might be associated with a higher cost of borrowingin international capital markets. As previously mentioned, many commentatorsargued that Australia was being forced to pay a sizeable risk premium on borrowingsas a result of the debt build-up. For example, FitzGerald (1993), in his report to thegovernment on national saving, provides estimates of the real interest differentialbetween 10-year bonds in Australia and in the G3 countries, United States, Germanyand Japan, which certainly suggest a sizeable risk premium on Australian long-termbonds in the few years leading up to the end of his sample in 1992.
Figure 10 shows an updated version of the figure presented by FitzGerald (p 13)in support of this argument.27 With the benefit of an extra seven years of data, a ratherdifferent conclusion emerges. Although Japan is an outlier (presumably for domesticJapanese reasons) it is much less clear that Australia has been paying a sizeable riskpremium as a consequence of the external debt build-up. By the end of the 1990s, thereal yield on A$-denominated bonds was roughly the same as those on German andUS bonds. A more natural explanation for the relatively high Australian real bond
26. Downgrades have almost always been a sign of current or past difficulties, rather than increasedfuture vulnerability. For example, the countries most affected by the Asian financial crisis(Thailand, Malaysia, Indonesia and Korea) received either steady or gradually improving creditratings from Moody’s in the years leading up to the 1997–98 crisis. After the crisis was upon them,however, their credit ratings dropped sharply.
27. FitzGerald used the past year’s change in OECD private consumption deflators to deflate nominalbond yields. We use the past year’s core consumer price inflation because it is a more commonlyused measure. This change makes minimal difference to the results. FitzGerald also registered therelevant caveat that past inflation may be only an imperfect measure of expected future inflation.
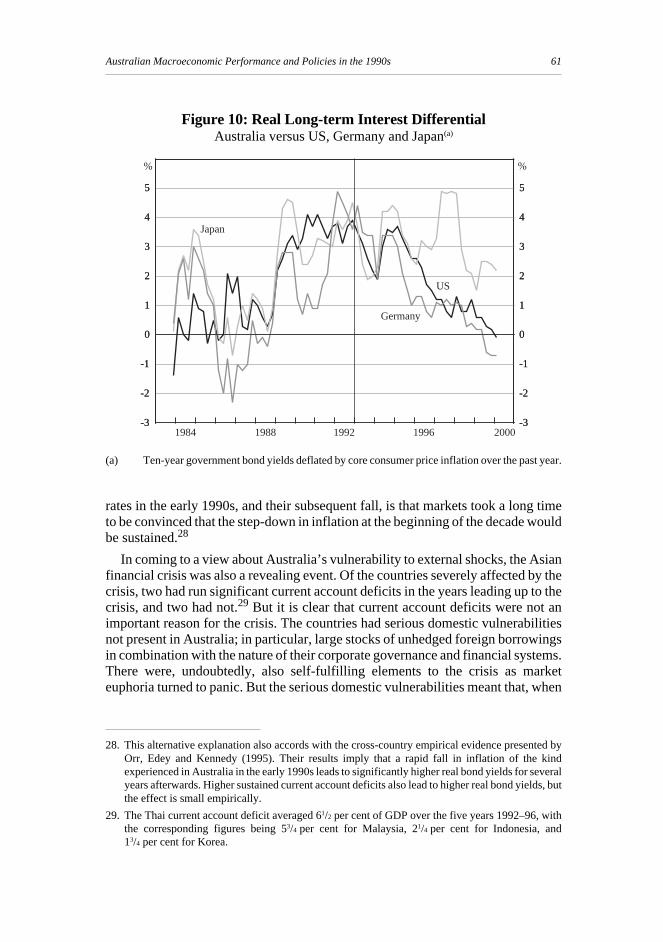
61Australian Macroeconomic Performance and Policies in the 1990s
rates in the early 1990s, and their subsequent fall, is that markets took a long timeto be convinced that the step-down in inflation at the beginning of the decade wouldbe sustained.28
In coming to a view about Australia’s vulnerability to external shocks, the Asianfinancial crisis was also a revealing event. Of the countries severely affected by thecrisis, two had run significant current account deficits in the years leading up to thecrisis, and two had not.29 But it is clear that current account deficits were not animportant reason for the crisis. The countries had serious domestic vulnerabilitiesnot present in Australia; in particular, large stocks of unhedged foreign borrowingsin combination with the nature of their corporate governance and financial systems.There were, undoubtedly, also self-fulfilling elements to the crisis as marketeuphoria turned to panic. But the serious domestic vulnerabilities meant that, when
Figure 10: Real Long-term Interest DifferentialAustralia versus US, Germany and Japan(a)
(a) Ten-year government bond yields deflated by core consumer price inflation over the past year.
-3
-2
-1
0
1
2
3
4
5
-3
-2
-1
0
1
2
3
4
5
-3
-2
-1
0
1
2
3
4
5
-3
-2
-1
0
1
2
3
4
5
2000
US
%%
Germany
Japan
1996199219881984
28. This alternative explanation also accords with the cross-country empirical evidence presented byOrr, Edey and Kennedy (1995). Their results imply that a rapid fall in inflation of the kindexperienced in Australia in the early 1990s leads to significantly higher real bond yields for severalyears afterwards. Higher sustained current account deficits also lead to higher real bond yields, butthe effect is small empirically.
29. The Thai current account deficit averaged 61/2 per cent of GDP over the five years 1992–96, withthe corresponding figures being 53/4 per cent for Malaysia, 21/4 per cent for Indonesia, and13/4 per cent for Korea.

62 David Gruen and Glenn Stevens
the currency pegs collapsed, the resulting exchange rate depreciations generatedwidespread bankruptcies and savage recessions, rather than expanding domesticactivity as was the case in Australia.
As the crisis intensified, there was less appetite for risk on the part of internationalinvestors, and risk premia on bonds issued by developing countries – even those withno links to East Asia – rose dramatically. Australia was, however, treated as a safehaven. The current account deficit widened by over 2 per cent of GDP from mid 1997to mid 1999, but this was treated with equanimity by capital markets and yields fellon A$-denominated bonds. There were no signs of enhanced Australian vulnerability,at least from this external shock.
The recent academic literature has also not been particularly kind to the idea thathigh current account deficits or foreign-debt exposures necessarily increase acountry’s vulnerability to crisis. In a survey of 28 empirical studies on currencycrises, Kaminsky, Lizondo and Reinhart (1998) uncover a series of economicindicators that receive support as indicators of impending crisis. These include anovervalued real exchange rate relative to trend, rapid credit growth, and indicatorsof banking sector problems. They observe (p 12), however, that ‘variables associatedwith the external debt profile [do] not fare well. Also, contrary to expectations, thecurrent account balance [does] not receive much support as a useful indicator ofcrises’ [emphasis in the original].30
Most of the studies surveyed by Kaminsky et al focus on the collapse of fixedexchange rate regimes, or exchange rate bands of one sort of another. Most examinethe experience of developing rather than industrial countries. We should thereforenot overstate the relevance of such work for Australia. Nevertheless, it is still ofinterest that high current account deficits and/or high levels of external indebtednessdo not systematically seem to signal enhanced vulnerability to crisis.
A final point about countries with large external debts. These are, of course,countries to which international investors have lent large quantities of funds. Inmany cases, this is because the countries have a range of characteristics –macroeconomic, microeconomic and regulatory – that inspire the confidence ofinvestors. Without these characteristics, the countries might not have been able tobuild up their large external debts in the first place. But these characteristics alsorender these countries more able to adjust to shocks; that is, they reduce thecountries’ vulnerability to crisis. It should therefore not come as such a surprise thathigh levels of external indebtedness are not good indicators of enhanced vulnerabilityto crisis.
To conclude then, the current account debate in Australia never completely wentaway over the course of 1990s, but its intensity gradually subsided. The currentaccount deficit showed no sustained improvement over the decade, with its average
30. The authors qualify this last statement with the remark: ‘This may be because the informationprovided by the behavior of the current account balance to some extent may already have beenreflected in the evolution of the real exchange rate’. This comment would seem of particularrelevance to pegged rather than floating-rate regimes.

63Australian Macroeconomic Performance and Policies in the 1990s
ratio to GDP almost as large as it had been in the 1980s. Nevertheless, at no time inthe 1990s did the predictions of those most pessimistic about the current accountlook like they would be realised. The economy grew strongly and by many measures,Australia’s vulnerability to possible changes in sentiment by foreign investorsdeclined over the course of the decade.
Notwithstanding the favourable experience of the 1990s, however, we can stillpose the question: Is Australia significantly more vulnerable to external shocksbecause of the foreign debt build-up? Perhaps the right answer remains the oneattributed to Chou En Lai when he was asked his opinion of the French revolution:‘It is too early to say’. It may still be true that the foreign debt build-up is of concernbecause, were there to be a serious domestic policy mistake or political instabilityat some time in the future, the associated costs could be much higher than wouldotherwise be the case. Nevertheless, we can at least say that the 1990s experience hasbeen kind to the consenting-adults view of the current account.
3.3 Fiscal policyIn the immediate aftermath of World War II, Australia had a large stock of
government debt, amounting in gross terms to more than 100 per cent of GDP. Thisratio declined rapidly over the next several decades, mainly as a consequence ofprudent fiscal policy until the mid 1970s, but also because of a period of unanticipatedinflation in the 1970s. By 1980, the net debt of the Australian general governmentsector had fallen to about 10 per cent of GDP.31
During the 1980s, a further significant deterioration in the fiscal accountsassociated with the recession early in the decade occurred, followed by a long periodof consolidation culminating in fiscal surpluses at the decade’s end. This pattern wasrepeated, at least in rough outline, during the 1990s (see Figure 11). The net effectof these cycles in the fiscal balance over the two decades was that generalgovernment net debt in 1990 and again in 1999 was largely unchanged from its 1980level of about 10 per cent of GDP.
The maintenance of low levels of government net debt over the past two decadesis quite unusual by international standards. Figure 12 shows snapshots of the levelof general government net debt for 17 OECD countries including Australia in 1980,
31. Data issues complicate comparisons over time. Commonwealth Government Securities on issueamounted to more than 100 per cent of GDP in 1950; this ratio had fallen to 25 per cent by 1980.We use the alternative figure for general government net debt (or net financial liabilities) becauseit is one of the measures used by the OECD to make cross-country comparisons of governmentindebtedness. The general government sector is a consolidation of the central, state and localgovernments, and the social security sector (which does not exist as a separate sector in Australia).Net debt includes all financial liabilities less all financial assets. The government’s equityparticipation in public trading enterprises is not included as part of its holdings of financial assets.As a consequence, therefore, the use of the proceeds from the sale of public trading enterprises toretire government debt reduces general government net debt. Adjusting the Australian figures forthe proceeds of such sales would change the numbers somewhat, without making much differenceto the overall qualitative picture.

64 David Gruen and Glenn Stevens
Figure 11: General Government Underlying Cash BalancePer cent of GDP
Note: Decade averages are shown.
-5
-4
-3
-2
-1
0
1
-5
-4
-3
-2
-1
0
1
99/00
0.4
% %
94/9589/9084/8579/8074/7569/7064/65
-0.7-1.1
-1.5
Figure 12: General Government Net DebtPer cent of GDP
Source: OECD
Bel
gium Ital
y
Can
ada
Net
herl
ands
Spai
n
Ger
man
y
Aus
tria US
Fran
ce
UK
Japa
n
Den
mar
k
Icel
and
Swed
en
Aus
tral
ia
Finl
and
Nor
way
-60
-40
-20
0
20
40
60
80
100
-60
-40
-20
0
20
40
60
80
100
1980 1990 1999
%%

65Australian Macroeconomic Performance and Policies in the 1990s
1990 and 1999. Australia is right in the middle of the international pack in 1980, witheight of the countries shown having lower ratios of net government debt to GDP, andeight higher. By 1999, however, only Finland and Norway among this group ofcountries have lower ratios of net government debt than Australia. The two extendedperiods of fiscal consolidation in the latter halves of the past two decades have meantthat Australia has not experienced the significant fiscal deterioration suffered bymany other industrial countries over this time.
In discussing Australian fiscal policy in the 1990s, it is convenient to separate itsrole as a counter-cyclical tool from analysis of its medium-term focus. There isgeneral agreement that fiscal policy’s automatic stabilisers should and do play animportant counter-cyclical role. But beyond that, there has been growingdisillusionment, both in Australia and elsewhere, about the capacity of discretionaryfiscal policy to be genuinely counter-cyclical. The problem is not the transmissionlag. Indeed, changes to fiscal policy, once implemented, should be expected to havea quick impact on economic activity – probably quicker than the impact of monetarypolicy. This is particularly true of changes to government expenditure, which feeddirectly into economic activity.
The problem, as has been widely understood, is instead the implementation lag.Fiscal policy is implemented, predominantly, on an annual cycle, with the timetabledetermined by the calendar rather than the state of the economy. Even in circumstancesin which governments decide to provide a fiscal boost to the economy, the processof deciding exactly which expenditures and taxes to change, having the changespassed through the Parliament where that is necessary, and implementing them,leads to inevitable delay. For example, the Federal Government’s main fiscalinitiative in response to the early 1990s recession, One Nation, was announced inFebruary 1992, when the economy was in its third quarter of expansion followingthe recession, but still growing quite slowly. While there were some small spendinginitiatives in the package that began immediately, the bulk of them were implementedin the following financial year, 1992/93, and beyond. They therefore came into effectwhen the economy had begun to expand robustly (growth over the 1992/93 financialyear was 4.2 per cent, and over the 1993/94 year, 4.7 per cent).
In contrast, monetary policy could, subject to the medium-term inflation target,respond counter-cyclically. Monetary policy decisions could be made andimplemented quickly, even though the transmission lags were long.
These perceived institutional disadvantages of fiscal policy suggested to somethat the institutional arrangements for implementing it should be changed so that itcould play a more effective counter-cyclical role. This suggestion had been putforward by Larry Ball (1996) in New Zealand, Alan Blinder (1997) in the US, andNicholas Gruen (1997) in Australia. It received more prominence in the Australiandebate with the release of a discussion paper by the Business Council of Australia,‘Avoiding Boom/Bust’, in late 1999. This paper argued that politically independentofficials should be given the power to make small across-the-board changes to taxrates to deliver effective counter-cyclical fiscal policy. This suggestion generated

66 David Gruen and Glenn Stevens
widespread interest and discussion, although at present it appears unlikely that it willbe implemented in the foreseeable future.
Aside from its counter-cyclical role, fiscal policy also has a medium-terminfluence on national saving. For most of the period since the mid 1980s, discussionabout fiscal policy’s appropriate medium-term stance has been strongly influencedby concern about the current account. Notwithstanding the consenting-adults view,there has been a broad consensus, shared by governments of both political persuasions,that sustained high current account deficits represent prima facie evidence thatnational saving is insufficient and that public saving should make a contribution toraising it.
This position is expressed clearly in Budget documents in the second half of the1980s, and throughout the 1990s. At the time of the early 1990s recession, thismedium-term requirement is balanced against the immediate need for fiscal policyto support economic recovery. ‘In the face of weak private sector demand, …discretionary increases in expenditure have provided a direct stimulus to activity …As private sector activity consolidates, … [f]iscal policy can … resume its importantmedium term role of increasing national saving and reducing recourse to foreignfinancing of domestic investment’ (Budget Statements 1992, p 2.59).
With recovery from recession, the medium-term task of improving the fiscalbalance again becomes the dominant influence on fiscal policy. The need for thisimprovement is argued forcefully in the June 1993 FitzGerald report, the majorreport on national saving commissioned by the Federal Government. The reportopens with the observation that national saving had fallen to its lowest level in thetwentieth century, except in times of world war and the Great Depression. Itcontinues (p xiii) ‘prima facie, there is cause for concern – particularly since wealready have a very high foreign debt and a high current account deficit addingconstantly to it. If we do not save more, then the investment necessary to ensurehigher growth and more employment will only be funded by even greater recourseto foreign savings and further build-up of foreign debt’. Of particular relevance tofiscal policy, the report goes on to argue (p 16) that ‘the greatest scope for raising …national saving lies in the public sector. A concerted effort to strengthen the nationalpublic sector fiscal position is thus one of the major economic imperatives forAustralia in the years ahead’.
In its response to the FitzGerald report in the 1993/94 Budget, the FederalGovernment committed itself to lifting public saving in the medium term andspecifically to achieving a Commonwealth budget deficit of around 1 per cent ofGDP by 1996/97, compared to the deficit of nearly 4 per cent that had been recordedin the 1993/94 financial year that had just ended. (As events turned out, the goal forthe 1996/97 budget deficit was achieved, but under a new government.)
The bipartisan nature of the general strategy to raise public saving was confirmedwith the election of the Liberal/National Coalition government in 1996. In its firstbudget, the new government committed itself to a medium-term fiscal strategy ‘tofollow, as a guiding principle, the objective of maintaining an underlying [budget]balance on average over the course of the economic cycle’ (Budget Statements 1996,
67Australian Macroeconomic Performance and Policies in the 1990s
p 1–9). Assuming that this strategy is indeed maintained over the medium term, itwill generate a ratio of government debt to GDP that gradually declines towardszero.32 As had been the case earlier in the decade, the primary justification presentedfor this fiscal strategy was that it was the appropriate response to the sustained highlevel of the current account deficit.
It would be an oversimplification to argue that concern about the current accounthas been the only reason advanced for tightening fiscal policy and raising the levelof public saving in Australia in the 1990s. The FitzGerald report, for example, alsopoints to the need to raise national saving because of the ageing of the population.33
And it has also been argued that improving the budget balance in good times givesfiscal policy more capacity to respond flexibly to unforseen future economicdifficulties. But it would be fair to say that concern about the current account has beenthe primary reason advanced for raising public saving and returning gradually to afiscal surplus through the course of the 1990s.
How one views this justification for maintaining very low levels of governmentdebt (and further reducing them) depends on one’s view about the current account.For those who do not regard the current account as a relevant consideration indetermining fiscal policy’s appropriate medium-term stance, there must be analternative guiding principle. An appealing alternative is intergenerational equity.For given government spending, this principle would lead the overall level of taxes(and therefore the fiscal balance) to be set so that each generation’s tax burden would(roughly) pay for the government services that it uses. Ageing of the populationwould be relevant to this calculus simply because taxes are mostly paid duringindividuals’ working lives, while government services continue to be used inretirement.
This approach would, however, lead to separate treatment for current and capitalgovernment expenditures, rather than having a target for the overall medium-termfiscal balance. Government capital expenditure projects that, it is judged, wouldgenerate a social return over the life of the projects higher than the borrowing costsincurred to fund them would be undertaken, and financed out of new governmentborrowing. Provided one is not concerned about the implications for the currentaccount, a cost/benefit analysis of such projects would therefore suggest that theyshould go ahead, despite their implications for the overall budget balance.
An alternative perspective, however, is the one discussed at the end of theprevious section. Notwithstanding the favourable experience of the 1990s, Australiamay still remain vulnerable to possible future changes in sentiment by foreigninvestors. In this view, one of the reasons Australia has maintained the confidenceof foreign investors over the two decades of high current account deficits has beenthe fiscal restraint and discipline that has been demonstrated over this time. From this
32. Abstracting from the effects of any asset sales, maintaining an underlying budget balance in agrowing economy gradually generates this outcome.
33. See Edey and Gower (this volume) for further discussion on the implications of population ageingfor the fiscal accounts.
68 David Gruen and Glenn Stevens
perspective, achieving continued medium-term fiscal balance and maintaining verylow levels of government debt represent an appropriately prudent course of action.This approach, it could be argued, represents a small price to pay to enable Australiato continue to draw on foreign saving to fund that portion of domestic investment notfunded by domestic saving, while maintaining the confidence of foreign investors.
4. ConclusionThe macroeconomic performance of the Australian economy grew progressively
more impressive as the 1990s proceeded. While the decade began with a severerecession, by its close, growth had been strong and sustained for over eight years. Theupswing had outlived its two predecessors. The economy had apparently becomenoticeably more stable than in the past. Living standards, as measured by per capitaGDP, had improved at a rate not seen since the 1960s – a result shared only withIreland among industrial countries. Public finances were, by any normal standard,in exceptionally strong shape. Unemployment rates remained high throughout thedecade, but had declined by the end of 1999 by more than many would have daredhope six or seven years earlier. At the same time, inflation had averaged less than3 per cent over the whole decade, and about 2 per cent since the inflation target formonetary policy was introduced in 1993. The combination of 4 per cent growth and2–3 per cent inflation seen for a number of years now is one which a previousgeneration of economists and policy-makers would have only dreamed of – but towhich many contributed through the hard grind of numerous reforms over manyyears.
That this combination would be achieved in a world in which Australia’s currentaccount deficit – the bête noire of the policy-makers of the 1980s – had apparentlychanged little, and had averaged 41/2 per cent of GDP for twenty years, would havebeen considered even more unlikely a decade ago. Careful observers would probablybe wary of concluding that this issue has been completely put to rest, or that problemscould not at some stage appear. But it is undeniable that Australia’s standing ininternational financial markets remained strong, and at few times in our history hasit been stronger than during the financial crisis which engulfed our neighbours, andwhich clearly did not derail the Australian economy.
The policy debates of the 1990s shaped these trends, and also were shaped bythem. Vigorous debate about the conduct of monetary policy, its objectives and evenits very institutional structure, was a feature of the early part of the decade. Someelements of that debate contributed to constructive change in policy arrangements.It would be disingenuous to suggest that there is now no debate on these issues, butthe debate is more confined, more focused, and less politicised. Likewise thereseems to be broad agreement at present about the overall goals of fiscal policy,though the inevitable conflicts about how they are achieved naturally occur. Ourguess would be that interesting intellectual debates may lie ahead in this area,assuming that surpluses continue for some years and debt on issue continues to rundown. A decade from now, some important medium-term issues of public financemay well have been debated to a much greater extent that they have to date. If so, it

69Australian Macroeconomic Performance and Policies in the 1990s
will only have been possible because of the efforts at fiscal consolidation andmaintaining discipline in the period since the mid 1980s.
The key question in mid 2000 is whether these successes of the 1990s can becontinued in the first decade of the new century. There is no shortage of actual orpotential challenges. Most imminently, the various temporary effects ofwide-ranging tax reform have to be coped with. There is the obvious potential forinstability in international financial markets were a serious correction to take holdin US equity markets. The increased size of household financial balance sheetsgenerally is something that may generate additional uncertainty, as is the pervasiveeffect of rapid technological change. Further ahead, environmental issues maybecome more prominent as factors requiring adjustments in relative prices andpatterns of production – which in the past have been known to occasion disruption.Many of the factors pertinent to ongoing success lie in the social area rather than thestrictly economic domain, though the two are related.
Yet despite this, and evident concern that the economic gains have been unevenlydistributed, and despite the tendency of the Australian media to give more prominenceto bad economic news than to good, and to threats to growth than to opportunitiesfor it, there is perhaps more optimism in many informed circles now than there wasten years ago about Australia’s economic possibilities. A decade of low inflation hasdone a lot to eradicate the old inflation mentality, with all the distortions that camewith it. Stable growth, and a long expansion, mean that talk of sustainingunemployment rates below 6 per cent might now seem only slightly ambitious; sevenyears ago it would have seemed ludicrous to many. The benefits of productivitygrowth for living standards, a result of all the difficult microeconomic reforms, andperhaps of the more stable macroeconomy, have become clearer and will surely beclearer still in future. Finally, comparisons with the performance of other countries,particularly our Asia-Pacific neighbours, made so unfavourably even five years ago,are more balanced now.
The successes in the 1990s, and of the latter 1990s in particular, have generateda lot of this confidence. It was surely not, of course, all good management; goodfortune has, perhaps, favoured Australia at times in the 1990s, in ways it did not inthe 1980s. Only time will tell whether further performance like that of the pastseveral years is within our grasp, or not. There are areas of risk to watch out for. Butthere are also good reasons for cautious optimism.

70 David Gruen and Glenn Stevens
ReferencesAccess Economics (1990), Australia’s Foreign Debt: Choices for the Future, report prepared
for First National Summit on Debt, Business Council of Australia, Melbourne,1–2 March.
Andersen P and D Gruen (1995), ‘Macroeconomic Policies and Growth’, in P Andersen,J Dwyer and D Gruen (eds), Productivity and Growth, Proceedings of a Conference,Reserve Bank of Australia, Sydney, pp 279–319.
Australian Industrial Relations Commission (1997), Safety Net Review – Wages.
Budget Statements (1992), 1992-93 Budget Paper No 1, Australian Government PublishingService, Canberra.
Budget Statements (1996), 1996-97 Budget Paper No 1, Australian Government PublishingService, Canberra.
Ball LM (1996), ‘A Proposal for the Next Macro-Economic Reform’, Victoria University ofWellington Foundation, Wellington, 11 November, mimeo.
Blinder AS (1997), ‘Is Government Too Political?’, Foreign Affairs, 76(6), pp 115–126.
Blundell-Wignall A and S Thorp (1987), ‘Money Demand, Own Interest Rates andDeregulation’, Reserve Bank of Australia Research Discussion Paper No 8703.
Boehm EA and PM Summers (1999), ‘Analysing and Forecasting Business Cycles with theAid of Economic Indicators’, Melbourne Institute Working Paper No 18/99.
Business Council of Australia (1999), ‘Avoiding Boom/Bust: Macro-economic Reform fora Globalised Economy’, New Directions Discussion Paper 2.
Carmichael J (1990), ‘Inflation: Performance and Policy’, in SA Grenville (ed), TheAustralian Macro-Economy in the 1980s, Proceedings of a Conference, Reserve Bankof Australia, Sydney, pp 288–342.
Chapman B (1990), ‘The Labour Market’, in SA Grenville (ed), The AustralianMacro-Economy in the 1980s, Proceedings of a Conference, Reserve Bank of Australia,Sydney, pp 7–65.
Corden WM (1991), ‘Does the Current Account Matter? The Old View and the New’,Economic Papers, 10, pp 1–19.
Creedy J (ed) (1990), The Australian Economic Review, 90, Melbourne Institute of AppliedEconomic and Social Research, University of Melbourne.
Dowrick S (2000), ‘The Resurgence of Australian Productivity Growth in the 1990s: Miracleor Mirage?’, paper presented at 29th Annual Conference of Economists, Gold Coast,Queensland, 3–6 July.
Edey M (1997), ‘The Debate on Alternatives for Monetary Policy in Australia’, in P Lowe(ed), Monetary Policy and Inflation Targeting, Proceedings of a Conference, ReserveBank of Australia, Sydney, pp 42–67.
FitzGerald VW (1993), National Saving: A Report to the Treasurer, Australian GovernmentPublishing Service, Canberra.
Fraser BW (1993), ‘Some Aspects of Monetary Policy’, Reserve Bank of Australia Bulletin,April, pp 1–7.
Gordon RJ (2000), ‘Does the “New Economy” Measure up to the Great Inventions of thePast?’, Journal of Economic Perspectives, 14(4), forthcoming.

71Australian Macroeconomic Performance and Policies in the 1990s
Grenville SA (1990), ‘The Operation of Monetary Policy’, The Australian Economic Review,90, pp 6–16.
Grenville SA (1997), ‘The Evolution of Monetary Policy: From Money Targets to InflationTargets’, in P Lowe (ed), Monetary Policy and Inflation Targeting, Proceedings of aConference, Reserve Bank of Australia, Sydney, pp 125–158.
Gruen D and G Shuetrim (1994), ‘Internationalisation and the Macroeconomy’, in P Loweand J Dwyer (eds), International Integration of the Australian Economy, Proceedingsof a Conference, Reserve Bank of Australia, Sydney, pp 309–363.
Gruen F and M Grattan (1993), Managing Government: Labor’s Achievements and Failures,Longman Cheshire, Melbourne.
Gruen N (1997), ‘Making Fiscal Policy Flexibly Independent of Government’, Agenda, aJournal of Policy Analysis and Reform, 4(3), pp 297–307.
Hanke SH, MG Porter and K Schuler (1992), ‘A “Bundesbank” or a “Reserve CurrencyBoard”?’, in D Moore (ed), Can Monetary Policy be Made to Work?, Papers presentedat the Institute of Public Affairs Monetary Policy Conference, Melbourne, pp 36–50.
Kaminsky G, S Lizondo and CM Reinhart (1998), ‘Leading Indicators of Currency Crises’,IMF Staff Papers, 45(1), pp 1–48.
Lowe P (1995), ‘Labour-Productivity Growth and Relative Wages: 1978–1994’, in P Andersen,J Dwyer and D Gruen (eds), Productivity and Growth, Proceedings of a Conference,Reserve Bank of Australia, Sydney, pp 93–134.
Macfarlane IJ (1989), ‘Money, Credit and the Demand for Debt’, Reserve Bank of AustraliaBulletin, May, pp 21–31.
Macfarlane IJ (1990), ‘Credit and Debt: Part II’, Reserve Bank of Australia Bulletin, May,pp 27–34.
Macfarlane IJ (1998), ‘Australian Monetary Policy in the Last Quarter of the TwentiethCentury’, Reserve Bank of Australia Bulletin, October, pp 6–19.
Macfarlane IJ and G Stevens (eds) (1989), Studies in Money and Credit, Proceedings of aConference, Reserve Bank of Australia, Sydney.
Macquarie Bank (1989), A Boiling Frog: Australia’s Economic Challenge, Macquarie Bank,Sydney.
McTaggart D and C Rogers (1990), ‘Monetary Policy and the Terms of Trade: A Case forMonetary Base Control in Australia?’, The Australian Economic Review, 90,pp 38–49.
Milbourne, R (1990), ‘Money and Finance’, in SA Grenville (ed), The AustralianMacro-Economy in the 1980s, Proceedings of a Conference, Reserve Bank ofAustralia, Sydney, pp 222–276.
Moore D (ed) (1992), Can Monetary Policy be Made to work?, Papers presented at theInstitute of Public Affairs Monetary Policy Conference, Melbourne.
Oliner SD and Sichel DE (2000), ‘The Resurgence of Growth in the Late 1990s: IsInformation Technology the Story?’, Board of Governors of the Federal ReserveSystem, Finance and Economics Discussion Series, Paper No 2000-20, Washington DC.
Orr A, M Edey and M Kennedy (1995), ‘The Determinants of Real Long-Term Interest Rates:17 Country Pooled-Time-Series Evidence’, OECD Economics Department WorkingPaper No 155.

72 David Gruen and Glenn Stevens
Phillips MJ (1989), ‘A Central Banking Triptych’, Reserve Bank of Australia Bulletin,October, pp 13–16.
Phillips MJ (1990), ‘When the Music Stops’, Reserve Bank of Australia Bulletin, July,pp 14–18.
Pitchford J (1989a), ‘A Sceptical View of Australia’s Current Account and Debt Problem’,The Australian Economic Review, 86, pp 5–14.
Pitchford J (1989b), ‘Does Australia Really Have a Current Account Problem?’, Policy, 5(2),Centre for Independent Studies, Sydney, pp 2–5.
Pitchford J (1990), Australia’s Foreign Debt: Myths and Realities, Allen and Unwin, Sydney.
Simon J (2000), ‘Essays in Empirical Macroeconomics’, PhD Thesis, MIT.
Stevens G (1992), ‘Inflation and Disinflation in Australia: 1950-91’, in A Blundell-Wignall(ed), Inflation Disinflation and Monetary Policy, Proceedings of a Conference,Reserve Bank of Australia, Sydney, pp 182–244.
Stevens G (1997), ‘Some Observations on Low Inflation and Household Finances’, ReserveBank of Australia Bulletin, October, pp 38–47.
Stevens G (1999), ‘Six Years of Inflation Targeting’, Reserve Bank of Australia Bulletin,May, pp 46–61.
Stevens G, S Thorp and J Anderson (1987), ‘The Australian Demand Function for Money:Another Look at Stability’, Reserve Bank of Australia Research Discussion PaperNo 8701.
Stone JO (1984), ‘1929 and All That ...’, The Australian Economic Review, 67, pp 18–31.