australian grown cotton sustainability report2014
TRANSCRIPT

AUSTRALIAN GROWN COTTON
2014SUSTAINABILITY REPORT

1 AUSTRALIAN GROWN COTTON SUSTAINABILITY REPORT // 2014
OUR APPROACH
ABOUT THIS REPORT Cotton is the most widely produced natural fibre in the world. Every day, billions of people wear cotton clothing and use cotton fabrics and products in their everyday lives. Australia is the third largest exporter of cotton in the world and has a reputation for producing high quality cotton.
Cotton Australia and the Cotton Research and Development Corporation (CRDC) have been working together to ensure the Australian cotton industry is a global leader in sustainable agriculture.
// Cotton Australia is the peak body for Australia’s cotton growers. Cotton Australia strives to foster a world class agricultural industry that is sustainable, valued for its economic and social contributions and produces very high quality cotton which is in high demand around the globe.
// The Cotton Research and Development Corporation’s purpose is to enhance the performance of the Australian cotton industry and community through strategically investing in research and development, and its application.
The Australian cotton industry is committed to sustainability and continuous improvement. This is its first sustainability report prepared according to the principles and framework of the Global Reporting Initiative for Sustainability Reporting (G4 version). In preparing the report the industry has considered more than 100 sustainability indicators, reviewed the literature and international frameworks, and consulted stakeholders.
Cotton Australia
Suite 4.01, 247 Coward St Mascot, NSW 2020 p: 02 9669 5222e: [email protected]
Cotton Research and Development Corporation
2 Lloyd St, Narrabri NSW 2390p: 02 6792 4088 e: [email protected]
OUR APPROACH 1
EXECUTIVE SUMMARY 2
OUR STRATEGY 5
OUR ORGANISATIONAL PROFILE 15
Economic category 17
Environmental category 28
Social category 50
OUR REPORT 61
REFERENCES 72

2 AUSTRALIAN GROWN COTTON SUSTAINABILITY REPORT // 2014
Sustainability has long been a key focus of the Australian cotton industry. Today, Australian cotton growers grow more cotton on less land, with more efficient water use and with less impact on the environment than ever before.
The Australian cotton industry:
// Is dedicated to becoming the producer and supplier of the most environmentally and socially responsible cotton in the world.
// Aims to be a global leader in sustainable agriculture by investing in research and development and reporting against recognised sustainability indicators.
// Is committed to delivering independent, evidence based assessments of its sustainability and environmental performance and communicating this with a common voice.
The industry has a strong research and development culture. Over the past 24 years, the Cotton Research and Development Corporation (CRDC) has invested $200 million in research, development and extension on behalf of Australian cotton growers and the Australian Government – delivering an estimated minimum $1.4 billion benefit back to growers on their farms, and twice that value to the wider community.
Cotton Australia has recently joined two international sustainability partnerships: the Cotton LEADS Program and the Better Cotton Initiative. myBMP is the Australian cotton industry’s voluntary farm and environmental management system for growers to improve on-farm production. myBMP ensures that the Australian cotton industry produces economically, socially and environmentally sustainable cotton. 45 percent of Australia’s cotton produced is grown on farms participating in the myBMP program.
EXECUTIVE SUMMARY

3 AUSTRALIAN GROWN COTTON SUSTAINABILITY REPORT // 2014
ECONOMIC CATEGORY
There are up to
1500 cotton farms in Australia
Australia produces three percent of the world’s cotton but is the third largest exporter, behind the US and India. More than 99 percent of Australia’s cotton is exported.
Australia’s cotton farmers produce enough cotton to clothe 500 million people.
Australian yields are high by international standards, almost three times the world average.
The economic aspects considered for this report are cotton production statistics, crop yield and quality, and its economic value.
ANNUAL PRODUCTION ON AVERAGE FOR THE LAST FIVE YEARS (2009-2014):
Australian cotton is viewed worldwide as having an excellent quality fibre. It is used to produce high quality yarns for use in the woven and knitted apparel sector.
Irrigated planted area was
354,775 haDryland planted area was
96,074 haIrrigated crop yield was
9.85 bales/ha [2236 kg/ha]
Dryland crop yield was
4.09 bales/ha [928 kg/ha]
Total production was
881,463 metric tonnes [3.9 million bales]
The gross value of production was
$2 billionAverage cotton area per farm
495 ha
Cotton is the most widely produced natural fibre in the world and represents about 31 percent of the world textile market. 31%
Cotton is a major commodity, representing from 30 to 60 percent of the gross value of the total agricultural production in regions where it is grown. The average profitability of growing cotton in 2013 was $410/ha.
30 to 60%
MARKET SHARE

ENVIRONMENTAL CATEGORYThe environmental aspects for this report included soil health, water use, groundwater, biodiversity, riparian land management, integrated pest management, pesticide use and greenhouse gas emissions.
SOCIAL CATEGORYKey social aspects for the cotton industry include education levels, demographics, employment, health, social capital, research and development and legal compliance.
The number of cotton growers with a diploma level or above qualification has risen from 30 percent in 1990 to 50 percent in 2011. These qualification levels are higher than other agricultural sectors and above the average Australian population.
40% Water is critical to maximise crop yields and fibre quality.
Comparing 5 year averages for the periods 2008-13 and 1998-03, the amount of insecticide used has reduced from 5.12 kg to 0.55 kg active ingredient per hectare.
The proportion of farmers monitoring groundwater quality has increased significantly from 20 percent in 2006 to 62 percent in 2011.
// The whole farm irrigation efficiency index improved from 57 percent to 70 percent.
// The crop water use index is above three kg/mm/ha, high by international standards.
// 96 percent of irrigators have improved their furrow irrigation system or changed to an alternate irrigation system.
Nitrogen fertilisers and energy consumed on farms are a major source of greenhouse gas emissions, and the industry continues to invest in research, demonstration trials and decision support tools focused on improving nitrogen and energy use efficiency.
Farmers are taking action to improve soil health
The cotton industry has achieved an 89 percent reduction in insecticide use.89%
On average cotton farms have approximately 42
percent of their land dedicated to native vegetation. More than 42,000 birds representing
45 species were found on farm water
storages in the Gwydir Valley, 153 bird
species were found in natural vegetation in the Namoi Valley,
450 species of invertebrates have been recorded in one cotton field
during the summer.
// There are about 6.6 people per farm (1.6 employees/100 cotton hectares, with a highly variable range across regions).
// Cotton represents less than 0.02 percent of all claims in agriculture for injuries less than four days and five-plus days.
// Overall cotton growers are much younger than farmers in other agricultural industries in Australia.
HIGH SOCIAL CAPITAL// The Australian Cotton Conference is one of the
largest conferences of any agricultural industry in Australia with more than 1800 delegates.
ADOPTION
// 82 percent use new round module pickers.
99% of transgenic traits for insect and weed management.
// 70 percent of farmers use soil moisture probes, up from 40 percent in 2006 (highest of all agriculture industries in Australia).
// 90 percent using satellite navigation systems in tractors.
// 84 percent use a smart phone or tablet for accessing information about their farming system.
// 93 percent of farmers use integrated pest management (IPM).
AUSTRALIAN COTTON GROWERS ARE INNOVATIVE AND RAPIDLY ADOPT NEW TECHNOLOGIES
60%
The proportion of women working in
key industry organisations is
60%
COTTON AUSTRALIA ESTIMATES 10,000 PEOPLE ARE DIRECTLY EMPLOYED BY THE COTTON INDUSTRY IN A NON-DROUGHT YEAR.
10,000 people
increase in cotton water productivity over the last decade.

5 AUSTRALIAN GROWN COTTON SUSTAINABILITY REPORT // 2014
JOINT LETTER FROM THE CHAIRS - OUR COMMITMENT TO SUSTAINABILITYSustainability is integral to stakeholders both within and external to the industry.
In 2009, leaders in the Australian cotton industry recognised the potential for improving industry performance, organisational collaboration and capacity through a shared view of the future. A 20 year timeline was chosen to ensure a long-term strategic focus.
The Cotton Industry Vision 2029 is: “Australian cotton, carefully grown, naturally world’s best”. i
Key elements of the Cotton Industry Vision 2029 are to make Australian cotton:
// DIFFERENTIATED a world-leading supplier of elite quality cotton that is highly sought in premium market segments.
// RESPONSIBLE the producer and supplier of the most environmentally and socially responsible cotton in the world.
// TOUGH a resilient industry, equipped for future challenges.
// SUCCESSFUL exciting new levels of performance that transform productivity and profitability of every sector of the industry.
// RESPECTED an industry recognised and valued by the wider community for its contribution to fibre and food needs of the world.
// CAPABLE an industry that retains, attracts and develops highly capable people.
THE AUSTRALIAN COTTON INDUSTRY// Is dedicated to becoming the producer and supplier of the most environmentally
and socially responsible cotton in the world.
// Aims to be a global leader in sustainable agriculture by investing in research and development and reporting against recognised sustainability indicators.
// Is committed to delivering independent, evidence based assessments of its sustainability and environmental performance and communicating this with a common voice.
// Utilises its best management practice program (myBMP) as a pivotal platform to maintain the cotton industry’s social licence to operate. myBMP provides the tools for growers to leave a smaller environmental footprint and the means to demonstrate the industry’s commitment to sustainable practices.
OUR STRATEGY

6 AUSTRALIAN GROWN COTTON SUSTAINABILITY REPORT // 2014
The principles in this statement are built from the strategic plans of Cotton Australia, the CRDC and the Cotton Industry Vision 2029ii.
The Australian cotton industry has a 21 year history of independent environmental assessments and is unique among Australian agricultural industries in documenting performance and practice change over such a long period. Cotton Australia and CRDC are committed to continuing an independent, evidence based assessment of cotton industry’s sustainability and environmental performance and reporting outcomes to stakeholders and industry.
Consumers, government and communities around the world are increasingly interested in the sustainability of agriculture and its products. As part of the industry strategy to better meet stakeholder needs, Cotton Australia has recently joined two international sustainability partnerships: the Cotton LEADSTM Program and the Better Cotton Initiative. The National Farmers Federation (of which Cotton Australia is a member), in its Blueprint for Australian Agriculture 2013-2020, has a high priority goal to improve and promote the agricultural industry’s environmental sustainability. One of the strategies identified is to develop sustainability indicators.
Notably, at the 2013 annual International Cotton Advisory Committee (ICAC) Plenary Meeting, the committee received a report titled Measuring sustainability in cotton farming systems: Towards a guidance frameworkiii from its Expert Panel on the Social, Environmental and Economic Performance of Cotton Production (SEEP). SEEP provided recommendations about the indicators which should be used to measure sustainability in cotton production at the global level. The recommended indicators cover the three pillars of sustainability - social, environmental and economic. This report was developed as envisaged by SEEP as part of developing an agreed set of indicators for the industry.
The Australian cotton industry is committed to a continued focus on achieving a successful, resilient and responsible industry. As part of this commitment we will establish a forum to actively engage with our stakeholders to discuss opportunities for improvement. This will include developing specific sustainability targets that:
// Boost farm productivity.
// Increase water use efficiency.
// Reduce the carbon footprint.
// Enhance biodiversity.
// Reduce work related injuries and fatalities.
// Facilitate increased sustainability reporting across the supply and value chain for cotton.
Lyndon MulliganChair, Cotton Australia
Dr Mary CorbettChair, Cotton Research and Development Corporation

7 AUSTRALIAN GROWN COTTON SUSTAINABILITY REPORT // 2014
INTERNATIONAL COTTON SITUATIONAL ANALYSISCotton has been widely used and traded as fibre and fabric for more than 5,000 years. Cotton is the most commonly produced natural fibre in the world and represents about 31 percent of the world textile market. By contrast, wool accounts for three percent, and other natural fibres like silk, hemp, linen and mohair make up a very small proportion of global textiles (less than one percent each). Man-made fibres make up more than 60 percent of the global textile market and this proportion is increasing. World consumption for cotton is growing, but at a much slower rate compared to man-made fibres (Figure 1).
Figure 1. World consumption for cotton and man-made fibres
19930
10
20
30
40
50
70
80
Fibre
cons
umpt
ion (M
t) 60
0
5
10
15
20
25
30
35
40
45
50
1994 1995 1996
cotton
1997 1999 20001998 2001 2002 2003 2004 2005 2006 2007 2008 2009 2010 2011 2012
Calendar yearnon-cellulosic cellulosic wool cotton share
Fibre consumption (%)
Source: International Cotton Advisory Committee 2012
Cotton is produced in more than 100 countries in the world, but six of them - China, India, Pakistan, USA, Brazil and Uzbekistan - contribute about 80 percent of production. On average 33-34 million hectares are planted to cotton annually around the world, producing about 26 million tonnes of lint.
Figure 2. World cotton production and exports from major producing countries
Source: ICAC 2014 Note: Figures for 2014 include carry over stocks from 2013.
Australia produces around three percent of the world’s cotton but is the third largest exporter, behind the USA and India (Figure 2). More than 99 percent of Australia’s cotton is exported. In an average year, Australia’s cotton growers can produce enough cotton to clothe 500 million people.
0
1
2
3
4
5
6
7
8
China India USA Pakistan Brazil Uzbekistan Australia FrancophoneAfrica
Others
Cotto
n (Mi
llion t
onne
s)
Lintproduction
Exports
0
500
1000
1500
2000
2500
19
80/8
1
19
81/8
2
19
82/8
3
19
83/8
4
19
84/8
5
19
85/8
6
19
86/8
7
19
87/8
8
19
88/8
9
1989
/90
1990
/91
1991
/92
1992
/93
1993
/94
1994
/95
1995
/96
1996
/97
1997
/98
1998
/99
1999
/00
2000
/01
2001
/02
2002
/03
2003
/04
2004
/05
2005
/06
2006
/07
2007
/08
2008
/09
2009
/10
2010
/11
2011
/12
2012
/13
2013
/14
LINT P
ER HA
(kg)
BRAZIL AUSTRALIA USA ISRAEL
CHINA WORLD AVERAGE INDIA

8 AUSTRALIAN GROWN COTTON SUSTAINABILITY REPORT // 2014
Figure 3. Cotton lint yields for major producing countries between 1980 – 2014
0
1
2
3
4
5
6
7
8
China India USA Pakistan Brazil Uzbekistan Australia FrancophoneAfrica
Others
Cotto
n (Mi
llion t
onne
s)
Lintproduction
Exports
0
500
1000
1500
2000
2500
19
80/8
1
19
81/8
2
19
82/8
3
19
83/8
4
19
84/8
5
19
85/8
6
19
86/8
7
19
87/8
8
19
88/8
9
1989
/90
1990
/91
1991
/92
1992
/93
1993
/94
1994
/95
1995
/96
1996
/97
1997
/98
1998
/99
1999
/00
2000
/01
2001
/02
2002
/03
2003
/04
2004
/05
2005
/06
2006
/07
2007
/08
2008
/09
2009
/10
2010
/11
2011
/12
2012
/13
2013
/14
LINT P
ER HA
(kg)
BRAZIL AUSTRALIA USA ISRAEL
CHINA WORLD AVERAGE INDIA
Source: ICAC 2014
Australian yields are high by international standards, almost three times the world average.
Figure 3 shows Israel and Australian yields are consistently higher than other major producing countries and the world average.

9 AUSTRALIAN GROWN COTTON SUSTAINABILITY REPORT // 2014
The Australian Government is a member of the International Cotton Advisory Committee (ICAC), which is the international forum for governments to discuss cotton issues.
The ICAC has noted that cotton’s international competitive challenges include:
// Man-made fibres now dominate the global fibre market with cotton’s share declining as man-made fibre quality and production capacity improves.
// Competition for resources, such as land and water, with other crops.
// Rising input costs.
// Consumer pressures to reduce input use.
// Shifts in consumer spending away from clothing and home furnishings.
// Demonstrating sustainable practices.
// High volatility of prices caused by climate variability and government measures that distort markets.
// Fibre quality standardisation and classification.
// Accelerating yield and fibre quality improvement.
// Increasing the participation of women in the cotton industry.
Irrigation modernisation has improved water use efficiency.

10 AUSTRALIAN GROWN COTTON SUSTAINABILITY REPORT // 2014
AUSTRALIAN COTTON SITUATIONAL ANALYSIS The cotton industry is an integral part of the Australian economy, worth more than $2 billion per annum in export earnings and helping to underpin more than 50 rural communities. The industry is made up of approximately 1500 farms in regional New South Wales (NSW) and Queensland as well as cotton ginning facilities and a range of associated support industries, including crop consultants, input suppliers, farming contractors, cotton classers and cotton merchants. About 65 percent of Australia’s cotton is grown in NSW with the remainder grown in Queensland (Figure 4).
From 1920 to 1960 cotton was grown on a small scale as a dryland crop in Queensland. Yields were less than 180kg/ha. The most dramatic change to cotton production followed the completion of major river headwater dams and the subsequent introduction of irrigation in northern NSW during the 1960s to 1980s. In 2013-14 some commercial cotton crops were grown for the first time in northern Victoria. Figure 4 Australian cotton growing regions
Cotton is mostly grown in the 400-800mm summer rainfall zone, which means cotton crops can receive significant amounts of their water needs from rain during the growing season. The cracking clay soils where cotton is grown can store up to 150 -170mm of plant available water in a 130cm profile, especially following a wet winter prior to cotton planting. The highly variable climate can lead to droughts or flooding rains and both extremes have been experienced in the past decade (Figure 5). The largest crop on record was 566,000 hectares planted in 2011-12. The area of rain-grown cotton changes considerably from year to year depending on rain and prices.
Figure 5 Long term average rainfall for Emerald, Qld and Narrabri, NSW
0
200
400
600
800
1000
1200
1990
19
91
1992
19
93
1994
19
95
1996
19
97
1998
19
99
2000
20
01
2002
20
03
2004
20
05
2006
20
07
2008
20
09
2010
20
11
2012
20
13 Av
erag
e Ann
ual R
ainfa
ll (mm
)
Narrabri Emerald Average Narribri Average Emerald
Source: Bureau of Meteorology

11 AUSTRALIAN GROWN COTTON SUSTAINABILITY REPORT // 2014
For the past 10 years, on average, 83 percent of the Australian cotton crop was irrigated and produced 92 percent of the national crop with an average yield of 9.59 bales/ha. Australian irrigated lint yields per unit area are now the highest of any major cotton producing country in the world, being about three times the world average. Yields have continued to move upwards from 1200kg/ha in the 1970s, through 1400kg/ha in the 1980s to 1600kg/ha in the 1990s and can now be greater than 2270kg/ha (10 bales/ha). Figure 6 shows the rising trend in yields as well as significant technology and climatic events which occurred. Most of this yield gain is attributed to plant breeding and exploiting genetic variation and genotype response to modern management.
Figure 6 Technology and climatic impacts on cotton yields
LINT
YIELD
(kg/
ha) LINT YIELD (bales/ha)
1
2
3
4
5
0
500
1000
1500
2000
2500
6
7
8
9
10
FLOOD
FLOOD
PYRETHROIDS INTRODUCED
BIOTECHNOLOGY CROPS EXPAND
RECORDVARIETY DISEASE
RESISTANCE INTRODUCED
FLOOD
IDEAL SEASON
DROUGHT
DROUGHT HIGH PEST LEVELS
DROUGHT
HOTDROUGHT
WET PICK
1960
-61
1961
-62
1962
-63
1963
-64
1964
-65
1965
-66
1966
-67
1967
-68
1968
-69
1969
-70
1970
-71
1971
-72
1972
-73
1973
-74
1974
-75
1975
-76
1976
-77
1977
-78
1978
-79
1979
-80
1980
-81
1981
-82
1982
-83
1983
-84
1984
-85
1985
-86
1986
-87
1987
-88
1988
-89
1989
-90
1990
-91
1991
-92
1992
-93
1993
-94
1994
-95
1995
-96
1996
-97
1997
-98
1998
-99
1999
-00
2000
-01
2001
-02
2002
-03
2003
-04
2004
-05
2005
-06
2006
-07
2007
-08
2008
-09
2009
-10
2010
-11
2011
-12
2012
-13
2013
-14
Australian cotton prices vary due to the world cotton price (priced in US dollars) and the Australian/US dollar exchange rate. Taking into account the world cotton price and currency exchange rates, for the last two years they have hovered around $440/bale. About 270 kilograms of fuzzy cotton seed is produced for every 227 kilogram bale of cotton fibre and this seed is currently valued around $370/tonne.
The Australian cotton industry faces many challenges which are addressed by the current 2013-2018 strategic plans of Cotton Australia and CRDC. These challenges include:
// Competition from man-made fibres (especially polyester) that now dominates the global fibre market, with cotton’s share continuing to decline.
// Falling farm profitability and increasing input costs.
// Maintaining yield and fibre quality improvements.
// Rising competition for natural resources such as water and land.
// Demonstrating environmental stewardship and sustainability in line with community and market expectations.
// Managing climatic variability and its impact on production.
// Biosecurity and transgenic trait stewardship.
// Attraction and retention of skilled labour.
// Ensuring innovation and its adoption from research and development.

COTTON PRODUCTSThe cotton plant produces fruit, known as bolls. When mature the crop is picked and ginned - which separates the cotton fibre (or lint) from the seed. Cotton lint makes up about 42 percent of the picked cotton by weight, and contributes about 85 percent of the total income from a cotton crop. The other 15 percent of income is from cotton seed.
Cotton lint is spun into yarn that is woven or knitted into a wide range of fabrics such as velvet, corduroy, chambray, velour, jersey and flannel. Cotton fabric is used to make denim jeans, socks, towels, t-shirts, bed sheets and underwear. Cotton’s strength and absorbency make it an ideal fabric for medical and personal hygiene products. Other uses of cotton fibres include furnishings, car-tyre cord, fishing nets and bookbinding. Some very short fibres that remain on the cottonseed after ginning are called linters. These can be used to produce items such as bandages, swabs, bank notes, cotton buds and x-rays.
Cotton is a sought-after fibre due to its non-allergenic properties, softness which people like close to their skin, ability to be blended with synthetic and natural fibres, easiness to dye because of its white colour, strength, and breathability that keeps the body cool in summer and warm in winter.
Cotton seed, which makes up around half the weight of the picked cotton, is mostly used to make cotton seed oil. One tonne of cotton seed yields approximately 200kg of oil, 500kg of cotton seed meal and 300kg of hulls.
Cotton seed oil is cholesterol free, high in polyunsaturated fats and contains high levels of anti-oxidants (vitamin E) which contribute to its long shelf life. It is particularly sought by restaurants and snack food stores for deep frying and is also used in the manufacture of some margarines and salad dressings. Cotton seed oil is also used to make products such as soap, emulsifiers, cosmetics, pharmaceuticals, rubber, paint, water proofing agents and candles.
The by-product of the oil-extraction process is meal, which is used as stock feed. Cotton seed meal is a high protein meal that can be fed to most animals. Cotton seed hulls are also a valuable feed source for livestock. Whole cotton seed can also be used as a supplement for ruminant livestock. It is high in energy, protein and fibre, and can be fed as a supplement in dry standing pastures or as an ingredient in feedlot rations. Global cotton seed production can potentially provide protein requirements for half a billion people and many billions of other animalsiv.

13 AUSTRALIAN GROWN COTTON SUSTAINABILITY REPORT // 2014
STRENGTHENING LINKAGES WITH THE SUPPLY CHAINCotton Australia, with CRDC and the Australian Cotton Shippers Association, is collaborating with international and domestic brand owners and retailers to encourage demand for Australian cotton in the production of their fabrics. Cotton Australia is driving this demand by becoming active participants in Cotton LEADSTM and the Better Cotton Initiative. Both programs provide manufacturers, brands and retailers with a reliable cotton supply chain and confidence that their raw material is responsibly produced and identified.
// Cotton LEADSTM is Cotton Australia’s partnership with the US cotton industry (The Cotton Foundation) to promote the use of responsibly produced cotton, by providing evidence of best practice cotton production and traceability in the supply chain. Cotton LEADSTM has more than 200 global partners including Brooks Brothers, Tesco, Fruit of the Loom, TexHong, Shanghai Imagine Home Textiles and Datsun Weaving (more information is available at www.cottonleads.org).
// The Better Cotton Initiative (BCI) is a not-for-profit organisation based in Switzerland, stewarding the global standards for ‘better cotton’, and bringing together cotton’s complex supply chain, from the farmers to the retailers. BCI exists to make global cotton production better for the people who produce it, better for the environment it grows in and better for the sector’s future, by developing ‘better cotton’ as a sustainable mainstream commodity. BCI partner organisations include Adidas, Gap Inc, H&M, IKEA, Oxfam, and the World Wide Fund for Nature (WWF) (more information is available at www.bettercotton.org).
Australian Cotton Towel Range DRI GLO.

myBMP: FARM MANAGEMENT SYSTEM www.myBMP.com.au
myBMP is the cotton industry’s voluntary farm and environmental management system for growers to improve on-farm production. myBMP ensures that the Australian cotton industry produces economically, socially and environmentally sustainable cotton by providing:
// a central access point to the industry’s best practice standards.
// technical support.
// self-assessment mechanisms.
// practical tools.
// auditing processes.
myBMP is also the industry’s assurance mechanism. myBMP helps the industry manage risks and assures the community that the industry is committed to best management practice.
Currently there are 315 farms, producing 45 percent of Australia’s cotton, participating in the myBMP Program and 45 of these farms have completed an external assurance audit for certification to the myBMP standard. In 2013 around eight percent of cotton bales were produced on certified myBMP farms, and the number of bales shipped in 2014 has increased significantly and is expected to rise further as 2014 shipments continue (Figure 7).
By the end of 2014, the Australian cotton industry aims to have 60 percent of the industry utilising myBMP. The targets for 2016 are:
// 100 percent of cotton growers complete level 1 myBMP accreditation.
// 40 percent of cotton growers complete level 2 myBMP accreditation.
// 10 percent of cotton growers complete myBMP certification.
Figure 7. myBMP certified cotton bales shipped to customers
2006 2007 2008 2009 2010 20122011 2013 2014
Bales
0
10000
20000
30000
40000
50000
Source: Cotton Australia

15 AUSTRALIAN GROWN COTTON SUSTAINABILITY REPORT // 2014
The Australian cotton industry is made up of many diverse individuals and organisations. The Australian Cotton Industry Council (www.acic.org.au) is a whole of industry forum for sharing information, discussing strategies and promoting cooperation between industry organisations. It includes growers, researchers, ginners, classers, marketers, consulting agronomists, chemical and seed suppliers.
Cotton Australia (www.cottonaustralia.com.au) is the peak body for Australian cotton growers. Cotton Australia is a not for profit company limited by guarantee. Cotton Australia supports a regional cotton growers association in each region where cotton is produced. Cotton Australia strives to foster a world class agricultural industry that’s sustainable, valued for its economic and social contributions and produces very high quality cotton in demand around the globe. Cotton Australia provides a united voice for cotton growers across research and development, stewardship, natural resources management, biosecurity, and community engagement. This is achieved through policy and advocacy, education, communication and grower services.
Cotton Australia’s head office is in Sydney and has regional staff in Narrabri, Toowoomba and many other regional locations where cotton is grown. Cotton Australia is funded by a voluntary levy of $1.50 on each bale of cotton produced by growers. Cotton Australia’s strategic plan and annual report (containing further details on, corporate operations, employees, and financial statements) are available on the website www.cottonaustralia.com.au.
Cotton Australia’s advocacy work often revolves around membership with other like-minded organisations in the agricultural sector. Together, issues are debated and policies and submissions are developed and presented to government. These organisations include The National Farmers’ Federation, Queensland Farmers’ Federation, National Irrigators’ and NSW Irrigators’ Council. The CRDC is a member of the Council of Rural Research and Development Corporations. Both organisations are members of the Australian Cotton Industry Council.
OUR ORGANISATIONAL PROFILE

16 AUSTRALIAN GROWN COTTON SUSTAINABILITY REPORT // 2014
Cotton growers also pay a compulsory research and development levy ($2.25 per bale), which is matched by the Australian Government and managed by the Cotton Research and Development Corporation (CRDC) (www.crdc.com.au). CRDC’s purpose is to enhance the performance of the Australian cotton industry and community through investing in research and development, and its application. CRDC’s 2013 – 2018 Strategic Plan can be found at www.crdc.com.au
The CRDC head office is in Narrabri, NSW – the heart of one of Australia’s major cotton growing regions. CRDC is a research and development partnership between the Australian Government and the Australian cotton industry. Further details on corporate operations, employment arrangements, research activities and financial statements can be found in the annual report, which is tabled in Federal Parliament and is available on the website www.crdc.com.au
Cotton Australia and the CRDC have established a joint environmental working group to oversee the cotton industry’s sustainability report.
AUSTRALIAN COTTON INDUSTRY COUNCIL
CRDC COTTON AUSTRALIA
STAKEHOLDERS
JOINT ENVIRONMENTAL WORKING GROUP

17 AUSTRALIAN GROWN COTTON SUSTAINABILITY REPORT // 2014
OUR ACTIVITIES
ECONOMIC CATEGORYThe economic aspects considered for this report are cotton production statistics, crop yield and quality, and its economic value to the economy.
PRODUCTION STATISTICS AREA OF COTTON PLANTEDThe highly variable Australian climate has a significant impact on the cotton area planted and these fluctuations are shown for both irrigated and dryland cotton between 1990 and 2014 in Figure 8. For the last 10 years, on average, 84 percent of the Australian crop area was irrigated, while 16 percent was dryland. The irrigated planted area in 2013-14 was 382,850ha and the dryland area was 28,360ha, which was only seven percent of the total area due to drought conditions and the lack of any significant seasonal rainfall. The irrigated area peaked at 452,830ha in 2011-12, while it was at a record low in 2007-08 during the millennium drought.
Figure 8 The area planted to irrigated and dryland cotton in Australia 1990-2014
100,000
50,000
500,000
450,000
400,000
350,000
300,000
250,000
200,000
150,000
1990
-91
1991
-92
1992
-93
1993
-94
1994
-95
1995
-96
1996
-97
1997
-98
1998
-99
1999
-00
2000
-01
2001
-02
2002
-03
2003
-04
2004
-05
2005
-06
2006
-07
2007
-08
2008
-09
2009
-10
2010
-11
2011
-12
2012
-13
2013
-14
Dryland area (ha)
Irrigated area (ha)
HECT
ARES
Source: Cotton Australia

18 AUSTRALIAN GROWN COTTON SUSTAINABILITY REPORT // 2014
PRODUCTION STATISTICS CROP YIELDFor the past 10 years, the average irrigated crop yield was 9.60 bales/ha and for dryland cotton was 3.69 bales/ha (Figure 9). The irrigated yield for 2013-14 is estimated to be 9.96 bales/ha, while for dryland cotton yields are forecast to be around 1.93 bales/ha. Average irrigated crop yields exceeded 10 bales/ha for the first time in 2008-09 and reached record levels in 2012-13 at 10.73 bales/ha.
Figure 9 The yield of irrigated and dryland cotton 1990-2014
2
4
6
8
10
12
500
1000
1500
2000
2500
1990
-91
1991
-92
1992
-93
1993
-94
1994
-95
1995
-96
1996
-97
1997
-98
1998
-99
1999
-00
2000
-01
2001
-02
2002
-03
2003
-04
2004
-05
2005
-06
2006
-07
2007
-08
2008
-09
2009
-10
2010
-11
2011
-12
2012
-13
2013
-14
Dryland
Irrigated
bales
/ ha kg / ha
Source: Cotton Australia
Australian cotton bales ready for export. A bale of cotton lint weighs 227 kg. Each bale is tagged so it can be traced through the supply chain.

19 AUSTRALIAN GROWN COTTON SUSTAINABILITY REPORT // 2014
PRODUCTION STATISTICS TOTAL AMOUNT OF COTTON PRODUCEDFigure 10 shows the total amount of cotton produced in Australia between 1990 and 2014. For the past 10 years the average annual amount of cotton lint produced in Australia was 641,806 metric tonnes (2,827,338 bales). Production reached a record high in 2011-12 at 1,215,870 metric tonnes (5,356,254 bales) and a low in 2007-08 at 136,831 metric tonnes (602,780 bales).
Figure 10 The total amount of cotton produced in Australia
800,000
1,000,000
1,200,000
140.000
600,000
400,000
200,000
1990
-91
1991
-92
1992
-93
1993
-94
1994
-95
1995
-96
1996
-97
1997
-98
1998
-99
1999
-00
2000
-01
2001
-02
2002
-03
2003
-04
2004
-05
2005
-06
2006
-07
2007
-08
2008
-09
2009
-10
2010
-11
2011
-12
2012
-13
2013
-14
Dryland
Irrigated
COTT
ON PR
ODUC
TION
(MET
RIC T
ONNE
S)
Source: Cotton Australia
PRODUCTION STATISTICS FIBRE QUALITYAustralian cotton is viewed worldwide as an excellent quality fibre. It is usually purchased, primarily in the Asia-Pacific region, with the intention of producing high quality combed, ring spun yarns for use in the woven and knitted apparel sector. Fibre quality is affected by a large number of interacting factors including variety, seasonal conditions such as temperature and rain, crop management, harvesting and ginning. The industry has produced a number of resources to help farmers produce high quality cotton such as the FIBREpak manualviii.
There are a number of characteristics that make up the cotton quality grade, but the most important are: length, strength, trash content, micronaire (a measure of fibre maturity and thickness) and colour. Annual data on the fibre quality parameters of the Australian cotton harvest can be found on the Australian Cotton Shippers site (www.cottonshippers.com.au).
Figure 11 shows the trend in the Australian cotton crop fibre staple length. The market base length is 1 inch 1/8”, which a significant proportion of Australia’s cotton exceeds consistently. In 2006, 57 percent of Australia’s cotton had a fibre length of 1 inch and 5/32” or more, which had risen to 97 percent by 2013.

20 AUSTRALIAN GROWN COTTON SUSTAINABILITY REPORT // 2014
2006
<1-3/32” (<27.7mm) 1-3/32” (27.7mm) 1-1/8” (28.4mm) 1-5/32” +(28.3mm+)
%
0
10
20
30
40
50
60
70
80
90
100
2007 2008 2009 2010 2011 2012 2013
Figure 11 The trend in Australian cotton crop fibre staple length 2006-2013.
Fibre length has increased significantly.
Source: Australian Cotton Shippers Association
Ongoing strategies to drive the industry’s competitive advantage include:
// Development of premium quality varieties.
// Research to better understand management practices for fibre quality.
// Improved cotton ginning processes.
// Reducing contamination.
// Development of new technologies to facilitate objective definition of fibre characteristics.
// Partnerships including the Cotton LEADS program and Better Cotton Initiative.
THE WORD COTTON IS DERIVED FROM ARABIC WORDS
THAT MEANT ‘FINE TEXTILE’. COTTON IS A NATURAL FIBRE
GROWING ON A PLANT AND IS RELATED TO
HIBISCUS SPECIES.

21 AUSTRALIAN GROWN COTTON SUSTAINABILITY REPORT // 2014
PRODUCTION STATISTICS GROWER NUMBERSThe number of cotton farmers varies each year as a consequence of water availability and comparative crop prices of cotton and alternative crops such as sorghum and wheat. Figure 12 shows the number of cotton farmers in Australia is usually between 1200 to 1500. The Darling Downs region has the largest number of cotton farmers (300 to 400); however the Gwydir, Macquarie, Namoi and Border Rivers regions produce cotton from a smaller number of much larger farms. In the last few years many new farmers have entered the industry for the first time in the Murrumbidgee region of Southern NSW and some farmers in northern Victoria are also trialling cotton production.
Figure 12 The number of cotton farm units 2003-2014
200
400
600
800
1000
1200
1400
1600
1800
200
2003
-04
2004
-05
2005
-06
2006
-07
2007
-08
2008
-09
2009
-10
2010
-11
2011
-12
2012
-13
2013
-14
Numb
er o
f far
ms
Source: Cotton Australia
22 AUSTRALIAN GROWN COTTON SUSTAINABILITY REPORT // 2014
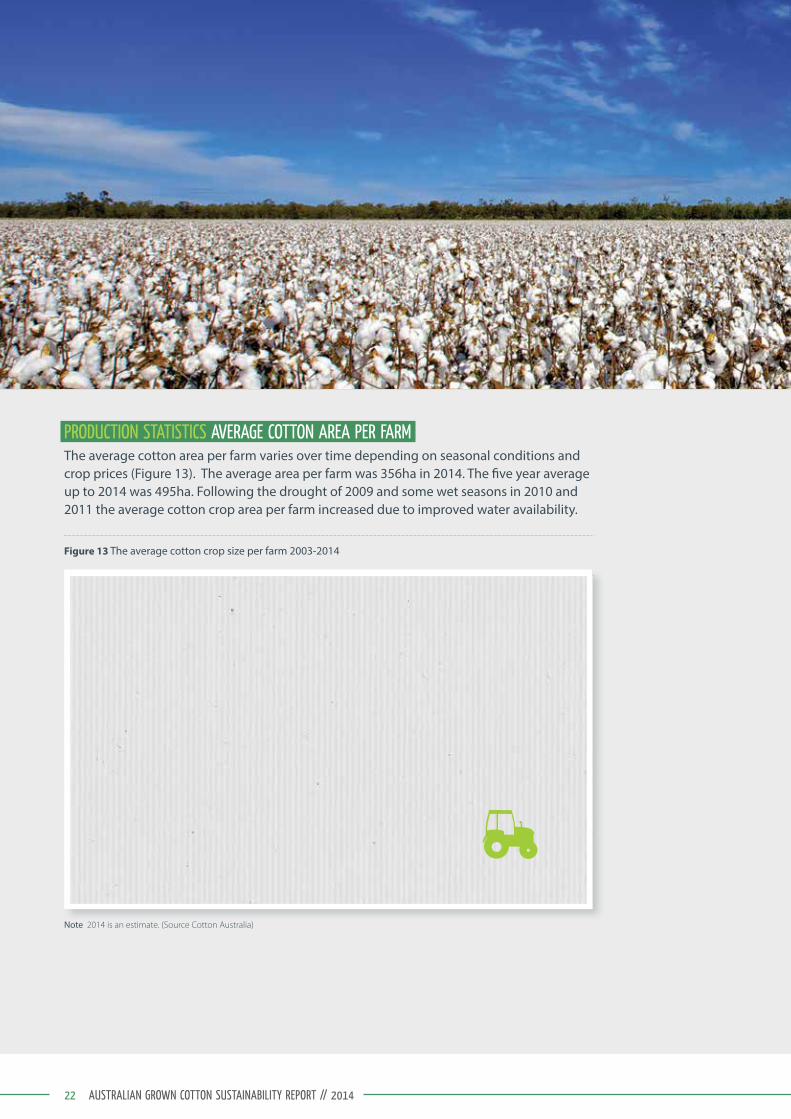
PRODUCTION STATISTICS AVERAGE COTTON AREA PER FARMThe average cotton area per farm varies over time depending on seasonal conditions and crop prices (Figure 13). The average area per farm was 356ha in 2014. The five year average up to 2014 was 495ha. Following the drought of 2009 and some wet seasons in 2010 and 2011 the average cotton crop area per farm increased due to improved water availability.
Figure 13 The average cotton crop size per farm 2003-2014
100
200
300
400
500
600
700
800
900
2003
-04
2004
-05
2005
-06
2006
-07
2007
-08
2008
-09
2009
-10
2010
-11
2011
-12
2012
-13
2013
-14
AVER
AGE C
ROP S
IZE PE
R FA
RM (H
A)
Note 2014 is an estimate. (Source Cotton Australia)

23 AUSTRALIAN GROWN COTTON SUSTAINABILITY REPORT // 2014
PRODUCTION STATISTICS COTTON PRICEAustralian cotton prices vary due to the world cotton price (denominated in US dollars) and the Australian-US dollar exchange rate. Taking into account the world cotton price and currency exchange rates, Figure 14 shows the average price per bale of cotton received by farmers since 1990.
Prices have ranged from $300 to $600/bale. The all-time high was $758/bale in 1995 while the all-time low was $233/bale in 1986. Prices were also very high in 2011 due to a short term shortage of cotton in exportable locations. The average price for the last five years has been $396/bale. For the last two years prices have hovered around $440/bale.
Figure 14 The average price received per bale of cotton 1990 and 2014
0
100
200
300
400
500
600
700
1990
-91
472
372 46
1
472
577
544
458 49
4
479
407
503
393
497
354
485
376
368 38
4 392 42
2
664
451
431 45
0
1991
-92
1992
-93
1993
-94
1994
-95
1995
-96
1996
-97
1997
-98
1998
-99
1999
-00
2000
-01
2001
-02
2002
-03
2003
-04
2004
-05
2005
-06
2006
-07
2007
-08
2008
-09
2009
-10
2010
-11
2011
-12
2012
-13
2013
-14
$AUD
BAL
E PRIC
E
Source: data from ABARES, 2014 estimate

24 AUSTRALIAN GROWN COTTON SUSTAINABILITY REPORT // 2014
PRODUCTION STATISTICS GROSS VALUE OF COTTON LINTThe gross value of cotton lint produced in Australia since 1990 is shown in Figure 15. It has steadily increased with the exception of drought years. In 2007-08 production was at a record low $254 million and peaked again in 2011-12 at $2.9 billion. The forecast gross value for the 2014 crop is $1.9 billion, which means the five year average between 2009 and 2014 is $2 billion. These figures exclude cotton seed sales, which is forecast at $255 million in 2014.
Figure 15 The gross value of cotton lint production
1990
-91
1991
-92
1992
-93
1993
-94
1994
-95
1995
-96
1996
-97
1997
-98
1998
-99
1999
-00
2000
-01
2001
-02
2002
-03
2003
-04
2004
-05
2005
-06
2006
-07
2007
-08
2008
-09
2009
-10
2010
-11
2011
-12
2012
-13
2013
-14
$ 500,000,000
$0
$3,000,000,000
$2,500,000,000
$2,000,000,000
$1,500,000,000
$1,000,000,000
DROUGHT DROUGHT DROUGHT
Source: Data from ABARES, 2014 estimate
Round module of picked cotton ready for transport, Moree, NSW

25 AUSTRALIAN GROWN COTTON SUSTAINABILITY REPORT // 2014
ECONOMIC VALUE REGIONAL GROSS VALUE OF COTTON PRODUCTIONCotton is a major commodity and driver of the gross value of the total agricultural production in regions where it is grown. Table 1 shows the value of cotton production as a percentage of total agricultural production value in most of the local government regions in NSW and QLD where cotton is grown. In Queensland, a significant percentage of the regional gross value of agricultural income is from cotton: Emerald (24-38 percent), Balonne (32-58 percent), and Waggamba (30-46 percent). In NSW, Moree, Narrabri, Warren and Bourke Shires have had more than 50 percent their regional gross value of agricultural production from cotton, although this proportion varies depending on water availability for irrigation.
Table 1 The value of cotton production as a percentage of total agricultural production value in most local
government regions in NSW and Queensland where cotton is grown
Local Government Area
19971 % of agricultural
gross value production ($)
20012
% of agricultural gross value
production ($)
20063
% of agricultural gross value
production ($)
20114
% of agricultural gross value
production ($)
QUEENSLAND
Emerald 37.5 23.6 22.5 29.2
Bananna 22.2 13.7 10.4 6.2
Balonne 53.1 59.4 32.6 58.1
Wambo 29 25.9 19.4 38
Dalby 49.4 n/a n/a 38.1
Jondaryran 27.3 18.7 12.5 35
Pittsworth 44.2 44 20.1 17.8
Chinchilla 8 4.8 2.7 16.9
Milmerran 35.8 20.5 15 18.1
Waggamba 30 35.2 34.5 45.6
The Darling Downs n/a n/a 10.9 20.4
NEW SOUTH WALES
Moree 55 62.6 44.9 52.9
Narrabri 60.2 63.8 52.7 56.6
Walgett 28.6 41.8 23 25.9
Gunnedah 33 26.8 24.8 30
Narromine 26.1 37.5 18.4 16.6
Warren 49.7 57.3 27.4 20.9
Bourke 66.4 61.7 34.4 59.5
Carathool 0.6 n/a 2.7 11.6
Lachlan n/a n/a 2.1 1.6
Source: Figures compiled from data supplied by ABS from 1997 ABS Agricultural Census and 2001 Census1, 2; ABS agricultural census 20063,
ABS 2011-12 Agricultural Resource Management Survey 20114). (Note Qld LGA changes by 2011.
Warren, New South Wales

26 AUSTRALIAN GROWN COTTON SUSTAINABILITY REPORT // 2014
AUSTRALIA’S SHARE OF THE GLOBAL LINT TRADE
Australia produces around three percent of the world’s cotton but is the third largest exporter (behind the US and India - Figure 2). Over 99 percent of Australia’s cotton is exported. In an average year, Australia’s cotton farmers produce enough cotton to clothe 500 million people.
AUSTRALIAN CUSTOMERSThe major buyers of Australian cotton are currently China (68 percent), Indonesia, Thailand, South Korea, Bangladesh and Japan. Australia has a reputation for producing high quality cotton. Australian cotton is marketed under a competitive market system by several major cotton merchants. Cotton growers use a sophisticated range of risk management and price hedging strategies to manage price and currency fluctuations, and there is no government intervention in the growing or marketing of the crop.
PROPORTION OF THE GLOBAL TEXTILE MARKETCotton’s proportion of the global textile market is falling and is currently around 31 percent. This has fallen from 50 percent in the 1980s as shown in Figure 1.

27 AUSTRALIAN GROWN COTTON SUSTAINABILITY REPORT // 2014
PROFITABILITYFarmers grow cotton because they believe it is the most profitable crop per unit area of land and water used. Boyce Chartered Accountants have been producing an Australian cotton crop comparative analysis since 1989 to track the economic performance of cotton farmers.
In it’s 2013 analysis Boyce found the top 20 percent of farmers farm net profit was $1535/ha, while for the bottom 20 percent of farmers recorded a net loss of $407/ha. It found expenses per hectare continue to climb, in particular fertiliser and fuel/oil. The average grower in the sample had a profit of $410/ha after interest with growing expenses of $3808/ha, plus $389/ha in interest and bank charges. Based on these figures yields of 9.8 bales per hectare are required to cover expenses. A full report on the 2013 crop can be found on the Boyce Chartered Accountants website www.boyceca.com
In terms of profitability per megalitre of irrigation water returns, irrigators on average require 6.5 ML/ha of irrigation water, for a 10 bales/ha crop at $450/bale, the return is $692/ML. This has been considerably higher than returns for other broad acre irrigated crops.
Figure 16 Comparison of net farm profit (loss) for the average and top 20 percent of farmers
-$2,000
-$1,500
-$1,000
-$500
$0
$500
$1,000
$1,500
$2,000
$2,500
$3,000
1997 1998 1999 2000 2001 2002 2003 2004 2005 2006 2007 2008 2009 2010 2011 2012 2013
Average Top 20%
Source: Boyce and CRDC Australian Cotton Comparative Analysis 2013

28 AUSTRALIAN GROWN COTTON SUSTAINABILITY REPORT // 2014
ENVIRONMENTAL CATEGORYThe material aspects within the environmental category are soil health, water use, groundwater, biodiversity, riparian land management, integrated pest management, pesticide use and greenhouse gas emissions.
SOIL HEALTHAustralian soils are often described as ancient, highly weathered and infertile. Cotton is grown on floodplains where the soils are younger and more fertile than most Australian soils. The major soil types on which cotton is grown are grey, brown and black Vertosols (around 75 percent), that are naturally fertile, have high clay content and strong shrink-swell capacities.
The cotton industry has invested in a substantial body of soil science research over the past two decades, which was recently summarised by researchers from The University of Sydneyix. The review covered soil mapping and characterisation, soil physical condition, salinity and sodicity, soil chemical fertility and soil carbon and biota.
SOIL HEALTH ORGANIC CARBON PERCENTAGEThe cotton industry conducted three medium-term farming systems trials from 1993 to 2005 at Warren NSW, Merah North NSW and Warra Qld. Research has found 50 to 70 tonnes of soil organic carbon per hectare in soils where cotton is grown. A review of cotton rotation experiments between 1970 to 2006 found soil organic carbon in most locations has decreased with time despite frequent sowing of rotation crops . It concluded that two to three kg/m2 per year of dry matter needs to be returned to the soil to maintain or increase soil organic carbon, whereas most cotton based cropping systems typically return 0.8 to 1.2 kg/m2 per year.
Cotton farm wetland, Boggabri, New South Wales.

29 AUSTRALIAN GROWN COTTON SUSTAINABILITY REPORT // 2014
In Figure 17, an example is shown in 2(b), where a decrease in carbon levels between 1994 and 2001 was followed by an increase. The cropping sequence from 2000 to 2002 included irrigated and fertilised wheat, which was in turn followed by irrigated sorghum. These cereal crops returned 2.5 kg/m2 of organic matter and the cotton return was 0.3 kg/m2. Other research on rotations with wheat, faba beans and vetch has found soil organic carbon increased throughout a 10-year monitoring period where stubble was retainedxi .
To improve soil carbon management, the industry:
// Conducts soil carbon workshops for farmers and advisors.
// Has commissioned new research at The University of New England on soil biology.
// Continues its ongoing R&D investments on managing soil carbon.
Figure 17 Variation in soil organic carbon in the 0-0.6m depth with time in irrigated and dryland cotton farms in
NSW and QLD
(c) Wee Waa, NSW (irrigated)
SOIL
ORGA
NIC C
ARBO
N (k
g/M2 )
(d) Warra, Qld (dryland)
(a) Warren, NSW (irrigated) (b) Merah North, NSW
19920
2
4
6
8
19
12
14
16
0
2
4
6
8
19
12
14
16
1994 1996 1998 2000 1994 1996 1998 2000 2002 2004 2006
Source: Hulugalle and Scott 2008

30 AUSTRALIAN GROWN COTTON SUSTAINABILITY REPORT // 2014
SOIL HEALTH PRACTICE CHANGEThe main changes in management of cotton soils over the past 30 years have been an overall reduction in tillage, widespread adoption of controlled traffic-permanent bed farming systems and increased application of nutrients in response to higher crop yields and the need for fertiliser replacement of nutrients.
Crop rotations vary considerably due to regional climatic and soil type differences as well as the prevailing price of cotton and alternative crops. Most farmers (75 percent) produce two or less cotton crops before breaking with an alternate crop or fallowxii. Wheat is the most common rotation with cotton. Other rotation crops (in declining order of use) are chickpea, sorghum, barley, maize, mungbean, faba bean, canola, soybean, vetch, sunflower, French white millet, canary seed and lab lab.
In the 2011 grower survey 58 percent of farmers reported a decrease in cultivation over the previous five years, while 34 percent said it was similar, and eight percent reported it had increased while 97 percent of farmers incorporated their crop stubble rather than burn itxiii.
The number of machinery passes for a crop varies considerably, from one to 10 passes. There were on average five workings for back-to-back cotton and four workings for cotton following a rotation or fallow. In total 52 percent of farmers used soil testing to aid fertiliser decisions and 39 percent used manures or composts in their nutrition programxiv. Controlled traffic farming systems were in use on over 90 percent of farms to reduce soil compaction and to retain permanent bedsxv.
Other practice changes include the use of precision agriculture and associated technologies such as remote sensing, geographic information systems, yield mapping, variable rate applications and soil sensors such as electromagnetic induction.
Soil pit field days allow farmers to discuss soil structure.

31 AUSTRALIAN GROWN COTTON SUSTAINABILITY REPORT // 2014
SOIL HEALTH SALINITYSoil salinity is the presence of soluble salts in the landscape and soil solution. Soil salinisation is a recognised risk for irrigated cotton as a consequence of excessive deep drainage which can create rising water tables. Irrigation-induced salinity is not a widespread problemxvi. However it remains a risk, so monitoring is ongoing. The Cotton CRC, CRDC, Natural Heritage Trust and The University of Sydney worked collectively to map the soils where cotton is grown in Australia as part of a series of projects titled “Understanding the salinity threat in the irrigated cotton growing areas of Australia.” Biophysical data is available in seven irrigated cotton growing areas (Toobeah QLD, Ashley, Wee Waa, Gunnedah, Trangie, Warren and Bourke in NSW)xvii.
At the farm scale, farmers’ soil tests can be used to monitor salinity trends while many farmers now undertake electromagnetic (EM) surveys to improve their irrigation and soil management.
In-field deep drainage has been the focus of much research which has found typical figures have reduced significantly to on average 100 to 200mm/year with a very large range (zero to 900mm/year)xviii. This 2013 review reported that deep drainage is now better managed than in the past. Irrigation management needs to balance leaching requirements and deep drainage to minimise potential root zone salinity as well as off-site salinity impactsxix.
CSIRO lysimeter research at Narrabri investigating deep drainage and soil solute movement.

32 AUSTRALIAN GROWN COTTON SUSTAINABILITY REPORT // 2014
SOIL HEALTH SODICITYSoil sodicity refers to the proportion of sodium cations held on the clay particles surface. Sodicity is an inherent property of many Australian soils, and sodic soils occupy 23 percent of the total area of Australiaxx. Much of Australia’s cotton crop is grown on soils with high subsoil sodicity and some soils also have surface layers that are considered sodic (exchangeable sodium percentage (ESP) greater than six). High sodium levels cause soil dispersion and hence create soil structure problems and change the chemistry of the soil solution which alters the availability of nutrients to the plant. As the level of sodium in the soil increases, there is a corresponding decrease in the uptake of phosphorus and potassium by the cotton plant, with these nutrients reaching deficient levels as the crop maturesxxi. The amelioration required to reduce sodicity impacts continues to be the focus of current industry funded research projects in the cotton and grains industries.
1.5
1.2
0.9
0.6
0.3
0
Dept
h (m
)
< 6
< 10
< 15
ESP %
< 20
< 25
> 25
The spatial distribution of exchangeable sodium percentage down a soil profile near Moree, NSW. In this case higher
sodicity levels are apparent below 60cmxxii .
The major soil types on which cotton is grown are grey, brown and black Vertosols (around 75 percent), that are naturally fertile, have high clay content and strong shrink-swell capacities.

33 AUSTRALIAN GROWN COTTON SUSTAINABILITY REPORT // 2014
WATER USE EFFICIENCY AND PRODUCTIVITYWater is critical to the cotton industry to maximise crop yields and fibre quality. While dryland crops are successful in some regions and seasons, irrigation enables high-yielding cotton to be grown in a wider range of regions more of the time. Increasingly there is more competition for water due to the rising demand from other crops, mining, urban communities and environmental flows. It is imperative farmers continue to strive to improve water use efficiency and productivity.
Agriculture is a major user of water and the cotton industry uses about 10 to 15 percent (1500-2000 gigalitres (GL)) of the water used for irrigation in Australia depending on seasonal conditions. This water is used according to licences and water sharing plans issued by state governments. The water reform process has reduced water allocations available for irrigation, particularly in the Murray Darling Basin.
The majority (at least 80 percent) of the Australian cotton area is irrigated using gravity surface irrigation systems. A recent scientific review found on average over 23 years cotton crops utilise six to seven megalitres (ML) per hectare of irrigation water depending on the amount of seasonal rain received. The seasonal evapotranspiration of surface irrigated crops averaged 729mm over this periodxxiii .

34 AUSTRALIAN GROWN COTTON SUSTAINABILITY REPORT // 2014
WATER USE IRRIGATION WATER USE INDEXThe Irrigation Water Use Index (IWUI) is one way to measure water productivity. The IWUI is the amount of cotton produced per megalitre of irrigation water applied. However, it can vary from year to year depending on the amount of rainfall, which reduces irrigation needs.
Figure 18 shows the lint yield per hectare of cotton has been increasing, while at the same time the average total amount of irrigation water applied has decreased. Despite both wet and dry seasons during this time the irrigation water use index has increased significantly between 2001 and 2012.
Figure 18 Irrigated cotton yields and irrigation water applied in Australia 2001-2012
0.00
2.00
4.00
6.00
8.00
10.00
12.00
0.00
2.00
4.00
6.00
8.00
10.00
12.00
Cotto
n yiel
d (ba
les/h
a)
Water applied (ML/ha)
Cotton yieldWater applied
2000
-01
2001
-02
2002
-03
2003
-04
2004
-05
2005
-06
2006
-07
2007
-08
2008
-09
2009
-10
2010
-11
2011
-12
Source: Roth et al 2013
WATER USE GROSS PRODUCTION WATER USE INDEXThe water use efficiency and productivity of the Australian cotton industry has been measured as part of several studies in the past 20 years. The Gross Production Water Use Index (GPWUI) is the more meaningful water use index for comparing water use between farms or seasons. The GPWUI includes irrigation, rainfall and water stored in the soil and is the best measure for long term seasonal comparisons.
There is an improving trend in this index with the average GPWUI showing a 40 percent improvement over the decade between 2003 (0.79/bales/ML) and 2010 (1.14 bales/ML). This has been achieved by both yield increases and more efficient water management systems. The whole farm irrigation efficiency index improved from 57 percent to 70 percent, while the crop water use index is above three kg/mm/ha, high by international standards xxiv.
The established industry benchmarks indicate that Australian cotton irrigators using conventional furrow surface irrigation systems are aiming to produce greater than 1.1 bales per ML (greater than 250 kg/ML) of the total water used (total water includes: irrigation water applied, in season rainfall and used soil moisture).

35 AUSTRALIAN GROWN COTTON SUSTAINABILITY REPORT // 2014
WATER USE WHOLE FARM IRRIGATION EFFICIENCYWhole Farm Irrigation Efficiency (WFIE) reflects the irrigation system efficiencies. That is, it shows the amount of irrigation water that was used by the plant as a percentage of total irrigation water inputs to the farm. Therefore, inefficiencies in an irrigation system will result in a percentage of total water not being used by the crop.
During the late 1990s, the WFIE was around 57 percent, whereas in the latest industry-wide data collected 10 years later the WFIE rose to around 70 percent. This indicates that there is now less on-farm water losses and more of the water is used by the crop.
The losses are due to evaporation and seepage across the fields, conveyance system (channels) and on farm water storages and their proportions are shown in Figure 19xxv. This study and others have shown that storage evaporation is the largest water loss component on cotton farms.
Figure 19 Whole farm water balance
1% Trailwater
10% Field seepage
1% Channels
18% Storage dam
70% Crop use
Source: Wigginton 2012

36 AUSTRALIAN GROWN COTTON SUSTAINABILITY REPORT // 2014
WATER USE PRACTICE CHANGEThe improvements in water use are the result of significant practice change and plant breeding. Examples of farm management changes include:
// 70 percent of farmers use soil moisture probes, up from 40 percent in 2006 (highest of all agriculture industries in Australia).
// 96 percent of irrigators have improved their furrow irrigation system or changed to an alternate irrigation system.
// 49 percent of irrigators had made changes to the flow or size of their siphons.
// 35 percent have redesigned fields.
// Other practices include irrigating to deficits, better accounting of soil variations, changed bed shapes, using irrigation scheduling probes, furrow irrigation system optimisation evaluations, pump optimisation and reducing distribution losses (Figure 20)xxvi.
Figure 20 Water use practice change strategies applied by cotton farmers
56%49%
35% 34% 33%28%
23% 21%14%
17%
5% 5%
% O
F IRR
IGATO
R RE
SPON
DENT
S
0%
10%
20%
30%
40%
50%
60%
Main
taine
d �eld
slop
e
Chan
ged s
iphon
�ow/
size
Rede
signe
d �eld
, slop
e & le
ngth
Irriga
ted t
o de�
cits
Took
soil c
hara
cteris
tics i
nto a
ccou
nt
Chan
ged b
ed or
row
con�
gura
tion
Unde
rstoo
d unif
orm
ity di
stribu
tion
Met
ered
siph
ons
Unde
rtook
irrim
ate/
benc
hmar
king
Othe
r
Chan
ged t
o irri
gatio
n sys
tem N/A
Source: Cotton Grower Survey 2011
Farmers are changing to alternative irrigation systems such as centre pivots and lateral move systems and it is expected there will be an increasing number of these machines in the future. These systems achieve labour and water savings (about 30 percent) but have significantly higher energy costs associated with water pumping and machine operation. Drip irrigation has been extensively tried in a variety of locations where it has resulted in 20 to 30 percent water savings, but yields have been shown to both increase and decrease compared to surface irrigation systems. Drip irrigation systems have significantly higher capital and running costs compared to surface irrigation systems.

37 AUSTRALIAN GROWN COTTON SUSTAINABILITY REPORT // 2014
GROUNDWATER LEVELSGroundwater is an important resource underpinning a significant proportion of agricultural production and communities in regional Australia. It is estimated about 15 percent of the water used for cotton irrigation comes from groundwater sources, however this figure can be higher especially in dry years when there is a scarcity of surface water availability.
Groundwater is used in some specific locations where cotton is grown. These include the Murrumbidgee (Darlington Point to Hay), Lachlan (around Hillston), Macquarie Valley (near Narromine), Namoi Valley (Gunnedah to Burren Junction), Gwydir Valley (near Moree), Great Artesian Basin eastern recharge zone (near North Star) and the Condamine Alluvium on the Darling Downs.
Water sharing plans in Queensland and NSW determine an irrigator’s water allocation.
Groundwater levels have been monitored for many years and detailed data can be obtained from state government water management agencies.
In some regions groundwater levels have declined, while in others they have risen. For example in the Namoi Catchment there is about 45 years of groundwater data from 458 groundwater level records. One of these hydrographs is shown in Figure 21. It shows figures for Maules Creek near Boggabri, NSW (http://waterinfo.nsw.gov.au/pinneena/gw.shtml). While there was drawdown of the aquifer, favourable climatic condition and flooding resulted in good aquifer recovery from 2010 through 2012.
Figure 21 An example hydrograph of groundwater levels in the Namoi Valley
2171975-84 1985-94 1995-04 2005-06
222
227
232
Pipe 1 Slotted interval 21.300 - 24.300 mPipe 2 Slotted interval 39.600 - 42.600 m
Water quality monitoring forms an important part of industry stewardship of natural resources

38 AUSTRALIAN GROWN COTTON SUSTAINABILITY REPORT // 2014
Falling or rising groundwater levels and salinisation are management risks. The cotton industry is committed to investigating and monitoring its groundwater and has been participating and funding extensive groundwater research in recent years.
Many of these research projects were done by The University of NSW (UNSW). The projects sought to quantify the exchange of surface and sub-surface water in the Namoi Catchment, taking detailed measurements along the Namoi River reach between Gin’s Leap and Narrabri. A three-dimensional groundwater model was developed that provides insights on recharge pathways, groundwater contributions to river base flow, impact of irrigation extractions, and water quality responses to climatic variability. River and groundwater interactions were found to be highly dynamic and can change rapidly with the onset of pumping or during floodingxxvii.
There has been considerable community interest in the Condamine Alluvium groundwater levels. A report on temporal trends of groundwater levels in the Condamine Catchment between 2007 and 2013 shows the consistent trend of declining water levels, which occurred for several decades in most parts of the Condamine Catchment, but ceased in the late 2000s. In most bores in the Condamine Catchment, current groundwater levels are higher by 1.5 to 8.5 metres than the levels recorded in 2010. In other bores, groundwater levels stabilised since 2007. These trends are a cumulative result of enhanced recharge during summer 2007/08 and summer 2010/11 flood events and restrictions, on water pumping in the Condamine Groundwater Management Areaxxviii.
The UNSW research team installing groundwater quality monitoring equipment.

39 AUSTRALIAN GROWN COTTON SUSTAINABILITY REPORT // 2014
GROUNDWATER QUALITYMonitoring groundwater quality is essential for the sustainable use of the resource. In addition to monitoring by state governments the cotton industry has funded specific research and development projects for groundwater quality as well as projects to encourage farmers to monitor their own groundwater qualityxxix. The proportion of farmers monitoring groundwater quality has increased significantly since 2006 (Table 2).
Table 2 Results from cotton grower surveys in 2006 and 2011 in relation to irrigators monitoring groundwater quality
Year 2006 2011
Irrigators monitoring groundwater
quality
20% 62%
MAULES CREEK 3D GEOLOGICAL MODELS: Understanding the 3D distribution of aquifer sediment types and their associated hydraulic properties is critical when coupling water chemistry and ecological processes to the movement of water movement through a catchment. 3D modelling will yield improved insights on recharge pathways, groundwater contributions to river baseflow, the impact of irrigation extraction, water quality characterisation and the possibility of examining climatic variability and change on groundwater availability.
Source: Cotton CRC
Research is studying water movement and quality in the Namoi Valley.

40 AUSTRALIAN GROWN COTTON SUSTAINABILITY REPORT // 2014
BIODIVERSITY AND RIPARIAN LANDThe cotton industry is located along riverine areas, floodplains and wetlands associated with major inland rivers of the northern Murray Darling Basin (MDB) and Fitzroy Basin. The northern MDB differs from the southern basin as it is hotter, has higher rates of evaporation, less predictable flow and more frequent and longer periods of very low flow. Rivers can also experience large flood events in response to the summer rainfall, which in turn have produced the fertile floodplains where cotton is grown.
The Murray Darling Basin Plan became law in November 2012. The Plan was the culmination of a lengthy period of refinements and iterations through consultations and negotiations with states, local governments, catchment management bodies, community, peak industry groups, and indigenous and environment groups. The Plan provides a coordinated approach to water use across the MDB’s four states and the Australian Capital Territory. It limits water use at environmentally sustainable levels by determining long-term average sustainable diversion limits (SDLs) for both surface water and groundwater resources.
BIODIVERSITY NATIVE VEGETATION AREA PER FARMFarms where cotton is grown have a variety of other land uses such as growing wheat and other crops, grazing cattle and sheep, native vegetation and billabongs.
The 2010-11 cotton grower survey found on average (across respondents from all regions) that cotton farms have approximately 40 percent of their land dedicated to cultivation (of which cotton accounted for approximately one third of the area in 2011) and 42 percent dedicated to native vegetation (Figure 22)xxx . This survey found fifteen percent of farmers had re-vegetated parts of their farm and on average 63 percent of cotton farms had riparian land with an average length of their river frontage of nine kilometres.
The 2013 cotton grower survey found cotton production accounted for 18 percent of the farm land area (16 percent irrigated, two percent dryland) and the native vegetation (ungrazed) was 5 percentxxxi. In this survey the average farm area was 3,494ha, consisting of 1,200ha irrigation area of which 657ha was planted to cotton, 1,721ha of dryland farming country, 1,618ha of grazing country and 363ha of native vegetation that was ungrazed.
There is considerable variation across growing regions as depicted in Figure 23, such as in Southern NSW, where farms had a larger proportion of the farm developed for irrigation.
Riparian land on a cotton farm near Theodore, Queensland

41 AUSTRALIAN GROWN COTTON SUSTAINABILITY REPORT // 2014
Figure 22 Land use mix across all cotton farms surveyed 2011
42% Native vegetation
15% Other
29% Balance of cultivation
14% Cotton
Figure 23 Average proportion of land use types on cotton growing farms surveyed by region 2013
0% 10% 20% 30% 40% 50% 60% 70% 80% 90% 100%
Central Qld
Darling Downs
Southern Qld
Northern NSW
Macquarie
Southern NSW
All regions
Balance of irrigation areaNative vegetation (ungrazed)
Dryland cotton 2012-13Grazing area
Irrigated cotton 2012-13Balance of dryland crop land
Note: Responses from Central QLD are predominately in the Dawson-Callide region. Farms in the Emerald Irrigation Area typically have the
majority of the farm used for cotton production and would differ from what is presented here. (Source 2013 Cotton Grower Survey).
UNE researchers monitoring native vegetation and carbon storage areas on cotton farms.

42 AUSTRALIAN GROWN COTTON SUSTAINABILITY REPORT // 2014
VEGETATION CONDITION AND CONNECTIVITYThe cotton industry is currently working to better understand the condition and connectivity of natural vegetation on cotton farms. Several studies have investigated wildlife and their habitats on cotton farms over the years and found, for example:
// More than 42,000 birds representing 45 species were found on farm water storages in the Gwydir Valleyxxxii.
// 153 bird species were found in natural vegetation in the Namoi Valleyxxxiii.
// 450 species of invertebrates have been recorded in one cotton field during the summerxxxiv.
Spotlighting activities enable families to learn more about the farm environment,the role of ecosystem services and local inhabitants such as bats, birds, and insects.
In a recent project for the Australian Government’s Caring for Country Program across three cotton growing valleys, 84 cotton farmers adopted activities contributing to the ongoing conservation and protection of biodiversity in 37,296ha of natural vegetation, controlling pigs, planting habitat for beneficial insects and enhancing habitat for native and bats.
Activities such as lady beetle, bird and bat workshops, spotlighting nights and a kayak wildlife discovery tour on the Namoi River attracted strong interest from local farming families and prompted a number of participants to install nesting boxes on their properties to enhance habit for native birds and bats.
ACTION ON THE GROUND – SNAPSHOT

43 AUSTRALIAN GROWN COTTON SUSTAINABILITY REPORT // 2014
INTEGRATED PEST MANAGEMENT PERCENTAGE OF GROWERS USING IPM PRACTICESManagement of insect pests has been a key challenge for cotton farmers in Australia. From the 1960s to 1990s, cotton farmers relied almost exclusively on regular application of insecticides that generally had a limited range of modes of action. This inevitably led to pesticide resistance in the pests, secondary pest outbreaks, destruction of natural enemies and increased risks from off farm movement and environmental concerns.
To address the need for better pest management options the cotton industry funded significant research and practice change projects, including training to encourage integrated pest management (IPM) adoption by farmers.
Each year the industry produces the Cotton Pest Management Guide (found at www.crdc.com.au). The Cotton Pest Management Guide contains the latest thresholds, products and techniques for managing specific pests.
IPM practices include:
// Use of transgenic crop traits in varieties.
// Soft chemistry options that preserve beneficial species.
// Use of crop spray thresholds.
// Insecticide Resistance Management Strategy.
// Trap and refuge crops.
// Regular insect crop scouting (twice weekly).
// Crop rotations.
// Weed control.
// Native vegetation.
Results from the Crop Consultants Australia survey of IPM practices for the 2012-13 season found a high adoption of IPM practices (Table 3).
Table 3 Adoption of IPM practices by cotton farmers
The industry’s recommended sampling strategies are used to monitor pest abundance and plant damage.
99%
The industry’s recommended thresholds are used when making pest control decisions. 86%
The IRMS is followed when selecting insecticides/miticides. 94%
Pesticide selection aims to conserve beneficial insects whenever possible. 93%
Beneficial species like spiders are used to control pests.

44 AUSTRALIAN GROWN COTTON SUSTAINABILITY REPORT // 2014
CROP PROCTECTION INSECTICIDE USEThe use of chemical insecticides in the cotton industry has declined from almost 1000 tonnes of active ingredient per annum to less than 50 tonnesxxxvii. The 2012-13 season is the sixth consecutive cotton season of strong downward trend in insecticide use, measured in terms of grams of active ingredient applied per hectare. Comparing the five year averages for the periods 2008-2013 and 1998-2003, the cotton industry has achieved an 89 percent reduction in insecticide use. A scientific overview of these pesticide use changes and water quality outcomes was published by The University of Sydney in 2013xxxviii.
Figure 24 Historical insecticide use on cotton
0
2000
4000
6000
8000
10000
12000
Insec
ticide
use
(g a.
i / h
a) Total Insecticide Use g a.i./ha
Insecticde Use in Bollgard (g a.i/ha)
Insecticide Use in Conventional (g a.i./ha)
Insecticide Use in Ingard (g a.i./ha)
0
500
1000
1500
2000
2500
3000
3500
4000
4500
1994
1995
1996
1997
1998
1999
2000
2001
2002
2003
2004
2005
2006
2007
2009
2010
2011
2012
2013
Herb
icide
usa
ge (g
a.i /
ha)
Non residual
Residual
Total (g a.i /ha)
93/9
4
94/9
5
95/9
6
96/9
7
97/9
8
98/9
9
99/0
0
01/0
2
02/0
3
03/0
4
04/0
5
05/0
6
06/0
7
07/0
8
08/0
9
09/1
0
10/1
1
11/1
2
12/1
3
Source: CCA 2013
Extensive research is conducted to reduce pesticide use and ensure safe stewardship of transgenic cotton

45 AUSTRALIAN GROWN COTTON SUSTAINABILITY REPORT // 2014
CROP PROCTECTION HERBICIDE USE Total herbicide usage in Australian cotton fields is shown in Figure 25 as well as the residual and non-residual herbicide use. Since 2004-05 there has been an increase in non-residual glyphosate based herbicides, which corresponds with the introduction of herbicide resistant traits in cotton varieties. Concurrently, the use of residual herbicides which have a higher environmental risk quotient such as trifluralin, diuron, fluometuron and prometryn has dropped significantly.
Figure 25 Herbicide usage in cotton.
0
2000
4000
6000
8000
10000
12000
Insec
ticide
use
(g a.
i / h
a) Total Insecticide Use g a.i./ha
Insecticde Use in Bollgard (g a.i/ha)
Insecticide Use in Conventional (g a.i./ha)
Insecticide Use in Ingard (g a.i./ha)
0
500
1000
1500
2000
2500
3000
3500
4000
4500
1994
1995
1996
1997
1998
1999
2000
2001
2002
2003
2004
2005
2006
2007
2009
2010
2011
2012
2013
Herb
icide
usa
ge (g
a.i /
ha)
Non residual
Residual
Total (g a.i /ha)
93/9
4
94/9
5
95/9
6
96/9
7
97/9
8
98/9
9
99/0
0
01/0
2
02/0
3
03/0
4
04/0
5
05/0
6
06/0
7
07/0
8
08/0
9
09/1
0
10/1
1
11/1
2
12/1
3
Source: CCA 2013

46 AUSTRALIAN GROWN COTTON SUSTAINABILITY REPORT // 2014
CROP PROTECTION USE OF GENETIC MODIFIED TRAITSOne of the most significant changes in the Australian cotton industry has been the introduction of genetically modified (GM) cotton. Australia’s first transgenic cotton, Ingard® was grown in 1996. It contained a single gene from the soil bacterium Bacillus thuringiensis (Bt) which expressed Cry1Ac protein that provided protection against the key insect caterpillar pests, Helicoverpa armigera and H. punctigera. In 2003, Bollgard II® technology varieties became available to cotton farmers for planting, which expressed two Bt proteins (Cry1Ac and Cry2Ab). Prior to the release of Bollgard II® there was a 30 percent cap in the transgenic crop area that could be planted, which was removed in 2004 and the uptake of the technology has steadily increased to 96.6 percent of the national crop in 2013-14 (Figure 26).
The first genetically modified herbicide-tolerant cotton was introduced after a period of research and cultivar development under regulatory permits in 2000. There has been a steady increase in the area planted to Roundup Ready® and its successor Roundup Ready Flex® as shown in Figure 26, up to 99 percent of the national crop in 2013-14.
The cotton industry has been funding research as part of its stewardship of GM crop trait use. The management of potential pest and weed resistance risks is ongoing and one of the highest priorities for the Australian cotton industry.
CSIRO Publishing has recently reported scientific reviews on:
// Integrated pest management in the transgenic eraxxxix.
// Changes in weed species since the introduction of glyphosate–resistance cottonxl.
// Managing glyphosate resistancexli.
// Pesticide use and water qualityxlii.
Figure 26 The proportion of cotton crop area planted to genetically modified traits
Source: Cotton Australia
2000
/01
2001
/02
2002
/03
2003
/04
2004
/05
2005
/06
2006
/07
2007
/08
2008
/09
2009
/10
2010
/11
2011
/12
2012
/13
2013
/14
PERC
ENT
OF CR
OP A
REA
Herbicide tolerant cotton Insect tolerant cotton Conventional cotton (non GM)
30
70
60
40
50
90
100
80
20
0
10

47 AUSTRALIAN GROWN COTTON SUSTAINABILITY REPORT // 2014
GREENHOUSE GAS EMISSIONS ENERGY USEEnergy use is a major priority for the cotton industry. Research has found that pumping water accounts for 50 to 75 percent of the energy costs on farms depending on the water source (Figure 27)xliii. Crop harvesting and managing crop fallows are also major uses of energy on cotton farms.
Figure 27 Average distribution of energy use for irrigated cotton production on-farm.
Source: National Centre for Engineering in Agriculture.The University of Southern Queensland
Table 4 shows the energy consumed on average was 10.9 GJ per ha at a cost of $310/ha, which had greenhouse gas emissions of 1,091 kg CO2e per ha xliv. Diesel is the major (80-90 percent) source of energy on cotton farms with the balance being electricity.
Table 4 Energy consumed, greenhouse gas emissions and cost of energy per hectare and per bale.
per Ha per bale
GJ OF ENERGY 10.9 1.18
kg C02e 1091 119
COST $ 310 34
(75% for bore irrigators)
6% In crop
24% Harvest
6% Post harvest
Pumping water accounts for half to three-quarters of all on-farm direct energy consumption
46% Irrigation
5% Planting
13% Fallow
Research is monitoring greenhouse gas emissions from irrigated cotton.
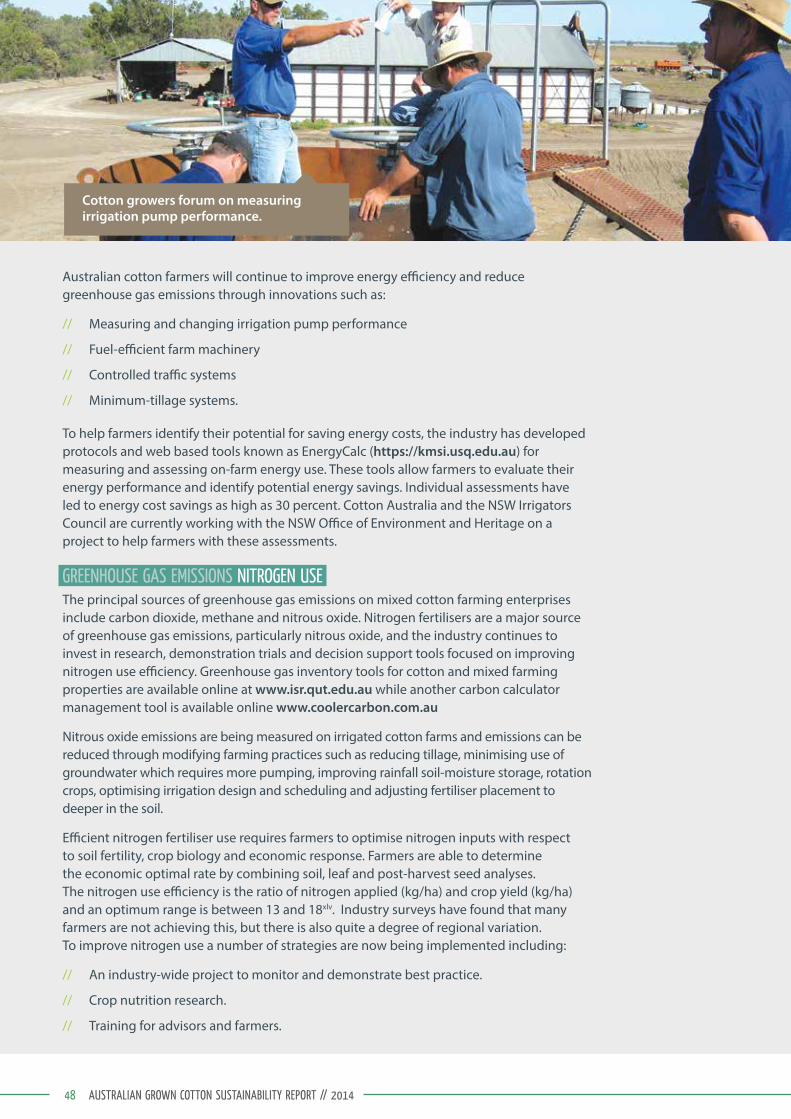
48 AUSTRALIAN GROWN COTTON SUSTAINABILITY REPORT // 2014
Australian cotton farmers will continue to improve energy efficiency and reduce greenhouse gas emissions through innovations such as:
// Measuring and changing irrigation pump performance
// Fuel-efficient farm machinery
// Controlled traffic systems
// Minimum-tillage systems.
To help farmers identify their potential for saving energy costs, the industry has developed protocols and web based tools known as EnergyCalc (https://kmsi.usq.edu.au) for measuring and assessing on-farm energy use. These tools allow farmers to evaluate their energy performance and identify potential energy savings. Individual assessments have led to energy cost savings as high as 30 percent. Cotton Australia and the NSW Irrigators Council are currently working with the NSW Office of Environment and Heritage on a project to help farmers with these assessments.
GREENHOUSE GAS EMISSIONS NITROGEN USEThe principal sources of greenhouse gas emissions on mixed cotton farming enterprises include carbon dioxide, methane and nitrous oxide. Nitrogen fertilisers are a major source of greenhouse gas emissions, particularly nitrous oxide, and the industry continues to invest in research, demonstration trials and decision support tools focused on improving nitrogen use efficiency. Greenhouse gas inventory tools for cotton and mixed farming properties are available online at www.isr.qut.edu.au while another carbon calculator management tool is available online www.coolercarbon.com.au
Nitrous oxide emissions are being measured on irrigated cotton farms and emissions can be reduced through modifying farming practices such as reducing tillage, minimising use of groundwater which requires more pumping, improving rainfall soil-moisture storage, rotation crops, optimising irrigation design and scheduling and adjusting fertiliser placement to deeper in the soil.
Efficient nitrogen fertiliser use requires farmers to optimise nitrogen inputs with respect to soil fertility, crop biology and economic response. Farmers are able to determine the economic optimal rate by combining soil, leaf and post-harvest seed analyses. The nitrogen use efficiency is the ratio of nitrogen applied (kg/ha) and crop yield (kg/ha) and an optimum range is between 13 and 18xlv. Industry surveys have found that many farmers are not achieving this, but there is also quite a degree of regional variation. To improve nitrogen use a number of strategies are now being implemented including:
// An industry-wide project to monitor and demonstrate best practice.
// Crop nutrition research.
// Training for advisors and farmers.
Cotton growers forum on measuring irrigation pump performance.

49 AUSTRALIAN GROWN COTTON SUSTAINABILITY REPORT // 2014
RESEARCH ON CARBON FOOTPRINT OF FARMS The Australian cotton industry is developing a carbon (C) footprint calculator for cotton farms. The calculator determines carbon sequestration and emissions associated with agricultural production (irrigated and dryland crops and grazing enterprises), as well as the net primary productivity and carbon sequestered by native vegetation. The calculator will demonstrate how farmers can be carbon neutral, or even better, be carbon positive. A case study illustrating the carbon footprint of a cotton farm near Wee Waa NSW has been developed, using an holistic approach that takes into account the carbon sequestration and greenhouse gas emissions associated with cotton production as well as the net primary productivity and carbon sequestered by native vegetation. This case study demonstrates that it is possible to achieve a carbon positive cotton farming operation.
In soils and native vegetation commonly found on the Namoi floodplain on average, river red gum plant communities store a total of 216 tonnes of carbon per hectare, coolibah vegetation types store almost half of this carbon with 100 tonnes per hectare, while grasslands store approximately 40 tonnes of carbon per hectare. Depending on relative land-use proportions, carbon emissions from cotton farms can be offset by native vegetation, potentially allowing cotton farmers to achieve carbon neutralityxxxvi.
The cotton industry is currently working to better understand vegetation on cotton farms - both the ecosystem services it provides such as carbon storage, erosion control, natural pest control and biodiversity value; as well as how we can improve the management practices of riparian lands to contribute towards their health. myBMP, the industry’s best management practice program has a specific module dedicated to the best management practices of these natural assets on cotton farms.

50 AUSTRALIAN GROWN COTTON SUSTAINABILITY REPORT // 2014
SOCIAL CATEGORYKey social aspects for the cotton industry include education levels, demographics, employment, health, social capital, research and development and legal compliance.
EDUCATION HIGHEST POST GRADUATE SCHOOL QUALIFICATION OF COTTON GROWERSEducation can be used as a measure of the human capital of the cotton industry. Figure 28 shows the highest post school qualification obtained by cotton growers between 1991 and 2011. The major trend over the period is that the number of cotton growers with a diploma level or above qualification has risen from 30 percent in 1990 to 50 percent in 2011. The number of growers holding a bachelor degree rose from 13.5 percent to 24.1 percent between 1991 and 2011. The majority of cotton growers’ highest post school qualification is an advanced diploma (22.2 percent) or certificate level (40.6 percent) qualification. These qualifications are higher than other agricultural sectors and above the average Australian population.
Figure 28 Highest qualification of cotton growers from ABS Census data 1991-2011
1991 1996 2001 2006 2011
PERC
ENTA
GE O
F COT
TON
GROW
ERS
0%
10%
20%
30%
40%
50%
60%
70%
80%
90%
100%
Not stated
Certi�cate Level
Advanced Diploma and Diploma Level
Bachelor Degree Level
Graduate Diploma and GraduateCerti�cate Level
Postgraduate Degree Level
Source: Data from 1991, 1996, 2001, 2006, 2011 ABS Census
Many initiatives encourage the participation of young people and women in industry activities and decisions.
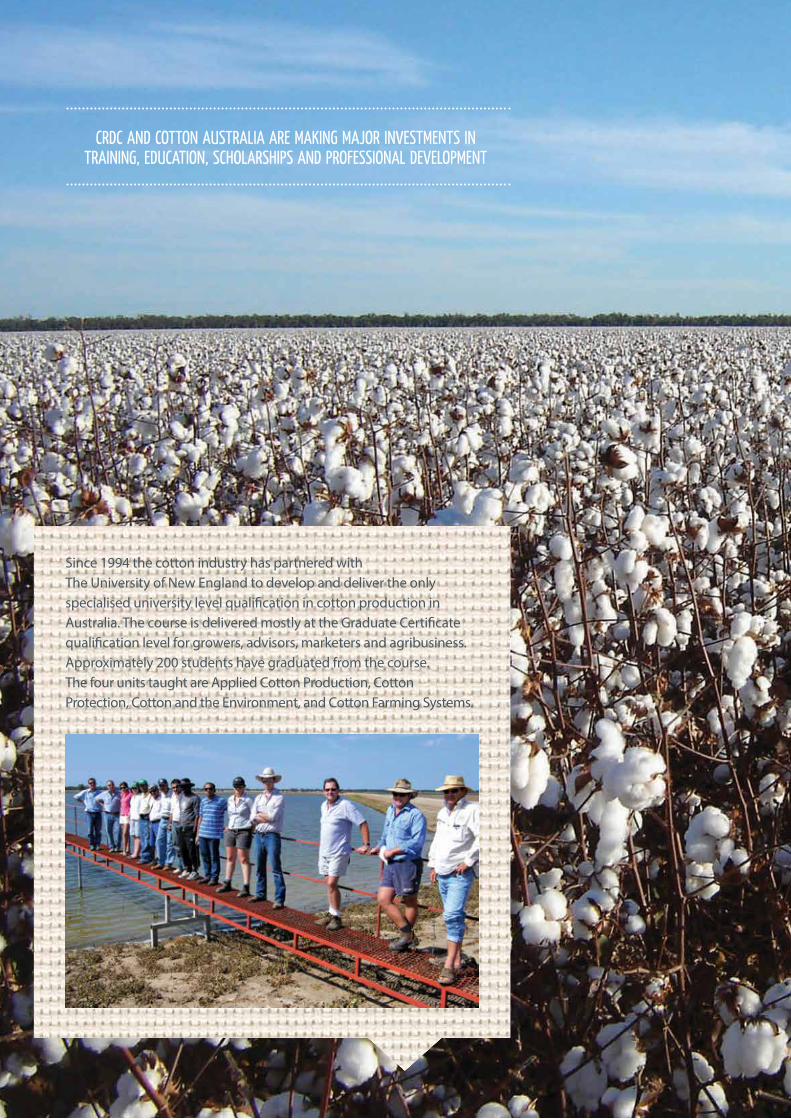
Since 1994 the cotton industry has partnered with The University of New England to develop and deliver the only specialised university level qualification in cotton production in Australia. The course is delivered mostly at the Graduate Certificate qualification level for growers, advisors, marketers and agribusiness. Approximately 200 students have graduated from the course. The four units taught are Applied Cotton Production, Cotton Protection, Cotton and the Environment, and Cotton Farming Systems.
CRDC AND COTTON AUSTRALIA ARE MAKING MAJOR INVESTMENTS IN TRAINING, EDUCATION, SCHOLARSHIPS AND PROFESSIONAL DEVELOPMENT

52 AUSTRALIAN GROWN COTTON SUSTAINABILITY REPORT // 2014
EMPLOYMENT NUMBER EMPLOYED – FARMS, INDUSTRY, REGIONAL The specific number of people employed by the cotton industry is difficult to estimate. This is because most farms have mixed farming systems involving other crops and livestock. Agribusinesses also tend to work with other sectors. Cotton Australia estimates the number of people employed by the cotton industry in a non-drought year is 10,000 people.
Cotton production is one of the leading employers in most places where it is grown. It is a high input annual crop for products and services and therefore generates many permanent and casual jobs and has traditionally provided some of the best salary packages in agriculture. Cotton is also a knowledge intensive industry so there are a high number of service businesses in cotton regions. Employment includes on farm jobs such as irrigating and machinery operation, fertiliser and chemical sales, aerial and ground spraying services, machinery and spare parts sales and service, engineering services, transport companies, oil seed crushers, cotton gins, marketers, agronomists and scientists.
The 2013 grower survey found respondents employed on average 6.6 people per farm (1.6 employees/100 cotton hectares, with a highly variable range in different regions). Of these, on average 2.4 employees first joined the farm in 2012 and 1.8 of these employees had no prior experience in cotton production. The farm workforce varies from farm to farm. However, as an indication:
// 63 percent of the permanent staff are employed full time.
// Three percent of staff hold 457 visas (Temporary Skilled Work).
// Eight percent of staff are employed on a permanent part time basis.
// 65 percent of casual staff hold 417 visas (Working Holiday)xlvi.
Nearly all farms also use contractors for tasks such as picking, spray application, and module transport.
Several studies on employment linkages with regional cotton communities and the national economy were published by the Cotton Catchment Communities CRC between 2006 to 2012xlvii.
The future of Australian science and agriculture is dependent on young people. A number of schools and universities are hosted on farms and the Australian Cotton Research Institute.

53 AUSTRALIAN GROWN COTTON SUSTAINABILITY REPORT // 2014
Changes in technology have influenced employment levels in the cotton industry. For example, Bollgard® transgenic cotton requires less spraying and crop checking compared to conventional varieties. Another significant trend as a result of Roundup Ready® transgenic cotton has been the decrease in manual cotton chipping for weed control. This has resulted in less casual employment for itinerant, student and indigenous workers. Employment is also changing with changes to irrigation systems from surface irrigation to drip or overhead systems which usually require less but more skilled labour.
WORKPLACE HEALTH AND SAFETYFarming has a number of workplace health and safety risks. Between 2001 and 2013 seven cases of work-related serious injury and fatality on cotton farms were identifiedxlviii:
// Aeroplane.
// Cotton picker.
// Dam drowning (child).
// Farm ute.
// Module builder (x2).
// Water pump.
From 2008-09 to 2011-12 the cotton industry had approximately 30 short-term injury claims (zero to four days) per year. This is similar to the grain industry. The cotton industry also experience around half the number of serious (five-plus days) claims (35/year) when compared to grain production. There are around 2,000 claims (zero to four days) and 3,000 (five-plus days) per year across all Australian agriculture. Cotton represents less than 0.02 percent of all claims in agriculture for injuries less than four days and five-plus daysxlix.
The new round module cotton pickers have reduced labour needs on farms. In the last three years there has been a rapid adoption of these new pickers, which in 2013 were used to harvest 82% of the national crop area. The major motivations for the initial decision to use these new pickers is the ability to pick crops more quickly, a decrease in labour needs and less workforce health and safety risks.

54 AUSTRALIAN GROWN COTTON SUSTAINABILITY REPORT // 2014
Sprains and strains accounted for around one-third of both short term (zero to four days) and serious (five-plus days) injury claims. Open wounds (without amputation), followed by contusions, foreign bodies and fractures were common in claims of zero to four days duration. For the more serious injuries (five-plus days), apart from sprains and strains, fractures, open wounds and contusions were most common .
There have been a number of changes relating to safety innovations on cotton farms including:
// Reduction in vehicle and on-farm traffic risks.
// Safer irrigation systems.
// Changes in cultivation technology.
// Changes in pesticides and application technology.
// Changes in harvest technology.
// Adoption of gene technology.
// Adoption of WH&S management systems.
myBMP modules on pesticide application, pesticide storage, integrated pest management, petrochemical storage and a new module specifically on human resources and safety management are explained to industry personnel through a variety of platforms including farm workshops.

55 AUSTRALIAN GROWN COTTON SUSTAINABILITY REPORT // 2014
CRDC and Cotton Australia continue to place a high emphasis on farm health and safety and have a number of strategies in place including:
// myBMP modules on pesticide application, pesticide storage, integrated pest management, petrochemical storage and a new module on human resources and safety management.
// IPM strategies for crop management.
// Partnership in the Primary Industries Health and Safety Partnership to undertake RD&E activities to improve the:
// Physical health of farming workers and their families.
// Mental health of farming families.
// The safety of the work environment and practices in farming and fishing industries.
// Major display at the 2014 Australian Cotton Conference with professional medical staff who conducted health checks on 241 people.
DEMOGRAPHICS GROWER AGEOverall cotton growers are much younger than farmers in other agricultural industries in Australia (as shown in Figure 29). For example, 20 percent of cotton growers are aged 55 years and over while 45 percent of all other farmers are aged 55 years or over. There are many initiatives to encourage the participation of young people in the cotton industry. These include:
// Leadership training course and scholarships for young leaders.
// Summer scholarships for undergraduates to undertake R&D projects.
// Annual industry award for achievement by a young person (35 years or younger).
Figure 29 The age of cotton farmers and other farmers in Australia during 2011
15
20
25
30
10
5
0
15-24 years 25-34 years 35-44 years 45-54 years 55-64 years 65 years+
All other farmersCotton farmers
PERC
ENT
Source: ABS 2011 Census
Cotton grower, Brett Bidstrupp and Murray Boshammer from Total Agricultural Services Pty Ltd, Dalby, QLD.

56 AUSTRALIAN GROWN COTTON SUSTAINABILITY REPORT // 2014
DEMOGRAPHICS GENDER PARTICIPATIONTraditionally agriculture has been an industry involving more males than females in the workplace. The cotton industry has actively encouraged women to participate at all levels of the industry. The current CRDC Board of Directors Chair is female and Cotton Australia has also had women undertake the role of Chair of the governing board and have had one to two female board members for the past five years. Women occupy a number of senior positions in the industry, as well as undertaking roles such as agronomists, researchers and cotton marketing. Table 5 shows the proportion of women working in key industry organisations is currently around 60 percent.
Table 5 The proportion of female staff in industry organisations (2014)
ORGANISATION FEMALE (%)
Cotton Australia staff 67
CRDC staff 64
CottonInfo Team 60
Source: Cotton Australia annual report 2014, CRDC annual report 2013
Crop Consultants Australia is the major membership body for professional crop growing advisors. Overall, 12 percent of the membership is female, with most of the older members being male. Within the less than 35 years demographic, 50 percent of the membership is female, with a recent influx of female agronomists entering the industry.
Figure 30 Women in cotton (WinCott) membership numbers.
150
200
250
300
350
400
450
100
50
0
2000 2007 2014
MEMB
ERSH
IP NU
MBER
S
In 2000, a ‘women in cotton’ organisation known as WinCott was formed. WinCott has enabled a women’s network to develop, and strengthen the linkages and participation of women within the industry. There are currently 400 members.

57 AUSTRALIAN GROWN COTTON SUSTAINABILITY REPORT // 2014
SOCIAL CAPITAL COTTON CONFERENCE DELEGATESSocial capital refers to features of social organisation such as networks, and co-operation for mutual benefit. The cotton industry is often described by others as a highly connected industry. One metric of this is the delegate numbers of the Australian Cotton Conference.
The Australian Cotton Conference is jointly organised by Cotton Australia and Australian Cotton Shippers Association. The Conference has been operational for 34 years. The biennial conference is the cotton industry’s most important event drawing a delegate base that spans researchers, cotton farmers, suppliers, cotton merchants, spinning mills, brand owners and supply chain partners together into one forum.
Seventeen conferences have been held and it is one of the largest conferences of any agricultural industry in Australia. Table 6 lists the delegate numbers for the last eight conferences. The decline in 2008 was due to the ongoing drought, however cotton industry leaders were pleased with the continued strong attendance.
Table 6 Australian cotton conference delegate numbers
YEAR 2000 2002 2004 2006 2008 2010 2012 2014
Delegate numbers
1413 1392 1478 1302 896 998 1586 1816
Some other examples of industry networks include:
// Australian Cotton Industry Council.
// Crop Consultants Australia.
// Cotton Innovation Network.
// Regional Grower Associations.
// Australian Cotton Shippers Association.
// Association of Australian Cotton Scientists.
Further information about the 2014 conference is available on the conference website www.australiancottonconference.com.au
Most Australian cotton farms are family owned and operated.

58 AUSTRALIAN GROWN COTTON SUSTAINABILITY REPORT // 2014
INNOVATION INVESTMENT IN R&DThe Australian cotton industry has always invested in research and development. Over the past 24 years, the Cotton Research and Development Corporation has invested $200 million in RD&E on behalf of Australian cotton growers and the Australian Government – delivering an estimated minimum $1.4 billion benefit back to growers on their farms, and twice that value to the wider community.
Cotton growers pay a $2.25 per bale research and development levy, which is matched using various formulas by the Australian Government. The CRDC does not spend all its income each year. Cash reserves are kept and used during low income years caused by drought to reduce the variation in the research and development expenditure budget.
Expenditure levels have generally been around $11 million per year, although they have been less in drought years and more recently in response to increased production around $20 million per year (Figure 31). The annual reports of CRDC provide comprehensive details on the cotton industry’s research and development activities (www.crdc.com.au).
Figure 31 Research and development expenditure by the Cotton Research and Development Corporation
2003-2014.
The cotton industry has also been an active participant in the Australian Government’s Co-operative Research Centre Program. The triumvirate of cotton-based CRCs concluded in 2012 after 18 years of significant investment and collaboration. Over 400 research project reports can be found at www.cottoncrc.org.au
In 2012 the Cotton Innovation Network was formed to co-ordinate the cotton industry’s research and development activity and ensure a collaborative and cohesive approach to achieving our industry’s long term goals. The key participants in cotton research are all represented in the Cotton Innovation Network. The network includes representatives from the NSW Department of Primary Industries, CRDC, Cotton Seed Distributors (CSD), CSIRO, the Commonwealth Department of Agriculture, Queensland Government’s Department of Agriculture, Fisheries, Forestry and universities.
12.6 12.6 12.8 11.9
10.5
9.4
11.5 9.8
13.7
19.3 21.9
0
5
10
15
20
25
$ (M
ILLION
)
2003
-04
2004
-05
2005
-06
2006
-07
2007
-08
2008
-09
2009
-10
2010
-11
2011
-12
2012
-13
2013
-14

59 AUSTRALIAN GROWN COTTON SUSTAINABILITY REPORT // 2014
INNOVATION GROWERS ADOPTING TECHNOLOGIESAustralian cotton growers are innovative and rapidly adopt new technologies:
// 99 percent adoption of transgenic traits for insect and weed management.
// 82 percent adoption of new round module pickers.
// 70 percent using soil moisture probes for irrigation scheduling.
// 90 percent using satellite navigation systems in tractors.
// 84 percent use a smart phone or tablet for accessing information about their farming system.
Source Cotton Grower Surveys 2011, 2013.
LEGAL COMPLIANCE AND RESPONSIBILITY Australia’s cotton industry is regulated by a strict legislative framework which is applied at federal, state and local government levels.
The Australian cotton industry’s myBMP program helps Australian cotton growers keep track of their legal obligations in operating their farm businesses. Of the approximately 600 ‘check’ items growers can use to evidence their use of industry best practice, around 180 provide evidence of legal compliance. Legislation affects all aspects of operations such as:
// Conditions of employment for staff and the protection of their safety in the workplace.
// Standards for transporting farm machinery and cotton modules on public roads.
// Storage and handling of pesticides and petrochemicals on-farm.
// Weather conditions for the application of pesticides.
// Licensing arrangements for access and use of transgenic traits.
// Mechanisms and timing of access to water for irrigation and the on-farm retention of overland flows.
// Management of trees and native vegetation.
Computers, smart phones and tablets are used widely for accessing information.
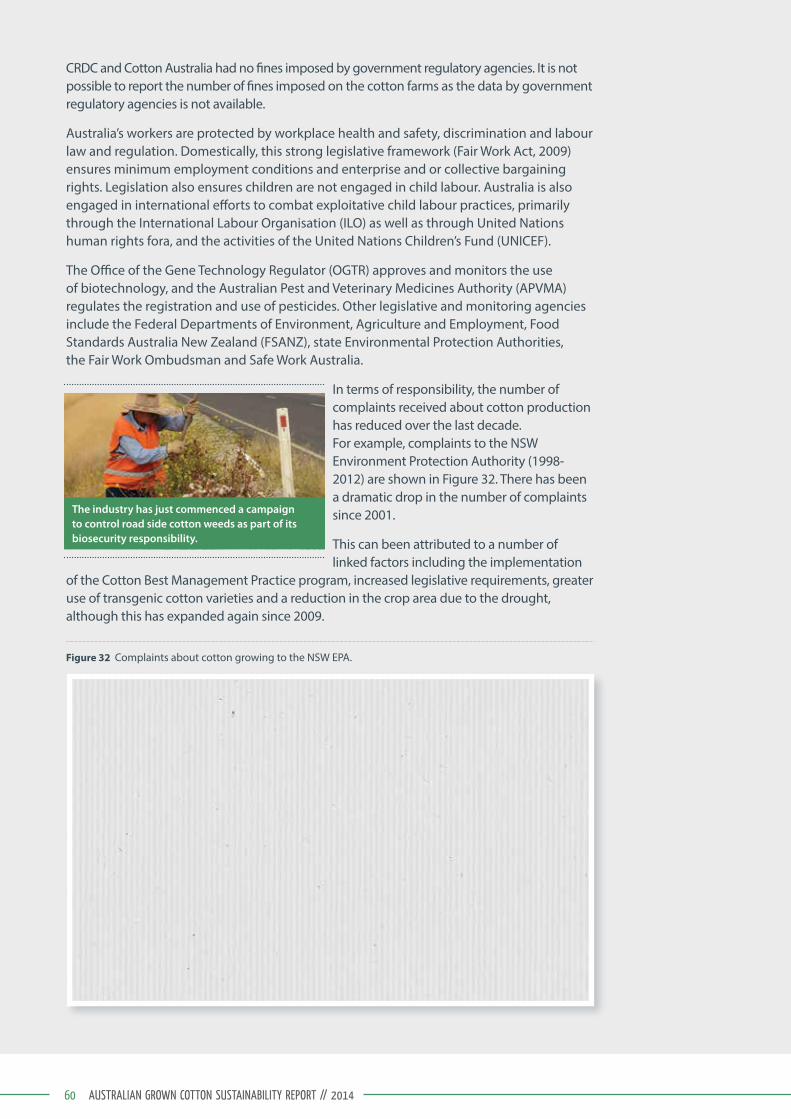
60 AUSTRALIAN GROWN COTTON SUSTAINABILITY REPORT // 2014
CRDC and Cotton Australia had no fines imposed by government regulatory agencies. It is not possible to report the number of fines imposed on the cotton farms as the data by government regulatory agencies is not available.
Australia’s workers are protected by workplace health and safety, discrimination and labour law and regulation. Domestically, this strong legislative framework (Fair Work Act, 2009) ensures minimum employment conditions and enterprise and or collective bargaining rights. Legislation also ensures children are not engaged in child labour. Australia is also engaged in international efforts to combat exploitative child labour practices, primarily through the International Labour Organisation (ILO) as well as through United Nations human rights fora, and the activities of the United Nations Children’s Fund (UNICEF).
The Office of the Gene Technology Regulator (OGTR) approves and monitors the use of biotechnology, and the Australian Pest and Veterinary Medicines Authority (APVMA) regulates the registration and use of pesticides. Other legislative and monitoring agencies include the Federal Departments of Environment, Agriculture and Employment, Food Standards Australia New Zealand (FSANZ), state Environmental Protection Authorities, the Fair Work Ombudsman and Safe Work Australia.
In terms of responsibility, the number of complaints received about cotton production has reduced over the last decade. For example, complaints to the NSW Environment Protection Authority (1998-2012) are shown in Figure 32. There has been a dramatic drop in the number of complaints since 2001.
This can been attributed to a number of linked factors including the implementation
of the Cotton Best Management Practice program, increased legislative requirements, greater use of transgenic cotton varieties and a reduction in the crop area due to the drought, although this has expanded again since 2009.
Figure 32 Complaints about cotton growing to the NSW EPA.
0
10
20
30
40
50
60
70
1998
1999
2000
2001
2002
2003
2004
2005
2007
2008
2009
2010
2011
2012
NUMB
ER O
F COM
PLAIN
TS
The industry has just commenced a campaign to control road side cotton weeds as part of its biosecurity responsibility.

61 AUSTRALIAN GROWN COTTON SUSTAINABILITY REPORT // 2014
REPORT BOUNDARYThis report focuses on Australian cotton farms. As discussed in the report there are up to 1500 independently and privately owned cotton farms in Australia. Cotton Australia and the CRDC have been working together to ensure the Australian cotton industry is a global leader in sustainable and responsible agriculture.
The report’s standard core GRI disclosures focus internally on Cotton Australia and CRDC as it is not possible to report on these metrics for 1500 individual farms. The economic, environmental and social sustainability performance information relates to Australian cotton farms, which are external to Cotton Australia and CRDC. The process for determining the aspect boundaries vary and are discussed in the economic, environmental and social categories. The boundary is usually the immediate farm, cotton growing region or water catchment.
This report does not include coverage of post-farm gate activities of the supply chain such as cotton ginning, shipping, spinning and textile manufacture, although reference is made to linkages in the cotton value chain. With the exception of cotton ginning these activities are carried out overseas by a range of independent corporations. As discussed in the report, linkages with the supply chain are being strengthened.
Cotton production on farms forms part of the overall supply chain for clothes, fabrics and products people use. Having an appropriate, ethical and sustainable supply chain is important for Australian cotton production.
OUR REPORT
CROP INPUTS
THE FARM
COTTON GINNING
TRANSPORT
SHIPPING
SPINNING AND FABRIC MAKING
COTTON PRODUCT

62 AUSTRALIAN GROWN COTTON SUSTAINABILITY REPORT // 2014
DEFINING MATERIAL ASPECTS AND SUSTAINABILITY INDICATORSThe purpose of sustainability indicators for the Australian cotton industry is:
// To demonstrate economic, environmental and social credibility to supply chain, markets, government and policy makers and community (domestically and globally).
// To guide research priorities and investment to enable practice change and continual improvement.
// To evaluate outcomes of research investments.
// To benchmark current performance and trends over time at the farm and industry scale.
// To inform and respond to policy development.
A comprehensive inventory of potential sustainability indicators was developed and published which reviewed the material issues of stakeholders and the literature as well as compiling data from a wide suite of published and unpublished research and monitoring data sets to provide and overall picture of the sustainability issues and trends of the Australian cotton industryv.
This set of potential sustainability indicators was assessed and updated by the cotton industry’s Environmental Assessment Working Group, taking into account recent developments in international supply chain sustainability initiatives such as the Better Cotton Initiative, Cotton LEADSTM, and the Social, Environmental and Economic Performance of Cotton Production (SEEP) Panel of the International Cotton Advisory Committee.

63 AUSTRALIAN GROWN COTTON SUSTAINABILITY REPORT // 2014
A list of more than 100 potential sustainability indicators was compiled. These indicators were then prioritised using an objective ranking system which scored indicators against six selection criteria (Table 7). Development of the final list of indicators took into account those of material interest to stakeholders, international sustainability initiatives, CRDC and Cotton Australia’s strategic plans.
Table 7 Selection criteria and ranking for materiality of sustainability indicators
SELECTION CRITERIA
1 Materiality (a) (relevance to cotton industry stakeholders)
2 Materiality (b) (relevance to external stakeholders including market, government, community)
3 Cost-effectiveness of data collection
4 Technical difficulty of data collection
5 Data integrity / confidence
6 Accuracy in data collection
From the list of more than 100 indicators, 45 have been shortlisted as high priority material aspects for the cotton industry to collect, collate and report on to form the basis of this report.
ENVIRONMENTAL Sixteen environmental indicators were identified as high priority.ECONOMIC Sixteen economic indicators were identified as high priority.SOCIAL Thirteen social indicators were identified as high priority.
These priority indicators are listed in Table 8.
Farm landscape monitoring, Mungindi.

64 AUSTRALIAN GROWN COTTON SUSTAINABILITY REPORT // 2014
Table 8 Material sustainability aspects and indicators for the Australian cotton industry
KEY ASPECT ECONOMIC INDICATOR
Cotton industry production statistics
1. Planted area (ha) - Irrigated
2. Planted area (ha) - Dryland
3. Yield (bales / ha) - Irrigated
4. Yield (bales / ha) - Dryland
5. Fibre quality
6. Metric tonnes of cotton produced
7. Grower numbers
8. Average / median farm size
Economic value
9. Cotton price / bale
10. Gross value of the cotton produced in Australia ($)
11. Cotton exports
12. Cotton’s % of region gross value
13. Australia’s % share of global cotton lint trade
14. Cotton proportion of global textile market
Profitability15. Gross margin / ha
16. Income / ML water
KEY ASPECT ENVIRONMENTAL INDICATOR
Soil health
1. Organic carbon %
2. Practice change.
3. Soil sodicity
On farm water use efficiency and productivity
4. Gross Production Water Use Index
5. Irrigation Water Use Index
6. Practice change
7. Whole farm water use efficiency (%)
Groundwater8. Groundwater levels
9. Groundwater quality
Biodiversity / riparian10. Area of native vegetation managed under best practice
11. Vegetation condition and connectivity
IPM 12. Growers using integrated pest management practices
Chemical use13. Herbicide use
14. Insecticide use
GHG emissions15. Energy use
16. Nitrogen use efficiency
KEY ASPECT SOCIAL INDICATOR
Education 1. Highest post school qualification of cotton growers
Employment
2. Number of people employed on farms
3. Number of people employed - industry
4. Number of people employed - regional
Workplace health and safety
5. Workers receiving regular health and safety training
6. Workers health & safety programs in place
Demographics 7. Grower age
8. Gender participation in industry
Social capital9. Australian Cotton Conference delegate numbers
10. Financial membership in regional Cotton Grower Associations
Innovation11. Investment levels in R&D
12. Growers adoption of technologies
Legal compliance & responsibility 13. Fines imposed upon cotton SMEs by regulatory authorities

65 AUSTRALIAN GROWN COTTON SUSTAINABILITY REPORT // 2014
STAKEHOLDER ENGAGEMENTThe Australian cotton industry has a range of stakeholders and is committed to an open dialogue with them. Stakeholders include:
// Cotton growers.
// Cotton ginners.
// Cotton marketers.
// Cotton shippers and buyers.
// The agribusiness and banking sectors.
// Commonwealth, state and local government.
// Research and development providers.
// Community groups.
The cotton industry regularly engages with stakeholders through a variety of platforms such as formal meetings, workshops, networks, surveys, advisory panels and research projects. The basis and frequency for engagement of stakeholders is determined by the issues.
An understanding of stakeholder attitudes is important as they influence the social licence or right to farm cotton. In order to understand community and stakeholder concerns the cotton industry has undertaken a number of attitudinal studies in cotton communities and Australian cities. These studies have shown that community members are concerned about pesticide use and application, water use, soil health and salinity, land clearing and changes to biodiversity, river and groundwater quality, use of genetically modified crops, waste management, weeds, greenhouse emissions and energy use. These studies have also found geographic variation in community attitudes with differences in both positive and negative feelings.
In 2012, the cotton industry completed its third independent environmental assessment of Australian cotton growingvi. The study period of the assessment was 2003-2012 as it appraised the cotton industry’s implementation of the recommendations of the second environmental audit in 2003vii and the cotton industry’s progress since then.
A variety of forums are held. This one was in Emerald where farmers, advisers, researchers, CRDC and Cotton Australia discussed farming systems R&D.

66 AUSTRALIAN GROWN COTTON SUSTAINABILITY REPORT // 2014
The first independent environmental audit of the cotton industry was conducted in 1991. The third environmental assessment represented the continuation of the cotton industry’s commitment to undertaking comprehensive independent environmental assessments, a process unique in agricultural industries in Australia. The third environmental assessment included meetings, site inspections and a survey of industry/non industry stakeholders and some focus groups in the city.
Growers were asked about their current environmental concerns and their responses indicate that the priorities are those issues that have the greatest implications for the survival and profitability of their cotton growing enterprise - water, fertiliser and fuel availability or use (Figure 33).
Figure 33 Grower concerns in terms of environmental issues
81%
60%
49%
47%
40%
37%
28%
21%
11%
13%
22%
39%
43%
33%
40%
49%
44%
38%
3%
10%
9%
8%
17%
16%
16%
23%
29%
1%
5%
3%
1%
3%
7%
6%
11%
16%
2%
3%
0%
1%
6%
1%
1%
1%
6%
Irrigation water allocations
Environmental water allocations
Nitrogen fertiliser use
Fuel efficiency
Power efficiency
Pesticide application
Tillage management
Biodiversity conservation(protecting native flora and fauna)
Greenhouse gas emissions
Highly concerned Moderately concerned Have little concern Have no concern Can’t say
94 %
90 %
77 %
65 %
49 %
77 %
73 %
88 %
82 %
Source: Cotton Environmental Assessment Grower Survey 2012

67 AUSTRALIAN GROWN COTTON SUSTAINABILITY REPORT // 2014
As part of the environmental assessment in 2012, stakeholders were also asked to nominate the three main environmental issues they believe the industry needed to act on immediately. Water use was ranked as the first main issue, greenhouse gas emissions as the second main issue and soil health as the third main issue. Chemical use and energy efficiency also rated prominently (Figure 34). When asked what environmental issues respondents see as becoming important over the next three to five years in terms of impacting on cotton growing, water was again ranked by most as the first main issue and again by those as the second main issue by those that ranked something else as the first main issue. Energy use, carbon emissions and coal seam gas extraction were rated prominently.
Figure 34 Stakeholder perceptions on future environmental priorities for industry
Fertiliser run-off to rivers and wetlands
Extent of planting or conservation of native vegetation
GM crops
Protection of ground water quality and quantity
Protection of riparian areas
Climate change
Coal seam gas
Protection of biodiversity on farms
Method of application of chemicals
Chemical resistant weeds and insects
Energy efficiency on farms
Level of chemicals used to combat cotton pests
Practices to improve or conserve soil health
Level of greenhouse gas emissions on farms
Water use efficiency
NUMBER OF STAKEHOLDERS0 5 10 15 20 25 30 35
Source: Cotton Environmental Assessment Stakeholder Survey 2012
Integrated Pest Management Field Day southern NSW.

68 AUSTRALIAN GROWN COTTON SUSTAINABILITY REPORT // 2014
These stakeholders were also asked how they would rate the cotton industry’s overall performance. A large proportion of respondents rated the cotton industry’s performance as ‘quite good’ or ‘very good’, with few respondents rating performance to be below ‘just okay’. Most individuals identified the industry’s performance to be ‘very good’. The perception of the cotton industry’s performance selected by each type of stakeholder group is shown in Figure 35.
Figure 35 Stakeholder perceptions of industry’s overall environmental performance.
0
2
4
6
8
10
12
14
Environment
Government
Industry
Other
Other farm industry
Source: Cotton Environmental Assessment Stakeholder Survey 2012
The Australian Cotton Industry Third Environmental Assessment 2012 made six recommendations for the industry to improve its environmental performance:
1. Develop a strategic and risk management approach to environmental management and performance.
2. Continue to improve myBMP.
3. Improve contact databases.
4. Deliver evidence-based reporting of environmental performance.
5. Engage in market-based initiatives.
6. Research how people use contemporary media.
This report has been prepared as part of the industry’s response to the Third Environmental Assessment.

69 AUSTRALIAN GROWN COTTON SUSTAINABILITY REPORT // 2014
STAKEHOLDER FEEDBACK ON THE INDICATORS FOR THIS REPORTAs part of preparing this report feedback was sought from key cotton industry stakeholder organisations. Each organisation was asked to rank the indicators according to importance to their organisation and/or constituents and list any indicators they considered were missing.
Feedback was also sought at the Better Cotton Initiative stakeholder workshop (November 2013) and by inviting comments directly from eleven organisations in May 2014, including the National Farmers’ Federation, CSIRO, WWF, Murray Darling Basin Authority, and the Global Reporting Initiative.
The cotton industry Environmental Assessment Working Group considered the feedback and included revisions to the final list of priority material aspects and indicators. Overall, this reduced the number of indicators from 47 to 45. There were also several potential indicators which were raised by stakeholders as missing from the list which have not been included in the current report. These included erosion, eco-toxicity, significance of native vegetation, surface water quality and a more detailed analysis of employment and professional development. It was considered that there is currently not enough data to enable the industry to report against these indicators in 2014, however they warrant further exploration for future sustainability reports.
REPORT PROFILEThis is the first formal sustainability report of the Australian cotton industry and has been prepared using the Global Reporting Initiative G4 Guidelines. It builds on a history of previous disclosures such as published annual reports, research and development project outputs, and three independent environmental audits and assessments.
In line with core principles of sustainability, the report draws on long-term data sets, where possible, up to the present 2014 cotton crop. The future planned reporting cycle is intended to be biennial. A separate Global Reporting Initiative Context Index has been prepared as an Appendix. Current policy is not to have the entire report externally assured. Most of the data sets are from published scientific reports which have received external assurance reviews. The financial statements of CRDC and Cotton Australia have also had an independent external audit.
Namoi River floodplain, Burren Junction.

70 AUSTRALIAN GROWN COTTON SUSTAINABILITY REPORT // 2014
GOVERNANCECotton Australia is a not for profit company limited by guarantee. The members of Cotton Australia include all cotton grower associations, cotton ginning companies and some service industry members (Cotton Seed Distributors Ltd and Crop Consultants Inc). It is governed by a board of 10 elected non-executive directors by its members at the annual general meeting (for three-year terms). The board chairman is elected by the board. The board is responsible for establishing strategic directions and targets, approving and monitoring policies, plans and budgets, and ensuring compliance with legal obligations and corporate governance. The chief executive officer is appointed by the board who is responsible for day to day management and implementation. Cotton Australia’s strategic plan and annual report containing further details on corporate governance and operations are available on the website www.cottonaustralia.com.au
The Cotton Research and Development Corporation (CRDC) is a research and development partnership between the Australian Government and the Australian cotton industry. The corporation was established in 1990 under the Primary Industries and Energy Research and Development Act. The corporation is accountable to the Australian Government through the Minister for Agriculture. The Minister appoints the chair and five to seven non-executive directors of the governing board. The roles and responsibilities of directors are set out in the board charter, which includes a governance statement, conduct and ethical standards provisions. The board appoints an executive director who is responsible for the day to day management of corporation activities. Further details on governance and corporate operations can be found in the annual report, which is available on the website; www.crdc.com.au
The governing boards of both Cotton Australia and the CRDC are responsible for decision- making on economic, environmental and social impacts. The governing boards have established an Environmental Assessment Working Group which consists of senior staff from both organisations to implement policy and actions to improve the sustainability of Australian cotton production. The Environmental Assessment Working Group and boards both consult with stakeholders on sustainability matters and in the case of the Working Group, it provides its feedback to the boards on its findings and a recommended response.

71 AUSTRALIAN GROWN COTTON SUSTAINABILITY REPORT // 2014
ETHICS AND INTEGRITYThe Cotton Industry’s Vision 2029 includes a core element of responsibility. This vision specifically commits to producing the most socially responsible cotton in the world.
Cotton Australia’s core values are:
// RESPECT To respect the views, opinions and concerns of others at all times.
// OPENNESS To ensure that information is available and accessible to members, staff and by all other parties.
// INTEGRITY To operate with honesty, decency and courage.
Cotton Australia’s staff policy document commits the organisation and its staff to ethical, legal and moral standards. These standards cover practice areas including work health and safety, anti-discrimination and -harassment, parental rights, remuneration, training and professional development. Furthermore, Cotton Australia’s board members are subject to a code of conduct that aligns themselves and the organisation to the best interests of members (ie growers). This code of conduct is on par with common standards for agriculture and industry associations.
Likewise CRDC’s policy documents outline expectations for ethical and legal behaviour in all its operations. Many of CRDC policies are outlined in its published annual report. This includes policies on governance, workplace health and safety, equal employment opportunity, harassment, and disabilities.
The cotton industry adopts precautionary approach principles to its operations:
INTERNALLY Through a risk management framework and policies overseen by the governing boards of CRDC and Cotton Australia.
EXTERNALLY For cotton farms through the myBMP program, which includes risk-assessment processes as part of its modus operandi.
The myBMP farm management system includes a specific module on human resources and workplace health and safety. The module provides guidance for farmers to meet their legal obligations around employing staff, and to put in place procedures that help optimise employee productivity in a safe environment. The module focuses on all aspects of employing staff, whether they be family members, employees or contractors. It offers practical ways to improve the ability to attract, retain, manage and protect staff.

72 AUSTRALIAN GROWN COTTON SUSTAINABILITY REPORT // 2014
i The Cotton Industry Vision 2029 Statement. www.crdc.com.au
ii Cotton Australia Strategic Plan 2013-2018 www.cottonaustralia.com.au: CRDC Strategic Plan 2013-2018 www.crdc.com.au
iii Social, Environmental and Economic Performance of Cotton Production (SEEP), “Measuring sustainability in cotton farming systems: Towards a guidance framework.” 2013. Report to ICAC. (https://www.icac.org/getattachment/mtgs/Plenary/72nd-Plenary/Documents/e_SEEP-report.pdf )
iv Leng R 2012. Animal production and future use of cotton seed. Emeritus Professor, The University of New England. Paper for 2012 Australian Cotton Conference.
v Roth G 2010. Economic, Environmental and Social Sustainability Indicators of the Australian Cotton Industry. The University of New England / Cotton CRC, Narrabri, NSW. (http://www.cottoncrc.org.au/general/Research/Projects/3_03_09)
vi Inovact Consulting Pty Ltd 2012. The Australian Cotton Industry Third Environmental Assessment. CRDC (http://cottonaustralia.com.au/uploads/publications/2012_Cotton_Industry_Environmental_Assessment_-_Executive_Summary.pdf )
vii GHD 2003. Second Australian Cotton Industry Environmental Audit, GHD Ltd for the Cotton Research and Development Corporation.
viii FIBREpak – from seeds to good shirts. A guide to improving Australian Cotton Fibre quality. Cotton Catchment Communities Cooperative Research Centre (2009), www.cottoncrc.org.au
ix Cattle SR and Field DJ 2013. A review of the soil science research legacy of the triumvirate of Cotton CRC, Crop and Pasture Science, 64, 1076-1094.
x Hulugalle NR and Scott F 2008. A review of the changes in soil quality and profitability accomplished by sowing rotation crops after cotton in Australian Vertosols from 1970 to 2006, Australian Journal of Soil Research, 46:173-190.
xi Rochester I 2011. Sequestering carbon in minimum tilled clay soils used for irrigated cotton and grain production. Soil & Tillage Research 112:1-7.
xii Roth Rural 2013. Cotton growing Practices 2013: Findings of CRDCs survey of cotton growers. Cotton Research and Development Corporation, Narrabri.
xiii 2011 Cotton Grower Survey, Cotton Catchment Communities CRC, Narrabri.
xiv Roth Rural 2013. Cotton growing Practices 2013: Findings of CRDCs survey of cotton growers. Cotton Research and Development Corporation, Narrabri.
xv WRI 2007. Survey of cotton grower practices. Report for the Cotton Research and Development Corporation, Narrabri, NSW.
xvi Roth Rural 2013. Cotton growing Practices 2013: Findings of CRDCs survey of cotton growers. Cotton Research and Development Corporation, Narrabri.
xxii Triantafilis J 2007. TerraGIS natural resource management for cotton growing regions, www.terragis.bees.unsw.edu.au
xviii Silburn M Foley J, Biggs A, Montgomery J Gunawardena T 2013. The Australian cotton industry and four decades of deep drainage research: a review. Crop and Pasture Science 64:1049-1075.
xix McGarry D and Gunawardena T 2012. Deep drainage investigated. The Australian Cotton water Story, Cotton Catchment Communities CRC, Narrabri.
xx McKenzie N, Jacquier D, Isbell R, Brown K 2004. Australian soils and landscapes: an illustrated compendium, CSIRO Publishing.
xxi Dodd K, Guppy C, Lockwood P, Rochester I 2013. The effect of sodicity on cotton: does soil chemistry or soil physical condition have a greater role?, Crop and Pasture Science 64:806-815.
xxii Triantafilis J , Huang J, Davies G, Bowd D, Monteiro Santos F 2014. Spatial prediction of the exchangeable sodium percentage at multiple depths using electromagnetic inversion modelling. Soil Use and Management.
xxiii Roth G, Harris G, Gillies M, Montgomery J, Wigginton D 2013. Water use efficiency and productivity trends in Australian irrigated cotton: a review. Crop and Pasture Science 64:1033-1048.
xxiv Roth G, Harris G, Gillies M, Montgomery J, Wigginton D 2013. Water use efficiency and productivity trends in Australian irrigated cotton: a review. Crop and Pasture Science 64:1033-1048.
xxv Wigginton D 2011. Measuring to improve water storage efficiency. The Australian Cotton water Story, Cotton Catchment Communities CRC, Narrabri.
xxvi 2011 Grower Survey, Cotton Catchment Communities CRC, Narrabri.
REFERENCES

73 AUSTRALIAN GROWN COTTON SUSTAINABILITY REPORT // 2014
REFERENCES
xxvii Kelly B, Timms W, Andersen M, McCallum A, Blakers R, Smith R, Rau G 2013. Aquifer heterogeneity and response time: the challenge for groundwater management. Crop and Pasture Science 64:1141-1154.
xxviii Dafny E 2014. Temporal trends of groundwater levels in the Condamine Catchment 2007-2013. Report prepared for CRDC, The University of Southern Queensland, Toowoomba.
xxix Timms W, Badenhop A, Rayner D, Mehrabi S 2010. Groundwater monitoring, evaluation and grower survey. UNSW Technical Report 2009/24.
xxx 2011 Grower Survey, Cotton Catchment Communities CRC, Narrabri.
xxxi Roth Rural (2013) Cotton growing Practices 2013: Findings of CRDCs survey of cotton growers. Cotton Research and Development Corporation, Narrabri.
xxxii Jarman PJ and Montgomery J 2002. Water birds and irrigation storages in the Lower Gwydir valley, NSW, Report for the Natural Heritage Trust, Canberra, 36 pp.
xxxiii Cleland E 2008. Identifying habitat requirements for birds on cotton farms in the lower Namoi, Final report 2.04.12, Cotton Catchment Communities Cooperative Research Centre, Narrabri, 43pp.
xxxiv Fitt G and Wilson L 2002. Non target effects of Bt cotton: a case study in Australia, Proceedings of the 4th Pacific Rim Conference, CSIRO, Canberra, pp175-184.
xxxv Smith R, Visser F, Welsh J, Vogel S, Trindall J 2014. Carbon neutral cotton farms. 17th Australian Cotton Conference, Gold Coast, August 2014.
xxxvi Smith R, Reid N 2013. Carbon storage value of native vegetation on a subhumid semi-arid floodplain. Crop and Pasture Science 64:1209-1216.
xxxvii Kennedy I, Rose M, Crossan A, Burns M 2013. Research and practice: environmental action for improving water quality in cotton catchments since 1990. Crop and Pasture Science 64:1095-111.
xxxviii Kennedy I, Rose M, Crossan A, Burns M 2013. Research and practice: environmental action for improving water quality in cotton catchments since 1990. Crop and Pasture Science 64:1095-111.
xxxix Wilson L, Downes S, Khan M, Whitehouse M, Baker G, Grundy P, Maas S 2013. IPM in the transgenic era: a review of the challenges from emerging pests in Australian cotton systems. Crop and Pasture Science 64:737-749.
xl Werth J, Boucher L, Thornby D, Walker S, Charles G 2013. Changes in weed species since the introduction of glyphosate resistant cotton. Crop and Pasture Science 64:791-798.
xli Thornby D, Werth J, Walker S 2013. Managing glyphosate resistance in Australian cotton farming: modelling shows how to evolution and maintain long term pest control. Crop and pasture Science 64: 780-790.
xlii Kennedy I, Rose M, Crossan A, Burns M 2013. Research and practice: environmental action for improving water quality in cotton catchments since 1990. Crop and Pasture Science 64:1095-111.
xliii USQ 2014. Energy use in cotton. Fact sheet. NCEA, The University of Southern Queensland.
xliv USQ 2014. Energy use in cotton. Fact sheet. NCEA, The University of Southern Queensland.
xlv Rochester I 2014. Growing high yielding nitrogen efficient cotton, CSIRO Agriculture Flagship, 17th Australian Cotton Conference, Queensland, August 2014.
xlvi Roth Rural 2013. Australian Cotton Grower Survey, Roth Rural and Regional Pty Ltd for Cotton Research and Development Corporation, Narrabri.
xlvii Powell and Chalmers 2009. Judith Stubbs and Associates – 4 reports (2010). Roth and Vogel 2012.
xlviii Lower T and Temperley J 2014. Cotton farm health and safety profile 2014 update, Australian centre for Agricultural Health and Safety, The University of Sydney, 17th Australian Cotton Conference, August 2014.
xlix Lower T and Temperley J 2014. Cotton farm health and safety profile 2014 update, Australian centre for Agricultural Health and Safety, The University of Sydney, 17th Australian Cotton Conference, August 2014.
l Lower T and Temperley J 2014. Cotton farm health and safety profile 2014 update, Australian centre for Agricultural Health and Safety, The University of Sydney, 17th Australian Cotton Conference, August 2014.
li Fragar, L and Temperley, J 2011. Drivers of adoption of safety innovations on Australian Cotton farms. Journal of Agricultural Safety and Health, 17:(3).

Standard Disclosure Standard Disclosure Title
STRATEGY AND ANALYSIS
G4-1 Page 5-6.
ORGANISATIONAL PROFILE
G4-3 Page 1.
G4-4 Page 7-12.
G4-5 Page 15-16.
G4-6 Page 7-12.
G4-7 Page 70.
G4-8 Pages 7-12.
G4-9 Page 15-16 & Annual Reports*.
G4-10 Annual Reports*.
G4-11 Page 80 CRDC Annual Report*.
G4-12 Page 61.
G4-13 n/a. First report.
G4-14 Page 71.
G4-15 Page 15-16.
G4-16 Page 15-16. Annual Reports*.
IDENTIFIED MATERIAL ASPECTS AND BOUNDARIES
G4-17 Page 15-16.
G4-18 Page 61-64.
G4-19 Page 64.
G4-20 Page 61.
G4-21 Page 61-64.
G4-22 n/a. First report.
G4-23 n/a. First report.
STAKEHOLDER ENGAGEMENT
G4-24 Page 65.
G4-25 Page 65-69.
G4-26 Page 65-69.
G4-27 Page 66-67.
REPORT PROFILE
G4-28 Page 69.
G4-29 n/a. First report.
G4-30 Page 69.
G4-31 Page 1.
G4-32 Page 74.
G4-33 Page 69.
GOVERNANCE
G4-34 Page 70.
ETHICS AND INTEGRITY
G4-56 Page 71.
STANDARD DISCLOSURES
Economic Page 17-27.
Environmental Page 28-49.
Social Page 50-60.
THE GLOBAL REPORTING INITIATIVE CONTENT INDEX The Global Reporting Initiative (www.gri.org) Content Index for a “G4-based report in accordance core option” is shown below.
* Further details are in the published annual reports of Cotton Australia and CRDC.

75 AUSTRALIAN GROWN COTTON SUSTAINABILITY REPORT // 2014
ISBN 978-0-9923758-8-1
Acknowledgements
The joint Cotton Australia and Cotton Research and Development Corporation Environmental
Assessment Working Group: Angela Bradburn, Greg Kauter, Leah Ross, Allan Williams and
Jane Trindall.
This report was prepared by Dr Guy Roth, Roth Rural and Regional Pty Ltd.
Photographs Cotton Australia, CRDC, CSIRO, Sally Dickinson, Greg Kauter, Mel Jensen, Tracey Leven,
Ruth Redfern, Guy Roth, Johnelle Rogan, Rhiannon Smith, Stacey Vogel, DRI GLO.
Disclaimer Cotton Australia, CRDC and Roth Rural & Regional Pty Ltd accept no responsibility
for the accuracy or completeness of any material contained in this publication. Cotton Australia,
CRDC and Roth Rural & Regional Pty Ltd disclaims all liability to any person in respect of anything
and of the consequences of anything done or omitted to be done by any such person in reliance,
whether wholly or partly, on any information contained in this publication. If you intend to rely
on information provided in this publication you should rely on your own appropriate professional
advice. Material included in this publication is made available on the understanding Cotton
Australia, CRDC and Roth Rural & Regional Pty Ltd are not providing professional advice.
Cotton Australia, CRDC, the authors and their organisations accept no responsibility or liability
for any loss or damage caused by reliance on the information, management approaches or
recommendations in this publication.
© Cotton Research and Development Corporation and Cotton Australia, 2014.