australian economic outlook - finity consulting€¦ · australian economic outlook finity niche...
TRANSCRIPT

Australian Economic OutlookFinity Niche Insurer Conference - 11 November, 2009
Deutsche Bank AG
Tony Meer, Chief Economist (Australia)
All prices are those current at the end of the previous trading session unless otherwise indicated. Prices are sourced from local exchanges via Reuters, Bloomberg and other vendors. Data is sourced from Deutsche Bank and subject companies.Deutsche Bank does and seeks to do business with companies covered in its research reports. Thus, investors should be aware that the firm may have a conflict of interest that could affect the objectivity of this report.Investors should consider this report as only a single factor in making their investment decision.Independent, third-party research (IR) on certain companies covered by DBSI's research is available to customers of DBSI in the United States at no cost. Customers can access this IR at http://gm.db.com, or call 1-877-208-6300 to request that a copy of the IR be sent to them.DISCLOSURES AND ANALYST CERTIFICATIONS ARE LOCATED IN APPENDIX 1

· · page 2
Global Economy Past Low-Point and Gathering Steam, the Question is How Sustainable?
Since March sentiment globally has swung from deep concerns that the global economy was headed - if not already in - another ‘Great Depression’ to confidence that policy intervention has been successful and economic recovery from the deepest post-War recession is now underway.
For us, this means that the key question facing investors has become what will be the nature of the recovery. How quick and sustainable will global growth’s return to trend or above be (a precondition for sustained gains in Australia’s terms of trade)? What is ‘trend’ (or potential) growth in a world of ongoing balance sheet restructuring (corporate and household and then eventually government) and re-regulation?
In large part, asset price movements since March can largely be viewed as unwinding the pricing of the risk of ‘Great Depression II’. As a result, going forward the burden of proof for further sustained gains in risk assets, and/or the pace of gains, will fall on the issues above.
Issues of sustainable growth for the global economy surround the degree of inventory correction underway (e.g. the global auto sector has experienced a sharp rebound due to the combination of previous unprecedented production cuts and direct policy interventions such as ‘cash for clunkers’); the attitude of households towards credit and access to it; the degree to which a reversal of labour hoarding stymies employment creation; and the impact of the inevitable withdrawal of easy policy.
Locally, while many of the issues are the same, Australia also has its own potential vulnerabilities –such as limited household balance sheet restructuring (the cost of our relative and absolute success?), and medium term issues surrounding our ongoing structural adjustment to a sustained higher terms of trade.
Deutsche Bank

· · page 3
Outline1) Global Recovery
Emerging markets leading the global recovery
2) Australia Has Outperformed
Strong initial conditions, e.g. relative lack of imbalances, strong banking sector, high degree of policy flexibility, etc.; strong and timely policy response; and exposure to outperforming emerging markets
3) Transition To Sustained Growth
As policy stimulus wanes, growth becomes increasingly reliant on endogenous (self generated) private demand. The question is how strong will this be?
4) Policy Response
For fiscal policy, withdrawal happens ‘naturally’ through the operation of the automatic stabilisers and the temporary nature of the discretionary easing. For monetary policy, the RBA has elected for an ‘early’ start to a “gradual lessening” of stimulus – a process that will increasingly become data dependent in our view.
5) Dutch Disease?
Over the past decade the structural aspect of the rise in Australia’s terms of trade (export prices relative to import prices) has become an increasingly dominant factor for the economy. As a result, longer term implications, e.g. the more-or-less permanent need for monetary policy to restrain domestic focussed activity to ‘make room’ for the external sector, has also become increasingly apparent.
6) Summary
Australia will continue to benefit as the global economy recovers. The nature of our growth, however, will increasingly reflect the removal of policy stimulus and the structural changes resulting from the ever rising importance of resources.
Deutsche Bank
· · page 4
(1) Global Recovery
Deutsche Bank
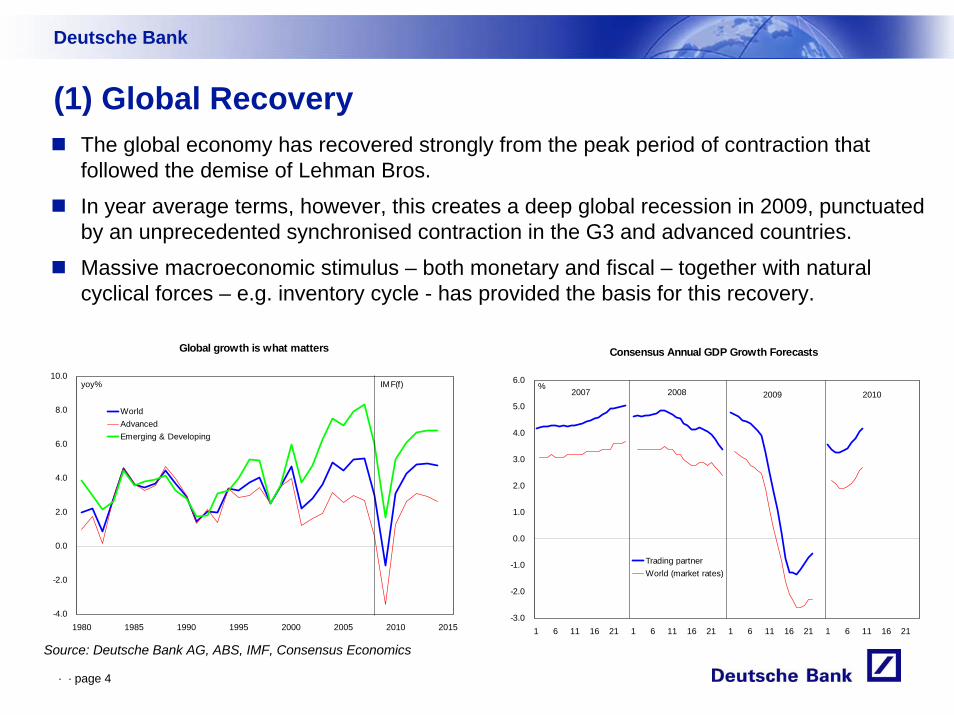
The global economy has recovered strongly from the peak period of contraction that followed the demise of Lehman Bros.
In year average terms, however, this creates a deep global recession in 2009, punctuated by an unprecedented synchronised contraction in the G3 and advanced countries.
Massive macroeconomic stimulus – both monetary and fiscal – together with natural cyclical forces – e.g. inventory cycle - has provided the basis for this recovery.
Source: Deutsche Bank AG, ABS, IMF, Consensus Economics
Global growth is what matters
-4.0
-2.0
0.0
2.0
4.0
6.0
8.0
10.0
1980 1985 1990 1995 2000 2005 2010 2015
WorldAdvancedEmerging & Developing
yoy% IMF(f)
Consensus Annual GDP Growth Forecasts
-3.0
-2.0
-1.0
0.0
1.0
2.0
3.0
4.0
5.0
6.0
1 6 11 16 21 1 6 11 16 21 1 6 11 16 21 1 6 11 16 21
Trading partnerWorld (market rates)
2007 2008 2009 2010%

· · page 5
(1) Global Recovery
Commodity prices the 'swing' element in AUS terms of trade
55.0
65.0
75.0
85.0
95.0
105.0
115.0
125.0
135.0
Sep-82 Sep-85 Sep-88 Sep-91 Sep-94 Sep-97 Sep-00 Sep-03 Sep-06 Sep-0965.0
95.0
125.0
155.0
185.0
215.0
245.0
275.0
305.0
Australia's terms of trade (LHS)
RBA commodity price index (RHS)
Index SDR terms
Australia’s ‘terms of trade’ (export prices relative to import prices) are basically commodity prices over the price of globally traded manufactured goods.
With manufactured goods prices generally more stable than commodity prices this means that the cycle in Australia’s terms of trade is large and driven by commodity prices.
Given a trade share of over 20% of GDP, this means that the cycle in Australia’s national income is largely driven by the external sector.
Source: Deutsche Bank AG, ABS, RBA
Deutsche Bank
Nominal income growth and the terms of trade
-5.0%
0.0%
5.0%
10.0%
15.0%
20.0%
Mar-89 Mar-93 Mar-97 Mar-01 Mar-05 Mar-09 Mar-13-20.0%
-10.0%
0.0%
10.0%
20.0%
30.0%
Nominal GDP (LHS) Terms of trade (RHS)
yoy% (f) yoy%
· · page 6
(2) Australia Has Outperformed
Deutsche Bank
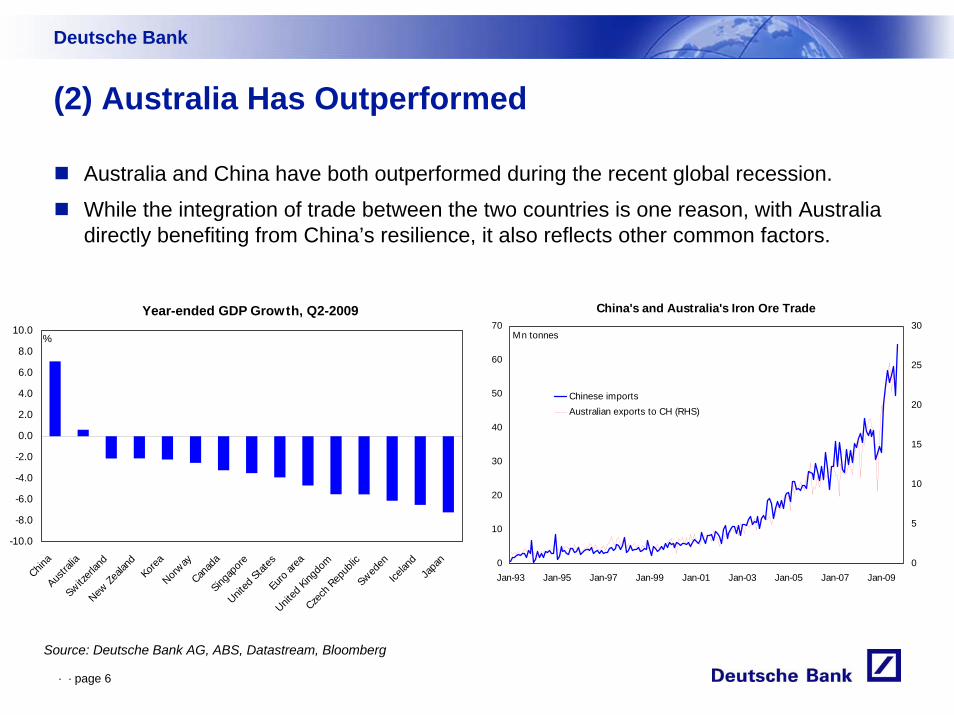
Australia and China have both outperformed during the recent global recession.
While the integration of trade between the two countries is one reason, with Australia directly benefiting from China’s resilience, it also reflects other common factors.
Source: Deutsche Bank AG, ABS, Datastream, Bloomberg
-10.0
-8.0
-6.0
-4.0
-2.0
0.0
2.0
4.0
6.0
8.0
10.0
China
Austra
liaSwitz
erlan
dNew
Zeala
ndKore
aNorw
ayCan
ada
Singap
oreUnit
ed Stat
esEuro
area
United
King
dom
Czech
Repub
licSwed
enIce
land
Japa
n
Year-ended GDP Growth, Q2-2009
%
0
10
20
30
40
50
60
70
Jan-93 Jan-95 Jan-97 Jan-99 Jan-01 Jan-03 Jan-05 Jan-07 Jan-090
5
10
15
20
25
30
Chinese importsAustralian exports to CH (RHS)
China's and Australia's Iron Ore Trade
Mn tonnes

· · page 7
(2) Australia Has Outperformed
G-20 Countries: Estimated Cost of Discretionary Measures 2009
0.0 0.5 1.0 1.5 2.0 2.5 3.0 3.5
TurkeyItaly
BrazilIndia
FranceArgentinaIndonesia
JapanUnited Kingdom
CanadaGermany
KoreaMexico
Total (PPP weighted)Russia
South AfricaChina
United StatesAustralia
SpainSaudia Arabia
%GDP
Australia
G20 Average
Both Australia and China entered the GFC with relatively unimpaired banking systems and a high degree of policy flexibility (both monetary and fiscal) which has been aggressively and effectively used.
Source: Deutsche Bank AG, IMF, RBA, Bloomberg
Deutsche Bank
Monetary policy was aggressively eased in both AU and CH
2.00
3.00
4.00
5.00
6.00
7.00
8.00
Jan-02 Jan-03 Jan-04 Jan-05 Jan-06 Jan-07 Jan-08 Jan-09 Jan-10 Jan-11-500
0
500
1000
1500
2000
AU: Cash rate (LHS)CH: Net new lending (RHS)
RMB bn%

· · page 8
(3) Transition To Sustained Growth
Contributions of fiscal stimulus to GDP growth
-0.50
-0.25
0.00
0.25
0.50
0.75
1.00
1.25
Dec-08 Mar-09 Jun-09 Sep-09 Dec-09 Mar-10 Jun-10 Sep-10 Dec-10 Mar-11 Jun-11
qoq ppts Q2-09peak impact
The Commonwealth Treasury estimate that the peak contribution from the stimulus in Australia occurred in Q2-2009, estimating that fiscal stimulus accounted for “all of the growth in 2008-09, and expected growth in 2009-10”.
Source: Deutsche Bank AG, Commonwealth Treasury
Deutsche Bank
Domestic demand - Private versus Public
-6.0
-4.0
-2.0
0.0
2.0
4.0
6.0
8.0
10.0
Sep-90 Sep-92 Sep-94 Sep-96 Sep-98 Sep-00 Sep-02 Sep-04 Sep-06 Sep-08 Sep-10 Sep-12
Domestic final demand Private final demand Public final demand
yoy% (f)

· · page 9
(3) Transition To Sustained Growth
Deutsche Bank
The retail sector has seen sales wane as the distance from the direct transfers delivered to households at the end of 2008 and earlier this year grows. We estimate that the transfers have accounted for around two thirds of the 6.0% annual growth in retail turnover to September.
Housing has benefited from both fiscal and monetary stimulus. With the FHOG Boost now being scaled back and the RBA lifting interest rates the focus is now on investor and trade-up buyer demand.
Source: Deutsche Bank AG, ABS
Value of retail turnover
18.0
18.5
19.0
19.5
20.0
20.5
Jan-08 Apr-08 Jul-08 Oct-08 Jan-09 Apr-09 Jul-09 Oct-09
Retail + Counter factualRecent retail as reported
$bn
Rudd-Drop 1 announcedmid-October
Additional retail expenditure
Retail if previous 2008 trend had persisted, i.e. 0.1%mom
Retail as reported
Green bars reflect retail boost from Rudd-Drops, ~$7-1/2bn
Cash rates and housing finance
-40.0%
-20.0%
0.0%
20.0%
40.0%
60.0%
80.0%
Jan-93 Jan-95 Jan-97 Jan-99 Jan-01 Jan-03 Jan-05 Jan-07 Jan-09 Jan-11
2.00
3.00
4.00
5.00
6.00
7.00
8.00
yoy% %
Cash rateinverted
scale
Housing finance (ex-refin.) (LHS)
(f)

· · page 10
(3) Transition To Sustained Growth
Deutsche Bank
The outlook for engineering construction remains strong thanks to state government infrastructure spending and the mining sector but non-residential construction approvals, outside of the Commonwealth’s “Education Revolution”, continue to slide.
Heavy truck sales surged in late Q2 ahead of the expiration of the 30% tax concession for investment by businesses with turnover in excess of $2m p.a. Small businesses remain eligible for a 50% tax concession on investment before 31 December, arguably a factor in the recovery in overall car sales (along with new models and sharp pricing).
Source: Deutsche Bank AG, ABS, FCAI
Non-residential Building Approvals
0.0
1.0
2.0
3.0
4.0
5.0
6.0
Jul-00 Jul-02 Jul-04 Jul-06 Jul-08
Total non-resTotal less 'educational buildings'
$bn
Monthly Heavy Truck Sales
0
500
1,000
1,500
2,000
2,500
3,000
3,500
4,000
Jan-00 Jan-01 Jan-02 Jan-03 Jan-04 Jan-05 Jan-06 Jan-07 Jan-08 Jan-09 Jan-10 Jan-11
Tax break pull-forward
No.

· · page 11
(3) Transition To Sustained Growth
Deutsche Bank
Against the prospect of waning government support the clear positives we see are:– The sheer strength of mining sector investment plans; and– The degree of labour hoarding that has occurred (insulating the household sector).
Source: Deutsche Bank AG, ABS
Mining and transport increasing CAPEX
0%
5%
10%
15%
20%
25%
30%
35%
40%
45%
1986/87 1989/90 1992/93 19$95/96 1998/99 2001/02 2004/05 2007/08
Mining Manufacturing
Wholesale & retail Transport & Storage
Finance, property & business services Other services (inc. const.)
%Nominal CAPEX
ExpectedCA
PEX
Hours worked versus employment growth
-6.0%
-4.0%
-2.0%
0.0%
2.0%
4.0%
6.0%
8.0%
Jun-86 Jun-89 Jun-92 Jun-95 Jun-98 Jun-01 Jun-04 Jun-07 Jun-10
EmploymentHours worked
Labour hoarding
yoy%

· · page 12
(4) Policy Response
Australian unemployment & participation rates
3.0
4.0
5.0
6.0
7.0
8.0
9.0
10.0
11.0
12.0
Jan-78 Jan-81 Jan-84 Jan-87 Jan-90 Jan-93 Jan-96 Jan-99 Jan-02 Jan-05 Jan-08 Jan-1158.0
59.0
60.0
61.0
62.0
63.0
64.0
65.0
66.0
67.0
Unemployment rate, LHSParticipation rate, RHS
% %
The unemployment rate has lingered around 5¾% since March this year ...
.... and the RBA has begun lifting the cash rate ahead of a sustained decline in the unemployment rate ...
… although by starting ‘early’, the RBA is expected to lift the cash rate “gradually” …
Source: Deutsche Bank AG, ABS, RBA
Deutsche Bank
RBA easing has anticipated the rise in unemployment
-8.0
-6.0
-4.0
-2.0
0.0
2.0
4.0
6.0
Jun-67 Jun-72 Jun-77 Jun-82 Jun-87 Jun-92 Jun-97 Jun-02 Jun-07 Jun-12
-3.0
-2.0
-1.0
0.0
1.0
2.0
3.0
4.0
Official cash rate %, LHSUnemployment rate %, RHS (reverse)
yoy ch
yoych
(f)

· · page 13
(4) Policy Response
Deutsche Bank
Similarly, the fact that the recovery phase will be associated with higher household debt servicing as household sector debt has continued to grow also supports a “gradual”approach.With no further lump sum payments to households; organic household income growth constrained; lenders likely to continue expanding lending margins; and the dominance of variable rate borrowing unchallenged, the household cash-flow transmission mechanism of RBA policy grows ever more powerful
Source: Deutsche Bank AG, ABS, RBA
Household debt service ratio
0.0%
3.0%
6.0%
9.0%
12.0%
15.0%
18.0%
Jun-82 Jun-85 Jun-88 Jun-91 Jun-94 Jun-97 Jun-00 Jun-03 Jun-06 Jun-09 Jun-12
%household disposable income
Cash15.5%
Cash17.0%
Cash7.5%
Cash6.25%
Cash7.25%
Cash3.0%
Cash4.5%
DB(f)
Financial Liabilities of the AUS and U.S. Household Sectors
0
200
400
600
800
1000
1200
1400
1600
Jun-88 Jun-93 Jun-98 Jun-03 Jun-082000
4000
6000
8000
10000
12000
14000
16000
Australia (LHS)United States (RHS)
A$ billion US$ billion
· · page 14
(5) Dutch Disease?
Deutsche Bank
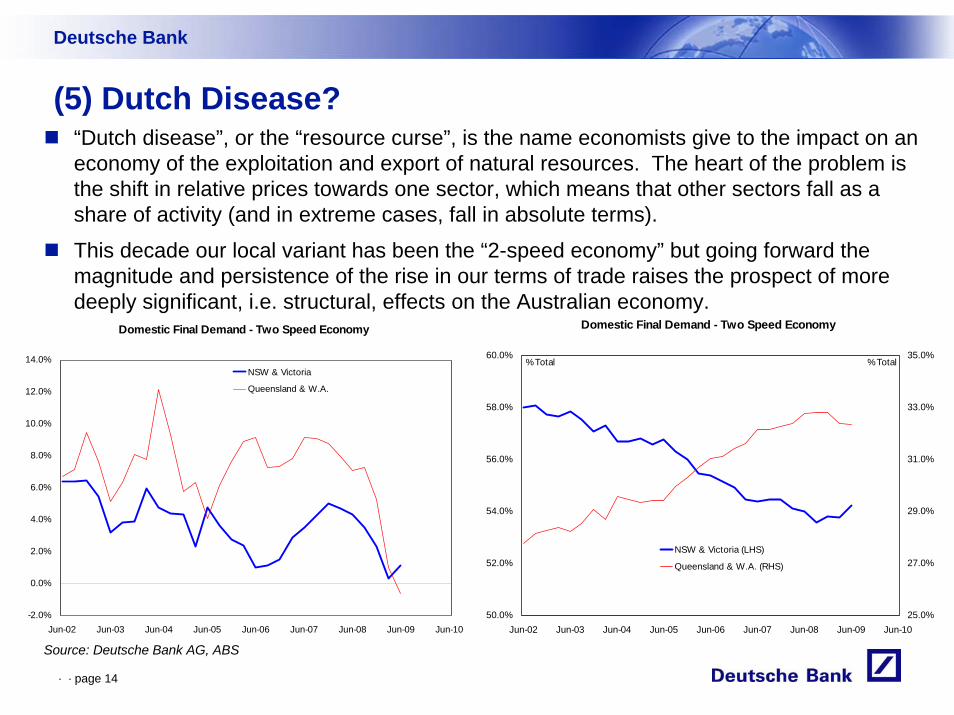
“Dutch disease”, or the “resource curse”, is the name economists give to the impact on an economy of the exploitation and export of natural resources. The heart of the problem is the shift in relative prices towards one sector, which means that other sectors fall as a share of activity (and in extreme cases, fall in absolute terms).
This decade our local variant has been the “2-speed economy” but going forward the magnitude and persistence of the rise in our terms of trade raises the prospect of more deeply significant, i.e. structural, effects on the Australian economy.
Source: Deutsche Bank AG, ABS
Domestic Final Demand - Two Speed Economy
-2.0%
0.0%
2.0%
4.0%
6.0%
8.0%
10.0%
12.0%
14.0%
Jun-02 Jun-03 Jun-04 Jun-05 Jun-06 Jun-07 Jun-08 Jun-09 Jun-10
NSW & Victoria
Queensland & W.A.
Domestic Final Demand - Two Speed Economy
50.0%
52.0%
54.0%
56.0%
58.0%
60.0%
Jun-02 Jun-03 Jun-04 Jun-05 Jun-06 Jun-07 Jun-08 Jun-09 Jun-1025.0%
27.0%
29.0%
31.0%
33.0%
35.0%
NSW & Victoria (LHS)
Queensland & W.A. (RHS)
%Total %Total
· · page 15
(6) Summary
Deutsche Bank
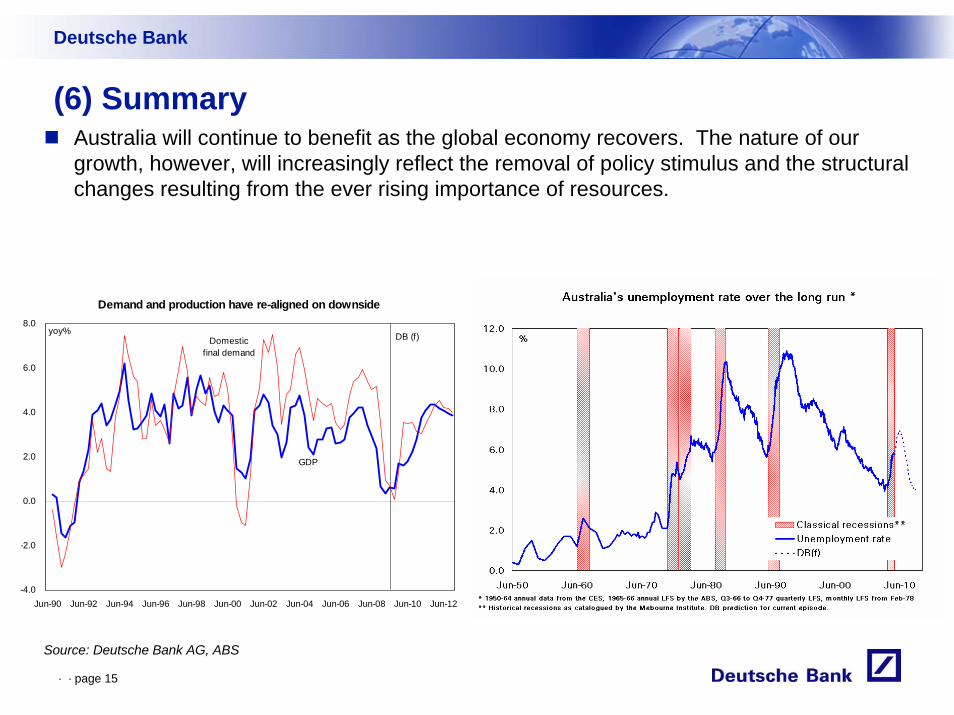
Australia will continue to benefit as the global economy recovers. The nature of our growth, however, will increasingly reflect the removal of policy stimulus and the structural changes resulting from the ever rising importance of resources.
Source: Deutsche Bank AG, ABS
Demand and production have re-aligned on downside
-4.0
-2.0
0.0
2.0
4.0
6.0
8.0
Jun-90 Jun-92 Jun-94 Jun-96 Jun-98 Jun-00 Jun-02 Jun-04 Jun-06 Jun-08 Jun-10 Jun-12
GDP
DB (f)Domesticfinal demand
yoy%

· · page 16
(6) Summary
Source: Deutsche Bank AG, ABS
DEUTSCHE BANK AG AUSTRALIAN MACRO-ECONOMIC FORECASTS4 September 2009 Financial years Calendar years% increase, year avg 2007/08 2008/09 2009/10
Deutsche Bank
F 2010/11F 2011/12F 2008 2009F 2010F 2011F 2012FACTIVITY INDICATORSReal Gross Domestic Income 4.8 2.7 -0.0 2.8 3.6 5.3 -1.3 2.6 3.1 3.7Real Gross Domestic Product 3.7 1.0 1.4 3.2 4.3 2.4 0.8 2.1 4.2 4.0
Non-farm GDP 3.6 0.7 1.3 3.3 4.4 2.1 0.7 2.0 4.2 4.1Farm GDP 8.5 13.5 6.9 1.3 0.1 15.3 6.2 6.5 0.6 0.1
Nominal GDP 8.4 6.5 1.3 5.0 6.5 9.2 1.4 3.8 6.1 6.4
Personal consumption 4.0 1.4 1.5 3.2 3.8 2.6 1.4 2.1 3.8 3.6Housing 1.4 -4.8 6.8 7.6 7.7 -1.5 -3.7 12.9 6.1 5.3Business capital spending 15.4 6.8 -3.3 2.3 7.9 13.7 -2.6 -0.2 5.6 8.8
Of which: Plant 17.3 5.1 -2.8 1.7 9.9 15.7 -4.8 0.6 6.2 10.4Construction 12.8 7.8 -5.9 2.6 6.5 11.4 -2.6 -1.8 5.3 8.2
Government spending 4.0 4.8 6.0 2.8 1.7 6.2 3.1 6.5 1.2 2.1Private final demand 5.9 1.9 0.9 3.5 5.0 4.4 0.0 2.5 4.4 4.9Domestic final demand 5.5 2.6 2.0 3.3 4.3 4.8 0.7 3.4 3.7 4.2
Exports 4.1 1.8 5.4 3.3 4.8 3.8 3.0 4.7 3.8 5.1Imports 13.8 -2.5 4.9 7.9 7.9 11.4 -7.6 11.9 6.7 8.7
Net exports (cont) -2.2 1.0 -0.0 -1.1 -0.9 -1.8 2.5 -1.6 -0.8 -1.1
PRICES and WAGESCPI (headline rate) 3.4 3.1 1.9 2.2 3.1 4.4 1.7 2.1 2.9 2.8
(through year rate) 4.5 1.5 2.1 2.8 2.8 3.7 1.7 2.1 3.3 2.6Market prices 3.3 3.2 1.7 1.6 2.2 4.0 1.9 1.7 1.9 2.3
(through year rate) 4.2 2.0 1.8 1.8 2.3 3.8 1.4 1.5 2.2 2.3Avg wages (AWOTE) 4.9 5.5 3.1 2.7 3.9 4.9 5.0 2.2 3.3 4.6
(through year rate) 4.0 6.1 1.9 3.2 4.5 5.5 3.5 2.6 3.6 5.0Unit labour costs 3.8 4.6 -1.4 0.5 2.8 5.3 0.1 -0.3 1.7 3.5Terms of trade 5.2 7.8 -7.8 -0.7 -1.2 13.7 -8.6 0.6 -2.2 0.4
BALANCE of PAYMENTSCurrent account balance
$billion -72.7 -38.2 -61.6 -81.8 -101.9 -54.5 -49.0 -70.5 -92.2 -109.7 %GDP -6.4 -3.2 -5.1 -6.4 -7.5 -4.6 -4.1 -5.7 -7.0 -7.8
LABOUR MARKETEmployment 2.6 1.1 -0.3 1.6 3.6 2.2 0.1 0.1 3.1 3.3Unemploy. rate (end period) 4.2 5.7 6.9 5.7 4.2 4.5 6.2 6.5 4.6 4.0
· · page 17
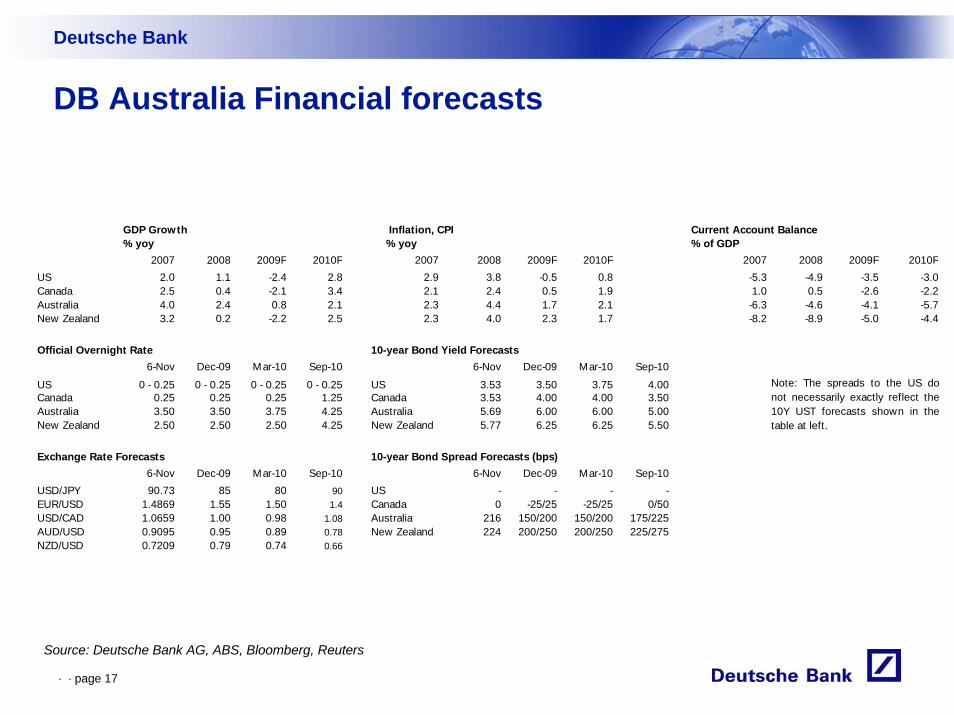
DB Australia Financial forecasts
Deutsche Bank
Source: Deutsche Bank AG, ABS, Bloomberg, Reuters
GDP Growth Inflation, CPI Current Account Balance% yoy % yoy % of GDP
2007 2008 2009F 2010F 2007 2008 2009F 2010F 2007 2008 2009F 2010FUS 2.0 1.1 -2.4 2.8 2.9 3.8 -0.5 0.8 -5.3 -4.9 -3.5 -3.0Canada 2.5 0.4 -2.1 3.4 2.1 2.4 0.5 1.9 1.0 0.5 -2.6 -2.2Australia 4.0 2.4 0.8 2.1 2.3 4.4 1.7 2.1 -6.3 -4.6 -4.1 -5.7New Zealand 3.2 0.2 -2.2 2.5 2.3 4.0 2.3 1.7 -8.2 -8.9 -5.0 -4.4
Official Overnight Rate 10-year Bond Yield Forecasts6-Nov Dec-09 Mar-10 Sep-10 6-Nov Dec-09 Mar-10 Sep-10
US 0 - 0.25 0 - 0.25 0 - 0.25 0 - 0.25 US 3.53 3.50 3.75 4.00Canada 0.25 0.25 0.25 1.25 Canada 3.53 4.00 4.00 3.50Australia 3.50 3.50 3.75 4.25 Australia 5.69 6.00 6.00 5.00New Zealand 2.50 2.50 2.50 4.25 New Zealand 5.77 6.25 6.25 5.50
Exchange Rate Forecasts 10-year Bond Spread Forecasts (bps)6-Nov Dec-09 Mar-10 Sep-10 6-Nov Dec-09 Mar-10 Sep-10
USD/JPY 90.73 85 80 90 US - - - -EUR/USD 1.4869 1.55 1.50 1.4 Canada 0 -25/25 -25/25 0/50USD/CAD 1.0659 1.00 0.98 1.08 Australia 216 150/200 150/200 175/225AUD/USD 0.9095 0.95 0.89 0.78 New Zealand 224 200/250 200/250 225/275NZD/USD 0.7209 0.79 0.74 0.66
Note: The spreads to the US donot necessarily exactly reflect the10Y UST forecasts shown in thetable at left.
· · page 18
Analyst CertificationThe views expressed in this report accurately reflect the personal views of the undersigned lead analyst(s). In addition, the undersigned lead analyst(s) has not and will not receive any compensation for providing a specific recommendation or view in this report. [Tony Meer]
Regulatory Disclosures1. Important Additional Conflict DisclosuresAside from within this report, important conflict disclosures can also be found at https://gm.db.com/equities under the "Disclosures Lookup" and "Legal" tabs. Investors are strongly encouraged to review this information before investing.2. Short-Term Trade IdeasDeutsche Bank equity research analysts sometimes have shorter-term trade ideas (known as SOLAR ideas) that are consistent or inconsistent with Deutsche Bank's existing longer term ratings. These trade ideas can be found at the SOLAR link at http://gm.db.com.3. Country-Specific DisclosuresAustralia: This research, and any access to it, is intended only for "wholesale clients" within the meaning of the Australian Corporations Act.EU countries: Disclosures relating to our obligations under MiFiD can be found at http://globalmarkets.db.com/riskdisclosures.Japan: Disclosures under the Financial Instruments and Exchange Law: Company name – Deutsche Securities Inc. Registration number – Registered as a financial instruments dealer by the Head of the Kanto Local Finance Bureau (Kinsho) No. 117. Member of associations: JSDA, The Financial Futures Association of Japan. This report is not meant to solicit the purchase of specific financial instruments or related services. We may charge commissions and fees for certain categories of investment advice, products and services. Recommended investment strategies, products and services carry the risk of losses to principal and other losses as a result of changes in market and/or economic trends, and/or fluctuations in market value. Before deciding on the purchase of financial products and/or services, customers should carefully read the relevant disclosures, prospectuses and other documentation.Malaysia: Deutsche Bank AG and/or its affiliate(s) may maintain positions in the securities referred to herein and may from time to time offer those securities for purchase or may have an interest to purchase such securities. Deutsche Bank may engage in transactions in a manner inconsistent with the views discussed herein.New Zealand: This research is not intended for, and should not be given to, "members of the public" within the meaning of the New Zealand Securities Market Act 1988.Russia: This information, interpretation and opinions submitted herein are not in the context of, and do not constitute, any appraisal or evaluation activity requiring a license in the Russian Federation.

· · page 19
Risks to Fixed Income PositionsMacroeconomic fluctuations often account for most of the risks associated with exposures to instruments that promise to pay fixed or variable interest rates. For an investor that is long fixed rate instruments (thus receiving these cash flows), increases in interest rates naturally lift the discount factors applied to the expected cash flows and thus cause a loss. The longer the maturity of a certain cash flow and the higher the move in the discount factor, the higher will be the loss. Upside surprises in inflation, fiscal funding needs, and FX depreciation rates are among the most common adverse macroeconomic shocks to receivers. But counterparty exposure, issuer creditworthiness, client segmentation, regulation (including changes in assets holding limits for different types of investors), changes in tax policies, currency convertibility (which may constrain currency conversion, repatriation of profits and/or the liquidation of positions), and settlement issues related to local clearing houses are also important risk factors to be considered. The sensitivity of fixed income instruments to macroeconomic shocks may be mitigated by indexing the contracted cash flows to inflation, to FX depreciation, or to specified interest rates – these are common in emerging markets. It is important to note that the index fixings may -- by construction -- lag or mis-measure the actual move in the underlying variables they are intended to track. The choice of the proper fixing (or metric) is particularly important in swaps markets, where floating coupon rates (i.e., coupons indexed to a typically short-dated interest rate reference index) are exchanged for fixed coupons. It is also important to acknowledge that funding in a currency that differs from the currency in which the coupons to be received are denominated carries FX risk. Naturally, options on swaps (swaptions) also bear the risks typical to options in addition to the risks related to rates movements.

· · page 20
Global DisclaimerThe information and opinions in this report were prepared by Deutsche Bank AG or one of its affiliates (collectively "Deutsche Bank"). The information herein is believed to be reliable and has been obtained from public sources believed to be reliable. Deutsche Bank makes no representation as to the accuracy or completeness of such information.Deutsche Bank may (1) engage in securities transactions in a manner inconsistent with this research report, (2) with respect to securities covered by this report, sell to or buy from customers on a principal basis, and (3) consider this report in deciding to trade on a proprietary basis.Opinions, estimates and projections in this report constitute the current judgment of the author as of the date of this report. They do not necessarily reflect the opinions of Deutsche Bank and are subject to change without notice. Deutsche Bank has no obligation to update, modify or amend this report or to otherwise notify a recipient thereof in the event that any opinion, forecast or estimate set forth herein, changes or subsequently becomes inaccurate. Prices and availability of financial instruments are subject to change without notice. This report is provided for informational purposes only. It is not an offer or a solicitation of an offer to buy or sell any financial instruments or to participate in any particular trading strategy.The financial instruments discussed in this report may not be suitable for all investors and investors must make their own informed investment decisions. Stock transactions can lead to losses as a result of price fluctuations and other factors. If a financial instrument is denominated in a currency other than an investor's currency, a change in exchange rates may adversely affect the investment. Past performance is not necessarily indicative of future results.Derivative transactions involve numerous risks including, among others, market, counterparty default and illiquidity risk. The appropriateness or otherwise of these products for use by investors is dependent on the investors' own circumstances including their tax position, their regulatory environment and the nature of their other assets and liabilities and as such investors should take expert legal and financial advice before entering into any transaction similar to or inspired by the contents of this publication. Trading in options involves risk and is not suitable for all investors. Prior to buying or selling an option investors must review the "Characteristics and Risks of Standardized Options," at http://www.optionsclearing.com/publications/risks/riskchap1.jsp . If you are unable to access the website please contact Deutsche Bank AG at +1 (212) 250-7994, for a copy of this important document.The risk of loss in futures trading, foreign or domestic, can be substantial. As a result of the high degree of leverage obtainable in futures trading, losses may be incurred that are greater than the amount of funds initially deposited.Unless governing law provides otherwise, all transactions should be executed through the Deutsche Bank entity in the investor's home jurisdiction. In the U.S. this report is approved and/or distributed by Deutsche Bank Securities Inc., a member of the NYSE, the NASD, NFA and SIPC. In Germany this report is approved and/or communicated by Deutsche Bank AG Frankfurt authorized by the BaFin. In the United Kingdom this report is approved and/or communicated by Deutsche Bank AG London, a member of the London Stock Exchange and regulated by the Financial Services Authority for the conduct of investment business in the UK and authorized by the BaFin. This report is distributed in Hong Kong by Deutsche Bank AG, Hong Kong Branch, in Korea by Deutsche Securities Korea Co. and in Singapore by Deutsche Bank AG,Singapore Branch. In Japan this report is approved and/or distributed by Deutsche Securities Inc. The information contained in this report does not constitute the provision of investment advice. In Australia, retail clients should obtain a copy of a Product Disclosure Statement (PDS) relating to any financial product referred to in this report and consider the PDS before making any decision about whether to acquire the product. Deutsche Bank AG Johannesburg is incorporated in the Federal Republic of Germany (Branch Register Number in South Africa: 1998/003298/10). Additional information relative to securities, other financial products or issuers discussed in this report is available upon request. This report may not be reproduced, distributed or published by any person for any purpose without Deutsche Bank's prior written consent. Please cite source when quoting.Copyright © 2009 Deutsche Bank AG

This presentation has been prepared for the Finity Niche Insurer Conference held on 11 November 2009. Finity Consulting Pty Limited (ABN 89 111 470 270) wishes it to be understood that opinions put forward herein are not necessarily those of Finity and Finity is not responsible for those opinions. The information presented at the conference was of a general nature and a reader of this presentation must seek their own independent advice before using it for any purpose.