australian dairy herd improvement report 2015
TRANSCRIPT

Australian Dairy Herd Improvement Report 2015

Copyright ADHIS Pty Ltd 2015. All rights reserved ©.
This Report is published for your information only. It is published with due care and attention to accuracy, but ADHIS and NHIA accept no liability if, for any reason, the information is inaccurate, incomplete or out of date whether negligent or otherwise.
All intellectual property rights in Australian Breeding Values (ABVTM) detailed in this publication are owned by ADHIS Pty Ltd. Neither the ABVs nor any part of this publication may be reproduced without the prior written permission of ADHIS Pty Ltd. Permission to reproduce or copy will not be given by ADHIS Pty Ltd where the proposed reproduction or copy may, in the sole opinion of ADHIS Pty Ltd, result in a use of the ABV that is likely to mislead or confuse stakeholders in the Australian dairy industry.
ADHIS is an Australian Dairy Farmers Ltd initiative that receives the majority of its funding from Dairy Australia through the Dairy Services Levy.
ADHIS acknowledges the contribution of the Victorian Department of Economic Development, Jobs, Transport and Resources.
Enquiries
ADHIS Pty Ltd ABN 97 006 475 378Level 2, Swann House22 William StreetMelbourne Victoria 3000T 03 8621 4240F 03 8621 [email protected]
National Herd Improvement Association of Australia Inc. Reg No. A0008711EUnit 1/112 Synnot Street Werribee VIC 3030 T 03 9742 7244 F 03 9742 7696 [email protected]
Photo acknowledgements: Thank you to Trevor Parrish, Craig Lister, Jason Birmingham and Jo Timperon, for supplying photographs and to all of the farmers who took time away from their businesses to enthusiastically participate in the photographs that appear in this report.

Australian Dairy Herd Improvement Report 2015 1
2015 in review ............................................................................................................................ 2NHIA Chairman’s report ........................................................................................................................................... 2
ADHIS Chairman’s report ..........................................................................................................................................3
Message from HIISSG .................................................................................................................................................4
ADHIS activity report .................................................................................................................................................6
ADHIS Board and Committees ...............................................................................................................................9
Partner projects .......................................................................................................................10InCalf ..............................................................................................................................................................................10
Countdown Downunder ..................................................................................................................................... 11
Dairy Futures CRC ................................................................................................................................................... 12
National Herd Recording Statistics 2014-2015 ...........................................................13
2015 Australian Breeding Values ......................................................................................24
Contents

2 Australian Dairy Herd Improvement Report 2015
2015 in review
NHIA Chairman’s report
By Graeme GillanNHIA Chairman
The National Herd Improvement Association is proud to co-operate with ADHIS in the production of this publication, which provides the Australian dairy industry with an important record of the level of productivity of the national dairy herd.
This has been a momentous year for the herd improvement sector in Australia.
For many years the sector has tried to find a way towards a more integrated and collaborative structure. Recognising the existence of too many ‘silos’ seemed easy compared to finding a solution where the industry can work together to improve the productivity of dairy farmers in Australia.
NHIA has been pleased this year to work with a number of our industry colleagues at Dairy Australia and ADHIS, among others, on the Herd Improvement Industry Strategic Steering Group (HIISSG ) to chart a way forward. Although sometimes slow, a great deal of progress has been made that will, I believe, have great benefits in the future.
We would especially like to acknowledge the leadership shown by Dr Matt Shaffer of Dairy Australia in this process.
It is vital that dairy farmers in Australia have access to the very best in herd improvement services and the service providers who make up the membership of NHIA work extremely hard to ensure that their customers have a wide variety of options in both herd testing as well as breeding, genetics and reproduction.
NHIA is co-investing in a number of research projects at present that we hope will lead to new and improved processes and products for herd testing. It is important that the Association and its members remain at the centre of animal performance recording. While it is too soon to talk about any results yet, we are optimistic about the project outcomes and look forward to communicating the results in due course.
The scientific advances made in the field of genomics in recent years have brought dramatic change to the artificial insemination sector. Genomics is providing us with so much more information but it is very important to realise that these estimates are only as good as the data we have to arrive at those estimates. We are in an era where we need more – not less – data to measure updated phenotypes to be current and relevant for our breeding programs today. Herd testing and linear classification will continue to be very important in the future.
I would like to thank our industry partners, Dairy Australia, ADHIS, the Victorian Government and all NHIA members for their contributions in the past twelve months. It is in working together that we can utilise the collective strengths that exist and which make the Australian dairy industry such a resilient and strong sector.

Australian Dairy Herd Improvement Report 2015 3
2015 in review
ADHIS Chairman’s report
By John Harlock ADHIS Chairman
Collaboration is integral to almost everything ADHIS does. While this year has seen some exciting achievements, it’s important to recognise that none would have been possible without the contribution from our various partners. Australia’s dairy herd improvement progress comes from the combination of world leading science and technology, input from the grass roots and contributions from the many organisations involved in between.
New indicesThis year has seen the delivery of some major improvements to breeding tools available to dairy farmers, most notably Australia’s three new indices. All have been received very favourably by industry, particularly farmers who welcome being able to choose an index that is aligned to their breeding priorities. Their development was based on an exhaustive consultation process conducted in 2014 which gave the clear message that farmers wanted indices to help them breed for profit as well as other priorities, particularly health and type.
Feed Saved ABVWith feed being a major cost in milk production, dairy farmers welcomed the arrival of the Feed Saved ABV in April. Developed by the Dairy Futures CRC, the Feed Saved ABV broke new ground as the first use of genomics to measure a trait that can’t be routinely measured on farm. While Australia is the first country in the world to provide a feed efficiency breeding value based on real feed intake data, it wouldn’t have been possible without an international collaboration of scientists. The Feed Saved ABV is based on data from an eight year project that measured the feed intake of almost 2000 heifers in Australia and New Zealand; combined with genomic results from the Netherlands and UK.
Herd 15ADHIS was delighted to again join with Holstein Australia and NHIA in hosting the biennial conference, Herd 15, which attracted more than
200 delegates from the dairy herd improvement industry. Herd 15 was the fourth conference in the series which began in 2009. Each event has attracted more delegates, having earned a reputation for offering exciting and relevant presenters and a unique opportunity to gather with others who are passionate about genetics.
New initiatives Collaboration in the herd improvement sector is set to be taken to another level with initiatives under development by the Herd Improvement Industry Strategic Steering Group (HIISSG).
The coming year will see some exciting initiatives come to fruition that will allow the herd improvement industry to derive greater value from herd recording and other data.
ThankyouI’d like to thank our out-going Chairman, Adrian Drury, who has led ADHIS through a sustained period of intense development. Some of the key initiatives under Adrian’s leadership have been the introduction of genomics, the Good Bulls Guide, the Feed Saved ABV and the review of the National Breeding Objective. He has left ADHIS in a good position for the changes ahead.
Thanks also to our many collaborators, including the Victorian Government and Dairy Futures CRC team, herd improvement organisations and the people from the field who keep us in touch with what’s needed by industry and what’s possible with technological advances.
And finally, I’d like to thank the staff of ADHIS for their on-going passion for dairy breeding and their commitment to delivering a quality service to industry. It is their determination on a daily basis to get the job done, regardless of the inevitable challenges that enables ADHIS to deliver value to the dairy industry.

4 Australian Dairy Herd Improvement Report 2015
A message from The Herd Improvement Industry Strategic Steering Group (HIISSG)
2015 in review
By Simone JolliffeChair, HIISG
The Herd Improvement Industry Strategic Steering Group (HIISSG) is a collective of industry experts and representatives who have come together to drive the implementation of the Herd Improvement Strategy 2020.
The bringing together of a broad group of Herd Improvement businesses with not-for-profit industry groups under the HIISSG banner enabled an industry-wide bid to address barriers to herd improvement. The HIISSG members did this by focusing their energies on the pre-competitive space and as a consequence the process will bring about transformative change in the herd improvement industry.
HIISSG, through a series of taskforces, set about the implementation of the Herd Improvement Strategy in a manner that concurrently tackled the big picture leadership, capability, structural and governance challenges; the value proposition of Herd Improvement (primarily through the Gardiner Foundation’s ImProving Herds project but also through driving efficiencies); while at the same time developed a range of practical tools and initiatives that delivered some immediate and tangible outcomes. The latter was a demonstration that collaboration in the pre competitive space was possible and as a consequence would make a direct contribution to farm profit.
HIISSG members and the sectors they represented were united in their vision. For example, they all agreed that:
▶ Genetics must be broadly accepted as a driver of farm profit – and to do that we needed to increase the number of farmers and advisors who recognise, promote and make decisions based on the link between genetic improvement and profit using Australian Breeding Values; and
▶ We needed a vibrant herd improvement industry offering effective and highly valued services, in order for farmers to make better herd management decisions and as a consequence drive farm productivity and profit.
In a comparatively short time frame, HIISSG has produced:
▶ A Good Bulls Smart Phone App (in partnership with ADHIS), that manages to combine user-friendliness with sophistication in order to provide a really practical way to sort bulls, create a bull list and make your semen order. Not only will this promote greater use of bulls listed in the Good Bulls Guide (that we know will drive profit improvements) the App is still promoting and driving an interface with your preferred semen supplier;
▶ A herd test report dashboard that will mean that by mid-2016, herd test reports will comprise a snapshot of herd health and performance, together with alerts and herd trends in the equivalent of two A4 pages;
▶ A series of feature articles that showcase the works and capability of Australia’s dairy geneticists – encouraging industry pride in not only the skills of this team, but their understanding of, and affinity for the industry they serve.
Throughout its tenure, HIISSG has been a strong advocate of the Gardiner-funded ImProving Herds project – considering this as the vehicle to provide the ultimate cost benefit demonstration of herd improvement. This project recognises that quantifying the benefit to farm profitability of best-practice herd improvement strategies, is best done when farmers go on a journey of ‘assisted

Australian Dairy Herd Improvement Report 2015 5
2015 in review
self-discovery’ and then tell other farmers! HIISSG considers ImProving Herds a valuable new route to market that brings to the fore the best available genetic management tools in a new format.
Without doubt, the unity created through the HIISSG initiative was a key factor in industry securing a highly competitive Australian Government R&D for Profit funding that will drive the next phase of profit-driver tools.
The Herd Improvement Strategy 2020 clearly said we were desperate for new and improved herd improvement services. As a consequence we now have a project that could turn the application of herd recording 180 degrees.
Instead of using herd recording data as an historical record of what has just occurred, the technology now exists to use a milk sample to offer predictions of a cow’s health performance over her life time. If this research project validates the technology in Australian conditions, it should mean that Australian dairy farmers will be able to manage and select their cows for the major drivers of profitability – production, feed efficiency, fertility, health and longevity – using data collected from milk samples.
While these works are going on, the single biggest challenge for the HIISSG collective has been to oversee the rationalisation of all relevant, pre-competitive herd improvement functions into a single entity.
The Herd Improvement Strategy 2020 clearly recommended a new model/structure that embraced
genetics, herd testing standards and data systems, was required to effectively deliver on the vision.
With a working title of ‘NewCo’ (New Company), the process of re-shaping the role of herd improvement in Australia by drawing together all relevant, pre-competitive herd improvement functions, is under way.
NewCo will work to deliver the long-held vision of a unified data repository, centralising the data collected by all Herd Improvement companies irrespective of their current IT platform.
But it will do much more than that.
This database system would facilitate a quantum leap in the capabilities of genetic evaluation and decision making and provide the value-add to herd improvement that industry has been seeking. This comes in large part due to the expected incorporation of on-farm data collected through various software packages that do not currently talk to the other industry databases. The driving principle from a farm perspective is single-entry, multi-use.
These developments will help improve data quality standards and so underpin quality assurance standards to support genetic evaluation and to create other services that are world’s best practice.
The HIISSG collective has highlighted that transformative change is possible in an environment of shared vision.
It is exciting times in this space.

6 Australian Dairy Herd Improvement Report 2015
ADHIS activity report
2015 in review
By Daniel Abernethy,ADHIS General
Manager
2015 has been a year of delivering on a range of key initiatives and improved service delivery. Such initiatives and improvements were implemented in response to the many conversations with our various stakeholders during the 2014 review of the national breeding objective.
Launch of the New Indices The most visible improvements to customer service for dairy farmers have been the delivery of the three new indices (BPI, HWI and TWI) and the Feed Saved ABV with the April ABV release. The delivery of these new indices was in a direct response to farmer and industry requests to provide greater alignment between farmers breeding objectives and the selection indices ADHIS produces. The new indices followed extensive industry consultation which has resulted in indices which directly relate to what farmers have told us is important to them.
A major initiative for 2015 has been to communicate these changes to our customers with the aim of reaching a far broader audience than we have in the past. The team delivered an innovative campaign, utilising both traditional and social media as well as face-to-face communication with farmers, their advisors and others in the artificial breeding industry.
The ever-popular Good Bulls Guide was revamped to align it with the new indices.
Our aim is to continually make it easier for farmers to select bulls that meet their individual breeding priorities. In an era of constantly changing technologies we have a number of initiatives under way to make breeding data more accessible, and in interactive formats.
For example, an app version of the Good Bulls Guide is under development. Rather than replacing the current format, this app will provide an additional, interactive platform and incorporate some of the functionality of the extremely popular, ‘Displayabull’ web tool.
Genomic Testing and ResearchThis year saw a leap in the number of dairy animals genotyped with industry partner Zoetis commencing a commercial dairy genomic testing service in conjunction with Holstein Australia. When the service was introduced in 2009, the main use was AB companies testing the genetic merit of young sires that may enter their bull teams. In the past year or so increasing numbers of dairy farmers are having females tested to guide their breeding decisions and fast-track genetic gain. Services for dairy farmers are still evolving and ADHIS has been working with Holstein Australia and Zoetis to develop services and reports that are relevant and user-friendly.
In addition to genomic testing by bull breeding companies and farmers, more than 40,000 animals have been genotyped as part of industry initiatives to 2015. These initiatives are aimed at continual improvement in genomic technology and the reliability of ABV(g)s for young sires. ADHIS acknowledges the significant contribution from the Dairy Futures CRC in driving the science behind genomic evaluations.
Industry Tools and Service DeliveryADHIS’ web-based facilities are ‘tools of the trade’ for many dairy farmers, bull companies and herd recording organisations. Users of the Displayabull tool will have noticed improvements to its searching capabilities. The inclusion of additional filters and use of common bull names makes it faster to find the right bull from the database of 300,000 animals.
Improving fertility and the health of our herd has been our top breeding priority for some time so the Health Weighted Index does a lot of the hard work for me.
– Tim Humphris, Northern Victoria

Australian Dairy Herd Improvement Report 2015 7
2015 in review
To support the above initiatives and major developments ADHIS has also invested significantly in the ‘engine room’. While the three new indices and the Feed Saved ABV have received most public attention, other improvements have included the new, Residual Survival ABV, new type expression, the move to a test day model, improved blending of information from genomic and overseas sources in ABVs and on-going work in re-writing the software (GESII) that underpins the current ADHIS genetic evaluation system.
NHIA and other herd improvement stakeholders to progress discussions around the future of genetic/herd improvement. A key outcome from these discussions is the proposal to establish a new herd improvement industry organisation. This exciting opportunity is aimed at maximising benefits to farmers from all investments and developments across herd improvement as a whole effectively becoming a ‘Centre of Excellence’ for the Australian Dairy Industry. In the coming year ADHIS looks forward to progressing this initiative and establishing a strong collective vision to drive farmer profits from improving the quality and management of their herds. I encourage you to keep an eye on these developments during 2016.
R&D activity summaryADHIS continues to invest in a range of research, development, extension, education and communication activities. Figure 2 highlights the impact of several 2015 developments.
10000
9000
8000
7000
6000
5000
4000
3000
2000
1000
0
2012/13 2013/14 2014/15
Total commercially genotyped females
Total commercially genotyped males
Figure 1: Cumulative total males and females
genotyped commercially in Australia 2012/13 – 2014/15.
‘NASIS registrations for large groups of bulls is now quick and painless as a result of streamlined ADHIS processes. ADHIS listened to their customers and revamped their services to better meet our needs.
– Bruce Ronalds, Business Operations Manager, ABS Australia
The future for Genetic Evaluation and Herd ImprovementOver the past year ADHIS has worked alongside Dairy Australia, Australian Dairy Farmers (ADF),

8 Australian Dairy Herd Improvement Report 2015
2015 in review
Figure 2: Highlights of ADHIS activities in 2015.Development Activity ImpactAustralia’s three new breeding indices
Following the National Breeding Objective review, ADHIS introduced Australia’s three new breeding indices in April 2015; Balanced Performance Index (BPI), Health Weighted Index (HWI) and Type Weighted Index (TWI). The indices are backed by strong science and in line with farmer preferences.
Three new indices aligned to farmer preferences means farmers now have more choice when selecting bulls for their herd.
Feed Saved ABV A world-first Feed Saved ABV was introduced in April 2015 following more than 8 years of dedicated research.
Farmers can now breed cows that produce the same amount of milk using less feed.
Residual Survival ABV
A new ABV for Residual Survival replaced the Survival ABV in the new indices. The Residual Survival ABV aims to estimate the benefit of factors for which we do not currently have an ABV
All the factors that contribute to survival are appropriately weighted in Australia’s three indices.
Good Bulls Guide A new look Good Bulls Guide was published and distributed in April and August 2015. The Good Bulls Guide provides data on bulls that are above average for profit (BPI), regardless of the country or company they come from.
Farmers can build their herds with confidence by selecting bulls from the Good Bulls Guide.
Genetic Progress Reports
Genetic Progress Reports were updated to include the Balanced Performance Index and mailed out to all farmers in August 2015.
The Genetic Progress Report lets farmers benchmark their herd against the average and top 10% and track their progress for profit and six key traits.
Web updates Improvements have been made to the search capabilities of the Displayabull tool on the ADHIS website.
Farmers and advisers have a better user experience when using Displayabull.
Herd Improvement Industry Strategic Steering Group
ADHIS is collaborating in many industry initiatives initiated by HIISSG; including the Good Bulls App, Improving Herds and MIR Profit projects.
The collaborative actions of HIISSG aim to drive improved farmer profit through the use of highly valued herd improvement services.
NCDEA breeding unit
Support NCDEA in the development and delivery of ‘Develop and Implement a Breeding Strategy’ unit from the Diploma of Agriculture program.
Farmers are supported with regional delivery of a formal training program in applied dairy cattle breeding.
Building the reference population
ADHIS continues to work closely with the Dairy Futures CRC and other industry partners to see the continued building of Australia’s genomic phenotype reference population.
Increasing the reliability of genomic breeding values means more confidence when selecting young bulls.
Genetic Evaluation System II
ADHIS is conducting a major genetic evaluation software upgrade.
ADHIS services will be more flexible and able to respond to new developments when new software commissioned in about two years.
Type expression Standardisation of type traits was introduced from April 2015. Standardising type traits makes it easier for farmers to assess how good an animal is for a trait.
GMACE (Genomic multi-across-country-evaluation)
ADHIS has collaborated with Interbull on new Interbull genomic breeding values for overseas bulls with no genotype recorded in Australia (also known as GMACE). August 2014 marked the first release of these breeding values which will be known as ABV(ig)s.
1000s of additional bulls can be reviewed for their suitability to Australian herds that would otherwise have no comparable Australian breeding value.
Test day model A new model for interpreting production herd test records was implemented for Ayrshire, Brown Swiss, Guernsey, Illawarra and Aussie Red Breeds and will be implemented for Holstein and Jersey breeds.
This new model improves the reliability of production trait ABVs for all breeds. It has also facilitated a greater sharing of international information for the Brown Swiss Breed.
Brown Swiss production ABV(i)s
After successfully completing Interbull testing, ADHIS began publishing Brown Swiss production ABV(i)s in April 2015.
Farmers who seek to use Brown Swiss bulls now have more information to make sound bull choices.
Improved blending of ABVs
New methodology to combine information from many sources was implemented in late 2015.
Bull companies and farmers using genotyping services will notice improved consistency between private and public ABV releases.
Genotyping ADHIS has been working with Holstein Australia and Zoetis to improve services and reports.
Reports that are easier to use increase the value of genotyping for farmers.

Australian Dairy Herd Improvement Report 2015 9
2015 in review
Stakeholder meetingsIn 2015 ADHIS hosted a number of industry technical meetings and participated in the HIISSG overall strategy including the genomic pipeline working group, and the genetics taskforce. These meetings provide ADHIS with a forum to discuss genetics and data in detail and for open discussion.
Genetics CommitteeThe Genetics Committee brings together scientists from a number of organisations to review genetic developments within ADHIS.
MembersProf. Mike Goddard (Chairman, University of Melbourne), Assoc. Prof. Julius Van der Werf (University of New England), Dr Bruce Tier (University of New England), Dr Rob Woolaston, Dr Mekonnen Haile-Mariam (DEDJTR), Assoc Prof Ben Hayes (DEDJTR), Dr Kevin Beard (ADHIS Consultant), Dr Gert Nieuwhof (ADHIS), Dr Kon Konstantinov (ADHIS), Daniel Abernethy (ADHIS) with support from Dr Jennie Pryce (DEDJTR).
Industry consultationEffective industry consultation underpins the ADHIS Strategic Plan. ADHIS achieves industry consultation across its activity areas through its committees, specific meetings with individuals and organisations, and regular stakeholder meetings. ADHIS values the input that it receives through the following committees and discussion forums.
ADHIS Board and CommitteesADHIS Board of ManagementThe Board met seven times during the year to govern the activities of ADHIS so that dairy farmers can maximise their opportunity to benefit from genetic improvement.
Members John Harlock (Chairman), Adrian Drury (retired Nov 2015), Lyndon Cleggett, Daryl Hoey, Matthew Shaffer, James Neal, Ian Cobbledick, Daniel Abernethy (General Manager and Secretary).
ADHIS staff
Daniel Abernethy, ADHIS General Manager
Genetic Evaluation National Data and Database Service
Kon Konstantinov, StatisticianTimothy Hancock, StatisticianJudith Schweitzer, Information Scientist
Michelle Axford, Extension ManagerPeter Williams, Extension OfficerSarah Saxton, Extension OfficerLee-Ann Monks, Communications SpecialistJodie Olden,Project Assistant
Education and Extension
Gert Nieuwhof, Geneticist and Team Leader
Paul Koh, Data and Services ManagerErica Jewell, Data and Services Manager
Type Evaluation Steering CommitteeA Type Steering Committee was established to recommend improvements to the evaluation and communication of linear type ABVs. This group has met throughout 2015 to analyse the results of a number of type related investigations. This is an important and ongoing area of work.
MembersGraeme Gillan (Chair of Type Evaluation Steering Committee and Holstein Australia), Scott Joynson (Jersey Australia), Dr Jennie Pryce (DEDJTR), Mekonnen Haile-Mariam (DEDJTR), Daryl Hoey (ADHIS Board and farmer), Christian Hickey (National Herd Development), Matthew Shaffer (Dairy Australia), Michelle Axford (ADHIS), Peter Williams (ADHIS), Bruce Ronalds (ABS Australia), Peter Thurn (Genetics Australia), Rohan Butler (Holstein Australia), Daniel Abernethy (ADHIS), Gert Nieuwhof (ADHIS).
Record Standards committeeThe Records Standards Committee provides representatives from data processing centres a forum to discuss data issues relating to herd improvement records and genetic evaluation.
MembersDr Matthew Shaffer (Chair of ADHIS Records & Standards Committee), John Stevenson (Dairy Express), Peter Nish (Tasherd), Frank Treasure (Farmwest), David Parkinson (AUSherd), Dr Gert Nieuwhof (ADHIS), Paul Koh (ADHIS), Daniel Abernethy (ADHIS).
Cameron Donnelly, ProgrammerDuncan Robertson, GESII System AdminSimon Jenkins, GESII Project ManagerSundeep Shetty, GESII Business Analyst
Operations
Glen Barrett, Operations Manager

10 Australian Dairy Herd Improvement Report 2015
Dr Richard Shephard InCalf Project Leader
03 5147 0307richard@herdhealth.
com.au
Partner project
InCalf report 2015
The latest ADHIS data shows that the slow decline in herd reproductive performance over the past few decades seems to have plateaued – if not reversed – in recent years. We now have the essential genetic tool for improving herd fertility – the Daughter Fertility ABV. This allows farmers to choose high-fertility bulls that also meet their other breeding objectives. If above-average daughter fertility bulls are used, the reproductive performance of the herd will improve over time. But, while this improvement is permanent and additive it will take many years for national fertility to reach the industry goal: a median 6-week in-calf rate of 60% by 2020. This means that farmers also need to focus on the other ‘environmental’ drivers of fertility.
The importance of good calf and heifer management cannot be overstated. A growing body of research on calf health and nutrition (pre-weaning and post-weaning) points to significant lifetime gains that can be achieved through better management of young stock. Young stock earn no income until they calve and lactate. Good rearing practices help ensure that heifers reach their target weight in time for mating and allows them with the best chance to get in calf early. Heifers that calve early in the calving period have longer recovery times before being mated again and have an increased likelihood of becoming pregnant and recalving early in the next year. We will soon have the findings from a PhD research project that shows the impact of colostrum management and other pre-weaning events on subsequent heifer performance and milk production in south-west Victoria.
The management of cows during the transition period also has profound and long-term impacts on cow health, production and reproduction. Cows that make good transitions into the new lactation are more likely to cycle, have fertile heats and become pregnant early in the mating period – and have
higher production. To encourage farmers to focus more on how to manage cows over their transition period, Dairy Australia has developed the Low Stress Calving farmer discussion group module. This two-hour informal session will be made available to farmer discussion groups in all dairy regions in the year ahead, supported by the more technical Transition Cow Management farmer workshops.
The InCalf project has been working closely with ADHIS to promote the importance of the new genetic tools to InCalf advisers and vets as part of their approach to improving herd reproductive performance. The 40+ Repro Right advisers trained under the InCalf project over the past two years are becoming a valuable resource to the industry. These advisers work mainly within veterinary practices, artificial breeding companies and herd consultancy businesses in all our dairy regions. They have completed 10 months of study on dairy reproduction to equip them to work one-on-one with farmers on herd fertility issues. Go to www.dairyaustralia.com.au/reproright for more information about these highly skilled advisers and services they offer.
Dairy Australia held the second InCalf Reproduction Symposium in October for advisers, service providers and leading farmers. The program presented by both international and local herd fertility experts had a strong emphasis on genetics, featuring two sessions by Dr Donagh Berry from Teagasc, Ireland, that demonstrated the power of genetics and better herd data recording to improve reproductive performance across the industry.
The key to success is to select and use good genetics but don’t stop there. The InCalf project aims to help farmers to optimise genetic improvements in their herds through consistent application of sound management practices.

Australian Dairy Herd Improvement Report 2015 11
Partner project
Mark Humphris Project Leader
Countdown Downunder
0428 561 440mark@themilkroad.
com.au
Dairy Australia’s Countdown project aims to improve profitability for dairy farmers and the industry through improved milk quality. The program promotes better udder health, milk quality and farm profitability through access to Countdown resources for both farmers and advisers.
Countdown MetricsLike many aspects of the dairy business, there is a great ability to use current data to inform decision making. With milk quality, daily BMCC data facilitates regular feedback on udder health to managers. Through great efforts of the original Countdown team, the sharing of BMCC data for the Milk Quality Awards, from all processors has allowed the recognition of herds that have achieved outstanding sustained milk quality. Celebrating success and the exploration of reasons behind it has been another way to share the broad range of controls necessary for excellent milk quality. This data set has also allowed monitoring of national trends since its inception in 2000. Figure 1 shows the steady increase in the percentage of herds with an annual BMCC less than 250 000 cells/mL. National BMCC Results – 2014
National BMCC Results – 2014
Countdown Update
research and technologies into milk quality with practicing dairy advisers providing milk quality advice to dairy farmers. One of the speakers, Dr. Donagh Berry from Ireland spoke on “Genetic selection for improved milk quality”.
Dr Berry built a convincing argument for the potential of genetics to improve milk quality, saying that there was lots of exploitable genetic variation for milk quality, milking speed and milk components to meet future demand for dairy products.
Although the industry has very good information on sub-clinical information (through individual somatic cell count testing), individual health data and in particular, clinical mastitis data, is lacking at present which reduces the potential for genetic improvement. Improved integration of health data generated on farm with the ADHIS database is required to maximise improvements in milk quality performance.
National Breeding Objectives
In the 2014 ADHIS review of the national breeding objectives, mastitis was identified as a top priority trait. Given this, it is great to observe a bigger weighting on mastitis resistance in the indices, facilitating improved genetic progress with milk quality.
Our small Countdown team is constantly reminded of the benefits of different professional groups combining to support improved milk quality on Australian dairy farms. Although there are always new developments in mastitis control, Countdown strives to use their resources, courses and webinars to promote consistent messaging to benefit hard working factory field staff, milking machine technicians, veterinarians and most of all, farmers.
Figure 3: Milk Quality trends over the past 5 years.
Countdown Symposium October 2015
Dairy Australia’s Countdown team organised a scientific Symposium in Melbourne in October. The symposium was designed to share the most recent
0%
10%
20%
30%
40%
50%
60%
70%
80%
2010 2011 2012 2013 2014
Perc
enta
ge o
f Her
ds
Annual average BMCC (2010-2014)
≤250 >250-≤400 >400
Genetic improvement programs require access to large quantities of data on individual animals to aid in differentiating between animals differing in genetic merit.
– Donagh Berry

12 Australian Dairy Herd Improvement Report 2015
Partner project
Dr David Nation, CEO,
Dairy Futures CRC
Dairy Futures CRC Report
Dairy Futures CRC has a diverse range of research projects underway, some aiming to improve specific traits of high economic value and others aiming to boost the overall reliability of genomic selection. An important focus during 2015 has been the launch of ADHIS’ new breeding indices, which use genomic information in the evaluation of all animals and include traits that incorporate our technology.
As we approach the end of our funding under the Commonwealth Government’s Cooperative Research Centre Program (in June 2016), we have a diverse range of innovation projects coming to fruition. Two projects already delivering benefits to farmers are outlined below.
New Feed Saved ABVThe new Feed Saved ABV, published for the first time in April 2015, is the outcome of eight years research and development. It allows farmers to identify bulls that can save at least 100kg of dry matter per cow per year while maintaining milk production at the same level.
Our researchers were among the first in the world to devise a way in which measured feed efficiency can be used for a breeding value that incorporates real feed intake data as well as a prediction of feed required for maintenance purposes. This extra data makes the trait more relevant.
The Balanced Performance Index, Health Weighted Index and Type Weighed Index all include Feed Saved, so farmers who choose elite bulls will be breeding for feed efficiency.
More reliable fertility ABVsThe current multi-trait model used in calculations for fertility ABVs was introduced in 2013 as a result of a joint ADHIS-CRC project. Since then, the fertility project has substantially increased the amount of fertility data used in genetic evaluations by capturing data from farm and vet software that did not previously download to the national database. We have also been working together to inject data from 100 dairy herds into the national database (the Ginfo project).
The goal of all this work has been to improve the reliability of fertility ABVs, enabling farmers to more effectively breed for this trait. Our evaluation shows that, for bulls with fewer than 50 Australian daughters, fertility ABV reliability increased by 19 per cent between April 2012 (just before the introduction of the multi-trait model) and April 2015. Over the same period, the number of very high (at least 109) Fertility ABV bulls almost doubled, from 1.9% to 3.5% of Australian proven bulls. The three new breeding indices all include this improved fertility trait.
For more information about these and other Dairy Futures CRC projects, visit our website: www.dairyfuturescrc.com.au .

Australian Dairy Herd Improvement Report 2015 13
National Herd Recording Statistics 2014-2015
The practice of herd recording delivers reliable information for on-farm decision making. Every year, this data is compiled and published to facilitate a broader analysis of herd and production trends.
Tables 1-13 describe production trends by age, breed, mating type and region. As some data in this report dates back to the 1930s, you will find a rich resource describing Australia’s changing herd.
Statistics for previous years and further file formats are available at www.adhis.com.au
Herd Recording Statistics
Table 1 : National and State Totals and Production Averages.
State Numberof Herds
Herds and Cows Recorded Production Averages
Includedin
Averages
Excludedfrom
Averages
TotalCows
HerdSize
Milklitres
Fat%
Fatkg
Protein%
Proteinkg
LactationLength
days
Victoria 1,854 292,645 126,876 419,521 226.3 6,826 4.1 278 3.4 230 322
New South Wales 389 78,240 23,130 101,370 260.6 7,604 3.9 294 3.2 247 336
Queensland 171 18,639 8,994 27,633 161.6 5,961 4.0 238 3.3 195 332
South Australia 193 38,323 6,949 45,272 234.6 7,533 3.8 286 3.3 245 336
Tasmania 165 40,120 17,921 58,041 351.8 6,444 4.0 257 3.4 221 296
Western Australia 108 25,615 3,085 28,700 265.7 7,563 3.8 286 3.2 240 344
Australia 2,880 493,582 186,955 680,537 236.3 6,979 4.0 278 3.3 232 324
Victorian regions
Northern 705 106,309 43,373 149,682 212.3 7,278 4 291 3.4 245 332
Eastern 673 107,310 47,872 155,182 230.6 6,445 4.1 266 3.4 217 316
Western 476 79,026 35,631 114,657 240.9 6,736 4.1 277 3.4 226 315
Table 1a : National Totals and Production Averages 1999 to 2015.
Year Number of Herds
Herds and Cows Recorded Production Averages
Included in Averages
Excluded from
Averages
Total Cows
Herd Size
Milk litres
Fat %
Fat kg
Protein %
Protein kg
Lactation Length
days
1999/2000 6,976 947,104 81,129 1,028,233 147.4 5,691 4 230 3.3 187 302
2000/2001 7,405 940,712 286,248 1,226,960 165.7 5,682 4 229 3.3 186 302
2001/2002 6,930 888,497 303,269 1,191,766 172 6,027 4 243 3.3 200 307
2002/2003 6,358 842,113 335,786 1,177,899 185.3 5,877 4 235 3.3 193 303
2003/2004 5,704 722,074 298,727 1,020,801 179 6,048 4.0 242 3.3 201 310
2004/2005 5,080 725,374 224,352 949,726 187 6,257 4.0 251 3.3 207 314
2005/2006 4,746 701,852 208,536 910,388 191.8 6,402 4.0 255 3.3 212 316
2006/2007 4,462 655,212 222,592 877,804 196.7 6,452 4.0 257 3.3 216 312
2007/2008 3,966 578,263 207,199 785,462 198 6,596 4.0 264 3.3 220 321
2008/2009 3,779 566,029 206,694 772,723 204.5 6,645 4.1 270 3.4 223 318
2009/2010 3,503 522,869 201,400 724,269 206.8 6,680 4.0 270 3.3 223 323
2010/2011 3,359 518,675 186,915 705,590 210.1 6,813 4.0 273 3.3 228 323
2011/2012 3,301 525,908 205,174 731,082 221.5 6,930 4.0 274 3.3 231 324
2012/2013 3,173 511,923 195,896 707,819 223.1 6,881 4.0 272 3.3 229 322
2013/2014 3,023 492,461 180,638 673,099 222.7 6,890 4.0 273 3.3 228 327
2014/2015 2,880 493,582 186,955 680,537 236.3 6,979 4.0 278 3.3 232 324

14 Australian Dairy Herd Improvement Report 2015
Table 2: Number of herds in fat production categories by region.State Total
herdsAverage fat production (kg per cow)
< 125 125-149 150-174 175-199 200-224 225-249 250-274 275-299 300-324 > 324Victoria 1,854 39 40 54 95 147 216 293 344 224 166New South Wales 389 10 4 9 22 26 47 67 73 54 43Queensland 171 15 8 11 19 22 23 16 13 7 12South Australia 193 0 2 6 8 13 18 42 36 31 28Tasmania 165 2 4 6 18 19 30 25 26 11 9Western Australia 108 1 0 3 0 7 11 15 27 19 21Australia 2,880 67 58 89 162 234 345 458 519 346 279Victorian regionsNorthern 705 8 11 14 26 39 68 110 146 105 99
Eastern 673 14 16 17 45 70 95 118 125 61 27
Western 476 17 13 23 24 38 53 65 73 58 40
National Herd Recording Statistics 2014-2015
Table 4: Production averages by age group.Age group Number of
cowsProduction averages Lactation
length daysMilk litres Fat % Fat kg Protein % Protein kg
2 Year Old 91,027 6,166 3.95 244 3.34 206 329
3 Year Old 87,329 6,860 3.96 272 3.36 230 327
Mature Cow 315,226 7,246 4.00 290 3.32 240 322
Total 493,582 6,979 3.99 278 3.33 232 324
Table 3: Number of herds in protein production categories by region.State Total
herdsAverage protein production (kg per cow)
< 100 100-124 125-149 150-174 175-199 200-224 225-249 250-274 275-299 > 299
Victoria 1,854 43 42 98 162 236 319 331 208 124 55
New South Wales 389 9 7 18 25 50 65 80 57 24 20
Queensland 171 14 10 17 18 31 23 18 8 3 4
South Australia 193 0 2 6 15 23 35 40 28 22 13
Tasmania 165 1 6 10 25 27 26 28 9 9 9
Western Australia 108 1 1 2 3 8 24 23 28 12 2
Australia 2,880 68 68 151 248 375 492 520 338 194 103
Victorian regions
Northern 705 7 12 25 45 63 122 133 112 70 37
Eastern 673 17 15 43 77 107 125 123 50 23 8
Western 476 19 15 30 40 66 72 75 46 31 10
Table 5: Production averages by age group and mating type.Age group Number
of cowsAverage fat (kg) Average protein (kg)
Artificially bred stock Naturally bred stock Artificially bred stock Naturally bred stock
2 Year Old 91,027 249 232 211 194
3 Year Old 87,329 281 255 240 214
Mature Cow 315,226 306 270 254 223
Total 493,582 289 262 242 217

Australian Dairy Herd Improvement Report 2015 15
National Herd Recording Statistics 2014-2015
1999
/200
020
01/2
002
2003
/200
420
05/2
006
2007
/200
820
09/2
010
2011
/201
220
13/2
014
290270250230210190170150
kg/c
ow/y
ear
Fat kg
Protein
Figure 4: Trend in fat and protein yields in herd recorded cows
1999-2015.
2 Year Old 3 Year Old Mature Cow Total
350
300
250
200
150
100
50
0
kg/c
ow
Fat Production AI
Fat Production Herd Bull
Protein Production AI
Protein Production Herd Bull
Figure 5: Fat and Protein production per cow bred by AI
and Natural bull.
Trends in the production of herd recorded cowsThe milk solid yields of herd recorded cows have increased by almost 100 kg/cow/year since 1999. After two years of decline in average milk solid yields, herd recorded cows have increased by 9kg milk solids/cow/year (2%) compared to 2014.
Where’s the bull?At $6/kg MS, the difference in production between progeny of AI and Natural sires is worth an impressive $312 in extra milk solids per cow per year. AI sires have higher genetic merit and are more profitable because they have been selected for production but also because of their benefits in delivering other economically important traits
like longevity, fertility, type, health, feed saved and workability characteristics. Not only do the daughters of higher genetic merit sires produce well, they are just as likely (if not more likely) to last in the herd compared to daughters of lower genetic merit sires in Australia’s wide range of feeding systems (Feeding the Genes, 2013).

16 Australian Dairy Herd Improvement Report 2015
National Herd Recording Statistics 2014-2015
Table 6 : Production averages by percentage of artificially bred cows in herds.Percentage of artificially bred cows in herd
Number of herds Production averagesMilk litres Fat kg Protein kg
< 10 534 6,038 244 20310-19 142 6,601 262 21920-29 143 6,643 264 22030-39 157 6,414 259 21440-49 202 6,974 275 23050-59 251 7,207 288 24060-69 291 7,053 280 23370-79 351 7,419 294 24580-89 342 7,202 288 241> 89 467 7,385 293 246Total 2,880 6,979 278 232
Table 7: Production averages by breed.Breed Number of
cowsProduction averages
Milk litres Fat % Fat kg Protein % Protein kg Lactation length days
Holstein 315,574 7,494 3.85 288 3.26 244 331Jersey 55,633 5,381 4.80 258 3.67 198 313Holstein/Jersey Cross 23,567 6,371 4.40 280 3.51 224 311Guernsey 1,379 5,645 4.31 243 3.37 190 330Ayrshire 3,085 5,704 4.18 239 3.40 194 313Dairy Shorthorn 376 5,338 3.88 207 3.29 175 301Illawarra 4,901 6,540 3.97 260 3.28 214 321Unknown Breed 71,277 6,430 4.00 257 3.36 216 315Simmental 76 6,534 4.05 265 3.35 219 326Red Poll 49 3,576 5.31 190 3.73 134 300Meuse-Rhine-Issel 66 5,489 4.11 226 3.48 191 308Aust Milking Zebu 7 6,193 3.66 227 3.21 199 330Commercial Dairy 2 7,288 3.97 290 3.20 233 340Aust Red Breed 13,958 6,361 4.16 265 3.43 218 311Brown Swiss 3,614 6,217 4.07 253 3.45 214 325Aust Friesian Sahiwal 18 7,442 4.07 303 3.30 245 325Total 493,582 6,979 3.99 278 3.33 232 324
National Herd Recording Statistics 2014-2015
05
101520253035404550
2&3 year old 4&5 year old 6&7 year old 8 & over
Age distribu�on of herd recorded cows by breed (at most recent calving)
Holstein
Jersey
Red Breeds
Figure 6: Age distribution of herd recorded cows by breed
(at most recent calving).

Australian Dairy Herd Improvement Report 2015 17
National Herd Recording Statistics 2014-2015 National Herd Recording Statistics 2010-2011
Table 8: Production averages by month of calving.Month of calving
Number of cows
% of total Production averages Lactation length days
Milk litres Fat % Fat kg Protein % Protein kgJanuary 15,992 3.2 7,109 3.87 275 3.26 232 344February 28,046 5.7 7,403 3.87 287 3.29 244 342March 51,666 10.5 7,347 3.93 289 3.34 245 337April 51,994 10.5 7,228 3.95 286 3.34 242 332May 43,526 8.8 7,118 3.97 282 3.33 237 327June 36,198 7.3 6,922 4.01 277 3.33 231 320July 47,492 9.6 6,762 4.06 274 3.35 227 316August 88,527 17.9 6,772 4.08 276 3.37 228 309September 69,457 14.1 6,769 4.02 272 3.32 225 318October 33,109 6.7 6,814 3.97 270 3.27 223 326November 15,816 3.2 6,857 3.92 269 3.24 222 335December 11,759 2.4 7,025 3.87 272 3.22 226 344Australia 493,582 100 6,979 3.99 278 3.33 232 324
Holstein75%
Jersey13%
Holstein/Jersey Cross6%
Red Breed Group5% Other
1%
Figure 8: Distribution of breeds.
1999/2000
2014/2015
Jan
Feb
Mar
Apr
May
Jun
Jul
Aug
Sep
Oct
Nov
Dec
% o
f cow
s ca
lved
eac
h m
onth
(Aus
tral
ia)
25
20
15
10
5
0
Figure 7: Distribution of calvings by month.
National Herd Recording Statistics 2014-2015
Trends in the calving pattern of herd recorded cows
Over the past 15 years, the proportion of cows calved between July and September has dropped by more than 10%. The proportion of cows calved in March and April has almost doubled. Having the right calving pattern is an important contributor to profit and is influenced by many factors, including milk pricing, feeding systems and cow fertility.
18 Australian Dairy Herd Improvement Report 2015
National Herd Recording Statistics 2014-2015National Herd Recording Statistics 2014-2015
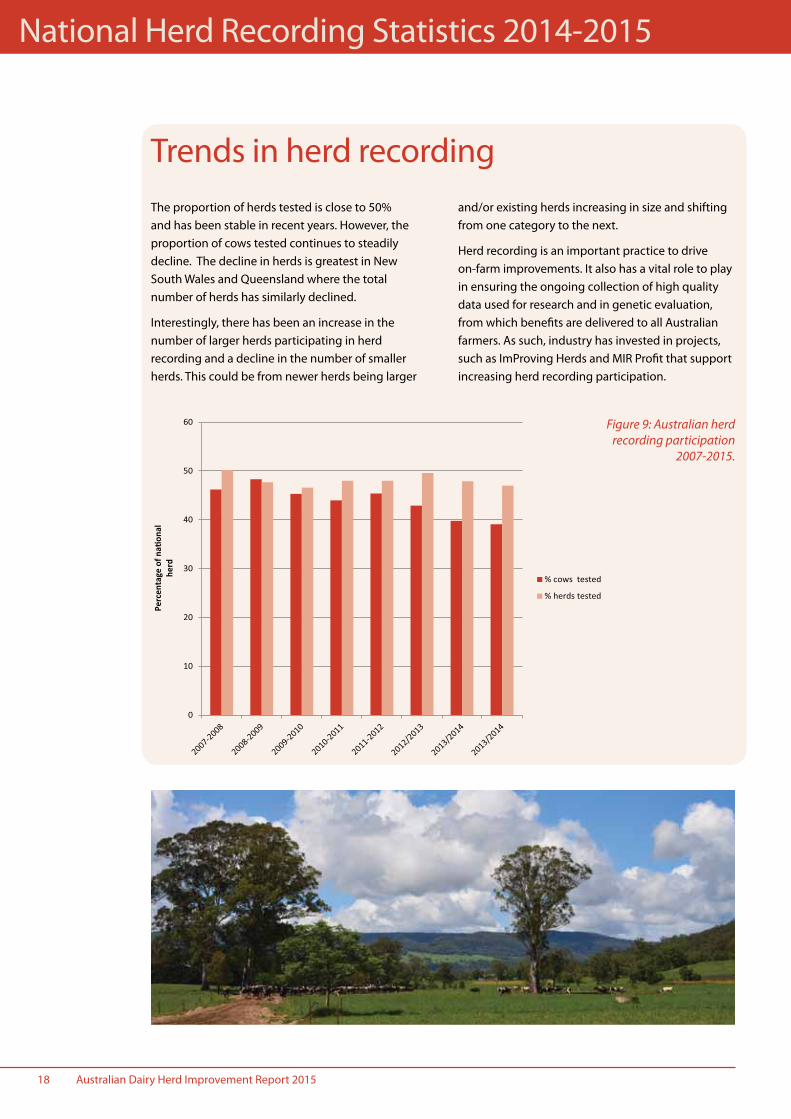
The proportion of herds tested is close to 50% and has been stable in recent years. However, the proportion of cows tested continues to steadily decline. The decline in herds is greatest in New South Wales and Queensland where the total number of herds has similarly declined.
Interestingly, there has been an increase in the number of larger herds participating in herd recording and a decline in the number of smaller herds. This could be from newer herds being larger
and/or existing herds increasing in size and shifting from one category to the next.
Herd recording is an important practice to drive on-farm improvements. It also has a vital role to play in ensuring the ongoing collection of high quality data used for research and in genetic evaluation, from which benefits are delivered to all Australian farmers. As such, industry has invested in projects, such as ImProving Herds and MIR Profit that support increasing herd recording participation.
Trends in herd recording
0
10
20
30
40
50
60
Perc
enta
ge o
f na�
onal
he
rd
% cows tested
% herds tested
Figure 9: Australian herd recording participation
2007-2015.

Australian Dairy Herd Improvement Report 2015 19
Table 9: Production averages by breed, age group, mating type and registration.Breed Type Number of
cowsProduction averages
Milk litres
Fat % Fat kg Protein %
Protein kg
Lactation length days
Holstein 2-year-old 60,331 6,573 3.78 249 3.27 215 335
3-year-old 58,637 7,331 3.80 278 3.29 241 333
Mature cow 196,606 7,825 3.88 303 3.25 254 328
Total 315,574 7,494 3.85 288 3.26 244 331
Artifically bred 219,303 7,721 3.83 296 3.26 251 333
Naturally bred 96,271 6,975 3.89 271 3.26 228 325
Pure bred 56,338 8,331 3.75 312 3.20 267 347
Grade 259,236 7,312 3.87 283 3.27 239 327
Jersey 2-year-old 11,989 4,921 4.73 233 3.61 178 319
3-year-old 10,991 5,263 4.84 255 3.69 194 314
Mature cow 32,653 5,591 4.80 269 3.68 206 310
Total 55,633 5,381 4.80 258 3.67 198 313
Artifically bred 35,199 5,484 4.87 267 3.70 203 315
Naturally bred 20,434 5,205 4.66 243 3.61 188 310
Pure bred 13,980 5,718 4.91 281 3.71 212 327
Grade 41,653 5,269 4.76 251 3.66 193 308
Holstein/Jersey Cross
2-year-old 4,428 5,632 4.37 246 3.47 196 316
3-year-old 4,979 6,230 4.42 275 3.55 221 311
Mature cow 14,160 6,652 4.40 293 3.51 234 310
Total 23,567 6,371 4.40 280 3.51 224 311
Artifically bred 9,136 6,548 4.42 289 3.54 232 313
Naturally bred 14,431 6,259 4.39 275 3.50 219 311
Pure bred 0 0 0 0 0 0 0
Grade 23,567 6,371 4.40 280 3.51 224 311
Guernsey 2-year-old 243 4,797 4.39 211 3.36 161 324
3-year-old 278 5,529 4.29 237 3.39 187 342
Mature cow 858 5,922 4.30 255 3.37 199 328
Total 1,379 5,645 4.31 243 3.37 190 330
Artifically bred 557 5,597 4.43 248 3.39 190 334
Naturally bred 822 5,677 4.24 241 3.36 191 328
Pure bred 250 5,299 4.31 228 3.36 178 346
Grade 1,129 5,721 4.31 247 3.37 193 327
Ayrshire 2-year-old 544 4,741 4.27 202 3.41 162 322
3-year-old 547 5,549 4.17 231 3.40 189 322
Mature cow 1,994 6,009 4.17 250 3.40 204 307
Total 3,085 5,704 4.18 239 3.40 194 313
Artifically bred 1,692 5,885 4.24 249 3.44 202 317
Naturally bred 1,393 5,484 4.11 226 3.36 184 307
Pure bred 651 5,851 4.10 240 3.35 196 328
Grade 2,434 5,665 4.21 238 3.42 194 309
National Herd Recording Statistics 2014-2015 National Herd Recording Statistics 2010-2011National Herd Recording Statistics 2014-2015

20 Australian Dairy Herd Improvement Report 2015
Table 9: Production averages by breed, age group, mating type and registration (continued).
Breed Type Number of cows
Production averages
Milk litres
Fat % Fat kg Protein %
Protein kg
Lactation length days
Illawarra 2-year-old 713 5,889 4.03 237 3.31 195 336
3-year-old 1,126 6,137 3.94 242 3.31 203 328
Mature cow 3,062 6,840 3.97 272 3.26 223 316
Total 4,901 6,540 3.97 260 3.28 214 321
Artifically bred 2,639 6,837 3.99 273 3.29 225 322
Naturally bred 2,262 6,194 3.95 245 3.26 202 321
Pure bred 1,665 6,853 3.88 266 3.24 222 327
Grade 3,236 6,379 4.02 257 3.30 210 319
Unknown Breed 2-year-old 8,886 5,768 4.02 232 3.42 197 317
3-year-old 7,093 6,513 3.99 260 3.42 223 312
Mature cow 55,298 6,526 4.00 261 3.35 218 315
Total 71,277 6,430 4.00 257 3.36 216 315
Artifically bred 2,273 7,232 3.89 281 3.33 241 319
Naturally bred 69,004 6,404 4.01 257 3.36 215 315
Pure bred 0 0 0 0 0 0 0
Grade 71,277 6,430 4.00 257 3.36 216 315
Aust. Red Breed 2-year-old 3,104 5,558 4.15 231 3.42 190 319
3-year-old 2,944 6,253 4.14 259 3.47 217 312
Mature cow 7,910 6,716 4.17 280 3.42 230 308
Total 13,958 6,361 4.16 265 3.43 218 311
Artifically bred 12,698 6,447 4.16 268 3.43 221 312
Naturally bred 1,260 5,493 4.19 230 3.41 187 304
Pure bred 1,379 7,175 3.77 270 3.38 242 322
Grade 12,579 6,272 4.21 264 3.44 216 310
Brown Swiss 2-year-old 701 5,472 3.99 219 3.41 187 323
3-year-old 628 5,924 4.00 237 3.45 204 328
Mature cow 2,285 6,526 4.11 268 3.45 225 325
Total 3,614 6,217 4.07 253 3.45 214 325
Artifically bred 2,355 6,364 4.09 260 3.47 221 328
Naturally bred 1,259 5,943 4.04 240 3.40 202 320
Pure bred 1,296 6,410 4.03 258 3.50 224 346
Grade 2,318 6,110 4.10 251 3.42 209 314
Other Breeds 2-year-old 88 5,148 3.97 204 3.34 172 305
3-year-old 106 5,364 3.95 212 3.32 178 322
Mature cow 400 5,528 4.05 224 3.35 185 302
Total 594 5,443 4.05 219 3.35 182 306
Artifically bred 251 6,171 3.95 244 3.34 206 305
Naturally bred 343 4,910 4.08 200 3.34 164 306
Pure bred 21 4,318 3.99 172 3.26 141 288
Grade 573 5,484 4.02 220 3.34 183 306
National Herd Recording Statistics 2014-2015National Herd Recording Statistics 2014-2015

Australian Dairy Herd Improvement Report 2015 21
National Herd Recording Statistics 2014-2015
Figure 10: Percentage of herds in AI usage groups 2003-2015.
National Herd Recording Statistics 2014-2015
2003/04
2005/06
2007/08
2009/10
2011/12
2012/13
2013/14
2014/15
50%
40%
30%
20%
10%
0%
<50% of herd sired by AI
50-79% of herd sired by AI
>80% of herd sired by AI
Better herd analysis through recording siresCalf records serve a variety of purposes, including establishing an animal’s pedigree, which influences its breeding values and estimate of profit. For most dairy businesses, the herd is the second most valuable asset so it’s worth looking after the information that contributes to that value.
The trend continues towards poorer recording of sires of calves. At a time when computerised record keeping systems make it relatively easy to store information, the proportion of herds with very good sire IDs has declined by about 5% in the past 10 years while the proportion of herds with poor sire IDs has increased similarly.
One way to make sure sire IDs aren’t forgotten is to record at birth and send the information to the herd recording centre. Having calf records entered into the system from an early age means the herd’s genetic progress report will show the impact of more recent breeding decisions. Having this feedback sooner means farmers can take action earlier if needed. Without calf records, the Genetic Progress Report will always be lagging for the most recent two years.
It’s definitely worth making the effort to get paddock records into the herd recording system as soon as possible.

22 Australian Dairy Herd Improvement Report 2015
Table 11: Production averages of stud cows.Breed Number of
cowsProduction averages
Milk litres Fat % Fat kg Protein % Protein kg Lactation length days
Holstein 56,338 8,331 3.75 312 3.20 267 347
Jersey 13,980 5,718 4.91 281 3.71 212 327
Guernsey 250 5,299 4.31 228 3.36 178 346
Ayrshire 651 5,851 4.10 240 3.35 196 328
Illawarra 1,665 6,853 3.88 266 3.24 222 327
Aust Red Breed 1,379 7,175 3.77 270 3.38 242 322
Brown Swiss 1,296 6,410 4.03 258 3.50 224 346
Total 75,559 7,730 3.98 303 3.31 254 342
Table 12: Production averages of artificially bred stud cows.Breed Number
of cowsProduction averages
Milk litres Fat % Fat kg Protein % Protein kg Lactation length days
Holstein 46,428 8,411 3.74 315 3.20 269 348
Jersey 11,107 5,787 4.91 284 3.71 215 327
Guernsey 117 5,353 4.30 230 3.30 177 355
Ayrshire 381 5,958 4.08 243 3.33 198 333
Illawarra 968 7,074 3.89 276 3.25 230 329
Aust Red Breed 1,336 7,206 3.76 271 3.37 243 322
Brown Swiss 938 6,471 4.03 261 3.51 227 348
Total 61,275 7,837 3.97 306 3.31 257 343
Table 10: Distribution of calvings by month and region.State Percentage of cows that calved each month
Jan Feb Mar Apr May Jun Jul Aug Sep Oct Nov Dec
Victoria 1 4 11 11 10 8 11 20 14 6 2 1
New South Wales 7 8 11 9 8 8 10 10 9 7 6 6
Queensland 10 9 10 9 10 9 8 8 7 6 6 7
South Australia 6 9 10 10 9 6 7 12 14 9 5 4
Tasmania 1 3 8 10 4 1 4 31 26 9 2 1
Western Australia 9 12 12 9 8 6 5 9 11 7 5 7
Australia 3 6 10 11 9 7 10 18 14 7 3 2
Victorian regions
Northern 1 4 13 14 7 4 7 23 16 7 3 1
Eastern 1 3 9 8 6 7 16 25 16 6 1 1
Western 2 6 9 12 17 16 11 10 9 5 2 1
National Herd Recording Statistics 2014-2015National Herd Recording Statistics 2014-2015

Australian Dairy Herd Improvement Report 2015 23
Table 13: Victorian production averages 1930/1931 – 2014/2015.Year Total herds Total cows Herd size Production averages
Milk litres Fat % Fat kg Protein % Protein kg
1930/1935 2,984 91,328 31 2,295 4.7 107
1935/1940 2,324 80,883 35 2,210 4.9 108
1940/1945 1,082 39,368 36 2,154 4.9 105
1945/1950 2,329 90,015 39 2,301 5.0 114
1950/1955 3,192 141,387 44 2,284 5.0 114
1955/1960 3,461 187,306 54 2,485 5.1 126
1960/1965 4,003 248,791 62 2,643 5.0 132
1965/1970 5,041 368,300 73 2,793 4.9 137
1970/1975 4,314 382,925 89 2,942 4.7 139
1975/1980 2,456 256,744 105 3,159 4.5 143
1980/1985 3,913 423,120 108 3,471 4.5 155
1985/1990 4,399 527,240 120 4,047 4.4 180 3.3 134
1990/1991 4,402 568,885 129 4,245 4.4 186 3.4 142
1991/1992 4,061 517,760 128 4,477 4.4 196 3.4 150
1992/1993 4,293 552,445 129 4,708 4.4 205 3.4 158
1993/1994 4,606 604,160 131 4,962 4.3 212 3.3 166
1994/1995 4,591 574,674 125 4,976 4.2 210 3.3 164
1995/1996 4,685 606,198 129 5,142 4.2 215 3.3 169
1996/1997 4,928 619,470 126 4,984 4.2 208 3.3 163
1997/1998 4,328 624,428 144 5,084 4.1 208 3.3 167
1998/1999 4,156 641,106 154 5,350 4.1 220 3.3 177
1999/2000 3,904 622,281 159 5,570 4.1 227 3.3 184
2000/2001 4,267 761,219 178 5,527 4.0 223 3.3 182
2001/2002 4,198 757,029 180 5,969 4.0 240 3.3 198
2002/2003 3,831 738,329 193 5,705 4.0 230 3.3 187
2003/2004 3,414 624,002 183 5,841 4.0 236 3.3 194
2004/2005 3,079 586,566 191 6,083 4.0 245 3.3 202
2005/2006 2,933 572,906 195 6,205 4.0 248 3.3 206
2006/2007 2,775 554,136 200 6,245 4.0 250 3.4 209
2007/2008 2,431 484,030 199 6,423 4.0 259 3.3 215
2008/2009 2,313 478,612 207 6,458 4.1 266 3.4 218
2009/2010 2,127 437,811 206 6,443 4.1 265 3.4 217
2010/2011 2,036 428,660 211 6,588 4.1 268 3.4 222
2011/2012 2,050 453,465 221 6,731 4.0 270 3.4 226
2012/2013 1,977 433,383 219 6,694 4.0 268 3.3 224
2013/2014 1,892 409,743 217 6,709 4.0 270 3.3 225
2014/2015 1,854 419,521 226 6,826 4.1 278 3.4 230
National Herd Recording Statistics 2014-2015 National Herd Recording Statistics 2010-2011National Herd Recording Statistics 2014-2015

24 Australian Dairy Herd Improvement Report 2015
2015 Australian Breeding Values – Genetic Trends
Over the past decade, about one third of productivity improvements achieved by Australian farmers are credited to better genetics. Since ADHIS was established in 1983, farmers have had access to independent information to make breeding choices in the form of Australian Breeding Values (ABVs). ABVs are the best estimate of the genetic merit of animals and reflect the performance of animals in Australian production systems. ABVs are a proven effective tool to improve the genetic merit of herds.
Because the impact of genetics is gradual and compounding it can be difficult to see the benefits, leading some farmers and advisors to question whether ABVs make a difference. ADHIS is committed to demonstrating the value of genetics and recognising those who show a commitment to breeding the country’s leading dairy cow genetics. In 2015 ADHIS recognised the highest performing herds on the new Balanced Performance Index (BPI) across each
dairying region. The achievements made by these herds received considerable regional media attention and lead to the inaugural DairySA highest BPI awards at the DairySA Gala dinner. Australia’s top ranking Red Breeds herds are recognised at the annual Red breeds red tie gala dinner. A list of Australia’s top ranking herds can be found on pages 31 and 32 of this report. Many years of careful breeding are required to feature in this list. Congratulations to the farmers who have bred this year’s top herds.
This year also saw the inaugural highest BPI Holstein cow award presented at the Victorian Winter Fair. The winning cow, Elmar Goldwyn Jessica 4, topped the award with a BPI of 255, well above the breed average of 0. Bred and owned by the Hore family at Leitchville, Jessica 4 represented the sort of cow that many dairy farmers aspire to breed. ADHIS looks forward to continuing this award at future Victorian Winter Fairs.
Farmers continue to make effective choices in improving their herds’ genetic merit as demonstrated in Figures 11-14.
P25-26 Are you willing to leave profit on the table? Figures 11-13 illustrate the genetic improvement for Australia’s three breeding indices; the Balanced Performance Index (BPI), the Health Weighted Index (HWI), and the Type Weighted Index (TWI).
P27 Fertility trends improve Figure 14 illustrates the recent improvements we have seen in the genetic trend for the Daughter fertility ABV.
P28-30 Good Bulls Guide A list of the 2015 leading proven Australian bulls and the brightest young genomically selected sires.
P31-32 Top Herds Summary A summary of the high achieving herds for 2015.

Australian Dairy Herd Improvement Report 2015 25
2015 Australian Breeding Values – Genetic Trends
Figure 11: Genetic trend of Australian Holstein cows for profit indices. Herd
recorded and sired by AI bulls.
-350
-300
-250
-200
-150
-100
-50
0
50
100
1980
1981
1982
1983
1984
1985
1986
1987
1988
1989
1990
1991
1992
1993
1994
1995
1996
1997
1998
1999
2000
2001
2002
2003
2004
2005
2006
2007
2008
2009
2010
2011
2012
Year of birth
Gene�c trend of Australian Holstein cows for profit indicesHerd recorded and sired by AI bulls
BPI
HWI
TWI
Are you willing to leave profit on the table?
Younger Holstein cows (born 2012) are about $100 per year more profitable than their counterparts born at the start of the millennium. This is the result of the breeding decisions farmers and bull companies have made. This can be tracked by comparing the average genetic merit of cows for profit (Balanced Performance Index BPI) grouped by year of birth. In reality, farmers have needed to improve the profitability of every cow in their herd to maintain or increase the wedge between income and farm costs. Staying the same isn’t an option.
Last year, one third of Holstein AI bulls purchased by farmers did not meet the standard of the Good Bulls Guide. The 2014 NHIA semen market survey reported 1400 Holstein AI bulls sold in Australia (excluding progeny test). Nine hundred Holstein AI bulls met the Good Bulls Guide criteria for reliability and profit. This leaves 500 bulls below the standard. The standard was $116 profit in 2014, with an average of the top 50 bulls being $267. There is scope for improved focus on bull selection.
Let’s take a look at two scenarios:
1. Maintain status quo. If we continue to select bulls as we have, is likely that cows born in 2020 will be about $100 more profitable than the average cow today.
2. Make improvements. A more focused approach to bull selection that doubles the annual gain is likely to deliver cows born in 2020 that are about $160 more profitable than the average cow today. This means choosing higher profit bulls, such as those found in the Good Bulls Guide.
If the goal is to increase profit, check that bulls used for all joinings come from the Good Bulls Guide. Accelerate gains by sticking to the highest BPI bulls that also have strengths in priority areas for an individual herd. Look for the Good Bulls App in 2016 to make this job quick and easy.
BPI Holstein $8.1 profit per cow per year
Rate of genetic gain for profit for cows born 1985-2012

26 Australian Dairy Herd Improvement Report 2015
2015 Australian Breeding Values – Genetic Trends
Figure 12: Genetic trend of Australian Jersey cows for profit indices. Herd
recorded and sired by AI bulls.
Figure 13: Genetic trend of Australian Red Breed cows for profit indices.
Herd recorded and sired by AI bulls.
-350
-300
-250
-200
-150
-100
-50
0
50
100
1980
1981
1982
1983
1984
1985
1986
1987
1988
1989
1990
1991
1992
1993
1994
1995
1996
1997
1998
1999
2000
2001
2002
2003
2004
2005
2006
2007
2008
2009
2010
2011
2012
Year of birth
Gene�c trend of Australian Jersey cows for profit indicesHerd recorded and sired by AI bulls
BPI
HWI
TWI
-350
-300
-250
-200
-150
-100
-50
0
50
100
1980
1981
1982
1983
1984
1985
1986
1987
1988
1989
1990
1991
1992
1993
1994
1995
1996
1997
1998
1999
2000
2001
2002
2003
2004
2005
2006
2007
2008
2009
2010
2011
2012
2013
Year of birth
Gene�c trend of Australian Jersey cows for profit indicesHerd recorded and sired by AI bulls
BPI
HWI
TWI
-350
-300
-250
-200
-150
-100
-50
0
50
100
1985
1987
1988
1989
1990
1991
1992
1993
1994
1995
1996
1997
1998
1999
2000
2001
2002
2003
2004
2005
2006
2007
2008
2009
2010
2011
2012
2013
Year of birth
Gene�c trend of Australian Red Breed cows for profit indicesHerd recorded and sired by AI bulls
BPI
HWI
TWI
-350
-300
-250
-200
-150
-100
-50
0
50
100
1985
1987
1988
1989
1990
1991
1992
1993
1994
1995
1996
1997
1998
1999
2000
2001
2002
2003
2004
2005
2006
2007
2008
2009
2010
2011
2012
Year of birth
Gene�c trend of Australian Red Breed cows for profit indicesHerd recorded and sired by AI bulls
BPI
HWI
TWI
BPI Jersey $11.4 profit per cow per year
Rate of genetic gain for profit for cows born 1985-2012
BPI Red Breeds $9 profit per cow per year
Rate of genetic gain for profit for cows born 1985-2012

Australian Dairy Herd Improvement Report 2015 27
2015 Australian Breeding Values – Genetic Trends
Figure 14: Genetic Trend of Holstein
Daughter Fertility ABV. Herd recorded and sired
by AI bulls.
Fertility trends improveAfter two decades of decline or no improvement, the genetic trend for fertility is improving each year. The average ABV for daughter fertility of cows born in 2012 is similar to cows born in 1996 and is about 0.5% higher than cows born in 2011. Daughter fertility is expressed as % 6-week in-calf rate.
This is an example of the gains that can be made through increased emphasis of fertility in Australian indices and further gains are expected as the focus on fertility has strengthened, particularly in the Balanced Performance Index (BPI) and Health Weighted Index (HWI). Furthermore, bull companies and farmers are paying extra attention to the Daughter Fertility ABV when choosing their final bull selections.
The value of an increased rate of gain for daughter fertility can be directly applied at farm level. In 2015, John Morton analysed the relationship between the reproductive
performance of cows and their Daughter Fertility ABV. The 6-week in-calf rate of cows with an ABV of 102 was 9% higher than cows with an ABV of 97 (Morton unpublished).
The work of the Dairy Futures CRC and ADHIS has significantly improved the reliability of the Daughter Fertility ABV by 18% for bulls with less than 50 daughters between 2012 and 2015 (Pryce, 2015). This research has also increased the standard deviation of the trait 3.6 to 4.47 (2012 to 2015), which means there are more bulls with much higher fertility ABVs to choose from. For example, in August 2015, half of the top 20 BPI bulls had a Daughter Fertility ABV of at least 105.
The simplest way to improve the genetics of herds for fertility is to choose bulls from the Good Bulls Guide with a higher Daughter Fertility ABV.
80
85
90
95
100
105
110
115
120
1980 1982 1984 1986 1988 1990 1992 1994 1996 1998 2000 2002 2004 2006 2008 2010 2012Year of birth
Gene�c trend of Australian Holstein cows for health traitsHerd recorded and sired by AI bulls
Daughter Fer�lity ABV

28 Australian Dairy Herd Improvement Report 2015
2015 Australian Breeding Values – Good Bulls Guide
The bull must meet minimum requirements for reliability, is active and more than 1 standard deviation above average for Profit $. For the full list go to www.adhis.com.au
INDICES PRODUCTION TYPE FERTILITY
PR
OFI
T R
AN
K
BU
LL ID
BU
LL N
AM
E
GEN
OM
ICS
INCLU
DED
AUST
RAL
IAN
PR
OVE
N
OR
INTE
RN
ATIO
NAL
BP
I ($
)
REL
IAB
ILIT
Y
HW
I
TWI
ASI
REL
IAB
ILIT
Y
AU
STR
ALI
AN
D
AU
GH
TER
S
AU
STR
ALI
AN
HER
DS
OVE
RA
LL T
YPE
MA
MM
AR
Y SY
STEM
REL
IAB
ILIT
Y
DA
UG
HTE
RFE
RTI
LITY
REL
IAB
ILIT
Y
SOU
RCE
1 CHRISTMAS EMU BANKS CHRISTMAS-ET g A 315 79 206 319 251 88 99 31 107 100 81 100 74 GAC
2 GOLDCREST TOPSPEED GOLDYN-ET g A 312 74 255 287 221 84 63 30 101 102 72 99 70 GAC
3 NIELS HILL VALLEY NIELS g A 311 72 258 325 161 84 62 31 105 104 63 103 65 ABS
4 CANBEE COUNTRY ROAD ROUMARE CANBEE g A 295 82 205 308 255 92 187 60 106 103 85 93 74 ALT
5 SHOLTZ ST. CLAIR SHOLTZ-TWIN g A 257 74 178 258 191 84 54 30 104 103 72 99 73 ABS
6 DELSANTO MANNA FARM DEL SANTO g A 254 91 181 277 236 99 1384 222 107 110 95 95 90 GAC
7 29HO12772 BALLYCAIRN OMAN PELLO g A 250 79 200 197 134 87 59 27 99 97 80 111 76 ABS
8 ROUFECTOR BUNDALONG ROUFECTOR g A 248 78 165 274 220 88 87 36 109 106 77 95 74 ALT
9 7H8081 ENSENADA TABOO PLANET ET g A 246 92 215 258 94 99 661 133 104 110 97 101 95 GAC
10 WESTGATE GALLRAE JOCKO 3438 g A 245 81 202 257 139 90 102 49 109 106 78 100 78 GAC
11 JANEK RENGAW JARDIN JANEK g A 238 74 183 222 192 85 85 24 104 105 70 103 64 ABS
12 29HO12470 INDIJKS BABYLON g A 236 88 164 198 165 97 415 96 102 99 88 111 86 ABS
13 GONZO CURRAJUGLE GONZO g A 236 84 226 220 65 95 268 80 100 105 84 112 80 ABS
14 USEAGE KAARMONA CALEB g A 235 85 198 233 156 94 232 66 103 109 85 100 83 GAC
15 FLASHBACK CARENDA FLASHBACK g A 230 71 184 239 140 80 53 24 106 104 75 102 64 GAC
16 BUDDHA BUSHLEA PERFECTOR BOLD-ET g A 229 88 177 196 152 98 787 186 101 102 92 101 82 GAC
17 MIDNIGHTSPEC HILL VALLEY MIDNIGHT SPECIAL g A 228 75 152 211 187 84 77 28 103 104 80 96 68 ABS
18 JENKINS KIRK ANDREWS JENKINS g A 228 70 185 273 152 80 52 25 108 113 68 97 61 GAC
19 KINGTIDE BUNDALONG PLANET KINGTIDE g A 224 70 184 161 116 79 45 25 97 103 70 100 63 GAC
20 ALTAMOONWALK HILL VALLEY MOONWALK g A 224 76 203 254 90 88 104 32 103 108 69 99 68 ALT
21 CARLANA KAARMONA CARLANA g A 221 71 144 202 192 80 49 27 102 104 75 100 66 GAC
22 AJFANTOM ADLEJAMA REALM FANTOM g A 219 72 160 201 192 82 61 24 98 98 74 99 60 GAC
23 MOTOWN ECLIPSE ROUMARE MOTOWN A 219 75 163 208 161 86 81 40 101 100 74 100 62 GAC
24 WYMAN PIROLO GOLDW. WYMAN g A 219 88 186 208 94 96 426 79 102 102 93 109 85 GAC
25 REALM ECLIPSE ROUMARE REALM g A 218 77 144 195 225 86 73 36 97 100 73 94 74 GAC
26 DEANCOX MANNA FARM DEANCOX g A 218 80 164 230 183 89 96 46 106 103 78 97 76 GAC
27 SUPAPLANET KIRK ANDREWS SUPAPLANET g A 217 71 171 150 126 80 49 21 95 102 71 98 66 ABS
28 DARNET MANNA FARM DRENALIN g A 216 73 186 244 93 84 67 21 106 111 70 101 65 GAC
29 EUROSTAR ECLIPSE EUROSTAR g A 214 81 191 224 112 92 151 66 105 107 73 104 78 GAC
30 OPALEYE DILEE PLANET OLLIE 958-ET g A 210 71 174 240 143 81 54 29 106 110 68 97 65 GAC
31 HOTAYLORMADE TAHORA TAYLORMADE g A 209 84 185 211 116 94 179 69 104 108 81 106 79 SEM
32 DOLBY GUM RIDGES ROUMARE DOLBY g A 208 73 148 211 148 83 51 28 103 105 67 100 70 GAC
33 LAZZARO GLOMAR LAZZARO g A 204 79 143 198 133 90 129 40 107 103 72 105 74 ABS
34 PIMENTO PHILMAR ORNAMENT g A 197 72 159 156 176 82 64 32 100 98 71 94 65 GAC
35 LAIDLEY GLOMAR LAIDLEY g A 197 72 146 167 147 82 53 22 100 95 71 101 67 GAC
36 CRACKAJACK ECLIPSE ROUMARE CRACKAJACK g A 197 84 167 165 138 94 259 69 95 102 85 93 78 GAC
37 ALTAGOLDPLAN SARDI GOLDPLAN-IMP-ET g A 196 74 187 184 86 85 82 30 100 105 70 100 65 ALT
38 7H9321 RALMA GOLD CROWN g A 195 89 165 173 84 97 542 97 101 100 94 107 89 GAC
39 29HO13053 GRAN-J OMAN MCCORMICK g A 194 93 170 150 72 99 5529 550 101 100 98 114 98 ABS
40 CURIO COUNTRY ROAD ROUMARE CURIO g A 193 75 130 188 140 84 57 32 104 102 70 96 73 GAC
41 BUDLIGHT WANDILLA INFORMER BUSTER 8TH-TWIN g A 193 87 179 235 42 96 321 91 107 107 87 107 84 GAC
42 JIFFEY RENGAW SHOTTLE JIFFEY g A 191 78 166 191 76 89 101 33 100 102 74 103 74 AGR
43 BARBADOS WANDILLA ROUMARE BARBADOS g A 189 76 160 226 81 86 85 32 110 109 73 102 70 GAC
44 BUDWESIER CURRAJUGLE BUDWESIER g A 183 74 169 201 30 86 94 31 104 106 66 103 67 ABS
45 011HO11027 HAMMER-CREEK ALTAKOOL g A 180 78 160 174 46 88 91 31 102 102 81 107 77 ALT
46 HOAROMIS HILL VALLEY AROMIS A 179 77 138 188 114 90 107 31 105 105 70 100 73 SEM
47 ATTICUS KIRK ANDREWS ATTICUS g A 178 74 139 168 140 84 74 36 103 100 73 99 68 GAC
48 SHOTTLE PICSTON SHOTTLE g A 178 93 163 199 40 99 4162 564 106 104 99 104 99 ABS
Holstein Profit – Proven AustraliaBalanced Performance Index (BPI)
INDICES PRODUCTION TYPE FERTILITY
PR
OFI
T R
AN
K
BU
LL ID
BU
LL N
AM
E
GEN
OM
ICS
INCLU
DED
AUST
RAL
IAN
PR
OVE
N
OR
INTE
RN
ATIO
NAL
BP
I ($
)
REL
IAB
ILIT
Y
HW
I
TWI
ASI
REL
IAB
ILIT
Y
AU
STR
ALI
AN
D
AU
GH
TER
S
AU
STR
ALI
AN
HER
DS
OVE
RA
LL T
YPE
MA
MM
AR
Y SY
STEM
REL
IAB
ILIT
Y
DA
UG
HTE
RFE
RTI
LITY
REL
IAB
ILIT
Y
SOU
RCE
1 ROYALPIC HINDLEE PICOLA ROYALROUMARE 1414-ET g A 307 53 239 290 218 65 0 0 103 105 41 104 38 GAC
2 VALIUM CARENDA VALIUM 354 g A 305 51 241 274 204 64 0 0 101 101 38 107 36 GAC
3 JUMPON RENGAW KMA JUMPON g A 302 57 227 303 231 68 0 0 105 105 46 98 43 GAC
4 VIZABULL CARENDA VIZABULL 375 g A 302 52 213 286 203 64 0 0 103 102 39 106 37 GAC
5 VANCE CARENDA PICOLA 349 g A 290 53 226 281 197 65 0 0 105 104 40 104 38 GAC
6 CRVBOUWROCKY BOUW ROCKY g A 288 51 235 276 147 64 0 0 104 103 38 110 36 CRV
7 VERMOUTH CARENDA VERMOUTH 394 g A 281 52 218 258 217 64 0 0 100 105 40 103 38 GAC
8 REACTOR CARENDA REACTOR 352 g A 280 55 200 288 223 67 0 0 105 107 44 100 42 GAC
9 JUSTLE RENGAW MOM JUSTLE g A 280 59 228 244 151 70 0 0 102 103 50 107 46 AGR
10 MILKMORE COUNTRY ROAD PICOLA MILLSY-ET g A 277 54 226 275 193 66 0 0 105 105 41 104 39 GAC
11 PLANEJACK OURWAY PLANE JACK g A 275 61 230 264 115 72 0 0 102 104 51 105 48 GAC
12 ROYALBEE HINDLEE CANBEE ROYAL 14 6-ET g A 272 56 200 270 184 68 0 0 104 102 46 103 41 GAC
13 PICOLA ADLEJAMA DELSANTO PICOLA g A 271 60 206 270 192 71 0 0 104 107 49 102 47 GAC
14 FOLKLAW CARENDA FOLKLAW 339 g A 270 59 207 254 193 71 0 0 102 103 49 98 44 GAC
15 NARDOO HILL VALLEY SS NARDOO g A 270 52 223 274 139 65 0 0 104 105 39 102 37 GAC
16 PETRIE INGOLMORE MCCORMICK PETRIE g A 269 63 212 231 175 76 17 8 101 100 51 109 49 ABS
17 ROYALMAN HINDLEE GOLDWYN OMANROYAL 121003 g A 269 62 224 263 140 73 0 0 104 105 56 108 52 GAC
18 GOLDWARRIOR BUNDALONG LIQUIDGOLD WARRIOR g A 267 51 200 237 158 64 0 0 102 101 39 108 37 GAC
19 THETOP ADLEJAMA ATLEY PINNACLE-ET g A 265 52 206 286 152 64 0 0 108 109 40 101 38 GAC
20 JUDGEMENT RENGAW ESQUIRE JUDGEMENT g A 264 56 213 212 150 68 0 0 101 100 43 110 44 GAC
21 WRANGLER RENGAW MANOMAN WRANGLER-ET g A 262 61 185 216 179 73 2 2 101 103 52 108 47 GAC
22 PRAXIS ADLEJAMA ATLEY PRAXIS-ET g A 259 52 213 281 137 64 0 0 106 108 40 98 37 GAC
23 OTTMAR DILEE BUDDHA OLLIE 751 g A 258 56 226 233 153 68 0 0 100 102 46 100 41 GAC
24 EARLGREY DILEE ATLEY OLLIE 951 g A 257 52 205 247 156 65 0 0 103 106 40 102 37 GAC
25 FEARSOME KANDES C889H g A 256 61 206 262 173 73 0 0 105 107 51 101 46 GAC
26 DAMANI MANNA FARM KMA 2341 g A 255 56 181 237 204 67 0 0 103 102 44 99 42 GAC
27 TOPSIRE GLOMAR TOPSIRE g A 255 51 192 225 166 65 0 0 102 100 38 104 36 GAC
28 29HO16888 SEAGULL-BAY MVP-ET g A 253 50 192 233 142 62 0 0 102 103 37 106 34 ABS
29 GEEMCEE RENGAW MANOMAN HUMMER-ET g A 251 61 159 222 210 73 2 2 103 102 51 103 46 GAC
30 PRIORMAN ADLEJAMA WYMAN PRIORITY g A 251 56 212 223 153 67 0 0 99 101 46 106 40 GAC
31 29HO17573 SEAGULL-BAY SILVER-ET g A 251 50 190 233 148 63 0 0 101 101 38 103 36 ABS
32 PERFECTBERT DALBORA BERT g A 249 71 209 255 96 84 69 24 106 107 60 100 68 ALT
33 GGIBARCLEY GGI - BARCLEY g A 248 45 188 240 160 56 0 0 103 103 33 100 31 UVS
34 ROLLERDEX GALLRAE 473 DEXTRAL 19 g A 248 56 212 273 133 68 0 0 106 106 43 97 41 GAC
35 STARISBORN CURRAJUGLE STARISBORN g A 248 62 217 232 76 74 15 8 102 103 51 107 47 ABS
36 JAKOVICH RENGAW CROWN JAKOVICH g A 247 56 193 230 167 68 0 0 101 100 45 102 42 AGR
37 JENGOLD EMU BANKS JENGOLD g A 247 57 183 201 161 68 0 0 100 100 47 109 42 GAC
38 JEBEDIAH ADLEJAMA PICOLA JEBEDIAH-ET g A 246 54 181 229 193 66 0 0 102 105 41 104 40 GAC
39 GGISUPERIOR GGI - SUPERIOR g A 245 51 196 221 143 64 0 0 101 101 38 104 36 UVS
40 LJCOOL ADLEJAMA PICOLA FAROUK g A 244 52 155 233 224 64 0 0 103 104 39 102 36 GAC
41 ASHMARK WARRAMONT NUMBERONE DUDE g A 244 56 195 220 139 68 0 0 102 104 45 108 42 GAC
42 KALBEE WILARA KALBEE g A 242 56 176 242 170 68 0 0 104 103 46 101 41 GAC
43 MICROCHIP HINDLEE PICOLA GOLDCHIPDREAM 1418-ET g A 242 52 218 231 129 65 0 0 104 105 41 108 37 GAC
44 STARSHIRAZ JET STAR DELSANTO SHIRAZ g A 241 65 185 242 193 76 0 0 105 108 56 101 53 GAC
45 NADAL JET STAR MANOMAN NADARL -ET g A 241 63 172 191 175 74 2 2 101 101 54 107 51 GAC
46 JAGGS ADLEJAMA JETFINN JAGGA-ET g A 241 59 198 216 144 71 0 0 102 103 50 106 46 GAC
47 CRVSKYFALL NEWHOUSE SKYFALL g A 240 50 185 207 147 63 0 0 102 102 38 109 37 CRV
48 JIMEO COOMBOONA LEGEND JIMEO g A 240 61 192 221 114 72 8 5 103 101 52 105 47 GAC
49 DISCO ADLEJAMA FEARSOME DISCO-ET g A 239 53 183 254 180 65 0 0 106 107 41 97 38 GAC
50 29HO17553 UECKER SUPERSIRE JOSUPER-ET g A 239 48 178 244 154 62 0 0 105 106 35 104 32 ABS
51 JSPOWERBALLP VIEW-HOME POWERBALL P ET g A 239 47 200 214 142 59 0 0 102 102 34 109 31 CRV
Holstein Profit - Genomic ABV(g)s Balanced Performance Index (BPI)
Use a team: Genomically tested sires should not be treated the same as proven sires, as the reliability of ABV(g)s is about the same as a bull with 30 milking daughters. If you want to replace proven bulls with young genomic sires, it’s recommended that for every proven bull you remove from your bull team, you replace it with at least two unrelated young genomically tested sires.
August 2015

Australian Dairy Herd Improvement Report 2015 29
2015 Australian Breeding Values – Good Bulls Guide
The bull must meet minimum requirements for reliability, is active and more than 1 standard deviation above average for Profit $. For the full list go to www.adhis.com.au
2015 Australian Breeding Values – Good Bulls Guide
August 2015
Jersey Profit – Proven Australia Balanced Performance Index (BPI) INDICES PRODUCTION TYPE FERTILITY
PR
OFI
T R
AN
K
BU
LL ID
BU
LL N
AM
E
GEN
OM
ICS
INCL
UDED
AUST
RAL
IAN
PR
OVE
N
OR
INTE
RN
ATIO
NAL
BP
I ($
)
REL
IAB
ILIT
Y
HW
I
TWI
ASI
REL
IAB
ILIT
Y
AU
STR
ALI
AN
DA
UG
HTE
RS
AU
STR
ALI
AN
HER
DS
OVE
RA
LL T
YPE
MA
MM
AR
Y SY
STEM
REL
IAB
ILIT
Y
DA
UG
HTE
RFE
RTI
LITY
REL
IAB
ILIT
Y
SOU
RCE
1 0200JE08165 BROADLIN HATMAN g A 356 65 251 379 290 78 42 21 109 111 62 SEM
2 RACEWAY ABERDEEN VALERIAN SANDOWN-ET g A 339 80 260 344 222 90 114 44 107 112 82 101 75 GAC
3 CAIRNBONE CAIRNBRAE TBONE ENSIGN g A 326 72 249 392 203 83 61 22 113 120 69 102 64 ALT
4 CSCAMBITION RIVERSIDE AMBITION g A 324 74 276 306 197 84 64 26 104 108 70 102 68 ABS
5 VIPOR NOWELL VIPER g A 316 71 268 324 186 81 51 20 104 112 69 101 70 AGR
6 ELTON CAIRNBRAE JACES ELTON g A 314 92 222 332 218 99 3814 428 108 107 96 101 97 ABS
7 NAVARIAN COLNARCO NAVARIAN g A 313 74 240 311 221 85 76 34 105 108 65 102 68 GAC
8 CSCEDISON CAIRNBRAE TBONE EDISON g A 299 73 168 302 280 84 75 33 103 104 73 98 63 ABS
9 BOSGREGSTAR WHITE STAR GREG g A 280 77 178 198 251 89 140 46 98 94 74 104 63 CRV
10 MAXAPPEAL RIVERSIDE MAXIMUM APPEAL g A 262 75 202 294 156 87 63 27 107 105 70 101 73 ABS
11 ROUNDHILL ABERDEEN VALERIAN ROUNDHILL-ET g A 245 74 194 235 147 84 72 32 105 105 68 104 72 GAC
12 BROADSIDE BROADLIN 2420 SPIRITUAL g A 243 74 198 238 158 84 62 37 103 105 74 102 66 GAC
13 VASILIS KAARMONA VASILIS g A 233 73 176 226 148 84 65 22 102 100 62 99 68 AGR
14 LARFALOT LIGHTWOOD LUCRATIVE g A 232 92 158 261 164 99 2174 306 107 104 96 98 97 GAC
15 BOSMURMUR OKURA LIKA MURMUR S3J g A 231 88 184 217 130 97 521 67 99 97 88 104 84 CRV
16 VAVOOM ROCKLEIGH PARK VALERIAN VAVOOM g A 227 75 147 179 175 86 71 27 100 98 65 102 69 ABS
17 ALMERBOND ALMERVISTA BOND g A 225 71 169 233 134 84 69 24 101 108 61 99 63 ALT
18 VANAHLEM PANNOO ABE VANAHLEM g A 214 91 167 244 128 99 2087 302 107 109 96 98 91 ALT
19 SANDBLAST NOWELL SANDBLAST g A 209 88 171 168 174 98 693 133 102 105 88 103 87 AGR
20 TAILBOARD NOWELL TARSAN g A 208 92 152 209 156 99 1552 266 104 103 91 97 97 GAC
21 CSCMELVARA WALLACEDALE MELVARA g A 207 74 174 233 116 86 101 37 107 112 73 100 61 ABS
22 ARIES NOWELL ZODIAC g A 200 74 151 143 132 84 64 23 99 99 70 102 71
23 RASCAL NOWELL RASCAL g A 188 69 165 221 76 79 42 17 109 109 63 96 66
24 DELIAN LOXLEIGH DELIAN g A 181 76 133 209 129 87 78 44 108 106 66 101 71 GAC
25 MAXIMUM SUNSET CANYON MAXIMUM g A 180 88 150 204 63 97 275 60 106 102 86 103 91 AGR
Jersey Profit – Genomic ABV(g)sBalanced Performance Index (BPI) INDICES PRODUCTION TYPE FERTILITY
PR
OFI
T R
AN
K
BU
LL ID
BU
LL N
AM
E
GEN
OM
ICS
INCL
UDED
AUST
RAL
IAN
PR
OVE
N
OR
INTE
RN
ATIO
NAL
BP
I ($
)
REL
IAB
ILIT
Y
HW
I
TWI
ASI
REL
IAB
ILIT
Y
AU
STR
ALI
AN
DA
UG
HTE
RS
AU
STR
ALI
AN
HER
DS
OVE
RA
LL T
YPE
MA
MM
AR
Y SY
STEM
REL
IAB
ILIT
Y
DA
UG
HTE
RFE
RTI
LITY
REL
IAB
ILIT
Y
SOU
RCE
1 DROGO BEULAH BRAX DROGO g A 328 44 259 348 222 56 0 0 107 107 33 98 28 GAC
2 BROWNLOW DALBORA BRAX 5097 BROWNLOW g A 300 43 225 312 208 55 0 0 105 107 33 100 28 AGR
3 CRVBRAX PANNOO BRAX g A 298 50 233 350 182 62 0 0 112 112 41 99 35 CRV
4 GRIFF KAARAMONA GRIFFIN g A 297 50 224 310 202 62 0 0 107 110 40 101 34 GAC
5 CSCBANDANNA ARALUEN PARK BANDANNA g A 296 50 217 320 190 62 0 0 108 109 42 100 36 ABS
6 BORAT BROOKBORA TBONE BORAT g A 291 52 204 306 212 63 0 0 105 105 43 97 37 GAC
7 LEVIGENES BROADLIN LEVI g A 288 51 205 289 219 63 0 0 105 105 43 99 38 GAC
8 DOUBLEUP BROADLIN DOUBLEUP g A 284 46 194 234 250 59 0 0 99 99 36 103 26 GAC
9 SHAQ NOWELL SHAQ g A 280 56 198 284 192 67 0 0 106 105 48 102 43
10 BONTINO CAIRNBRAE BONTINO g A 278 49 192 292 204 62 0 0 104 108 38 98 34 AGR
11 CRVMUMFORD WHITE STAR MUMFORD g A 275 50 183 266 232 62 0 0 104 106 41 100 34 CRV
12 CSCFERRARI INVERLAIR HEIGHTS RACEWAY FERRARI g A 270 53 198 281 181 64 0 0 106 107 45 99 40 ABS
13 SEGA KADDY LARFALOT SEGA - ET g A 266 65 157 259 248 76 33 15 105 100 59 94 58 GAC
14 SANDSTORM KADDY ELTON SANDSTORM g A 265 58 168 249 237 69 0 0 102 100 51 97 46 TLG
15 CRVLINE PANNOO VLINE g A 265 56 185 263 173 68 0 0 107 104 49 104 45 CRV
16 SEVILLA ARALUEN PARK SEVILLE g A 261 50 196 257 184 62 0 0 104 104 40 99 34 GAC
17 CRVSANDRIFT KADDY ELTON SANDRIFT g A 260 57 184 265 190 69 0 0 105 103 50 98 45 CRV
18 TAHBILK BEULAH TAHBILK g A 260 48 214 294 133 59 0 0 108 110 38 100 33 GAC
19 HARDROCK ARALUEN PARK BAND g A 259 50 186 279 162 62 0 0 106 107 42 98 35 GAC
20 CRVGAVIN WHITE STAR GAVIN g A 257 49 187 274 184 60 0 0 105 104 40 98 34 CRV
21 ZORKO BEULAH GALV 4090 g A 256 47 190 244 199 60 0 0 103 104 36 100 32 GAC
22 011JE01134 BROOKBORA TBONE BARCARDI g A 256 64 179 284 189 78 36 11 107 106 60 98 42 ALT

30 Australian Dairy Herd Improvement Report 2015
The bull must meet minimum requirements for reliability, is active and more than 1 standard deviation above average for Profit $. For the full list go to www.adhis.com.au
2015 Australian Breeding Values – Good Bulls Guide
August 2015
Red Breeds Profit – Proven AustraliaBalanced Performance Index (BPI) INDICES PRODUCTION TYPE FERTILITY
PR
OFI
T R
AN
K
BU
LL ID
BU
LL N
AM
E
BR
EED
AUST
RAL
IAN
PR
OVE
N
OR
INTE
RN
ATIO
NAL
BP
I ($
)
REL
IAB
ILIT
Y
HW
I
TWI
ASI
REL
IAB
ILIT
Y
AU
STR
ALI
AN
DA
UG
HTE
RS
AU
STR
ALI
AN
HER
DS
OVE
RA
LL T
YPE
MA
MM
AR
Y SY
STEM
REL
IAB
ILIT
Y
DA
UG
HTE
RFE
RTI
LITY
REL
IAB
ILIT
Y
SOU
RCE
1 VFOSKE V FOSKE U A 335 86 243 329 222 96 158 19 106 106 84 106 82 VIK
2 GEDBO2263 G EDBO U A 218 80 208 195 97 94 88 11 96# 101# 60 99 82 VIK
3 RANDERSDAVID R DAVID U A 215 85 191 209 66 95 139 33 99 100 79 104 87 VIK
4 ATOSIKKO ASMO TOSIKKO U A 201 87 157 205 140 96 176 23 98 103 87 99 84 VIK
5 FASTRUP R FASTRUP U A 201 85 159 204 119 95 134 19 104 102 82 103 85 VIK
6 VRSOLERO2851 VR SOLERO U A 196 73 151 191 126 86 31 11 98# 101# 57 VIK
7 ARBOBAMA BEAULANDS OBAMA U A 167 72 122 174 125 89 61 25 102 101 49 102 59 GAC
8 ARBBONJOVI BOSGOWAN BON JOVI U A 160 89 113 129 122 99 748 155 99 100 82 104 90 GAC
9 ARBLEVER LOUVIC LEVER U A 150 76 150 172 57 91 74 33 101 105 56 102 66 GAC
10 RBANGKOK R BANGKOK U A 150 85 128 194 34 97 206 19 105# 107# 62 101 88 VIK
11 ARBBOBDOWN LODEN BOB U A 148 91 92 108 143 99 1788 248 100 99 87 96 96 GAC
12 ARBLIPPMAN BOSGOWAN LIPPMAN U A 140 79 125 144 104 94 114 42 101 105 51 100 75 GAC
INDICES PRODUCTION LONGEVITY FERTILITY
PR
OFI
T R
AN
K
BU
LL ID
BU
LL N
AM
E
AUST
RAL
IAN
PR
OVE
N
OR
INTE
RN
ATIO
NAL
BP
I ($
)
REL
IAB
ILIT
Y
HW
I
TWI
ASI
REL
IAB
ILIT
Y
AU
STR
ALI
AN
D
AU
GH
TER
S
AU
STR
ALI
AN
HER
DS
FOR
EIG
N
DA
UG
HTE
RS
FIR
ST
SUR
VIVA
L
REL
IAB
ILIT
Y
FER
TILI
TY
REL
IAB
ILIT
Y
SOU
RCE
1 GGVASSLI VASSLI I 204 33 145 186 175 60 136 GGI
2 GGEVENT EVENT A 187 69 143 178 125 92 91 32 105 61 98 69 GGI
3 54BS0437 COZY NOOK BEAMER TORCH I 98 31 63 88 101 59 154 ALT
4 BSCAFINO VETSCHS DENTESSO CAFINO I 94 37 59 83 102 69 3318 SEM
5 76B0900 VICTORY ACRES SIMON EVEN A 94 69 75 97 54 92 58 28 101 58 96 70
6 SUPHARDY SUPERBROWN HARDY I 87 29 57 78 87 59 149 CRV
7 SWISSEDGE ELM PARK JUPITERS EDGE A 86 75 75 71 26 97 249 77 102 78 106 85 GAC
8 SUPNOEL SUPERBROWN CA MASCARI NOEL I 82 29 49 72 96 54 84 CRV
Brown Swiss Profit Balanced Performance Index (BPI)
INDICES PRODUCTION TYPE FERTILITY
PR
OFI
T R
AN
K
BU
LL ID
BU
LL N
AM
E
AUST
RAL
IAN
PR
OVE
N
OR
INTE
RN
ATIO
NAL
BP
I ($
)
REL
IAB
ILIT
Y
HW
I
TWI
ASI
REL
IAB
ILIT
Y
AU
STR
ALI
AN
D
AU
GH
TER
S
AU
STR
ALI
AN
HER
DS
FOR
EIG
N
DA
UG
HTE
RS
FIR
ST
OVE
RA
LL T
YPE
MA
MM
AR
Y SY
STEM
REL
IAB
ILIT
Y
FER
TILI
TY
REL
IAB
ILIT
Y
SOU
RCE
1 7G398 SNIDERS RONALDS ALSTAR I 120 56 109 114 62 67 264 101 102 59 102 65 GAC
2 ICYICEBERG SPRING WALK ICY ICEBERG I 104 56 43 64 139 67 85 100 94 60 103 59 AGR
3 7GU00438 MARODORE AARONS LEVI I 102 40 88 142 59 49 32 108 107 48 100 34 WWS
4 AUSFAYSBOO KOOKABURRA FAYS BOO A 99 70 90 90 29 91 78 27 99 69
5 GUACTION BROOKLEIGH BQ ACTION A 99 75 131 120 -38 90 66 12 102 105 72 105 63 SEM
6 7GU00428 GOLDEN J SKIPPER GARY I 89 48 48 106 88 59 81 106 102 52 98 44 WWS
Guernsey ProfitBalanced Performance Index (BPI)

Australian Dairy Herd Improvement Report 2015 31
2015 Australian Breeding Values – Good Bulls Guide
Top Holstein herds based on herd average BPI, August 2015 ABVs.
BPI rank
Owner name Address Post code
National Herd ID
Cows on file
Current cows
No. of (g) cows
BPI ASI Prot. ABV
Prot %
ABV
Milk ABV
Fat ABV
Fat %
ABV
1 Wagner G Winnaleah 7265 T63SWAA 3,137 67 98 128 105 17 0.06 533 22 -0.02
2 Hogg, A & J Biggara 3707 C00155U 914 199 144 123 103 15 0.13 308 16 0.05
3 Henry TW & T Tinamba 3859 240108T 2,544 501 325 116 87 15 0.06 416 15 -0.04
4 Kitchen Far Boyanup 6237 W00248F 2,048 431 108 115 88 14 0.06 391 17 0.01
5 Sprunt RG (Easy Dairy) Kaarimba 3635 C01125S 529 185 148 107 75 14 0.03 445 15 -0.06
6 Parrish, TJ & LR Barrengarry 2577 N00544Q 1,267 66 304 105 69 10 0.06 265 14 0.04
6 Anderson WR & BL Kongwak 3951 540597R 1,364 271 145 105 87 14 0.08 355 14 -0.01
8 Dickson BJ & JL, Terang 3264 850441U 3,164 979 306 103 82 15 0.06 423 13 -0.08
9 Guye, Ashley Barwon Downs 3242 770030J 461 59 0 97 52 11 -0.05 513 14 -0.12
10 Willcocks P & I Yankalilla 5203 S00047P 944 198 134 95 61 12 0 454 12 -0.11
11 Johnston R & L Bundalaguah 3851 240024G 2,392 804 44 94 76 14 0.01 517 16 -0.08
12 Hoey Dm & L Katunga 3640 4I0025F 94 55 28 93 77 11 0.1 224 12 0.04
13 Walder RG & CA Heathmere 3305 840404W 892 154 0 92 67 8 0.09 114 13 0.11
14 Uebergang IS & JA Gorae West 3305 840391T 306 51 0 91 79 15 0.05 449 11 -0.11
15 Cook, RJ & JP Edi Upper 3678 C00276F 2,148 582 108 90 80 14 0.06 395 14 -0.04
16 Perrett RJ & HE Kongwak 3951 540624E 776 309 12 89 65 15 -0.03 624 13 -0.2
17 Mcrae SA & NM Nambrok 3847 2K0054J 743 459 103 87 67 10 0.07 235 12 0.02
17 MacQueen AD & GL Yanakie 3960 540139F 1,381 241 124 87 77 13 0.09 290 10 -0.03
19 Coster B & M Ripplebrook 3818 981306Q 2,308 907 271 85 73 11 0.07 271 12 0.01
20 TF Hutton And Sons Whcl0070 6271 W00088D 2,208 503 0 83 61 5 0.13 -61 10 0.18
20 Lia TO & PM Pty Ltd Nilma North 3821 540184S 737 192 0 83 89 15 0.04 470 19 -0.01
22 Heywood GA Yarragon 3823 240851B 1,138 221 0 80 63 9 0.08 177 10 0.04
22 Lambalk, J & J Timboon 3268 650274B 1,448 458 0 80 63 10 0.07 211 10 0.01
24 Lister Craig A Calivil 3573 4A3216P 1,191 282 224 79 59 12 0.02 403 10 -0.11
25 Fielding R & D South Riana 7316 T34GFJM 1,726 365 0 78 68 10 0.09 184 11 0.05
26 White WD & L Carrajung 3844 340316V 542 98 0 76 50 -1 0.17 -358 11 0.37
26 White KL & DM & RL Leongatha Sth 3953 540605F 1,427 388 273 76 68 11 0.05 311 13 -0.01
28 Moscript ME CJ & JM Leongatha Sth 3953 540300E 909 188 0 74 50 11 -0.02 444 9 -0.14
28 Carnachan Z & B Denison 3853 240294T 155 0 74 57 47 1 0.15 -261 9 0.29
30 Green, RJ LM & AE Tamworth 2340 N00416Q 225 83 73 55 54 11 0.02 377 7 -0.13
31 Lawry A K & P M Dingee 3571 4A1819R 498 121 72 55 53 9 0.04 248 8 -0.03
31 Derix GM & ME Maffra 3860 270031H 130 58 72 55 50 5 0.09 29 9 0.11
33 Lillico JM & V Smithton 7330 T13AHMV 849 63 71 55 50 9 0.02 300 9 -0.05
33 Coates JD & OR Via Portland 3305 840377M 288 0 71 53 55 9 0.04 257 10 -0.01
33 Holloway I D & A M Gundowring 3691 C00210E 612 0 71 52 57 9 0.06 209 9 0.01
33 Pekin JF, A & JG Terang 3264 850550V 399 0 71 49 65 10 0.08 210 11 0.02
37 Mcrae AG L & EM Heywood 3304 840329N 282 2 70 54 50 4 0.1 -50 10 0.17
37 Tracy S Waratah Bay 3959 540162K 219 67 70 49 61 10 0.08 220 8 -0.02
39 Holt Family Trust Bundalaguah 3851 240111W 66 0 69 47 60 7 0.1 39 11 0.13
40 Woodbine Holdings Pty Lancaster 3620 B20571E 769 0 68 47 61 11 0.05 320 8 -0.08
2015 Australian Breeding Values – Top Herd Summary

32 Australian Dairy Herd Improvement Report 2015
BPI rank
Owner name Address Post code
National Herd ID
Cows on file
Current cows
No. of (g) cows
BPI ASI Prot. ABV
Prot % ABV
Milk ABV
Fat ABV
Fat % ABV
Top Jersey herds based on herd average BPI, August 2015 ABVs.
1 Hoey DM & L Katunga 3640 240699A 1,084 219 165 125 94 9 0.21 -24 16 0.33
2 Glennen C & CO Terang 3264 850588C 2,779 484 48 122 93 7 0.24 -120 18 0.46
3 Worboys R & A Kotta 3565 C00993T 1,127 181 0 107 71 6 0.17 -50 14 0.31
4 Mc Manus BT & CA . Bamawm 3561 C00935T 774 174 0 88 54 4 0.15 -72 10 0.26
5 Codling & Baker Larpent 3249 740064P 699 141 0 84 67 3 0.26 -272 11 0.49
6 Wyss Trading P/L Boorcan 3265 850604I 1,412 88 0 82 53 1 0.2 -248 12 0.49
7 Moscript ME CJ & JM Leongatha Sth 3953 540300E 1,053 113 18 80 38 1 0.13 -143 9 0.32
7 Van Den Bosch JH & CA Lockington 3563 C00927B 387 58 0 80 51 1 0.22 -264 9 0.45
9 Boley Messrs PJ J Karridale 6288 W00095S 521 32 0 79 76 7 -0.07 313 31 0.27
10 Gelbeado Park Jerseys Won Wron Victoria 3971 340284T 1,792 373 203 78 49 4 0.12 -26 9 0.19
11 Bacon RLG & SL Tennyson 3572 C00859H 1,800 293 82 77 34 3 0.07 -4 6 0.12
12 Smethurst Byron Timboon 3268 650400L 599 62 63 76 48 7 0.06 133 6 -0.01
13 JS & KL Tanner, East Framlingham 3265 841827A 354 41 0 74 22 0 0.09 -119 4 0.2
14 Saunders & Day TA & AG Shady Creek 3821 981473R 1,282 488 122 68 39 4 0.08 9 8 0.14
15 Hill AJ, CA, SG & BF Kolora 3265 850478V 700 225 0 66 44 3 0.13 -101 8 0.26
16 Gleeson Stephen G Purnim 3278 842144T 895 148 0 64 32 1 0.13 -163 6 0.29
16 Brady PW Tinamba 3860 240339I 1,859 222 113 64 36 1 0.14 -147 7 0.27
16 Akers R & H & G Tallygaroopna 3634 C00637Q 1,608 526 77 64 40 3 0.09 -22 8 0.18
16 Francis GB & KJ Yanakie 3960 540114L 512 68 0 64 41 1 0.2 -247 5 0.35
Top Red Breeds herds based on herd average BPI, August 2015 ABVs.
Ayrshire
1 Johnstone B & R Hawksdale 3287 SM0023T 94 84 0 -75 -37 -9 0.03 -371 -8 0.11
2 Penfold DA & VE Willow Grove 3825 5A0045H 313 33 0 -88 -58 -12 -0.01 -416 -10 0.12
3 Morris RM & LA Heywood 3304 4A1468H 401 57 0 -130 -116 -17 -0.13 -368 -21 -0.08
4 Howlett VW & JS Drumborg 3304 840369R 412 45 0 -131 -118 -16 -0.12 -372 -24 -0.12
Illawarra
1 Chelmonte Farming Brymaroo 4403 Q00203D 1,267 88 0 -55 -48 -12 -0.02 -411 -3 0.21
1 Williams G P & R C Meningie 5264 4A1868T 1,304 334 0 -55 -35 -2 -0.07 71 -9 -0.17
3 Wieck B & J Via Peranga 4352 Q00390G 649 56 0 -63 -49 -7 -0.07 -133 -6 -0.01
4 Carson JH & GL Irrewillipe 3249 740170H 64 32 0 -67 -45 -3 -0.11 120 -8 -0.19
Aussie Red
1 Graham RW & BC Numbaa 2540 N00555U 1,464 544 0 97 53 9 0.03 260 11 0
2 Raleigh, Jan Timboon 3268 650244V 724 239 0 80 31 3 0.07 -21 4 0.08
3 Leppin T & LJ Bena 3946 540557N 1,477 413 0 76 34 4 0.08 -5 4 0.05
4 Coulthart C & G Numbaa 2541 N00548F 40 38 0 75 22 4 -0.01 152 7 0
Top Brown Swiss herds based on herd average BPI, August 2015 ABVs.
Brown Swiss
1 Balfour PE & SM Kanoona NSW 2550 B21285J 499 204 0 -12 -6 -1 0.05 -81 -3 0.01
2 Restdown Pastoral Rochester 3561 C00871I 1,746 502 0 -14 -7 -3 0.08 -173 -1 0.16
3 Cooltah P'ship Narromine 2821 N01423J 615 211 0 -15 -13 -3 0.08 -162 -6 0.05
4 Osborne MR & KJ Jamberoo 2533 N00472K 261 67 0 -17 -17 -3 -0.03 -80 -1 0.07
2015 Australian Breeding Values – Top Herd Summary

