australian dairy annual review - rural finance · pdf filethis report presents information...
TRANSCRIPT

AUSTRALIANDAIRY ANNUAL REVIEWJUNE 2017

About Ag AnswersAg Answers is a specialist insights division of Rural Bank and Rural Finance. Recognising that good information is the key to making good business decisions, Ag Answers provides research and analysis into commodities, farmland values, farm business performance and topical agricultural issues to enable farmers to make informed decisions.
About Rural Bank and Rural FinanceRural Bank has been a wholly-owned subsidiary of Bendigo and Adelaide Bank Limited since 2010 and is the only Australian-owned and operated dedicated agribusiness bank in the country. From 1 July 2014, Victorian agribusiness lender, Rural Finance joined Rural Bank as a division of Bendigo and Adelaide Bank Limited. As a specialist rural lender, Rural Finance has been fostering the sustainable economic growth of rural and regional Victoria for more than 70 years.
Together, Rural Bank and Rural Finance are supporting farmers and farming communities by providing them with specialist financial tools, industry insights and investment into the future of the Australian agribusiness sector.
The future for agriculture is brightWe provide exceptional financial services, knowledge and leadership for Australian farmers to grow.
This report is intended to provide general information on a particular subject or subjects and is not an exhaustive treatment of such subject(s). The information herein is believed to be reliable and has been obtained from public sources believed to be reliable. Rural Bank Limited, ABN 74 083 938 416 AFSL /Australian Credit Licence 238042, and Rural Finance, a division of Bendigo and Adelaide Bank Limited ABN 11 068 049 178 AFSL / Australian Credit Licence 237879, make no representation as to or accept any responsibility for the accuracy or completeness of information contained in this report. Any opinions, estimates and projections in this report do not necessarily reflect the opinions of Rural Bank and Rural Finance and are subject to change without notice. Rural Bank and Rural Finance have no obligation to update, modify or amend this report or to otherwise notify a recipient thereof in the event that any opinion, forecast or estimate set forth therein, changes or subsequently becomes inaccurate. This report is provided for informational purposes only. The information contained in this report does not take into account your personal circumstances and should not be relied upon without consulting your legal, financial, tax or other appropriate professional.
© Copyright Rural Bank Ltd ABN 74 083 938 416 and Bendigo and Adelaide Bank Ltd ABN 11 068 049 178 (A224779) (04/17)
About the research The Australian Dairy Annual Review includes data and outlooks on production in Australia and globally, seasonal conditions, prices, demand and the financial performance of Australian farms.
Significant effort has been taken to secure the most recent data available.
02
SUMMARY
82%higher than average in 2016
5.1%
Skim milk powder production has averaged
In 2015/16, the average farm gate milk price in
Australia fell
Australian winter rainfall was
The volume of milk powder exports decreased
growth per year since 2009/10
2.6%
Total milk supply as at April 2017
European Union milk production is up
in 2016/17 YTD
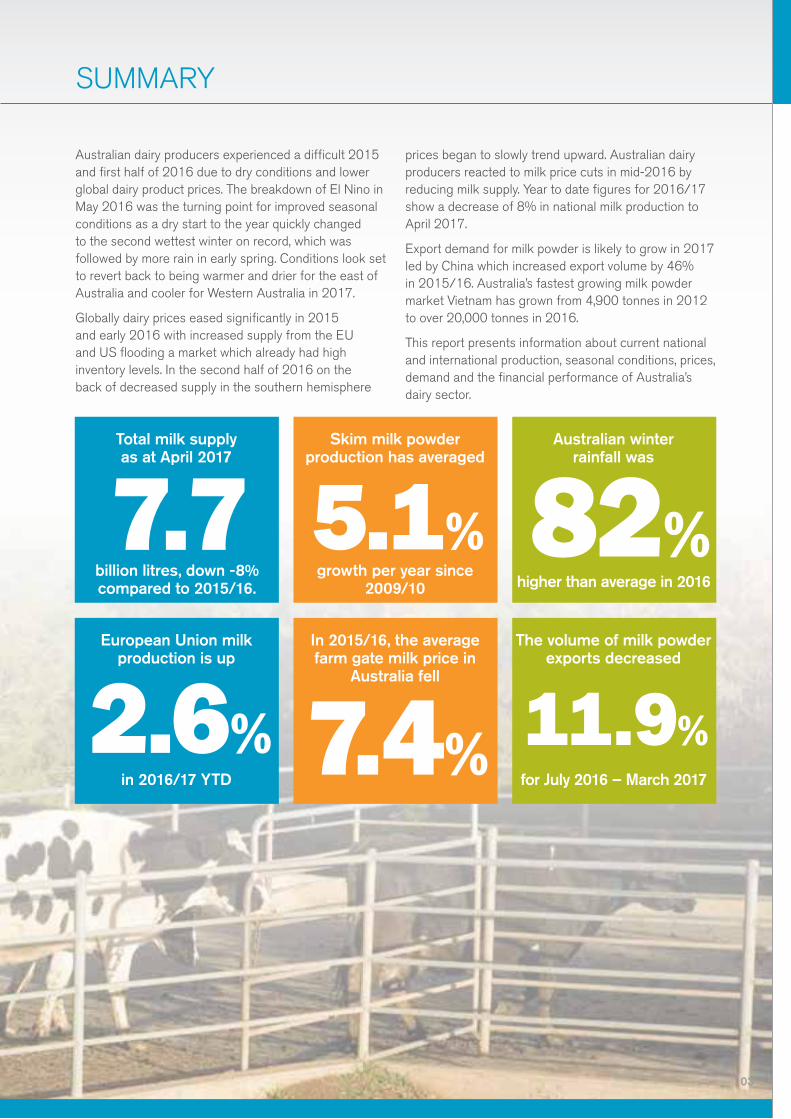
Australian dairy producers experienced a difficult 2015 and first half of 2016 due to dry conditions and lower global dairy product prices. The breakdown of El Nino in May 2016 was the turning point for improved seasonal conditions as a dry start to the year quickly changed to the second wettest winter on record, which was followed by more rain in early spring. Conditions look set to revert back to being warmer and drier for the east of Australia and cooler for Western Australia in 2017.
Globally dairy prices eased significantly in 2015 and early 2016 with increased supply from the EU and US flooding a market which already had high inventory levels. In the second half of 2016 on the back of decreased supply in the southern hemisphere
prices began to slowly trend upward. Australian dairy producers reacted to milk price cuts in mid-2016 by reducing milk supply. Year to date figures for 2016/17 show a decrease of 8% in national milk production to April 2017.
Export demand for milk powder is likely to grow in 2017 led by China which increased export volume by 46% in 2015/16. Australia’s fastest growing milk powder market Vietnam has grown from 4,900 tonnes in 2012 to over 20,000 tonnes in 2016.
This report presents information about current national and international production, seasonal conditions, prices, demand and the financial performance of Australia’s dairy sector.
7.4% 11.9%for July 2016 – March 2017
7.7billion litres, down -8% compared to 2015/16.
03

PRODUCTION – AUSTRALIA
Dairy production in Australia has stayed above 9 billion litres since 2006/07. Prior to this period milk production exceeded 10 billion litres between 1998/99 and 2005/06, reaching a peak of 11.27 billion litres in 2001/02. In 2015/16 total milk production was 9.7 billion litres a decline of 2%. In the current financial year Australia’s milk production is down 8.0% to April 2017. Victoria produces 65% of Australia’s milk and year to date production is down in 2016/17 by 9.6%.
The number of dairy cows in Australia has fluctuated between 1.5 million and 2.6 million over the last 44 years. In 2015/16 the national herd was 1.66 million and decline of 1.5% compared to 2014/15. More important than the total number of cows is the milk yield per cow. Milk yield per cow has never been higher reaching over 5,700 litres per cow for last two
years. Milk yield per cow has grown at an average of 1.8% per year since 1972/73.
The volume of manufactured dairy products such as cheese and milk powder are an important measure of value to the industry. Skim milk powder (SMP) production has been growing to satisfy world demand. In 2015/16 Australia produced 255,800 tonnes of SMP a 6% increase on 2014/15. SMP production has grown faster than any other product at an average of 5.1% per year since 2009/10. Cheese production has declined at an average of 0.3% since 2009/10. Production in 2015/16 was 344,300 tonnes. Manufactured production has declined in 2016/17 with January year to date figures showing a reduction of 11.2% for SMP and flat growth of 0.0% for cheese.
Data: Dairy Australia Data: Dairy Australia
1.8%
Milk yield per cow has averaged
growth per year since 1972/73
Outlook
Global price movements either up or down trigger a response from processors which then makes farmers respond accordingly. The response lags behind the event, as is the current case for supply with a 10% drop in production year to date in response to global price declines which occurred over 10 months ago. Global skim milk powder price is only just above May 2015 and 2016 prices, the overall movement since May 2016 is slightly positive. Processors will come under pressure to lift prices in a positive market which would then start a new production growth cycle. Expect production growth to be slow as it’s much easier to cut production then it is to breed more cows. Though this equation sounds positive for production global demand needs to increase to avoid another price decline.
State milk production April year to date variance
-5.4% -9.6%
1.4%
-8.5% -1.5% -6.8%
NSW VIC QLD SA WA TAS
Mill
ion
litre
s
Australian Milk Production National Total
1,200
700
400
500
600
1,100
800
900
1,000
300
2015/16 2016/17
Jan Feb Apr JunAug Oct Dec Mar MayJul Sep Nov
Total milk supply as at April 2017
5.1%
Skim milk powder production has averaged
growth per year since 2009/10
7.7billion litres, down -8% compared to 2015/16.
04

PRODUCTION – WORLD
growth since 2016
0.4% 1.5%New Zealand’s dairy
herd fellUS milk production
per cow has averaged
in 2015/16, the first time in 10 years
Milk production in Europe (EU-28) increased to a record 150 billion litres in 2015/16 up 3.6%. The increase in production was a result of the removal of milk quotas and favourable seasonal conditions. For 2016/17, February year to date milk production is 2.9% lower than 2015/16. Ireland, Netherlands and Germany increased production significantly in 2015/16 up 14.4%, 12.3% and 3.5%. All three countries have eased back production in 2016/17 in response to poor weather and environmental requirements in the Netherlands.
New Zealand milk production declined by 1.6% to 20.9 billion litres in 2015/16. In 2014/15 New Zealand produced a record volume of milk at 21.3 billion litres. April year to date figures for 2016/17 show a 1.1% deficient compared to the same period in 2015/16. Herd size declined 0.4% to 5 million in 2015/16 which is the first decline in 10 years.
Annual milk production in the United States (US) increased 1.8% in 2016 to 93.5 billion litres. Herd size continues to grow at an average of 0.2% since 2003. The major contributor to the growth in volume is the improvement in litres per cow. Average annual growth for litres per cow since 2003 has been 1.5%. The 2016 average was 10,024 litres per cow. Key export partners for the US are Mexico, South East Asia, Canada and China. The main export product is skim milk powder with export volumes up 8% for January to November 2016. South East Asia and in particular the Philippines is the fastest growing market for the US. SMP exports to the Philippines were up 71% for January to November 2016.
Data: Eurostat Data: DCANZ
Outlook
Relying on organic growth in demand to increase dairy prices and in turn supply may not be an option in the short term given the volume of product on the global market. Instead securing market access may be the most important thing in 2017/18 to achieve production growth at an individual country level. The US is competing strongly in Asian markets and it has the milk supply to take advantage of any opportunities. The full potential of milk production in countries such as Germany, Netherlands and Ireland is yet to be realised and will be monitored closely in the short to mid-term. Something that could constrain mid to long term milk production is environmental degradation, which is becoming an issue for not only the Netherlands but also New Zealand.
Jan Feb Apr JunAug Oct Dec Mar MayJul Sep Nov
Mill
ion
litre
s
New Zealand milk production for April 2017 year to date is down 1.1%
compared to 2015/163,500
3,000
1,500
2,000
2,500
1,000
2013/14 2014/15 2015/16 2016/17
Jan Feb Apr JunAug Oct Dec Mar MayJul Sep Nov
Mill
ion
litre
s
EU-28 milk production increased 3.6% in 2015/16
14,000
11,500
10,500
11,000
13,500
12,000
12,500
13,000
10,000
2013/14 2014/15 2015/16 2016/17
2.6%
European Union milk production is up
in 2016/17 YTD
05

SEASONAL CONDITIONS
Rainfall in Australia in September 2016 was the
South Australia experienced its
highest on record wettest April on record in 2017
Winter in 2016 was the second wettest on record for Australia with total winter rainfall over the season being 82% above average. Queensland experienced its second wettest winter, recording rainfall 172% above average. New South Wales and the Northern Territory also experienced very much above average rainfall. Most of Western Australia received above average rainfall except for the south west of the state which saw average to below average rain. The wet winter was followed by a wet September for all states except Western Australia. October saw a return to more average rainfall across most of the country except Tasmania which received above average rainfall.
More recent conditions have been mixed in regard to rainfall and temperature. The eastern side of the country has experienced above average temperatures coupled with above average rainfall. Whilst the in the West temperatures were average and rainfall below average.
The Bureau of Meteorology’s Normalised Difference Vegetation Index (NDVI) shows higher than normal autumn pasture density and greenness for the East coast of Australia. This suggests pasture growth was given a boost from above average rainfall and warmer than average temperatures in autumn.
Source: Bureau of Meteorology (BoM) Source: BoM
Outlook
Winter 2017 is forecast to be drier than average for the southern half of Australia. Whilst Queensland and the Northern Territory are forecast to receive close to average winter rainfall. Climate models are still predicting a period of El nino conditions for the second half of 2017. However, the severity has been downgraded and is likely to result in a weak El nino or neutral conditions. Local ocean temperatures aren’t moving strongly in either direction suggesting there will be a period of stable weather with less rainfall events. For a monthly state specific forecast from meteorologist Jane Bunn please visit our website www.ruralbank.com.au/for-farmers/ag-answers
82%above average in 2016
Australian winter rainfall was
2nd 10th
Chance of above median rainfall from June to August
Recent rainfall deciles between March and May 2017
06

PRICES
Farm gate milk price is never far from the headlines and 2016 was no exception. When Murray Goulburn (MG) cut prices late in the 2015/16 season it triggered cuts from all major processors for the opening of 2016/17. Each processor has pointed to falling global dairy prices as the main reason for a lower opening milk price.
The first half of the 2016/17 season saw lower production across most states in response to price cuts and decreasing herd size. Step ups were applied as the global dairy market recovered. Farm gate milk price is averaging between $4.95 - $5.20/ kg MS in southern states. Fonterra expect to close the 2016/17 season at $5.20/kg MS, whilst Murray Goulburn will
close around $4.95/kg MS. Northern NSW and Queensland producers are negotiating the 2017 contract with Parmalat. Parmalat initially kept its price unchanged from 2015/16 opting to negotiate price in December 2016. Parmalat are proposing a 1.5c/L drop in milk price for the 2017 contract.
Western Australian dairy farmers had a difficult 2016 with the states two milk processors Brownes and Harvey Fresh cutting supply contracts. Lack of demand from Asia for UHT milk was cited as the main problem. Spring milk was trucked to Darwin and Adelaide to manage oversupply. Farm gate milk price has historically averaged around 45c/L, a figure which is now unviable for some dairy farmers.
Data: Dairy Australia
Data: Dairy Australia
Outlook
Queensland dairy farmers supply the domestic market and are mostly immune to movements on the global market, a drop in price is hard to justify. Southern state opening price for 2017/18 will be between $5.20-5.50/kg MS, closing price is likely to be around $5.80/kg MS. MG were at significant risk of losing supply at their initial opening price of $4.70/kg MS and have since revised upwards to $5.20/kg MS. Loyalty remains an unknown for MG. Fonterra is looking to capitalise on MG’s situation through contracted incentives, although this limits flexibility it will likely appeal to those producers needing a higher price to remain profitable. Short 6 month contracts for WA dairy farmers adds an element of risk as the industry tries to work its way through a period of lower demand.
The 2016/17 average farm gate milk price is
below the 5 year
percentile in Victoria
20th
20
16
/17
E
20
07
/08
20
08
/09
20
15
/16
20
13
/14
20
09
/10
20
10
/11
20
11
/12
20
12
/13
20
14
/15
$/
kg M
S
Average farm gate milk price can be volatile particularly in southern states where global factors influence price
9
6
7
8
4
5
3
NSW QLD SA
VIC WATAS
20
06
/07
20
07
/08
20
08
/09
20
15
/16
20
13
/14
20
09
/10
20
10
/11
20
11
/12
20
12
/13
20
14
/15
$/
kg M
S
Average farm gate milk price in Australia fell 7.4% in 2015/16
7.5
6.0
6.5
7.0
4.0
4.5
5.0
5.5
3.0
3.5
In 2015/16, the average farm gate milk price in
Australia fell
7.4% 1.8%
Queensland’s average farm gate milk price
increased
in 2015/16
07

DEMAND
Global dairy demand is growing slowly after a period of decline between February 2014 and March 2016. The decline in demand was a function of increased supply and high inventory stocks in key importing countries such as China. In 2015/16 Australia exported 244,062 tonnes of milk powder which was 5.4% lower than 2014/15. In 2016/17 Australia has exported 165,966 tonnes of milk powder for the July to March 2017 period which is 11.9% lower than 2015/16. By volume Indonesia was Australia’s largest export market for milk powder in 2015/16 equating to 17% of total export volume. Milk powder exports to China increased 46% in 2015/16 on the back of a low export volume year in 2014/15. Singapore continued to import less milk powder in 2015/16 down 22%. Cheese exports were up 8.3% in 2015/16 totalling 171,938 tonnes. For July 2016 – March 2017 cheese exports totalled
123,872 tonnes which is a 1.0% down on the same period in 2015/16. Cheese exports to Japan for July 2016 to March 2017 were 9.3% tonnes lower than 2015/16. Cheese exports to China for July 2016 to March 2017 increased 38.3%.
Genetics also form part of the dairy industries exports. Dairy breeding cattle are primarily exported to China. The export price per head fell in 2016 from $2,000/ head in January to $1,750/ head in December. In 2017 prices have fallen to $1,535/ head as at March.
Domestic demand for drinking milk in Australia increased 1.2% in 2015/16 to 2,516 billion litres. For 2016/17 February year to date sales are down 0.8%. Sales have increased in Victoria and South Australia during 2016/17 up 1% and 2.8% year to date respectively.
Outlook
Domestic demand is unlikely to change dramatically in 2017 due to the size and growth of Australia’s population. Export demand for milk powder is likely to grow in 2017 led by China and Vietnam, Australia’s fastest growing milk powder market. In 2012 Vietnam imported 4,905 tonnes of Australian milk powder rising to 20,080 tonnes in 2016. Monthly volume is generally greater from November to February. In November and December 2016 Vietnam imported its largest volume of milk powder from Australia in a two month period which suggest demand is growing. Demand for cheese is likely to increase in 2017 as China continues to import higher volumes. The key months to look for will be May to July as this is when China imports most of its yearly volume from Australia.
Data: Dairy Australia Data: GTIS
Total value of dairy exports was
billion in 2015/16
$2.2
‘00
0 T
onne
s
Australian exports of milk powder and cheese performed well in 2015/16
despite an oversupplied world market300
150
200
250
100
50
0
Milk Powder Cheese
2014/15 2015/16 2016/17 Mar YTD
China Japan Singapore Indonesia Malaysia
$ M
illio
ns
Asian nations are Australia's largest dairy export markets
350
300
200
255
50
100
150
0
Jul-Mar 2015/16 Jul-Mar 2016/17
The volume of cheese exports decreased
1%
The volume of milk powder exports decreased
11.9%for July 2016 – March 2017 for July 2016 – March 2017
08

FINANCIAL PERFORMANCE
In 2015/16 Victorian dairy farmers average farm gate milk price declined by around 11%. This translated to a 70% fall in average earnings before interest and tax (EBIT) to $70,804. Average return on assets fell to 0.6% from 5.3% in 2014/15.
New South Wales dairy farmers had a favourable spring in 2015, followed by an average summer and a very dry autumn. Average farm gate milk price was down 2% on 2014/15. EBIT fell slightly as a result of lower milk prices going from $264,888 in 2014/15 to $250,775. Average return on assets was 3% in 2015/16 down from 3.5%.
South Australian dairy farmers faced similar climate challenges to Victoria. Average farm gate milk price fell 3.1%. EBIT decreased 25% to $217,956. Average return on assets was 3.1% in 2015/16 compared to 3.9% in 2014/15.
Average farm gate milk price in Tasmania decreased 10% resulting in a 12% fall in gross income. EBIT decreased 48% to $246,639. Average return on assets in 2015/16 was 3.9% down from 7.8%.
Western Australian dairy farmers had a reasonable year in 2015/16. Average farm gate milk price increased 2%. EBIT decreased slightly to $617,059 from $641,083. Average return on assets was 6.6% down from 6.7%.
Queensland dairy farmers had favourable conditions in 2015/16. Average milk receipts increased 1.9%, farm working expenses decreased 2% and return on assets increased to 4.4% from 3.4% in 2014/15.
Outlook
The first half of 2016/17 has been more positive from a feeding perspective with low grain and hay prices as well as rain falling over most dairy regions. Production is currently lower than 2015/16 in every state except Queensland which will lower gross income. Costs may be reduced by lower feed prices and available pasture. Cost efficiency may fall due to lower herd numbers but the same overhead costs as 2015/16. This may result in a lower EBIT and lower return on assets than 2015/16. Global milk supply has eased in some countries but increased in others which may not allow dairy prices to increase quickly something that could reduce the incentive to build herd numbers in the short term.
in 2015/16 for Western Australian
dairy farmers in 2015/16
Average gross farm income in Tasmania fell
Average return on assets was
12%6.6%in 2015/16
Average farm gate milk price in Victoria fell
11%
Data: Dairy Australia
Data: Dairy Australia
2015/162013/14 2014/15
$/
kg M
S
Average net farm income has decreased significantly in Victoria and Tasmania
2.5
0.5
1.0
1.5
2.0
-0.5
0
-1.0
VIC NSW SA
WA QLD (RHS)TAS
0.20
0.16
0.06
0.02
0.04
0.08
0.12
0.18
0.10
0.14
0.00
$/
Litr
e
VIC NSW SA TAS QLD
Per
cent
Average return on assets was down in most states in 2015/16
9
7
8
2
1
3
4
5
6
0
2014/15 2015/16
WA
09

PRICES – STATE DETAIL
Current (June) June 2016 5 year average 80th percentile 20th percentile
Farm gate milk price ($/kg MS)
Southern states* 5 5.78 5.95 6.82 5.26
NSW 6.48 7.06 6.91 7.27 6.48
WA 7.02 7.32 6.69 7.29 6.05
QLD 8.11 7.99 7.57 7.96 7.33
Over the hooks indicators for dairy cows (c/kg cwt)
Southern states* 443 406 356 423 222
NSW 458 400 360 452 251
WA 423 420 318 392 236
QLD 418 397 340 446 235
Feed wheat prices $/tonne **
VIC 159 228 204 227 173
NSW 240 246 208 232 180
TAS** 160 229 206 230 174
SA 207 238 205 223 181
WA 220 234 217 234 199
QLD 240 256 226 255 186
Pasture Hay prices $/tonne
Southern states* 173 194 173 211 146
NSW 213 272 n/a n/a n/a
WA 200 225 n/a n/a n/a
QLD 250 335 n/a n/a n/a
Export prices
SMP ($/t) 2688 2264 3371 4287 2575
Cheese ($/t) 5012 3678 4117 4768 3443
Heifers ($/head) 1535 2166 2155 2461 1898
Input prices
Fertiliser DAP ($/t)*** 486 468 514 557 467
Australian dollar
AUD/USD 0.74 0.73 0.86 0.96 0.75
Data: Dairy Australia, MLA, RBA, AFIA, Index Mundi, GTIS, GDT, Profarmer *Southern states includes VIC, SA and TAS. **Melbourne contract FED1 12 months of data from September 2015. ***World indicator price
010
011
For report enquiries:
AG ANSWERSP 1300 796 101 E [email protected]
For banking enquiries:
RURAL BANK P 1300 660 115 W ruralbank.com.au
RURAL FINANCE P 1300 796 101 W ruralfinance.com.au
ELDERS P 1300 618 367 E [email protected]