australian competition and consumer commission inquiry april 2018 interim... · gas inquiry...
TRANSCRIPT

Australian Competition and Consumer Commission
23 Marcus Clarke Street, Canberra, Australian Capital Territory, 2601
© Commonwealth of Australia 2018
This work is copyright. In addition to any use permitted under the Copyright Act 1968, all material contained within this work is
provided under a Creative Commons Attribution 3.0 Australia licence, with the exception of:
the Commonwealth Coat of Arms
the ACCC and AER logos
any illustration, diagram, photograph or graphic over which the Australian Competition and Consumer Commission does not
hold copyright, but which may be part of or contained within this publication.
The details of the relevant licence conditions are available on the Creative Commons website, as is the full legal code for the
CC BY 3.0 AU licence.
Requests and inquiries concerning reproduction and rights should be addressed to the Director, Content and Digital Services,
ACCC, GPO Box 3131, Canberra ACT 2601, or [email protected].

Contents
Acronyms .............................................................................................................................. 2
Glossary................................................................................................................................ 5
Overview ............................................................................................................................... 9
1. Domestic gas price outlook .......................................................................................... 15
1.1. Key points ............................................................................................................. 15
1.2. Gas prices paid in the East Coast Gas Market in 2015–2017 ............................... 16
1.3. Gas offers for supply in 2018 and 2019 ................................................................. 20
1.4. Prices agreed for gas supply in 2018 and 2019 .................................................... 25
1.5. Gas prices paid in domestic short-term trading markets ........................................ 29
2. LNG netback price series ............................................................................................. 31
2.1. Key points ............................................................................................................. 31
2.2. Introduction ........................................................................................................... 31
2.3. Consultation .......................................................................................................... 32
2.4. ACCC to publish regular LNG netback prices ....................................................... 33
2.5. There is a need for greater price transparency ...................................................... 33
2.6. Factors influencing domestic gas prices ................................................................ 34
2.7. Interpretation of LNG netback prices ..................................................................... 42
2.8. Next steps ............................................................................................................. 44
3. Transport...................................................................................................................... 46
3.1. Key points ............................................................................................................. 46
3.2. Recent changes to pipeline regulation .................................................................. 46
3.3. Transport prices have seen some movement but many service prices appear higher than expected in a well-functioning market ................................................................... 48
3.4. There is now more information on available non-scheme pipeline capacity and usage ........................................................................................................................... 54

Gas Inquiry 2017-2020 2
Acronyms
ACT Australian Capital Territory
ACQ annual contract quantity
ADGSM Australian Domestic Gas Security Mechanism
C&I commercial and industrial
CPI Consumer Price Index
CSG coal seam gas
DES delivered ex-ship
DWGM Declared Wholesale Gas Market
EOI expression of interest
ESO Energy Supply Outlook
ESOO AEMO’s Electricity Statement of Opportunities
FID financial investment decision
FOB free on board
FSRU floating storage regasification unit
GBB Natural Gas Bulletin Board
GPG gas powered generation/generator
GSA gas supply agreement
GSH Gas Supply Hub
GSG Gas Supply Guarantee
GSOO Gas Statement of Opportunities
GTA gas transportation agreement
JCC Japanese Customs-Cleared Crude
JV joint venture
LNG liquefied natural gas
MCQ minimum contract quantity
MDQ maximum daily quantity
MFN most favoured nation
MMBtu Million British Thermal Units–see below, Units of Energy
MPH Moomba Processing Hub
NEM National Electricity Market

Gas Inquiry 2017-2020 3
NGL National Gas Law
NGO National Gas Objective
NGR National Gas Rules
NSW New South Wales
NT Northern Territory
SA South Australia
STTM Short-term trading market
WA Western Australia
Organisations
ABS Australian Bureau of Statistics
ACCC Australian Competition and Consumer Commission
AEMC Australian Energy Market Commission
AEMO Australian Energy Market Operator
AER Australian Energy Regulator
AGL AGL Energy, originally the Australian Gas Light Company
APA APA Group
APLNG Australia Pacific LNG Pty Ltd
APPEA Australian Petroleum Production and Exploration Association
ASX Australian Securities Exchange
BHP BHP Billiton, formed from a merger of BHP (originally the Broken Hill Propriety Company) and Billiton
CNOOC China National Offshore Oil Corporation
COAG Council of Australian Governments
EIA Energy Information Agency (US)
FERC Federal Energy Regulatory Commission (US)
GBJV Gippsland Basin Joint Venture
GLNG Gladstone LNG
GMRG Gas Market Reform Group
NOPTA National Offshore Petroleum Titles Administrator
PWC Power and Water Corporation
QCLNG Queensland Curtis LNG Project
QGC QGC Pty Limited, previously Queensland Gas Company
RLMS Resource and Land Management Services

Gas Inquiry 2017-2020 4
SEA Shell Energy Australia
SEC Securities and Exchange Commission (US)
SGH Seven Group Holdings
SPE-PRMS Society of Petroleum Engineers-Petroleum Resources Management System
Pipelines
BWP Berwyndale to Wallumbilla Pipeline
CGP Carpentaria Gas Pipeline
CRP Central Ranges Pipeline
CRWPL Comet Ridge to Wallumbilla Pipeline Loop
CWP Central West Pipeline
DTS Declared Transmission System
EGP Eastern Gas Pipeline
MAPS Moomba to Adelaide Pipeline System
MSP Moomba to Sydney Pipeline
NGP Northern Gas Pipeline
QSN Link Queensland to South Australia/New South Wales Link
RBP Roma to Brisbane Pipeline
SEAgas South East Australia Gas pipeline
SEPS South East Pipeline System
SESA South East South Australia Pipeline
SWQP South West Queensland Pipeline
TGP Tasmanian Gas Pipeline

Gas Inquiry 2017-2020 5
Glossary
ACCC’s 2015 inquiry: The ACCC’s inquiry into the East Coast Gas Market in 2015, as reported on in April 2016.
AEMO-operated wholesale markets: There are two broad kinds of AEMO-operated wholesale markets: demand hubs, and supply hubs. The Victorian Declared Wholesale Gas Market (DWGM) and the Adelaide, Sydney, and Brisbane Short Term Trading Markets (STTMs) can be considered demand hubs as their primary purpose is to meet the gas requirements of a particular demand centre. These markets are compulsory–if a user sits within the defined boundaries of the market, their gas use (or supply) will be scheduled through the market by AEMO. The Wallumbilla and Moomba Gas Supply Hubs were developed primarily to facilitate the trade of gas between suppliers and large users at a particular supply centre. These markets are voluntary.
Aggregator: an entity other than a gas retailer that purchases gas for the purpose of re-supply to end users (including C&I users and GPG) rather than for their own consumption.
Banking rights: A contractual term relating to a gas user’s maximum gas usage allowance in a given period. When a gas user consumes less than their maximum, banking rights determine the extent to which the user may ‘bank’ the difference for later use.
Conventional/unconventional gas: Conventional gas is contained in sedimentary rocks such as sandstone and limestone (referred to as reservoir rock). The gas is trapped by an impermeable cap rock and may be associated with liquid hydrocarbons. The reservoir rock has a relatively high porosity (percentage of space between rock grains) and permeability (the rock’s pores are well connected and the gas may be able to flow to the gas well without additional interventions). Gas is extracted by drilling a well through the cap rock allowing gas to flow to the surface. Depending on the structure of the rock containing the gas (amount of faulting or compartmentalisation), only a few wells may be required to produce gas over the life of the gas field.
Unconventional gas is a broad term that covers gas found in a range of sedimentary rocks which typically have low permeability and porosity. The International Energy Agency categorises the three major types of unconventional gas as:
shale gas: natural gas contained within shale rock
coal seam gas (CSG): natural gas contained in coalbeds
tight gas: natural gas found in low permeability rock formations.
A range of techniques may be required to promote gas flow including pumping water from the rock to reduce pressure holding the gas in place (in the case of CSG) or hydraulic fracture stimulation (fracking) to open pathways for the gas to enter the well (in the case of shale gas, tight gas and some CSG). An unconventional gas field may require a large number of wells to be drilled (in the thousands for the large CSG liquefied natural gas (LNG) projects in Queensland) over its life to ensure consistent production.
December 2017 report: the ACCC’s second interim report, published in December 2017, in the three year inquiry into the supply of and demand for wholesale gas in Australia that commenced in April 2017.
Delivered ex-ship price: The price of gas delivered by ship to a destination port. This term is typically used for LNG prices.
Domestic demand: The quantity of gas demanded by users located in Australia.

Gas Inquiry 2017-2020 6
East Coast Gas Market: The interconnected gas market covering Queensland, South Australia, New South Wales, the Australian Capital Territory, Victoria and Tasmania.
Export demand: The quantity of Australian gas demanded by overseas buyers.
Free on-board price: The price of gas loaded on a ship at a port connected to an LNG plant.
Liquefaction: The process of liquefying natural gas.
Liquefied natural gas (LNG): Natural gas that has been converted to liquid form for ease of storage or transport.
LNG netback price: A pricing concept based on an effective price to the producer or seller at a specific location or defined point, calculated by taking the delivered price paid for gas and subtracting or ‘netting back’ costs incurred between the specific location and the delivery point of the gas. For example, an LNG netback price at Wallumbilla is calculated by taking a delivered LNG price at a destination port and subtracting, as applicable, the cost of transporting gas from Wallumbilla to the liquefaction facility, the cost of liquefaction and the cost of shipping LNG from Gladstone to the destination port.
LNG train: A liquefied natural gas plant’s liquefaction and purification facility.
Load factor: measures the extent to which a buyer can take more than the average daily contract quantity throughout the year, subject to the cap imposed by the annual contract quantity.
Pipeline transportation services
As available transportation service: A service that allows the transportation of gas on an ‘as available’ basis, subject to the availability of capacity. This service has a lower priority than a firm transportation service.
Firm transportation service: A service that allows the transportation of gas on a ‘firm’ basis up to a maximum daily quantity and maximum hourly quantity. It has the highest priority of any transportation service.
Interruptible transportation service: A service that allows the transportation of gas on an ‘interruptible’ basis. The pipeline operator does not have an obligation to guarantee capacity and has the right to curtail the service if the pipeline becomes capacity constrained or higher priority services are required. This service has a lower priority than firm and as available transportation services.
Park service: A service that allows users to store gas in a pipeline, which in practice involves injecting more gas into a pipeline than what is taken out on a particular day.
Loan service: A service that allows users to “borrow” gas from a pipeline, which in practice involves withdrawing more gas from a pipeline than what is injected on a particular day.
Reserves and resources
Reserves: Quantities of gas expected to be commercially recoverable from a given date under defined conditions.
1P (proved) reserves: Commercially recoverable reserves with at least a 90 per cent probability that the quantities recovered will equal or exceed the estimated quantity.

Gas Inquiry 2017-2020 7
2P (proved and probable) reserves: Commercially recoverable reserves with at least a 50 per cent probability that the quantities recovered will equal or exceed the estimated quantity.
3P (proved and probable and possible) reserves: Commercially recoverable reserves with at least a 10 per cent probability that the quantities recovered will equal or exceed the estimated quantity.
Contingent resources: quantities of gas estimated to be potentially recoverable from known accumulations but are not yet considered able to be developed commercially due to one or more contingencies. Contingent resources may include gas accumulations for which there are currently no viable markets, where commercial recovery is dependent on technology under development or where evaluation of the accumulation is insufficient to assess if it can be produced commercially. 2C resources are classified as a best estimate of the resource (1C is the low estimate and 3C is the high estimate).
Prospective resources: Estimated quantities associated with undiscovered gas. These represent quantities of gas which are estimated, as of a given date, to be potentially recoverable from gas deposits identified on the basis of indirect evidence but which have not yet been drilled. Prospective resources represent a higher risk than contingent resources since the risk of discovery is also added. For prospective resources to become classified as contingent resources, hydrocarbons must be discovered, the gas accumulation must be further evaluated and an estimate made of quantities that would be recoverable under appropriate development projects.
Transportation and storage related terms:
Contracted but un-nominated capacity: A quantity of contracted pipeline capacity that is not nominated to be used by a shipper on a gas day.
Gas storage service: A service that allows users to store gas in a facility (either underground depleted gas fields or domestic LNG storage).
Secondary capacity: Capacity that is on-sold by primary capacity holders on a pipeline.
Shipper: A user of pipeline services.
September 2017 report: the ACCC’s first interim report, published in September 2017, in the three year inquiry into the supply of and demand for wholesale gas in Australia that commenced in April 2017.
Southern States: South Australia, New South Wales, the Australian Capital Territory, Victoria and Tasmania.
Spot market/transaction: One-off transactions, as distinct from transactions occurring under supply contracts.
Swap arrangement: An arrangement between two or more gas market participants to swap rights or obligations. For example, two gas producers in different locations may swap gas delivery obligations to minimise transportation.
Take or pay: A contract term specifying the minimum proportion of ACQ the buyer must pay for in each year.
Unfulfilled offer: A written offer for supply of gas that does not result in an agreement to supply gas.
Units of Energy
Joule—a unit of energy in the International System of Units

Gas Inquiry 2017-2020 8
Gigajoule (GJ)—a billion (109) joules
Terajoule (TJ)—a trillion (1012) joules
Petajoule (PJ)—a quadrillion (1015) joules
Million British Thermal Units (MMBtu)

Gas Inquiry 2017-2020 9
Overview
This is the third interim report of the Australian Competition and Consumer Commission’s (ACCC) inquiry (‘the Inquiry’) into gas supply arrangements in Australia. The ACCC has continued its focus on the operation of the East Coast Gas Market, where there are immediate and longer-term concerns.1
This report covers three topics:
an update on gas prices, which confirms the recent fall in gas commodity price offers for 2018 and 2019 and that prices struck under gas supply agreements (GSAs) remain generally higher in the Southern States2 than in Queensland
our decision to publish on our website an LNG netback price series to improve gas price transparency and assist commercial and industrial (C&I) users in negotiating for gas supply
our assessment of new reporting in relation to transportation services for non-scheme pipelines, which questions whether early information on standing offers and standing price methodologies is adequately addressing the objective of reducing information asymmetry between pipeline operators and users of pipeline services.
Gas price offers are well below the 2017 peak
With the information collected from suppliers since November 2017, the ACCC now has a more complete picture of the prices expected to be paid for gas supply in 2018, as well as the evolution of price offers for 2018 supply. The ACCC is now also reporting on prices offered and agreed for 2019 supply.
Latest data on gas commodity price offers
After reaching a peak of over $20/GJ in early 2017, gas commodity prices3 in offers for 2018 supply across the East Coast Gas Market fell to around $8–12/GJ between July and November 2017. The range of gas price offers narrowed further over subsequent months, with most offers between November 2017 and January 2018 being made between $8–10/GJ, as shown in chart 1.
This could reflect a less uncertain gas supply-demand outlook for 2018 and 2019 following the commitment made by the Queensland LNG producers under the Heads of Agreement with the Australian Government to make additional quantities of gas available to the domestic market. ACCC monitoring and close attention to specific deals may also have had an effect. The ACCC’s monitoring and public reporting can inhibit some of the exercise of market power in gas price negotiations.
1 The East Coast Gas Market currently includes Queensland, South Australia, New South Wales, the Australian Capital
Territory, Victoria and Tasmania. The Northern Territory will be connected to the East Coast Gas Market from 2019. This report does not cover Western Australia for reasons set out in the September 2017 report.
2 South Australia, New South Wales, the Australian Capital Territory, Victoria, and Tasmania. 3 Gas commodity prices are prices for the gas component under a GSA, and do not include any applicable transportation or
retail costs.

Gas Inquiry 2017-2020 10
Chart 1: Gas commodity price offers for 2018 supply in the East Coast Gas Market
Source: ACCC analysis of offer and bid information provided by suppliers. Note: Offers up to 14 July 2017 are for annual quantities of at least 1 PJ; offers after this date are for annual quantities of at least 0.5 PJ. Note: Prices are for gas commodity only. Actual prices paid by users may also include transport and retail cost components.
While large C&I gas users had chosen to delay entering into 2018 gas supply contracts while price offers were at their peak in early 2017, as price offers declined, C&I users became more willing to enter into GSAs. Between July and November 2017, around 12 large C&I users accepted offers, and this continued up to the end of December with around nine additional users securing 2018 supply.
The evolution of offers for 2019 gas supply has followed a similar pattern to that of offers for 2018 supply. After a peak of over $20/GJ in early 2017 (that coincided with a period when there was some uncertainty about gas supply over 2018 and 2019), gas commodity price offers for 2019 supply had mostly fallen to the high $8 to mid-$10/GJ range between November 2017 and January 2018. There have been fewer contracts entered into for 2019 supply so far, but this is expected to change over the course of this year, as many of the single-year GSAs recently executed near their expiry and users enter into negotiations for 2019 supply.
Latest data on gas commodity prices under contract
The average gas commodity prices under GSAs struck at the end of 2017 for gas supply in 2018 and 2019 are similar to the average prices under the GSAs struck earlier in the year. This is because not many contracts were entered into when offers were at their peak.
Prices have also continued to vary between locations. In Queensland, only short-term (seasonal) GSAs were executed towards the end of 2017, with an average price of around mid-$8/GJ. In the Southern States, several long-term GSAs were executed between November 2017 and January 2018 at prices ranging around $9–10/GJ, as shown in table 1.
14-Jul-17 9-Nov-17
6
8
10
12
14
16
18
20
22
Jan-17 Mar-17 May-17 Jul-17 Sep-17 Nov-17 Jan-18
Gas c
om
mo
dit
y p
rice (
2018 $
/GJ)
Unfulfilled - previously reported Accepted - previously reportedUnfulfilled - recent Unfulfilled - previously unreportedAccepted - previously unreported Accepted - recent

Gas Inquiry 2017-2020 11
Table 1: Expected average 2018 and 2019 wholesale gas commodity prices in the Southern States (under GSAs executed between November 2017 and January 2018)
Type of supplier / location Average gas commodity price for 2018 ($/GJ)
Average gas commodity price for 2019 ($/GJ)
Producers (VIC and SA) 9.13 9.13
Retailers/aggregators (VIC, SA and NSW)
10.16 Insufficient GSAs4
Source: ACCC analysis of contract information provided by suppliers. Note: Prices are for gas commodity only. Actual prices paid by users may also include transport and retail cost components.
The ACCC will publish LNG netback prices
The ACCC’s 2015 inquiry found that the East Coast Gas Market lacks transparency across the supply chain, including in relation to reserves and resources, current and expected production, gas supply and transportation prices, and the level and availability of storage.
The ACCC considers that this lack of transparency impairs competitive bargaining for gas supply and infrastructure services. Given recently offered gas prices across the East Coast Gas Market are significantly higher than historic gas prices and there remains uncertainty about future domestic gas prices, the ACCC considers that the need to address these gaps in transparency is heightened.
In this Inquiry so far, the ACCC has implemented the recommendation made in its 2015 inquiry and commenced publishing a series of actual gas commodity prices paid in the East Coast Gas Market, based on invoices obtained from suppliers.5 The ACCC has also begun publishing information on actual prices paid for firm forward haul services on major east coast pipelines, based on invoices obtained from pipeline operators.6 In addition, the ACCC has reported on a range of other information including prices offered and agreed for gas commodity, and the availability and utilisation of key east coast pipelines. The ACCC will continue to make this information available to the market.
As an additional measure, the ACCC has decided to publish an LNG netback price series on its website as a trial measure throughout this Inquiry. The publication of this series does not represent the ACCC setting a level of domestic gas prices nor the ACCC’s forecast of domestic gas prices. The primary purpose of the publication is to improve transparency of a key factor that plays an important role in influencing domestic gas prices.
The publication, which will commence in the coming months, will include LNG netback prices based on measures of recent and historic Asian LNG spot prices and a forward LNG netback price indicator extending to the end of the following calendar year. The ACCC will also publish accompanying documentation that will explain the concept of LNG netback pricing, the formula used to derive LNG netback prices and provide guidance on its interpretation. At the conclusion of the Inquiry, the ACCC will assess the merits of the publication and will make a recommendation on whether it should continue.
As discussed in chapter 2, there is a need for greater price transparency in the East Coast Gas Market. Availability of an indicative price and information about the factors that are driving domestic gas prices would greatly assist C&I users in negotiations for gas supply.
4 The ACCC has chosen not to include in this report the average retailer prices for gas supply in 2019 in the Southern
States due to a very small sample of applicable GSAs. If more GSAs are entered into over the course of this year, the ACCC will present average retailer prices in the future interim reports.
5 See ACCC, Gas Inquiry 2017–2020 – Interim report, September 2017, pp. 62–24. 6 See ACCC, Gas Inquiry 2017–2020 – Interim report, December 2017, pp. 66–68.

Gas Inquiry 2017-2020 12
Absence of this information inhibits competitive bargaining and makes it more difficult for C&I users to make informed long-term investment decisions.
The ACCC considers that the publication of an LNG netback price series is an important step towards improving transparency of pricing as LNG netback prices currently play an important role in influencing domestic gas price in the East Coast Gas Market. However, the LNG netback price is not sufficient on its own – there is potentially a range of factors that can influence prices offered to domestic gas buyers. The final price a particular domestic C&I user may need to pay to acquire gas could also vary considerably from the LNG netback price due to a range of factors specific to the C&I user’s individual circumstances. This includes the cost of transporting gas to the user’s location and non-price terms they request in their GSA.
The ACCC is currently exploring the key factors that may influence domestic gas prices in the East Coast Gas Market. The ACCC will discuss its findings in future interim reports. The ACCC will also consider whether to include this information alongside the LNG netback price publication on its website.
New information on pipeline services may not be achieving the objective
New information has been published on standing prices and methodologies
Since the ACCC reported in December 2017, new information disclosure obligations under Part 23 of the National Gas Rules (NGR) have come into force requiring non-scheme pipeline operators to publish standing prices for services and the methodologies used to derive those prices.7 These obligations also require the publication of pipeline availability and usage information, as well as financial and weighted average price information for pipelines. The Australian Energy Regulator (AER) has oversight of these new obligations.
In the ACCC’s 2015 inquiry, we found that information asymmetries were potentially limiting the ability of shippers to identify monopoly pricing of pipeline services and to negotiate effectively with pipeline operators.8 The aim of the Part 23 disclosure obligations is to reduce this information asymmetry and imbalance in bargaining power that shippers can face when negotiating transportation arrangements with pipeline operators.9
In February 2018, pipeline operators commenced publishing information on standing prices and price methodologies. Prior to this, most pipelines did not have published standing prices. The ACCC has reviewed this information and found that for some pipelines, published standing prices for firm forward haul services are higher than the range of firm forward haul prices paid by shippers under existing gas transportation agreements (GTAs). Further, although few new GTAs have been executed recently, the prices agreed in these new contracts are also, generally, lower than published standing prices. This suggests that standing prices are viewed as a price ceiling by pipeline operators and that shippers should be able to negotiate a better deal bilaterally.
The ACCC has also reviewed the published pricing methodologies, and considers that some of the methodologies lack sufficient detail to enable users to understand how standing prices have been derived.
7 See Part 23 of the National Gas Rules which commenced on 1 August 2017. 8 ACCC, Inquiry into the east coast gas market, April 2016, pp. 135-136. 9 Gas Market Reform Group, Gas Pipeline Information Disclosure and Arbitration Framework: Initial National Gas Rules:
Explanatory note, 2 August 2017, p. 4.

Gas Inquiry 2017-2020 13
These findings raise potential concerns about whether the standing prices and pricing methodologies published by non-scheme pipeline operators are achieving the objectives of the disclosure obligations under Part 23. These objectives are to reduce the information asymmetries faced by shippers in negotiations and to enable them to negotiate more effectively.
The ACCC notes that under the new disclosure obligations, non-scheme pipeline operators will begin to publish financial and weighted average price information in October 2018 and January 2019, depending on the financial year reporting periods used by the pipeline operator. This additional information may assist in reducing the information asymmetries faced by shippers. However, unless improvements are made to the pricing methodologies published by pipeline operators, it is possible the objective of the disclosure obligations in Part 23 may not be met.
The ACCC will continue to assess the information published under Part 23 of the NGR, including by understanding the experiences of users of applicable pipeline services. In particular, the ACCC will seek to determine whether the published information adequately addresses the market power and information asymmetry concerns highlighted in the ACCC’s 2015 inquiry.
Recent developments in pipeline pricing
There have been some recent developments in the pricing of pipeline services, with pipeline operator APA having begun offering discounted prices for non-firm services (which are generally priced at a premium to firm services).10 However, these discounted rates are only available to shippers when a pipeline is fully contracted.
In addition, APA has made a special offer for a bundled firm service to transport gas from Wallumbilla to Sydney or Melbourne.11 The ACCC estimates that this would reduce the price of transporting gas from Queensland to the Southern States by around $0.38/GJ compared to if shippers paid for transportation services on individual pipelines. Along with gas swaps at Moomba to divert gas south, cheaper bundled transport may assist in facilitating the movement of gas from Queensland to the Southern States, where there is currently expected to be insufficient supply to satisfy expected demand.
Future work of the Inquiry
This is the third interim report of this Inquiry, which will operate until April 2020. The ACCC expects to provide three interim reports in each of 2018 and 2019, around April, July and December, with a final report to be provided in April 2020. There are a number of objectives that the ACCC is targeting with its regular reporting throughout the Inquiry.
In each report, the ACCC will aim to further promote gas price transparency by providing updates on prices offered and agreed for gas supply across the domestic market. Updates on the pricing of transportation services will be provided annually in December reports, due to the relative infrequency of these price negotiations. In July reports, the ACCC will report on the gas supply and demand outlook for the following year as part of its advice to the Government under the Australian Domestic Gas Security Mechanism. The July reports will also provide a broader perspective on the state of the gas market by reporting on the experiences of C&I gas users in securing gas supply. December reports will provide an update on the immediate supply and demand outlook and C&I user experiences, as well as an update on the long-term supply outlook.
10 APA, Current tariffs and terms – east coast and central region, https://www.apa.com.au/our-services/gas-
transmission/current-tariffs-and-terms/current-tariffs-and-terms--east-coast-and-central-region/ 11 APA, Special offers, https://www.apa.com.au/our-services/gas-transmission/current-tariffs-and-terms/special-offers/.

Gas Inquiry 2017-2020 14
In addition to this regular reporting, there are a number of other areas the ACCC will be exploring over the course of the Inquiry which will be discussed in future reports, including:
conditions for, and pricing of, access to transportation and storage services
retailer pricing, costs and margins
improvements to market transparency and consistency of reporting
reserves and resources reporting
key factors influencing domestic gas prices.
The ACCC will continue to make market information available as appropriate and expects to produce the next interim report in July 2018.

Gas Inquiry 2017-2020 15
1. Domestic gas price outlook
1.1. Key points
The average12 gas commodity prices13 paid by all gas buyers in the East Coast Gas Market in 2017 under gas supply agreements (GSAs) have gradually increased over the course of 2017 as GSAs with historically low prices continue to roll off. Under more recent GSAs entered into since January 2016, in the last quarter of 2017:
o gas buyers paid, on average, $8.62/GJ to producers in Queensland
o C&I users paid, on average, $9.00/GJ to gas retailers across the East Coast Gas Market.
After peaking at over $20/GJ in early 2017, gas commodity prices offered by suppliers for gas supply in 2018 and/or 2019 have continued to trend downward over the course of 2017. By the end of 2017, most offers for gas supply in 2018 and/or 2019 were priced around $8–10/GJ for gas commodity.
The range of prices offered for gas supply more recently is narrower than the range of prices offered in the earlier part of 2017.
This could reflect a less uncertain gas supply-demand outlook for 2018 and 2019 following the commitment made by the LNG producers under the Heads of Agreement with the Australian Government to make additional quantities of gas available into the domestic market. ACCC monitoring and close attention to specific deals may also have had an effect. The ACCC’s monitoring and public reporting can inhibit some of the exercise of market power in gas price negotiations.
The average prices under GSAs struck at the end of 2017 for gas supply in 2018 and 2019 are similar to the average prices under the GSAs struck earlier in the year across the east coast. GSA prices vary between Queensland and the Southern States:
o In Queensland, the average producer prices are $8.54/GJ for supply in 2018 and $8.41/GJ for supply in 2019.
o In the Southern States, the average producer and retailer/aggregator prices for gas supply in 2018 are in the $8–10/GJ range, while the average prices for gas supply in 2019 are generally around $9/GJ.
Simple average gas prices in the domestic short-term trading markets are lower than they were at the same time last year. Comparing the period from 1 January to 28 March for both 2017 and 2018 shows that the simple average prices are about:
o 7 per cent lower in 2018 in the Sydney STTM, Adelaide STTM and the Victorian Declared Wholesale Gas Market (DWGM) – $9.01/GJ this year compared to $9.65/GJ last year
o 22 per cent lower in 2018 at the Wallumbilla Gas Supply Hub (GSH) – $7.95/GJ this year compared to $10.23/GJ last year
o 26 per cent lower at the Brisbane STTM – $7.55/GJ this year compared to $10.15/GJ last year.
12 Throughout this chapter, the term “average price” means a quantity weighted average price. Whenever a simple average
price is calculated, that price is referred to as a “simple average price”. 13 The gas prices reported throughout this chapter are for gas commodity component only and do not include any applicable
transportation or retail costs.

Gas Inquiry 2017-2020 16
1.2. Gas prices paid in the East Coast Gas Market in 2015–2017
In this section, we update our two series that track the prices that were invoiced under GSAs by a range of suppliers in the East Coast Gas Market over the period 2015–2017. The first series is based on invoices that were issued by producers to a range of gas buyers, including retailers, C&I gas users and gas powered generators (GPGs). The second series is based on invoices that were issued by retailers to C&I gas users.
Both of these series were previously presented in the September 2017 report and covered the period from Q1 2016 to Q2 2017 inclusively. In this report, both series have been extended using newly acquired information to include data for 2015 (excluding Q114) and the second half of 2017. These extensions allow for a more complete analysis of the evolution of market prices.
In interpreting the prices in this section, it is important to note that the presented prices are:
Based on invoices issued under all applicable GSAs that were in existence in a particular quarter (unless otherwise specified).15 This includes lower prices payable under a number of legacy GSAs that were entered into prior to recent changes to the East Coast Gas Market associated with the development of the LNG facilities in Queensland. The average prices presented in the invoiced prices series are therefore lower than the prices that have been agreed upon more recently. Some of the charts presented in this section include invoiced price series for GSAs that were entered into since 2016, which are more comparable to the recently agreed prices.
Based on gas commodity prices (sometimes referred to as the ex-plant prices) and do not include the cost of transporting gas to the users’ end location. The prices charged for transportation have been excluded from this analysis to enable a more direct comparison between the prices paid by buyers with differing transportation requirements.
Calculated using the prices specified in invoices issued under bilateral GSAs, which may factor in the specific non-price terms and conditions in those GSAs (including load factor, take or pay level, capacity commitments and contract length). The ACCC has not sought to account for these factors in this analysis.
1.2.1. Gas prices paid to producers under GSAs
Chart 1.1 shows the average16 quarterly gas prices that gas buyers in the East Coast Gas Market paid to gas producers in the Surat/Bowen17, Cooper and Bass Strait18 basins in 2015–2017. The averages were calculated using unit prices specified in invoices issued by producers under GSAs entered into on an arm’s length basis for a term of one year or more.
Chart 1.1 shows that prices paid in each region have increased across the period, with the largest relative increase of 45 per cent observed in the Bowen/Surat basin. The average price paid across the entire East Coast Gas Market has increased over the period by 23 percent – from $4.18/GJ in Q2 2015 to $5.16/GJ in Q4 2017.
As noted above, chart 1.1 contains prices from a number of legacy GSAs agreed upon when market conditions were substantially different. Prices from more recent GSAs, entered into
14 Q1 2015 has been excluded from the analysis due to an insufficient volume of data. 15 Excluding GSAs that were entered into between related parties. 16 As noted earlier, prices in this section are calculated on the basis of quantity weighted averages. The weights used in the
calculation are based on the quantities of gas invoiced in the relevant period. 17 The Surat/Bowen basin price reflects producers that are capable of supplying gas to Wallumbilla. 18 Due to the small number of producers in the Otway, Bass and Gippsland basins, a single average price has been
calculated to represent the prices charged by the producers in these basins.

Gas Inquiry 2017-2020 17
since January 2016 by the Queensland producers, have been separately marked on the chart. At the end of 2017, the average price paid to Queensland producers under the recent GSAs was $8.62/GJ, compared to the average price paid to all the producers across the East Coast Gas Market of $5.16/GJ – a 67 per cent difference.
It should be noted that the increase in the average invoiced prices observed under the recent GSAs from Q3 2017 to Q4 2017 is due to the substantial increase in the price of Brent crude oil over this period.19
Chart 1.1: Average gas commodity price invoiced by producers ($nominal/GJ)
Source: ACCC analysis of information provided by producers.
1.2.2. Gas prices paid by C&I users to retailers under GSAs
Chart 1.2 shows the prices that C&I users across the East Coast Gas Market paid to retailers in the period 2015–2017, separately presenting the prices paid under more recent GSAs entered into since January 2016. As previously noted, the prices included in the analysis are for the gas commodity only and exclude transportation and other ancillary charges.
The averages were calculated using unit prices specified in invoices issued by retailers to C&I users under the GSAs that were for a term of one year or more. For 2015 & 2016, the ACCC only included invoices under GSAs that were for a total annual contract quantity of at least one petajoule. From 2017, the series was expanded to include GSAs that were for a total annual contract quantity of at least half a petajoule.
At the end of 2017, the average of prices paid by C&I users under the recent GSAs ($9.00/GJ) was 17 per cent higher than the average of prices paid by C&I users under all GSAs ($7.67/GJ).
19 The prices in some recent GSAs are linked to the price of the Brent crude oil.
GSAs entered into since January 2016 (QLD only)
$2.00
$3.00
$4.00
$5.00
$6.00
$7.00
$8.00
$9.00
2015Q2
2015Q3
2015Q4
2016Q1
2016Q2
2016Q3
2016Q4
2017Q1
2017Q2
2017Q3
2017Q4
East Coast Gas Market Bowen/Surat
Cooper Gippsland/Bass/Otway
Gas Inquiry 2017-2020 18
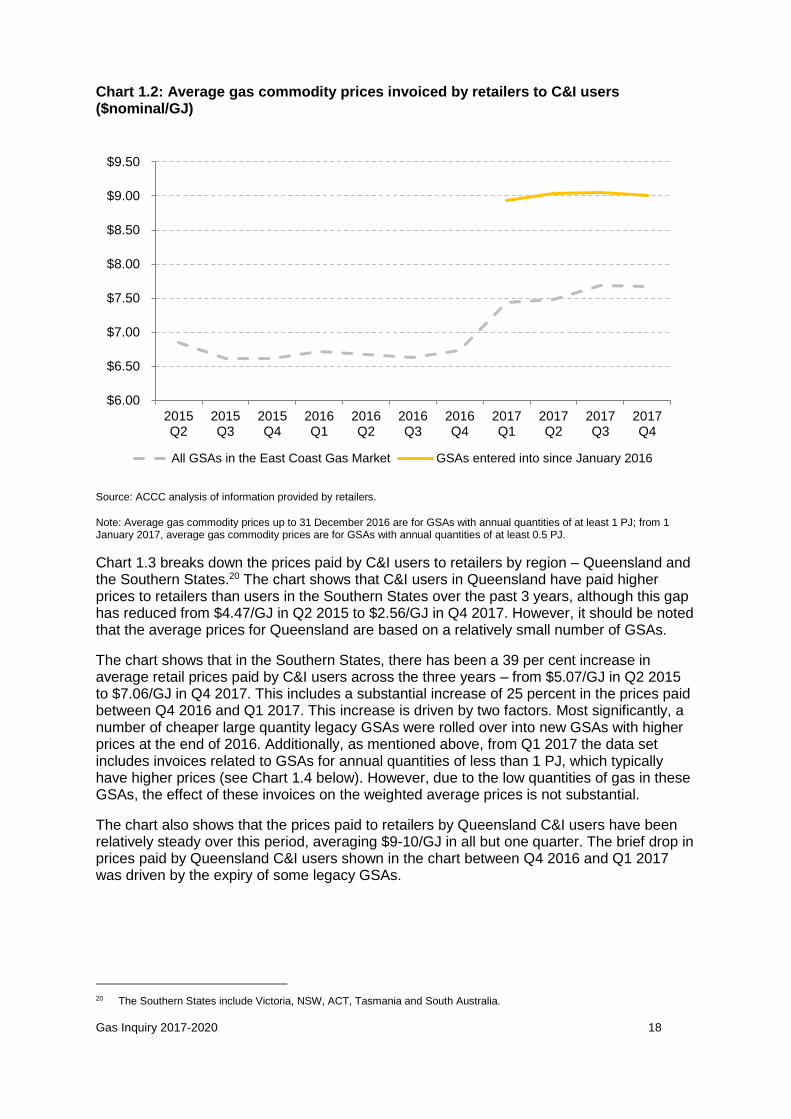
Chart 1.2: Average gas commodity prices invoiced by retailers to C&I users ($nominal/GJ)
Source: ACCC analysis of information provided by retailers.
Note: Average gas commodity prices up to 31 December 2016 are for GSAs with annual quantities of at least 1 PJ; from 1 January 2017, average gas commodity prices are for GSAs with annual quantities of at least 0.5 PJ.
Chart 1.3 breaks down the prices paid by C&I users to retailers by region – Queensland and the Southern States.20 The chart shows that C&I users in Queensland have paid higher prices to retailers than users in the Southern States over the past 3 years, although this gap has reduced from $4.47/GJ in Q2 2015 to $2.56/GJ in Q4 2017. However, it should be noted that the average prices for Queensland are based on a relatively small number of GSAs.
The chart shows that in the Southern States, there has been a 39 per cent increase in average retail prices paid by C&I users across the three years – from $5.07/GJ in Q2 2015 to $7.06/GJ in Q4 2017. This includes a substantial increase of 25 percent in the prices paid between Q4 2016 and Q1 2017. This increase is driven by two factors. Most significantly, a number of cheaper large quantity legacy GSAs were rolled over into new GSAs with higher prices at the end of 2016. Additionally, as mentioned above, from Q1 2017 the data set includes invoices related to GSAs for annual quantities of less than 1 PJ, which typically have higher prices (see Chart 1.4 below). However, due to the low quantities of gas in these GSAs, the effect of these invoices on the weighted average prices is not substantial.
The chart also shows that the prices paid to retailers by Queensland C&I users have been relatively steady over this period, averaging $9-10/GJ in all but one quarter. The brief drop in prices paid by Queensland C&I users shown in the chart between Q4 2016 and Q1 2017 was driven by the expiry of some legacy GSAs.
20 The Southern States include Victoria, NSW, ACT, Tasmania and South Australia.
$6.00
$6.50
$7.00
$7.50
$8.00
$8.50
$9.00
$9.50
2015Q2
2015Q3
2015Q4
2016Q1
2016Q2
2016Q3
2016Q4
2017Q1
2017Q2
2017Q3
2017Q4
All GSAs in the East Coast Gas Market GSAs entered into since January 2016

Gas Inquiry 2017-2020 19
Chart 1.3: Average gas commodity prices invoiced by retailers, by C&I location ($nominal/GJ)
Source: ACCC analysis of information provided by retailers.
Note: Average gas commodity prices up to 31 December 2016 are for GSAs with annual quantities of at least 1 PJ; from 1 January 2017, average gas commodity prices are for GSAs with annual quantities of at least 0.5 PJ.
Chart 1.4 shows the prices paid in 2017 by C&I users that purchased larger quantities compared to the prices paid by C&I users that purchased smaller quantities. For the purpose of this chart, C&I across the East Coast Gas Market were classified into one of two groups, depending on whether they were invoiced for less than, or greater than, one Petajoule (PJ) of gas in total over the course of 2017. For C&I users that were invoiced for gas across a number of sites, they were classified based on the total quantity invoiced across all sites.
Chart 1.4 shows that, on average, C&I users that were invoiced less than one PJ paid higher prices than users that were invoiced for more than 1 PJ. The magnitude of the difference varies across the year between $0.87–1.67/GJ. Larger gas users may have more bargaining power when negotiating GSAs with retailers, due to the total value that their demand represents.
$5.00
$6.00
$7.00
$8.00
$9.00
$10.00
2015Q2
2015Q3
2015Q4
2016Q1
2016Q2
2016Q3
2016Q4
2017Q1
2017Q2
2017Q3
2017Q4
Qld Southern States

Gas Inquiry 2017-2020 20
Chart 1.4: Average gas commodity prices invoiced by retailers, by quantity invoiced to C&I users ($nominal/GJ)
Source: ACCC analysis of information provided by retailers.
1.3. Gas offers for supply in 2018 and 2019
In the ACCC’s September 2017 and December 2017 reports, we reported on offers made and bids received by suppliers in the East Coast Gas Market for gas supply in 2018. The September report covered information received by the ACCC from suppliers on offers that did not result in a GSA by 14 July 2017. The December report further covered offers made and bids received between 14 July and 9 November 2017.
For this report, the ACCC has obtained information from suppliers on offers and bids for gas supply in both 2018 and 2019. Except where otherwise indicated, the analysis in this section focuses on offers and bids that are for a quantity of at least half a petajoule per annum and a term of at least 12 months. We extend our previous reports’ coverage of 2018 by reporting on offers made and bids received by suppliers between 9 November 2017 and 22 January 2018. We begin covering 2019 by reporting on offers made and bids received by suppliers between 14 July 2017 and 22 January 2018, as well as unfulfilled offers for 2019 that did not result in a GSA by 14 July 2017.
The price offers and bids discussed in this section include offers from, and bids to, both producers and retailers/aggregators for a range of buyers including retailers, C&I users and GPGs. Consistent with the gas prices presented elsewhere in this chapter, these prices represent only the gas commodity component of offers and bids. That is, they do not include other price components that will be billed to the user should the offer or bid progress to a GSA, such as the cost of transporting the gas to the user’s delivery location. The price of offers from retailers/aggregators may also have margins and other types of costs built in.
$6.50
$7.00
$7.50
$8.00
$8.50
$9.00
2017 Q1 2017 Q2 2017 Q3 2017 Q4
C&I users invoiced for > 1PJ C&I users invoiced for < 1PJ
Gas Inquiry 2017-2020 21
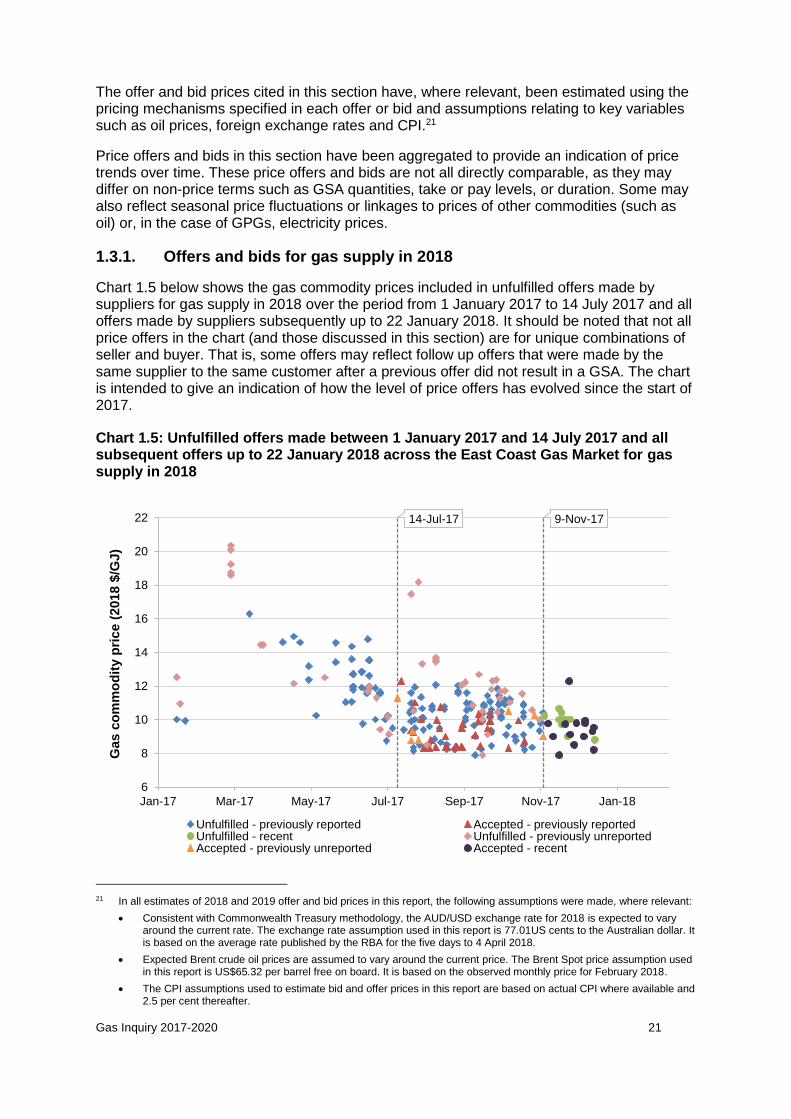
The offer and bid prices cited in this section have, where relevant, been estimated using the pricing mechanisms specified in each offer or bid and assumptions relating to key variables such as oil prices, foreign exchange rates and CPI.21
Price offers and bids in this section have been aggregated to provide an indication of price trends over time. These price offers and bids are not all directly comparable, as they may differ on non-price terms such as GSA quantities, take or pay levels, or duration. Some may also reflect seasonal price fluctuations or linkages to prices of other commodities (such as oil) or, in the case of GPGs, electricity prices.
1.3.1. Offers and bids for gas supply in 2018
Chart 1.5 below shows the gas commodity prices included in unfulfilled offers made by suppliers for gas supply in 2018 over the period from 1 January 2017 to 14 July 2017 and all offers made by suppliers subsequently up to 22 January 2018. It should be noted that not all price offers in the chart (and those discussed in this section) are for unique combinations of seller and buyer. That is, some offers may reflect follow up offers that were made by the same supplier to the same customer after a previous offer did not result in a GSA. The chart is intended to give an indication of how the level of price offers has evolved since the start of 2017.
Chart 1.5: Unfulfilled offers made between 1 January 2017 and 14 July 2017 and all subsequent offers up to 22 January 2018 across the East Coast Gas Market for gas supply in 2018
21 In all estimates of 2018 and 2019 offer and bid prices in this report, the following assumptions were made, where relevant:
Consistent with Commonwealth Treasury methodology, the AUD/USD exchange rate for 2018 is expected to vary around the current rate. The exchange rate assumption used in this report is 77.01US cents to the Australian dollar. It is based on the average rate published by the RBA for the five days to 4 April 2018.
Expected Brent crude oil prices are assumed to vary around the current price. The Brent Spot price assumption used in this report is US$65.32 per barrel free on board. It is based on the observed monthly price for February 2018.
The CPI assumptions used to estimate bid and offer prices in this report are based on actual CPI where available and 2.5 per cent thereafter.
14-Jul-17 9-Nov-17
6
8
10
12
14
16
18
20
22
Jan-17 Mar-17 May-17 Jul-17 Sep-17 Nov-17 Jan-18
Gas c
om
mo
dit
y p
rice (
2018 $
/GJ)
Unfulfilled - previously reported Accepted - previously reportedUnfulfilled - recent Unfulfilled - previously unreportedAccepted - previously unreported Accepted - recent

Gas Inquiry 2017-2020 22
Source: ACCC analysis of offer and bid information provided by suppliers. Note: Offers up to 14 July 2017 are for annual quantities of at least 1 PJ; offers after this date are for quantities of at least 0.5 PJ. Includes offers for gas supply of at least 12 months duration. Note: Prices are for gas commodity only. Actual prices paid by users may also include transport and retail cost components.
In the ACCC’s September 2017 report, we reported that unfulfilled offers for 2018 supply had shown an increase in price over time since the beginning of 2016, reaching a peak in early 2017 before declining in July 2017. In December 2017, we reported that most offers made in the period between 14 July and 9 November 2017 were priced in the range $8 to $12/GJ. Following publication of the ACCC’s December 2017 report, additional information was identified by some suppliers on offers and bids made throughout 2017 (these are marked as ‘previously unreported’ in chart 1.5). While broadly consistent with the reported $8 to $12/GJ price range, the additional information reveals a number of higher priced offers in that period that had not previously been reported.
Chart 1.5 shows that most offers made in the period between 9 November 2017 and 22 January 2018 were priced in the range of around $8 to $10/GJ. The chart shows that the range of prices offered in this period was narrower than the range of prices offered in the earlier part of 2017. This may reflect a less uncertain gas supply-demand outlook for 2018 following additional quantities of gas being made available by the LNG producers into the domestic market after the Heads of Agreement was reached with the Australian Government. ACCC monitoring and close attention to specific deals may also have had an effect. The ACCC’s monitoring and public reporting can inhibit some of the exercise of market power in gas price negotiations.
While offer prices have trended downward since early 2017, they remain higher than the $6 to $8/GJ range observed at the beginning of 2016.22
Recent offers and bids for gas supply in 2018: LNG producers and other suppliers
Table 1.1 summarises offers made and bids received by suppliers in the period between 14 July 2017 and 22 January 2018 for gas supply in 2018. Reflecting the trend seen in chart 1.5, the price range of offers made and bids received between 9 November 2017 and 22 January 2018 has narrowed compared to the period between 14 July and 9 November 2017.
Table 1.1: Recent offers and bids for gas supply in 2018
14 July 2017 – 9 November 201723 Offers Bids
Number of offers or bids 157 77
Gas commodity price range ($/GJ) 7.90 – 18.18 5.50 – 13.70
Average gas commodity price ($/GJ) 9.51 8.39
9 November 2017 – 22 January 2018 Offers Bids
Number of offers or bids 21 9
Gas commodity price range ($/GJ) 8.20 – 11.31 7.30 – 12.28
Average gas commodity price ($/GJ) 9.69 8.17
22 ACCC, Gas Inquiry September 2017 Report, Chart 4.5, p. 75. 23 Figures in this table differ from those reported in the ACCC’s December 2017 report as this table only includes offers and
bids for at least 12 months duration and a quantity of at least half a petajoule per annum.

Gas Inquiry 2017-2020 23
Source: ACCC analysis of offer and bid information provided by suppliers. Note: Prices are for gas commodity only. Actual prices paid by users may also include transport and retail cost components. Note: Includes offers and bids for gas supply of at least 12 months duration and annual quantities of at least 0.5 PJ.
Of the most recent offers and bids for gas supply in 2018 presented in table 1.1, LNG producers made 1 offer and received 3 bids. LNG producers additionally made a number of offers and received a number of bids for short-term GSAs of less than twelve months. The bulk of these offers were made to retailers and aggregators who will on-sell gas or use it to power electricity generation. The price averages and ranges of offers made and bids received by LNG producers were broadly in line with those of other suppliers.
Of the most recent offers and bids for gas supply in 2018 presented in table 1.1, other suppliers (including non-LNG producers, retailers and aggregators) made 20 offers and received 6 bids. Offer prices from these suppliers ranged from $8.20/GJ to $11.31/GJ, with an average price of $9.68/GJ. Bid prices received by these suppliers were in a similar range, with an average price of $9.73/GJ.
Offers and bids for gas supply in 2018: trend in term length
Chart 1.6 shows the breakdown of the offers made and bids received by gas suppliers based on the term length where the buyer is a C&I user and some or all of the supply is to occur in 2018. The chart covers three periods – January to July 2017 (unfulfilled offers only), July to November 2017 and November 2017 to January 2018. It includes all offers and bids of at least two months duration.
Chart 1.6: Offer and bid activity vs GSA term length
Source: ACCC analysis of offer and bid information provided by suppliers.
Chart 1.6 shows that more than ninety per cent of unfulfilled offers made in the first half of 2017 were for a term of two years or more. In contrast, the proportion of offers and bids for a term of two years or more was under 50 per cent in the second half of 2017.
This is likely to be driven by C&I gas users. As the ACCC reported in the September 2017 report, many C&I users were delaying signing GSAs for gas supply in 2018 and beyond in the hope that government intervention in the market would drive gas prices down. While prices of offers declined towards the end of the year, C&I users that the ACCC had spoken to in November 2017 still considered gas prices to be high. It is possible that these C&I
0%
10%
20%
30%
40%
50%
60%
70%
80%
90%
100%
1 Jan '17 - 13 Jul '17 14 Jul - 8 Nov '17 9 Nov '17 - 22 Jan'18
Fre
quency
Period
48+ mths
36 to 47 mths
24 to 35 mths
12 to 23 mths
<12 mths

Gas Inquiry 2017-2020 24
users sought to enter into shorter duration agreements in the hope that domestic gas prices would reduce further over time. This wait-and-see approach means that a large number of C&I users will be coming out of contract again relatively soon. The ACCC will be consulting with C&I gas users in the lead up to our next report to understand the drivers behind this trend.
1.3.2. Offers and bids for gas supply in 2019
Chart 1.7 below shows the gas commodity prices included in unfulfilled offers made by suppliers for 2019 gas supply over the period from 1 January 2017 to 14 July 2017 and all offers made by suppliers subsequently up to 22 January 2018. It should be noted that not all price offers in the chart (and those discussed in this section) are for unique combinations of seller and buyer. That is, some offers may reflect follow up offers that were made by the same supplier to the same customer after a previous offer did not result in a GSA. The chart is intended to give an indication of how the level of price offers has evolved since the start of 2017.
Chart 1.7: Unfulfilled offers between 1 January 2017 and 14 July 2017 and all subsequent offers up to 22 January 2018 across the East Coast Gas Market for gas supply in 2019
Source: ACCC analysis of offer and bid information provided by suppliers. Note: Offers up to 14 July 2017 are for annual quantities of at least 1 PJ; offers after this date are for quantities of at least 0.5 PJ. Includes offers for gas supply of at least 12 months duration. Note: Prices are for gas commodity only. Actual prices paid by users may also include transport and retail cost components.
Chart 1.7 shows a downward trend in gas commodity prices offered by suppliers for gas supply in 2019, closely resembling the trend discussed earlier for gas supply in 2018 (see chart 1.5 above). This is because many of the offers for gas supply in 2019 were made as part of offers spanning both 2018 and 2019 supply. As a result, there is significant overlap between the offers for gas supply in 2018 displayed in chart 1.7 and the offers for gas supply in 2018 displayed in chart 1.5. Further, those offers spanning both 2018 and 2019 have typically been made at constant prices across the two years (generally subject to CPI escalation).
14-Jul-17 9-Nov-17
6
8
10
12
14
16
18
20
22
Jan-17 Mar-17 May-17 Jul-17 Sep-17 Nov-17 Jan-18
Gas c
om
mo
dit
y p
rice (
2019 $
/GJ)
Accepted Unfulfilled

Gas Inquiry 2017-2020 25
Most offers for gas supply in 2019 that were made in the period between 14 July and 9 November 2017 were priced in the $8 to $12/GJ range. Compared to offers made for 2018 supply in the same timeframe, there is a slightly greater prevalence of offers in the $12 to $14/GJ range.
Most offers for gas supply in 2019 made in the period between 9 November 2017 and 22 January 2018 were priced in the high $8 to mid-$10/GJ range. The chart shows that the range of prices offered in this period was narrower than the range of prices offered in the earlier part of 2017. This may reflect a less uncertain gas supply-demand outlook for 2019 following the commitment made by the LNG producers under the Heads of Agreement with the Australian Government to make additional quantities of gas available into the domestic market. ACCC monitoring and close attention to specific deals may also have had an effect. The ACCC’s monitoring and public reporting can inhibit some of the exercise of market power in gas price negotiations.
Recent offers and bids for gas supply in 2019
Table 1.2 summarises offers made and bids received by suppliers in the period between 14 July 2017 and 22 January 2018 for gas supply in 2019. As discussed above, many of the offers and bids for gas supply in 2019 reported to the ACCC to-date have come as part of offers/bids spanning both 2018 and 2019 supply. As a result there is significant overlap between the offers and bids for 2019 represented in table 1.2 and those for 2018 supply represented in table 1.1.
Table 1.2: Offers and bids for gas supply in 2019 in the period between 14 July 2017 and 22 January 2018
14 July 2017 – 9 November 2017 Offers Bids
Number of offers or bids 121 32
Gas commodity price range ($/GJ) 7.25 – 19.16 7.80 – 15.09
Average gas commodity price ($/GJ) 9.51 9.21
9 November 2017 – 22 January 2018 Offers Bids
Number of offers or bids 15 1
Gas commodity price range ($/GJ) 7.30 – 10.56 Insufficient bids24
Average gas commodity price ($/GJ) 8.64 Insufficient bids
Source: ACCC analysis of offer and bid information provided by suppliers. Note: Prices are for gas commodity only. Actual prices paid by users may also include transport and retail cost components. Note: Includes offers and bids for gas supply of at least 12 months duration and annual quantities of at least 0.5 PJ.
Reflecting the downward trend shown in chart 1.7, the average price of offers made by suppliers between 9 November 2017 and 22 January 2018 was $8.64/GJ, compared with an average price of $9.51/GJ for offers made between 14 July and 9 November 2017.
1.4. Prices agreed for gas supply in 2018 and 2019
This section sets out the ACCC’s findings on the wholesale gas prices that producers, retailers and aggregators expect to receive in 2018 and 2019 under GSAs entered into
24 The ACCC has chosen not to include pricing information on bids received by suppliers between 9 November 2017 and
22 January 2018 for gas supply in 2019 due to a very small sample of applicable bids.

Gas Inquiry 2017-2020 26
between January 2016 and January 2018 with gas buyers in Queensland and the Southern States. The reported prices are based on the wholesale commodity price of gas (sometimes referred to as the ex-plant price) and do not include the cost of transporting gas to the user’s end location or any other ancillary costs.
For the purpose of the analysis of prices under long-term GSAs, the ACCC included:
producers: GSAs that were entered into on an arm’s length basis, with any counterparty and for a term of one year or more
retailer/aggregators: GSAs that were entered into with end users, for a term of one year or more and that were for a total annual contract quantity of at least half a petajoule.
The gas prices cited in this section have been estimated using the pricing mechanisms specified in each GSA and assumptions relating to key variables such as oil prices, foreign exchange rates and CPI, where relevant.
The ACCC notes that the GSA price averages cited in this section are not adjusted to reflect any differences in non-price terms specified in the GSAs, such as take-or-pay levels, loading factors or banking rights. These non-price terms and the flexibility they can provide may be valued differently depending on the customer and may influence the gas prices that are ultimately agreed.
The prices presented in this section for supply in 2018 in both Queensland and the Southern States are not directly comparable to those that were reported in our September 2017 and December 2017 reports. This is because the prices for gas supply in 2018 that were reported previously were calculated under the pricing formulae set out in the respective GSAs, based on a set of assumptions about key economic parameters in 2018 that existed at the time. Market expectations for oil prices and exchange rates in 2018 have changed over recent months and have been incorporated into the prices presented in this report.
Prices agreed under long-term GSAs in Queensland
Table 1.3 shows expected average gas prices for supply in 2018 and 2019 entered into by producers and retailers/aggregators in Queensland since January 2016. For gas supply in 2018, these averages are based on GSAs that were previously reported in the December 2017 report (updated for current estimates of oil prices). In the period between November 2017 and January 2018, gas suppliers in Queensland only entered into short-term GSAs for gas supply in 2018.
For gas supply in 2019, the averages in the table are based on GSAs that were previously reported in the December 2017 report as well as more recent long-term GSAs entered into between November 2017 and January 2018.

Gas Inquiry 2017-2020 27
Table 1.3: Expected average 2018 and 2019 wholesale gas commodity prices in
Queensland (under GSAs executed since January 2016)25
Type of supplier Average gas commodity price for 2018 ($/GJ)
Average gas commodity price for 2019 ($/GJ)
Producers 8.54 8.41
Retailers/aggregators 9.35 Insufficient GSAs26
Source: ACCC analysis of contract information provided by suppliers.
Table 1.3 shows that the average price of producer GSAs for 2018 and 2019 is similar. Prices under producer GSAs for gas supply in 2018 range from $7.45/GJ to $10.05/GJ, while prices under producer GSAs for gas supply in 2019 range from $7.63/GJ to $10.09/GJ.
Table 1.3 also shows that the average price of retailer/aggregator GSAs for gas supply in 2018 is higher than the average price of producer GSAs. However, it should be noted that the average price of retailer/aggregator GSAs was based on only a small number of GSAs. Further, some of the difference in prices may be due to retailer specific costs or margins. The ACCC is currently engaging with the major retailers to understand the costs they incur in selling gas to domestic gas users and the margins they apply. The ACCC intends to report on its findings in future interim reports.
Prices agreed under long-term GSAs in the Southern States
Table 1.4 shows average gas price estimates for gas supply in 2018 and 2019 based on long-term GSAs entered into in the Southern States since January 2016. These averages incorporate prices agreed under GSAs previously reported in the December 2017 report as well as prices under more recent GSAs entered into between November 2017 and January 2018. It should be noted that the average price for retailers/aggregators in South Australia is based on a small number of GSAs.
25 In all estimates of 2018 and 2019 GSA prices in this report, the following assumptions were made, where relevant:
Consistent with Commonwealth Treasury methodology, the AUD/USD exchange rate for 2018 is expected to vary around the current rate. The exchange rate assumption used in this report is 77.01US cents to the Australian dollar. It is based on the average rate published by the RBA for the five days to 4 April 2018.
Expected Brent crude oil prices are assumed to vary around the current price. The Brent Spot price assumption used in this report is US$65.32 per barrel free on board. It is based on the observed monthly price for February 2018.
Based on the historical relationship between Brent crude oil prices and the Japanese Customs Cleared (JCC) crude oil price, the ACCC considers that the Brent price lagged by half a calendar month is an appropriate proxy for the JCC price.
The CPI assumptions used to estimate GSA prices in this report are based on actual CPI where available and 2.5 per cent thereafter.
26 The ACCC has chosen not to include in this report the average retailer prices for gas supply in 2019 in Queensland due to a very small sample of applicable GSAs. If more GSAs are entered into over the course of this year, the ACCC will present average retailer prices in the future interim reports.

Gas Inquiry 2017-2020 28
Table 1.4: Expected average 2018 and 2019 wholesale gas commodity prices in the Southern States (under GSAs executed since January 2016)
Type of supplier Average gas commodity price for 2018 ($/GJ)
Average gas commodity price for 2019 ($/GJ)
Producers (VIC and SA) 9.21 8.91
Retailers/aggregators (VIC) 9.97 9.69
Retailers/aggregators (NSW) 8.49 9.01
Retailers/aggregators (SA) 8.04 Insufficient GSAs
Source: ACCC analysis of contract information provided by suppliers.
Table 1.4 shows that the average of gas prices for supply in 2019 is lower than the average of gas prices for supply in 2018 with the exception of NSW prices. This is largely due to the fact that the higher priced GSAs are for gas supply in 2018 only.
There is a large range of prices for the GSAs entered into by retailers/aggregators across the Southern States. Prices range from $5.98/GJ to $12.28/GJ for gas supply in 2018 and from $6.13/GJ to $12.59/GJ for gas supply in 2019. Part of the reason for the wide range in GSA prices is that different contracts are signed at different times and the prevailing market price varies over time. The prices at the lower end of these ranges are typically in GSAs entered into in 2016, while prices at the higher end of these ranges are largely in GSAs entered into in 2017.
Table 1.5 below shows average wholesale gas commodity price estimates for gas supply in 2018 and 2019 based on the more recent long-term GSAs entered into between November 2017 and January 2018. There have only been a small number of long-term GSAs entered into by producers and retailer/aggregators in this period. For this reason, the ACCC has calculated a single average price for gas supplied by producers in Victoria and South Australia as well as a single average price for gas supplied by retailers/aggregators in Victoria, South Australia and NSW.27
Table 1.5: Expected average 2018 and 2019 wholesale gas commodity prices in the Southern States (under GSAs executed between November 2017 and January 2018)
Type of supplier Average gas commodity price for 2018 ($/GJ)
Average gas commodity price for 2019 ($/GJ)
Producers (VIC and SA) 9.13 9.13
Retailers/aggregators (VIC, SA and NSW)
10.16 Insufficient GSAs
Source: ACCC analysis of contract information provided by suppliers.
Table 1.5 shows that the average prices agreed under the more recent GSAs are similar to the average prices agreed previously. The range of producer prices for gas supply in 2018 under the more recent GSAs is between $8.60/GJ and $9.80/GJ. The range for gas supply in 2019 is narrower, from $8.82/GJ to $9.64/GJ.
27 Even on an aggregated basis, there were too few GSAs entered into by retailers and aggregators in the Southern States
since November 2017 for gas supply in 2019 to calculate an average price.

Gas Inquiry 2017-2020 29
Prices agreed under short-term GSAs
The ACCC has obtained information on a number of short-term GSAs (less than one year) entered into for gas supply in 2018 & 2019. These have not been included in the analysis in this chapter.
The average price of short-term GSAs over 2018–19 across the entire East Coast Gas Market is $8.30/GJ with individual GSA prices ranging from $8.10/GJ to $11/GJ.
In these short-term GSAs, the most common suppliers are the LNG producers and the most common buyers are gas powered generators. The highest prices under short-term GSAs are generally for gas supply over the period from January to April. This period corresponds to some of the warmer months in Australia when demand for electricity is high. During this period, the international LNG spot prices are generally seasonally high too as this is the period of the colder months in the northern hemisphere when demand for LNG is high.
1.5. Gas prices paid in domestic short-term trading markets
The price of gas in short-term markets is volatile and may reflect seasonal or temporary factors. It can be influenced by weather, the price that gas powered generation is receiving in the national electricity market, maintenance at processing facilities like the Longford gas plant or the requirements of market participants to balance their portfolios.
Chart 1.8 shows the daily prices in the Brisbane, Sydney and Adelaide STTMs, the Victorian DWGM and the Wallumbilla GSH from the start of April 2017 to the end of March 2018. The chart shows that prices in Queensland have diverged from the rest of the market for various periods. For example, from July to August 2017, the simple average price in short-term trading markets in the Southern States was $9.21/GJ compared to $7.12/GJ in Queensland.
Chart 1.8: Daily prices paid in domestic short-term trading markets, 1 April 2017 to 28 March 2018, ($nominal/GJ)
Source: AER.
Recent prices in all the domestic short-term trading markets in the Southern States are about 7 per cent lower relative to the same period in the previous year. The simple average
4
5
6
7
8
9
10
11
12
13
14
Apr 17 May 17 Jun 17 Jul 17 Aug 17 Sep 17 Oct 17 Nov 17 Dec 17 Jan 18 Feb 18 Mar 18 Apr 18
Sydney Adelaide Brisbane Victoria Wallumbilla Moomba

Gas Inquiry 2017-2020 30
of the prices in the Sydney STTM, Adelaide STTM and the Victorian DWGM was $9.01/GJ for the period from 1 January 2018 to 28 March 2018 and $9.65 for the period from 1 January 2017 to 28 March 2017.
In Queensland, the price difference has been larger. The simple average of the prices at the Wallumbilla GSH is $7.95/GJ for the period from 1 January 2018 to 28 March 2018, which is about 22 per cent lower than $10.23/GJ simple average of the prices for the period from 1 January 2017 to 28 March 2017. Similarly, the simple average of prices on the Brisbane STTM was $7.55/GJ for the period 1 January 2018 to 28 March 2018, which is about 26 per cent lower than $10.15/GJ simple average of the prices for the period 1 January 2017 to 28 March 2017.

Gas Inquiry 2017-2020 31
2. LNG netback price series
2.1. Key points
The ACCC has decided to publish an LNG netback price series on its website on a trial basis for the duration of this inquiry. At the conclusion of the inquiry, the ACCC will assess the merits of the publication and will make a recommendation on whether it should continue.
The publication will commence in the coming months and will include LNG netback prices based on measures of recent and historic Asian LNG spot prices. It will also include a forward LNG netback price indicator extending to the end of the following calendar year. The ACCC will also publish accompanying documentation that will explain the concept of LNG netback pricing, the formula used to derive LNG netback prices and provide guidance on its interpretation.
The publication of this series by the ACCC does not represent the ACCC setting a level of domestic gas prices nor the ACCC’s forecast of domestic gas prices. The primary purpose of the publication is to improve transparency.
Availability of an indicative price and information about the factors that are driving domestic gas prices would greatly assist C&I users in negotiations for gas supply. Absence of this information inhibits competitive bargaining and makes it more difficult for C&I users to make informed long-term investment decisions.
The publication of the LNG netback price series is an important step towards improving transparency of pricing as LNG netback prices currently play an important role in influencing domestic gas prices in the East Coast Gas Market. However, the LNG netback price is not sufficient on its own – there is potentially a range of factors that can influence prices offered to domestic gas buyers.
The final price a particular domestic C&I user may need to pay to acquire gas could also vary considerably from the LNG netback price due to a range of factors specific to the C&I user’s individual circumstances. This includes the cost of transporting gas to the user’s location and non-price terms they request in their gas supply agreement (GSA).
The ACCC is currently exploring the key factors that may influence domestic gas prices in the East Coast Gas Market. The ACCC will discuss its findings in future interim reports and will consider whether to include this information alongside the LNG netback price publication on its website.
2.2. Introduction
An LNG netback price is a pricing concept based on an effective price to the producer or seller at a specific location or defined point, calculated by taking the delivered price paid for gas and subtracting or ‘netting back’ costs incurred between the specific location and the delivery point of the gas. For example, an LNG netback price at Wallumbilla is calculated by taking a delivered LNG price at a destination port and subtracting, as applicable, the cost of transporting gas from Wallumbilla to the liquefaction facility, the cost of liquefaction and the cost of shipping LNG from Gladstone to the destination port.
In the ACCC’s 2015 inquiry, the ACCC discussed the influence that LNG prices were likely to have on the outcomes of gas supply negotiations in the domestic market.28 The ACCC observed, however, that there appeared to be little common understanding of what an LNG
28 ACCC, Inquiry into the east coast gas market, April 2016, pp. 42–53.
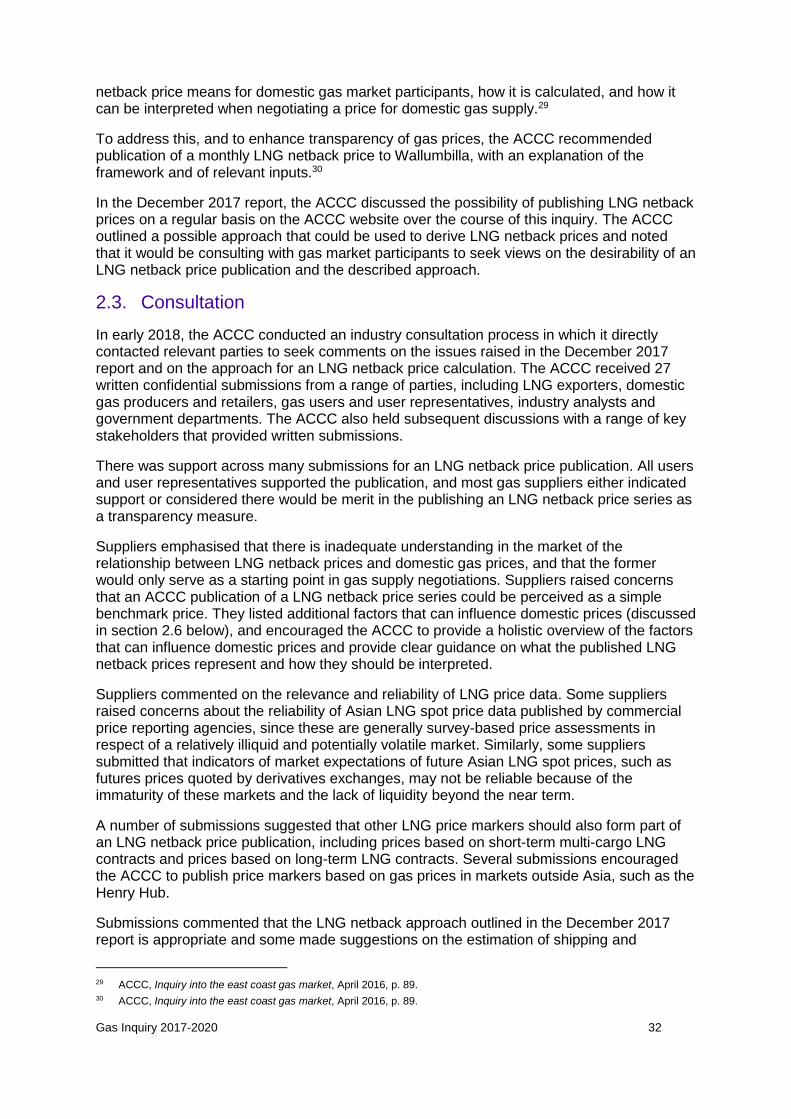
Gas Inquiry 2017-2020 32
netback price means for domestic gas market participants, how it is calculated, and how it can be interpreted when negotiating a price for domestic gas supply.29
To address this, and to enhance transparency of gas prices, the ACCC recommended publication of a monthly LNG netback price to Wallumbilla, with an explanation of the framework and of relevant inputs.30
In the December 2017 report, the ACCC discussed the possibility of publishing LNG netback prices on a regular basis on the ACCC website over the course of this inquiry. The ACCC outlined a possible approach that could be used to derive LNG netback prices and noted that it would be consulting with gas market participants to seek views on the desirability of an LNG netback price publication and the described approach.
2.3. Consultation
In early 2018, the ACCC conducted an industry consultation process in which it directly contacted relevant parties to seek comments on the issues raised in the December 2017 report and on the approach for an LNG netback price calculation. The ACCC received 27 written confidential submissions from a range of parties, including LNG exporters, domestic gas producers and retailers, gas users and user representatives, industry analysts and government departments. The ACCC also held subsequent discussions with a range of key stakeholders that provided written submissions.
There was support across many submissions for an LNG netback price publication. All users and user representatives supported the publication, and most gas suppliers either indicated support or considered there would be merit in the publishing an LNG netback price series as a transparency measure.
Suppliers emphasised that there is inadequate understanding in the market of the relationship between LNG netback prices and domestic gas prices, and that the former would only serve as a starting point in gas supply negotiations. Suppliers raised concerns that an ACCC publication of a LNG netback price series could be perceived as a simple benchmark price. They listed additional factors that can influence domestic prices (discussed in section 2.6 below), and encouraged the ACCC to provide a holistic overview of the factors that can influence domestic prices and provide clear guidance on what the published LNG netback prices represent and how they should be interpreted.
Suppliers commented on the relevance and reliability of LNG price data. Some suppliers raised concerns about the reliability of Asian LNG spot price data published by commercial price reporting agencies, since these are generally survey-based price assessments in respect of a relatively illiquid and potentially volatile market. Similarly, some suppliers submitted that indicators of market expectations of future Asian LNG spot prices, such as futures prices quoted by derivatives exchanges, may not be reliable because of the immaturity of these markets and the lack of liquidity beyond the near term.
A number of submissions suggested that other LNG price markers should also form part of an LNG netback price publication, including prices based on short-term multi-cargo LNG contracts and prices based on long-term LNG contracts. Several submissions encouraged the ACCC to publish price markers based on gas prices in markets outside Asia, such as the Henry Hub.
Submissions commented that the LNG netback approach outlined in the December 2017 report is appropriate and some made suggestions on the estimation of shipping and
29 ACCC, Inquiry into the east coast gas market, April 2016, p. 89. 30 ACCC, Inquiry into the east coast gas market, April 2016, p. 89.

Gas Inquiry 2017-2020 33
liquefaction costs. Submissions also included comments on other issues, such as an appropriate source of LNG spot price information, the preferred frequency of the publication and additional information that the ACCC could publish (such as indicative pipeline tariffs).
2.4. ACCC to publish regular LNG netback prices
The ACCC has decided to publish an LNG netback price series on its website, as there is a significant need for greater price transparency in the East Coast Gas Market (discussed further in section 2.5 below). In light of the concerns raised in submissions, the publication will be on a trial basis for the duration of the inquiry. At the conclusion of the inquiry, the ACCC will assess the merits of the publication and will make a recommendation on whether it should continue.
Section 2.4.1 outlines the information that the ACCC currently expects to publish, although the details relating to the publication are still being finalised. The ACCC expects to commence the publication in the coming months.
Section 2.6 outlines the additional factors that gas suppliers have raised as being relevant to domestic prices and the further work that the ACCC expects to undertake to improve transparency of those factors.
Section 2.7 discusses the interpretation of the LNG netback price series.
2.4.1. Information to be published
The ACCC will publish a monthly LNG netback price series based on measures of recent and historic Asian LNG spot prices, extending back to the beginning of 2016. These LNG netback prices will be derived using a monthly average of the daily prices published by a commodity price reporting agency and will be netted back to Wallumbilla using estimates of the cost of shipping, liquefaction and transportation. The ACCC will update the series on a monthly basis.
The ACCC will also publish a forward LNG netback price indicator, extending to the end of the following calendar year, based on expected Asian LNG spot prices at the time of publication. These LNG netback prices will be derived using futures prices of the Japan Korea Marker (a measure of Asian LNG spot prices published by S&P Global Platts) and forward estimates of shipping, liquefaction and transportation costs. The ACCC will update this series on a fortnightly basis.
The ACCC will publish pipeline services tariffs and any other relevant information to enable gas buyers to determine an indicative cost of transportation at particular locations in the East Coast Gas Market, based on their individual transportation needs and reflecting actual prices paid.
Further, the ACCC will publish accompanying documentation that will explain the concept of LNG netback pricing and provide guidance on its interpretation. The ACCC will also provide a detailed explanation of its LNG netback price formula and assumptions, as well as show step-by-step calculations used to convert delivered LNG prices to netback prices at Wallumbilla.
2.5. There is a need for greater price transparency
As reported throughout this inquiry, the domestic gas prices being agreed in the East Coast Gas Market are now significantly higher than historical prices, placing significant cost pressures on many C&I gas users. In discussions with the ACCC, many C&I users have raised concerns about the lack of competitive bargaining in the East Coast Gas Market, with

Gas Inquiry 2017-2020 34
C&I users receiving offers from fewer suppliers than in the past. C&I users are also concerned about the lack of adequate pricing information available to them to assist them in understanding the drivers of domestic gas prices and what the prices are likely to be in the future.31
This creates a very challenging negotiating environment for C&I users. Many C&I users are finding it difficult to assess whether prices offered to them by suppliers are reasonable and to plan ahead. In response, C&I users are increasingly opting to enter into shorter-term GSAs, despite their desire to secure gas supply on a longer-term basis, and to defer long-term investment decisions.
A key problem for C&I users is the lack of an indicative price for gas in the East Coast Gas Market. In many ways, the domestic gas market is opaque and continues to be dominated by confidential bilateral GSAs, giving C&I users limited insight into the prices being agreed in the market. The domestic short-term trading markets and hubs remain relatively thinly traded, so prices may not be representative. There is limited shared understanding of what the most relevant LNG netback price marker is for the domestic market or how it should be calculated.
A further problem for C&I users is the lack of information available to assist them to understand all the factors that are driving domestic gas prices and how those factors are reflected in the prices. In particular, there is a lack of consensus about the role of LNG netback prices in shaping domestic gas prices.
The lack of readily available pricing information impairs competitive bargaining and favours large incumbents in gas price negotiations. While some disparity has always existed, the disparity widens when the number of offers made by suppliers is reduced.
Greater price transparency in the East Coast Gas Market can help to alleviate these concerns. The Australian Government has required the ACCC to hold this three-year inquiry to improve transparency of gas prices, among other things.
The ACCC considers that the publication of the LNG netback prices is an important step towards improving transparency of pricing in the East Coast Gas Market. The ACCC has therefore decided to introduce this measure and to refine it over the course of the inquiry. At the conclusion of the inquiry, the ACCC intends to make final recommendations in respect of long-term transparency measures for the market, which may include the need for, and form of, an ongoing LNG netback price series.
However, the ACCC recognises that it needs to take further steps to explain the factors that influence domestic gas prices. The next section discusses the key factors that are likely to be influencing domestic gas prices and the steps the ACCC is taking to bring greater transparency of those factors to the market.
2.6. Factors influencing domestic gas prices
Gas suppliers submitted to the ACCC that there are factors other than LNG netback prices that are likely to influence the final prices paid by domestic gas users, such that LNG netback prices should not be interpreted as the final price domestic gas users should expect to pay for gas they purchase in domestic markets. Other specific factors that can influence the final price paid by domestic users can include:
transportation costs
costs of domestic gas production
31 ACCC, Gas inquiry 2017–2020 – Interim report, September 2017, pp. 42–60.

Gas Inquiry 2017-2020 35
non-price terms and conditions in GSAs
retailer costs and margins
prices in domestic short-term markets
electricity prices.
While the ACCC considers that LNG netback prices are likely to be a key factor influencing domestic prices in the current environment, the ACCC acknowledges that other factors such as the above may also be relevant to varying degrees under certain circumstances.
Some of these factors can affect domestic prices across the entire market, such as the cost of domestic gas production, while others are specific to the individual circumstances of the gas buyer, such as transportation costs and non-price terms and conditions in GSA. Some factors are specific to the prices offered by gas retailers, such as retailer costs and margins.
This section discusses how LNG netback prices and other factors are likely to be relevant to domestic gas prices and what the ACCC is currently doing to better understand the relationship between these factors and domestic gas prices.
2.6.1. LNG netback prices
This section sets out the ACCC’s views on the relevance of LNG netback prices in the context of current and expected market conditions, and discusses the key issues that an LNG netback publication should help to address.
What are LNG netback prices and why are they relevant to negotiations for domestic gas supply?
LNG netback prices represent a supplier’s opportunity cost of supplying gas to the domestic market, where the alternative is exporting the gas as LNG. That is, it reflects the foregone value to a supplier that could have been received if the gas had been exported.
This foregone value is not an actual amount that can be observed; rather, it is a conceptual amount based on a range of expectations and assumptions. One of the key factors underpinning an LNG netback price is the assumption about the price that can be achieved for the gas if it is exported as LNG to overseas gas buyers. This, in turn, will depend on how the LNG is being sold: either under long-term foundation LNG contracts, under short-term LNG contracts or into LNG spot markets.
As set out in the December 2017 report, the ACCC considers that the opportunity cost of domestic supply is currently represented by Asian LNG spot prices.32 This is because the east coast LNG exporters are, in aggregate, expected to have sufficient gas to meet their long-term contractual commitments in the near term and expect to produce excess gas. Given its relative proximity to the Gladstone LNG facilities, the most likely destination for this excess gas (if not used to supply the domestic market) is the Asian LNG spot market.
LNG netback prices are likely to be highly influential in determining the market price of gas on the east coast, given current market dynamics. At present, there is insufficient gas expected to be produced by domestic producers to meet domestic demand and, as noted above, the LNG producers in aggregate expect to produce excess gas. This means that the next best alternative for domestic gas buyers when negotiating with domestic suppliers is to buy gas from the LNG producers that would otherwise be sold for export (the buyer’s alternative). In this scenario, the LNG producers are the marginal suppliers of gas into the
32 ACCC, Gas inquiry 2017–2020 – Interim report, December 2017, pp. 110–111; also see ACCC, Gas inquiry 2017–2020 –
Interim report, September 2017, p. 67.

Gas Inquiry 2017-2020 36
domestic market, with the price at which they would be willing to sell gas to domestic buyers influencing the market price of gas. To be incentivised to supply the domestic market, the LNG producer must receive a domestic price at least equal to what it could receive selling the gas as LNG (less the costs it would avoid by not liquefying the gas and shipping it to an international port).
A different pricing dynamic would apply if LNG producers were no longer the marginal suppliers into the domestic market. This would occur if domestic suppliers on the east coast produced sufficient quantities of gas, such that gas from the LNG producers would no longer be required to satisfy domestic demand. In these circumstances, it would be the supplier’s next best alternative that would be more relevant in negotiations between gas suppliers and domestic gas buyers. The supplier’s next best alternative would be to sell gas to the LNG producers for export or to delay production (the seller’s alternative). In this scenario, the price at which the LNG producers would be prepared to pay for gas from domestic suppliers would influence the market price of gas.33 To be incentivised to supply the domestic market, the domestic supplier would expect to receive a domestic price at least equal to what they would receive selling the gas to an LNG producer—which would, in turn, be no more than what the LNG producer would receive exporting the gas as LNG less avoided shipping, liquefaction and transport costs.
As mentioned earlier, the LNG producers, in aggregate, expect to produce quantities of gas in excess of what is required to satisfy long-term LNG contractual obligations, which they are likely to sell on the Asian LNG spot market if it is not used for domestic supply. The buyer’s alternative is currently to purchase gas that would otherwise be sold on the Asian LNG spot market and the seller’s alternative would be to sell gas to the LNG producers that would then be sold on the Asian LNG spot market. Therefore, in both scenarios, in order to provide suppliers with a commercial incentive to supply gas to the domestic market, gas buyers would expect to pay prices that are shaped by Asian LNG spot prices.
However, as mentioned earlier, there may be other factors that influence the prices that suppliers are willing to offer to domestic gas buyers (discussed in section 2.6.2 below), which could result in prices agreed under individual GSAs deviating from LNG netback prices.
There is a lack of common understanding of LNG netback pricing
As noted above, the ACCC has found (both in the 2015 inquiry and in this inquiry) that there is a lack of common understanding among domestic market participants on what LNG netback prices are relevant, how they are calculated and how they can be interpreted when negotiating a price for domestic gas supply.
For example, in submissions received through the LNG netback consultation process, the ACCC has observed that there is a range of views among market participants on the relevance of the various LNG price markers that could be used to determine LNG netback prices. Some submissions considered that LNG spot prices were the relevant marker, while others considered that foundational LNG contract prices were relevant. A small number of submissions argued that new short-term LNG contracts should be used.
Further, there are divergent views on what costs should be accounted for in determining an LNG netback price and how these costs should be estimated. For example, most submissions agreed that the LNG netback approach described in the December 2017 report captured all relevant costs that would be avoided when an LNG producer diverts upstream production to the domestic market. Other submissions, however, considered that LNG netback prices should not be based on the Queensland LNG producers’ avoidable
33 This assumes that LNG producers have spare capacity in their trains to process additional gas.

Gas Inquiry 2017-2020 37
liquefaction costs, but rather should be based on the tolling fees charged by LNG facilities that provide third party access (such as Cheniere Energy’s LNG facility in Louisiana), which would implicitly account for sunk capital costs.
The ACCC has also observed that gas users have different expectations to suppliers on how LNG netback prices will be reflected in domestic prices. For example, some users have submitted that the prices they should pay under GSAs should be no more than LNG netback prices, whereas, as mentioned earlier, suppliers have submitted that there are other factors that influence the individual GSA prices.
The publication of LNG netback prices will improve transparency and improve the relative bargaining positions of parties
The ACCC considers that the regular publication of LNG netback prices will likely improve price discovery in the East Coast Gas Market by providing up-to-date information to market participants on a key factor that influences domestic gas prices.
The ACCC emphasises that the LNG netback price based on a measure of LNG spot prices chosen by the ACCC is not sufficient in itself to inform gas buyers of the reasonable prices they would expect to be offered by gas suppliers. As explained earlier, the LNG netback price is a conceptual figure, rather than an actual amount that is observed, and there are other factors that may influence the prices offered by gas suppliers for individual GSAs.
However, the LNG netback price would provide an important starting point for negotiations with gas suppliers and, when combined with other key market information, would enable gas buyers to more effectively assess the reasonableness of gas prices being offered to them by suppliers. Additional information that may assist gas buyers in negotiations includes prices under recently executed GSAs and in domestic short-term trading markets, pipeline tariffs, information on gas production costs, estimates of reserves and resources and supply-demand outlook in the East Coast Gas Market. Some of this information will be published by the ACCC in its interim reports and some of this information will accompany the publication of the LNG netback price series.
While there is a number of gas industry analysts who publish, or provide as part of their service, their own measures of LNG netback prices, these measures are based on somewhat different approaches and assumptions. The details of those approaches and associated assumptions are not always made available to users. The ACCC’s publication will clearly set out the step-by-step calculations used in its published series and provide information about the underlying assumptions. This would provide market participants with additional relevant and consistent information on which to base their negotiations and discussions, as well as the opportunity to perform calculations by substituting their own assumptions about particular inputs.
Over the course of this inquiry, the ACCC will monitor the effectiveness of the publication and refine it as appropriate. In particular, the ACCC will assess the adequacy of the LNG netback price information and supplementary materials provided.
2.6.2. Other factors influencing domestic prices
This section discusses some of the other factors that could play a role in shaping domestic gas prices. Some of these factors are currently being explored by the ACCC, while others have been raised in the course of the LNG netback consultation process and will be considered further.
Gas Inquiry 2017-2020 38
Cost of transportation
As set out earlier, the ACCC will publish an LNG netback price at Wallumbilla. For any gas buyer taking delivery of gas at a location other than Wallumbilla, the cost of transportation will be an important factor influencing the price the buyer is required to pay for gas on a delivered basis at its location and, in some cases, the gas commodity charge.
For example, if the supplier is required to transport gas to the buyer’s location, the delivered price of gas will reflect both the gas commodity charge and the cost of transporting the gas to the buyer’s location. The cost of transportation will therefore directly affect the price payable for gas at the buyer’s location.
For gas buyers in the Southern States, the gas commodity charge levied by suppliers may also be affected by transportation costs. This pricing dynamic was explained in detail in the September 2017 report.34 As noted in this report, while there is a gas supply shortfall in the Southern States, gas from Queensland is likely to be required to meet the needs of some users in the Southern States (the buyer’s alternative). This affects negotiations between gas suppliers and buyers in every region in the Southern States. Gas suppliers can set a gas commodity charge based on the buyer’s alternative (being the price of gas in Queensland plus the cost of transporting the gas from Queensland to the buyer’s location) even if the gas that is being supplied comes from a gas production area located in the Southern States and none of the pipelines from Queensland are utilised in its delivery.
This pricing dynamic could reverse if sufficient new supply is brought on in the Southern States so that gas from Queensland is no longer required. In a competitive market, gas buyers could negotiate the gas commodity charge down to the seller’s alternative (being the price a supplier could receive for its gas in Queensland less the cost the supplier would incur transporting its gas to Queensland).
Gas buyers in the East Coast Gas Market need to understand the pricing dynamics that are applicable to them and how the cost of transportation is likely to influence the prices offered to them.
The ACCC will publish pipeline services tariffs (and any other relevant information) alongside the LNG netback price series to enable gas buyers to determine an indicative cost of transporting gas on the key transmission pipelines in the East Coast Gas Market.
Cost of production
The cost of gas production is an important factor for domestic gas prices, as it sets the floor price in negotiations between gas producers and gas buyers. However, given that the current estimates of production costs are below the estimates of LNG netback prices, the cost of production is currently not the key driver of the domestic gas prices in the market. Nevertheless, estimates of production costs are a key consideration for market participants, as they can become central to GSA negotiations if there is a significant fall in international LNG prices.
The cost of production has generally increased in the East Coast Gas Market over the past few years. A key driver of this increase has been a shift towards a greater reliance on unconventional gas reserves to meet the needs of the domestic market. With conventional gas fields that traditionally served the domestic market in decline, additional gas for the domestic market is increasingly supplied from unconventional gas fields, particularly the coal seam gas fields in Queensland.
34 ACCC, Gas inquiry 2017–2020 – Interim report, September 2017, pp. 20–22 and 69–70.
Gas Inquiry 2017-2020 39
Unconventional gas reserves typically occur in reservoirs with very low permeability compared to conventional reservoirs. In these geological formations, horizontal drilling and hydraulic fracturing are often necessary for economic gas extraction. These unconventional gas fields also require ongoing capital expenditure to pay for the large number of wells that are required to be drilled over the life of the fields to maintain production.
Another driver has been the increasing cost of conventional gas production, particularly in the Bass Strait. As was recently reported in the Offshore South East Australia Future Gas Supply Study, the major known gas fields of south east Australia have been developed and are significantly depleted.35 Future production will continue to shift from the higher volume, shallow depth, higher-quality gas fields to lower volume, deeper, lower-quality gas fields. This is likely to lead to higher costs of production if, for example, the new gas fields contain higher impurity gas that requires additional levels of processing.
However, there will also be downward pressure on production costs, particularly for the development of unconventional gas reserves. Over time, gas producers should be able to take advantage of new technologies and optimise unconventional gas production while cutting drilling costs. For example, Santos has been able to achieve significant cost savings in operating production from GLNG’s gas fields. Projects are now being completed and approved at about half the cost estimates they were two years ago, with well costs down nearly three quarters and drilling times halved.36
As noted in the December 2017 report, the ACCC has engaged Core Energy as part of this inquiry to assist it to develop more detailed and up-to-date estimates of the cost of gas production across the East Coast Gas Market. The ACCC expects to report on these estimates in a future interim report. The ACCC will also consider making these cost estimates available on its website as part of the LNG netback publication and updating them on an annual basis.
Non-price terms and conditions in GSAs
A number of suppliers submitted that the particular characteristics of a user’s gas requirements can influence the price that a supplier may be willing to offer to that user. In particular, the suppliers emphasised that the non-price terms and conditions in GSAs, such as take-or-pay levels, daily swing allowances, transportation requirements, GSA quantity and duration can affect the costs and risks associated with supplying a particular user. The suppliers commented that this would be reflected in the price offered by them to that user.
However, some suppliers acknowledged that the costs and risks associated with an individual GSA can be smoothed out and reduced across a portfolio of GSAs. This means that the costs and risks taken on by a supplier when entering into a marginal domestic GSA may not be as high when considered in the context of the supplier’s entire portfolio, compared to those costs and risks being considered in isolation.
Some LNG producers submitted that non-price GSA terms and conditions typically sought by domestic gas buyers create additional costs and risks for the LNG producers, relative to selling gas on international LNG spot markets, due to the uncertain nature of CSG production. Compared to production from conventional gas reserves, production from CSG wells declines faster and there is greater uncertainty in production rates over time. The LNG projects produce gas in excess of what is required to meet their contractual commitments, at least in part, as a risk-management measure to maintain throughput at the LNG plant. The
35 Offshore South East Australia Future Gas Supply Study (Commonwealth), November 2017, p. 6. 36 The Australian, Well, well, well: how Santos GLNG slashed costs, drilling times, 24 March 2018
http://online.isentialink.com/theaustralian.com.au/2018/03/23/dbc2ac65-5fa8-4ef5-b2f9-e7068cdf2b67.html.

Gas Inquiry 2017-2020 40
LNG projects then have the flexibility to sell the excess gas on the LNG spot markets at relatively short notice when the supply of this gas becomes certain.
The LNG producers submitted that, in contrast, domestic gas buyers require certainty of supply and often seek flexibility in their daily gas requirements. Given uncertainty of CSG production, this creates a volume risk for the LNG producers. The longer the GSA and the further away the commencement of gas supply from the date of the execution of the GSA, the higher the risk that the LNG producer will not have sufficient gas to meet all of their contractual commitments. Those LNG producers submitted that, when negotiating with domestic gas buyers to supply gas that they would otherwise sell on the LNG spot markets, LNG producers need to consider risk mitigation measures, including additional risk premium in the price, shorter durations of supply and pass through of upstream uncertainty to the buyer.
However, the ACCC notes that the LNG producers use a range of supply mitigation options to manage production risks, including storage, master GSAs with other LNG projects and domestic short-term trading markets.
The ACCC considers that domestic gas buyers would benefit from having greater transparency of the relationship between GSA prices and non-price terms and conditions. The ACCC will be exploring these issues further during the inquiry and will report on any findings in future interim reports.
Retailer costs and margins
As shown in section 1.4, prices charged by retailers under GSAs are generally higher than those charged by producers. There are factors that are specific to gas supply by retailers that may influence retailers’ price offers to domestic users. This includes costs incurred by retailers associated with transportation as well as managing variations in demand over the term of supply. It also includes margins included by retailers in gas prices.
For costs associated with managing demand variations (gas shaping), this can vary depending on the flexibility of the GSA, with a higher load factor potentially resulting in higher costs. For example, under a GSA with a high load factor, the user may require a significant quantity above the average daily quantity on a particular day. This may result in a shortfall in the retailer’s portfolio on that day, which would need to be filled using gas either purchased from a domestic short-term market or drawn from storage. The expected cost to the retailer of addressing these daily variations over the life of the GSA will determine the additional costs that will be passed on to the user.
Similarly, a higher load factor may result in higher transportation costs since the retailer will need to ensure that there is pipeline capacity available to satisfy additional demand beyond the average daily quantity.
However, as mentioned earlier, some suppliers have acknowledged that demand management and transportation costs can be smoothed out and reduced, to an extent, across a portfolio of GSAs. The additional costs incurred by a retailer when entering into the marginal domestic GSA may not be as high as if that GSA was considered in isolation.
As noted in the December 2017 report, the ACCC is currently exploring the issues of retailer costs and margins and the extent to which these affect the prices charged by retailers. The ACCC is engaging with retailers and using its information gathering powers to collect information that will enable analysis and further reporting. The ACCC will report on its findings through interim reports as the inquiry progresses.

Gas Inquiry 2017-2020 41
Domestic short-term trading markets
The short-term trading markets in Sydney, Adelaide and Brisbane, as well as the Victorian Wholesale Domestic Gas Market and Wallumbilla Gas Supply Hub (hereafter collectively referred to as the domestic short-term markets) can also influence prices under domestic GSAs and could do this in a number of ways.
Firstly, prices in GSAs might be explicitly linked to prices in one or more of the domestic short-term markets. Over the course of this inquiry, the ACCC has observed this type of linkage in a limited number of GSAs, however some users have indicated a willingness to enter into such arrangements.
Secondly, there may be circumstances where retailers may sell gas to users before they purchase that gas from producers. This would confer a price risk onto the retailer (both upside and downside). Depending on the availability of gas in the market, the retailer may need to rely on domestic short-term markets to secure sufficient gas to meet their contractual commitments to the gas user. In these circumstances, the retailer may factor in this risk into the GSA price it offers to the gas user.
Thirdly, for some gas users, sourcing gas from domestic short-term markets is an alternative to entering into GSAs. While the bulk of gas buyers in the East Coast Gas Market continue to rely on long-term GSAs to meet their gas requirements, a number of industrial gas users the ACCC has spoken to are now using, or investigating the use of, domestic short-term markets to either supplement GSAs or to source their entire gas requirements.37 If these markets were to become liquid such that a greater number of gas users could rely on them for their ongoing gas needs, the prices in the domestic short-term markets would have a greater influence on the prices agreed under GSAs.
The ACCC will be monitoring the development of domestic short-term markets over the course of this inquiry and will make information available to the market as appropriate.
The ACCC notes that there are several publicly available sources of information on domestic short-term markets, including real-time prices and documentation published by AEMO and periodic reporting and analysis by the AER.
Electricity prices
As discussed in the September 2017 report, the role of gas-powered generators (GPG) in the electricity market has changed significantly. The recent retirement of coal-fired generators has increased reliance on other forms of generation including GPG, particularly during peak demand periods. When electricity demand is high, GPG is often the marginal generator and therefore sets the wholesale electricity price.38
However, at this stage, it is not clear to what extent electricity prices could influence gas prices, particularly prices offered and agreed under long-term GSAs. In submissions, some retailers have emphasised to the ACCC the importance of electricity prices as a factor that can feed back into gas prices. That is, if a GPG expects high demand for electricity and a high price in the National Electricity Market (NEM), this may raise the GPG’s willingness to pay for gas.
Some retailers considered that this would be more likely to affect prices in the short-term domestic gas markets rather than GSAs. However, it is possible that it could affect GSA prices in certain circumstances. As noted in the December 2017 report, under the GBJV’s
37 ACCC, Gas inquiry 2017–2020 – Interim report, September 2017, p. 53. 38 ACCC, Gas inquiry 2017–2020 – Interim report, September 2017, p. 56.
Gas Inquiry 2017-2020 42
2017 gas auction, all successful bidders were retailers and/or GPGs. The ACCC noted that this may indicate that if there is expected to be a shortage of gas in the East Coast Gas Market, and therefore different types of buyers are required to compete for gas supply, industrial gas users may be crowded out by other gas users, particularly GPGs.39 In circumstances where GPGs are increasingly likely to be influencing prices in the NEM, they are more likely to be able to pass on higher gas prices than C&I gas users.
Some retailers, in submissions and in discussions with the ACCC, have referred to the concept of an ‘electricity netback’ price that is based on expected NEM prices and adjusted to account for the avoidable costs of electricity generation should the gas be used for gas supply. If a relationship between electricity and gas prices develops further, a NEM-based price marker such as this may begin to play a role in shaping domestic gas prices.
The ACCC will be analysing and monitoring the relationship between gas and electricity prices during this inquiry (and as part of the Retail Electricity Pricing Inquiry) and will provide any findings in future reports.
2.7. Interpretation of LNG netback prices
Given the potential for the factors discussed above to influence domestic gas prices, LNG netback prices should not be considered as the only price marker that could be used for indication of domestic gas prices. While the ACCC considers that an LNG netback price is currently a key factor influencing domestic prices, it should not be viewed in isolation.
Having regard to the factors discussed above, this section sets out what a published LNG netback price (based on measures of both recent and forward prices) represents and provides guidance on its interpretation.
2.7.1. LNG netback prices based on measures of recent and historic LNG prices
As set out above, the component of the LNG netback publication based on measures of recent prices will be derived using a monthly average of Asian LNG spot prices as measured by a commodity price reporting agency.
The level of reported Asian LNG spot prices at a given point in time is an indicator of the market price of spot LNG cargoes delivered to various Asian ports in the following months. It is therefore a measure of the price that an east coast LNG exporter could achieve if excess gas were sold as a spot cargo in that month.40
When this measure of LNG prices is netted back to Wallumbilla by subtracting the avoidable costs of shipping, liquefaction and transport, it represents the exporter’s opportunity cost of supplying gas to the domestic market at that point in time. As was mentioned earlier, this foregone value is not an actual amount that can be observed; rather, it is a conceptual amount based on a range of expectations and assumptions.
There are benefits to market participants in knowing recent and historical LNG netback prices. The trends in these prices can inform market participants on how Asian LNG spot prices have moved over time; and the seasonality patterns in both price level and volatility, as well as how these are changing over time. This is important information for market
39 ACCC, Gas inquiry 2017–2020 – Interim report, December 2017, p. 45. 40 Prices reported by commodity price reporting agencies should not be interpreted as precise measures of Asian LNG spot
prices. These agencies’ assessment processes involve surveying Asian LNG market participants to ascertain expectations on the price of LNG cargoes that are scheduled to be delivered in the following months.

Gas Inquiry 2017-2020 43
participants to understand, given that Asian LNG spot prices have historically been subject to significant fluctuations for various reasons, including:
seasonality, with typically higher prices over the northern hemisphere winter
short-term volatility, with prices having changed rapidly over short periods
structural changes, with general price levels reflecting the supply and demand dynamics of the international LNG market.
Further, by comparing LNG netback prices based on expectations of future Asian LNG spot prices to LNG netback prices based on measures of recent and historic prices, market participants should be better able to anticipate temporary or structural changes in LNG market supply-demand dynamics. This may put market participants in a better position to take timely action to mitigate any adverse price movements or to take advantage of any favourable price movements.
However, the LNG netback prices based on measures of recent and historic LNG prices are not likely to be the most relevant price marker for negotiations between a supplier and a buyer concerning gas supply that commences at some time in the future. It would be more relevant to calculate the LNG netback prices based on measures of LNG spot prices that are expected to prevail in the market during the supply period (discussed further below). This would better inform the parties in the negotiation of the supplier’s opportunity cost of supplying the gas.
2.7.2. LNG netback prices based on measures of forward LNG prices
As set out above, the component of the LNG netback publication based on expectations of future Asian LNG spot prices will be derived using Platts Japan Korea Marker (JKM) futures prices.
A JKM futures price for a given future month, quoted at a given point in time, represents an indication of the expectations of market participants, at the time of the quote, of the level of the JKM for that future month. It therefore indicates the expectation of market participants of the price of Asian LNG spot cargoes delivered in that future month. When this price is netted back to Wallumbilla by subtracting expected avoidable costs of shipping, liquefaction and transport, it represents an LNG exporter’s expected opportunity cost of supplying gas to the domestic market if the alternative was selling that gas as an LNG spot cargo in that month. As explained previously, this opportunity cost is a conceptual figure rather than an actual amount that can be observed.
The extent to which a forward LNG netback price is relevant as a price marker in negotiations for future domestic gas supply may vary. Parties to a negotiation should satisfy themselves that an LNG netback price based on Asian LNG spot prices is in fact the most appropriate reference point in the circumstances of their gas supply negotiations. If pricing dynamics in the East Coast Gas Market change, it may be that a different pricing marker is more appropriate. There may also be circumstances relating to the specific negotiations that make other factors (discussed earlier) material to the outcome of the negotiation.
The ACCC has observed some gas suppliers recently using forward LNG netback prices to inform negotiations for future domestic gas supply. The ACCC has observed that those suppliers calculated an average of the monthly expected LNG netback prices over the proposed period of supply. The ACCC considers that a monthly average provides a reasonable indication of the supplier’s opportunity cost over the period of proposed supply.
A number of parties have submitted to the ACCC that the LNG producers are likely to seek to sell more gas over the northern winter months, to take advantage of higher expected

Gas Inquiry 2017-2020 44
Asian LNG spot prices. However, the information obtained by the ACCC in the course of the inquiry indicates that LNG spot sales by the Queensland LNG producers have occurred relatively evenly throughout the year, rather than being concentrated in the northern winter months. This could be attributed to the nature of CSG production, which cannot be readily dialled up or down, and the relatively limited storage capacity available to the LNG producers.
It is important to emphasise that the forward LNG netback price is not the ACCC’s forecast of what domestic prices should or will be at any particular point in time. It represents an indication of expectations at a point in time using one specific measure – the JKM futures price. The ACCC considers that this is currently the best available measure for the purpose of providing a price marker, however there are other sources of expectations of future LNG prices, such as those provided by industry experts. Market participants may wish, from time to time, to check JKM futures prices against the forecasts provided by those industry experts.
Market participants seeking to use forward LNG netback prices based on JKM futures in their negotiations should also be aware of its limitations. JKM futures are financial contracts based on the realised level of the Platts JKM for the relevant future month. Therefore, JKM futures are based on prices achieved in financial markets rather than on prices for physical cargoes achieved in commodity markets.
The JKM futures market is also currently relatively illiquid beyond around 6 months, compared to some of the more mature derivatives markets (for example, oil futures). This means that futures quotes for months beyond this are based on a relatively small number of transactions and therefore may be less indicative of market expectations about future prices. However, the ACCC notes that this market has been growing over recent years and this growth is expected to continue.41
Market participants should also be aware that JKM futures prices can change significantly over a short period of time. In mid-2017 the average level of JKM futures for the 2018 calendar year as quoted by the Chicago Mercantile Exchange was around US$6/MMBtu. Over the second half of 2017 this increased significantly, and by the end of 2017 the average JKM futures price over 2018 was around US$7.50/MMBtu. This means that for the purpose of gas supply negotiations, it is important for market participants to refer to forward LNG netback prices based on the latest JKM futures prices.
The ACCC’s publication of forward LNG netback prices is not intended to represent a forecast of domestic gas prices, nor be seen as setting a level of domestic gas prices. The primary purpose of the publication is to improve transparency and to help rebalance relative bargaining positions such that all market participants can be better informed during gas supply negotiations.
2.8. Next steps
The ACCC will commence publishing LNG netback prices and supporting materials on its website in the coming months. LNG netback prices based on measures of recent LNG spot prices will be published monthly, while LNG netback prices based on measures of forward LNG spot prices will be updated fortnightly.
The LNG netback publication will initially focus on netback prices based on Asian LNG spot markets, given the relevance of these prices under current market conditions. However, as mentioned earlier, market participants proposed a number of additional markers that the
41 Platts, ‘CME clears its first JKM LNG swap deal’, 25 August 2017, https://www.platts.com/latest-news/natural-
gas/london/cme-clears-its-first-jkm-lng-swap-deal-27867146.

Gas Inquiry 2017-2020 45
ACCC could publish to assist in domestic price discovery. Over the course of the inquiry, the ACCC will consider publishing additional transparency measures on its website to complement the LNG netback price series.
As noted above, the ACCC is currently exploring some of the factors other than LNG netback prices that influence domestic gas prices. The ACCC’s findings in respect of these factors will be discussed in future interim reports. The ACCC will also consider whether to include this information alongside the LNG netback price publication on its website.
Further, given the possibility of LNG import facilities being introduced on the east coast, import parity prices may also become a relevant pricing marker for domestic gas prices. The ACCC will consider publishing an import parity price based on an appropriate measure of LNG spot or contract prices.
Over the course of the inquiry, the ACCC will monitor the effectiveness of the publication of the LNG netback price series and associated materials, and refine the LNG netback price series as required. At the conclusion of the inquiry, the ACCC will make a recommendation on whether the LNG netback prices series, and any other transparency measures, should continue to be published.
Gas Inquiry 2017-2020 46
3. Transport
3.1. Key points
Under the terms of reference for this inquiry the ACCC has continued to monitor the publicly available pipeline information to assess whether it addresses the information asymmetries identified in the ACCC’s 2015 inquiry into the east coast gas market. For this interim report, we have reviewed the information recently published by operators of non-scheme pipeline operators under Part 23 of the National Gas Rules.
This has revealed that on the key pipelines used to transport gas from Queensland to the Southern States, the standing prices offered by pipeline operators for firm forward haul services are generally higher than the prices that shippers are currently paying for these services or will pay under recently negotiated contracts. This suggests that standing prices are viewed as a price ceiling by pipeline operators and that shippers should be able to negotiate a better deal bilaterally. Together with the limited pricing methodologies published by pipeline operators, we are concerned that the information published may not be achieving the intended objective of reducing the information asymmetries faced by shippers in negotiations.
While additional information is due to be published by operators of non-scheme pipelines later this year that should further reduce the information asymmetries faced by shippers, we have identified some potential improvements that could be made to the published pricing methodologies . These improvements would allow shippers to better understand how standing prices have been calculated and to negotiate more effectively with pipeline operators.
We will continue to review the information published under the new disclosure obligations, including the financial and weighted average pricing information as it is published from October this year. We will provide updates in future reports.
The ACCC has examined new 36-month uncontracted capacity information published by operators of non-scheme pipelines. This confirms that some of the key pipelines used in the transportation of gas from Queensland to the Southern States are contractually congested. However, discussions with pipeline operator, APA Group, indicate that there may be more uncontracted capacity on the South West Queensland Pipeline than publicly available information suggests, which the ACCC continues to examine with APA.
3.2. Recent changes to pipeline regulation
The ACCC’s 2015 Inquiry found that while pipeline operators had been responding dynamically to changes in the market, such as by expanding service options, there was evidence that a large number of pipeline operators were engaging in monopoly pricing. It also found that the lack of publicly available pricing and financial information was hindering the ability of shippers to negotiate effectively with service providers and to readily identify any exercise of market power by pipeline operators.42
The ACCC’s findings prompted the examination into the test for regulation of gas pipelines, which was carried out by Dr Vertigan in 2016. At the completion of this examination, Dr Vertigan recommended the introduction of a new information disclosure and arbitration framework for non-scheme pipelines. This new regulatory framework, which came into operation in August 2017, is set out in Chapter 6A of the National Gas Law (NGL) and Part 23 of the National Gas Rules (NGR) (for ease of reference the new regime is referred to in
42 ACCC, Inquiry into the east coast gas market, April 2016, chapter 6.

Gas Inquiry 2017-2020 47
this chapter as ‘Part 23’). Part 23 applies to ‘non-scheme’ pipelines, which are pipelines that are not subject to full or light regulation under the NGL and NGR.
As a result of the introduction of Part 23 of the NGR, there are now three different types of regulation that may apply to transmission pipelines in Australia. The major transmission pipelines on the east coast are currently subject to the following forms of regulation:
Full regulation – the Roma to Brisbane Pipeline and the Victorian Transmission System
Light regulation – Carpentaria Gas Pipeline and the Marsden to Wilton/Culcairn legs of the Moomba to Sydney Pipeline
Part 23 – South West Queensland Pipeline, Queensland Gas Pipeline, Moomba to Adelaide Pipeline System, the Moomba to Marsden leg of the Moomba to Sydney Pipeline, Eastern Gas Pipeline, SEAGas Pipeline, and Tasmanian Gas Pipeline.
A key element of Part 23 is the requirement for operators of non-scheme pipelines to publish information that shippers can use to assess whether the prices they are offered for transportation services are cost reflective,43 including:
the standing price for all the services offered by the pipeline (including firm forward haul services, as available and interruptible transportation services, park (storage) and loan services, and other ancillary services)
the methodology used to calculate the standing price and sufficient information to enable shippers to understand how the price reflects the application of this methodology
financial information for each non-scheme pipeline and the weighted average prices paid by users for each service.
The obligation to publish standing prices and the pricing methodology commenced in February 2018. The obligations to publish the financial and weighted average price information will commence between October 2018 and January 2019.
The publication of this information represents progress towards increased transparency in a market that has historically been relatively opaque, and a shift towards reporting frameworks which exist overseas such as in the United States.44 It should assist shippers, particularly smaller shippers and new entrants, to assess the reasonableness of a service provider’s offer.
This chapter focuses on the newly published information about non-scheme pipelines.
43 There are three categories of non-scheme pipeline that are exempt from part or all of the information disclosure under rule
585 of the NGR: (1) pipelines that do not offer third party access are exempt from the information disclosure and arbitration provisions; (2) pipelines that only have a single user are exempt from the upfront information disclosure; and (3) pipelines that have an average daily injection for the preceding 24 months of less than 10TJ/day are exempt from the information provision requirements except the requirements to publish details of the pipeline and services offered.
44 ACCC, Inquiry into the east coast gas market, April 2016, chapter 7. 45 Gas Market Reform Group, Gas Pipeline Information Disclosure and Arbitration Framework, Final Design
Recommendation, June 2017, p. 79.
Box 3.1: Pipeline information published in 2018
In early 2018, service providers (also known as pipeline operators) of non-scheme pipelines were required to publish a range of pipeline information as part of the disclosure obligations under Division 2 of Part 23 of the NGR. The purpose of the information disclosure requirements is to reduce the information asymmetry shippers can face in negotiations and, in doing so, facilitate more timely and effective negotiations.45

Gas Inquiry 2017-2020 48
3.3. Transport prices have seen some movement but many service prices appear higher than expected in a well-functioning market
3.3.1. Shippers should be able to negotiate a better deal than standing prices
We have reviewed the standing prices for firm forward haul services published by non-scheme pipeline operators and compared these prices with the minimum and maximum prices payable by shippers for firm forward haul services in January 2018.50
The results of this analysis are set out in Table 3.1. As this table shows, the standing prices for firm forward haul services are generally higher than prices currently paid by shippers. These current prices are based on the prices published in the ACCC’s December 2017 Report, escalated to January 2018. Prior to the publication of the standing prices, not all pipeline operators published standing offers for their pipelines. A number seem to have taken the opportunity to set standing prices at a higher level than the prices in current GTAs.
We acknowledge that it is difficult to make direct comparisons between the prices payable for the standing service and those under GTAs because the underlying terms and conditions
46 Part 23 of the National Gas Rules (NGR), rule 553. 47 Part 23 of the NGR, rule 554. 48 Part 23 of the NGR, rules 555 and 556. 49 Part 23 of the NGR, rule 585. AER, https://www.aer.gov.au/networks-pipelines/non-scheme-pipelines/part-23-access-to-
non-scheme-pipelines-exemptions. 50 This analysis was based on the invoiced price range that appeared in the ACCC’s December 2017 Report, which was
based on prices payable in July 2017, and the prices struck under more recently negotiated gas transportation agreements. To enable the July 2017 invoice prices to be compared with the standing prices published in February 2018 they have, where relevant, been escalated using the CPCI mechanism specified in the shipper’s gas transportation agreement.
Pipeline information that was published in February 2018 included:
pipeline service and access information – including pipeline information, pipeline service information, service availability information and service usage information46
standing terms for each service offered by the pipeline – including prices for each pipeline service offered, the methodology used to determine the standing prices, as well as sufficient information to enable prospective users to understand how the standing price reflects the application of the methodology.47
Part 23 of the NGR also requires pipeline operators to publish financial information and weighted average pricing information, which are to be published annually in the form and manner specified in the Australian Energy Regulator’s (AER) financial reporting guideline.48 This information will be published in either October 2018 or January 2019, depending on the pipeline operator’s financial year.
An exemption from publishing some or all of this information can be obtained from the AER in the following circumstances:49
the pipeline is not providing third party access (category 1 exemption)– in this case no information is reportable
the pipeline is servicing a single user (category 2 exemption) – in this case no information is reportable
the pipeline transported, on average, less than 10 TJ/day over the last 24 months (category 3 exemption) – in this case the pipeline operator is required to publish the pipeline information and pipeline service information and is exempted from publishing, standing terms, service usage information, service availability information and financial information.
Currently, 42 transmission pipelines have been granted an exemption from the reporting obligations under Part 23 of the NGR.
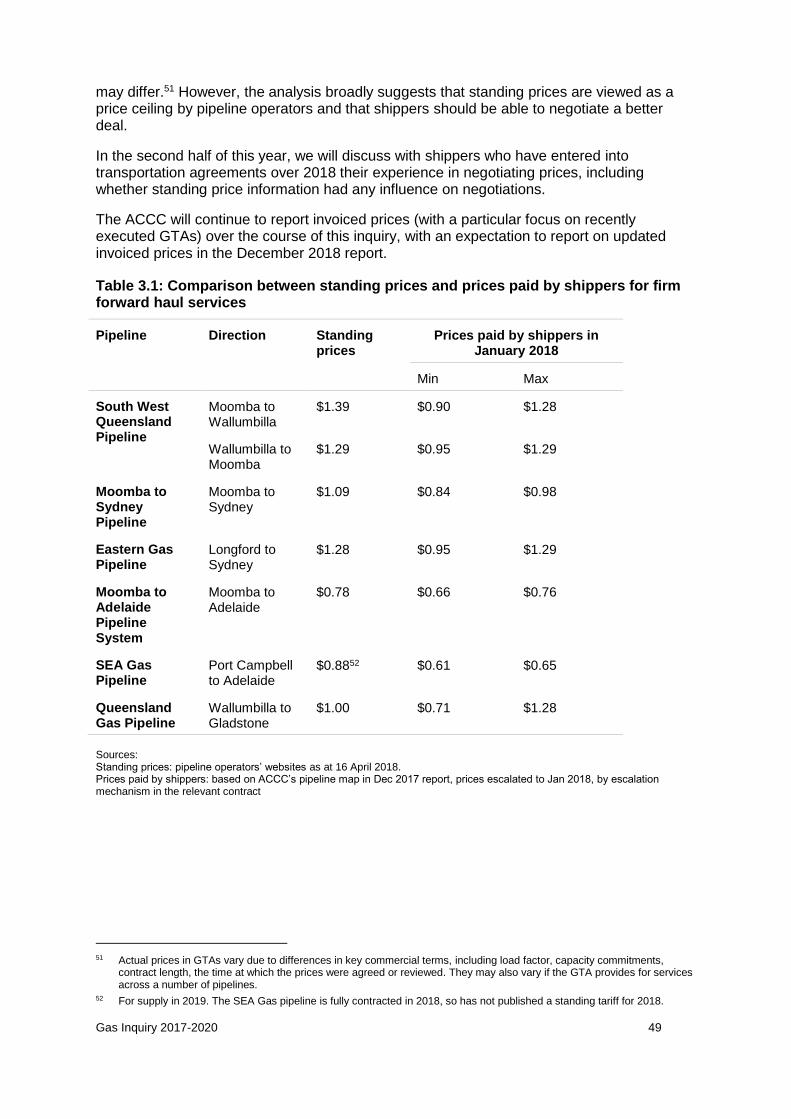
Gas Inquiry 2017-2020 49
may differ.51 However, the analysis broadly suggests that standing prices are viewed as a price ceiling by pipeline operators and that shippers should be able to negotiate a better deal.
In the second half of this year, we will discuss with shippers who have entered into transportation agreements over 2018 their experience in negotiating prices, including whether standing price information had any influence on negotiations.
The ACCC will continue to report invoiced prices (with a particular focus on recently executed GTAs) over the course of this inquiry, with an expectation to report on updated invoiced prices in the December 2018 report.
Table 3.1: Comparison between standing prices and prices paid by shippers for firm forward haul services
Pipeline Direction Standing prices
Prices paid by shippers in January 2018
Min Max
South West Queensland Pipeline
Moomba to Wallumbilla
$1.39 $0.90 $1.28
Wallumbilla to Moomba
$1.29 $0.95 $1.29
Moomba to Sydney Pipeline
Moomba to Sydney
$1.09 $0.84 $0.98
Eastern Gas Pipeline
Longford to Sydney
$1.28 $0.95 $1.29
Moomba to Adelaide Pipeline System
Moomba to Adelaide
$0.78 $0.66 $0.76
SEA Gas Pipeline
Port Campbell to Adelaide
$0.8852 $0.61 $0.65
Queensland Gas Pipeline
Wallumbilla to Gladstone
$1.00 $0.71 $1.28
Sources: Standing prices: pipeline operators’ websites as at 16 April 2018. Prices paid by shippers: based on ACCC’s pipeline map in Dec 2017 report, prices escalated to Jan 2018, by escalation mechanism in the relevant contract
51 Actual prices in GTAs vary due to differences in key commercial terms, including load factor, capacity commitments,
contract length, the time at which the prices were agreed or reviewed. They may also vary if the GTA provides for services across a number of pipelines.
52 For supply in 2019. The SEA Gas pipeline is fully contracted in 2018, so has not published a standing tariff for 2018.

Gas Inquiry 2017-2020 50
3.3.2. Standing prices for shorter term services
In addition to publishing standing prices for firm forward haul services, the operators of non-scheme pipelines published information on the prices available for shorter term services. The standing prices for these services are set out in Table 3.2.
As Table 3.2 shows, Jemena and Epic are charging shippers 1.3 times the firm forward haul price for as available and interruptible services, with the charge payable on the volume of gas actually transported. APA, on the other hand, is charging 1.3–1.6 times the firm forward haul price for capacity reserved under contracts with a term of less than a year. A 1.3 multiplier applies to contracts with a term greater than one day but less than 12 months; a 1.5 multiplier applies to day ahead services; and a 1.6 multiplier applies to within day services. In contrast to the charges levied by Jemena and Epic, which are payable on the volume of gas actually transported, APA is levying its charges on the basis of capacity reserved. Given contracted capacity is typically greater than that actually utilised by a shipper, APA’s prices are likely to be higher for shorter term services than the prices its counterparts are charging.
Table 3.2: Prices charged for shorter term services
APA (Short-term Firm Services) Jemena (As Available Service)
Epic (Interruptible Service)
Less than 12 months
Day ahead Within day
Firm tariff x (1.3)53
Firm tariff x (1.5)54
Firm tariff x (1.6)55
Firm tariff x (1.3)56 Firm tariff x (1.3)57
Payable on reserved capacity Payable on volumes transported
Source: Information publicly available on pipeline operators’ websites as at 16 April 2018. Note: SEAGas has not published a firm forward haul price for 2018, so it is not possible to calculate the relationship between the Firm Tariff and the Interruptible Tariff.
While not shown in Table 3.2, APA is also offering an interruptible transport service at 75 per cent of the price of the firm forward haul service on pipelines that are fully contracted.58 This represents a downward shift from the prices reported in our December 2017 report for interruptible services between Wallumbilla to Moomba (the prices reported at that time were 1.2 to 1.9 times the firm forward haul price). 59 However, it is important to note that this discounted price is only available when a pipeline is fully contracted, in contrast to a previous practice of offering interruptible services on both fully contracted pipelines and those which weren’t fully contracted. The ACCC is therefore wary of viewing this arrangement as a wholly positive pro-competitive market development.
53 APA, Current tariffs and terms – east coast and central region, https://www.apa.com.au/our-services/gas-
transmission/current-tariffs-and-terms/current-tariffs-and-terms--east-coast-and-central-region/. 54 APA, Current tariffs and terms – east coast and central region, https://www.apa.com.au/our-services/gas-
transmission/current-tariffs-and-terms/current-tariffs-and-terms--east-coast-and-central-region/. 55 APA, Current tariffs and terms – east coast and central region, https://www.apa.com.au/our-services/gas-
transmission/current-tariffs-and-terms/current-tariffs-and-terms--east-coast-and-central-region/. 56 Jemena, EGP, Standard service offering. 57 Epic Energy, MAPS GTA Agreement. 58 APA, Current tariffs and terms – east coast and central region, https://www.apa.com.au/our-services/gas-
transmission/current-tariffs-and-terms/current-tariffs-and-terms--east-coast-and-central-region/. 59 ACCC, December 2017 Report, p. 65.
Gas Inquiry 2017-2020 51
3.3.3. Transporting gas from Queensland to New South Wales and Victoria
In the ACCC September and December 2017 reports, we reported there was insufficient gas in the south to meet domestic demand in the south, so gas from Queensland would need to flow south to meet that demand. Access to transportation capacity on reasonable terms (including prices) in facilitating the supply of gas from Queensland to the Southern States remains critically important. We will continue to focus on this particular part of the east coast pipeline network which includes the South West Queensland Pipeline, the Moomba to Sydney Pipeline and the Moomba to Adelaide Pipeline System.
Since the release of the December 2017 report, APA has begun offering a ‘special offer’ to transport gas from Wallumbilla to Melbourne or Sydney for $2G/J for a minimum term of one year and a minimum reserved capacity of 10TJ/day.60 The offer reduces the price of transporting gas from Queensland to the south by around $0.38/GJ compared to if shippers paid for individual pipeline access. This offer appears to favour larger shippers over both smaller shippers and new entrants because of the 10TJ/day requirement and the minimum one year term. This requirement may place smaller shippers and new entrants at a competitive disadvantage to existing larger shippers.
As mentioned in section 3.4.2 below, the South West Queensland Pipeline (transporting gas to Moomba) is only fully contracted during certain periods of the year. During April to September in 2018 and 2019, when there is no firm capacity available, interruptible services on the South West Queensland Pipeline may be available to shippers at a discount to firm forward haul services. Discounted interruptible rates during this period may incentivise shippers looking to move gas to the south to take advantage of any arbitrage pricing opportunities between the short term trading markets, if the capacity is not utilised (see section 1.5 for a discussion of prices in these markets). The availability of these interruptible rates therefore depends on whether pipelines are fully contracted. Most APA services are advertised as less than 100 per cent contracted according to the Gas Bulletin Board.61 Therefore, these discounted interruptible services may only be available on a small number of pipelines, and shippers would need to ask APA on which pipelines the services are offered at any given time.
Table 3.3 below sets out the indicative prices to transport gas from Queensland to the south based on different shipper requirements.
60 APA, Special offers, https://www.apa.com.au/our-services/gas-transmission/current-tariffs-and-terms/special-offers/ 61 INT 929, www.gasbb.com.au, viewed 5 April 2018, exceptions are flows east on the South West Queensland Pipeline and
North on the Moomba to Sydney Pipeline which are listed as having zero uncontracted capacity.
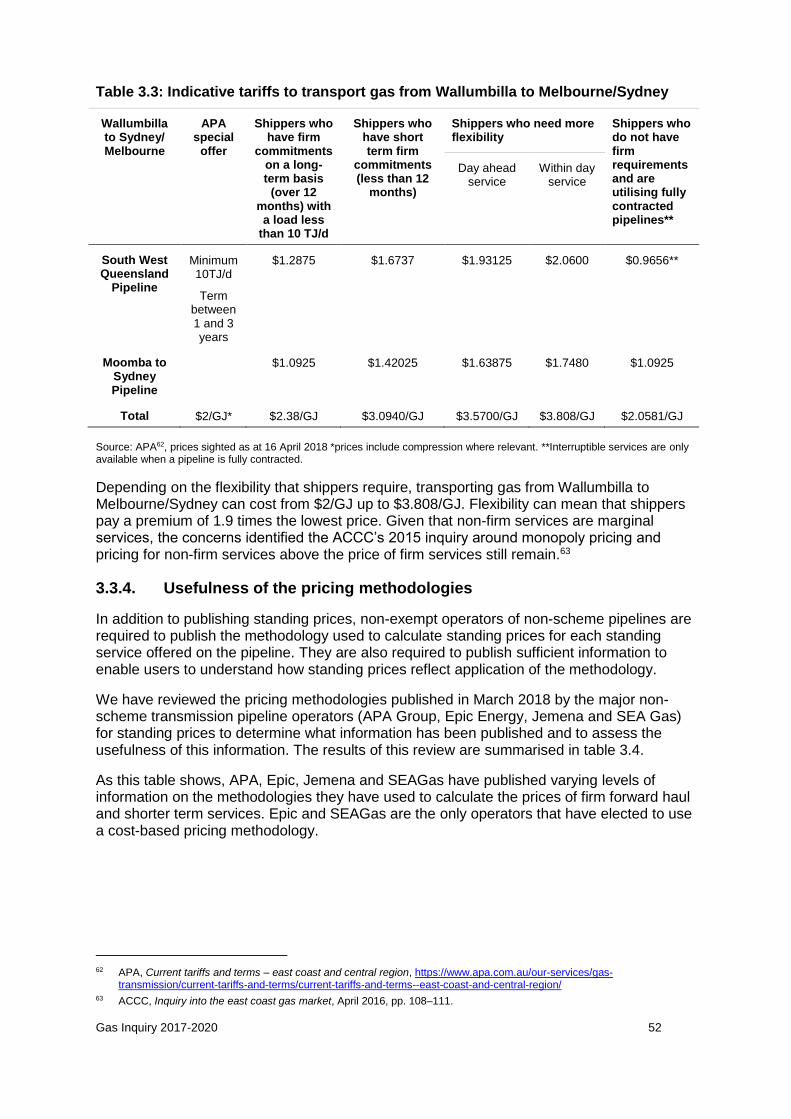
Gas Inquiry 2017-2020 52
Table 3.3: Indicative tariffs to transport gas from Wallumbilla to Melbourne/Sydney
Wallumbilla to Sydney/ Melbourne
APA special
offer
Shippers who have firm
commitments on a long-term basis
(over 12 months) with a load less
than 10 TJ/d
Shippers who have short term firm
commitments (less than 12
months)
Shippers who need more flexibility
Shippers who do not have firm requirements and are utilising fully contracted pipelines**
Day ahead service
Within day service
South West Queensland
Pipeline
Minimum 10TJ/d
Term between 1 and 3 years
$1.2875 $1.6737 $1.93125 $2.0600 $0.9656**
Moomba to Sydney Pipeline
$1.0925 $1.42025 $1.63875 $1.7480 $1.0925
Total $2/GJ* $2.38/GJ $3.0940/GJ $3.5700/GJ $3.808/GJ $2.0581/GJ
Source: APA62, prices sighted as at 16 April 2018 *prices include compression where relevant. **Interruptible services are only available when a pipeline is fully contracted.
Depending on the flexibility that shippers require, transporting gas from Wallumbilla to Melbourne/Sydney can cost from $2/GJ up to $3.808/GJ. Flexibility can mean that shippers pay a premium of 1.9 times the lowest price. Given that non-firm services are marginal services, the concerns identified the ACCC’s 2015 inquiry around monopoly pricing and pricing for non-firm services above the price of firm services still remain.63
3.3.4. Usefulness of the pricing methodologies
In addition to publishing standing prices, non-exempt operators of non-scheme pipelines are required to publish the methodology used to calculate standing prices for each standing service offered on the pipeline. They are also required to publish sufficient information to enable users to understand how standing prices reflect application of the methodology.
We have reviewed the pricing methodologies published in March 2018 by the major non-scheme transmission pipeline operators (APA Group, Epic Energy, Jemena and SEA Gas) for standing prices to determine what information has been published and to assess the usefulness of this information. The results of this review are summarised in table 3.4.
As this table shows, APA, Epic, Jemena and SEAGas have published varying levels of information on the methodologies they have used to calculate the prices of firm forward haul and shorter term services. Epic and SEAGas are the only operators that have elected to use a cost-based pricing methodology.
62 APA, Current tariffs and terms – east coast and central region, https://www.apa.com.au/our-services/gas-
transmission/current-tariffs-and-terms/current-tariffs-and-terms--east-coast-and-central-region/ 63 ACCC, Inquiry into the east coast gas market, April 2016, pp. 108–111.

Gas Inquiry 2017-2020 53
Table 3.4: Published pricing methodologies
Operator Pipeline Pricing Methodology
Firm forward haul services Shorter term services
APA1 Moomba to Sydney Pipeline
"Tariff based on competitive energy supply options into Sydney and Victorian markets"
Short-term firm services= 1.3–1.6 x long-term firm tariff
Interruptible = 0.75 x long-term firm tariff
Details of the premiums or discounts charged are not provided.
South West Queensland Pipeline
"Tariff based on foundation shipper arrangements for major expansion of the SWQP, determined in a competitive bid process”.
Epic2 Moomba to Adelaide Pipeline System
“The standing prices have been calculated using a “building block methodology”. This methodology calculates a “revenue requirement” for each year. As the standing price is offered in respect of a five year term, a revenue requirement for each of the years in the five-year period commencing July 2017 and ending June 2022 has been calculated. This revenue requirement is then divided by the forecast demand, which gives a per GJ/day tariff.”
Interruptible tariff= 1.3 x firm tariff
“Other tariffs have been calculated with reference to a premium or discount to this fixed firm tariff”.
Jemena3 Eastern Gas Pipeline
“The price setting method adopts the reference tariff in place at the time of pipeline commissioning (which was $0.30 for zone 1, $0.65 for zone 2 and $0.86 for zone 3 in relevant base year of 1998) adjusted by 75% of annual CPI using the year to the December quarter index from the ABS series 6401.0 – Consumer Price Index, Weighted average of eight capital cities data. The reference tariff was originally set to encourage pipeline utilisation, as the EGP was initially not fully contracted.”
As available tariff = 1.3 x firm tariff “The premium reflects the flexibility benefits available to shippers under this service (relative to a firm take-or pay service) and risk for Jemena associated with not having certainty of cash flows”.
SEAGas4 SEA Gas Pipeline
“SEA Gas has adopted a cost-reflective approach to its pricing methodology for the westerly Firm Forward Haul Service. In doing so it has considered a range of asset valuations in relation to capital and establishment costs, plus forecast non-capital, operating and maintenance costs. Revenue requirements have been determined using rates of return commensurate with the expected cost of raising equity and debt, cognisant of the need to achieve commercially sustainable outcomes for SEA Gas and prospective users. The above approach yields a range of potential tariff outcomes. The standing offer is within that range and is
"The methodology used to calculate the standing prices for interruptible and as available services is to offer prices consistent with existing contract prices negotiated with a number of shippers for those services, having regard to the nature of those services and their priority ranked against the services provided to foundation shippers."
Gas Inquiry 2017-2020 54
considered to reflect a position that could be reasonably expected in a workably competitive market”
Sources (all at 16 April 2018): 1. APA, Current Terms and tariffs – east coast and central region. https://www.apa.com.au/our-services/gas-transmission/current-tariffs-and-terms/current-tariffs-and-terms--east-coast-and-central-region/. 2. Epic Energy, Moomba to Adelaide Pipeline System, Standing prices information, 30 January 2018, http://www.epicenergy.com.au/media/docs/Standing_Terms_Methodology.pdf. 3. Jemena, EGP Transportation Services and Pricing Methodology, http://jemena.com.au/industry/pipelines/eastern-gas-pipeline. 4. SEAGas, Pricing Methodology. http://seagas.com.au/services/access-to-services/.
In our view, the information that has been published by some pipeline operators does not adequately address the information asymmetry issues identified in the ACCC’s 2015 Inquiry (see section 3.2).64 This is because it fails to provide shippers with sufficient information to understand the underlying reasoning behind how the standing prices have been calculated. We are therefore of the view that improvements should be made to the pricing methodologies that are published to provide shippers with better information about how the standing prices have been calculated.
We note that pipeline operators are required to publish financial information and weighted average pricing information from October 2018 or January 2019 (depending on their financial year). In principle, shippers should be able to use this information, in conjunction with the published pricing methodology to determine whether offered prices are cost reflective. However, unless improvements are made to the pricing methodologies published by pipeline operators, it is possible that the disclosure requirements in Part 23 will fail to achieve their intended objective of reducing information asymmetries and enabling shippers to negotiate more effectively with pipeline operators.
We will continue to monitor the standing offers and pricing methodologies published for pipeline operators subject to Part 23 and consider whether further improvements should be made to the level of detail and information required. If the published information does not address the information asymmetries raised in the ACCC’s 2015 Inquiry and Dr Vertigan’s examination, further regulatory guidance or changes to Part 23 may be necessary.
3.4. There is now more information on available non-scheme pipeline capacity and usage
Under Part 23 of the NGR, non-exempt operators of non-scheme pipelines are required to publish information on the amount of uncontracted capacity available over the next 36-month period.65 This information provides shippers with greater transparency, informing them when spare capacity on the pipeline is expected to become available over a longer time period. We note that the Natural Gas Bulletin Board66 (GBB) currently reports uncontracted capacity over a 12-month period. The ACCC’s view is that the 36-month outlook period is likely to be more useful as shippers typically seek firm capacity for more than 12-months when entering into primary GTAs.67
64 ACCC, Inquiry into the east coast gas market, April 2016, pp. 135–136, 141. 65 Part 23 of NGR, rule 553(5)(a). 66 The Natural Gas Services Bulletin Board (GBB) is a gas market and system information website covering all major gas
production fields, major demand centres, and national gas transmission pipeline systems of SA, VIC, TAS, NSW, the ACT, and QLD. AEMO operates the GBB in accordance with its obligations under the NGL and NGR. https://www.aemo.com.au/Gas/Natural-Gas-Services-Bulletin-Board.
67 We noted this in our submission to the AEMC’s review of economic regulation for covered pipelines, recommending that all pipelines should be required to publish a 36-month capacity outlook. See ACCC submission on Review into the scope of economic regulation applied to covered pipelines Draft Report, March 2018, p. 13.
Gas Inquiry 2017-2020 55
3.4.1. Capacity information on the key pipelines to the Southern States shows that these pipelines remain contractually congested in 2018 and 2019
As mentioned earlier, gas from Queensland would likely be required to flow south in 2018 to meet domestic demand. We therefore examined the capacity of the key pipelines used to transport gas from Queensland to the Southern States (i.e. the South West Queensland Pipeline, Moomba to Adelaide Pipeline System and Moomba to Sydney Pipeline) to determine whether there were any constraints that may affect the transport of gas south.
Our assessment showed that at the end of 2017, the South West Queensland Pipeline and Moomba to Adelaide Pipeline System were close to fully contracted in 2018 and that contractual constraints were limiting some market participants, (that is, those without South West Queensland Pipeline west contracted capacity) from sourcing additional northern gas to meet their southern user demand, particularly in winter.68
Chart 3.1 provides an update on the outlook for uncontracted capacity on the key pipelines used to transport gas from Queensland to the Southern States between May 2018 and December 2020. The chart shows:
The South West Queensland Pipeline has very limited uncontracted capacity between Wallumbilla and Moomba in 2018 (0 to 2 per cent),69 2019 (0 to 9 per cent), and most of 2020.
The Moomba to Adelaide Pipeline System has very limited uncontracted capacity between Moomba and Adelaide in 2018, and while more capacity is expected to become available in 2019 and 2020, most of this capacity is reportedly accounted for under commercial negotiations.70
The Moomba to Sydney Pipeline has uncontracted capacity between Moomba and Sydney and Moomba and Culcairn (allowing for supply into Victoria) in 2018, 2019 and 2020.
68 ACCC, December 2017 Report, p. 11. 69 % = Available capacity in TJ/d divided by the pipeline’s nameplate capacity (for the relevant flow direction) x 100. 70 Epic Energy, Epic Energy, Moomba to Adelaide Pipeline System: Outlook of Available for Sale Firm Capacity, 27 March
2018, http://www.epicenergy.com.au/media/docs/Firm_Capacity_Outlook.pdf.

Gas Inquiry 2017-2020 56
Chart 3.1: Uncontracted capacity on the key pipelines 2018 to 2020
Source: APA71 and Epic Energy.72.
While the South West Queensland Pipeline and Moomba to Adelaide Pipeline System are contractually congested at present, we are not aware of any plans to expand the pipeline capacity of these key pipelines. As we noted in the December 2017 report, any capacity expansion is unlikely to have an immediate impact on constraints because of the time to complete the expansion.73
3.4.2. The availability of capacity on the South West Queensland Pipeline is not presently captured comprehensively on the Gas Bulletin Board (or through Part 23 reporting)
From discussions with APA Group, we have been advised that there may be more capacity available on the South West Queensland Pipeline to transport gas to Moomba than what is reported publicly as available firm capacity between Wallumbilla and Moomba. APA advised that depending on the specific delivery points at which primary capacity holders have allocated their contracted entitlements and the time of the year, then spare capacity may be available to others subject to their specific requirements and provided that they have access to high pressure receipt points or compression capacity at Wallumbilla. We continue to work with APA to understand what spare capacity is available and what can be done to enable access and market entry.
71 APA, 36-month uncontracted capacity outlook, https://www.apa.com.au/globalassets/documents/info/uncontracted-and-
capacity-reports/ec103---tar-36months-uncontracted-capacity-outlook.xls (last updated 22 April 2018). 72 Epic Energy, Capacity outlook. http://www.epicenergy.com.au/media/docs/Firm_Capacity_Outlook.pdf (last updated 27
March 2018). 73 ACCC, Gas inquiry 2017-2020 Interim report, December 2017, p. 63.
0%
10%
20%
30%
40%
50%
60%
70%
Ma
y-2
01
8
Jun
e-2
01
8
July
-20
18
Au
gu
st-
20
18
Se
pte
mb
er-
201
8
Octo
be
r-20
18
No
ve
mbe
r-2
01
8
De
ce
mbe
r-2
01
8
Jan
uary
-20
19
Fe
bru
ary
-201
9
Ma
rch-2
019
Ap
ril-
201
9
Ma
y-2
01
9
Jun
e-2
01
9
July
-20
19
Au
gu
st-
20
19
Se
pte
mb
er-
201
9
Octo
be
r-20
19
No
ve
mbe
r-2
01
9
De
ce
mbe
r-2
01
9
Jan
uary
-20
20
Fe
bru
ary
-202
0
Ma
rch-2
020
Ap
ril-
202
0
Ma
y-2
02
0
Jun
e-2
02
0
July
-20
20
Au
gu
st-
20
20
Se
pte
mb
er-
202
0
Octo
be
r-20
20
No
ve
mbe
r-2
02
0
De
ce
mbe
r-2
02
0
Moomba to Adelaide Pipeline System Moomba to Sydney Pipeline South West Queensland Pipeline

Gas Inquiry 2017-2020 57
This may explain why APA was able to enter into a new agreement for transportation services from Queensland to Southern States, as was announced by it in February 2018.74 APA considered that this would facilitate the flow of more gas into the east coast domestic market.
APA has also recently begun to report on the uncontracted capacity of its compression facilities at Moomba and Wallumbilla.75 The ACCC considers this is a positive development in making upfront information available to shippers on the key assets required to transport gas on the South West Queensland Pipeline to the Southern States. We will continue to monitor the availability of capacity on key pipelines in this inquiry and investigate more deeply to identify the scope for more capacity to be utilised to facilitate market entry and promote efficient investment and market outcomes. We will also be monitoring secondary capacity trading, particularly in the lead up to the implementation of day ahead trading and secondary capacity trading market reforms.
74 APA, New Gas Transportation Agreement for east coast domestic market, 28 February 2018,
https://www.apa.com.au/globalassets/asx-releases/2018/2018-02-28-new-gta-east-coast-domestic-market.pdf. 75 APA, South West Queensland pipeline, service availability information, 36-month uncontracted capacity outlook,
https://www.apa.com.au/our-services/gas-transmission/east-coast-grid/south-west-queensland-pipeline/.