australian community sector survey 2014 - acoss · the australian community sector survey ... the...
TRANSCRIPT
Australian Community Sector Survey
2014
The Australian Community Sector Survey 2014 was published in 2014 by the Australian Council of Social ServiceLocked Bag 4777, Strawberry Hills, NSW 2012 AUSTRALIA | Email: [email protected] | Website: www.acoss.org.auISSN: 1326 7124 ISBN: 978 0 85871 082 5© Australian Council of Social ServiceFront cover image: © wordle.net
This publication is copyright. Apart from fair dealing for the purpose of private study, research, criticism, or review, as permitted under the Copyright Act, no part may be reproduced by any process without written permission. Enquiries should be addressed to the Publications Officer, Australian Council of Social Service. Copies are available from the address above.
Like our work? Support ACOSS todayACOSS and our community of supporters share a vision for a fair, just, diverse and sustainable Australia. Your support is critical to enable ACOSS to continue being a loud and influential advocate for change.
Support us today in one of the following ways:
Join the ACOSS Membership Organisations can become a member and join our network of community sector organisations advocating for a fairer Australia. Members play a vital role in shaping ACOSS policy and advocacy and amplifying the voice of community in public debate. Members are entitled to a suite of membership services including sector-specific media and policy updates, access to advocacy, training and networking opportunities and more. Find out more on our website at www.acoss.org.au
Sign up as an Individual Supporter Be part of the change. Add your voice to our cause as an Individual Supporter of ACOSS and we will keep you in the loop with regular policy and community sector updates and opportunities to take action. Become a supporter today – it’s free – sign up on our website at www.acoss.org.au
Make a donation All donations to ACOSS go straight to our policy development and advocacy work. Donations over $2 are tax deductible. Make a donation on our website at www.acoss.org.au
Share our work with your colleagues, friends, family and networks We know that strength lies in numbers. The more people who understand poverty and disadvantage in Australia, the better. Share this publication with your network and let’s grow the conversation about social services and the Australian community.
Follow us online Follow ACOSS on Twitter and Facebook and tell us your story.
AUSTRALIAN COMMUNITY SETOR SURVEY 2014
Executive Summary 1
Introduction 3
Voices of the sector 6
How are people faring? 8
Capacity and demand for services
and programs 17
Priorities for improving life for people
on low incomes 22
Acknowledgements 31
Appendix 1: Responses 33
Appendix 2: Methodology & rigour 37
Contents
2 Australian Council of Social Service
Figure 1: Perceived change in quality of life for people on high incomes (% of score) 9
Figure 2: Perceived change in quality of life for people on mid-ranging incomes (% of score) 9
Figure 3: Perceived change in quality of life for people on low incomes (% of score) 10
Figure 4: Perceived change in quality of life for young unemployed people (% of score) 10
Figure 5: Perceived change in quality of life for sole parents (% of score) 11
Figure 6: Perceived change in quality of life for older unemployed people (% of score) 11
Figure 7: Perceived change in quality of life by service ability to meet demand (score out of 5) 12
Figure 8: Perceived level of stress for young unemployed people (% of score) 13
Figure 9: Perceived level of stress for sole parents (% of score) 14
Figure10: Perceived level of stress for older unemployed people (% of score) 14
Figure11: Perceived quality of life and level of stress by service targeting (score out of 5) 15
Figure 12: Service ability to meet demand (% of services) 18
Figure13: Service ability to meet demand by service targeting (% of services) 19
Table 1: Service ability to meet demand by service targeting (% of services) 19
Figure 14: Service ability to meet demand by service type (%) 20
Table 2: Service ability to meet demand by service type (%) 20
Figure 15: Service capacity increase required to meet demand (%) 21
Figure 16: Priorities for the community (% of resources) 23
Figure 17: Differences in priorities for the community, young unemployed people, sole parents and older unemployed people (% of resources) 25
Figure 18: Service priorities for people on low incomes (% of resources) 26
Figure 19: Service priorities for people on low incomes for sector staff working mainly with young unemployed people, sole parents and older unemployed people (% of resources) 27
Figure 20: Importance of current policies (score out of 5) 28
Figure 21: Distribution of importance ratings of current policies (%) 29
Figures and tables
1AUSTRALIAN COMMUNITY SECTOR SURVEY 2014
EXECUTIVE SUMMARY
WHAT IS THE ACSS?
The Australian Community Sector Survey (ACSS) was conducted at a time when changes to social policy were expected to significantly impact the lives of people experiencing poverty in Australia. The release of the Federal Budget 2014-15 included a range of proposed changes to social security payments and social welfare and health services and supports. Prior to the Budget, the Government initiated a National Commission of Audit to recommend ways to improve the efficiency and effectiveness of government expenditure in the face of ongoing fiscal challenges; and had instigated a review of the welfare system.
The implementation of some welfare measures as part of the 2014 Budget and before the welfare review had reported its findings created the impression that these reforms were driven by budgetary rather than policy imperatives; and had not adequately noted the concerns of the community sector. ACOSS’ 2014-15 Budget Analysis of savings and revenue measures estimated that 52% of the major savings proposed in the Budget would adversely affect low and middle income earners, compared with only 15% that would impact high income earners. In addition, the Federal Budget
introduced reforms to the manner by which community services were funded by the Commonwealth and reduced the amount of funding available to those services. The cumulative effect of these policy and funding changes was a climate of uncertainty and concern about the integrity and future of essential social and welfare supports and services for people experiencing poverty and inequality in Australia.
Australia’s community sector contributes 5% to Gross Domestic Product (GDP)1 and 8% to employment annually, employing 919,000 staff and facilitating the participation of 2 million volunteers.2 The ACSS is the only annual, national survey of the community sector, by the community sector. For over 15 years, it has functioned as a gauge of how the sector and the people it serves are faring.
This year the ACSS has been redesigned to focus on the perspectives of sector staff about the experience of the people who use their services. Sector staff involved in the day to day delivery of services have a unique and valuable contribution to make to the community’s knowledge and understanding of people’s experience of poverty and what services and policy measures are needed to alleviate it. This survey captures the perspectives of almost 1,000 sector
The Australian Community Sector Survey is the only annual, national survey of the community sector, by the community sector.
2 Australian Council of Social Service
staff to show what life is like for people most at risk of poverty and disadvantage in our communities.
In the wake of recent proposed and enacted changes to a range of social policies in Australia, and in line with ACOSS’ strategic focus on income support and employment policy and housing and homelessness, three groups of service users were chosen as the focus of the survey: young unemployed people, sole parents and older unemployed people. Their particular experiences are drawn out in this report.
ACOSS recognises that these groups are only a few of the many sections of the community that have been and will be affected by proposed social policy changes.
Key FindingsHOW PEOPLE ARE FARING
Our survey finds that the lives of people living on low incomes have become increasingly difficult and stressful over the past year.
• 49%ofsectorstaffreported quality of life to be ‘a lot worse’ for people on low incomes.
• 50%ofsectorstaffreported quality of life to be ‘a lot worse’ for young unemployed people.
• 56%ofsectorstaffreported that life for sole parents is more stressful.
• 54%ofsectorstaffreported that life is more stressful for young unemployed people.
• 52%ofsectorstaffreported that life is more stressful for older unemployed people.
DEMAND FOR SERVICES
Across the community sector, services are struggling to meet demand.
• Overall,80%ofsectorservices reported being unable to fully
meet demand.
• 43%ofsectorservicesreported being unable to meet demand.
• 37%ofsectorservicesreported being able to almost fully meet demand.
• Only20%ofsectorservices reported being fully able to meet demand.
Services that prioritise people on low incomes or with specific needs are least able to meet demand.
• 49%reportedbeingunableto meet demand.
• Only12%reportedbeingfully able to meet demand.
The largest service gaps are in areas of greatest need.
The data on capacity to meet demand suggests the largest service gaps exist in areas of the greatest need: among services working most closely with those on the lowest incomes and with the highest levels of need in their communities.
Community legal and accommodation services reported great difficulty meeting demand.
• 72%oflegalservicesareunable to meet demand.
• 51%ofaccommodationservices are unable to meet demand.
Services not able to meet demand reported aneed to increase capacity substantially to meet demand.
• 33%ofserviceswouldneedto increase capacity by 11-25% to meet demand.
• 30%ofserviceswouldneedto increase capacity by 26-50% to meet demand.
• 25%ofserviceswouldneedto increase capacity by 51-200% or more in order to meet demand.
COMMUNITY PRIORITIES
Sector staff identified investment in affordable housing as the highest priority for benefitting the community as a whole, followed by employment, education and skills development, health and income support.
• Employmentwasthetoppriorityidentified for young unemployed people, followed by education and skills development, affordable housing and income support.
• Affordablehousingwasthetop priority identified for sole parents, followed by income support, education and skill development and employment.
• Affordablehousingwasalsothetop priority identified for older unemployed people, followed by income support, health and social connections and social capital.
Policy priorities identified include:
• Reducingcostoflivingpressures for people on low incomes;
• Maintainingstateandlocalgovernment concessions;
• Increasingincomesupport;and
• Expandingtrainingprogramsfor people experiencing long-term unemployment.
SERVICE PRIORITIES
Sector staff identified increased investment in housing and homelessness services as delivering the greatest benefit to people on low incomes, followed by mental health services and services for vulnerable families and children.
3AUSTRALIAN COMMUNITY SECTOR SURVEY 2014
CONTEXT
The release of the Federal Budget 2014-15 included a range of proposed changes to social security payments and social welfare and health services and supports. Prior to the Budget, the government had initiated a National Commission of Audit (the Commission) to recommend ways to improve the efficiency and effectiveness of government expenditure in the face of ongoing fiscal challenges. Alongside this Commission, the government instigated a review of the welfare system, chaired by PatrickMcClureAO.TheReferenceGroupreleased its Interim Report A New System for Better Employment and Social Outcomes in June 2014. At the time of writing, the final report has not been released.
In theory, both the Commission of Audit and the Welfare Review should have offered constructive opportunities to review the government’s role in, and responsibility for, providing social services and income support. However, key elements of these processes served to undermine community sector trust in the government’s commitment to delivering an evidence-based and fair policy program.
In particular, the announcement of considerable changes to social security policy in the Budget, prior to the release of the final report by the Welfare Review, created a sense that the measures were driven by budgetary rather than policy imperatives; and had not adequately taken account of the concerns conveyed by the community sector.
ACOSS’ 2014-15 Budget Analysis of savings and revenue measures estimated that 52% of the major savings proposed in the Budget would adversely affect low and middle income earners, compared with only 15% that would impact high income earners. Key Budget measures likely to affect low and middle income households included:
• Removing income support for young unemployed people for 6 months each year;
• Restricting access to Newstart to those over 25 years of age;
• Restricting access to family payments for sole parents with children over 5 years of age;
• Freezing family payments;
INTRODUCTION
This survey was conducted at a time when changes to social policy were expected to impact significantly on the lives of people experiencing poverty
4 Australian Council of Social Service
• Lowering the indexation of pensions;
• Deferring eligibility for the Age Pension to 70 years of age;
• Tightening eligibility for the Disability Support Pension; and
• Introducinga$7Medicareco-payment for GP visits.
This policy program provoked significant concern across the Australian community, including within community sector organisations working to support people living in poverty. At the time of the survey, many of the Budget measures remained unlegislated and their future uncertain due to opposition within the Parliament. While it is too early to assess the impact of these policies on people’s lives, the 2014 ACSS aimed to establish a benchmark for future comparison in the event these measures are implemented.
Concern about the impact of the Budget measures on people experiencing disadvantage in Australia has been sharpened by mounting evidence of rising levels of poverty and inequality in Australia. In 2014, a report released by the OECD showed that inequality in Australia had risen over the last 15 years, with the income share of the highest income earners rising and the middle and the lowest falling behind.3 The ACOSS 2014 Poverty Report, based on 2011-12 Australian Bureau of Statistics (ABS) data, estimated that around 2.5 million people or 13.9% of all people in Australia are living below the poverty line (calculated as 50% of median income, taking into account housing costs). This represents an increase of 0.9% since 2010.4
In addition to measures directly affecting people living with low and mid-ranging incomes, the Federal Budget culminated in significant funding cuts for critical social and community services. Services for Aboriginal and Torres Strait Islander people, community legal services,
housing and homelessness services and community advocacy particularly affected.
The Budget withdrew almost half a billion dollars in funding for Aboriginal and Torres Strait Islander programs over 4 years, including through the consolidation of 150 diverse programmes into only five under the government’s new ‘Indigenous Advancement Strategy’. Of particular concern was the $169.2 million reduction in funding for Aboriginal and Torres Strait Islander Health services and the discontinuation of funding for the National Congress of Australia’s First Peoples.
The Budget also confirmed cuts of $15 million in 2014-15 from federally funded legal assistance, including community legal centres, family violence and prevention services, and legal aid. These cuts specifically targeted access to justice and the capacity of legal services to inform evidence-based policy and undertake advocacy activities, for example through removal of funding for the National Aboriginal and Torres Strait Islander Legal Services (NATSILS). Similarly, throughout 2013 and 2014, a number of national sector peak bodies were defunded, including the Alcohol and Drug Council of Australia, the Refugee Council of Australia, the Australian Youth Affairs Coalition, and the National Congress of Australia’s First Peoples. These organisations make a vital contribution to developing the structural reforms necessary to improve social and economic outcomes for all people in Australia.
Finally, the Federal Budget reduced overall investment in affordable housing and homelessness services and failed to provide long-term funding certainty for key programs. Specifically, the Budget reduced funding to the National Rental Affordability Scheme (NRAS), resulting in the loss of 12,000 dwellings; and provided no
commitment for future funding. Similarly, while funding for the National Partnership Agreement on Homelessness (NPAH) was extended for 12 months, there was no guarantee of future funding. Indeed, at the time of writing, the future of the NPAH beyond June 2015 remains unclear, with dire consequences for homelessness and domestic violence services, which have no capacity to plan how best to support people out of homelessness through anything other than a crisis-driven approach.
The Federal Budget created additional challenges for the community services sector through reforms to the way in which Commonwealth grants are administered. The Budget condensed 18 distinct Department of Social Services discretionary grant programs into just 75, delivering $240 million in savings over four years. Further funding cuts to community services were delivered through the ‘Administered Programme Indexation Pause’, which froze indexation on grants payments until 2017, resulting in a real funding reduction amounting to an estimated total of $165 million over 3 years.6 These reforms have contributed to ongoing funding uncertainty within the sector, which remains unresolved at the time of writing; with serious consequences for community services and for the people affected by poverty and disadvantage that access them.
In June 2014, ACOSS, in partnership with the Community Council of Australia, conducted a survey of community services to better understand the impacts of funding uncertainty across the sector. The survey found that 87% of respondents expected to deliver continued activities under a contract or funding agreement that was yet to be finalised. 62% reported that they had not extended staff contracts due to uncertainty about funding; 34% stated that they had
5AUSTRALIAN COMMUNITY SECTOR SURVEY 2014
delayed filling staff vacancies; and 35% had delayed recruiting staff.
Throughout 2014 a number of other reforms to the way that social services are delivered, some of which were commenced under the previous government such as the National Disability Insurance Scheme (NDIS), had a significant impact across the service system. For example, in the implementation of the NDIS, it was expected that ‘core’ services such as health and education would provide access and support to people eligible under the scheme. ACOSS’ network reported that this had not happened consistently, leaving some people unable to access services covered by the scheme. Similarly, changes to the funding and delivery of employment services through Job Services Australia and the Disability Employment Service have continued the trend towards greater contestability in tender processes, increasing the numbers of for-profit service providers and the crowding out of small, specialist service providers from tender processes and service delivery.
The cumulative effect of these policy and funding changes has been a climate of uncertainty and concern about the integrity and future of essential social and welfare supports and services for people experiencing poverty and inequality in Australia. The impacts of these events and policy changes are likely to have influenced responses to the ACSS.
ABOUT THE ACSS
The community sector contributes 5% to Australia’s GDP7 and 8% to employment annually, employing 919,000 staff and facilitating the participation of 2 million volunteers.8 The ACSS is the only annual, national survey of the community sector, by the community sector. For over 15 years, it has functioned as a gauge of how the sector and the people it serves are faring.
This year the ACSS has been redesigned to focus on responses from sector staff about the experience of the people who use their services. The experience of sector staff in delivering a range of critical, on the ground services and supports to people affected by poverty and disadvantage – day in and day out, year in and year out – provides a valuable perspective on the lived experience of poverty in Australia and the policies and services that will have the greatest impact in reducing poverty. It also enables us to capture in greater detail particular accounts of service users’ experiences of living on low incomes. The survey was open for completion from September 24 to October 24, 2014. Over 1,000 sector staff participated, generating 963 useable responses.
In line with ACOSS policy focus on income support and employment policy and housing and homelessness, three groups of service users were chosen as the focus of the survey: young unemployed people, sole parents and older unemployed people. Their particular experiences are drawn out in this report. ACOSS recognises that these groups are only a few of many sections of the community that have been and will be affected by these proposed social policy changes; as well as by poverty in general.
SOME CHANGES THIS YEAR
In line with the new focus on sector perceptions of the people who access its services, the survey design and questions changed significantly. The questionnaire was structured around four core sections: services delivered; demand for services; the people who use services and their experiences; and perspectives on the policies and services that would do most to alleviate the experience of poverty in the community.
The survey methodology also underwent considerable change this year, in order to improve the quality of the data gathered. Notably, a new sector classification system was developed, as well as more robust sampling and data analysismethods.Moredetailon the methodological changes made to the 2014 ACSS, the survey questionnaire and a full catalogue of the survey data is contained in the ACSS 2014 Addendum: Methodology, Questionnaire and Collated Responses report which is available at http://acoss.org.au/take_action/australian_community_sector_survey/
The community sector contributes 5% to Australia’s GDP and 8% to employment annually, employing 919,000 staff and facilitating the participation of 2 million volunteers
6 Australian Council of Social Service
VOICES
The voices in this report are those of community sector staff who hear every day from people experiencing poverty and disadvantage in Australia. They describe the experience of people who access community services and what would make a difference to these people’s lives. Some of the particular groups whose experiences are described include:
• Youngunemployedpeople
• Soleparents
• Olderunemployedpeople.
In this report sector staff are categorised into different groups according to their experience:
• Communitysectorstaff(all963 sector staff whose survey responses were analysed for this report).
• Sectorstaffwithexperienceof:
o Young employed people (553 staff);
o Sole parents (564 staff);
o Older unemployed people (524 staff).
• Sector staff working mainly with:
o Young employed people (176 staff in services where 30% to 100% of service users are young unemployed);
o Sole parents (307 staff in services where the 30% to 100% of service users are sole parents);
o Older unemployed people (160 staff in services where 30% to 100% of service users are older unemployed).
Sector staff with experience of young unemployed people, sole parents or older unemployed people self-identified on the basis of whether or not they had enough experience to answer the questions about these groups. In the analysis of the responses, this process was validated with further analysis based on Australian Bureau of Stations (ABS) Socio-Economic Indexes for Areas (SEIFA) and Postcode data, which found sector staff who indicated they did not have enough experience of these groups to answer questions about them were working in on
average higher socio –economic areas than those who did answer the questions.
Sector staff working mainly with (the three groups of clients) are based on the proportion of clients in the service. There were questions about the percentage of different client groups in each service. These percentages were used to group services into those with higher percentages of clients from one or other groups.
ORGANISATIONS
The people who completed the survey are a sample of sector staff from:
a) MembersofACOSSandeachofthe state and territory Councils of Social Service who were sent personalised invitations to complete the survey (348 completed surveys came from the 1645 members of these COSSes - a 24% response rate);
b) Membersof18participatingpeakbody organisations who were sent personalised invitations
VOICES OF THE SECTOR
7AUSTRALIAN COMMUNITY SECTOR SURVEY 2014
to complete the survey (397 completed surveys came from these peak body organisations - a 32% response rate); and
c) Membersof15peakbodyorganisations that distributed the survey to their members on behalf of ACOSS (218 completed surveys from staff in the members of these peak body organisations; because emails were not personalised it is not possible to calculate a response rate for this group).
The patterns of responses across these three groups are very similar. Along with a range of other analyses to test the rigour of the data and the sampling, this suggests the completed surveys represent the experiences and views of the community sector as represented by the memberships of the Councils of Social Service network and other sector peak organisations.
Greater detail about the sector staff who completed the survey and the services and organisations they work for is included in Appendix 1 and about the methodology and rigour of the data in Appendix 2. The full details of the methodology are included in the ACSS 2014 Addendum: Methodology, Questionnaire and Collated Responses, which can be accessed at http://acoss.org.au/take_action/australian_community_sector_survey/
SERVICES REPRESENTED
In the survey services were classified into 63 different types (e.g. childcare centre, family support service, transitional and crisis accommodation) and grouped into 12 broad categories (e.g. daily living support, health services and education). The full list of service categories is included in Appendix 1. Each of the 63 different service types are represented in the survey.
Some services provide one principle service, for example a childcare centre or a transitional and crisis
accommodation service or a community legal centre. Other services provide multiple service types. Overall, the services included in the survey are seen to be broadly representative of the types of services in the sector.
For some service types there are sufficient numbers of services providing one type of service to be able to make indicative comparisons across different service types. Services types specifically referred to in this report are:
• Counselling & individual support services (109 services);
• Accommodation (73 services);
• Childcare - Childcare centres, preschools, long day care, kinders etc. ( 45 services);
• Community legal centres (82 services);
• Family support services and child protection (81 Services).
Services are also grouped into universal, priority and targeted services in this report:
• Universal-universalservices(395 services);
• Priority-universalservicesgiving priority to people with low incomes or specific needs (298 services); or
• Targeted-servicestargetedto people with low incomes or specific needs (248 services).
Any particular service type can be in each of the three categories, but some service types are more likely to be in one category rather than another. For example most childcare centres are universal with some giving priority services; whereas most community legal centres are either targeted services or give priority to specific groups; and family support services are a mix of universal, priority and targeted. Consequently the overall profile of the service types in each of these three categories contains a wide variety of services but the proportions within each of the types of services are quite different.
The services included in the survey are seen to be broadly representative of the types of services in the sector
8 Australian Council of Social Service
HOW ARE PEOPLE FARING?Key messages
* Sector staff perceive that the quality of life of people on low incomes is declining.
* Young unemployed people are perceived to have experienced the sharpest decline in quality of life.
* Sole parents are perceived to experience the highest stress levels.
* Sector staff working in services with difficulty meeting demand reported greater deterioration in quality of life for people on low incomes and higher levels of stress for the young unemployed people, sole parents and older unemployed people
* Sector staff working in services that prioritise or target people on low incomes or with specific needs perceived higher levels of stress for the three groups, relative to staff in universal services.
* Taken together, these data paint a clear picture that people on low incomes, and young unemployed people and sole parents in particular, continue to fall behind community living standards.
The quality of life of people on low incomes is reported to have declined substantially over the past year compared with people on middle and high incomes
Survey question
Thinking about the last 12 months in the local community where your service/program operates overall, in relation to people's quality of life, are things getting better, worse or about the same for:
• GroupA:The 20% of families/individuals on the highest incomes
• GroupB: The 40% of families/individuals with mid-ranging incomes
• GroupC:The 40% of families/individuals on the lowest incomes
• Youngunemployedpeople (aged 18-29) receiving Youth Allowance (unemployed) or Newstart
• Soleparents(receiving Newstart – i.e. youngest child has turned 6)
• Olderunemployedpeople (aged 55-65 receiving Newstart)
Respondents were asked to rate the relative quality of life for each group on a scale of 1 to 5, where 1 meant a lot worse’, 3 meant ‘about the same’ and 5 meant ‘a lot better’.
Quality of Life
9AUSTRALIAN COMMUNITY SECTOR SURVEY 2014
5A lot better
4321A lot worse
2%
7%
0
10
20
30
40
50
60
13%
53%
25%
Perc
enta
ge
People on high incomes
Figure1:Perceivedchangeinqualityoflifeforpeopleonhighincomes(%ofscore)
Figure2:Perceivedchangeinqualityoflifeforpeopleonmid-rangingincomes(%ofscore)
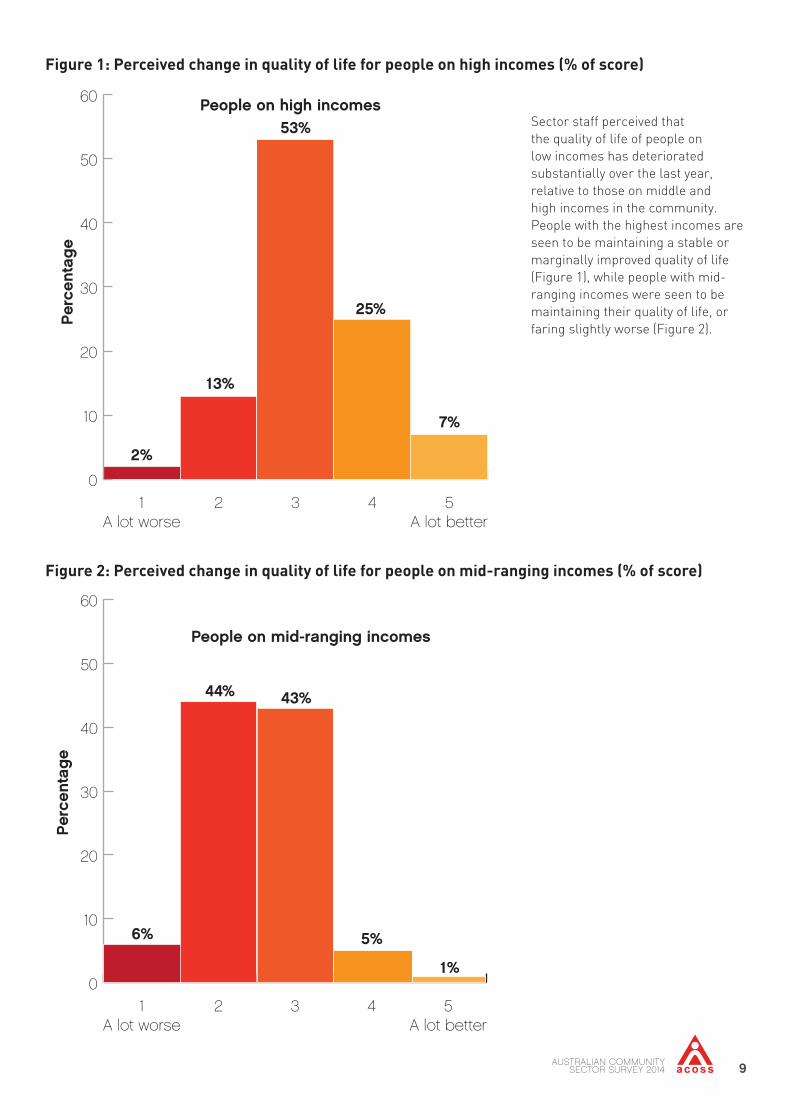
Sector staff perceived that the quality of life of people on low incomes has deteriorated substantially over the last year, relative to those on middle and high incomes in the community. People with the highest incomes are seen to be maintaining a stable or marginally improved quality of life (Figure 1), while people with mid-ranging incomes were seen to be maintaining their quality of life, or faring slightly worse (Figure 2).
0
10
20
30
40
50
60
5A lot better
4321A lot worse
Perc
enta
ge
6%
44% 43%
5%
1%
People on mid-ranging incomes
10 Australian Council of Social Service
Figure3:Perceivedchangeinqualityoflifeforpeopleonlowincomes(%ofscore)
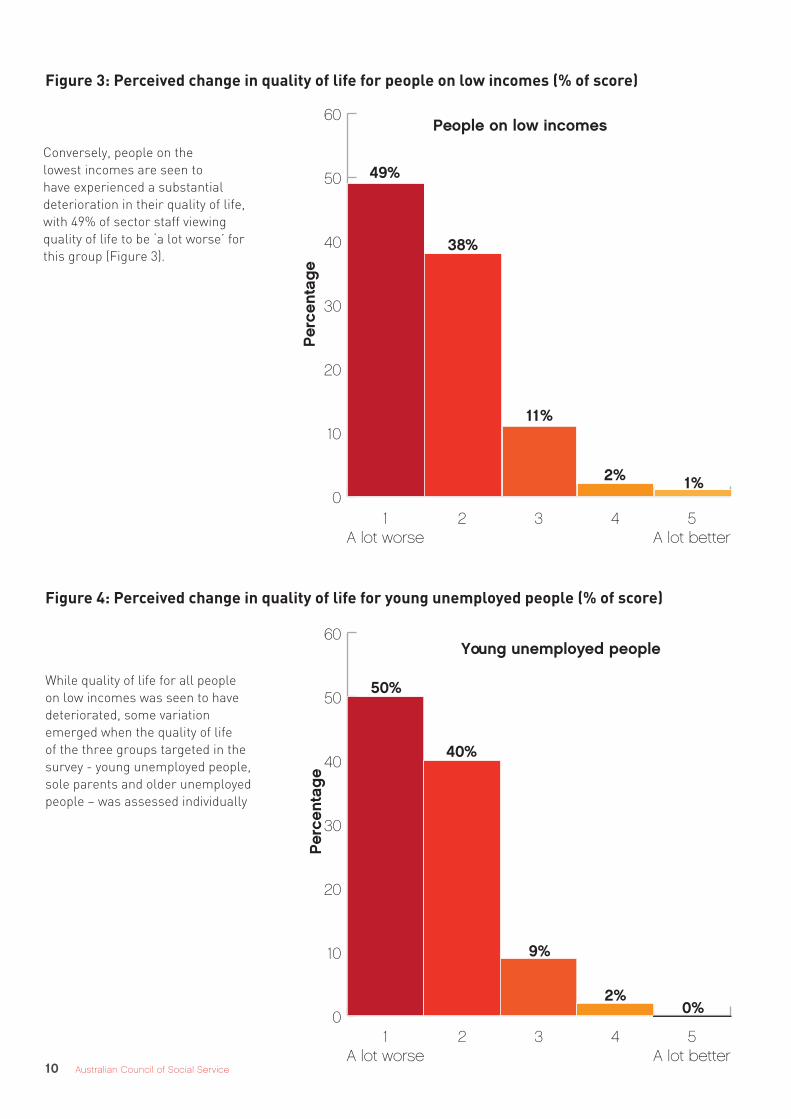
Conversely, people on the lowest incomes are seen to have experienced a substantial deterioration in their quality of life, with 49% of sector staff viewing quality of life to be ‘a lot worse’ for this group (Figure 3).
Figure4:Perceivedchangeinqualityoflifeforyoungunemployedpeople(%ofscore)
While quality of life for all people on low incomes was seen to have deteriorated, some variation emerged when the quality of life of the three groups targeted in the survey - young unemployed people, sole parents and older unemployed people – was assessed individually
0
10
20
30
40
50
60
5A lot better
4321A lot worse
50%
40%
9%
2%0%
Perc
enta
ge
Young unemployed people
0
10
20
30
40
50
60
5A lot better
4321A lot worse
Perc
enta
ge
49%
38%
11%
2% 1%
People on low incomes
11AUSTRALIAN COMMUNITY SECTOR SURVEY 2014
Sector staff reported that young unemployed people have seen their quality of life decline the most.
Figure5:Perceivedchangeinqualityoflifeforsoleparents(%ofscore)
Figure6:Perceivedchangeinqualityoflifeforolderunemployedpeople(%ofscore)
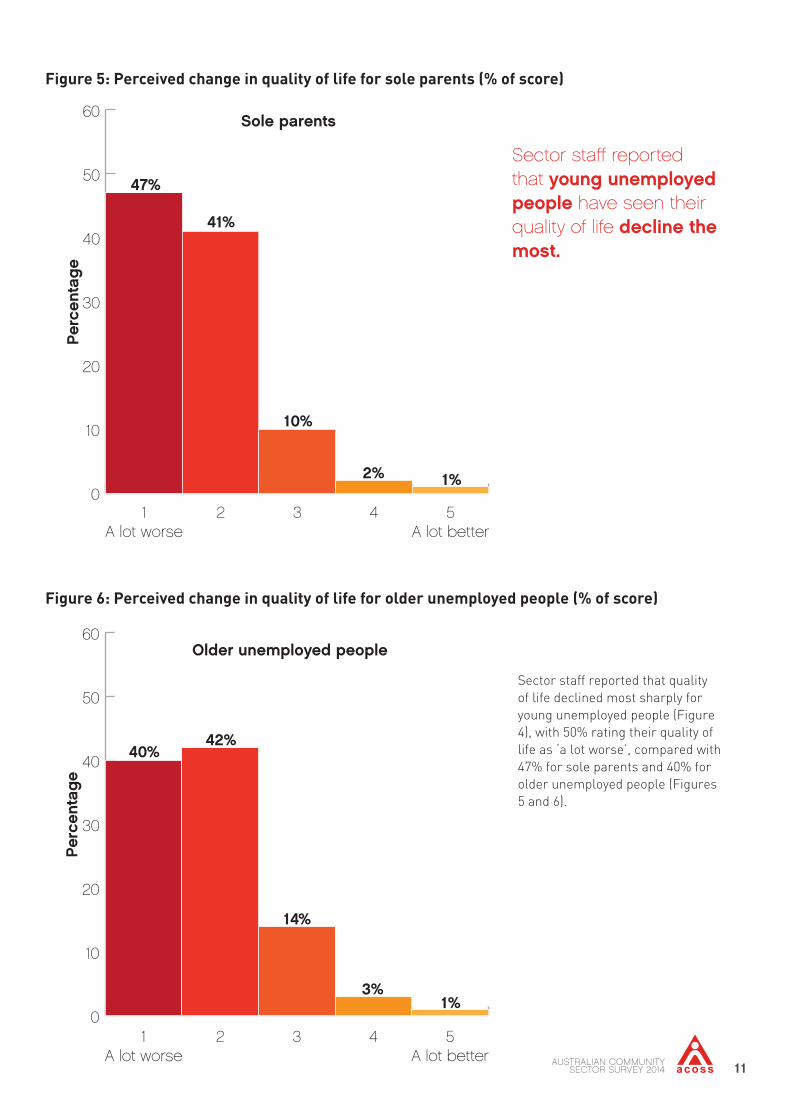
Sector staff reported that quality of life declined most sharply for young unemployed people (Figure 4), with 50% rating their quality of life as ‘a lot worse’, compared with 47% for sole parents and 40% for older unemployed people (Figures 5 and 6).
0
10
20
30
40
50
60
5A lot better
4321A lot worse
47%
41%
10%
2% 1%
Perc
enta
ge
Sole parents
0
10
20
30
40
50
60
5A lot better
4321A lot worse
40%42%
14%
3%1%
Perc
enta
ge
Older unemployed people
12 Australian Council of Social Service
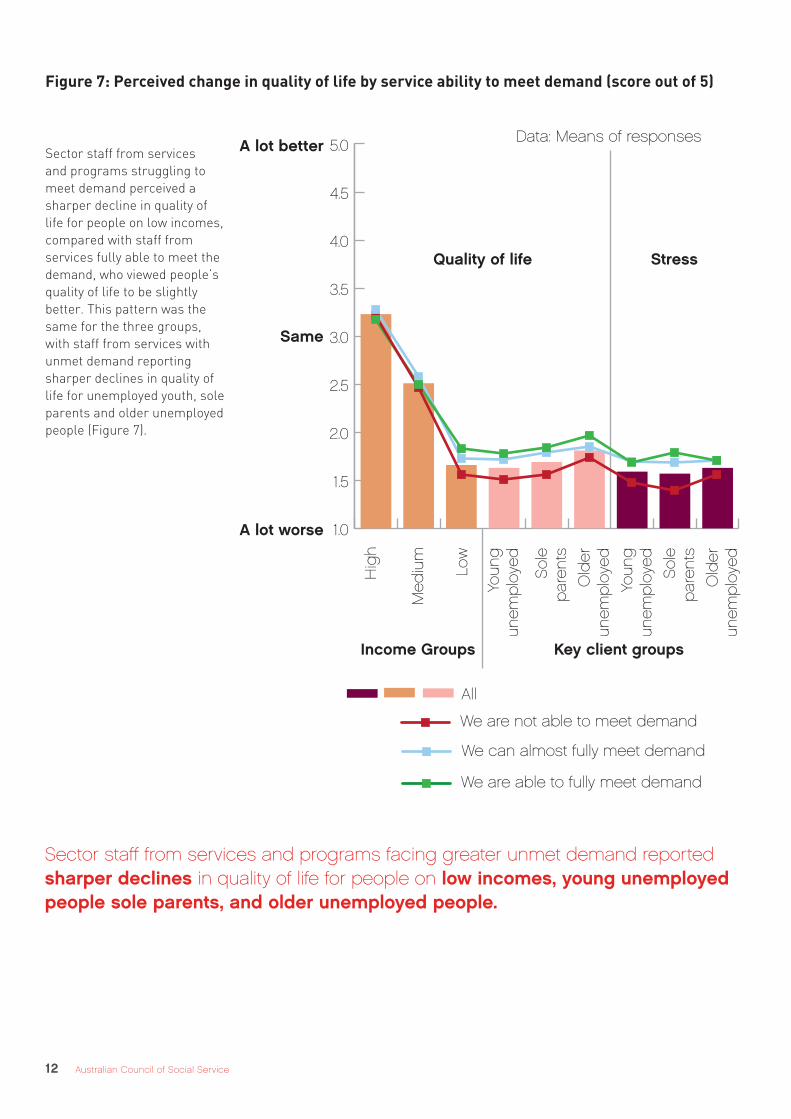
Sector staff from services and programs facing greater unmet demand reported sharper declines in quality of life for people on low incomes, young unemployed people sole parents, and older unemployed people.
Figure7:Perceivedchangeinqualityoflifebyserviceabilitytomeetdemand(scoreoutof5)
All
We are not able to meet demand
We can almost fully meet demand
We are able to fully meet demand
A lot better
Same
A lot worse 1.0
1.5
2.0
2.5
3.0
3.5
4.0
4.5
5.0
Old
erun
emp
loye
d
Sol
ep
aren
ts
Youn
gun
emp
loye
d
Old
erun
emp
loye
d
Sol
ep
aren
ts
Youn
gun
emp
loye
d
Low
Med
ium
Hig
h
Quality of life Stress
Income Groups Key client groups
Data: Means of responsesSector staff from services and programs struggling to meet demand perceived a sharper decline in quality of life for people on low incomes, compared with staff from services fully able to meet the demand, who viewed people’s quality of life to be slightly better. This pattern was the same for the three groups, with staff from services with unmet demand reporting sharper declines in quality of life for unemployed youth, sole parents and older unemployed people (Figure 7).
13AUSTRALIAN COMMUNITY SECTOR SURVEY 2014
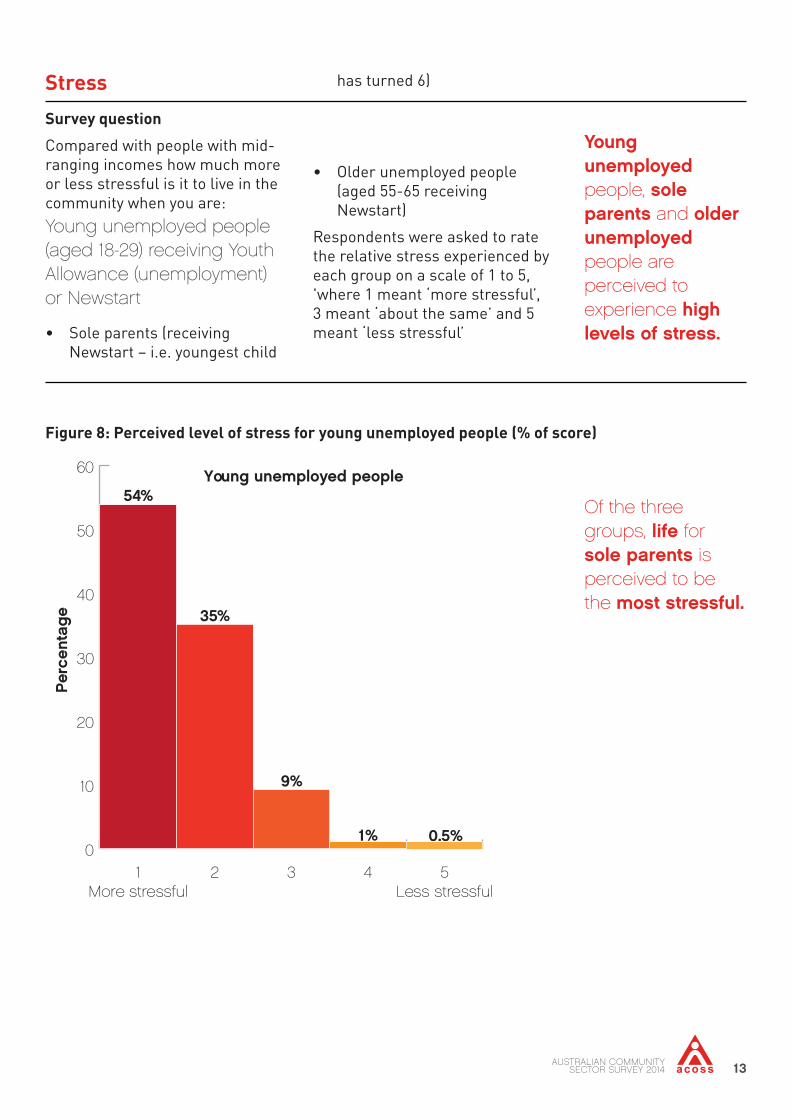
Young unemployed people, sole parents and older unemployed people are perceived to experience high levels of stress.
Stress
Survey question
Compared with people with mid-ranging incomes how much more or less stressful is it to live in the community when you are:Young unemployed people (aged 18-29) receiving Youth Allowance (unemployment) or Newstart
• Sole parents (receiving Newstart – i.e. youngest child
has turned 6)
• Older unemployed people (aged 55-65 receiving Newstart)
Respondents were asked to rate the relative stress experienced by each group on a scale of 1 to 5, 'where 1 meant ‘more stressful’, 3 meant ‘about the same’ and 5 meant ‘less stressful’
Figure8:Perceivedlevelofstressforyoungunemployedpeople(%ofscore)
0
10
20
30
40
50
60
5Less stressful
4321More stressful
54%
Perc
enta
ge 35%
9%
1% 0.5%
Young unemployed people
Of the three groups, life for sole parents is perceived to be the most stressful.
14 Australian Council of Social Service
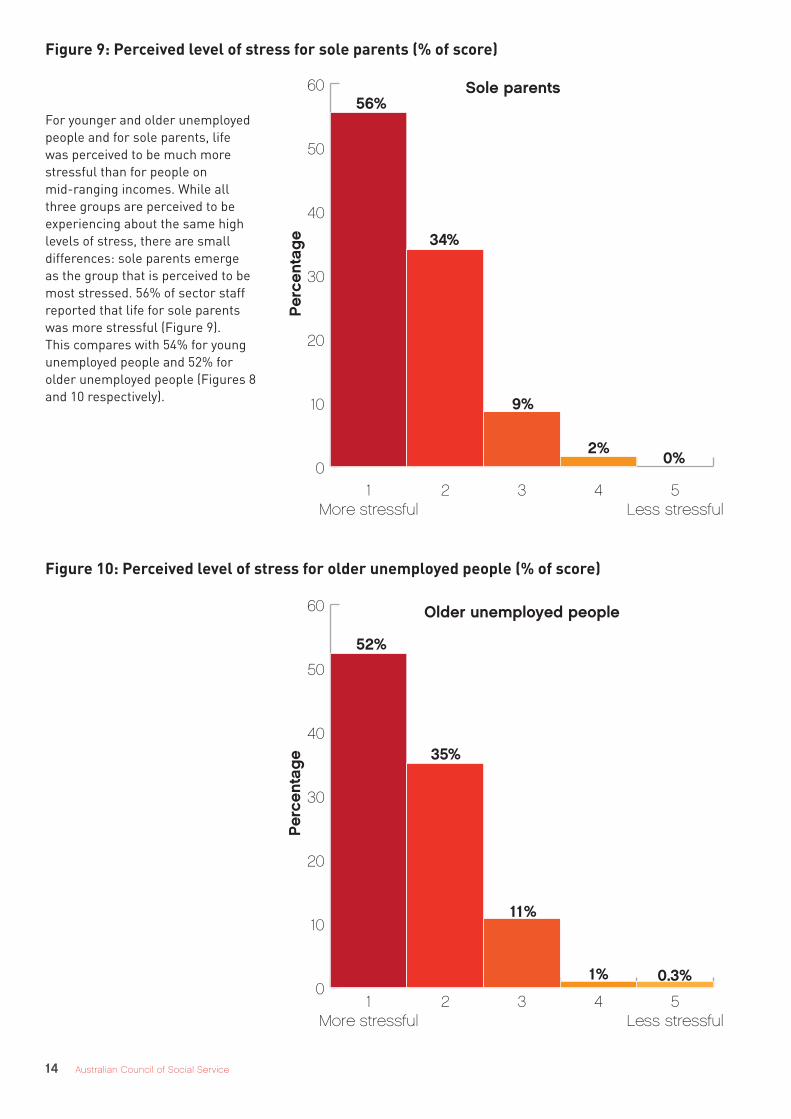
Figure9:Perceivedlevelofstressforsoleparents(%ofscore)
0
10
20
30
40
50
60
5Less stressful
4321More stressful
56%
34%
9%
2%0%
Perc
enta
ge
Sole parents
Figure10:Perceivedlevelofstressforolderunemployedpeople(%ofscore)
0
10
20
30
40
50
60
5Less stressful
4321More stressful
Perc
enta
ge
52%
35%
11%
1% 0.3%
Older unemployed people
For younger and older unemployed people and for sole parents, life was perceived to be much more stressful than for people on mid-ranging incomes. While all three groups are perceived to be experiencing about the same high levels of stress, there are small differences: sole parents emerge as the group that is perceived to be most stressed. 56% of sector staff reported that life for sole parents was more stressful (Figure 9). This compares with 54% for young unemployed people and 52% for older unemployed people (Figures 8 and 10 respectively).
15AUSTRALIAN COMMUNITY SECTOR SURVEY 2014
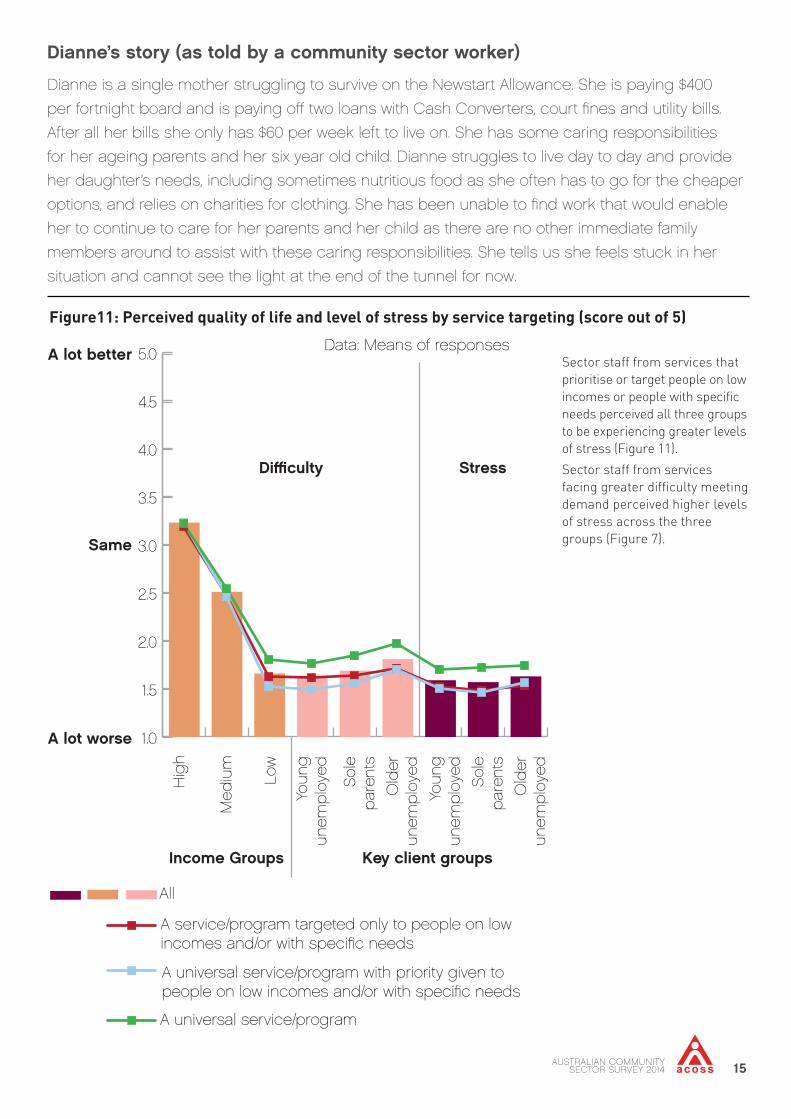
Dianne’s story (as told by a community sector worker)
Dianne is a single mother struggling to survive on the Newstart Allowance. She is paying $400
per fortnight board and is paying off two loans with Cash Converters, court fines and utility bills.
After all her bills she only has $60 per week left to live on. She has some caring responsibilities
for her ageing parents and her six year old child. Dianne struggles to live day to day and provide
her daughter’s needs, including sometimes nutritious food as she often has to go for the cheaper
options, and relies on charities for clothing. She has been unable to find work that would enable
her to continue to care for her parents and her child as there are no other immediate family
members around to assist with these caring responsibilities. She tells us she feels stuck in her
situation and cannot see the light at the end of the tunnel for now.
Figure11:Perceivedqualityoflifeandlevelofstressbyservicetargeting(scoreoutof5)
Sector staff from services that prioritise or target people on low incomes or people with specific needs perceived all three groups to be experiencing greater levels of stress (Figure 11).
Sector staff from services facing greater difficulty meeting demand perceived higher levels of stress across the three groups (Figure 7).
All
A universal service/program
A lot better
Same
A lot worse 1.0
1.5
2.0
2.5
3.0
3.5
4.0
4.5
5.0
Old
erun
emp
loye
d
Sol
ep
aren
ts
Youn
gun
emp
loye
d
Old
erun
emp
loye
d
Sol
ep
aren
ts
Youn
gun
emp
loye
d
Low
Med
ium
Hig
h
Stress
Income Groups Key client groups
Data: Means of responses
16 Australian Council of Social Service
Across the community sector, quality of life is perceived to be declining for people on low incomes, including for young unemployed people, sole parents and older unemployed people. Life is reported to be more stressful for these groups, relative to the broader community. The data reveal some differences between the experiences of the three groups. Quality of life was reported to be declining most sharply for young unemployed people, while sole parents are seen to be the most stressed.
Perceptions of quality of life experienced by people on low incomes and the three groups targeted in the survey varied with the level of demand on services. Across all three groups, people working in services with greater unmet demand reported sharper declines in quality of life and higher levels of stress. When assessing stress, people working in services that target or prioritise people on low incomes or with specific needs perceived the three groups to experience higher levels of stress.
These results clearly indicate that, relative to the broader community, life is seen to be much tougher for people at risk of poverty, including young unemployed people, sole parents and older unemployed people.
Conclusion:Howpeoplearefaring
Paul’s story (as told by a community sector worker)
Paul is 18 and was forced to leave home following a breakdown in relations with his mother’s new
boyfriend. Receiving $414 per fortnight in Youth Allowance doesn’t leave him with much after rent
for the room he’s been able to find in a share house. He turned to us for help when he was left
with little to survive on after raising enough money for his bond and two weeks’ rent. We assisted
him in covering bills and food and the transport costs involved in looking for work. He has since
found casual part time work which is helping, but the lack of entry level jobs and training and
apprenticeship positions makes securing permanent employment difficult. The lack of affordable
housing means he’s not able to move closer to the city where there are more job opportunities.
But he’s determined to succeed and crack that first job and is actively searching for work every
day. In the meantime, with the help of our service he has been able to get by with odds jobs that
come up.
17AUSTRALIAN COMMUNITY SECTOR SURVEY 2014
CAPACITY AND DEMAND FOR SERVICES AND PROGRAMSKey messages
* Services are struggling to meet demand, with 43% unable to meet demand and only 20% fully able to meet demand. A further 37% reported that they almost fully meet demand.
* Services that prioritise or target people with low incomes or specific needs have the greatest difficulty meeting demand. While 27% of universal services can meet or almost fully meet demand, 49% of priority services and 48% of targeted services are not able to.
* Community legal services and housing services are facing great difficulty meeting demand. 72% percent of community legal services and 51% of accommodation services included in the survey are unable to meet demand.
* In order to fully meet demand, sector services that are unable to meet demand require substantial increases in service capacity. 33% of these services estimated needing to increase capacity by between 11-25% and a further 30% estimated that an increase of between 26-50% would be necessary to meet demand.
* These results suggest that the greatest service gaps exist in areas of greatest need - that is, among services working most closely with those on the lowest incomes and the highest levels of need in the community.
The community sector is struggling to provide vital services and programs to people in need.
Survey question
Thinking about demand for your service and your capacity to meet demand this year, what best describes your service/program?
We are able to fully meet demand
We can almost fully meet demand
We are not able to meet demand
DemandforServices
18 Australian Council of Social Service
Figure12:Serviceabilitytomeetdemand(%ofservices)
0
10
20
30
40
50
60
Not able to meet demand
Almost fully meet demand
Fully meet
demand
Perc
enta
ge o
f se
rvic
es
70
20%
37%
43%
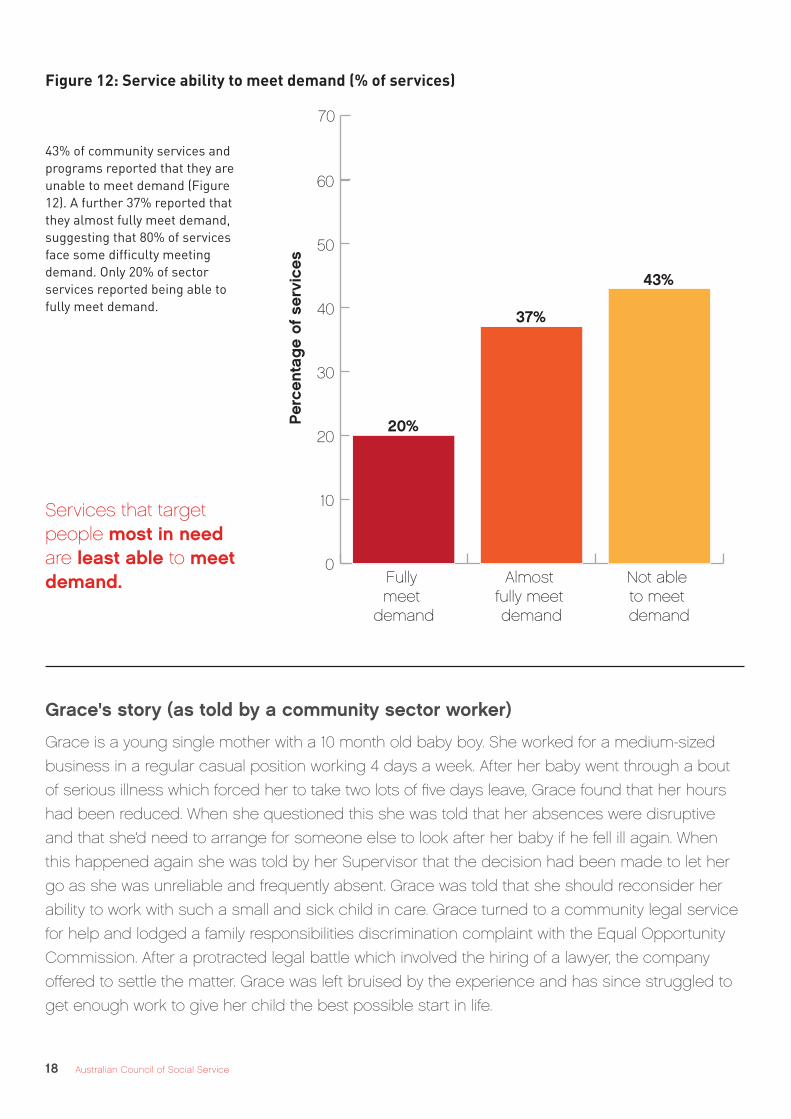
43% of community services and programs reported that they are unable to meet demand (Figure 12). A further 37% reported that they almost fully meet demand, suggesting that 80% of services face some difficulty meeting demand. Only 20% of sector services reported being able to fully meet demand.
Services that target people most in need are least able to meet demand.
Grace's story (as told by a community sector worker)
Grace is a young single mother with a 10 month old baby boy. She worked for a medium-sized
business in a regular casual position working 4 days a week. After her baby went through a bout
of serious illness which forced her to take two lots of five days leave, Grace found that her hours
had been reduced. When she questioned this she was told that her absences were disruptive
and that she’d need to arrange for someone else to look after her baby if he fell ill again. When
this happened again she was told by her Supervisor that the decision had been made to let her
go as she was unreliable and frequently absent. Grace was told that she should reconsider her
ability to work with such a small and sick child in care. Grace turned to a community legal service
for help and lodged a family responsibilities discrimination complaint with the Equal Opportunity
Commission. After a protracted legal battle which involved the hiring of a lawyer, the company
offered to settle the matter. Grace was left bruised by the experience and has since struggled to
get enough work to give her child the best possible start in life.
19AUSTRALIAN COMMUNITY SECTOR SURVEY 2014
Figure13:Serviceabilitytomeetdemandbyservicetargeting(%ofservices)
Table1:Serviceabilitytomeetdemandbyservicetargeting(%ofservices)
Type Weareabletofullymeet demand
Wecanalmostfullymeet demand
Wearenotabletomeet demand
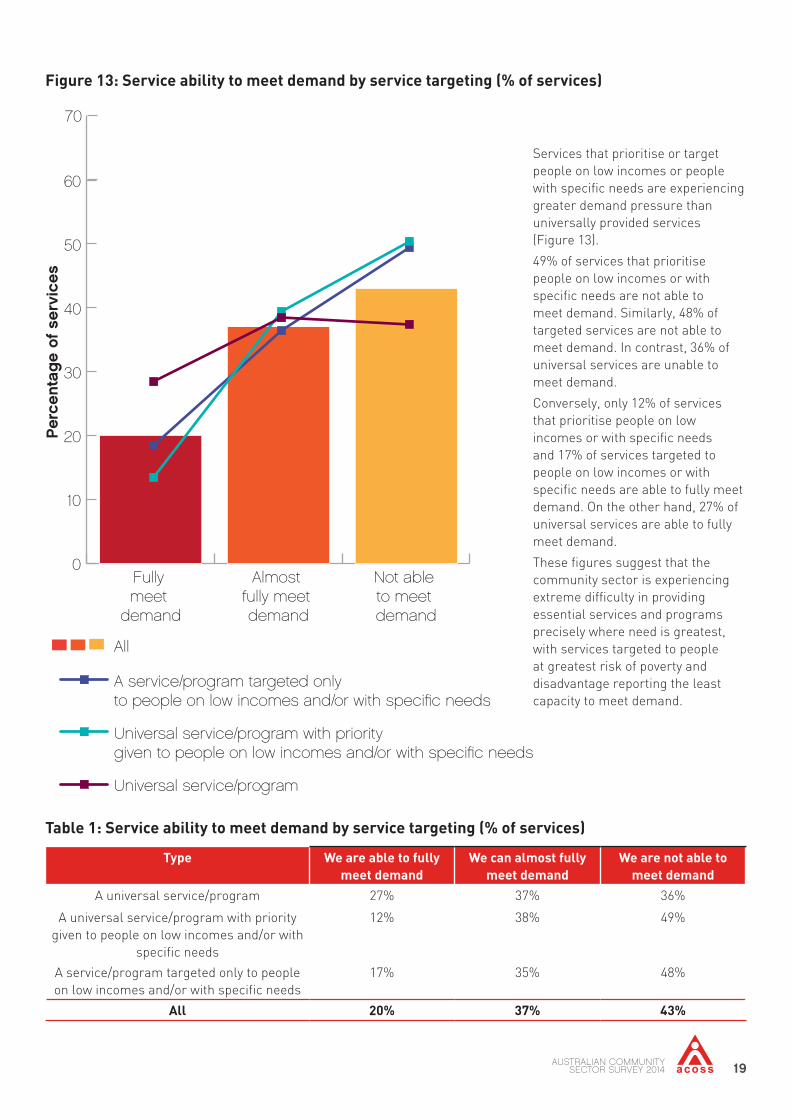
A universal service/program 27% 37% 36%
A universal service/program with priority given to people on low incomes and/or with
specific needs
12% 38% 49%
A service/program targeted only to people on low incomes and/or with specific needs
17% 35% 48%
All 20% 37% 43%
0
10
20
30
40
50
60
Not able to meet demand
Almost fully meet demand
Fully meet
demand
All
Universal service/program
70
Perc
enta
ge o
f se
rvic
es
Services that prioritise or target people on low incomes or people with specific needs are experiencing greater demand pressure than universally provided services (Figure 13).
49% of services that prioritise people on low incomes or with specific needs are not able to meet demand. Similarly, 48% of targeted services are not able to meet demand. In contrast, 36% of universal services are unable to meet demand.
Conversely, only 12% of services that prioritise people on low incomes or with specific needs and 17% of services targeted to people on low incomes or with specific needs are able to fully meet demand. On the other hand, 27% of universal services are able to fully meet demand.
These figures suggest that the community sector is experiencing extreme difficulty in providing essential services and programs precisely where need is greatest, with services targeted to people at greatest risk of poverty and disadvantage reporting the least capacity to meet demand.
20 Australian Council of Social Service
Figure14:Serviceabilitytomeetdemandbyservicetype(%)
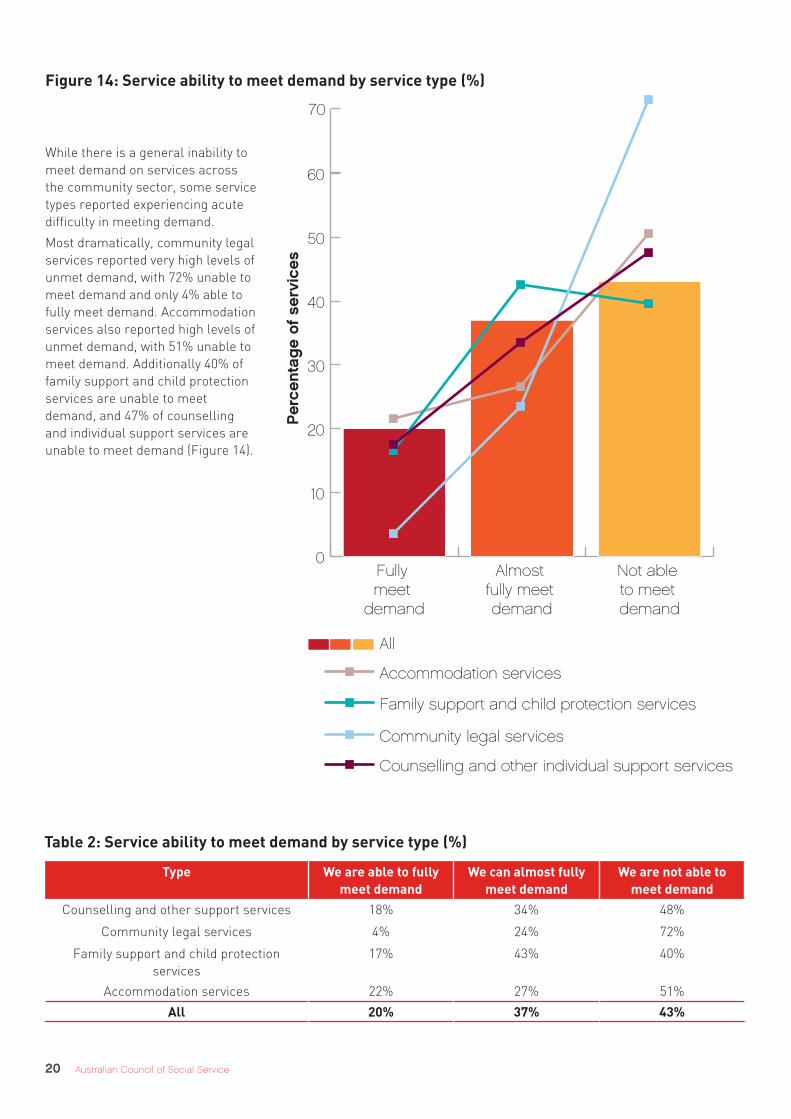
While there is a general inability to meet demand on services across the community sector, some service types reported experiencing acute difficulty in meeting demand.
Mostdramatically,communitylegalservices reported very high levels of unmet demand, with 72% unable to meet demand and only 4% able to fully meet demand. Accommodation services also reported high levels of unmet demand, with 51% unable to meet demand. Additionally 40% of family support and child protection services are unable to meet demand, and 47% of counselling and individual support services are unable to meet demand (Figure 14).
Table2:Serviceabilitytomeetdemandbyservicetype(%)
Type Weareabletofullymeet demand
Wecanalmostfullymeet demand
Wearenotabletomeet demand
Counselling and other support services 18% 34% 48%
Community legal services 4% 24% 72%
Family support and child protection services
17% 43% 40%
Accommodation services 22% 27% 51%
All 20% 37% 43%
Not able to meet demand
Almost fully meet demand
Fully meet
demand
0
10
20
30
40
50
60
70
All
Accommodation services
Family support and child protection services
Community legal services
Counselling and other individual support services
Perc
enta
ge o
f se
rvic
es
21AUSTRALIAN COMMUNITY SECTOR SURVEY 2014
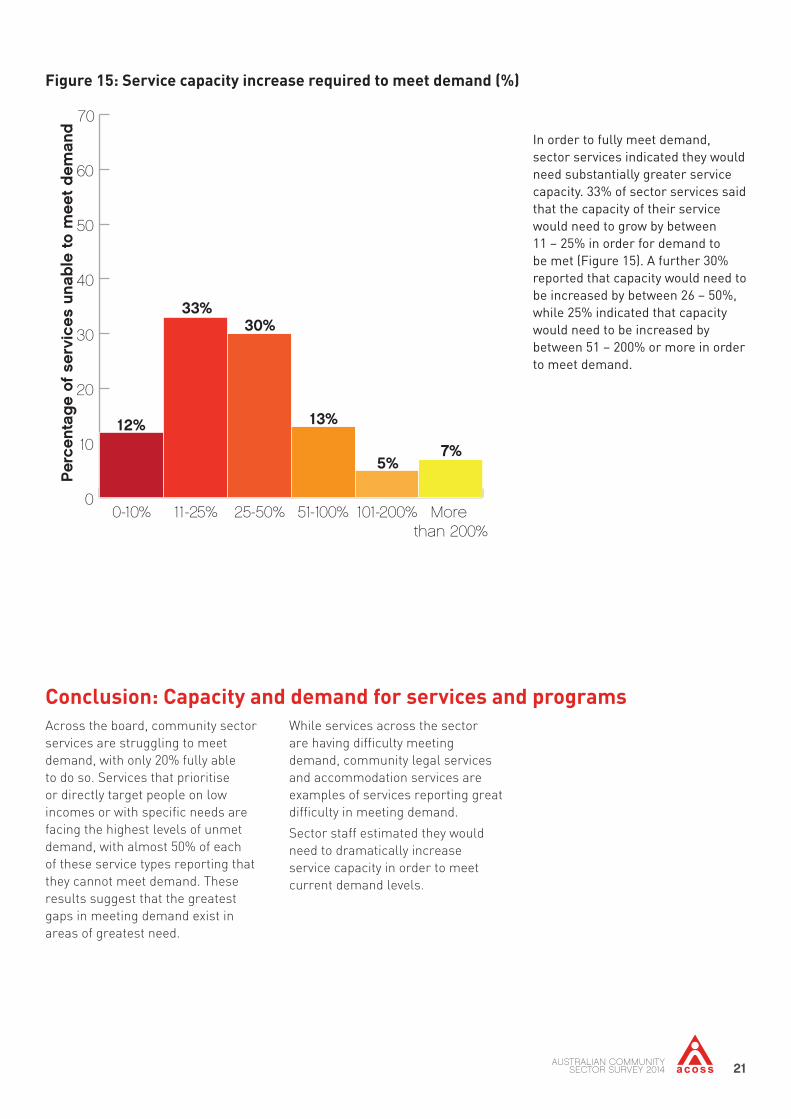
Figure15:Servicecapacityincreaserequiredtomeetdemand(%)
Across the board, community sector services are struggling to meet demand, with only 20% fully able to do so. Services that prioritise or directly target people on low incomes or with specific needs are facing the highest levels of unmet demand, with almost 50% of each of these service types reporting that they cannot meet demand. These results suggest that the greatest gaps in meeting demand exist in areas of greatest need.
While services across the sector are having difficulty meeting demand, community legal services and accommodation services are examples of services reporting great difficulty in meeting demand.
Sector staff estimated they would need to dramatically increase service capacity in order to meet current demand levels.
0
10
20
30
40
50
60
70
More than 200%
101-200%51-100%25-50%11-25%0-10%
12%
33%30%
13%
5%7%
Perc
enta
ge o
f se
rvic
es u
nab
le t
o m
eet
dem
and
In order to fully meet demand, sector services indicated they would need substantially greater service capacity. 33% of sector services said that the capacity of their service would need to grow by between 11 – 25% in order for demand to be met (Figure 15). A further 30% reported that capacity would need to be increased by between 26 – 50%, while 25% indicated that capacity would need to be increased by between 51 – 200% or more in order to meet demand.
Conclusion:Capacityanddemandforservicesandprograms
22 Australian Council of Social Service
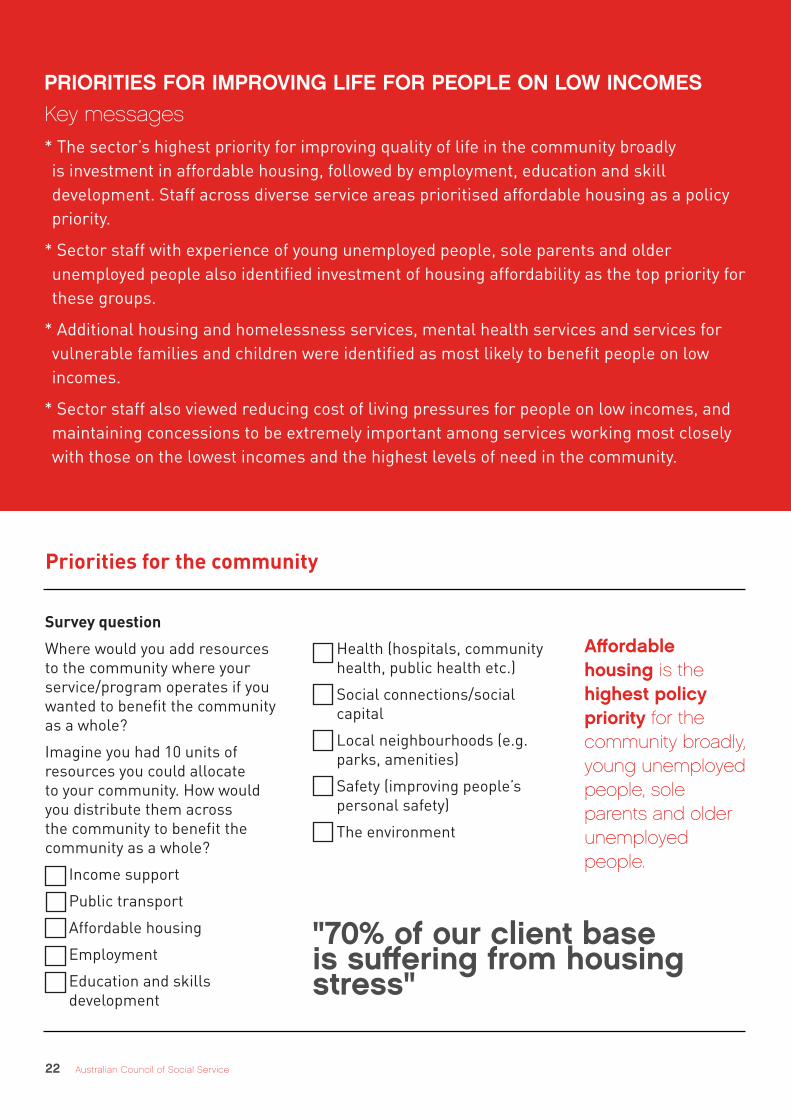
PRIORITIES FOR IMPROVING LIFE FOR PEOPLE ON LOW INCOMESKey messages
* The sector’s highest priority for improving quality of life in the community broadly is investment in affordable housing, followed by employment, education and skill development. Staff across diverse service areas prioritised affordable housing as a policy priority.
* Sector staff with experience of young unemployed people, sole parents and older unemployed people also identified investment of housing affordability as the top priority for these groups.
* Additional housing and homelessness services, mental health services and services for vulnerable families and children were identified as most likely to benefit people on low incomes.
* Sector staff also viewed reducing cost of living pressures for people on low incomes, and maintaining concessions to be extremely important among services working most closely with those on the lowest incomes and the highest levels of need in the community.
Affordable housing is the highest policy priority for the community broadly, young unemployed people, sole parents and older unemployed people.
Survey question
Where would you add resources to the community where your service/program operates if you wanted to benefit the community as a whole?
Imagine you had 10 units of resources you could allocate to your community. How would you distribute them across the community to benefit the community as a whole?
Income support
Public transport
Affordable housing
Employment
Education and skills development
Health (hospitals, community health, public health etc.)
Social connections/social capital
Local neighbourhoods (e.g. parks, amenities)
Safety (improving people’s personal safety)
The environment
Prioritiesforthecommunity
"70% of our client base is suffering from housing stress"
23AUSTRALIAN COMMUNITY SECTOR SURVEY 2014
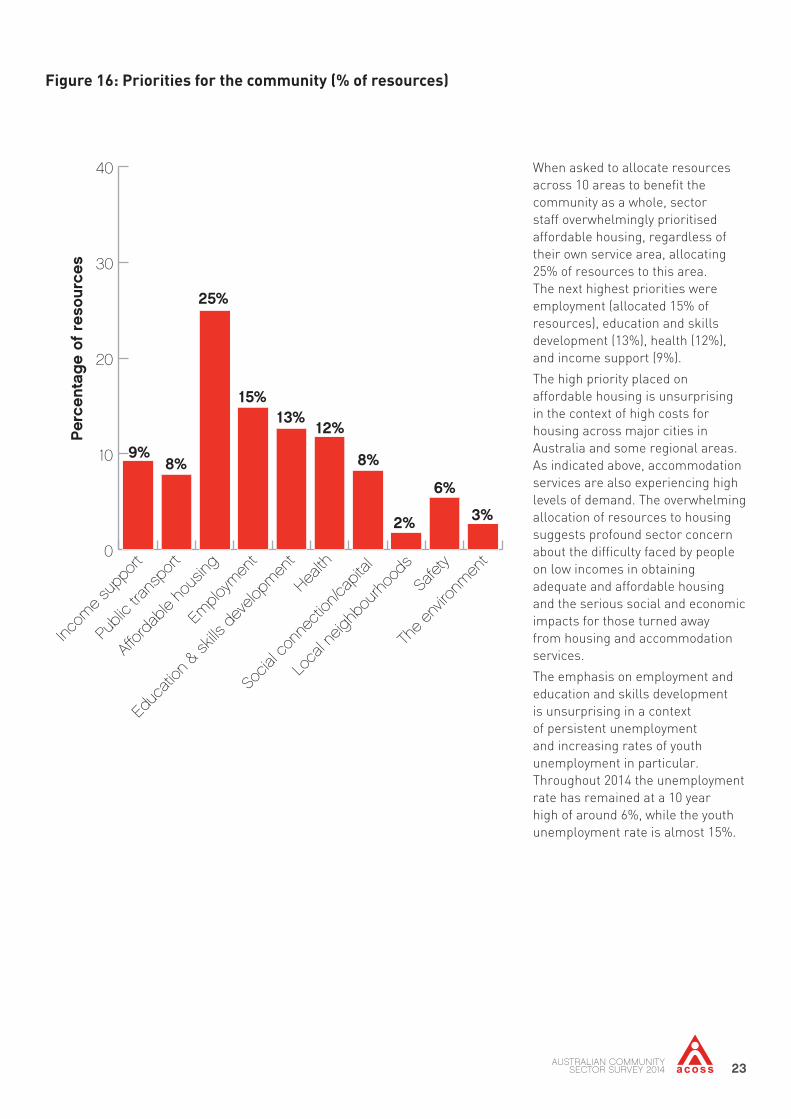
Figure16:Prioritiesforthecommunity(%ofresources)
0
10
20
30
40
The
envir
onm
ent
Safet
y
Loca
l neig
hbou
rhoo
ds
Socia
l con
nect
ion/ca
pital
Health
Educ
ation
& sk
ills d
evelo
pmen
t
Emplo
ymen
t
Publi
c tra
nspo
rt
Incom
e su
ppor
t
Perc
enta
ge o
f re
sour
ces
25%
9%8%
15%13%
12%
8%
2%
6%
3%
When asked to allocate resources across 10 areas to benefit the community as a whole, sector staff overwhelmingly prioritised affordable housing, regardless of their own service area, allocating 25% of resources to this area. The next highest priorities were employment (allocated 15% of resources), education and skills development (13%), health (12%), and income support (9%).
The high priority placed on affordable housing is unsurprising in the context of high costs for housing across major cities in Australia and some regional areas. As indicated above, accommodation services are also experiencing high levels of demand. The overwhelming allocation of resources to housing suggests profound sector concern about the difficulty faced by people on low incomes in obtaining adequate and affordable housing and the serious social and economic impacts for those turned away from housing and accommodation services.
The emphasis on employment and education and skills development is unsurprising in a context of persistent unemployment and increasing rates of youth unemployment in particular. Throughout 2014 the unemployment rate has remained at a 10 year high of around 6%, while the youth unemployment rate is almost 15%.
24 Australian Council of Social Service
Survey question
If you had 10 units of resources to add to the community in which your service/program operates where would you add them if you wanted to benefit:
• Young unemployed people (aged 19-29) receiving Youth Allowance (unemployed) or Newstart?
• Sole parents (receiving Newstart i.e. youngest child has turned 6)?
• Older unemployed people (aged 55-65) receiving Newstart?
Income support
Public transport
Affordable housing
Employment
Education and skills development
Health (hospitals, community health, public health etc.)
Social connections/social capital
Local neighbourhoods (e.g. parks, amenities)
Safety (improving people’s personal safety)
The environment
Priorities for young unemployed people, sole parents and older unemployed people
The experience of older unemployed people (as told by a community sector worker)
Our service supports older unemployed adults aged 55-65 years, the majority of whom are men
who are on volunteer work programs as required by Centrelink. They work on our garden program.
Many have had labouring roles and are unemployed due to age and fitness, some have limited
writing and communication skills. Their past skills are no longer needed in computerised factories
or in business, who are often looking for younger people with online skills. They have started
feeling worthless and have been through a system that is directed to younger people, and often
have limited capacity to retrain. These men make great volunteers and give to the community to
create safe homes and gardens for the disabled and aged. They come to us stressed, with poor
self-esteem and symptoms of depression. Our program gives meaning and purpose to their days
and lives. If we had additional funding we would support more of these men to play a meaningful
and fulfilling role in our community.
25AUSTRALIAN COMMUNITY SECTOR SURVEY 2014
Figure17:Differencesinprioritiesforthecommunity,youngunemployedpeople,soleparentsandolderunemployedpeople(%ofresources)
0
5
10
15
20
25
30
35
The
envir
onm
ent
Safet
y
Loca
l neig
hbou
rhoo
ds
Socia
l con
nect
ions/s
ocial
cap
ital
Health
Educ
ation
& sk
ills d
evt
Emplo
ymen
t
Publi
c tra
nspo
rt
Incom
e su
ppor
t
Perc
enta
ge o
f re
sour
ces
Older unemployed people
Unemployed sole parents
Young unemployed people
All
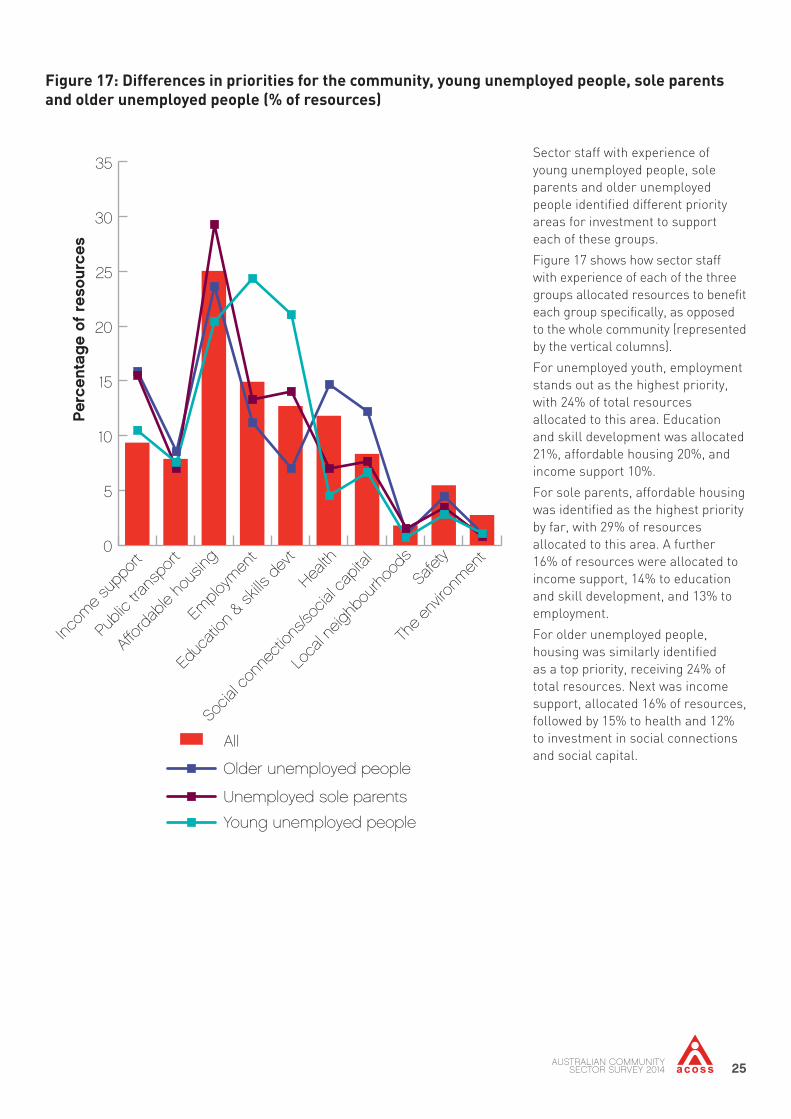
Sector staff with experience of young unemployed people, sole parents and older unemployed people identified different priority areas for investment to support each of these groups.
Figure 17 shows how sector staff with experience of each of the three groups allocated resources to benefit each group specifically, as opposed to the whole community (represented by the vertical columns).
For unemployed youth, employment stands out as the highest priority, with 24% of total resources allocated to this area. Education and skill development was allocated 21%, affordable housing 20%, and income support 10%.
For sole parents, affordable housing was identified as the highest priority by far, with 29% of resources allocated to this area. A further 16% of resources were allocated to income support, 14% to education and skill development, and 13% to employment.
For older unemployed people, housing was similarly identified as a top priority, receiving 24% of total resources. Next was income support, allocated 16% of resources, followed by 15% to health and 12% to investment in social connections and social capital.
26 Australian Council of Social Service
Survey question
What are your priorities for growth in services to benefit people on low incomes?
Imagine you had 10 units of resources to allocate to funding new services. How would you allocate them to the following services?
Income support
Public transport
Affordable housing
Employment
Education and skills development
Health (hospitals, community health, public health etc.)
Social connections/social capital
Local neighbourhoods (e.g. parks, amenities)
Safety (improving people’s personal safety)
The environment
Prioritiesforservicegrowthtobenefitpeopleonlowincomes
Figure18:Serviceprioritiesforpeopleonlowincomes(%ofresources)
0
5
10
15
20
25
30
35
Other
Housin
g/ho
mele
ssne
ss se
rvice
s
Servi
ces f
or vu
lnera
ble fa
milie
s & c
hildr
en
Subs
idise
d de
ntal s
ervic
es
Childc
are s
ervic
es
Emplo
ymen
t ser
vices
Mental
hea
lth se
rvice
s
Prim
ary h
ealth
servi
ces
Lega
l adv
ice &
ass
istan
ce se
rvice
s
7%
10%
18%
10%
7% 7%
17%
19%
5%
Perc
enta
ge
of r
esou
rces
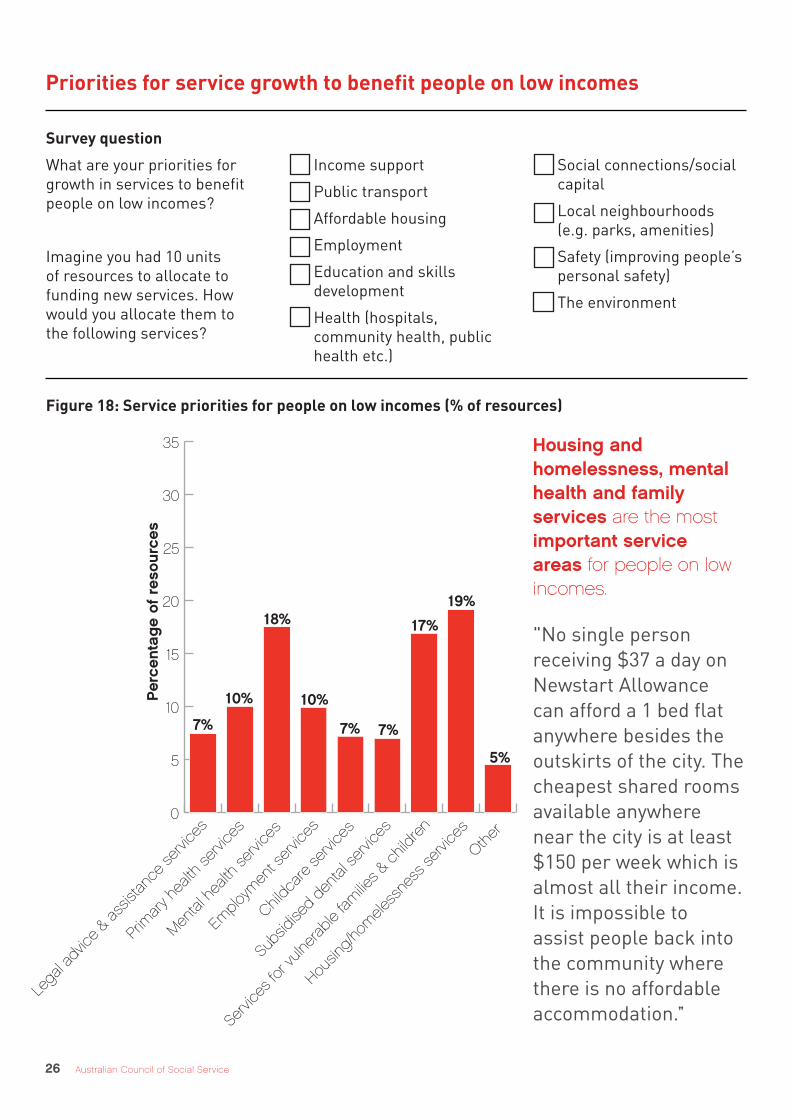
Housing and homelessness, mental health and family services are the most important service areas for people on low incomes.
"No single person receiving $37 a day on Newstart Allowance can afford a 1 bed flat anywhere besides the outskirts of the city. The cheapest shared rooms available anywhere near the city is at least $150 per week which is almost all their income. It is impossible to assist people back into the community where there is no affordable accommodation."
27AUSTRALIAN COMMUNITY SECTOR SURVEY 2014
Figure 18 reveals the sector’s view that an increase in housing and homelessness services, mental health services and services for vulnerable families and children would deliver the greatest benefits to people on low incomes, with housing and homelessness services allocated 19% of resources, mental health services 18% and services for vulnerable families and children
17% of resources. A further 10% of resources were allocated to primary health services and 10% to employment services.
These results largely reflect the sector’s priorities, the service areas with highest levels of unmet demand, and perceived levels of stress experienced by the three groups as discussed above. Once again, housing and homelessness
services emerge as the top priority, highlighting the pressing need for additional services in this area to support people struggling with housing costs.
Within this spread of average responses, there are some differences in priorities for sector staff working mainly with the three groups.
Figure19:Serviceprioritiesforpeopleonlowincomesforsectorstaffworkingmainlywithyoungunemployedpeople,soleparentsandolderunemployedpeople(%ofresources)
0
5
10
15
20
25
30
35
Other
(2)
Other
(1)
Housin
g/ho
mele
ssne
ss se
rvice
s
Servi
ces f
or vu
lnera
ble fa
milie
s & c
hildr
en
Subs
idise
d de
ntal
servi
ces
Childc
are se
rvice
s
Emplo
ymen
t ser
vices
Mental
hea
lth se
rvice
s
Prim
ary h
ealth
servi
ces
Lega
l adv
ice &
ass
istan
ce se
rvice
s
Perc
enta
ge o
f re
sour
ces
Older unemployed people
Sole parents
Young unemployed people
All
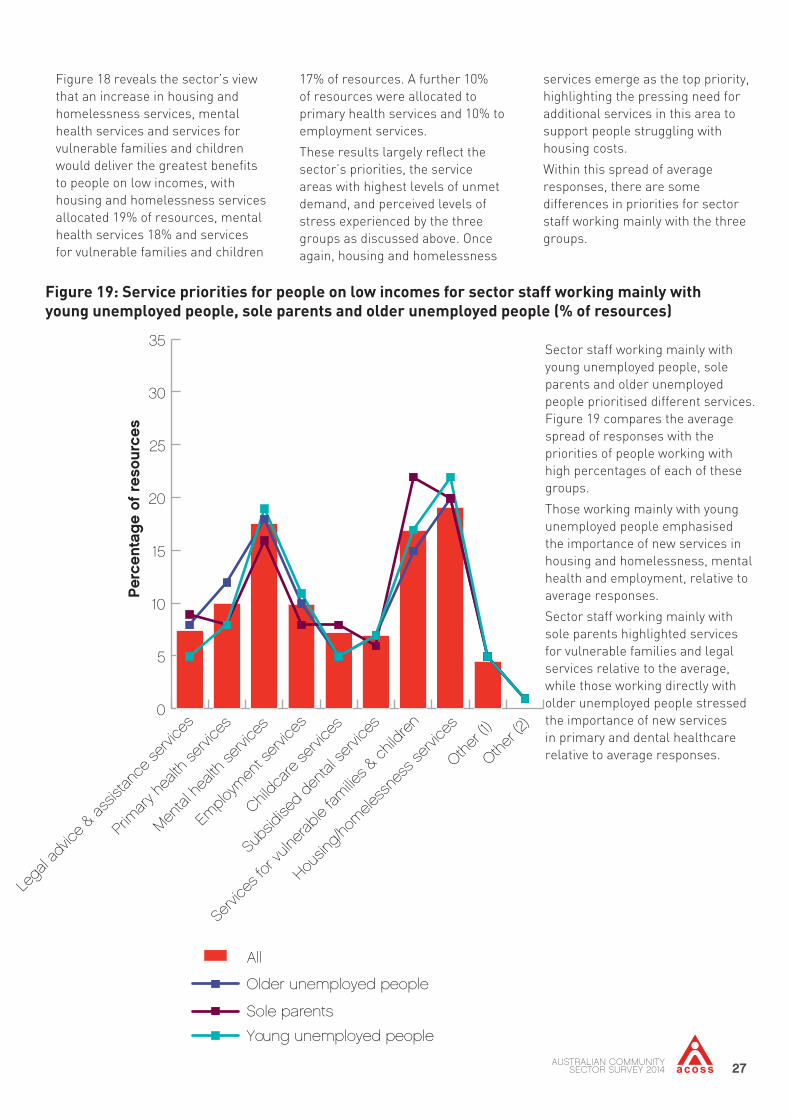
Sector staff working mainly with young unemployed people, sole parents and older unemployed people prioritised different services. Figure 19 compares the average spread of responses with the priorities of people working with high percentages of each of these groups.
Those working mainly with young unemployed people emphasised the importance of new services in housing and homelessness, mental health and employment, relative to average responses.
Sector staff working mainly with sole parents highlighted services for vulnerable families and legal services relative to the average, while those working directly with older unemployed people stressed the importance of new services in primary and dental healthcare relative to average responses.
28 Australian Council of Social Service
Survey question
How important are the following?9
Respondents were asked to rate how important each of the following policy reforms is on a scale of 1 -5, where 1 is 'extremely important' and 5 is 'not important'.
Increasing income support payments for the Newstart and Youth Allowances
More equitable funding for schools
Implementing universal dental care
Developing a sustainable tax base
Fully implementing the NDIS
Reducing the cost of of living pressures for people on low incomes
Maintaining concessions (state and local government eg transport, energy, water concessions)
Extending wage subsidies ie paid work experience in a regular job
Expanding training for long-term unemployed to secure paid employment
Prioritiesforservicegrowthtobenefitpeopleonlowincomes
Figure20:Importanceofcurrentpolicies(scoreoutof5)
All
Universal service/program
Data: Means of responses
Not important 5.0
4.5
4.0
3.5
3.0
2.5
2.0
1.5
Extremely important 1.0
Incre
asing
inco
me
supp
ort
Equit
able
scho
ol fun
ding
Unver
sal d
ental
car
e
Susta
inable
tax b
ase
NDIS im
plem
entat
ion
Reduc
ing c
ost o
f livn
ig
Maintai
ning
conc
essio
ns
Exte
nding
wag
e su
bsidi
es
Expa
nding
em
ploym
ent s
ervic
es
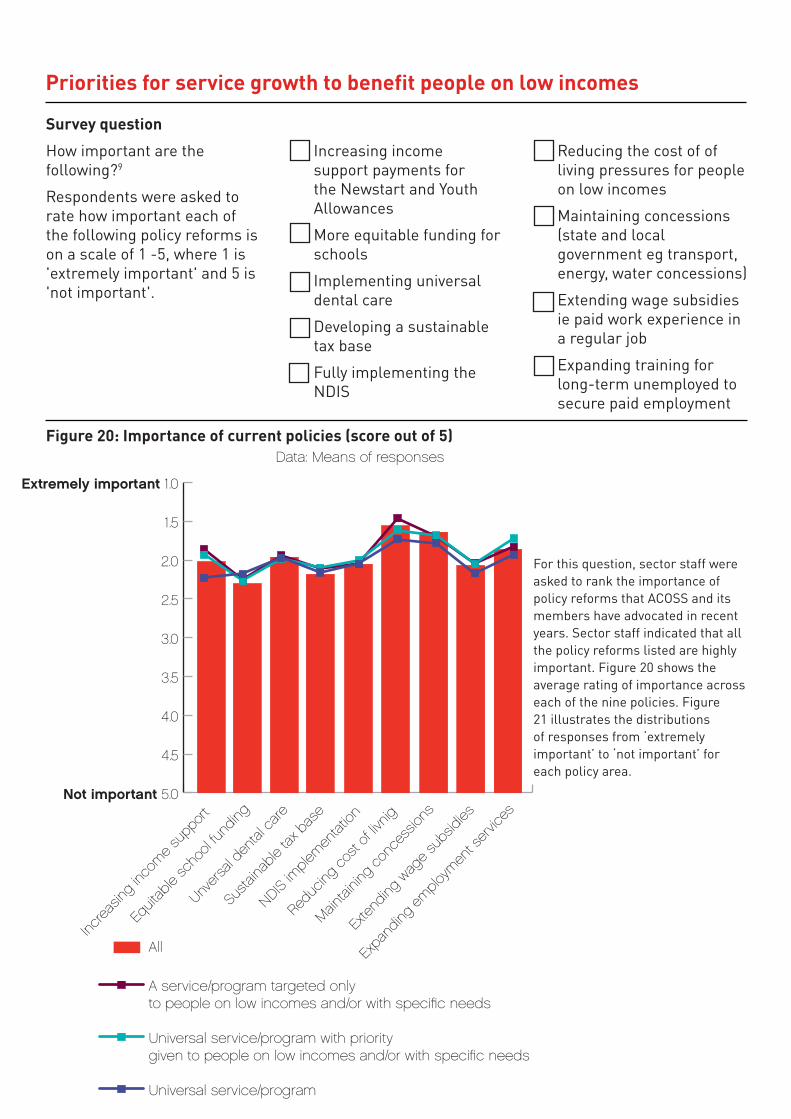
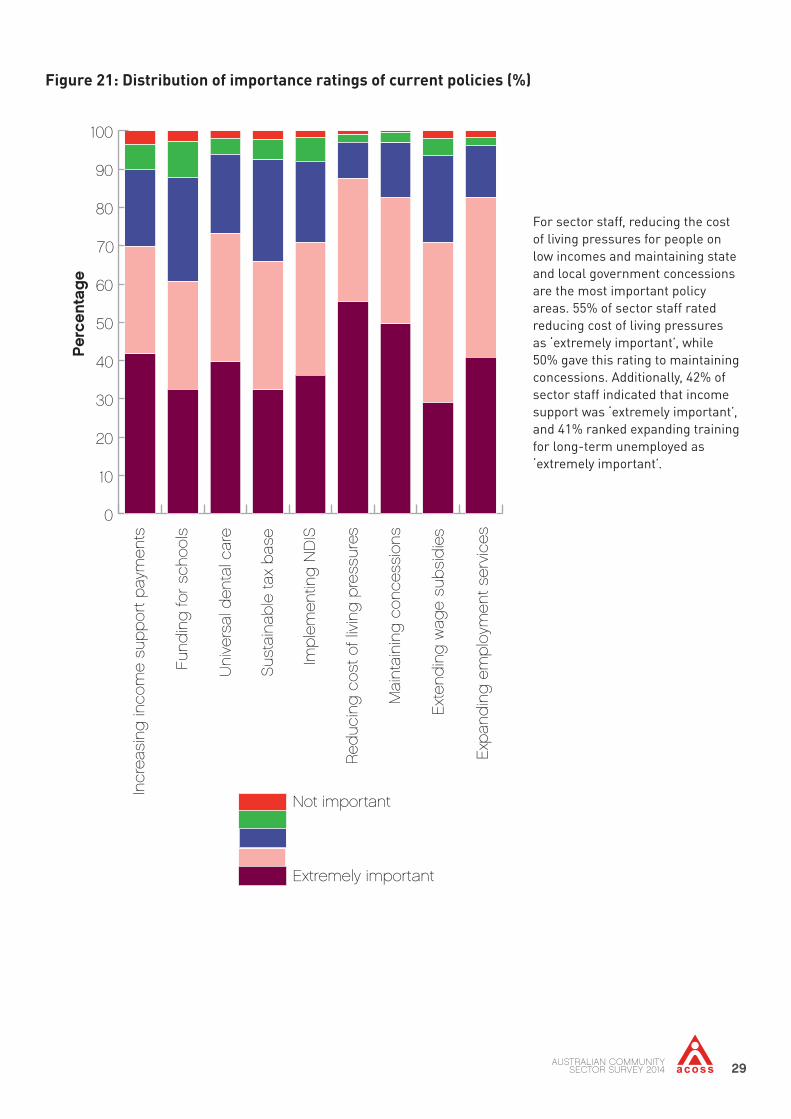
For this question, sector staff were asked to rank the importance of policy reforms that ACOSS and its members have advocated in recent years. Sector staff indicated that all the policy reforms listed are highly important. Figure 20 shows the average rating of importance across each of the nine policies. Figure 21 illustrates the distributions of responses from ‘extremely important’ to ‘not important’ for each policy area.
29AUSTRALIAN COMMUNITY SECTOR SURVEY 2014
Figure21:Distributionofimportanceratingsofcurrentpolicies(%)
0
10
20
30
40
50
60
70
80
90
100
Extremely important
Not important
Exp
and
ing
em
plo
ymen
t ser
vice
s
Ext
end
ing
wag
e su
bsi
die
s
Mai
ntai
ning
con
cess
ions
Red
ucin
g c
ost o
f liv
ing
pre
ssur
es
Imp
lem
entin
g N
DIS
Sus
tain
able
tax
bas
e
Uni
vers
al d
enta
l car
e
Fund
ing
for
scho
ols
Incr
easi
ng in
com
e su
pp
ort p
aym
ents
Perc
enta
ge
For sector staff, reducing the cost of living pressures for people on low incomes and maintaining state and local government concessions are the most important policy areas. 55% of sector staff rated reducing cost of living pressures as ‘extremely important’, while 50% gave this rating to maintaining concessions. Additionally, 42% of sector staff indicated that income support was ‘extremely important’, and 41% ranked expanding training for long-term unemployed as ‘extremely important’.
30 Australian Council of Social Service
The results in this section highlight that sector staff perceived an acute need for investment in affordable housing as well as for growth in housing and homelessness services. Indeed, housing emerged as the top priority in terms of delivering benefits to the community broadly as well as too young unemployed people, sole parents and older unemployed people.
In addition to housing, sector staff identified investment in
employment, education and skills development, health and income support as delivering the greatest benefits to the community. Differences emerged for the three groups: employment was prioritised for young unemployed people, housing for sole parents, and income support for older unemployed people.
After housing and homelessness services, sector staff identified mental health services and services
for vulnerable families and children as those most urgently needed by people on low incomes.
Finally, sector staff considered all of the areas identified for policy reform to be highly important. Reducing the cost of living pressures for people on low incomes, and maintaining concessions are perceived to be the two most important areas for reform.
Conclusion
ENDNOTES
1 Productivity Commission (2010) Contribution of the Not-for-Profit Sector. Productivity Commission Research Report, January 2010. Accessed at: http://www.pc.gov.au/__data/assets/pdf_file/0003/94548/not-for-profit-report.pdf. Accessed on 27 November 2014.2 Knight P & Gilchrist D (2014), Australian Charities 2013. Curtin University Not for Profit Initiative. Accessed at: https://www.acnc.gov.au/ACNC/Pblctns/Rpts/Curtin_Report/ACNC/Publications/Reports/Curtin_Report.aspx?hkey=fe4c5479-e3fd-4e03-977e-e84fbf23e070. Accessed on 27 November 2014.3 Causa O et al. (2014) Economic growth from the household perspective: GDP and Income Distribution Developments across OECD Countries. OECD Economics Department Working Papers No. 1111. OECD, France.4 ACOSS (2014) Poverty in Australia 2014. Accessed at: http://www.acoss.org.au/images/uploads/ACOSS_Poverty_in_Australia_2014.pdf. Accessed on 27 November 20145 Department of Social Service (no date) DSS Grants: A New Way of Working. Accessed at: https://www.dss.gov.au/sites/default/files/documents/06_2014/honeycomb.pdf. Accessed on 27 November 2014.6AustralianGovernment(2014)BudgetPaperNo.2:BudgetMeasures.Accessedathttp://www.budget.gov.au/2014-15/content/bp2/html/bp2_expense-07.htm. Accessed on 27 November 20147 Productivity Commission (2010) Contribution of the Not-for-Profit Sector. Productivity Commission Research Report, January 2010. Accessed at: http://www.pc.gov.au/__data/assets/pdf_file/0003/94548/not-for-profit-report.pdf. Accessed on 27 November 2014.8 Knight P & Gilchrist D (2014), Australian Charities 2013. Curtin University Not for Profit Initiative. Accesses at: https://www.acnc.gov.au/ACNC/Pblctns/Rpts/Curtin_Report/ACNC/Publications/Reports/Curtin_Report.aspx?hkey=fe4c5479-e3fd-4e03-977e-e84fbf23e070. Accessed on 27 November 20149 These policy recommendations reflect ACOSS priorities for social and economic reform at the time.
31AUSTRALIAN COMMUNITY SECTOR SURVEY 2014
ACKNOWLEDGEMENTS
ACOSS would like to acknowledge and offer our sincere thanks for the contribution of the following people and organisations to the development and analysis of the survey.
Foremost we would like to thank the Research Advisory Group: Paul Bullen(ManagementAlternatives),Dr Brendan Goodger (Community Services & Health Industry Skills Council),PrimodGovender(IBMAustralia), Sarah Fogg (The Benevolent Society), and Dev Mukherjee(VictorianCouncilofSocial Service). The survey benefited greatly from their expertise and regular consultation. In particular we would like to thank Paul and Brendan for their work on the survey design and data analysis.
Our thanks also go to the national and state peak organisations that assisted with the delivery and promotion of the survey. Their partnership ensured that a large and diverse array of organisations were given the opportunity to participate in the survey. They
include the state and territory Councils of Social Service and 33 specialist peaks:
• AboriginalChild,Family& Community Care State Secretariat
• AustralianFederationofDisability Organisations (AFDO)
• Aged&CommunityServicesAssociation NSW & ACT
• ACTCouncilofSocialService(ACTCOSS)
• AboriginalHealthCouncilofSouth Australia (AHCSA)
• AIDSActionCounciloftheACT
• Alcohol,Tobacco&otherDrugsCouncil Tasmania
• AustralianYouthAffairsCoalition (AYAC)
• BrainInjuryNetworkofSouthAustralia Inc (BINSA)
• CommunityChildcareAssociation Inc
• CommunityHousingFederationVictoria
• CommunityLegalCentresNSW
Inc
• DomesticViolenceVictoria
• EarlyLearningAssociationAustralia
• HomelessnessNSW
• Linkwest
• NationalAboriginalandTorresStrait Islander Legal Service (NATSILS)
• NationalAssociationofCommunity Legal Centres (NACLC)
• NationalWelfareRightsNetwork (NWRN)
• NetworkofAlcohol&OtherDrug Agencies (NADA)
• NSWCouncilofSocialService(NCOSS)
• NSWFamilyServicesInc
• NTCouncilofSocialService(NTCOSS)
• PeelCommunityDevelopmentGroup
• PeoplewithDisabilityAustralia(PWDA)
• QLDCouncilofSocialService
32 Australian Council of Social Service32 Australian Council of Social Service
• QueenslandAssociationofIndependent Legal Services (QAILS)
• RefugeeCouncilofAustralia(RCOA)
• SACouncilofSocialService(SACOSS)
• SecretariatofNationalAboriginal and Islander Childcare (SNAICC)
• SettlementCouncilofAustralia(SCOA)
• ShelterTasmania
• TasmanianCouncilofSocialService (TasCOSS)
• PsychiatricDisabilityServicesofVictoria(VICSERV)
• VictorianAlcoholandDrugAssociation
• VictorianCouncilofSocialService(VCOSS)
• VictorianHealthAssociationLtd.
• WACouncilofSocialService(WACOSS)
• YouthAffairsCoalitionofWA(YACWA)
• YouthAction
• YouthAffairsCouncilofVictoria
We would like to thank the ACOSS
team for their work on this report: Tessa Boyd-Caine, Penny Dorsch, Daisy Farnham, Emily Hamilton, AndrewKosandRebeccaVassarotti.
Finally, we would like to extend a sincere thank you to all organisations and individuals that participated in the pre-test and pilot, and all the community sector staff who took the time to complete the survey. Your contributions are invaluable and have allowed this important evaluation of the experiences of people who access community sector programs and services to come about.
33AUSTRALIAN COMMUNITY SECTOR SURVEY 2014
APPENDIX 1: RESPONSES
ROLE OF RESPONDENTS
The sector staff who completed the surveys come from a mix of roles within their organisations.
• 53%ofrespondentswereservice coordinators/program managers/community development workers/direct service providers.
• 26%wereCEOsorexecutiveofficers. Note: 80% of these were CEOs or EOs in organisations with less than 50 staff (i.e. not EOs or large organisations).
• 22%wereoperationsorothermanagers or other roles (note, over half of these were managers in organisations with less than 50 staff).
Overall the sector staff completing the surveys were working close to the clients rather than organisationally a long way from them.
GENDER, AGE AND LENGTH OF EMPLOYMENT OF RESPONDENTS
Gender
• 80% female and 20% male (consistent with employment in the sector).
Age
• 1%lessthan25yearsofage
• 11%between26and35yearsofage
• 33%between36and39yearsofage
• 49%between50and65yearsofage
• 6%over65yearsofage
Length of employment
• On average respondents had been employed 6 years in their current role and had been working 12 years in the service area in which they were currently working.
SERVICES REPRSENTED
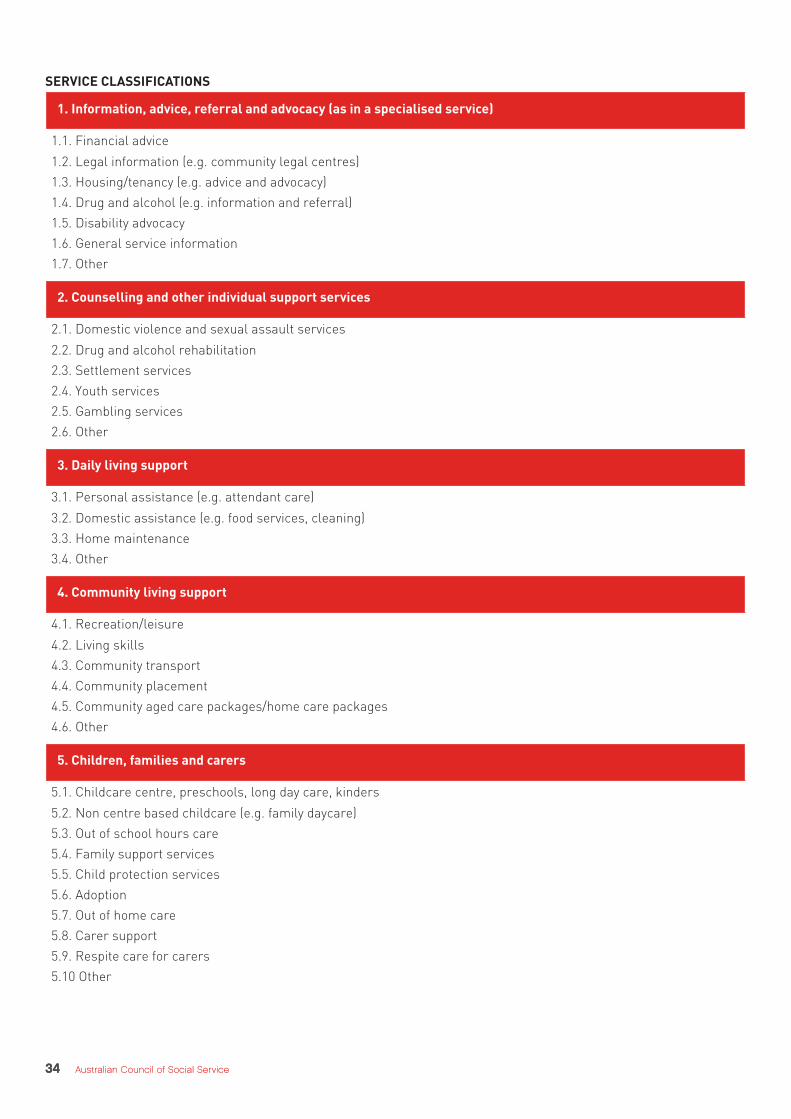
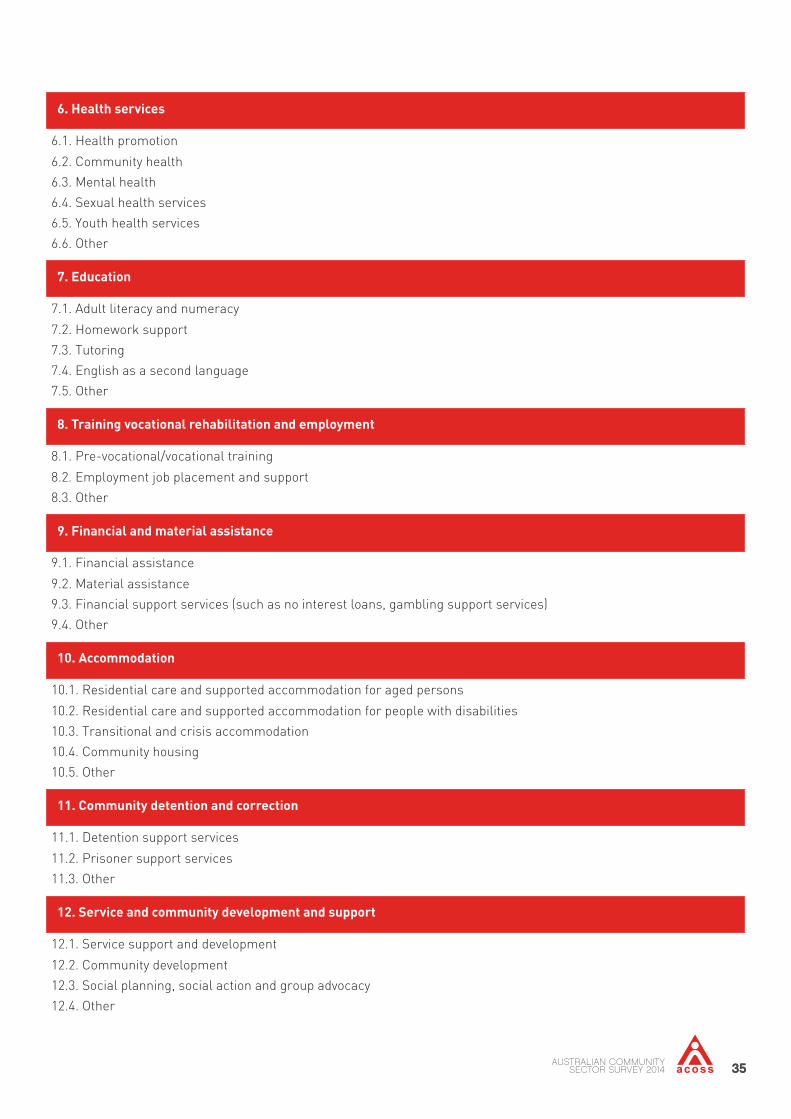
In the survey services were classified into 63 different types (e.g. childcare centre, family support service, transitional and crisis accommodation) grouped into 12 broad categories (e.g. daily living support, health services and education). The full list of service categories and types is presented in the table below. Each of the 63 different service types are represented in the survey.
34 Australian Council of Social Service34 Australian Council of Social Service
SERVICE CLASSIFICATIONS
1.Information,advice,referralandadvocacy(asinaspecialisedservice)
1.1. Financial advice
1.2. Legal information (e.g. community legal centres)
1.3. Housing/tenancy (e.g. advice and advocacy)
1.4. Drug and alcohol (e.g. information and referral)
1.5. Disability advocacy
1.6. General service information
1.7. Other
2.Counsellingandotherindividualsupportservices
2.1. Domestic violence and sexual assault services
2.2. Drug and alcohol rehabilitation
2.3. Settlement services
2.4. Youth services
2.5. Gambling services
2.6. Other
3. Daily living support
3.1. Personal assistance (e.g. attendant care)
3.2. Domestic assistance (e.g. food services, cleaning)
3.3. Home maintenance
3.4. Other
4. Community living support
4.1. Recreation/leisure
4.2. Living skills
4.3. Community transport
4.4. Community placement
4.5. Community aged care packages/home care packages
4.6. Other
5.Children,familiesandcarers
5.1. Childcare centre, preschools, long day care, kinders
5.2. Non centre based childcare (e.g. family daycare)
5.3. Out of school hours care
5.4. Family support services
5.5. Child protection services
5.6. Adoption
5.7. Out of home care
5.8. Carer support
5.9. Respite care for carers
5.10 Other
35AUSTRALIAN COMMUNITY SECTOR SURVEY 2014 35
6.Healthservices
6.1. Health promotion
6.2. Community health
6.3.Mentalhealth
6.4. Sexual health services
6.5. Youth health services
6.6. Other
7.Education
7.1. Adult literacy and numeracy
7.2. Homework support
7.3. Tutoring
7.4. English as a second language
7.5. Other
8.Trainingvocationalrehabilitationandemployment
8.1. Pre-vocational/vocational training
8.2. Employment job placement and support
8.3. Other
9.Financialandmaterialassistance
9.1. Financial assistance
9.2.Materialassistance
9.3. Financial support services (such as no interest loans, gambling support services)
9.4. Other
10.Accommodation
10.1. Residential care and supported accommodation for aged persons
10.2. Residential care and supported accommodation for people with disabilities
10.3. Transitional and crisis accommodation
10.4. Community housing
10.5. Other
11.Communitydetentionandcorrection
11.1. Detention support services
11.2. Prisoner support services
11.3. Other
12.Serviceandcommunitydevelopmentandsupport
12.1. Service support and development
12.2. Community development
12.3. Social planning, social action and group advocacy
12.4. Other
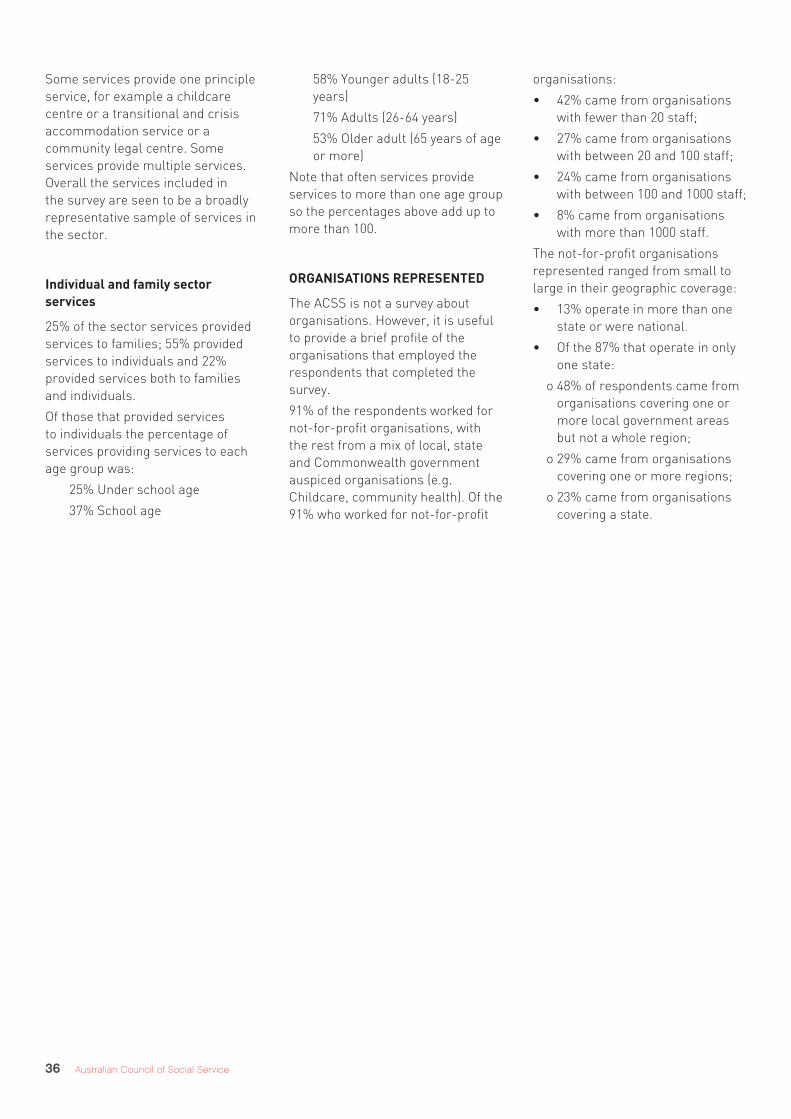
36 Australian Council of Social Service
Some services provide one principle service, for example a childcare centre or a transitional and crisis accommodation service or a community legal centre. Some services provide multiple services. Overall the services included in the survey are seen to be a broadly representative sample of services in the sector.
Individualandfamilysectorservices
25% of the sector services provided services to families; 55% provided services to individuals and 22% provided services both to families and individuals.
Of those that provided services to individuals the percentage of services providing services to each age group was:
25% Under school age
37% School age
58% Younger adults (18-25 years)
71% Adults (26-64 years)
53% Older adult (65 years of age or more)
Note that often services provide services to more than one age group so the percentages above add up to more than 100.
ORGANISATIONS REPRESENTED
The ACSS is not a survey about organisations. However, it is useful to provide a brief profile of the organisations that employed the respondents that completed the survey.
91% of the respondents worked for not-for-profit organisations, with the rest from a mix of local, state and Commonwealth government auspiced organisations (e.g. Childcare, community health). Of the 91% who worked for not-for-profit
organisations:
• 42%camefromorganisationswith fewer than 20 staff;
• 27%camefromorganisationswith between 20 and 100 staff;
• 24%camefromorganisationswith between 100 and 1000 staff;
• 8%camefromorganisationswith more than 1000 staff.
The not-for-profit organisations represented ranged from small to large in their geographic coverage:
• 13%operateinmorethanonestate or were national.
• Ofthe87%thatoperateinonlyone state:
o 48% of respondents came from organisations covering one or more local government areas but not a whole region;
o 29% came from organisations covering one or more regions;
o 23% came from organisations covering a state.
37ANNUAL REPORT 2014
APPENDIX 2:METHODOLOGY & RIGOUR
The survey has been developed in ways that strengthen the rigour of the data collected; and the data has been analysed in many ways to test its rigour. The development process and data analyses provide considerable confidence in the voices presented in this report.
The people who completed the survey are a sample of sector staff from:
1. MembersofACOSSandeachofthe state and territory Councils of Social Service (348 completed surveys came from the 1645 members of these COSSes - a 24% response rate);
2. Membersof18participatingpeak body organisations (397 completed surveys came from these peak body organisations - a 32% response rate); and
3. Membersof15peakbody
organisations that distributed the survey to their members on behalf of ACOSS (218 completed surveys from staff in the members of these peak body organisations; because ACOSS did not distribute these emails to individuals it is not possible to calculate an accurate response rate for this group).
The sector staff are from all states and territories:
State %ofAustralia'spopulation %ofsectorstaff
NSW 32 35
Victoria 25 21
Queensland 20 13
South Australia 7 5
Western Australia 11 15
Tasmania 2 4
Northern Territory 1 2
ACT 2 4
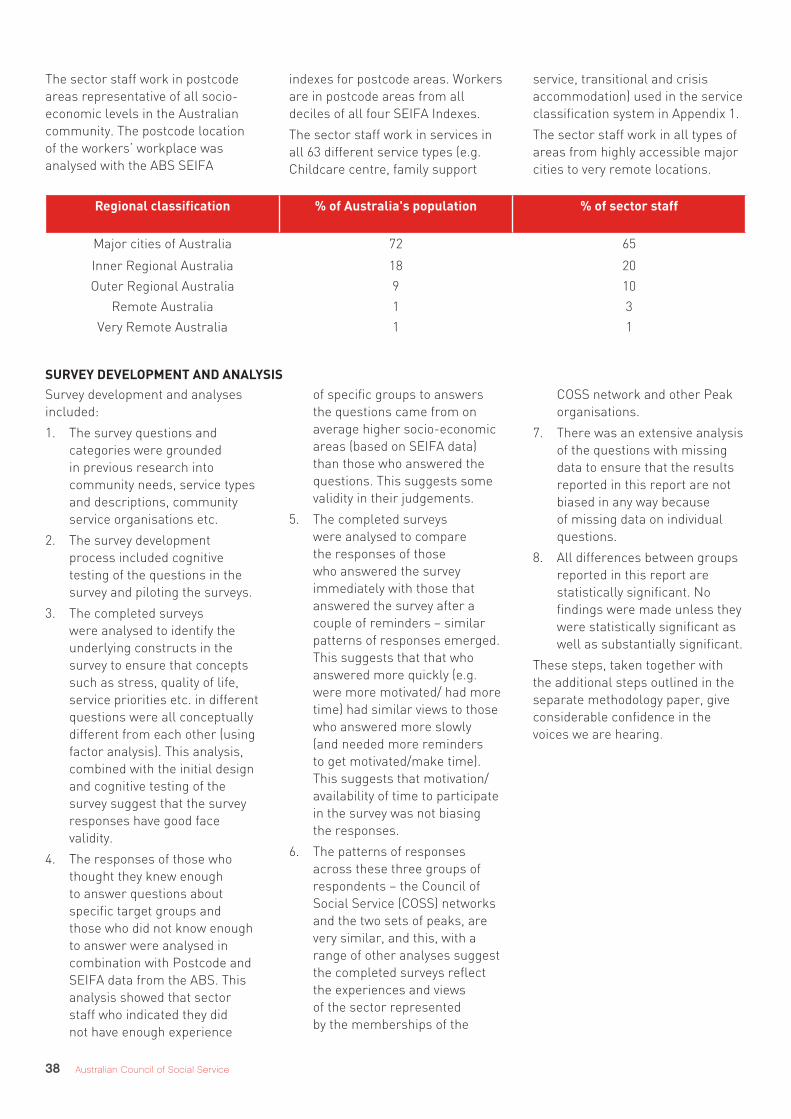
38 Australian Council of Social Service
The sector staff work in postcode areas representative of all socio-economic levels in the Australian community. The postcode location of the workers’ workplace was analysed with the ABS SEIFA
indexes for postcode areas. Workers are in postcode areas from all deciles of all four SEIFA Indexes.
The sector staff work in services in all 63 different service types (e.g. Childcare centre, family support
service, transitional and crisis accommodation) used in the service classification system in Appendix 1.
The sector staff work in all types of areas from highly accessible major cities to very remote locations.
Regionalclassification %ofAustralia'spopulation %ofsectorstaff
MajorcitiesofAustralia 72 65
Inner Regional Australia 18 20
Outer Regional Australia 9 10
Remote Australia 1 3
VeryRemoteAustralia 1 1
Survey development and analyses included:
1. The survey questions and categories were grounded in previous research into community needs, service types and descriptions, community service organisations etc.
2. The survey development process included cognitive testing of the questions in the survey and piloting the surveys.
3. The completed surveys were analysed to identify the underlying constructs in the survey to ensure that concepts such as stress, quality of life, service priorities etc. in different questions were all conceptually different from each other (using factor analysis). This analysis, combined with the initial design and cognitive testing of the survey suggest that the survey responses have good face validity.
4. The responses of those who thought they knew enough to answer questions about specific target groups and those who did not know enough to answer were analysed in combination with Postcode and SEIFA data from the ABS. This analysis showed that sector staff who indicated they did not have enough experience
of specific groups to answers the questions came from on average higher socio-economic areas (based on SEIFA data) than those who answered the questions. This suggests some validity in their judgements.
5. The completed surveys were analysed to compare the responses of those who answered the survey immediately with those that answered the survey after a couple of reminders – similar patterns of responses emerged. This suggests that that who answered more quickly (e.g. were more motivated/ had more time) had similar views to those who answered more slowly (and needed more reminders to get motivated/make time). This suggests that motivation/availability of time to participate in the survey was not biasing the responses.
6. The patterns of responses across these three groups of respondents – the Council of Social Service (COSS) networks and the two sets of peaks, are very similar, and this, with a range of other analyses suggest the completed surveys reflect the experiences and views of the sector represented by the memberships of the
COSS network and other Peak organisations.
7. There was an extensive analysis of the questions with missing data to ensure that the results reported in this report are not biased in any way because of missing data on individual questions.
8. All differences between groups reported in this report are statistically significant. No findings were made unless they were statistically significant as well as substantially significant.
These steps, taken together with the additional steps outlined in the separate methodology paper, give considerable confidence in the voices we are hearing.
SURVEY DEVELOPMENT AND ANALYSIS


AUSTRALIAN COUNCIL OF SOCIAL SERVICE
www.acoss.org.au FACEBOOKhttps://www.facebook.com/AustralianCouncilofSocialService
TWITTERhttps://twitter.com/#!/ACOSS