australian automotive industry...6 introduction a new era of the australian automotive industry...
TRANSCRIPT
AUSTRALIAN AUTOMOTIVE INDUSTRY Transition following the end of Australian motor
vehicle production
January 2020
Department of Industry Innovation and Science
2
Contents Glossary ............................................................................................................................... 3
Executive Summary ............................................................................................................ 4
Introduction ......................................................................................................................... 6
Structural Adjustment Policy Overview ......................................................................... 6
History ............................................................................................................................... 7
Government Transition Support Response .................................................................... 8
Developing the Response ........................................................................................... 9
Motor Vehicle Producers transition .............................................................................. 12
Ford ............................................................................................................................. 12
Toyota ......................................................................................................................... 13
Holden ........................................................................................................................ 13
Automotive Industry bodies ......................................................................................... 13
Automotive Supply Chain Firm Analysis .......................................................................... 14
Study Methodology ...................................................................................................... 14
Analysis of Firm Survival ................................................................................................. 15
Analysis of Employment Levels and Automotive Sales .............................................. 16
Industry Transition .............................................................................................................. 20
Automotive Aftermarket ............................................................................................... 21
Truck Industry Expansion ............................................................................................... 21
Other Company Transitions .......................................................................................... 23
Analysis of Transition Support from Government............................................................ 25
Effect of Program Participation on Firm Survival and Employment .......................... 26
Effect of Program Participation on Diversification and Export Markets .................... 29
2018 ATS Survey Update ................................................................................................... 32
Impact of Government Transition Assistance Programs ............................................ 32
Analysis of Sales ............................................................................................................. 33
Analysis of Exports ......................................................................................................... 34
Forecasts ........................................................................................................................ 35
Summary ........................................................................................................................ 35
Lessons Learnt ................................................................................................................... 36
Company Characteristics and Barriers for Successful Transition ............................... 37
Going forward ............................................................................................................... 40
Conclusions ....................................................................................................................... 42
Appendix A ....................................................................................................................... 43
Study Methodology ...................................................................................................... 43
3
Glossary
Abbreviation Description
ASCTP Automotive Supply Chain Transition Program
ADP Automotive Diversification Program
ANMP Automotive New Markets Program
ASCTP Automotive Supply Chain Transition Program
ASDP Automotive Supplier Diversification Program
ATS Automotive Transformation Scheme
BCSP Business Capability Support Program
DIIS Department of Industry, Innovation and Science
GCIF Green Car Innovation Fund
LIFT Local Industry Fund for Transition
OE Original Equipment
OEM Original Equipment Manufacturer
SPCP Supplier Productivity and Capability Program
4
Executive Summary
The closures of the three remaining motor vehicle producers (MVPs) in 2016 and 2017
were watershed moments in Australia’s industrial history. The first Australian
manufactured vehicle rolled off the Holden assembly line at Fisherman’s Bend in
Victoria in 1948. During the 1970’s the sector peaked with around 90,000 workers
producing nearly half a million vehicles a year.
The industry had benefitted from tariff protection, which was progressively wound
back in the 1980’s and 90’s. In exchange, the Australian Government provided
transitional support to the industry in the form of budgetary assistance. The winding
back of support, against a backdrop of a high domestic exchange rate, the
introduction of free trade agreements with other vehicle producing countries, and
shifting consumer preferences ultimately forced the closure of domestic vehicle
production. The three MVPs each gave a three year transition window to enable the
orderly wind-down of their operations. This period was invaluable in allowing the
automotive supply chain time to transition to the loss of their major customers.
Governments also responded by establishing transitional programs that supported
supply-chain firms to plan, re-invest and develop new capabilities and markets. The
Department of Industry, Innovation and Science (DIIS) worked closely with the
governments of South Australia (SA) and Victoria, to design complementary and
comprehensive initiatives. These measures were timely, targeted to the affected
firms, and strategic, by stimulating a change in firm behaviour rather than subsidising
ongoing activities.
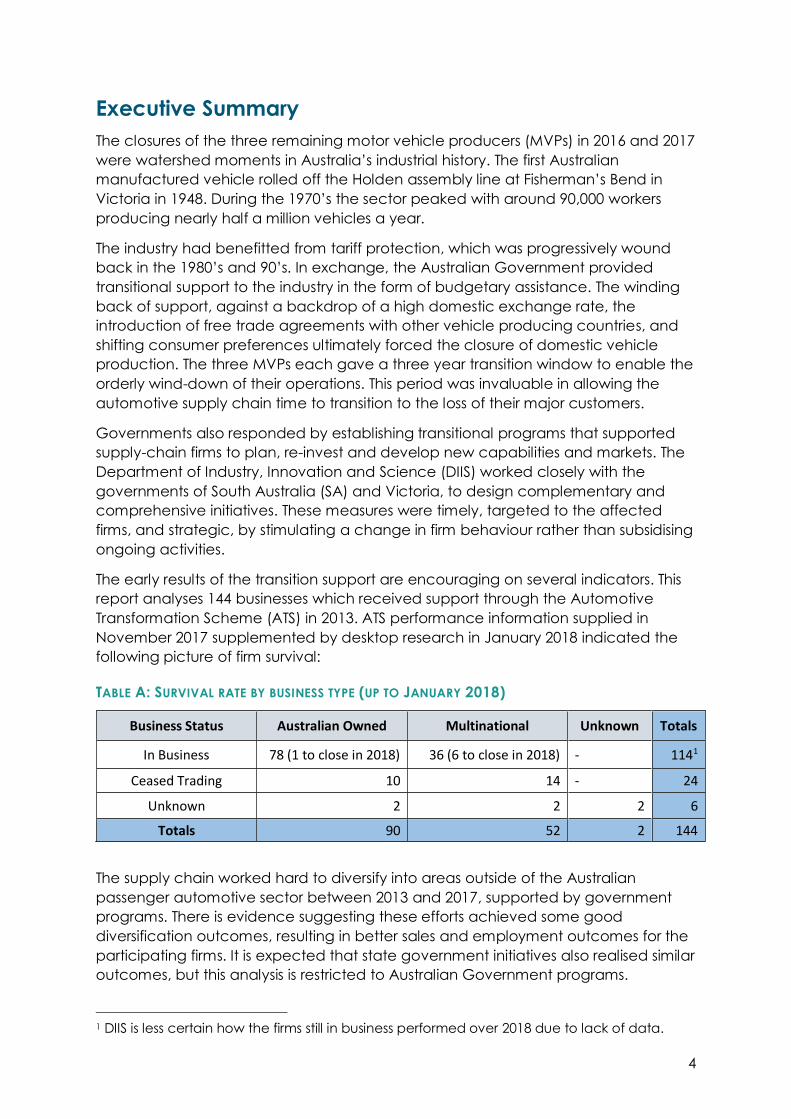
The early results of the transition support are encouraging on several indicators. This
report analyses 144 businesses which received support through the Automotive
Transformation Scheme (ATS) in 2013. ATS performance information supplied in
November 2017 supplemented by desktop research in January 2018 indicated the
following picture of firm survival:
TABLE A: SURVIVAL RATE BY BUSINESS TYPE (UP TO JANUARY 2018)
Business Status Australian Owned Multinational Unknown Totals
In Business 78 (1 to close in 2018) 36 (6 to close in 2018) - 1141
Ceased Trading 10 14 - 24
Unknown 2 2 2 6
Totals 90 52 2 144
The supply chain worked hard to diversify into areas outside of the Australian
passenger automotive sector between 2013 and 2017, supported by government
programs. There is evidence suggesting these efforts achieved some good
diversification outcomes, resulting in better sales and employment outcomes for the
participating firms. It is expected that state government initiatives also realised similar
outcomes, but this analysis is restricted to Australian Government programs.
1 DIIS is less certain how the firms still in business performed over 2018 due to lack of data.
5
The positive diversification outcomes are supported by ABS data. While overall motor
vehicle and motor vehicle part manufacturing employment numbers declined
between 2013-14 and 2017-18, the drop was concentrated in the ‘motor vehicle
manufacturing’ class. The other classes showed constant or increasing employment
numbers.
While it is challenging to draw conclusive lessons from the automotive transition, it is
clear that companies benefit tremendously from holistic assistance that includes:
consideration of a company’s vision and goals; skills and retraining; resources
(guidance as well as financial resources) and planning tools.
Going forward, the Australian Government will continue to encourage innovation,
build industry capability, and assist future emerging industries such as autonomous
vehicle and related technologies; hydrogen and electric vehicles and related
technologies. This will grow the remaining research and development and design
elements that are thriving in Australia.
6
Introduction
A new era of the Australian automotive industry began with the 2013 and 2014
decisions by Ford Australia (Ford), Toyota Australia (Toyota) and GM Holden
(Holden) to cease Australian production and focus on import models and research
and development (R&D). While the decisions to cease making cars in Australia were
extremely disappointing, the three companies demonstrated significant corporate
goodwill by planning a three year orderly closure of their operations. This was
particularly important for their suppliers, allowing a critical period to plan the
transition of their businesses to other sectors and markets, or for some, to close as
well.
The Australian, Victorian and South Australian (SA) Governments responded
collaboratively with a range of measures to help the industry transition. This report
presents an overview of the response; an analysis of the current state of the
automotive supply chain; and lessons learnt for future policy directions.
Structural Adjustment Policy Overview
The government’s primary role is to create an environment conducive to business
growth, innovation and competitiveness. Individual businesses have the responsibility
to make decisions to enhance their productivity and future sustainability. Businesses
can adjust their operation models and re-invent themselves through undertaking
such activities as investing in innovation and skills, adopting new technologies,
investigating global supply chains and markets, as well as creating new products.
Australia has an open economy which is dynamic and has transitioned through
directing its resources to the most appropriate and profitable use. The economy has
responded to the economic fluctuations created by such factors as globalisation,
trade liberalisation, automation, digitalisation, changes in demographics and shifting
consumer preferences.
However, governments have also recognised that at times the change imposed by
these factors may lead to significant challenges for businesses, particularly those in
regional areas. These changes may lead to the reconsideration of business models,
downsizing, or closure. In turn, this may have significant adverse impact on
individuals, their families, and other local businesses.
Governments also have a track record of providing support when the impact on
workers, their families and regions are particularly significant. Geelong and
Melbourne North’s Innovation and Investment Funds were announced in response to
Ford’s closure announcement, and the 2014 Growth Fund was announced following
Toyota and Holden’s closure announcements.
The Growth Fund is a comprehensive package of support for retrenched workers,
grants for diversification of the supply chain and the investment in higher value-add
non-automotive manufacturing. These interventions have had positive effects in
providing confidence and building resilience.
7
Productivity Commission’s “Transitioning Regional Economies” report
The Productivity Commission released its study, “Transitioning Regional Economies” in
December 2017. The Commission recommended that specific adjustment assistance
should be targeted towards adaption to change and reserved for extreme
unanticipated situations where there are impacts on disadvantaged groups and the
general safety net arrangements are inadequate.
The government’s experience and considerations around industry transition
challenges are broadly consistent with the Commission’s recommendation. The
government has intervened in circumstances of significant structural adjustment
challenge and when there is a strong policy case and evidence base.
What is clear is that the most effective interventions are collaborative, avoid
duplication and encourage cooperation across all levels of government, and
include contributions from affected firms. It is also key that the local community is
engaged and take ownership of its future economic viability.
History
Successive Australian Governments have provided comprehensive support to the
automotive industry over many decades, including import tariffs and quotas,
government purchasing arrangements and budgetary assistance. In 1988, the
Government changed its policy to boost the competitiveness of the industry by
winding back protective measures. Tariffs were cut from 57.5 to 45 per cent, to be
phased down to 35 per cent in 1992. Later decisions continued the reductions to 15
per cent by 2000 and 10 per cent by 2005.
In November 2008, the Government announced that it would cut the tariff applying
to vehicle imports from 10 to 5 per cent by 2010. To help transition the industry to the
lower protection, it introduced a $6.2 billion ‘New Car Plan for a Greener Future’. The
key initiative in this plan was the $3.4 billion Automotive Transformation Scheme (ATS)
which supported competitive investment in R&D and plant and equipment,
designed to attract new investment in long-term, sustainable vehicle production.
In 2012, $25 million of New Car Plan funding was directed to the establishment of the
Automotive New Markets Initiative (ANMI), the purpose of which was to help supply
chain firms expand their operations. The Victorian and SA Governments co-funded
one element of the program, the Automotive New Markets Program (ANMP). The
ANMP provided merit-based grants for companies to expand, enhance capabilities,
markets and product range. These measures were in recognition of the extreme cost
pressures the industry was facing. The three MVPs were also working closely with their
supply chains to identify opportunities for cost-savings.
In 2013 Australia was producing just over 200 thousand cars 2(Australian consumers
were purchasing 1 million new vehicles each year). About 40 per cent of production
was exported in 2012. The consensus amongst most analysts was that a run of 200-
300 thousand cars per plant was the minimum required to be cost-competitive.
2 https://www.pc.gov.au/inquiries/completed/automotive/report/automotive.pdf
8
In 2013 support to the sector was reduced by AUD$500 million. Industry lobbied for
this funding to be restored, as well as for additional assistance to be provided. The
Government called on industry to make a commitment to remaining in Australia,
however no commitment was forthcoming.
Despite the government measures and industry’s efforts, with sales of locally made
vehicles falling considerably in the context of Australia’s high exchange rate and
changing consumer preferences, the three MVPs were not profitable. Within
8 months from May 2013, all three announced plans to close their manufacturing
operations over a three-year period. Ford ceased production in September 2016;
Holden and Toyota in October 2017.
All three planned to continue their R&D activities, with Ford and Holden increasing
this function. In particular, Ford invested heavily in its Melbourne based Asia Pacific
Product Development Centre, employing 1,750 designers and engineers. In
August 2018, Holden announced the creation of 150 new engineering jobs, taking its
total design and engineering workforce to over 500 and an annual R&D spend of
over $120 million.
Government Transition Support Response
In response to Ford’s closure announcement in May 2013, the Commonwealth and
Victorian Governments announced the $29.5 million Geelong Region and
$24.5 million Melbourne’s North Innovation and Investment Funds. These programs
funded 37 businesses and leveraged $305 million investment. Funded by the
Commonwealth, $5.25 million was provided to the ‘Ford Workers in Transition
Project’, to support its employees into new employment opportunities.
Once Toyota and Holden decided to close their Australian operations in late 2013 to
early 2014, the Australian Government committed to retaining the existing support
through the Automotive Transformation Scheme (ATS), and worked with Victorian
and SA governments to introduce targeted transitional support programs. These
included the $155 million Growth Fund announced in April 2014, and the subsequent
$100 million Advanced Manufacturing Fund announced in May 2017. Key measures
from these packages include:
o The $15 million boost to the Automotive Industry Structural Adjustment
Programme that provided careers advice and assistance to automotive
employees to secure new jobs;
o The $20 million Automotive Diversification Programme that supported 26
businesses and generated an additional $49 million in investment;
o The $90 million Next Generation Manufacturing Investment Programme,
which included $12 million each from the SA and Victorian governments.
The programme accelerated private investment in high value non-
automotive manufacturing sectors, supported 48 businesses and
generated an additional $222 million in investment.
o The $47.5 million Advanced Manufacturing Growth Fund that supported
32 businesses from Victoria and South Australia with grants to transition
from traditional to advanced manufacturing of higher value products. The
funding leverages investment of $144 million.
9
The Australian Government’s budgetary assistance for the automotive sector in the
four years from 2013-14 to 2016-17 totalled approximately $1.29 billion. ATS assistance
made up $1.044 billion of this total, of which the MVPs received $703 million. When
combined with tariff assistance, the financial support to the industry through the
2013-17 transition period exceeded $2.5 billion. This contrasts with industry value
added for ‘motor vehicle and motor vehicle part manufacturing’ of $15 billion for
the four years from 2013-14 to 2016-17 (ABS Cat. 8155: noting that some supply chain
activities are not captured under this category – i.e., fibreglass and plastic, tyres,
glass/windscreens and seat manufacturing).
In 2018, support was provided through the remaining tariff protection (which still
assists supply chain companies but not the former MVPs), the Advanced
Manufacturing Fund, and the ATS.
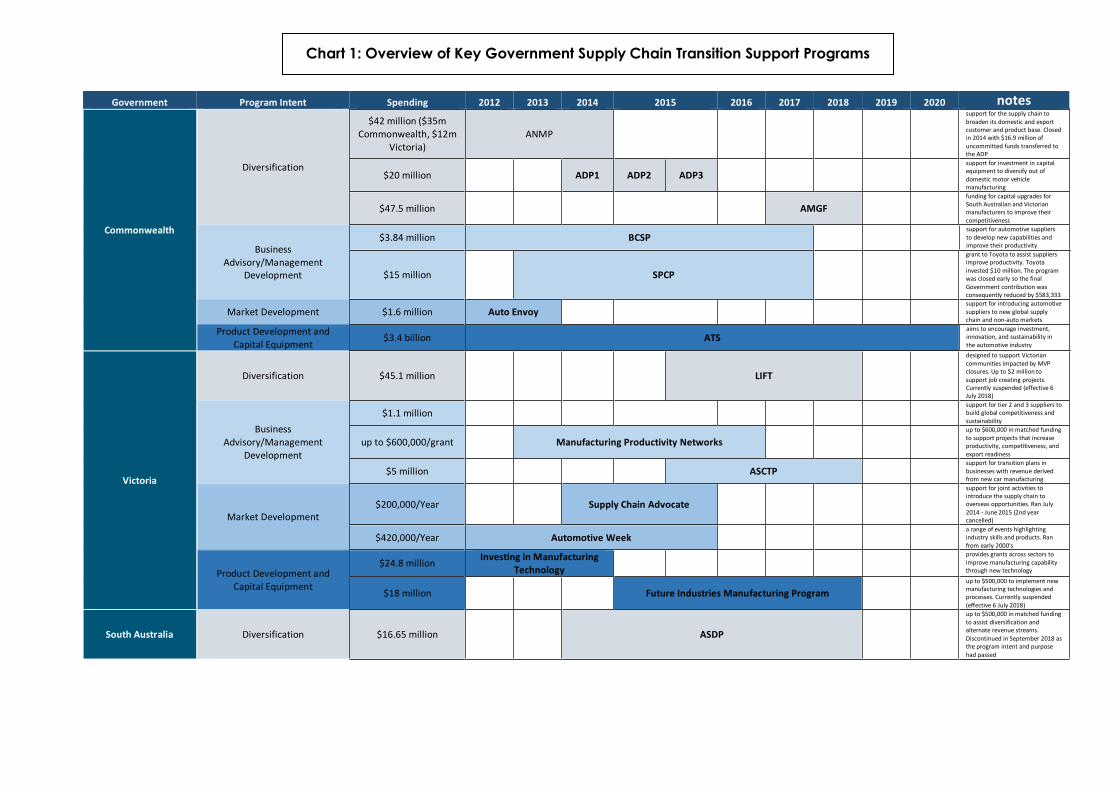
The Victorian and SA Governments introduced transition support programs which
had some similar and some complementary elements, but were of much smaller
scale. Chart 1 provides a snapshot of the varying assistance and diversification
support provided over the last decade.
Holden and Toyota Australia also funded the $30 million Skills and Training Initiative of
the Growth Fund. The $30 million primarily assists their own workers, however, Toyota
specifically partitioned $3 million of their contribution for workers in its supply chain.
This initiative was open until the end of 2018 to help automotive workers find new
jobs.
Developing the Response
In response to Holden’s closure announcement, the Australian Government
committed to fund a range of industry transition measures3. It set the broad
parameters for the measures, which were to support automotive firms diversify and
conduct R&D, and the expansion other manufacturers in affected areas. The details
of the initiatives were to be developed and informed by industry consultation.
The then Department of Industry convened a senior officials cross-government
working group to develop a strategic response to the Toyota and Holden closures
for the Government. This working group comprised senior officials from the
Commonwealth Departments of: Prime Minister and Cabinet; Treasury and
Productivity Commission; Industry; Employment; Education and Training; and Social
Services; and Infrastructure and Regional Development; and their counterparts in
the South Australian and Victorian governments.
All agencies provided the Department of Industry with information on the policies
and programs that could assist in the response, and options for supporting
automotive workers and supply chain businesses to transition to new opportunities.
The Department of Industry prepared an issues paper drawing on these and other
resources to help focus advice on the response.
3 https://www.minister.industry.gov.au/ministers/macfarlane/media-releases/securing-
australias-manufacturing-future, 18 December 2013
10
On 27 December 2013, the then Minister for Industry, the Hon Ian Macfarlane MP,
announced reviews of the South Australian and Victorian economies and called for
submissions. Minister Macfarlane convened separate expert review panels for South
Australia and Victoria. The panels held hearings in Victoria, South Australia and
Canberra in January and February 2014.
In parallel with this, the Department of Industry’s Economic Analysis Division, in
collaboration with the Productivity Commission and Department of Employment and
Social Services assessed each state’s economic situation and key challenges in the
automotive and components sectors. From this, it developed robust, evidence-
based advice on the likely impacts on the local government areas affected. This
helped to gauge the nature and size of the elements in the response, and to inform
public discussion on closures. Commentators and others provided estimates of the
possible impact of the closures.
The report of the economic review panels ‘Growing Opportunities: South Australian
and Victorian Comparative Advantages’, was released on 30 April 2014. It identified
high growth sectors in South Australia and Victoria with the potential of providing
new opportunities for workers and supply chain businesses in the short and longer
terms. The Government developed its $155 million Growth Fund with this valuable
evidence. The evidence also informed the design of elements of the Government’s
Industry Investment and Competitiveness Agenda.
Those agencies responsible for each element of the Growth Fund monitored
progress closely to ensure the programs were delivering as intended. A National
Governance Committee, chaired by the Department of Employment, oversaw
progress on the Fund’s elements supporting workers. Membership of this Committee
included officials from all stakeholder government agencies and Holden and
Toyota. The Department of Industry oversaw progress on the Fund’s elements
supporting supply chain businesses and other investment elements. Ongoing close
collaboration between the Commonwealth and states at the political and
departmental levels and Holden and Toyota ensured effective management of the
media reporting on the possible effects of the closures.
Government Program Intent Spending 2012 2013 2014 2015 2016 2017 2018 2019 2020 notes
Commonwealth
Diversification
$42 million ($35m Commonwealth, $12m
Victoria) ANMP
support for the supply chain to broaden its domestic and export customer and product base. Closed in 2014 with $16.9 million of uncommitted funds transferred to the ADP
$20 million ADP1 ADP2 ADP3
support for investment in capital equipment to diversify out of domestic motor vehicle manufacturing
$47.5 million AMGF
funding for capital upgrades for South Australian and Victorian manufacturers to improve their competitiveness
Business Advisory/Management
Development
$3.84 million BCSP support for automotive suppliers to develop new capabilities and improve their productivity
$15 million SPCP
grant to Toyota to assist suppliers improve productivity. Toyota invested $10 million. The program was closed early so the final Government contribution was consequently reduced by $583,333
Market Development $1.6 million Auto Envoy support for introducing automotive suppliers to new global supply chain and non-auto markets
Product Development and Capital Equipment
$3.4 billion ATS aims to encourage investment, innovation, and sustainability in the automotive industry
Victoria
Diversification $45.1 million LIFT
designed to support Victorian communities impacted by MVP closures. Up to $2 million to support job creating projects. Currently suspended (effective 6 July 2018)
Business Advisory/Management
Development
$1.1 million support for tier 2 and 3 suppliers to build global competitiveness and sustainability
up to $600,000/grant Manufacturing Productivity Networks
up to $600,000 in matched funding to support projects that increase productivity, competitiveness, and export readiness
$5 million ASCTP support for transition plans in businesses with revenue derived from new car manufacturing
Market Development $200,000/Year Supply Chain Advocate
support for joint activities to introduce the supply chain to overseas opportunities. Ran July 2014 - June 2015 (2nd year cancelled)
$420,000/Year Automotive Week a range of events highlighting industry skills and products. Ran from early 2000's
Product Development and Capital Equipment
$24.8 million Investing in Manufacturing
Technology
provides grants across sectors to improve manufacturing capability through new technology
$18 million Future Industries Manufacturing Program
up to $500,000 to implement new manufacturing technologies and processes. Currently suspended (effective 6 July 2018)
South Australia Diversification $16.65 million ASDP
up to $500,000 in matched funding to assist diversification and alternate revenue streams. Discontinued in September 2018 as the program intent and purpose had passed
Chart 1: Overview of Key Government Supply Chain Transition Support Programs
Motor Vehicle Producers transition
Despite the closure of their manufacturing operations, the three former MVPs have
all retained ongoing R&D capabilities in Australia.
Ford
Ford ceased local manufacturing in October 2016, shedding around 600 jobs, but
retaining around 2,000 local staff, including 1,750 designers and engineers.
Capitalising on its investment in and role as global engineering lead on the Ford
Ranger, Ford Australia has been awarded development work for other regional
vehicle programs. Ford continues to invest a significant proportion of its annual
budgets in R&D activities conducted in Australia. This investment amounted to more
than $3.5 billion in the ten years to 2017. Ford received significant ATS support over
this time.
Around the time of its manufacturing closure, Ford announced the establishment of
its Asia Pacific Product Development Centre (APPDC) to be headquartered in its
refurbished former Head Office at Broadmeadows. Employees working in the APPDC
undertake next generation vehicle development, including: design and
engineering; virtual and physical vehicle modelling; environmental and durability
testing and validating a range of driver assist technologies. These activities are
conducted at the Company’s Design Studio located in Broadmeadows, its Research
and Development Centre in Geelong and its Proving Ground located at Lara.
In April 2018, Ford’s head of development in China noted that the Australian
development team was increasingly being enlisted for major projects in the
Asia - Pacific region, crediting the team with an ability to rapidly and efficiently
switch between significantly different projects.4 Recently, Ford’s US headquarters
announced a re-design of Ford’s global business to improve operational fitness and
to meet the evolving requirements of consumers in emerging areas of new mobility
like connected and automated vehicles and alternative propulsion technologies.
Ford has continued to involve its local supply chain in its R&D activities, and has
helped a number of these innovative firms secure business with Ford global
operations.
4 https://www.whichcar.com.au/news/industry/ford-asia-pacific-leaning-on-australian-
development-centre, 30 April 2018 (viewed 27 Sept 2018)
13
Toyota
Toyota Australia ceased local manufacturing in October 2017, with the loss of 2,375
manufacturing and administrative jobs.
Toyota’s R&D program will continue with around 165 engineering staff retained.
There has been some re-focussing of priorities with an emphasis on autonomy,
connected vehicle services, product planning and design, vehicle evaluation to suit
the Australian market, and hydrogen fuel systems. At its Altona site, Toyota is also
exploring the broader application of hydrogen technologies beyond that of purely
vehicle application. Media notes Toyota (global) is investing heavily in ‘mobility as a
service’, with major investments in Uber and Grab (a Singapore based ride hailing
company).
Holden
Holden ceased local manufacturing in October 2017, with the loss of 950 jobs. It has
retained around 800 people nationally, including 350 designers, engineers and
technicians at Port Melbourne and its Proving Ground at Lang Lang, Victoria. In
August 2018 Holden announced this would be increased by 150 new engineers to
work on advanced vehicle development, including work on autonomous and
electric vehicle projects. Holden continues to have the second largest automotive
dealership and service network throughout Australia.
Automotive Industry bodies
Key automotive industry bodies remaining in Australia include the Australian
Automotive Aftermarket Association (AAAA); Motor Trades Association of Australia
(MTAA); Federal Chamber of Automotive Industries (FCAI); Truck Industry Council
(TIC); Australian Automotive Dealers Association (AADA); and the Society of
Automotive Engineers Australasia (SAE). These organisations have varying
representation across manufacturers, importers, dealers, and other stakeholders
regarding the direction of the future Australian automotive industry. Notably, the
Federation of Automotive Products Manufacturers (FAPM) which represented the
automotive supply chain companies, has ceased operations with residual activities
absorbed into the Victorian Automotive Chamber of Commerce (VACC).
Some associations, such as the AADA which represents franchised new car dealers,
and the SAE which represents automotive engineering training and research needs,
may become more prominent as the needs of the industry evolve.5
5 Victorian Automotive Chamber of Commerce, Directions in Australia’s Auto Industry, 2017
14
Automotive Supply Chain Firm Analysis
This automotive supply chain firm analysis provides a deep-dive into those
companies which were significantly exposed to the closure of the car
manufacturing industry in Australia.
Study Methodology
Industry specialists note that over its history, virtually all significant Tier 1, 2 and 3
automotive supply chain companies would have been registered in the ATS. This is
due to ATS registration requirements that supply chain companies must have a
minimum production value of $500,000 to be registered in the scheme. Accordingly,
the compulsory ATS reporting requirements give invaluable insight into the state of
the main supply chain participants.
The ATS data, including ATS participants’ business plan information, was
supplemented by information from various other Australian Government automotive
diversification support programs and desktop research. These programs were the
Business Capability Support Program (BCSP), Automotive Diversification Program
(ADP), and Automotive New Markets Program (ANMP). As the first closure
announcement was made in 2013, the study explores the journey of those
automotive firms that were part of the ATS in 2013 to September 2018.
ATS participant business plans are provided annually in November of each year and
can therefore provide a broad indication of the general trends occurring within the
industry. This review and its conclusions are however constrained by limited data. The
data availability for the 144 businesses which received ATS assistance in 2013 are
indicated in Table 1 below. The missing sales and employment data is due to
businesses in the original 144 sample leaving the ATS between 2013 and 2017. The
missing export data is due to the business plans containing limited information on
exports.
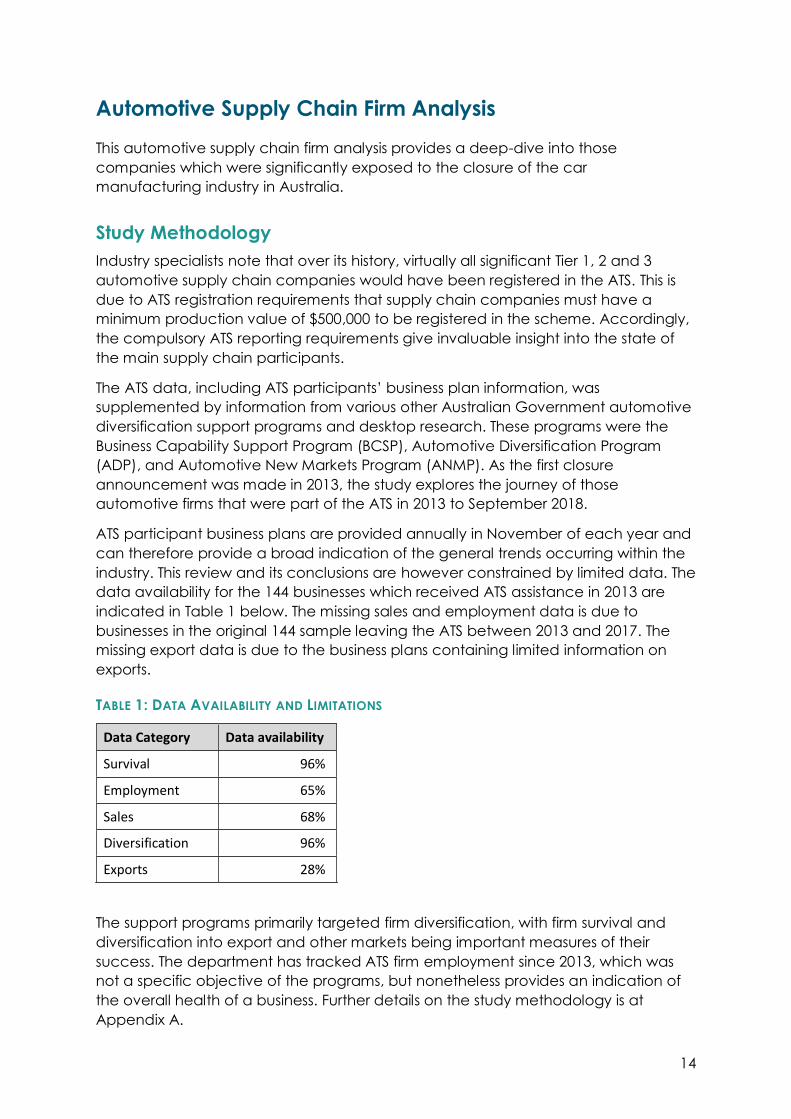
TABLE 1: DATA AVAILABILITY AND LIMITATIONS
Data Category Data availability
Survival 96%
Employment 65%
Sales 68%
Diversification 96%
Exports 28%
The support programs primarily targeted firm diversification, with firm survival and
diversification into export and other markets being important measures of their
success. The department has tracked ATS firm employment since 2013, which was
not a specific objective of the programs, but nonetheless provides an indication of
the overall health of a business. Further details on the study methodology is at
Appendix A.
15
In November 2018 a supplementary survey was issued to the 57 remaining ATS supply
chain registrants. The survey collected current data on sales and employment one
year out from the MVP closures. In particular, the survey requested more detailed
financial data - including a breakdown of total sales by Australian passenger motor
vehicle (PMV) original equipment (OE), non-auto products, and exports. The
submitted 2018 sales data contained three quarters of actual sales and one quarter
of forecast sales data.
Forty businesses (of the 144 study group) submitted a valid survey response. There is a
question over how representative the respondents are of the larger group, given 16
experienced sales growth over the last five years. Of the 50 firms no longer registered
in the ATS, the 2017 business plans indicated a much greater decrease in sales and
employment than the 57 remaining.
Analysis of Firm Survival
Table 2 summarises the survival rates of the 144 businesses in the sample.
TABLE 2: SURVIVAL RATE BY BUSINESS TYPE (UP TO JANUARY 2018)
Business Status Australian Owned Multinational Unknown Totals
In Business 78 (1 to close in 2018) 36 (6 to close in 2018) - 114
Ceased Trading 10 14 - 24
Unknown 2 2 2 6
Totals 90 52 2 144
Excluding the businesses that were winding down in 2018, by January 2018:
o 107 out of 144, or 74 per cent, of businesses were still trading;
o 86 per cent of Australian owned businesses were still trading; and
o 58 per cent of multinational businesses were trading.
Table 2 shows that the multinational businesses were impacted more by the MVP
closures compared to the Australian-owned businesses. That is, according to
November 2017 business plans and desktop research conducted in January 2018,
38 per cent of multinational businesses had ceased operations in Australia or were in
the process of winding down, whereas only 12 per cent of Australian businesses
closed down or were in the process of doing so.
A 2018 review undertaken for DIIS identified that 60 per cent of tier one suppliers
were less than ten per cent diversified6, deriving over 90 per cent of their income
from sales to the three MVPs. There was a concentration of multinational businesses
in the first tier supply chain. The greater impact of the MVP closures on the
multinationals seen in Table 2 is consistent with this result.
6 Siede, L. (2018), The Appropriateness & Effectiveness of Government Funding provided to
the Australian Automotive Supply Chain
16
This observation is seen in other aspects of the data. As discussed in the following
sections, the automotive sales and employment numbers of the multinationals
declined more rapidly than the Australian-owned businesses over the same 2013-
2017 period.
Analysis of Employment Levels and Automotive Sales
According to available employment data on 92 supply chain firms in 2013, 11,921
persons were employed. By the end of 2017 this had reduced to 7,874 (note: this
sub-set covers firms that provided data in both periods). This change in employment
reflects the declining production levels over the wind-down period.
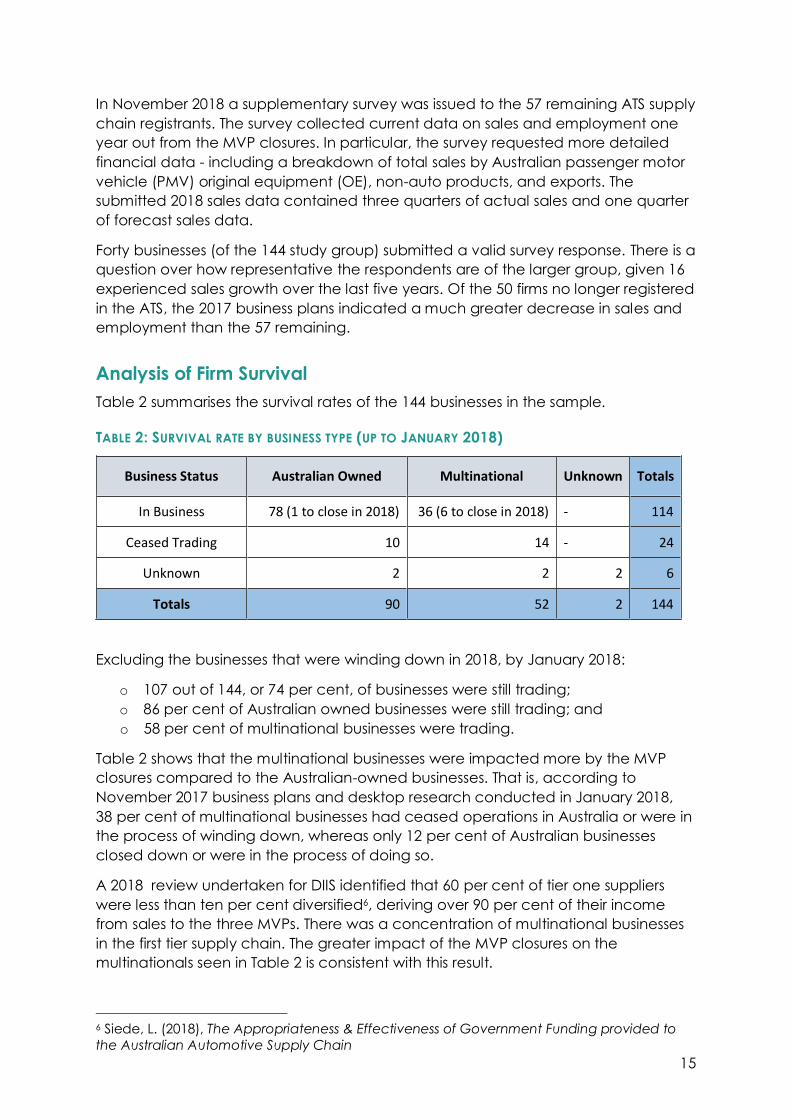
The following plot (Figure 1) shows employment by year for Australian owned and
multinational businesses. Note that this plot includes data from five businesses which
were in the process of ceasing operations in 2018. All five of these businesses are
multinationals and between them employ approximately 390 persons.
FIGURE 1: EMPLOYEE COUNT BY BUSINESS TYPE OVER TIME
The plot reveals a downward trend in employee counts of both Australian and
multinational companies. The larger fall in multinational companies is consistent with
the multinational business survival rates in Table 2. Data indicates that although there
were fewer multinationals, they had many more employees.
A similar industry performance indicator to employment is automotive sales. The
following plot summarises the total automotive sales by year for Australian owned
and multinational businesses. The numbers are from 98 companies registered in the
ATS in 2013 for which sales data exists for 2013-2017.
0
1
2
3
4
5
6
7
8
2013 2014 2015 2016 2017
Em
plo
ye
e C
ou
nt
(000
's)
Australian Owned Multinational
17
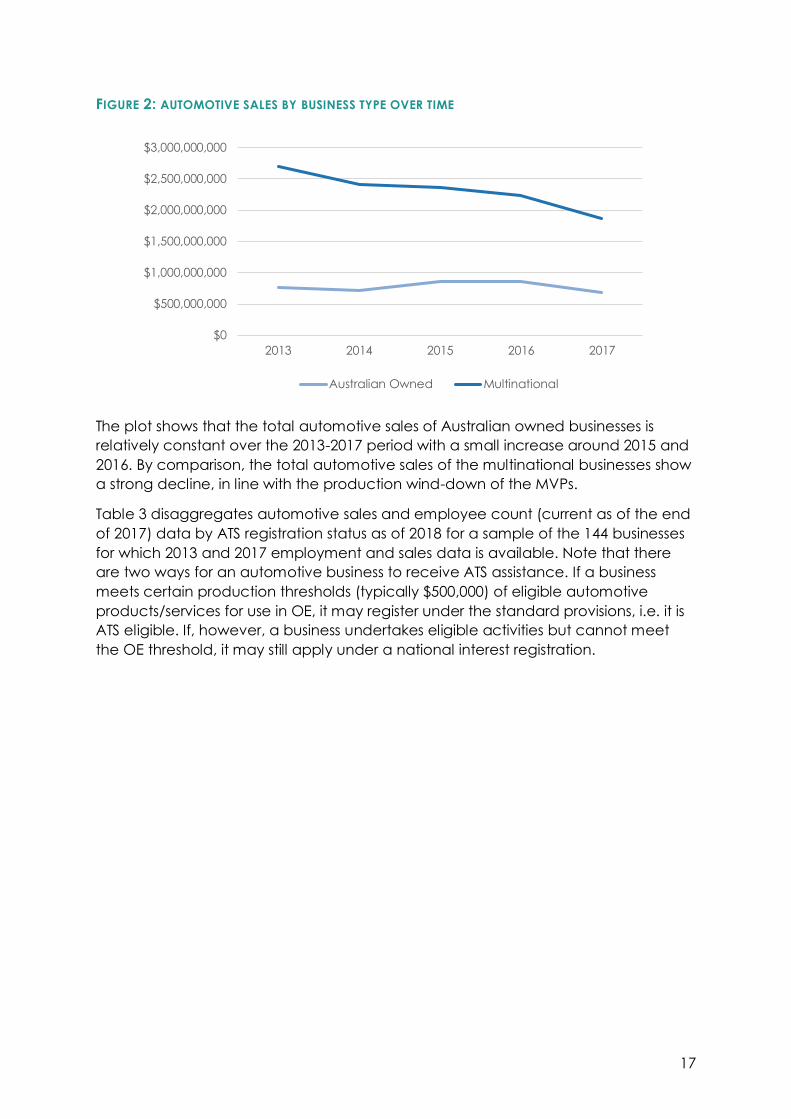
FIGURE 2: AUTOMOTIVE SALES BY BUSINESS TYPE OVER TIME
The plot shows that the total automotive sales of Australian owned businesses is
relatively constant over the 2013-2017 period with a small increase around 2015 and
2016. By comparison, the total automotive sales of the multinational businesses show
a strong decline, in line with the production wind-down of the MVPs.
Table 3 disaggregates automotive sales and employee count (current as of the end
of 2017) data by ATS registration status as of 2018 for a sample of the 144 businesses
for which 2013 and 2017 employment and sales data is available. Note that there
are two ways for an automotive business to receive ATS assistance. If a business
meets certain production thresholds (typically $500,000) of eligible automotive
products/services for use in OE, it may register under the standard provisions, i.e. it is
ATS eligible. If, however, a business undertakes eligible activities but cannot meet
the OE threshold, it may still apply under a national interest registration.
$0
$500,000,000
$1,000,000,000
$1,500,000,000
$2,000,000,000
$2,500,000,000
$3,000,000,000
2013 2014 2015 2016 2017
Australian Owned Multinational
18
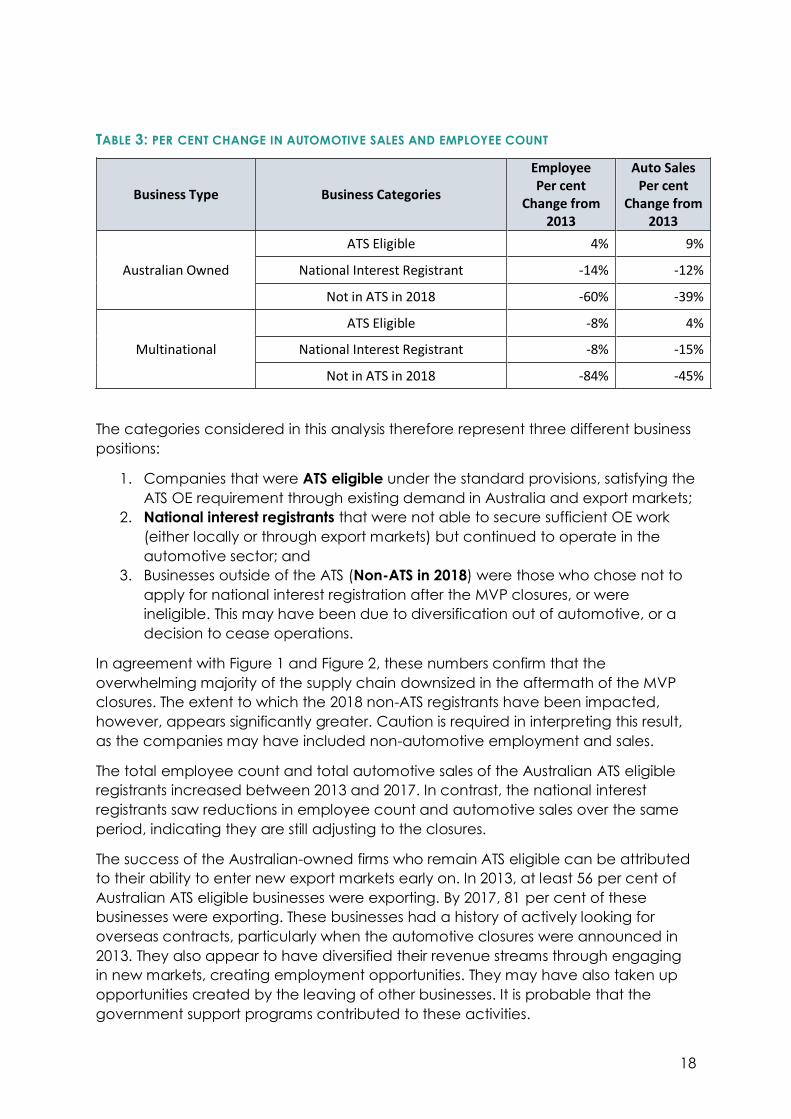
TABLE 3: PER CENT CHANGE IN AUTOMOTIVE SALES AND EMPLOYEE COUNT
Business Type Business Categories
Employee Per cent
Change from 2013
Auto Sales Per cent
Change from 2013
Australian Owned
ATS Eligible 4% 9%
National Interest Registrant -14% -12%
Not in ATS in 2018 -60% -39%
Multinational
ATS Eligible -8% 4%
National Interest Registrant -8% -15%
Not in ATS in 2018 -84% -45%
The categories considered in this analysis therefore represent three different business
positions:
1. Companies that were ATS eligible under the standard provisions, satisfying the
ATS OE requirement through existing demand in Australia and export markets;
2. National interest registrants that were not able to secure sufficient OE work
(either locally or through export markets) but continued to operate in the
automotive sector; and
3. Businesses outside of the ATS (Non-ATS in 2018) were those who chose not to
apply for national interest registration after the MVP closures, or were
ineligible. This may have been due to diversification out of automotive, or a
decision to cease operations.
In agreement with Figure 1 and Figure 2, these numbers confirm that the
overwhelming majority of the supply chain downsized in the aftermath of the MVP
closures. The extent to which the 2018 non-ATS registrants have been impacted,
however, appears significantly greater. Caution is required in interpreting this result,
as the companies may have included non-automotive employment and sales.
The total employee count and total automotive sales of the Australian ATS eligible
registrants increased between 2013 and 2017. In contrast, the national interest
registrants saw reductions in employee count and automotive sales over the same
period, indicating they are still adjusting to the closures.
The success of the Australian-owned firms who remain ATS eligible can be attributed
to their ability to enter new export markets early on. In 2013, at least 56 per cent of
Australian ATS eligible businesses were exporting. By 2017, 81 per cent of these
businesses were exporting. These businesses had a history of actively looking for
overseas contracts, particularly when the automotive closures were announced in
2013. They also appear to have diversified their revenue streams through engaging
in new markets, creating employment opportunities. They may have also taken up
opportunities created by the leaving of other businesses. It is probable that the
government support programs contributed to these activities.
19
Business plan information suggests that National Interest registrants did not increase
exports to the same level during the transition period. Of the 34 National Interest
registrants in the sample of 144, at least 24 per cent were exporting in 2013. By 2017,
this increased to at least 33 per cent. In 2018 these companies were exploring
overseas opportunities and diversification into other industry sectors. The national
interest applications also stressed the importance of ATS assistance for their ongoing
diversification, employment creation, and export activities.
The outcome for the multinational businesses was similar. The national interest
registrants saw drops in both sales and employee count, while the ATS eligible
registrants saw reductions in employee count but growth in sales. The result for the
multinational businesses is largely consistent with the overall downward trend in
employee count (corresponding to these businesses ceasing operations in Australia).
It is worth noting that between individual businesses in the above categories, there is
often large variation in the percentage change of sales and employee count,
i.e., the businesses in the dataset responded in a variety of ways. The numbers
above are therefore indicative only and do not represent the ‘typical’ experience of
an individual business.
The ‘non-ATS 2018’ group shows significant drops in employee count and
automotive sales between 2013 and 2017. While the drop in automotive sales can
be expected, the drop in employment is less conclusive due to the lack of
employment data available once a firm is no longer in the ATS. These firms may
have diversified out of automotive altogether, or set up other companies to carry on
operations.
20
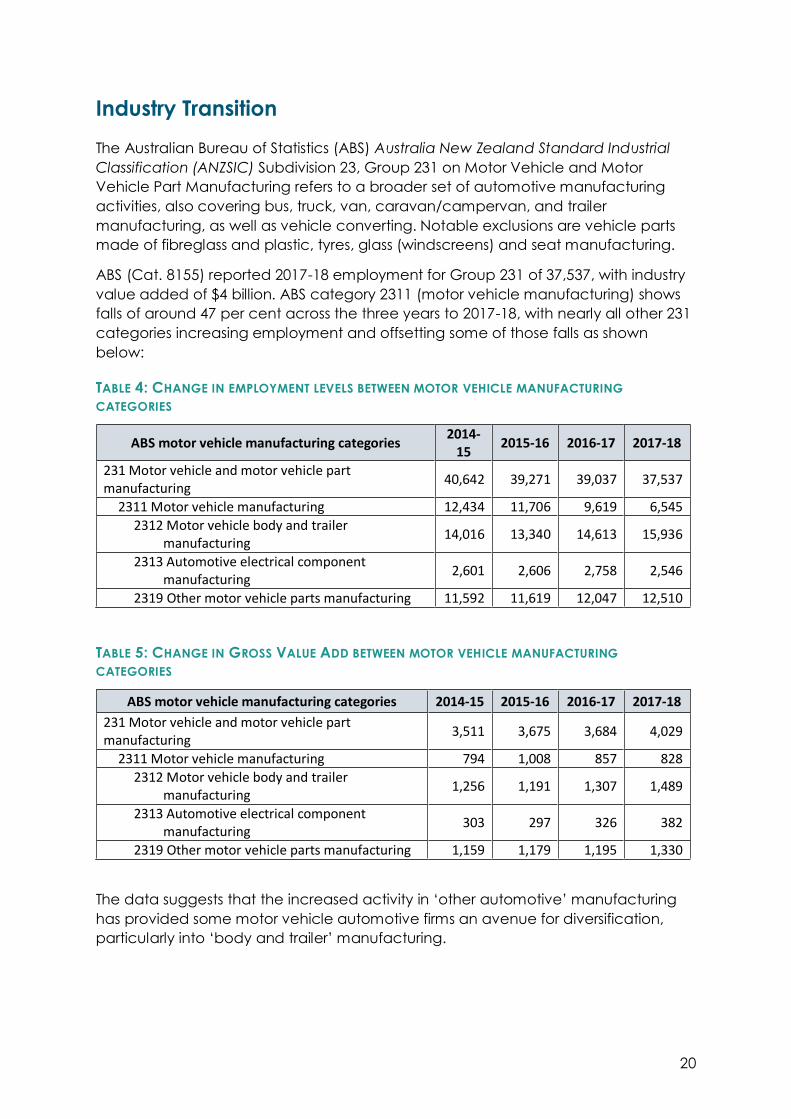
Industry Transition
The Australian Bureau of Statistics (ABS) Australia New Zealand Standard Industrial
Classification (ANZSIC) Subdivision 23, Group 231 on Motor Vehicle and Motor
Vehicle Part Manufacturing refers to a broader set of automotive manufacturing
activities, also covering bus, truck, van, caravan/campervan, and trailer
manufacturing, as well as vehicle converting. Notable exclusions are vehicle parts
made of fibreglass and plastic, tyres, glass (windscreens) and seat manufacturing.
ABS (Cat. 8155) reported 2017-18 employment for Group 231 of 37,537, with industry
value added of $4 billion. ABS category 2311 (motor vehicle manufacturing) shows
falls of around 47 per cent across the three years to 2017-18, with nearly all other 231
categories increasing employment and offsetting some of those falls as shown
below:
TABLE 4: CHANGE IN EMPLOYMENT LEVELS BETWEEN MOTOR VEHICLE MANUFACTURING
CATEGORIES
ABS motor vehicle manufacturing categories 2014-
15 2015-16 2016-17 2017-18
231 Motor vehicle and motor vehicle part manufacturing
40,642 39,271 39,037 37,537
2311 Motor vehicle manufacturing 12,434 11,706 9,619 6,545
2312 Motor vehicle body and trailer manufacturing
14,016 13,340 14,613 15,936
2313 Automotive electrical component manufacturing
2,601 2,606 2,758 2,546
2319 Other motor vehicle parts manufacturing 11,592 11,619 12,047 12,510
TABLE 5: CHANGE IN GROSS VALUE ADD BETWEEN MOTOR VEHICLE MANUFACTURING
CATEGORIES
ABS motor vehicle manufacturing categories 2014-15 2015-16 2016-17 2017-18
231 Motor vehicle and motor vehicle part manufacturing
3,511 3,675 3,684 4,029
2311 Motor vehicle manufacturing 794 1,008 857 828
2312 Motor vehicle body and trailer manufacturing
1,256 1,191 1,307 1,489
2313 Automotive electrical component manufacturing
303 297 326 382
2319 Other motor vehicle parts manufacturing 1,159 1,179 1,195 1,330
The data suggests that the increased activity in ‘other automotive’ manufacturing
has provided some motor vehicle automotive firms an avenue for diversification,
particularly into ‘body and trailer’ manufacturing.
21
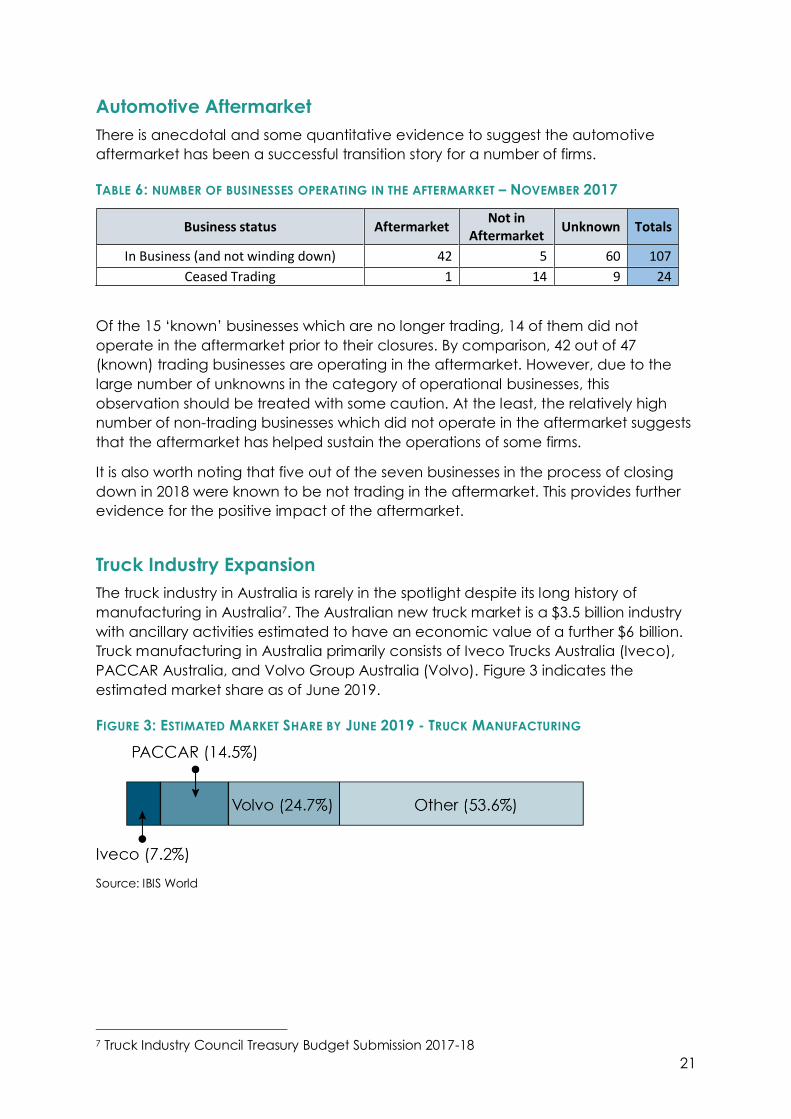
Automotive Aftermarket
There is anecdotal and some quantitative evidence to suggest the automotive
aftermarket has been a successful transition story for a number of firms.
TABLE 6: NUMBER OF BUSINESSES OPERATING IN THE AFTERMARKET – NOVEMBER 2017
Business status Aftermarket Not in
Aftermarket Unknown Totals
In Business (and not winding down) 42 5 60 107
Ceased Trading 1 14 9 24
Of the 15 ‘known’ businesses which are no longer trading, 14 of them did not
operate in the aftermarket prior to their closures. By comparison, 42 out of 47
(known) trading businesses are operating in the aftermarket. However, due to the
large number of unknowns in the category of operational businesses, this
observation should be treated with some caution. At the least, the relatively high
number of non-trading businesses which did not operate in the aftermarket suggests
that the aftermarket has helped sustain the operations of some firms.
It is also worth noting that five out of the seven businesses in the process of closing
down in 2018 were known to be not trading in the aftermarket. This provides further
evidence for the positive impact of the aftermarket.
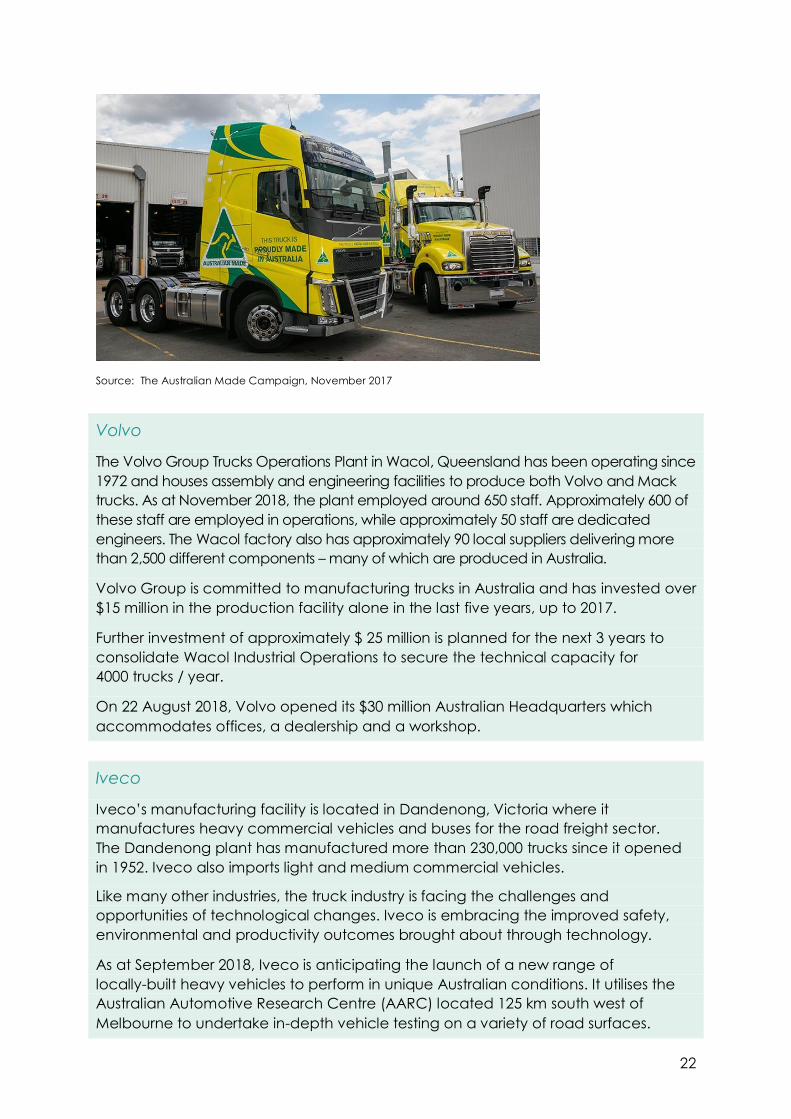
Truck Industry Expansion
The truck industry in Australia is rarely in the spotlight despite its long history of
manufacturing in Australia7. The Australian new truck market is a $3.5 billion industry
with ancillary activities estimated to have an economic value of a further $6 billion.
Truck manufacturing in Australia primarily consists of Iveco Trucks Australia (Iveco),
PACCAR Australia, and Volvo Group Australia (Volvo). Figure 3 indicates the
estimated market share as of June 2019.
FIGURE 3: ESTIMATED MARKET SHARE BY JUNE 2019 - TRUCK MANUFACTURING
Source: IBIS World
7 Truck Industry Council Treasury Budget Submission 2017-18
22
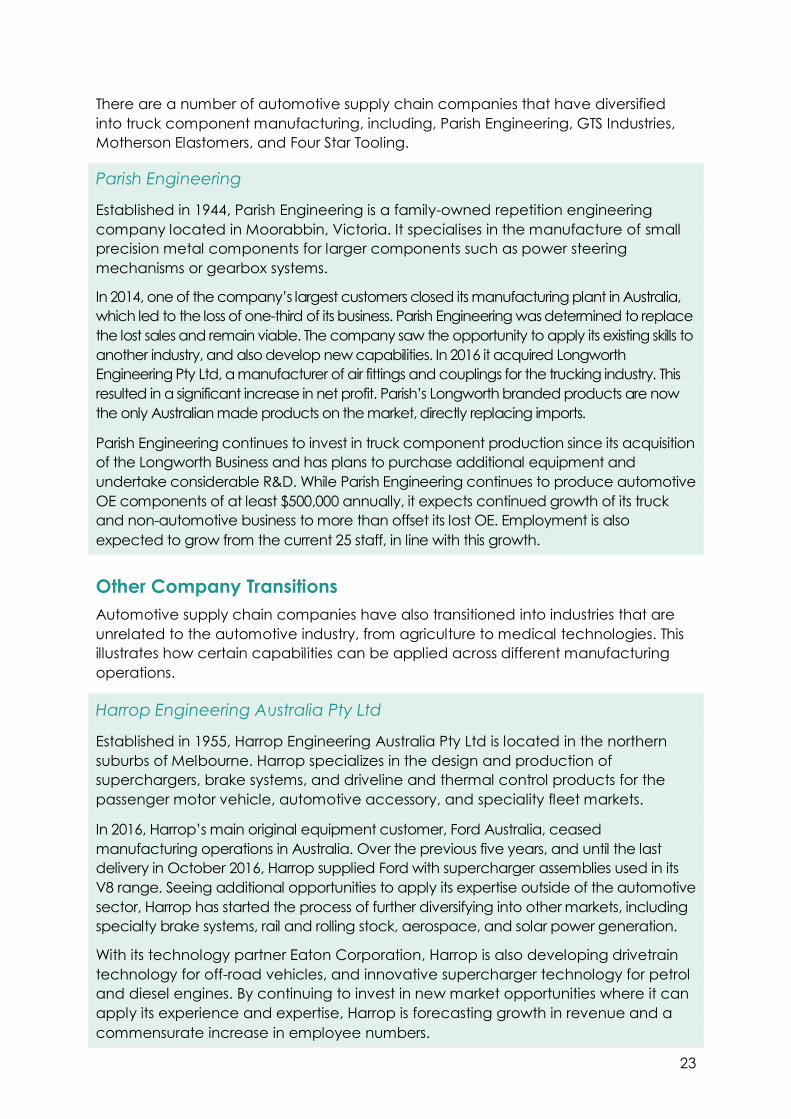
Source: The Australian Made Campaign, November 2017
Volvo
The Volvo Group Trucks Operations Plant in Wacol, Queensland has been operating since
1972 and houses assembly and engineering facilities to produce both Volvo and Mack
trucks. As at November 2018, the plant employed around 650 staff. Approximately 600 of
these staff are employed in operations, while approximately 50 staff are dedicated
engineers. The Wacol factory also has approximately 90 local suppliers delivering more
than 2,500 different components – many of which are produced in Australia.
Volvo Group is committed to manufacturing trucks in Australia and has invested over
$15 million in the production facility alone in the last five years, up to 2017.
Further investment of approximately $ 25 million is planned for the next 3 years to
consolidate Wacol Industrial Operations to secure the technical capacity for
4000 trucks / year.
On 22 August 2018, Volvo opened its $30 million Australian Headquarters which
accommodates offices, a dealership and a workshop.
Iveco
Iveco’s manufacturing facility is located in Dandenong, Victoria where it
manufactures heavy commercial vehicles and buses for the road freight sector.
The Dandenong plant has manufactured more than 230,000 trucks since it opened
in 1952. Iveco also imports light and medium commercial vehicles.
Like many other industries, the truck industry is facing the challenges and
opportunities of technological changes. Iveco is embracing the improved safety,
environmental and productivity outcomes brought about through technology.
As at September 2018, Iveco is anticipating the launch of a new range of
locally-built heavy vehicles to perform in unique Australian conditions. It utilises the
Australian Automotive Research Centre (AARC) located 125 km south west of
Melbourne to undertake in-depth vehicle testing on a variety of road surfaces.
23
There are a number of automotive supply chain companies that have diversified
into truck component manufacturing, including, Parish Engineering, GTS Industries,
Motherson Elastomers, and Four Star Tooling.
Parish Engineering
Established in 1944, Parish Engineering is a family-owned repetition engineering
company located in Moorabbin, Victoria. It specialises in the manufacture of small
precision metal components for larger components such as power steering
mechanisms or gearbox systems.
In 2014, one of the company’s largest customers closed its manufacturing plant in Australia,
which led to the loss of one-third of its business. Parish Engineering was determined to replace
the lost sales and remain viable. The company saw the opportunity to apply its existing skills to
another industry, and also develop new capabilities. In 2016 it acquired Longworth
Engineering Pty Ltd, a manufacturer of air fittings and couplings for the trucking industry. This
resulted in a significant increase in net profit. Parish’s Longworth branded products are now
the only Australian made products on the market, directly replacing imports.
Parish Engineering continues to invest in truck component production since its acquisition
of the Longworth Business and has plans to purchase additional equipment and
undertake considerable R&D. While Parish Engineering continues to produce automotive
OE components of at least $500,000 annually, it expects continued growth of its truck
and non-automotive business to more than offset its lost OE. Employment is also
expected to grow from the current 25 staff, in line with this growth.
Other Company Transitions
Automotive supply chain companies have also transitioned into industries that are
unrelated to the automotive industry, from agriculture to medical technologies. This
illustrates how certain capabilities can be applied across different manufacturing
operations.
Harrop Engineering Australia Pty Ltd
Established in 1955, Harrop Engineering Australia Pty Ltd is located in the northern
suburbs of Melbourne. Harrop specializes in the design and production of
superchargers, brake systems, and driveline and thermal control products for the
passenger motor vehicle, automotive accessory, and speciality fleet markets.
In 2016, Harrop’s main original equipment customer, Ford Australia, ceased
manufacturing operations in Australia. Over the previous five years, and until the last
delivery in October 2016, Harrop supplied Ford with supercharger assemblies used in its
V8 range. Seeing additional opportunities to apply its expertise outside of the automotive
sector, Harrop has started the process of further diversifying into other markets, including
specialty brake systems, rail and rolling stock, aerospace, and solar power generation.
With its technology partner Eaton Corporation, Harrop is also developing drivetrain
technology for off-road vehicles, and innovative supercharger technology for petrol
and diesel engines. By continuing to invest in new market opportunities where it can
apply its experience and expertise, Harrop is forecasting growth in revenue and a
commensurate increase in employee numbers.
24
Other companies have grown their export markets.
Robert Bosch (Australia) Pty Ltd
The Bosch Group has had a presence in Australia since 1907 establishing its first wholly
owned subsidiary, Robert Bosch (Australia) Pty Ltd (Bosch), in 1954 to manufacture
components for the local automotive industry. Since the late 1990’s, Bosch has
manufactured automotive power diodes for global automotive customers.
With the closure of Australian passenger vehicle manufacturing, Bosch’s diodes business is
completely export oriented with customers in Europe, USA, India, China, Japan and
Korea amongst others. It supplies more than 120 million parts per year used in vehicle
alternators. This equates to approximately 20 per cent global market share.
A new business unit, Bosch Australia Manufacturing Solutions (BAMS) has been
established as a consequence of the shrinking local automotive market. BAMS
utilises decades of experience in automotive to build special purpose machines for
manufacturing companies. The new unit employs 55 people who address robotics
and automation demands in a variety of industries from automotive to medical
technologies, agriculture and food production.
Bosch in Australia maintains engineering units with approximately 190 dedicated
staff working on global automotive projects including new technologies in
automated driving, driver assistance and vehicle connectivity. R&D activities are at
levels similar to before the closure of Australian passenger vehicle manufacturing
with a proposed investment of $47 million in 2018. Bosch has a total Australian based
workforce of approximately 1400 people across manufacturing, engineering, trade
sales of consumer goods and new business activities.
MtM Pty Ltd (MtM)
Founded in 1965, MtM is a Melbourne-based engineering firm specialising in design,
project management and manufacture of complex assemblies. As a recognised
supplier of high quality components, MtM supplied to Ford, Holden, Toyota, Nissan
and Mitsubishi in Australia for over 30 years. Ford, Holden and Toyota utilised a wide
variety of MtM products including windscreen washer nozzles, doorhandles,
automatic gearshifts and steering columns in their vehicles.
With the closure of Nissan Australia in 1992, it was apparent the local automotive
industry was in decline. It was decided then that MtM must pursue export and non-
automotive business, looking for other customers outside the local passenger vehicle
industry, before securing MtM’s first export contract in 1997. In this process, MtM
adopted new materials and developed new products with the view of gaining more
export opportunities.
The company now exports components to a number of countries, including, China,
South Africa, South America, India, Thailand, and the Middle East. Since 2013, MtM has
managed to increase its total sales by around 50 per cent. In 2018, the company
expects to export over 95 per cent of its automotive products and 75 per cent of its
staff are dedicated automotive manufacturing, R&D and design employees.
25
Analysis of Transition Support from Government
Governments at all levels had been working closely with the automotive industry
prior to the closure announcements, with a range of support programs in place, as
described in Chart 1. This acknowledged the significant competitive pressures that
were threatening the viability of the industry, and that firm diversification invariably
takes years, if not decades.
Besides the ATS, the Australian Government provided assistance to the automotive
supply chain through four key programs, discussed below:
Automotive New Markets Program (ANMP)
The Automotive New Markets Initiative provided funding to supply chain
companies to broaden their customer and product base, both domestically
and through exports. The ANMP was a component of the New Markets
Initiative introduced in 2012, providing merit-based grants to businesses for
projects that broaden business capabilities and provide access to markets
internationally and domestically.
The program had protocols in place to identify those companies who were ‘in
the right mindset’ to invest in and seek new business opportunities. One of the
methods used to identify these companies was a track record of
implementing prior business capability development recommendations
provided through arms-length company assessments.
ANMP funded R&D activities; early-stage commercialisation; pre-production
development activities; re-tooling; proof-of-concept activities; and
embedding of Australian design and engineering employees. It was
co-funded by the Victorian and South Australian governments. It was
terminated early with remaining funding re-directed to the ADP. The funding
was in three rounds.
Business Capability Support Program (BCSP)
The BCSP was another component of the Automotive New Markets Initiative.
The BCSP provided ongoing support to companies to develop new
capabilities; improve their productivity; and apply current capabilities in new
ways. This included assisting companies to access new markets by supplying
to global automotive industry and/or entering non-automotive industries.
The capability support was provided through Automotive Supplier Excellence
Australia (ASEA), which was part of the Automotive Cooperative Research
Centre.
Automotive Diversification Program (ADP)
The objective of the ADP was to assist Australian automotive supply chain
companies diversify out of the domestic motor vehicle manufacturing sector.
In contrast to ANMP, the funding was only for investments in capital
equipment. The funding was provided in three rounds which were run in 2014
to 2015.
26
Advanced Manufacturing Growth Fund (AMGF)
The $47.5 million AMGF is part of the $100 million Advanced Manufacturing
Fund announced in May 2017. The funding is for up to a third of the project
cost to manufacturers in South Australia and Victoria for capital upgrades to
make their businesses more competitive through innovative processes and
equipment. As the AMGF projects are still ongoing, it will not be considered
here.
Available data from the ATS, ANMP, ADP, and the BCSP have been used to explore
the effect of government funding on the supply chain firms in transition.
Effect of Program Participation on Firm Survival and Employment
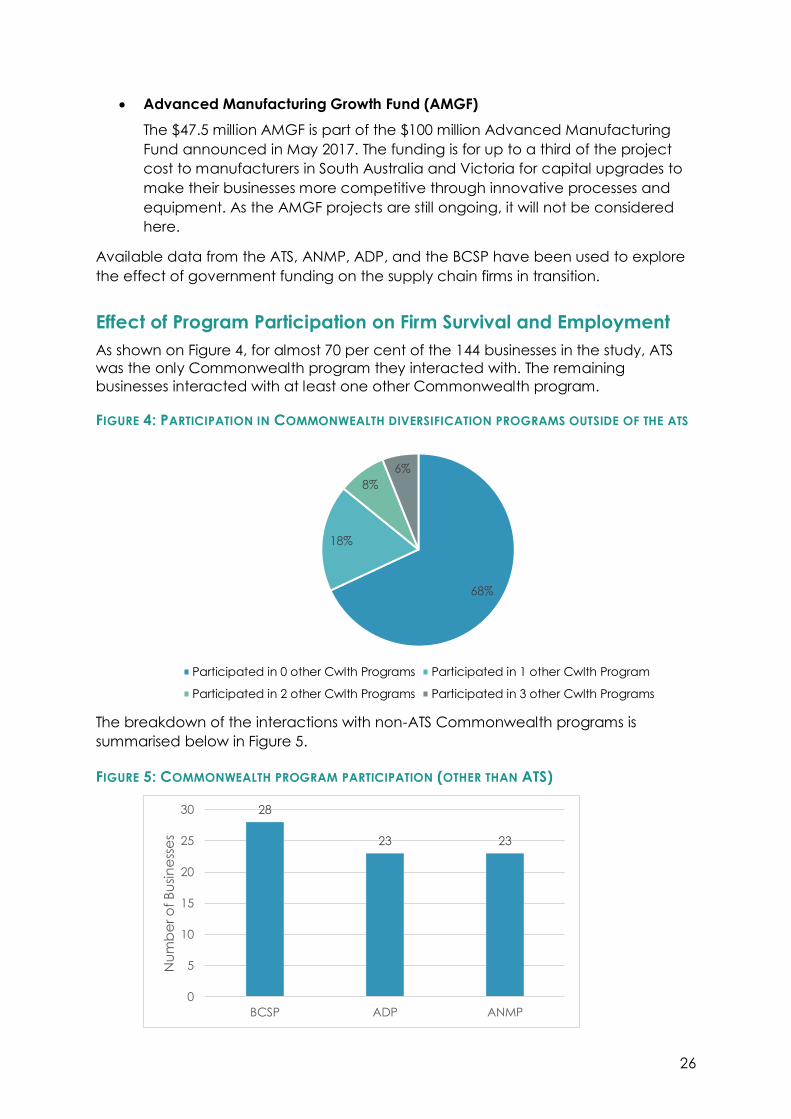
As shown on Figure 4, for almost 70 per cent of the 144 businesses in the study, ATS
was the only Commonwealth program they interacted with. The remaining
businesses interacted with at least one other Commonwealth program.
FIGURE 4: PARTICIPATION IN COMMONWEALTH DIVERSIFICATION PROGRAMS OUTSIDE OF THE ATS
The breakdown of the interactions with non-ATS Commonwealth programs is
summarised below in Figure 5.
FIGURE 5: COMMONWEALTH PROGRAM PARTICIPATION (OTHER THAN ATS)
68%
18%
8%
6%
Participated in 0 other Cwlth Programs Participated in 1 other Cwlth Program
Participated in 2 other Cwlth Programs Participated in 3 other Cwlth Programs
28
23 23
0
5
10
15
20
25
30
BCSP ADP ANMP
Nu
mb
er o
f B
usi
ne
sse
s
27
The ANMP, the ADP, and the BCSP appear to have been evenly interacted with
amongst the 46 businesses which interacted with at least one other Commonwealth
program other than the ATS.
It can be drawn from the data that funds allocated to the ANMP, ADP, and BCSP
were spent effectively as the majority of the firms who accessed these funds remain
in business post closures. Businesses still trading in late 2017 received $27,801,389 (or
87 per cent) in combined ANMP, ADP, and BCSP funding. In comparison, businesses
which closed down, or were in the process of closing down in 2018 received $4
million of the combined funding.
A similar result is seen when considering businesses that showed evidence of
diversification. Namely, $22,012,857 (or 69 per cent) of funding went to businesses
showing signs of diversification, while $9,788,532 (or 31 per cent) went to businesses
that did not show evidence of diversification.
While this distribution of funding does not conclusively demonstrate the
Commonwealth assistance programs had the intended effect, it does show an
association with business survival and diversification.
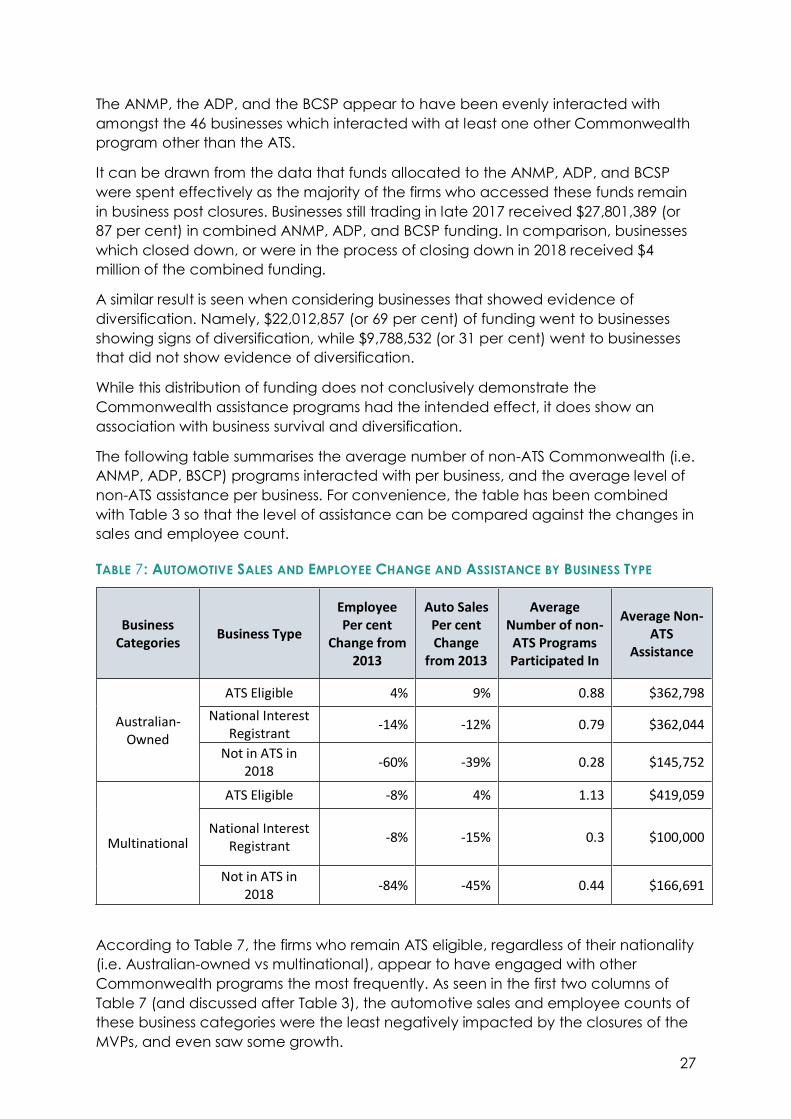
The following table summarises the average number of non-ATS Commonwealth (i.e.
ANMP, ADP, BSCP) programs interacted with per business, and the average level of
non-ATS assistance per business. For convenience, the table has been combined
with Table 3 so that the level of assistance can be compared against the changes in
sales and employee count.
TABLE 7: AUTOMOTIVE SALES AND EMPLOYEE CHANGE AND ASSISTANCE BY BUSINESS TYPE
Business Categories
Business Type
Employee Per cent
Change from 2013
Auto Sales Per cent Change
from 2013
Average Number of non-ATS Programs Participated In
Average Non-ATS
Assistance
Australian-Owned
ATS Eligible 4% 9% 0.88 $362,798
National Interest Registrant
-14% -12% 0.79 $362,044
Not in ATS in 2018
-60% -39% 0.28 $145,752
Multinational
ATS Eligible -8% 4% 1.13 $419,059
National Interest Registrant
-8% -15% 0.3 $100,000
Not in ATS in 2018
-84% -45% 0.44 $166,691
According to Table 7, the firms who remain ATS eligible, regardless of their nationality
(i.e. Australian-owned vs multinational), appear to have engaged with other
Commonwealth programs the most frequently. As seen in the first two columns of
Table 7 (and discussed after Table 3), the automotive sales and employee counts of
these business categories were the least negatively impacted by the closures of the
MVPs, and even saw some growth.
28
Table 7 therefore suggests that the number of programs accessed and assistance
received had an impact on a company’s auto sales and employee count between
2013 and 2017. The performance of the Australian-owned businesses not currently in
the ATS provides some additional support for this. Specifically, businesses in this
category saw significant drops in automotive sales and employee count between
2013 and 2017, and – according to Table 7 – also interacted with few
Commonwealth programs outside of the ATS.
The multinational businesses did not exactly follow this pattern. This could be due to
outside factors such as the level of control that a multinational had over their
Australian subsidiary’s operations.
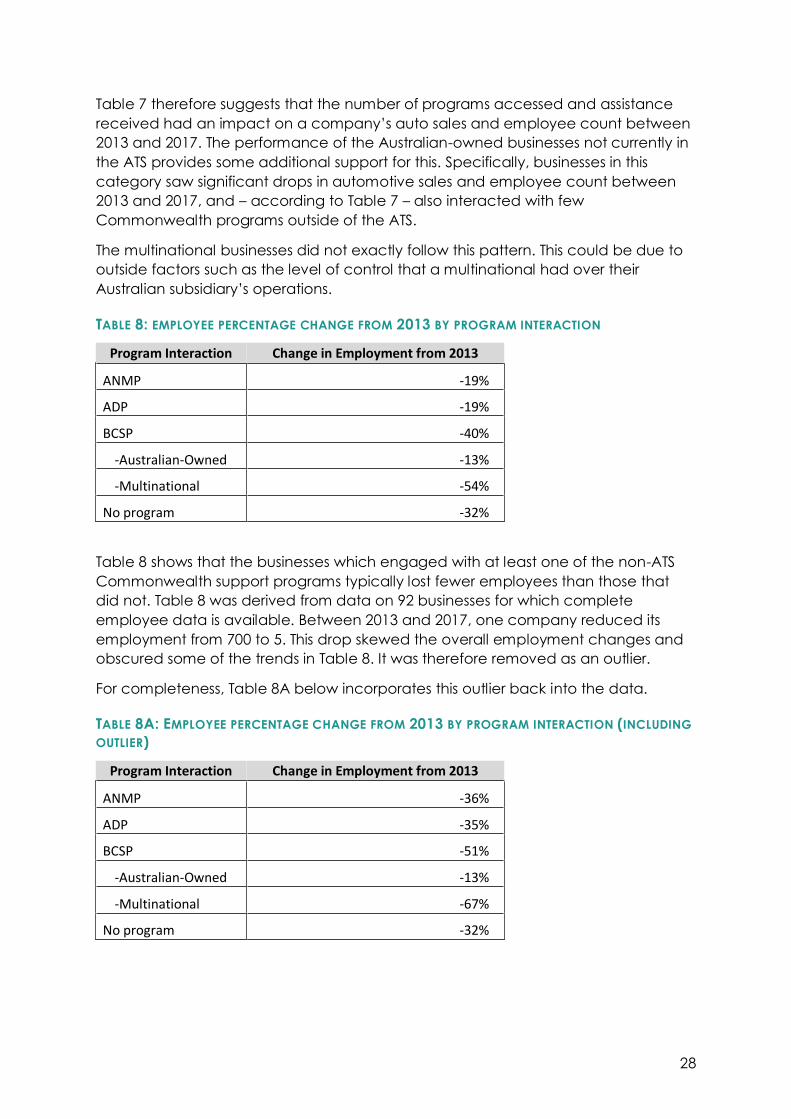
TABLE 8: EMPLOYEE PERCENTAGE CHANGE FROM 2013 BY PROGRAM INTERACTION
Program Interaction Change in Employment from 2013
ANMP -19%
ADP -19%
BCSP -40%
-Australian-Owned -13%
-Multinational -54%
No program -32%
Table 8 shows that the businesses which engaged with at least one of the non-ATS
Commonwealth support programs typically lost fewer employees than those that
did not. Table 8 was derived from data on 92 businesses for which complete
employee data is available. Between 2013 and 2017, one company reduced its
employment from 700 to 5. This drop skewed the overall employment changes and
obscured some of the trends in Table 8. It was therefore removed as an outlier.
For completeness, Table 8A below incorporates this outlier back into the data.
TABLE 8A: EMPLOYEE PERCENTAGE CHANGE FROM 2013 BY PROGRAM INTERACTION (INCLUDING
OUTLIER)
Program Interaction Change in Employment from 2013
ANMP -36%
ADP -35%
BCSP -51%
-Australian-Owned -13%
-Multinational -67%
No program -32%
29
Considering just Table 8, of the three support programs under consideration, BCSP
participants were the only businesses which saw a greater drop in employee count
compared to those which did not take part in any program. However, when broken
down by Australian-owned vs multinational businesses, it is seen that Australian-
owned BCSP participants saw a drop in employees of 13 per cent, whereas
multinational participants saw a drop of 54 per cent. In other words, the
Australian-owned BCSP participants performed better than all other categories,
including the ‘no-program’ category. The BCSP employment percentage drop was
concentrated in the multinationals - consistent with a greater proportion of them
ceasing operations in Australia. This result is also consistent with other reporting on
the BCSP which noted a clear distinction between the performances of the
multinationals compared to the Australian-owned businesses.
Similar to the disclosures in the analysis of employment levels section above, the
findings in relation to employment in this section are not conclusive due to
inconsistencies in the employment data provided by the supply chain companies
(that is, some companies reported employment at the company level, while others
just reported automotive employment).
Effect of Program Participation on Diversification and Export
Markets
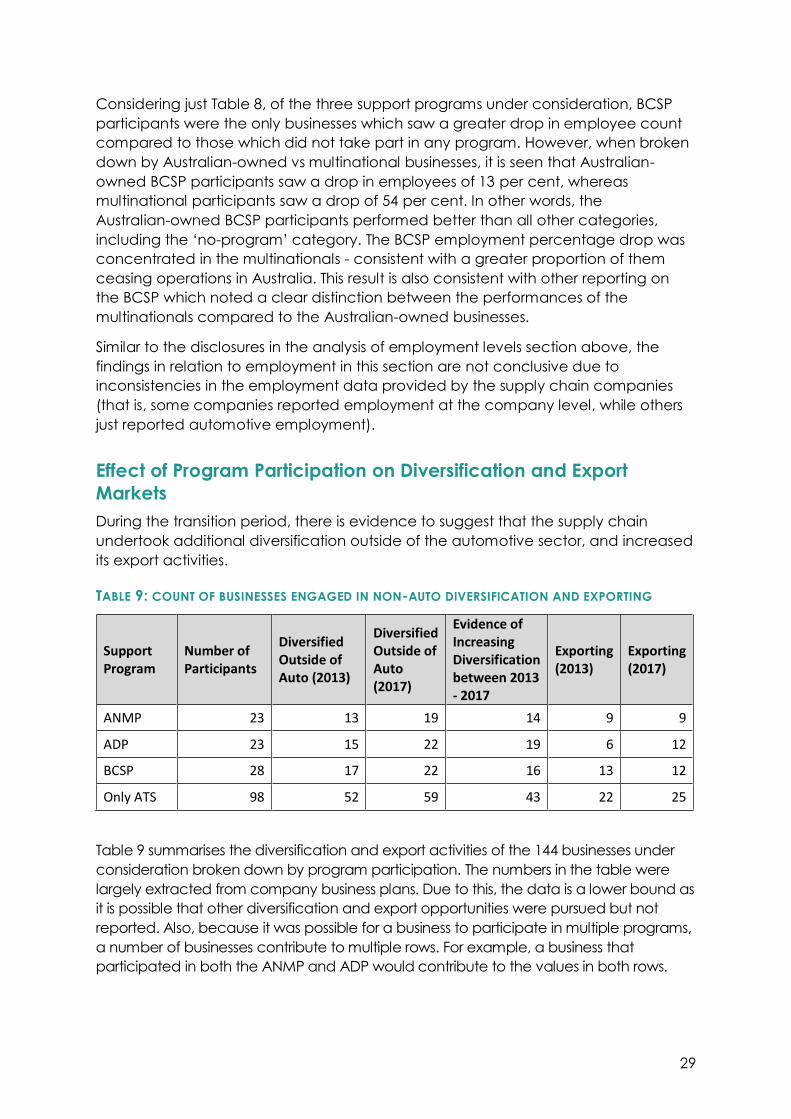
During the transition period, there is evidence to suggest that the supply chain
undertook additional diversification outside of the automotive sector, and increased
its export activities.
TABLE 9: COUNT OF BUSINESSES ENGAGED IN NON-AUTO DIVERSIFICATION AND EXPORTING
Support Program
Number of Participants
Diversified Outside of Auto (2013)
Diversified Outside of Auto (2017)
Evidence of Increasing Diversification between 2013 - 2017
Exporting (2013)
Exporting (2017)
ANMP 23 13 19 14 9 9
ADP 23 15 22 19 6 12
BCSP 28 17 22 16 13 12
Only ATS 98 52 59 43 22 25
Table 9 summarises the diversification and export activities of the 144 businesses under
consideration broken down by program participation. The numbers in the table were
largely extracted from company business plans. Due to this, the data is a lower bound as
it is possible that other diversification and export opportunities were pursued but not
reported. Also, because it was possible for a business to participate in multiple programs,
a number of businesses contribute to multiple rows. For example, a business that
participated in both the ANMP and ADP would contribute to the values in both rows.
30
The increases in the number of businesses engaged in diversification and export
across the categories suggests that the supply chain broadly made an effort to
minimise the impact of the MVP closures. Given that businesses interacted with
multiple programs, and the similarity between the numbers, it is difficult to say if one
group responded more strongly than another. The exact impact of the ATS and
other support programs on diversification and export activities in isolation is therefore
difficult to discern. The data does suggest, however, that the combined impact of
the government support programs had a positive effect and appeared to be
successful in their stated goals.
Intuitively, it is expected that businesses pursuing diversification would be less
severely impacted by the closures of the MVPs and would therefore be less likely to
see reductions in employee count. In this context, the results of Table 7 are consistent
with the numbers in Table 9, in that the assistance programs appear to have
increased levels of diversification, and those businesses which engaged most
strongly with the government programs showed evidence of smaller falls in
employee count.
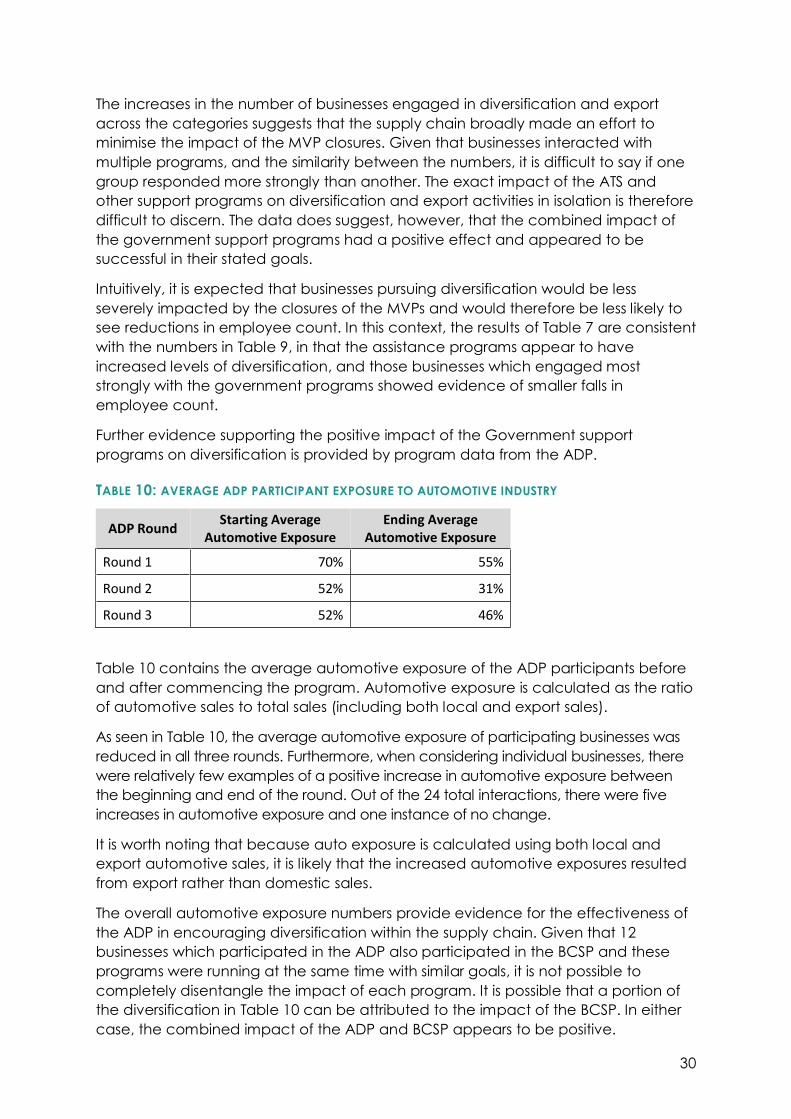
Further evidence supporting the positive impact of the Government support
programs on diversification is provided by program data from the ADP.
TABLE 10: AVERAGE ADP PARTICIPANT EXPOSURE TO AUTOMOTIVE INDUSTRY
ADP Round Starting Average
Automotive Exposure Ending Average
Automotive Exposure
Round 1 70% 55%
Round 2 52% 31%
Round 3 52% 46%
Table 10 contains the average automotive exposure of the ADP participants before
and after commencing the program. Automotive exposure is calculated as the ratio
of automotive sales to total sales (including both local and export sales).
As seen in Table 10, the average automotive exposure of participating businesses was
reduced in all three rounds. Furthermore, when considering individual businesses, there
were relatively few examples of a positive increase in automotive exposure between
the beginning and end of the round. Out of the 24 total interactions, there were five
increases in automotive exposure and one instance of no change.
It is worth noting that because auto exposure is calculated using both local and
export automotive sales, it is likely that the increased automotive exposures resulted
from export rather than domestic sales.
The overall automotive exposure numbers provide evidence for the effectiveness of
the ADP in encouraging diversification within the supply chain. Given that 12
businesses which participated in the ADP also participated in the BCSP and these
programs were running at the same time with similar goals, it is not possible to
completely disentangle the impact of each program. It is possible that a portion of
the diversification in Table 10 can be attributed to the impact of the BCSP. In either
case, the combined impact of the ADP and BCSP appears to be positive.
31
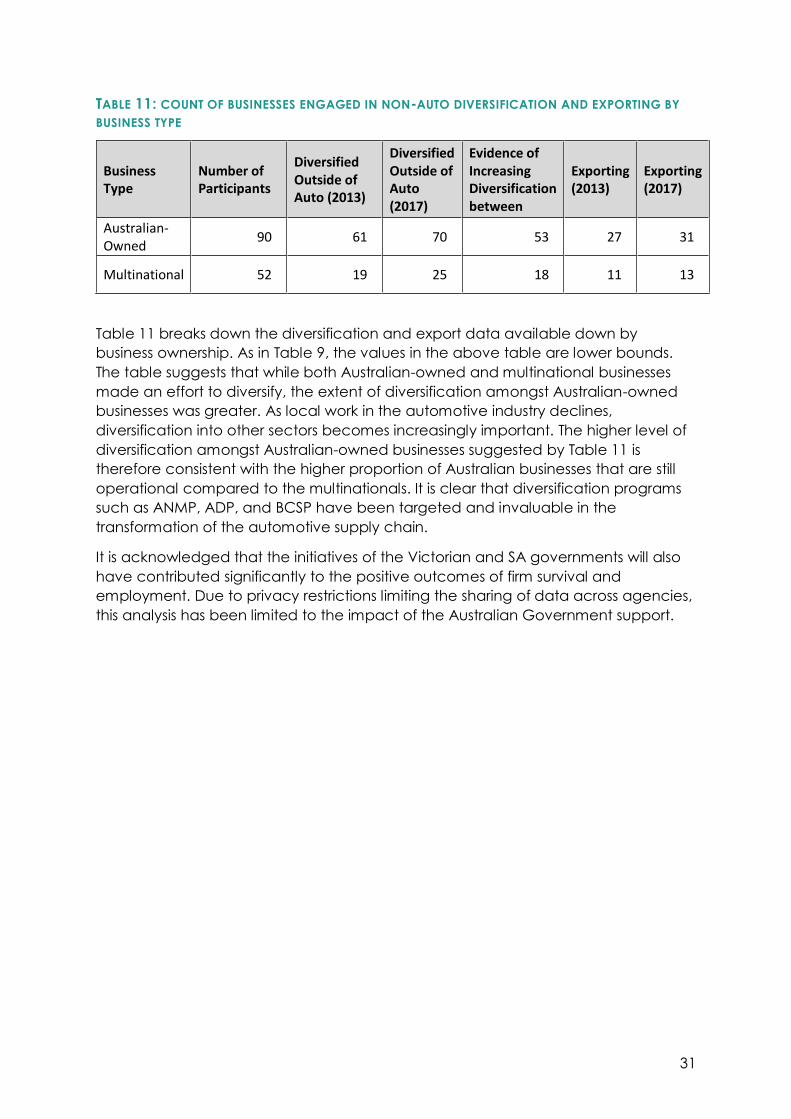
TABLE 11: COUNT OF BUSINESSES ENGAGED IN NON-AUTO DIVERSIFICATION AND EXPORTING BY
BUSINESS TYPE
Business Type
Number of Participants
Diversified Outside of Auto (2013)
Diversified Outside of Auto (2017)
Evidence of Increasing Diversification between
Exporting (2013)
Exporting (2017)
Australian-Owned
90 61 70 53 27 31
Multinational 52 19 25 18 11 13
Table 11 breaks down the diversification and export data available down by
business ownership. As in Table 9, the values in the above table are lower bounds.
The table suggests that while both Australian-owned and multinational businesses
made an effort to diversify, the extent of diversification amongst Australian-owned
businesses was greater. As local work in the automotive industry declines,
diversification into other sectors becomes increasingly important. The higher level of
diversification amongst Australian-owned businesses suggested by Table 11 is
therefore consistent with the higher proportion of Australian businesses that are still
operational compared to the multinationals. It is clear that diversification programs
such as ANMP, ADP, and BCSP have been targeted and invaluable in the
transformation of the automotive supply chain.
It is acknowledged that the initiatives of the Victorian and SA governments will also
have contributed significantly to the positive outcomes of firm survival and
employment. Due to privacy restrictions limiting the sharing of data across agencies,
this analysis has been limited to the impact of the Australian Government support.
32
2018 ATS Survey Update The following analysis is based on a supplementary survey issued to ATS registrants in
November 2018. As noted in the Study Methodology section, the survey sought
updated information on sales and employment, with 40 valid responses from the
remaining 57 ATS registrants.
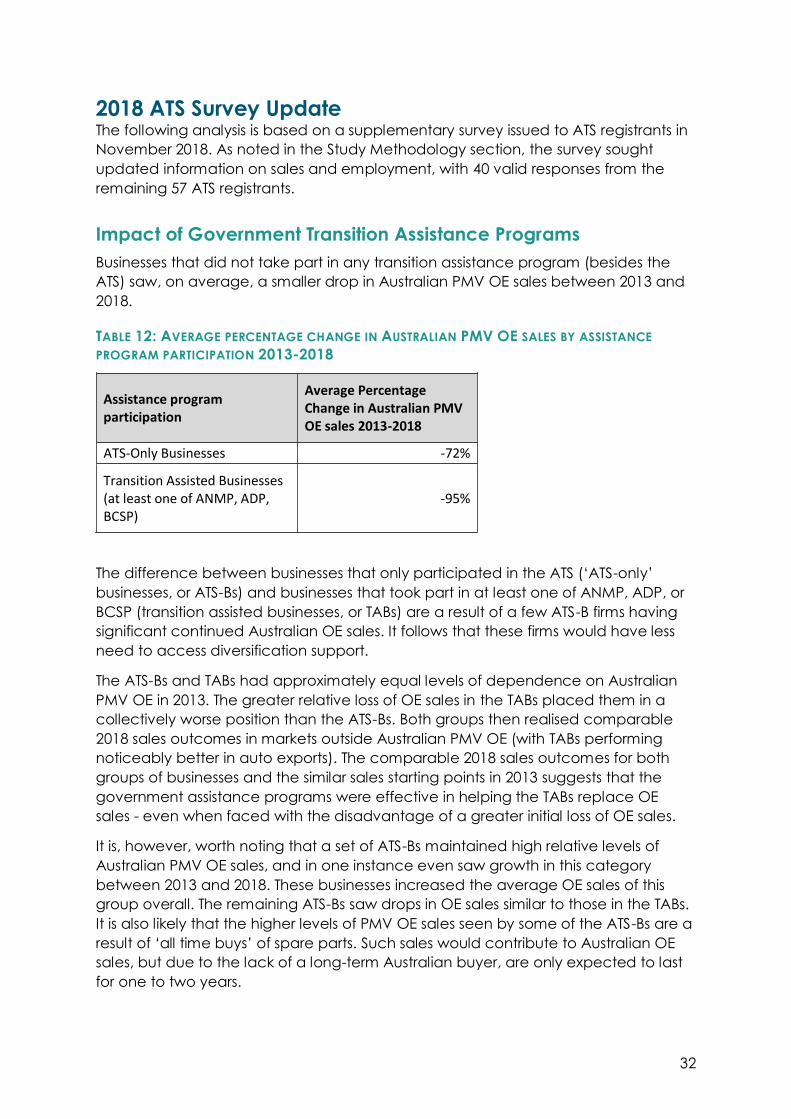
Impact of Government Transition Assistance Programs
Businesses that did not take part in any transition assistance program (besides the
ATS) saw, on average, a smaller drop in Australian PMV OE sales between 2013 and
2018.
TABLE 12: AVERAGE PERCENTAGE CHANGE IN AUSTRALIAN PMV OE SALES BY ASSISTANCE
PROGRAM PARTICIPATION 2013-2018
Assistance program participation
Average Percentage Change in Australian PMV OE sales 2013-2018
ATS-Only Businesses -72%
Transition Assisted Businesses (at least one of ANMP, ADP, BCSP)
-95%
The difference between businesses that only participated in the ATS (‘ATS-only’
businesses, or ATS-Bs) and businesses that took part in at least one of ANMP, ADP, or
BCSP (transition assisted businesses, or TABs) are a result of a few ATS-B firms having
significant continued Australian OE sales. It follows that these firms would have less
need to access diversification support.
The ATS-Bs and TABs had approximately equal levels of dependence on Australian
PMV OE in 2013. The greater relative loss of OE sales in the TABs placed them in a
collectively worse position than the ATS-Bs. Both groups then realised comparable
2018 sales outcomes in markets outside Australian PMV OE (with TABs performing
noticeably better in auto exports). The comparable 2018 sales outcomes for both
groups of businesses and the similar sales starting points in 2013 suggests that the
government assistance programs were effective in helping the TABs replace OE
sales - even when faced with the disadvantage of a greater initial loss of OE sales.
It is, however, worth noting that a set of ATS-Bs maintained high relative levels of
Australian PMV OE sales, and in one instance even saw growth in this category
between 2013 and 2018. These businesses increased the average OE sales of this
group overall. The remaining ATS-Bs saw drops in OE sales similar to those in the TABs.
It is also likely that the higher levels of PMV OE sales seen by some of the ATS-Bs are a
result of ‘all time buys’ of spare parts. Such sales would contribute to Australian OE
sales, but due to the lack of a long-term Australian buyer, are only expected to last
for one to two years.
33
There are likely errors in the data where survey respondents mistakenly labelled OE
exports as Australian OE, or characterised non-OE automotive products as OE. The
high levels of Australian OE reported by some ATS-Bs may therefore not be accurate,
with the implication being that these ATS-Bs actually lost similar levels of Australian
OE as the TABs. Accordingly, we should be cautious about drawing definite
conclusions on the success of the assistance programs based on this data.
Anecdotally, a number of TABs have commented on the value of the assistance
programs in helping them diversify. Further, as noted above, there is evidence to
suggest the TABs performed better in auto exports compared to the ATS-Bs. Given
the complexities involved in transition and diversification, the overall impact of the
assistance programs are likely best considered on a case-by-case basis.
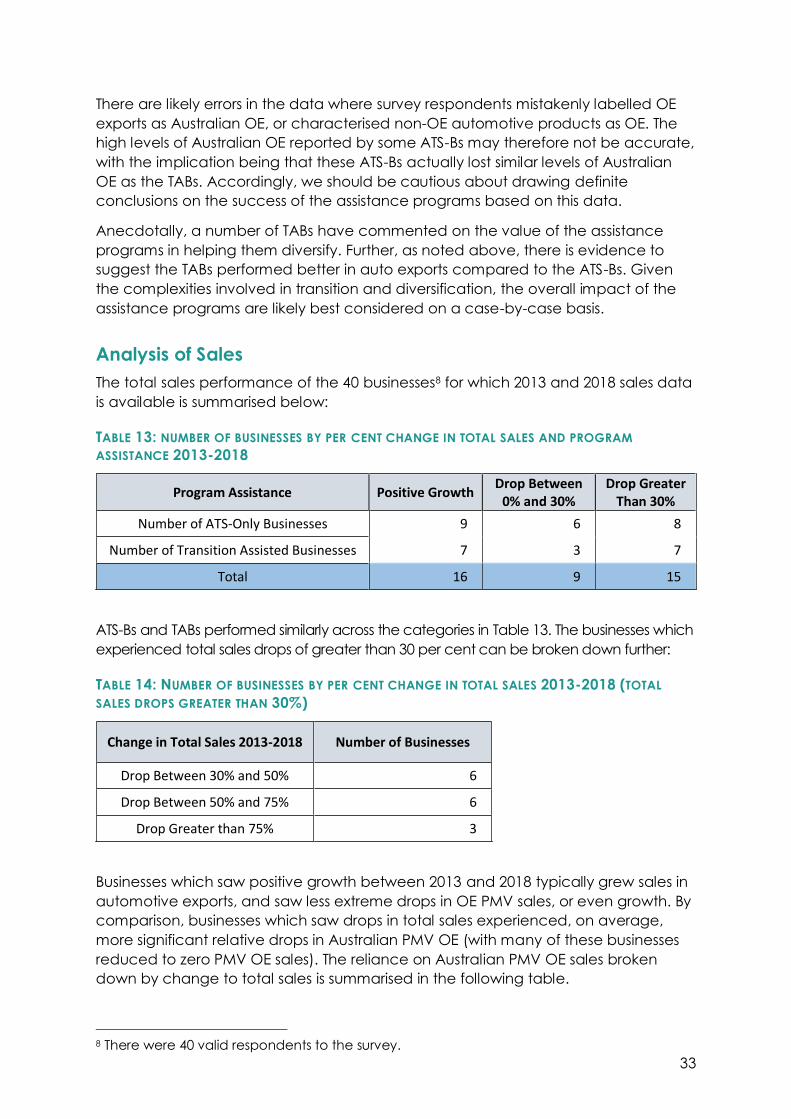
Analysis of Sales
The total sales performance of the 40 businesses8 for which 2013 and 2018 sales data
is available is summarised below:
TABLE 13: NUMBER OF BUSINESSES BY PER CENT CHANGE IN TOTAL SALES AND PROGRAM
ASSISTANCE 2013-2018
Program Assistance Positive Growth Drop Between
0% and 30% Drop Greater
Than 30%
Number of ATS-Only Businesses 9 6 8
Number of Transition Assisted Businesses 7 3 7
Total 16 9 15
ATS-Bs and TABs performed similarly across the categories in Table 13. The businesses which
experienced total sales drops of greater than 30 per cent can be broken down further:
TABLE 14: NUMBER OF BUSINESSES BY PER CENT CHANGE IN TOTAL SALES 2013-2018 (TOTAL
SALES DROPS GREATER THAN 30%)
Change in Total Sales 2013-2018 Number of Businesses
Drop Between 30% and 50% 6
Drop Between 50% and 75% 6
Drop Greater than 75% 3
Businesses which saw positive growth between 2013 and 2018 typically grew sales in
automotive exports, and saw less extreme drops in OE PMV sales, or even growth. By
comparison, businesses which saw drops in total sales experienced, on average,
more significant relative drops in Australian PMV OE (with many of these businesses
reduced to zero PMV OE sales). The reliance on Australian PMV OE sales broken
down by change to total sales is summarised in the following table.
8 There were 40 valid respondents to the survey.
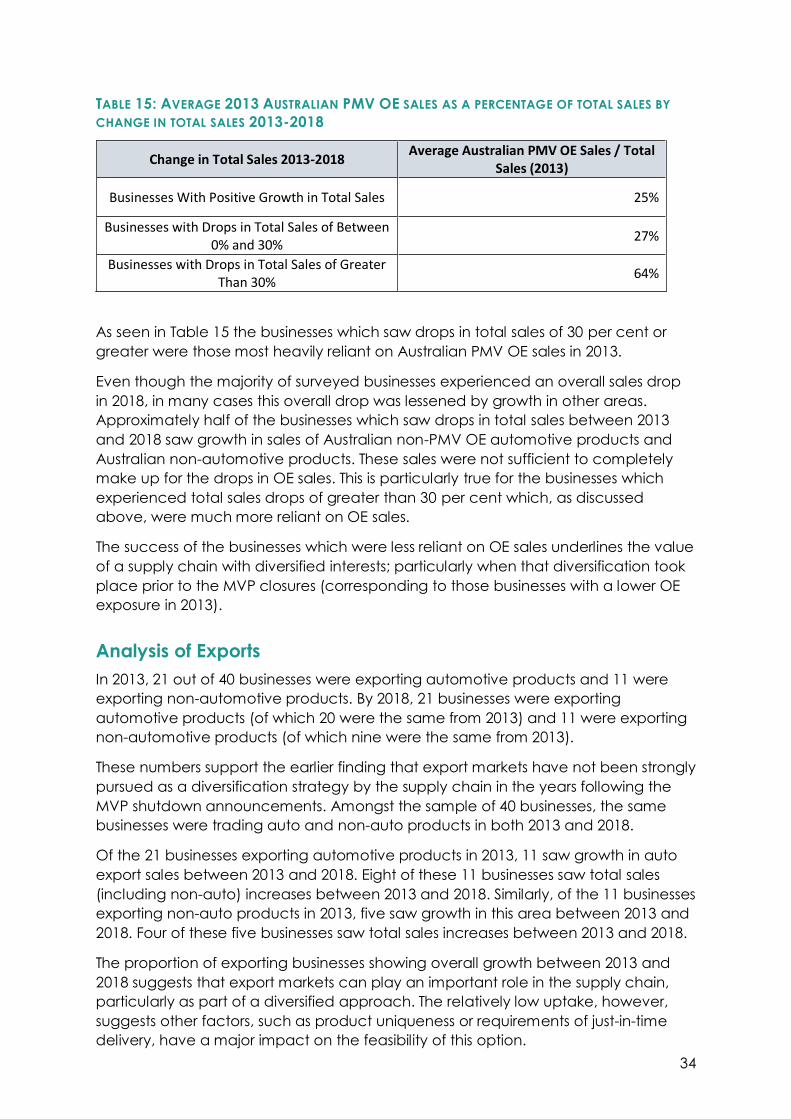
34
TABLE 15: AVERAGE 2013 AUSTRALIAN PMV OE SALES AS A PERCENTAGE OF TOTAL SALES BY
CHANGE IN TOTAL SALES 2013-2018
Change in Total Sales 2013-2018 Average Australian PMV OE Sales / Total
Sales (2013)
Businesses With Positive Growth in Total Sales 25%
Businesses with Drops in Total Sales of Between 0% and 30%
27%
Businesses with Drops in Total Sales of Greater Than 30%
64%
As seen in Table 15 the businesses which saw drops in total sales of 30 per cent or
greater were those most heavily reliant on Australian PMV OE sales in 2013.
Even though the majority of surveyed businesses experienced an overall sales drop
in 2018, in many cases this overall drop was lessened by growth in other areas.
Approximately half of the businesses which saw drops in total sales between 2013
and 2018 saw growth in sales of Australian non-PMV OE automotive products and
Australian non-automotive products. These sales were not sufficient to completely
make up for the drops in OE sales. This is particularly true for the businesses which
experienced total sales drops of greater than 30 per cent which, as discussed
above, were much more reliant on OE sales.
The success of the businesses which were less reliant on OE sales underlines the value
of a supply chain with diversified interests; particularly when that diversification took
place prior to the MVP closures (corresponding to those businesses with a lower OE
exposure in 2013).
Analysis of Exports
In 2013, 21 out of 40 businesses were exporting automotive products and 11 were
exporting non-automotive products. By 2018, 21 businesses were exporting
automotive products (of which 20 were the same from 2013) and 11 were exporting
non-automotive products (of which nine were the same from 2013).
These numbers support the earlier finding that export markets have not been strongly
pursued as a diversification strategy by the supply chain in the years following the
MVP shutdown announcements. Amongst the sample of 40 businesses, the same
businesses were trading auto and non-auto products in both 2013 and 2018.
Of the 21 businesses exporting automotive products in 2013, 11 saw growth in auto
export sales between 2013 and 2018. Eight of these 11 businesses saw total sales
(including non-auto) increases between 2013 and 2018. Similarly, of the 11 businesses
exporting non-auto products in 2013, five saw growth in this area between 2013 and
2018. Four of these five businesses saw total sales increases between 2013 and 2018.
The proportion of exporting businesses showing overall growth between 2013 and
2018 suggests that export markets can play an important role in the supply chain,
particularly as part of a diversified approach. The relatively low uptake, however,
suggests other factors, such as product uniqueness or requirements of just-in-time
delivery, have a major impact on the feasibility of this option.
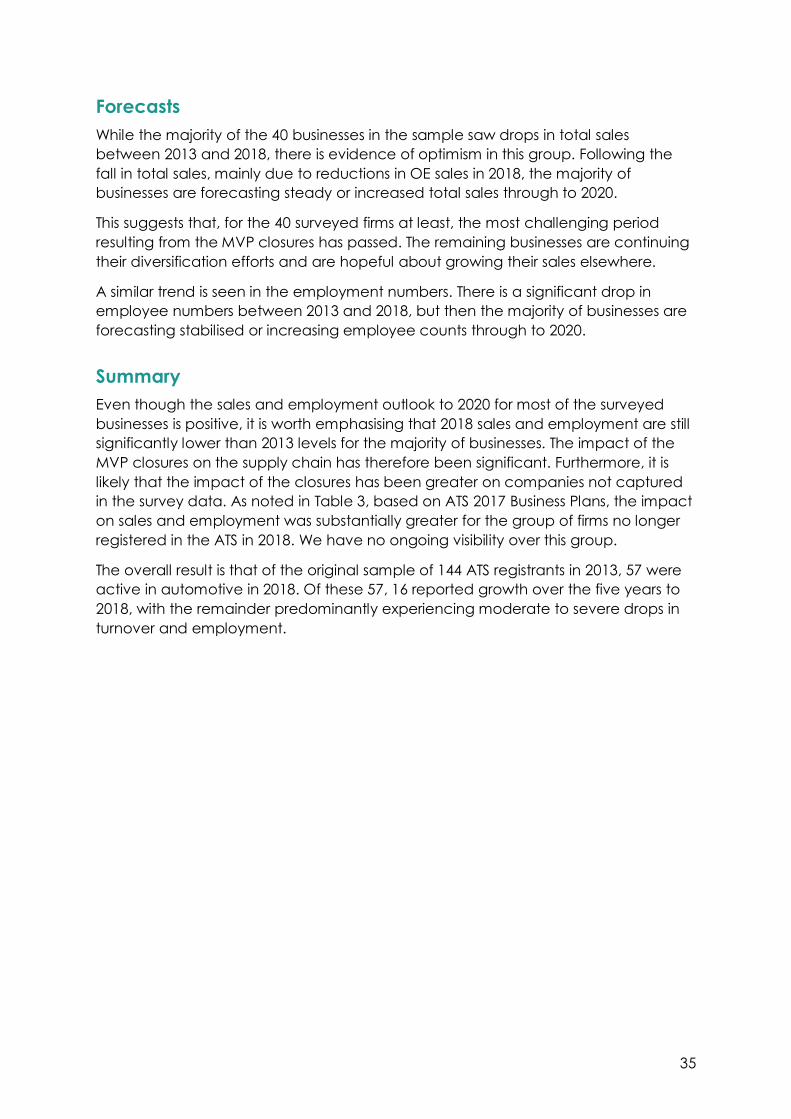
35
Forecasts
While the majority of the 40 businesses in the sample saw drops in total sales
between 2013 and 2018, there is evidence of optimism in this group. Following the
fall in total sales, mainly due to reductions in OE sales in 2018, the majority of
businesses are forecasting steady or increased total sales through to 2020.
This suggests that, for the 40 surveyed firms at least, the most challenging period
resulting from the MVP closures has passed. The remaining businesses are continuing
their diversification efforts and are hopeful about growing their sales elsewhere.
A similar trend is seen in the employment numbers. There is a significant drop in
employee numbers between 2013 and 2018, but then the majority of businesses are
forecasting stabilised or increasing employee counts through to 2020.
Summary
Even though the sales and employment outlook to 2020 for most of the surveyed
businesses is positive, it is worth emphasising that 2018 sales and employment are still
significantly lower than 2013 levels for the majority of businesses. The impact of the
MVP closures on the supply chain has therefore been significant. Furthermore, it is
likely that the impact of the closures has been greater on companies not captured
in the survey data. As noted in Table 3, based on ATS 2017 Business Plans, the impact
on sales and employment was substantially greater for the group of firms no longer
registered in the ATS in 2018. We have no ongoing visibility over this group.
The overall result is that of the original sample of 144 ATS registrants in 2013, 57 were
active in automotive in 2018. Of these 57, 16 reported growth over the five years to
2018, with the remainder predominantly experiencing moderate to severe drops in
turnover and employment.
36
Lessons Learnt
The below lessons are informed by the preceding analysis of supply chain
companies, analysis of transition support from the Commonwealth, as well as a
review of the government response to closures undertaken by Mr Linsey Seide, the
former Director of Automotive Supplier Excellence Australia (ASEA), in mid-20189.
Firms that received transition support generally fared better
As a whole, there is reasonable evidence that firms accessing support through
the transition assistance programs performed significantly better (or less worse)
than those receiving just ATS support.
Industry commentators have observed that ATS support was on average around
1 - 2 per cent of a firm’s sales turnover. As such it was not capable of
underpinning the scale and pace of transition required. It could be argued that
more generous assistance across a greater cohort of firms would have enabled
better outcomes. The capital grants schemes (ANMP and ADP) were
competitive, with some unsuccessful firms critical of the process and funding
available. The BCSP advisory service was however open to all industry
participants, and had very good results for participating Australian firms.
Primes such as the three MVPs can both enable and inhibit transition
Meeting a global OE Manufacturer’s (OEM) needs is challenging. For decades,
companies in the supply chain were encouraged by the MVPs to focus on just
meeting their lean manufacturing requirements of good quality, competitive
pricing, and on-time delivery. The MVP’s had been marginally profitable for many
years, and generally worked closely with their suppliers to identify efficiencies –
for their mutual survival. While some firms had embarked on a diversification
journey prior to 2014, many had not. Supplier diversification was only of indirect
interest to the MVP’s (to ensure supplier viability should auto OE demand fall to
critical levels). These commercial dependencies had a major impact on firm
diversification success.
As noted earlier, the 2018 report by Mr Linsey Siede found that around
60 per cent of Tier 1 suppliers were less than 10 per cent diversified. In other
words, automotive OEM customers made up at least 90 per cent of their sales. In
contrast, 60 per cent Tier 2 and 3 supply chain firms had more than 50 per cent of
sales to non-OEM customers.
While the MVPs have provided financial support towards efficiency
improvements to the supply chain and reskilling for retrenched workers, little
focus was on financial assistance for supply chain transition to new industry
sectors. Some of the MVPs supported a key group of suppliers that they identified
and took to visit other plants around the world, and introduced to their
purchasing groups. However, only a handful were successful in securing new
business. The three MVPs did not contribute to the assistance provided for firm
diversification through ADP, BCSP, and the ANMP.
9 Siede, L. (July 2018). Appropriateness and Effectiveness of Government Funding to the
Automotive Supply Chain.
37
For any future transition events, it is recommended that the Primes’ support be
directed towards supply chain market development activities, in particular, more
focussed assistance to access the global parent’s supply chain.
Australian-owned firms are more likely to persevere than multinationals
Multinational companies had starkly different outcomes to Australian-owned
firms. Despite the local managers of multinationals having started to diversify
early on (with support from government), once the closure announcements were
made, the vast majority were advised by their parent companies to cease their
Australian operations. This can at least in part be explained by the greater
exposure to automotive of this group (most were Tier 1 suppliers with over 90 per
cent focussed on the Australian MVP’s). Australian-owned firms were
predominantly Tier 2 and 3 suppliers, with a higher level of diversification. This
lead to better sales and employment outcomes.
Early diversification assistance contributes to firm survival, but expect businesses
to downsize as they adjust to the transition
Around 75 per cent of the former automotive supply chain were still in business in
early 2018. It is likely that many Tier 2 and 3 suppliers have simply wound up their
automotive divisions, but continue to operate in other markets, with
proportionate impacts on total sales and employment. It is also likely that there
were continued business closures over 2018.
Transition support is more effective if provided continuously rather than in rounds
Transition support is viewed by many firms as being fundamental to their survival
and subsequent success. Concerns were raised related to the intermittency of
funding availability with grant rounds (e.g. ANMP/ADP). Continuation of funding
(rather than being provided in rounds) is more suited to meet project timeframes
with less changes to the projects undertaken.
Firms need assistance for a range of activities to successfully transition
The data indicates that those who received transition assistance performed
better in terms of diversification, accessing new export markets, and in providing
employment. A combination of assistance for activities such as new market
identification, strategy development, early-stage commercialisation,
pre-production development, guidance and mentoring, as well as investments in
capital equipment/upgrades appear to be more effective than funding capital
equipment alone. This is particularly pronounced as repurposing existing
under-utilised capital during a downturn should be a first step before acquiring
new capital equipment.
Company Characteristics and Barriers for Successful Transition
While governments can play a large role in assisting companies through a transition,
true success largely rests in the hands of companies. The key company
characteristics that enable successful transition are discussed below. Furthermore,
key structural barriers that should be considered in policy and program
development are also discussed.
38
Key Company Characteristics for Success Transition
Awareness of the Business Landscape
The companies who have showed the most success in diversification and export
markets were those who anticipated the cessation of motor vehicle
manufacturing and took the initiative to explore options early. This is particularly
the case as many industry experts believe that it generally takes between seven
to 10 years to replace revenue. These firms have then used available
government support to progress their transition goals.
Mindset of Company Leadership
Recent research10 undertaken by the Behavioural Insights Team for DIIS noted
that a growth mindset is key to successfully facing any transition scenario -
whether it be closures of a large customer or technological disruption - that
impacts the underlying structure and culture of an entity.
Mr Siede’s observations of the supply chain companies noted that there are
three main types of supply chain companies:
1. those who do not want to change;
2. those who see the need for change, but do not know how; and
3. those who have already started to diversify, but need additional support.
Mr Siede noted that the success of the BCSP was due to the protocols it had in
place to identify those companies with the ‘right mindset’ (second and third
types listed above) to invest in and seek new business opportunities. Hence,
devising merit criteria that considers the mindset of company leadership is
important in the effective use of government funding towards companies in
transition. Highlighting the success of leading firms can provide a behavioural
‘nudge’ to shift manager’s mindsets, to help manage the transition.
Application of existing skills to new markets
Available data shows that companies have used a number of strategies to
diversify revenue streams including: joint ventures, application of existing skills,
and acquisition of businesses.
Of the 70 supply chain firms that showed evidence of increased diversification
while remaining in business (at least up to 2018), 39 firms (or 56 per cent) did so
simply through the application of their existing skills to new markets. A much
smaller number used joint venture/alliance arrangements and acquisitions (at 16
and 19 per cent respectively) to diversify.
A point to note is that lower use of partnerships/alliances could be due to lower
access to strategic relationships with other organisations and the research sector.
The government can work to bridge this gap in collaboration through facilitation
of targeted networking events and by providing capability development support
to assist with new market exploration.
10 The Behavioural Insights Team (2018). Encouraging the uptake of Industry 4.0 solutions
among Australian SMEs: A behavioural insights approach.
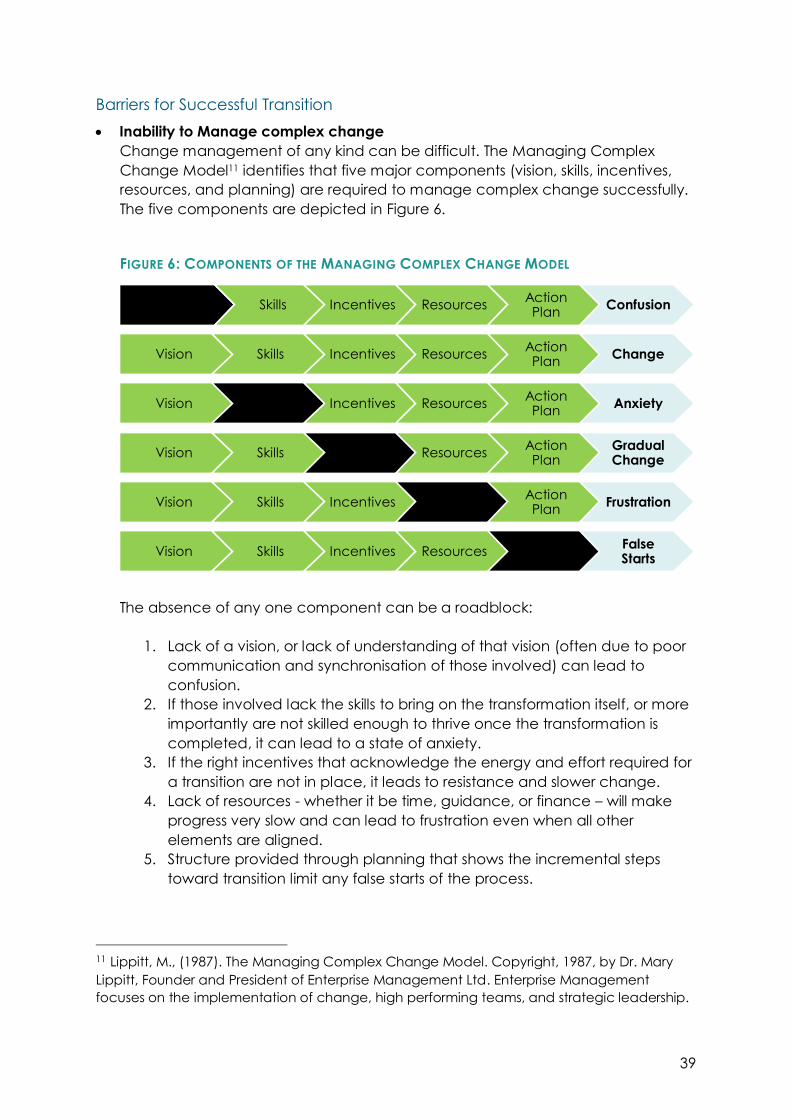
39
Barriers for Successful Transition
Inability to Manage complex change
Change management of any kind can be difficult. The Managing Complex
Change Model11 identifies that five major components (vision, skills, incentives,
resources, and planning) are required to manage complex change successfully.
The five components are depicted in Figure 6.
FIGURE 6: COMPONENTS OF THE MANAGING COMPLEX CHANGE MODEL
The absence of any one component can be a roadblock:
1. Lack of a vision, or lack of understanding of that vision (often due to poor
communication and synchronisation of those involved) can lead to
confusion.
2. If those involved lack the skills to bring on the transformation itself, or more
importantly are not skilled enough to thrive once the transformation is
completed, it can lead to a state of anxiety.
3. If the right incentives that acknowledge the energy and effort required for
a transition are not in place, it leads to resistance and slower change.
4. Lack of resources - whether it be time, guidance, or finance – will make
progress very slow and can lead to frustration even when all other
elements are aligned.
5. Structure provided through planning that shows the incremental steps
toward transition limit any false starts of the process.
11 Lippitt, M., (1987). The Managing Complex Change Model. Copyright, 1987, by Dr. Mary
Lippitt, Founder and President of Enterprise Management Ltd. Enterprise Management
focuses on the implementation of change, high performing teams, and strategic leadership.
Vision Skills Incentives ResourcesAction Plan
Confusion
Vision Skills Incentives ResourcesAction Plan
Change
Vision Skills Incentives ResourcesAction Plan
Anxiety
Vision Skills Incentives ResourcesAction Plan
Gradual Change
Vision Skills Incentives ResourcesAction Plan
Frustration
Vision Skills Incentives ResourcesAction Plan
FalseStarts
40
A negative outcome can be tracked backwards to identify its cause. For
example, a confused outcome can be traced back to a lack of vision.
Governments can assist companies with all five components of change
management and can provide a holistic approach to future transition events.
Pressure from Primes such as MVPs
While the MVPs showed corporate goodwill by planning a three year orderly
closure of their operations, diversification was not a priority prior to this window.
This was shown through the desire of MVPs to not buy products from a company
that provided similar products to another MVP. The ‘commitment’ of suppliers
who did decide to diversify early was also questioned by the MVPs.
The pressure that large customers such as the MVPs can exert on smaller suppliers
and individuals is therefore a real barrier to diversification and should be
considered when examining industries under stress. Governments could, for
example, implement measures to encourage the primes to support their suppliers
into global value chains.
Lack of support towards employee skills and retraining
Employee skills deserve to be explored in their own right considering the
significant barrier they can be to sector transition and diversification, and to a
company’s successful transition to new opportunities.
It was noted that much of the diversification and transition support provided to
firms was primarily in the form of funding for investment in capital equipment.
While capital equipment upgrades are important, if employees and company
leaders are stuck in old ways of working, the benefits can be short-lived.
Governments can play a large role in assisting companies with skill gaps and
retraining.
Going forward
Automotive manufacturing in Australia has undergone major downsizing – but
significant, and more profitable activity remains in the bus, truck, caravan and
aftermarket sectors. The industry continues to evolve, embracing new technologies
and developing high value-added products and pre- and post-production services.
The Australian dollar depreciation is adding significantly to our competitiveness in
global supply chains. We have significant strengths in emerging areas of light weight
components, battery recharging and cooling and autonomous vehicle
development that will provide substantial growth into the future, potentially involving
the former PMV OE supply chain.
The Australian Government, in consultation with key automotive industry
stakeholders, has several ongoing programs to assist businesses, including those in
automotive, to adopt new advanced technologies to maintain or improve market
competitiveness. Two programs that further target the transition of the Australian
automotive industry include the $100 million Advanced Manufacturing Fund’s
Automotive Innovation Labs and the Automotive Engineering Graduate Program.
41
The $10 million Automotive Innovation Labs program will assist automotive-related
companies to design and test new automotive products at established commercial
and research facilities. Thirty per cent of the funding from this program will establish
design and test facilities in South Australia and Victoria, where businesses can access
specialised equipment and facilities to design, develop and test new automotive
products. This includes allowing products designed for export markets to be fully
tested to international standards.
The remaining 70 per cent of funding will be provided as grants to support those
businesses undertaking automotive product development including design,
prototype and development activities at established commercial and research
facilities. These grants are specific to the industry development of automotive
components and equipment makers, reflecting the shift away from original
equipment manufacturing towards vehicle modification and component
manufacturing.
The $5 million Automotive Engineering Graduate Program funds higher education
providers to encourage engineering students to undertake research projects with
automotive businesses. The program will not only increase the pipeline of high
quality graduate engineers into Australia’s automotive sector, but it will also allow
companies to be exposed to new and innovative ideas that young graduates can
bring.
Another related and complementary initiative is the Industry 4.0 Testlabs for Australia
pilot program. This pilot program will establish Industry 4.0 Testlabs at six Australian
universities to improve collaboration between small and medium enterprises (SMEs)
and the research and education sector in areas of innovation. They will also support
SMEs to improve their skills and capabilities to incorporate technology and
innovation into their businesses.
These and similar assistance programs, which encourage innovation and build
industry capability, will assist future emerging automotive related industries and
technologies. These include hydrogen, electric and autonomous vehicle
technologies, to name just a few. In addition, ATS assistance will continue until the
program’s legislated closure in December 2020.
42
Conclusions
Australia’s experience with the automotive transition has been mixed. Of the 40 firms
surveyed in 2018, 16 reported growth over the five years from 2013. These firms were
included in the 57 that remained active in automotive in 2018, but the remainder
predominantly experienced a significant fall in sales and employment. The
remaining 87 firms (of the 2013-17 study group of 144) either closed, or likely left the
industry without substantially replacing lost auto sales.
The companies that continued participation in the ATS and had a proportionally
higher uptake of the transition support programs demonstrated better (or less worse)
employment outcomes. The study provides good evidence that the measures to
date have improved firm survival.
It is clear that establishing new markets where existing capabilities can be applied
was an effective diversification strategy. These markets varied from automotive
related industries such as truck and bus manufacturing, to agriculture and medical
technologies. However, it is also very clear that diversification for automotive firms is
a major and difficult undertaking, and takes many years.
The global automotive sector is similarly facing major disruptions and economic
headwinds, which makes export business particularly challenging. New global
vehicle sales have stagnated, and are set to fall further over the long term with the
growth of mobility-as-a-service business models. Most former Australian supply chain
companies are not equipped to compete in these shrinking global passenger
vehicle supply chains. However opportunities may exist in more profitable related
sectors, such as the automotive aftermarket, and other vehicle manufacture
(e.g. trucks, caravans). DIIS will continue to monitor industry developments to inform
its advice to Government.
43
Appendix A
Study Methodology
The analysis was mainly based on ATS data. Firms that received ATS assistance in
2013 were selected. These firms provided a picture of the supply chain prior to the
closure of the Australian MVPs. The firms were then tracked through the closure of
the Australian MVPs in 2017. Industry commentators have observed that virtually all
the substantial (i.e. greater than $500,000 production value) automotive supply
chain firms would have been registered in the ATS at some point. However it is
important to note that ATS registration is not static, firms will enter and leave the
scheme depending on eligibility. The ATS had 165 registrants at its commencement
in 2011, but only 105 firms of the 2013 registrants were still in the scheme at the end of
2017.
For each participant, ATS data contains:
Business location;
Employment data collected annually, starting in 2013;
Total sales of products and services related to automotive;
Sales of Original Equipment (OE). Depending on how a firm fulfils the ATS
eligibility criteria, the collected OE sales data is either total OE sales, or sales of
a single nominated OE component.
ATS data was supplemented by data extracted from business plans, ATS National
Interest applications, and company websites. Where available the following data
was extracted:
Total sales (including non-automotive sales);
Whether the business is currently operating;
Ownership status (Australian owned, or part of a multinational);
Key manufacturing competencies;
Markets diversified into (including the automotive aftermarket) and the
method used to diversify (joint-ventures, acquisitions, etc.);
Export markets (in both 2013 and 2017);
Because business plans and National Interest applications do not contain complete
information, the absence of data should not be interpreted as implying a capability
or market has not been pursued. By the same reasoning, the listed capabilities and
markets should not be considered complete.
A number of companies considered in this analysis also participated in the Business
Capability Support Program. Data on export markets and key manufacturing
capabilities was extracted from this data where available.