austin community college · austin community college district (acc) has a diverse, unique mission:...
TRANSCRIPT

Produced in partnership with Austin Community College
Austin Community CollegePROGRESS TOWARD EXCELLENCE 2013 Report
PROGRESS TOWARD EXCELLENCE REPORT 2013
The Austin Chamber of Commerce Progress Report Task ForceThe Chamber’s Austin Community College Progress Report Task Force is comprised of Central Texas business leaders focused on ensuring ACC can be the leading community college in the country and prepare the talent to help our companies grow.
Tony Budet, President/CEO, University Federal Credit Union, Chair
Gary Allison, Vice President, Engineering, Convio
Lisa Doyle, Senior Vice President, Human Resources, St. David’s HealthCare
Hunter Ellinger, Friends of ACC
John Hernandez, President, Friends of ACC, Commercial Real Estate Broker
Ken Lauber, Vice President, Texas Mutual
Amelia Lopez, Principal, MWM Design Group
Cynthia Pedigo, Program Manager, Organizational Capability Group, Intel
Mike Perrine, Commercial Banking President, Capital One Bank
Gaye Rothman, Partner, Brown McCarroll, LLP
Anna Sanchez, Vice President, Business Banking, Wells Fargo
Joel Stone, President, SpawGlass
Jeff Thomas, Regional President, HEB Grocery Co., Inc.
Richard Froeschle, Director, Labor Market & Career Information, Texas Workforce Commission, Ex–Officio
Byron McClenney, Community College Leadership Program, University of Texas at Austin, Ex–Officio
Austin Community College District Board of TrusteesThe Austin Community College District Board of Trustees represents residents of the ACC District. Trustees provide high–level guidance and leadership to ensure the college meets community needs. For more information, visit austincc.edu/board.
Jeffrey Richard, Chair
Dr. Victor H. P. Villarreal, Vice Chair
Guadalupe Q. Sosa, Secretary
John–Michael V. Cortez
Dr. Betty Hwang
Allen H. Kaplan
Tim Mahoney
Nan McRaven
Dr. Barbara P. Mink
ACC’s Master Plan can be reviewed at austincc.edu/masterplan.
Austin Community College is an affirmative action, equal opportunity educational institution.
1
A MESSAGE FROM THE AUSTIN CHAMBER AND ACC
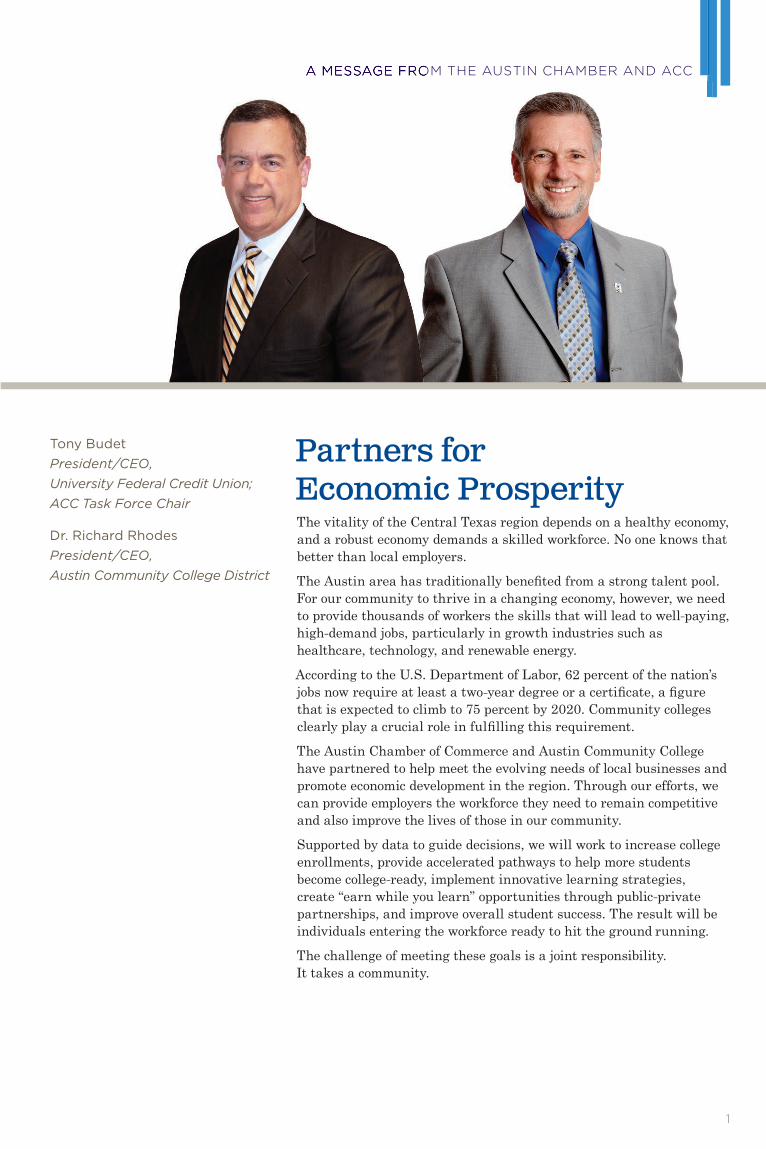
Partners for Economic Prosperity The vitality of the Central Texas region depends on a healthy economy, and a robust economy demands a skilled workforce. No one knows that better than local employers.
The Austin area has traditionally benefited from a strong talent pool. For our community to thrive in a changing economy, however, we need to provide thousands of workers the skills that will lead to well–paying, high–demand jobs, particularly in growth industries such as healthcare, technology, and renewable energy.
According to the U.S. Department of Labor, 62 percent of the nation’s jobs now require at least a two–year degree or a certificate, a figure that is expected to climb to 75 percent by 2020. Community colleges clearly play a crucial role in fulfilling this requirement.
The Austin Chamber of Commerce and Austin Community College have partnered to help meet the evolving needs of local businesses and promote economic development in the region. Through our efforts, we can provide employers the workforce they need to remain competitive and also improve the lives of those in our community.
Supported by data to guide decisions, we will work to increase college enrollments, provide accelerated pathways to help more students become college–ready, implement innovative learning strategies, create “earn while you learn” opportunities through public–private partnerships, and improve overall student success. The result will be individuals entering the workforce ready to hit the ground running.
The challenge of meeting these goals is a joint responsibility. It takes a community.
Tony Budet President/CEO, University Federal Credit Union; ACC Task Force Chair
Dr. Richard Rhodes President/CEO, Austin Community College District
A MESSAGE FRO

2
ACC commencement ceremony
WORKING TOGETHER TO ACHIEVE COMMON GOALS
INTRODUCTION

3
INTRODUCTION
Executive SummaryAustin Community College District (ACC) has a diverse, unique mission: provide programs for academic transfer, workforce education, college readiness, professional development, and personal enrichment.
Despite such a diverse mission, ACC is taking steps to ensure student success outcomes will be met.
• President Rhodes and Trustees have been fearless in pursuing key learning and performance metrics with which to improve student outcomes, remove student barriers, and benchmark performance with the nation’s best.
• After a decade of extraordinary enrollment growth, President Rhodes restructured his leadership team to create a forward-leaning operational structure for the next decade, with stronger external relationships.
• The college has been developing an Academic Master Plan, designed to ensure ACC will have the strategies and operational structure to meet the above targets. This plan is expected to be completed by fall 2013.
• ACC is building out facilities in its newly annexed properties.• ACC has completed the purchase of the Highland Mall in Central
Austin, to create a center for innovative learning and community partnerships. The college broke ground on the first phase of renovations in spring 2013.
These steps will require energy and focus from ACC. They also deserve energetic business leadership engagement and broad community support.
A few key ACC trends:
• After more than 30 percent growth in ACC student enrollment from 2007 to 2010, ACC’s enrollment—as well as that of community colleges across the country—stabilized and was relatively flat in 2010–2012, including a slight decline in fall 2012.
• ACC supports the local labor force with students who complete degree, certificate, and non-credit Continuing Education programs. For 2011–12, ACC awarded 2,960 degrees, certificates, and certifications—representing approximately 88 percent of the projected annual local need through 2020.
• In 2011–12, ACC had 905 health sciences completions, representing approximately 65 percent of the projected annual local need through 2020.
• In 2011–12, ACC had 452 applied technology completions, which is 61 percent of the projected annual local need through 2020.
• ACC’s three-year student success rate for the 2008 cohort is 43 percent. The college is undertaking a variety of initiatives to continue to grow that rate.
• The college provides a number of ways for business and industry to become involved and partner with the college to grow the workforce pipeline.
To continue growing career and technical training programs to meet the needs of Central Texas, we must change policies to reduce hurdles and accelerate education pathways, increase public-private partnerships, and improve student completion rates.
ABOUT THE REPORT
This report examines data compiled by ACC’s O�ce of Institutional E�ectiveness and Accountability (OIEA). OIEA’s research informs state, federal, and accrediting agencies; promotes accountability; and helps the college identify areas of success as well as opportunities for improvement.
Through this report, ACC and the Chamber can ensure the college remains aligned with employers’ needs and highlight ways ACC, the business community, and the Chamber can work to achieve common goals.

4
Two ACC students practice in the Emergency Medical Technology classroom at Eastview Campus
SERVING RESIDENTS AND BUILDING THE WORKFORCE
ACC SNAPSHOT

5
ACC SNAPSHOT
About ACCA Primary Pathway to Higher Education ACC provides affordable career and technical training and general education to the rapidly growing population of Central Texas. More than half of all area high school graduates choose ACC for their college education. Students come to ACC for a variety of reasons: workforce training for high–demand careers, university transfer, college readiness, and attainment of new skills for personal enrichment or professional advancement.
ACC and its community partners must continue to provide the training students need to succeed and the workers businesses need to prosper. It won’t be an easy task, with challenges including decreased funding of higher education, state policies that fail to promote seamless transfers between institutions, and the number of students unprepared for college–level courses.
The college is working to increase student retention, graduation, and transfer rates—with efforts such as innovative programs, support for those at high risk of not meeting their goals, and ongoing advocacy for policy change.
ACC FactsSince opening its doors in 1973, ACC has been a significant educational and economic asset to Central Texas.
• ACC is the only area college accredited to award the associate degree, which the U.S. Department of Labor identifies as the fastest–growing workplace credential.
• The college offers more than 100 areas of study and other educational options.
• ACC offers developmental education classes to get students college–ready.
• ACC is the lowest–cost provider of higher education in the area. In–district students can complete two years (60 credit hours) for less than $5,000, compared to an average rate of $17,540 for Texas State University–San Marcos, and $19,588 for the University of Texas at Austin. (Source: CollegeForAllTexans.com, 2012–13 tuition & fees)
• ACC offers the convenience of eight full–service campuses and 11 centers. Additional campuses opening in 2013 (Elgin) and 2014 (Kyle/Buda and Highland) will further expand accessibility.
• With approximately 5,000 full–time and part–time employees, ACC is among the area’s largest employers.

PROGRESS TOWARD EXCELLENCE REPORT 20136
Enrollment Trends and GoalsThe Central Texas region served by ACC includes some of the fastest growing counties in the state. The college has managed enrollment growth within the framework of a strategic Master Plan that aligns with the college’s mission as well as the statewide Closing the Gaps by 2015 initiative. Adopted in 2000 by the Texas Higher Education Coordinating Board, Closing the Gaps is intended to foster a college–going culture and close educational gaps within Texas and between Texas and other states.
• ACC has already surpassed its initial Closing the Gaps enrollment goals for 2015.
• The number of students taking credit classes has increased 26 percent since fall 2007, up to 40,198 in fall 2012.
• Adult Education enrollment increased 65 percent to 4,462 for 2011–12, up from 2,712 in 2007–2008.
• Continuing Education enrollment has decreased 7 percent to 11,213 in 2011–12, down from 12,032 in 2007–08.
Enrollment figures for 2007 through 2012 are certified enrollment headcounts submitted to THECB by ACC’s O�ce of Institutional E�ectiveness and Accountability.
The college produces an annual Fact Book that contains additional enrollment information. For more data, visit go.austincc.edu/factbook.
ENROLLMENT NUMBERS: WHAT’S THE DIFFERENCE?
The Texas Higher Education Coordinating Board (THECB) tracks enrollment based on students enrolled in classes with a census date on or before the THECB’s o�cial reporting date and whose account is considered paid. For its internal headcount, ACC includes all students registered for any course during the given semester, even classes with census dates following the o�cial reporting date. This accounts for the di�erence between certified THECB numbers and the college’s own count. Based on these varying methodologies, the fall 2012 enrollment count di�ers:
• THECB certified headcount: 40,198
• Internal ACC headcount: 43,315
Closing the Gaps enrollments are based on THECB numbers. This report uses the THECB figures.
7
ACC SNAPSHOT
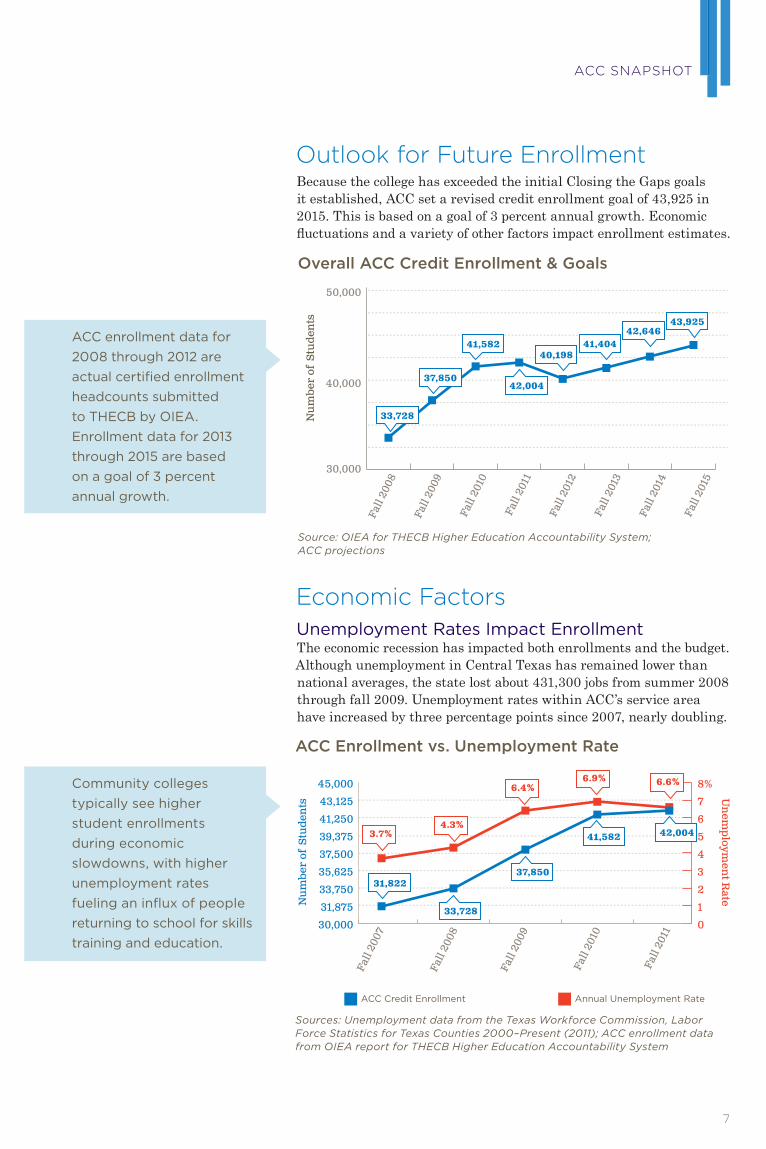
Outlook for Future Enrollment Because the college has exceeded the initial Closing the Gaps goals it established, ACC set a revised credit enrollment goal of 43,925 in 2015. This is based on a goal of 3 percent annual growth. Economic fluctuations and a variety of other factors impact enrollment estimates.
Economic FactorsUnemployment Rates Impact EnrollmentThe economic recession has impacted both enrollments and the budget. Although unemployment in Central Texas has remained lower than national averages, the state lost about 431,300 jobs from summer 2008 through fall 2009. Unemployment rates within ACC’s service area have increased by three percentage points since 2007, nearly doubling.
ACC enrollment data for 2008 through 2012 are actual certified enrollment headcounts submitted to THECB by OIEA. Enrollment data for 2013 through 2015 are based on a goal of 3 percent annual growth.
Community colleges typically see higher student enrollments during economic slowdowns, with higher unemployment rates fueling an influx of people returning to school for skills training and education.
Coated
Fall
2008
Fall
2009
Fall
2010
Fall
2011
Fall
2012
Fall
2013
Fall
2014
Fall
2015
41,582
42,004
43,92542,646
41,40440,198
30,000
40,000
50,000
37,850
33,728Nu
mbe
r of
Stu
den
ts
Overall ACC Credit Enrollment & Goals
Source: OIEA for THECB Higher Education Accountability System; ACC projections
ACC Credit Enrollment Annual Unemployment Rate
Nu
mbe
r of
Stu
den
ts
Un
employm
ent R
ate
0
1
2
3
4
5
6
7
8%
30,000
31,875
33,750
35,625
37,500
39,375
41,250
43,125
45,000
Fall
2007
Fall
2008
Fall
2009
Fall
2010
Fall
2011
31,822
33,728
37,850
41,582 42,0043.7%4.3%
6.4%6.9% 6.6%
ACC Enrollment vs. Unemployment Rate
Sources: Unemployment data from the Texas Workforce Commission, Labor Force Statistics for Texas Counties 2000–Present (2011); ACC enrollment data from OIEA report for THECB Higher Education Accountability System

PROGRESS TOWARD EXCELLENCE REPORT 20138
Annual Budget: Maximizing ResourcesACC’s Board of Trustees sets an operating budget that maximizes financial resources while allowing the college to achieve objectives for growth and student success. The annual operating budget has increased nearly 37 percent since fiscal year 2009.
The board adopted a $272,128,217 million budget for 2012–13, a 2.6 percent increase over the 2011–12 budget. The budget reflects an increase in ACC’s tax base resulting from the 2010 annexation of the Elgin and Hays school districts. An increased budget is necessary for the college to meet community demand for critical programs and support services.
Financial Aid Supports Student AchievementThe college administers approximately $100 million in federal, state, and private student aid annually. Of this amount, approximately $30 million covers tuition and fee costs while the remaining $70 million is disbursed directly to students for other educational and living expenses—which supports the local economy.
A leveling out of the unusually high enrollment growth seen during the recession and uncertainty about the state’s next biennial budget will pose challenges for the 2013 academic year. The college remains prepared to adapt while responding to local needs.
Students may receive more than one type of aid.
Coated
Federal grants
State grants
Institutional grants
Outsidescholarships
ACC Foundationscholarships
Student loans
Number of grants, scholarships, and loans awarded among 13,023 students, Fall 2012
0 2,000 4,000 6,000 8,000 10,000 12,000
10,573
1,0291,0291,0291,029
2,394
554
314
6,397
Students Receiving Financial Aid, Fall 2012
Source: ACC Financial Aid O�ce
Fiscal Year 2009
Fiscal Year 2010
Fiscal Year 2011
Fiscal Year 2012
Fiscal Year 2013
Millions0.0 0.5 1.0 1.5 2.0 2.5 3.0
$198,702,044
$226,331,254$$$226,331,254226,331,254226,331,254
$241,953,627
$265,208,841
$272,128,217
Annual Operating Budget (Fiscal Years 2009–2013)
Source: ACC Annual Operating Budget Books

9
ACC SNAPSHOT
State Funding Support for Students DecliningACC’s operating budget is drawn from three primary sources: local property taxes, student tuition, and state funding. The remainder comes from grants and other sources.
The percentages of the budget coming from those sources have shifted significantly in the past several years.
Tax revenues are expected to increase approximately 5 percent in the coming year. The college’s property tax rate for 2012–13 is approximately 9½ cents per $100 valuation, essentially unchanged from the previous year’s rate. The average residential tax bill will slightly decrease.
In 2011–12, federal, state, local, and private entities awarded ACC nearly $12 million in grants.
ACC’s property tax rate is among the lowest in the state—significantly below the 16 cent average for Texas community colleges.
As state funding support for community college students has declined, local taxpayers’ responsibility has increased. ACC remains committed to a low tax rate with generous exemptions for senior citizens and homeowners with disabilities.
34.6%
40.6%40.6%40.6%40.6%
20%
4.7%
35.6%
19.5%
41.5%
3.4%
Tuition & Fees
State Appropriations
Property Taxes
Other Funding Sources
19.5%19.5%19.5%
FY01 Budgeted Revenues FY13 Budgeted Revenues
Source: ACC Annual Operating Budget Books
2007
–08
2008
–09
2009
–10
2010
–11
2011
–12
2012
–13
$0.0958 $0.0954 $0.0946 $0.0951 $0.0948 $0.0951
$0.08
$0.10
ACC Property Tax Rate
Source: ACC Annual Operating Budget Books

10
Yesica M., Radio–Television–Film
STUDENTS WHO ATTEND ACC, AND WHY THEY’RE HERE
ENROLLMENT OVERVIEW

11
ENROLLMENT OVERVIEW
ACC Student SnapshotAn Open Door to Higher EducationACC’s “open door” policy ensures admission to all who meet eligibility criteria. ACC students represent diverse backgrounds, ethnicities, and ages, and most pursue their education while working, caring for their family, or fulfilling military commitments. Many are the first in their family to attend college.
White: 19,615 students
Hispanic: 11,698 students
Other*: 3,330 students
Black: 3,372 students
Asian: 2,144 students
48.8%
29.1%29.1%29.1%29.1%
8.4%
8.3%
5.3%
Student Enrollment by Race/Ethnicity, Fall 2012
Source: OIEA for THECB Higher Education Accountability System
*Note: The category “other” includes multi-racial and international students.
44.4%44.4%44.4%44.4%
55.6%
Female Students: 22,347
Male Students: 17,812
Student Enrollment by Gender, Fall 2012
Source: OIEA for THECB Higher Education Accountability System

PROGRESS TOWARD EXCELLENCE REPORT 201312
Student IntentStudents come to ACC for a variety of reasons; however, a substantial majority (82 percent) are taking credit courses with the intent of earning a degree or certificate, or transferring to a four–year university. Others already have a degree and are seeking additional career–related skills.
38%
38%
10%
5%5%5%5%
3%
6%
Transfer
Earn Associate Degree
Did Not Respond
Earn Certificate
Enrichment
Improve Skills
Student Intent, Fall 2012
Source: OIEA for THECB Higher Education Accountability System
0%
25%
50%
75%
100%
77%
23%
21%
79%79%79%79%
Part-time Enrollment
Full-time Enrollment
Workforce Enrollment
Core Curriculum Enrollment
40,159 StudentsEnrolled in
Credit-bearing Courses
Student Enrollment Categories, Fall 2012
Sources: OIEA for THECB Higher Education Accountability System; ACC Fact Book
STUDENTS WITH PREVIOUS EDUCATION
In fall 2012, the number of students considered first-time students at ACC was 11,385. Of these students, 712 (6 percent) had a bachelor’s degree or higher.
Percentages reflect enrollment in core curriculum versus workforce-specific courses, not a student’s classification. Workforce students also enroll in core curriculum courses.

13
ENROLLMENT OVERVIEW
ACC offers more than 100 fields of study. A complete list can be viewed on the college website at austincc.edu/choices.
Top 10 Intended Majors for ACC Students
#1 General Studies
#2 Nursing (professional)
#3 Business Administration
#4 General Studies in Science
#5 Engineering (general)
#6 Psychology
#7 Pre-Medical
#8 Biology
#9 Criminal Justice Law Enforcement
#10 Teaching: Early Childhood—6 Grade Levels
Source: OIEA, data based on fall 2012 12th class day data (intended majors)
In addition to students in credit courses, ACC enrolls approximately 15,000 students each year in non–credit Continuing Education and Adult Education classes.
Flexible Distance Learning OptionsAs an alternative to attending classes at an ACC campus, students may take advantage of flexible Distance Learning options. These include online and online/classroom hybrid classes, instructional television, and directed studies. Available credit, course content, and transferability is identical to classes offered on campus.
Distance Learning provides methods of learning convenient for many students. It also allows the college to increase the number of students it serves without incurring overhead costs associated with accommodating those individuals at a physical campus.
ACC’s Distance Learning enrollment has increased 40 percent since fall 2007. Distance Learning represents ACC’s second largest
“location,” with a total student enrollment surpassed only by that at Northridge Campus.
ACC NURSING PROGRAM AMONG TOP DEGREE PRODUCERS
ACC’s Associate Degree Nursing Program is among the top producers of graduates in the nation, according to a 2012 analysis by Community College Week. Among two-year institutions, ACC is ranked:• 15th for associate
degrees in registered nursing and related programs
• 18th for associate degrees in health professions and related programs
Based on data from the 2010–11 academic year from the U.S. Department of Education. Source: Community College Week
Fall
2007
Fall
2008
Fall
2009
Fall
2010
Fall
2011
Fall
2012
Nu
mbe
r of
Stu
den
ts
6,000
6,800
7,600
8,400
9,200
10,0009,741 9,593
9,319
8,517
7,452
6,872
Distance Learning Enrollment
Source: ACC Fact Book

PROGRESS TOWARD EXCELLENCE REPORT 201314
ACC Game Development Institute students at Northridge Campus
ACC’S COMMITMENT TO STUDENT ACHIEVEMENT
STUDENT SUCCESS

15
STUDENT SUCCESS
Improving Learning Through InnovationAchieving the Dream Student Success InitiativeThe Student Success Initiative (SSI) is a collegewide commitment to enhance learning and success for all students. SSI uses innovative curriculum, a range of support services, and analysis of student performance data to increase success in a variety of areas.
Core goals include:
• Increase persistence• Increase progression from Developmental and Adult Education
to credit courses• Increase successful completion of all attempted courses• Increase graduation and transfer rates
• Increase success equity across all student demographics
SSI benefits all students while providing extra support for those who are at risk for dropping out or not meeting their goals. These often include first–time–in–college students, minority students, students who are not yet college–ready, and those who are economically disadvantaged.
A key component of SSI is the use of data to drive decisions. To help faculty and staff better understand achievement gaps, ACC disaggregates student data by race, economic status, gender, and other factors such as teaching delivery methods. Through this “culture of evidence,” the college identifies best practices and develops improved learning techniques.
SSI goals parallel those of Achieving the Dream, a nationwide, multiyear initiative to help community college students who have traditionally faced barriers to success. ACC joined Achieving the Dream in 2009.
For more information on ACC’s commitment to student success, visit austincc.edu/success.
ACADEMIC MASTER PLAN
ACC is developing an Academic Master Plan that will guide the college’s programs into the future and serve as a basis for the continued development of innovative curriculum.
The goals of this process are to:• Support student
success
• Align budget, sta�ng, and support services with academic goals
• Integrate planning, budget, and assessment
• Evaluate progress toward achieving institutional goals
• Inform stakeholders of progress
The plan is expected to be finalized in fall 2013.

PROGRESS TOWARD EXCELLENCE REPORT 201316
Addressing College Readiness GapsWhile an increasing number of individuals are pursuing higher education, many arrive at ACC unprepared for college–level work.
Among first–time college students entering ACC in fall 2012, approximately 40 percent were mandated to take at least one developmental education course in reading, writing, and/or math.
The college has adopted new learning strategies to facilitate students’ transition from developmental education to credit programs. All are designed to address a student’s individual needs while maintaining the standards and expectations required of higher education.
Ongoing partnerships between secondary and post–secondary schools are essential to closing college readiness gaps. ACC programs such as Early College High School promote a college–going culture while preparing high school students for the rigor of college work and allowing them to earn college credit.
It made college more real to me. You hear about college, but now I see it for myself.
“”
Dimitri Turnipseed, LBJ graduate
EARLY COLLEGE HIGH SCHOOL
A partnership between ACC and Austin ISD, Early College High School enables students at Reagan and LBJ high schools to earn up to two years of tuition-free college credit. With hard work, incoming freshmen in the program can achieve an associate degree by their high school graduation.
HIGH SCHOOL TO COLLEGE
Other programs in which ACC provides accelerated pathways for high school students include:
Early College Start. Area high school juniors and seniors can enroll in up to two college courses per semester while still in high school.
College Connection. This award-winning program provides high school students across the region assistance with college applications, placement testing, financial aid applications, and advising.
ACCTech. Students take technical classes that give them high school credit immediately and college credit upon registration at ACC.
For more information on these e�orts, visit austincc.edu/highschool.

17
STUDENT SUCCESS
Expanding Student Data AnalysisData-driven decision making is a priority for ACC. The college has engaged in several initiatives to expand and focus ACC’s ability to collect and analyze student data.
ACC’s recently developed longitudinal data set grows the college’s analytical capabilities by providing student historical data in an accessible format. Outcomes for cohorts, or groups, of students— such as those entering college for the first time during a particular fall semester—can be analyzed. Cohort analyses provide a more comprehensive understanding of students’ educational experiences and performances, and such information is often more revealing than reports based on total student activity during fixed time periods.
These analyses will aid in assessing the effectiveness of programs and services designed to improve student achievement. Additionally, these analyses will help the college better understand the diverse groups of students it serves, and provide answers to fundamental questions related to student success, such as:
• What percentage of ACC students successfully reach their declared educational goals?
• How do student assessment scores and demographics correlate with success?
The results of these analyses will help both ACC and its students make decisions that promote successful completions.
Understanding Students and Their Behaviors This effort has already yielded interesting insights into the patterns of student engagement and achievement. As data collection continues, the information it produces should lead ACC and its students to make decisions that promote more successful completions as well as help the community better assess the college’s progress toward excellence.
PROGRESS TOWARD EXCELLENCE REPORT 201318
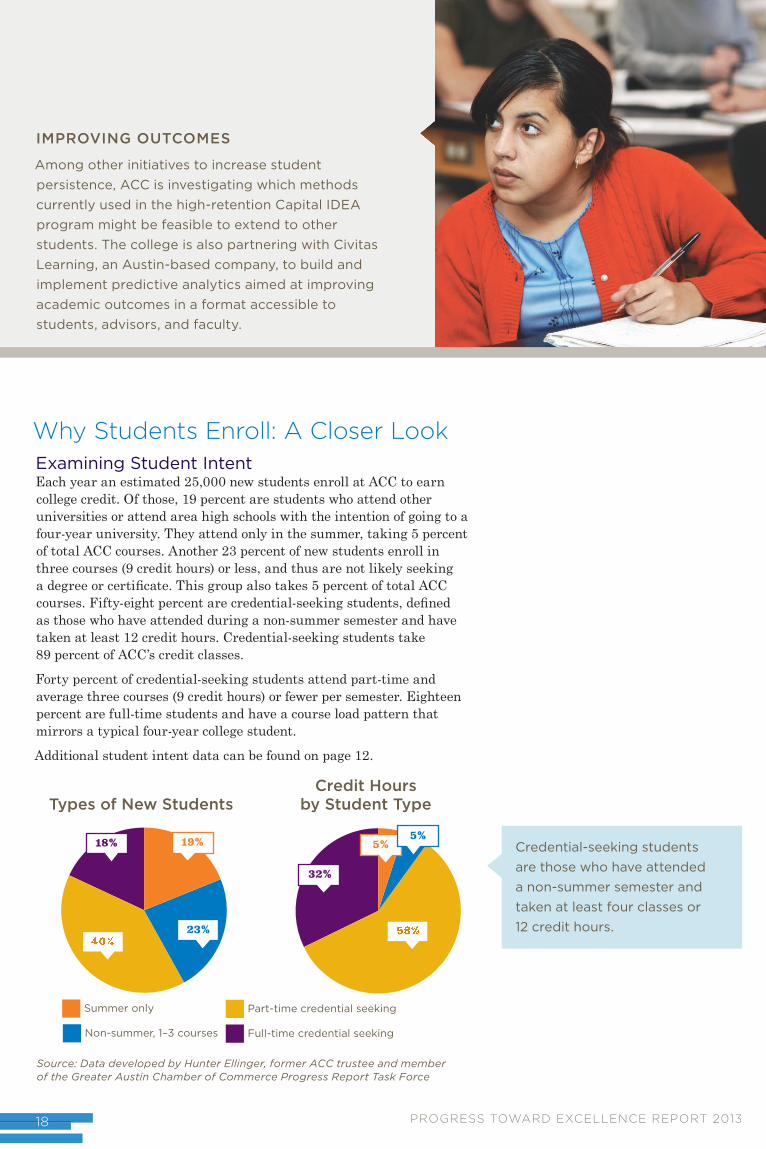
Why Students Enroll: A Closer LookExamining Student Intent Each year an estimated 25,000 new students enroll at ACC to earn college credit. Of those, 19 percent are students who attend other universities or attend area high schools with the intention of going to a four-year university. They attend only in the summer, taking 5 percent of total ACC courses. Another 23 percent of new students enroll in three courses (9 credit hours) or less, and thus are not likely seeking a degree or certificate. This group also takes 5 percent of total ACC courses. Fifty-eight percent are credential-seeking students, defined as those who have attended during a non-summer semester and have taken at least 12 credit hours. Credential-seeking students take 89 percent of ACC’s credit classes.
Forty percent of credential-seeking students attend part-time and average three courses (9 credit hours) or fewer per semester. Eighteen percent are full-time students and have a course load pattern that mirrors a typical four-year college student.
Additional student intent data can be found on page 12.
IMPROVING OUTCOMES
Among other initiatives to increase student persistence, ACC is investigating which methods currently used in the high-retention Capital IDEA program might be feasible to extend to other students. The college is also partnering with Civitas Learning, an Austin-based company, to build and implement predictive analytics aimed at improving academic outcomes in a format accessible to students, advisors, and faculty.
23%40%40%40%40%40%40%40%40%40%
18% 19%
Summer only
Non-summer, 1–3 courses
Part-time credential seeking
Full-time credential seeking
5%
58%58%58%58%58%58%58%58%58%
32%
5%
Types of New StudentsCredit Hours
by Student Type
Source: Data developed by Hunter Ellinger, former ACC trustee and member of the Greater Austin Chamber of Commerce Progress Report Task Force
Credential-seeking students are those who have attended a non-summer semester and taken at least four classes or 12 credit hours.

19
STUDENT SUCCESS
ACC Spends More on High-Achieving Students Successful Students Require More InvestmentSince the college’s expenses are primarily due to number of classes rather than the number of students, the lion’s share of college resources are spent on successful students. Successful students take more classes.
Eighty-one percent of ACC funds are spent on students who earn at least 15 credit hours. Almost 65 percent of expenses are on students who earn 30 credit hours or more.
Potential for Increasing Program Completions Retention Counts Student-history analysis tells how far ACC students who do not complete programs progress before stopping out. This can be used to identify those who make a good start (earning 15 credit hours or more) but who under current conditions don’t persist to near completion (45 credit hours or more). Approximately 40 percent of ACC students earn between 15 and 44 credit hours. Twenty-two percent earn 45 or more.
These figures imply that better retention, not additional recruitment, may be the most promising path to immediately increase ACC program completions (except for programs that already operate at full capacity, for which expansion and additional partnerships with business/industry are needed). Among other retention initiatives, ACC is investigating which of the methods of the high-retention Capital IDEA program might be feasible to extend to other students.Coated
15+ credit hours
30+ credit hours
45+ credit hours
Percentage of Funding
0% 20 40 60 80 100
81%
65%65%65%65%
48%
Funding Concentrated on Students Who Persist
Source: Data developed by Hunter Ellinger, former ACC trustee and member of the Greater Austin Chamber of Commerce Progress Report Task Force

20
ACC student at South Austin Campus
AREA WORKFORCE NEEDS AND ACC COMPLETIONS
MEASURING SUCCESS

21
MEASURING SUCCESS
Progress MetricsDegree CompletionIncreasing degree and certificate completions and university transfers is a primary focus of the college’s Student Success Initiative. It is also a key factor in meeting the needs of Central Texas business and industry. ACC supports the local labor force with students who complete degree, certificate, and non–credit Continuing Education programs.
Labor Needs and Total Degree CompletionAccording to projections from the Texas Workforce Commission, the Capital Area and Rural Capital Area workforce development areas (a region that closely aligns with ACC’s 7,000–square–mile service area) will need approximately 33,800 workers in the ten–year period from 2010–2020 to fill jobs that require an associate degree, certificate, or other post–secondary training. That’s an annual average of 3,380 new and replacement workers.
For 2011–12, ACC awarded
2,960 degrees, certificates,
and certifications—
representing approximately
88 percent of the projected
annual local labor force
need through 2020.
Total ACC Completions Degrees, Certificates, and Continuing Education Programs Leading to Professional Certifications
Average Annual Labor Force Need
2010
2011
2012
2013
*
2014
*
2015
*
2016
*
2017
*
2018
*
2019
*
2020
*0
500
1,000
1,500
2,000
2,500
3,000
3,500
4,000 3,380 jobs per year
2,960 completionsin 2012
Nu
mbe
r of
jobs
an
d co
mpl
etio
ns
Local Labor Force Need and ACC Completions
Source: Occupational Projections for the Capital Area workforce development area (WDA) and Rural Capital Area WDA, which includes Austin and the surrounding area (a region that closely aligns with the ACC service area). Occupational and Industry Projections is a cooperative program between the U.S. Department of Labor, Employment and Training Administration, and the Texas Workforce Commission-Labor Market and Career Information Department. Capital Area and Rural Capital Area projections produced by the Texas Workforce Commission for 2010–2020 in October 2012.
*Note: Completions through 2012 are actual for ACC. ACC completion data are from the ACC Fact Book and the Continuing Education division. Projections for 2013–2020 are based on a goal of 3 percent annual increase.

PROGRESS TOWARD EXCELLENCE REPORT 201322
Health Sciences Labor Needs and Targeted Degree CompletionACC is the area’s top provider of training for healthcare jobs. The college’s health sciences programs combine classroom instruction with hands–on clinical experience in hospital and community settings. ACC offers degrees and certificates in a variety of health science areas, including nursing, emergency medical services professions, sonography, medical coding, and more.
Twenty–four health sciences job titles were matched for this analysis.
ACC Health Sciences CompletionsDegrees, Certificates, and Continuing Education Programs Leading to Professional Certifications
Average Annual Labor Force Need
2010
2011
2012
2013
*
2014
*
2015
*
2016
*
2017
*
2018
*
2019
*
2020
*0
200
400
600
800
1,000
1,200
1,400
1,6001,400 jobs per year
905 completionsin 2012
Nu
mbe
r of
jobs
an
d co
mpl
etio
ns
Local Health Sciences Labor Need and ACC Completions
Source: Occupational Projections for the Capital Area workforce development area (WDA) and Rural Capital Area WDA, which includes Austin and the surrounding area (a region that closely aligns with the ACC service area). Occupational and Industry Projections is a cooperative program between the U.S. Department of Labor, Employment and Training Administration, and the Texas Workforce Commission-Labor Market and Career Information Department. Capital Area and Rural Capital Area projections produced by the Texas Workforce Commission for 2010–2020 in October 2012.
*Note: Completions through 2012 are actual for ACC. ACC completion data are from the ACC Fact Book and the Continuing Education division. Projections for 2013–2020 are based on a goal of 3 percent annual increase.
In 2011–12, ACC had 905 health sciences completions, representing approximately 65 percent of the total projected annual local need through 2020.

23
MEASURING SUCCESS
Growing the Healthcare WorkforceBetween 2010 and 2020, the Capital Area and Rural Capital Area workforce development areas will have an estimated 14,000 job openings for health sciences positions with a preferred education of an associate degree or postsecondary vocational training, according to Texas Workforce Commission projections. That’s an annual average need of 1,400 new and replacement workers.
Applications for ACC’s health sciences programs consistently outnumber available spots, and ensuring that program capacity meets demand is an ongoing challenge. Healthcare providers understand that investing in academic opportunities is an investment in the economic future of the area.
HEALTHCARE PROVIDERS PARTNER WITH ACC TO SUPPORT COMPLETIONS
Local healthcare providers count on ACC graduates to fill jobs and meet the community’s needs. Those providers partner with the college to ensure a robust pipeline of skilled workers.
In 2010, St. David’s Foundation donated more than $2 million to the ACC Foundation for a scholarship endowment benefiting students enrolled in health sciences programs. The Seton Family of Hospitals partnered with ACC to open the Clinical Education Center at Brackenridge, which enabled ACC to increase nursing program capacity and, in turn, program completions.
St. David’s Health Sciences Building at Round Rock Campus

PROGRESS TOWARD EXCELLENCE REPORT 201324
Applied Technology Labor Needs and Targeted Degree CompletionAt ACC, applied technology career training encompasses a vast array of fields such as technology, engineering, computer–based visual communications, and renewable energy.
According to Texas Workforce Commission projections, between 2010–2020, the Capital Area and Rural Capital Area workforce development areas will have approximately 7,350 openings for applied technology jobs with a preferred education level of an associate degree or postsecondary vocational training. That’s an annual average need of 735 new and replacement workers.
Twenty–seven applied technology job titles were matched for this analysis.
ACC Applied Technology CompletionsDegrees, Certificates, and Continuing Education Programs Leading to Professional Certifications
Average Annual Labor Force Need
2010
2011
2012
2013
*
2014
*
2015
*
2016
*
2017
*
2018
*
2019
*
2020
*0
100
200
300
400
500
600
700
800735 jobs per year
452 completionsin 2012
Nu
mbe
r of
jobs
an
d co
mpl
etio
ns
Local Applied Technology Labor Need and ACC Completions
Source: Occupational Projections for the Capital Area workforce development area (WDA) and Rural Capital Area WDA, which includes Austin and the surrounding area (a region that closely aligns with the ACC service area). Occupational and Industry Projections is a cooperative program between the U.S. Department of Labor, Employment and Training Administration, and the Texas Workforce Commission-Labor Market and Career Information Department. Capital Area and Rural Capital Area projections produced by the Texas Workforce Commission for 2010–2020 in October 2012.
*Note: Completions through 2012 are actual for ACC. ACC completion data are from the ACC Fact Book and the Continuing Education division. Projections for 2013–2020 are based on a goal of 3 percent annual increase.
In 2011–12, ACC had 452 applied technology completions, representing approximately 61 percent of the total projected annual local need through 2020.

25
MEASURING SUCCESS
Degree Completion and Transfer Rates for Full-Time StudentsCollege completion metrics encompass credential achievement as well as transfer status. ACC is surrounded by a number of universities, and almost half of the college’s credit students intend to transfer, making those transfers a critical element to track.
BOOSTING GRADUATES THROUGH TRANSFER
Austin Community College’s transfer program produces the largest number of transfer students to area universities, where they perform as well as or better than native students.
New programs with the University of Texas at Austin and Texas State University will let students enroll at ACC and their university simultaneously. ACC is also implementing reverse transfer agreements that allow students to combine credits for an associate degree—even if they transfer before community college graduation.
Coated
Transferred and/orEarned Associate Degreeor Certificate
Earned Associate Degree/Certificate/Core Completer(with 60 credit hours)
Transferred to anotherCollege or University
20062003 cohort
20072004 cohort
20082005 cohort
20092006 cohort
20102007 cohort
20112008 cohort
Succ
ess
Rat
e P
erce
nta
ge
05
1015202530354045
50% 43%
40% 39% 40% 40% 39% 39%
42% 43% 43% 42% 43%
3% 3% 3% 3%4% 4%
ACC Completion Rates, 2006–2011
Source: OIEA Report to IPEDS
Note: Data represents full-time students’ three-year success rates.
SAMSUNG AND ACC: BUILDING THE WORKFORCE TOGETHER
Samsung Austin Semiconductor is working with ACC to create a pipeline for workforce expansion. A Technician Apprenticeship Program provides qualified Electronics and Advanced Technologies students the opportunity to work part-time at Samsung’s Austin semiconductor plant while they complete their associate degree. Graduates are encouraged to apply to be full-time Samsung technicians.
“The technician apprentices receive Samsung-specific training, so they can really hit the ground running and contribute right away once they have graduated. It seems that a lot of people assume a four-year degree is required for this type of career. We want to make sure people know that we o�er a technically challenging and financially rewarding career path that begins with a technical degree from ACC.”
— J. Scott Woodland, Samsung Austin Semiconductor

PROGRESS TOWARD EXCELLENCE REPORT 201326
Graduate Outcomes ACC recognizes that the measure of its students’ success extends beyond earning a degree or certificate. The college is committed to helping students meet their professional goals and monitors metrics such as licensure exam pass rates to assess students’ progress.
Licensure pass ratesStudents in many ACC career training programs must take state and/or national licensure exams at the conclusion of their education. The following chart reflects the most recent available pass rates of students in ACC’s health sciences programs, with hundreds of students testing annually throughout the division.
2010–2011 Health Sciences Licensure ExamsGraduates Total Tested Total Passed
Nursing (Professional) 250 247 246
Totals for Health Sciences 539 516 507
Overall pass rates for health sciences students taking licensure exams increased to 98 percent in 2010–11 from 96 percent in 2005–06.
Graduate SatisfactionAnalysis of graduate follow–up surveys from 2008 through 2010 shows a high level of satisfaction with ACC. Ninety–four percent of graduates say they were satisfied or very satisfied with their overall experience at ACC and the overall quality of their classes.
ACC Health Sciences Licensure Exam Pass Rates Program 2005–06 2006–07 2007–08 2008–09 2009–10 2010–11Dental Hygiene 93% 95% 100% 100% 100% 100%Emergency Medical Services* 95% 97% 100% 100% 100% 100%Massage Therapy 95% 92% 100% 100% 100% 100%Medical Laboratory Technology**
100% 88% 100% 64% 75%
Nursing (Professional) 97% 96% 100% 100% 100% 100%Nursing (Vocational) 100% 85% 100% 100% 100% 98%Occupational Therapy Assistant 86% 100% 100% 100% 94% 100%Pharmacy Technician 100% 100% 100% 100% 100% 100%Physical Therapist Assistant 94% 94% 100% 100% 100% 100%Radiology** 100% 100% 100% 100%Sonography** 100% 100% 95% 100%Surgical Technology** 69% 72% 90% 85%Totals for Health Sciences 96% 95% 99% 99% 99% 98%
* NOTE: Emergency Medical Technician–Intermediate, Emergency Medical Technician–Basic, and Paramedic were merged together as Emergency Medical Services after 2007.
** NOTE: Medical Laboratory Technology was not o�ered in 2005–06; 2006–07 data not available for Radiology, Sonography, and Surgical Technology programs.
Source: OIEA for THECB Higher Education Accountability System
Ninety-six percent of the 539 health sciences graduates sat for licensure exams in 2010–11. Among those students, the pass rate was 98 percent.

27
MEASURING SUCCESS
Clarissa G., Health Sciences
28
Joseph W., Kinesiology and Carlos C., Business Administration
PARTNERING TO ENHANCE SUCCESS AND OVERCOME CHALLENGES
MOVING FORWARD

29
MOVING FORWARD
Progress Toward Excellence ReportAustin Chamber RecommendationsRecommendation 1Central Texas deserves the best community college system in the United States. ACC has defined its peer community colleges. The Board of Trustees and President should now define benchmarks and annual targets on its progress toward excellence.
Recommendation 2ACC can and should provide the overwhelming supply of Central Texas’ entry-level healthcare and IT completers. We commend ACC for adopting student enrollment, success rate, tech and health program completion targets sufficient to meet 90 percent of Austin’s projected new and replacement job opportunities. We strongly support ACC’s development of an Academic Master Plan which will flesh out how these targets will be met and how the ACC budget will resource its accomplishment.
Recommendation 3Programmers, network and database talent is in the greatest demand in Central Texas. The Chamber requests that ACC partner with it in creation of an intense focus on programmatic efforts to dramatically increase IT completers.
Recommendation 4In 2010, ACC set a goal of increasing graduation rates by 50 percent by 2020, based on the American Graduation Initiative. This is part of the college’s Student Success Initiative, which has shown initial success. Dr. Rhodes had deepened this effort by focusing resources on key “Momentum Points,” or accountability measures, which further student success rates. In addition, ACC has explored different ways to define student success. The Chamber encourages ACC to develop a defensible definition of a successful student, set targeted levels of successful students, and position the college and its resources to achieve its objectives. Further, the Chamber encourages ACC to follow its president in the difficult organizational prioritization required to accomplish this important goal.

30
Recommendation 5After years of dramatic student enrollment growth, the last two years have remained largely flat. The Chamber recommends ACC boost its enrollment projections to almost 50,000 by 2015 by growing enrollments and increasing retention, recognizing this may require different strategies and additional resources to accomplish, including the support of local business and industry.
Recommendation 6The Chamber recommends that it assist ACC in collecting a variety of data:
• Cost to expand high-demand programs limited by capacity• Hiring requirements—exploring reported needs for associate
degrees or certificates—for jobs supported by programs for which ACC has high capacity, strong enrollment, but lower completion rates
• Work with the Department of Labor to make available to higher education institutions information on whether graduates find work in their course of study and whether post-secondary education impacted their earnings
Recommendation 7The Chamber recommends the ACC Board of Trustees develop and adopt a Community Accountability Policy that addresses capacity and performance relative to community interests.
Recommendation 8The Chamber continues to recommend the Austin business community strongly support efforts by ACC to expand its taxing district.

31
MOVING FORWARD
Critical Issues AheadChallenges Facing Texas Community CollegesACC is committed to breaking down barriers to higher education and helping Central Texans prepare for the jobs of today and tomorrow. To do that, the Chamber believes the Texas Legislature, the community, and the college must address certain issues:
• State funding. One of ACC’s three primary funding sources, state funding has steadily declined, increasing the burden on taxpayers. The consequences of cutting funding are at odds with the state’s goal of closing education gaps. ACC will continue to advocate for restored state funding while pursuing new revenue sources.
• Accountability measures. Tracking only graduation rates as a measure of an institution’s success is outdated and not well–suited to a community college like ACC. These numbers account only for first–time, full–time students who graduate within three years—about 5 percent of ACC’s student body.
ACC supports using a broader set of metrics, known as “accountability measures” or “momentum points,” to assess student outcomes in all areas covered by its mission. The Texas Higher Education Coordinating Board has begun tracking these kinds of student milestones, including:
• Achievement of college–level skills• Attainment of first 15 and 30 credit hours• College–level credits in math and writing–intensive courses• Certificate, associate degree, and transfer completions
Community colleges offer multiple, diverse paths for students to accomplish their goals. Success rate measurements should reflect this diversity.
• Public policy. Public policy should promote the efficient and cost–effective completion of higher education. Credit transfer is a key area where policy changes would benefit students. Completing coursework at a community college with the intent to transfer is the only way some students can afford to earn a bachelor’s degree. In addition, research shows that students who complete an associate degree have greater success after transferring. Unfortunately, the current path from community colleges to four–year institutions is a complex web of individual articulation agreements that dictate which courses will transfer.
ACC supports a 60+60 model that would ensure that 60 credit hours completed at a Texas community college would transfer to any other public Texas college or university, where the student would complete the remaining 60 hours for a bachelor’s degree.
POLICY THAT SUPPORTS STUDENT SUCCESS
ACC is a member of the Texas Association of Community Colleges (TACC), a non-profit association that includes all 50 public community college districts in the state. TACC’s legislative priorities for the 83rd legislative session reflect a core principle: that student success is the highest priority of every Texas community college. To learn more about TACC’s priorities for the 2013 legislative session, visit the Texas Success website at txsuccess.com.

32
The Role of Business and IndustryAs ACC advocates for change at the state and national levels, local business and industry can help build a pipeline of skilled workers in a variety of ways:
• “Earn while you learn.” Internships and apprenticeships provide companies with motivated workers and produce graduates who start jobs with the skills employers need. Paid internships and apprenticeships are especially helpful for students, enabling them to focus on their studies and enter the workforce faster.
• Value associate degrees and certificates. Associate degrees and certificates give students both academic knowledge and the hands–on skills they need to succeed. Community colleges also teach soft skills, including communication, teamwork, and decision–making. By understanding and reflecting the value of associate degrees and certificates, companies can encourage more completions of these credentials.
• Program development. Area professionals serve on ACC program advisory committees to ensure career training programs reflect business and industry needs. To learn about getting involved with a program advisory committee, contact [email protected].
• Scholarships. Local employers can contribute to the ACC Foundation to create scholarships for students interested in their field. Companies including Grainger, Kinnser Software, and the Austin Hotel & Lodging Association have helped students complete their education through generous donations. For more information, visit austincc.edu/foundation.
PROGRESS TOWARD EXCELLENCE REPORT 2013
INDUSTRY PARTNERS
ACC maintains strategic partnerships with employers and economic development groups, building a foundation for a strong economic future. Partners include:
• AMD
• Applied Materials
• Applied Biosystems
• Austin Apartment Association
• Austin Energy
• Austin Hotel & Lodging Association
• Austin Independent School District
• Austin Technology Council
• Autodesk Corporation
• BAE Systems
• Capital Metro
• Cisco Systems
• City of Austin
• City of Fredericksburg
• Concordia University
• Dell
• Environmental Systems Research Institute
• E3 Alliance
• First American Flood Data Services
• Good Company Associates
• Greater Austin Chamber of Commerce
• Harden Healthcare
• H-E-B
• IBM
• Longhorn Dental
• Meridian Solar
• Microsoft Corporation
• Motorola/Freescale
• National Instruments
• Oracle Corporation
• Round Rock Chamber of Commerce
• Samsung
• Sandia National Laboratories
• Sematech
• Seton Family of Hospitals
• St. David’s HealthCare
• St. Edward’s University
• Texas Disposal Systems
• Texas e-Health Alliance
• Texas Restaurant Association
• Texas Solar
• Texas State University
• Time Warner Cable
• Tokyo Electron
• University Federal Credit Union
• U.S. Department of Labor
• University of Texas at Austin
• Walmart
• Whole Foods
• Workforce Solutions– Capital Area
• Workforce Solutions–Rural Capital Area

100+ AREAS OF STUDYACC has hundreds of degree and certificate options in more than 100 areas of study, including:
BUSINESS & MANAGEMENTAccountingAdministrative AssistantBusiness AdministrationFashion MarketingHospitality ManagementInternational BusinessLegal Administrative AssistantManagementMarketingMeeting & Events PlanningMusic Business, Performance
& TechnologyO�ce AdministrationParalegalReal Estate LicensingSmall Business ManagementTechnical CommunicationsTravel & Tourism
TRADE & INDUSTRYArt MetalsAuto Body Collision Repair
& RefinishingAutomation, Robotics, &
ControlsAutomotive TechnologyArchitectural & Engineering
Computer Aided DesignBioinstrumentationBuilding ConstructionConstruction ManagementCulinary ArtsElectronics TechnicianHeating, Air Conditioning,
& RefrigerationJewelryLand Surveying/GeomaticsMotorcycle RepairNanoelectronicsNetworking/Computer
ElectronicsRenewable EnergySmall Engine RepairUtility LineworkerWeldingWoodworking
HEALTH & PUBLIC SAFETYAddictions CounselingCriminal JusticeDental HygieneEmergency Medical ServicesEMT ParamedicFirefighterHealth Information TechnologyHuman ServicesMedical Administrative
AssistantMedical CodingMedical Laboratory TechnologyMolecular DiagnosticsNursingOccupational Therapy AssistantPharmacy TechnicianPhlebotomy TechnicianPhysical Therapist AssistantPre-Med/Pre-Dental/Pre-
Pharmacy/Pre-VetRadiologySonographySurgical TechnologyVocational Nursing
LIBERAL ARTS & SCIENCESAnthropologyArabicArchaeologyArtBiotechnologyBiologyChemistryChineseCommunicationCreative WritingDanceDramaEconomicsEngineeringEnglishEnvironmental ScienceForeign LanguageFrenchGeneral StudiesGeographyGeologyGermanGovernmentHealth & KinesiologyHistoryJapaneseJournalismLatinMathematicsMexican-American StudiesMusicPhilosophyPhysicsPsychologyRussianSociologySpanishSpeech
EDUCATION & HUMAN SERVICES
American Sign Language Interpreter
Child DevelopmentDeaf ServicesEducation/TeachingPersonal Fitness TrainerSocial WorkTherapeutic Recreation
INFORMATION & MEDIA TECHNOLOGIES
2D/3D AnimationComputer Information SystemsComputer ProgrammingComputer ScienceFilm/Video ProductionGame Development & DesignGeographic Information
SystemsGraphic DesignMotion GraphicsNetwork Security/
AdministrationPhotographyRadio–Television–FilmVisual CommunicationWeb & Interactive DesignWeb Developer
