aus dem gastrointestinal labor der tierärztlichen fakultät
TRANSCRIPT

I
Aus dem Gastrointestinal Labor
der Tierärztlichen Fakultät der Texas A&M Universität, College Station, Texas, USA
Vorstand: Prof. Dr. Sandee Hartsfield
angefertigt unter Leitung von
Steiner Jörg M., Dr.med.vet., PhD, Dipl. ACVIM, Dipl. ECVIM-CA
vorgelegt über Prof. Dr. Dr. habil. Johannes Hirschberger
Medizinische Kleintierklinik
der Tierärztlichen Fakultät der Ludwig-Maximilians-Universität München
Geschäftsführender Vorstand : Prof. Dr. Dr. habil. Katrin Hartmann
Identifizierung der Basensequenz des Lipoprotein-Lipase-Gens sowie dessen Bedeutung
bei der Entwicklung von Hyperlipidämie und Pancreatitis beim Zwergschnauzer
Identification of the nucleotide sequence of the lipoprotein lipase gene as well as its role
in the development of hyperlipidemia and pancreatitis in the Miniature Schnauzer
Inaugural-Dissertation
zur Erlangung der tiermedizinischen Doktorwürde
der Tierärztlichen Fakultät
der Ludwig-Maximilians-Universität München
von
Ralph Schickel
aus
Augsburg
München 2005

Gedruckt mit Genehmigung der Tierärztlichen Fakultät der Ludwig-Maximilians-
Universität München.
Dekan : Univ.-Prof. Dr. Andreas Stolle
Referent : Univ.-Prof. Dr. J. Hirschberger
1. Korreferent : Priv.-Doz. Dr. Dr. R. G. Erben
2. Korreferent : Univ.-Prof. Dr. W. Hermanns
3. Korreferent : Univ.-Prof. Dr. H.-J. Gabius
4. Korreferentin: Univ.-Prof. Dr. C. Poulsen Nautrup
Tag der Promotion : 15. Juli 2005

III
Table of Contents
Acknowledgments
Page
1. Introduction 1
2. Literature Review 2
2.1. Lipoprotein Lipase 2
2.1.1 Introduction 2
2.1.2. Function of the LPL 2
2.1.3. Molecular Interaction and Hydrolysis 3
2.1.4. LPL Gene 4
2.1.5. Synthesis and Structure of Lipoprotein Lipase 5
2.1.6. Regulation of LPL Gene Expression 6
2.1.7. Pathophysiological Importance of LPL 7
2.1.8. Mutations of the LPL Gene and Familial LPL Deficiency 7
2.2. Canine Genetics 9
2.2.1. Genetic Defects in the Dog 9
2.2.2. Genetic Analysis in the Dog 10
2.2.2.1. Genetic Markers 10
2.2.2.2. Linkage Analysis 11
2.2.2.3. Candidate Gene Approach 11
2.2.2.4. The LPL Gene as a Candidate Gene for Pancreatitis in the Miniature
Schnauzer 12
2.3. The Exocrine Pancreas of the Dog 13
2.3.1. Anatomy 13
2.3.2. Physiology 13
2.3.3. Diseases of the Exocrine Pancreas 14
2.3.3.1. Pancreatitis 14

IV
2.3.3.2. Chronic Pancreatitis in the Miniature Schnauzer 17
2.3.3.3. Exocrine Pancreatic Insufficiency 17
2.3.3.4. Pancreatic Neoplasia 19
3. Materials and Methods 20
3.1. Study Subjects 20
3.2. Isolation of DNA 20
3.2.1. DNA Extraction from White Blood Cells 20
3.2.2. DNA Extraction from Mucosal Cells 21
3.2.3. Quality Control and DNA Concentration 22
3.3. Primer Design 23
3.3.1. Nucleotide Sequence of the Canine LPL Gene 23
3.3.2. Identification of Primer Sites 24
3.3.3. Primer Design 25
3.4. Polymerase Chain Reaction (PCR) 33
3.4.1. Primer Concentration 33
3.4.2. Optimization of Amplification Conditions 33
3.4.3. Sequencing 36
3.4.3.1. Amplification Conditions for Exon 1 – 9 36
3.4.3.2. Direct Sequencing of Exon 1 – 9 36
4. Results 39
4.1. LPL Gene Sequence in the Miniature Schnauzer 39
4.2. Single Nucleotide Polymorphisms (SNPs) identified in the Miniature
Schnauzers studied 44
5. Discussion 49
6. Summary 52
7. Zusammenfassung 53

V
8. References 55
Appendix 67
A.1. List of Figures 67
A.2. List of Tables 69
A.3. Abbreviations 70
A.4. Curriculum Vitae 71

Acknowledgments
I would like to thank my supervisors Dr. Jörg Steiner and Dr. David Williams for their mentoring
and assistance during the completion of this research. Additionally, I would like to thank them for
their willingness to continue their support of my research efforts while I was a full time student at
Mays Business School, which opened tremendous opportunities for my future career. I am very
thankful for that.
I am also grateful for the support of Dr. Melissa Cox at Pfizer, Ann Arbour, Michigan. Her advice
and guidance accompanied this research from start to finish.
Furthermore, I gratefully acknowledge the support of all my colleagues at the Gastrointestinal
Laboratory at Texas A&M University, particularly Dr. Jan Suchodolski and Dr. Craig Ruaux. I also
would like to thank my colleagues at the Canine Genetics Laboratory at Texas A&M University for
their great support, particularly Dr. Leigh Ann Clark.
Also, I would like to thank Prof. Johannes Hirschberger for giving me the opportunity to conduct this
research in collaboration with the College of Veterinary Medicine, LMU, Munich.
Finally, I would like to thank my family and friends who contributed so much to this work through
their inspiration and friendship:
My Mom, my Dad, Max, Korbinian, Samantha, Steffi, Chase, David, TC, Lorax, and Asmus.

1
1. Introduction
Canine gastrointestinal diseases are among the most common disorders encountered in veterinary
practice, and pancreatitis in particular is found in dogs at a high incidence (Hänichen and Minkus,
1990). Factors incriminated in the pathogenesis of pancreatitis are numerous, including nutritional
imbalances, drugs, pancreatic ischaemia, infectious diseases and hyperlipidemia. Based on the high
prevalence of pancreatitis in the Miniature Schnauzer, several authors have also postulated a genetic
predisposition for pancreatitis in this breed (Zawie, 1996). Hereditary pancreatitis is a well-known
disease in human beings. A variety of different genes can be involved in the development of
pancreatitis in humans. The present study evaluated the role of the lipoprotein lipase gene in the
development of pancreatitis and hyperlipidemia in the Miniature Schnauzer.
Lipoprotein Lipase (LPL) is one of the key enzymes within the lipid turnover in the blood. In
humans, malfunction of the LPL results in decreased clearance of lipoproteins from the blood leading
to hyperlipidemia and pancreatitis. According to the high incidence of idiopathic hyperlipidemia in
Miniature Schnauzers in the United States a disruption within the lipid metabolism was proposed to
be the inciting event of the disease process in Miniature Schnauzers rather than a pancreatic disease
itself (Williams, 1996).
This study used the lipoprotein lipase gene as a candidate gene to identify mutations causing
hyperlipidemia and pancreatitis in Miniature Schnauzers

2
2. Literature Review
2.1. Lipoprotein Lipase
2.1.1. Introduction
In 1943 Paul Hahn first postulated the existence of a heparin-releasable clearing factor. He noticed
that injection of heparin abolished lipemia after a fatty meal (Hahn, 1943). In 1955 this clearing
factor could then be further characterized as a heparin-responsive lipase, termed clearing factor
lipase (Afinsen and Boyle, 1952; Korn, 1955). Apolipoprotein C2 (apo C2) was identified as part of
very low density lipoproteins in 1966 (Scanu, 1966) and was shown to be an important co-factor for
clearing factor lipase. Subsequently, clearing factor lipase was renamed as lipoprotein lipase (EC
3.1.1.34; LPL). The enzyme consists of 3 major domains that are responsible for the interaction with
different molecules. The catalytic function of the enzyme is dependant on interactions with
proteoglycans of the capillary endothelium as well as lipoproteins and apolipoprotein C2 present in
blood (Cryer, 1981; Wang and Hartsuck, 1992).
This chapter describes the structure and function of lipoprotein lipase, which is a key enzyme of lipid
turnover in the body.
2.1.2. Function of the LPL
Triacylglycerols (TAGs) are transported in the blood as a component of chylomicrons and very low
density lipoproteins (VLDL). Dietary TAGs are absorbed by the small intestine and packed into
chylomicrons in the intestinal epithelial cells, whereas TAG that is synthesized in the liver is released
into the blood stream as a part of VLDL. TAGs are transported to peripheral tissues. Lipoproteins are
too large to cross the capillary endothelium and LPL hydrolyzes TAG thus making non-esterified
fatty acids and monoacylglycerol available for tissue uptake.
Further functions of the LPL are facilitation of monocyte adhesion (Mamputu and Desfraits, 1997),

3
promotion of the proliferation of vascular smooth muscle cells (Mamputu and Desfraits, 2000), and
induction of the expression of the tumor necrosis factor-α gene (Renier and Skamene, 1994).
2.1.3. Molecular Interaction and Hydrolysis
The physiological site of action of LPL is the luminal surface of capillary endothelial cells. The
adhesion of the enzyme is facilitated by highly charged, membrane bound heparan sulfated
proteoglycans (HSPG) (Cryer, 1981; Wang and Hartsuck, 1992). This interaction can be competed
out by heparin. Apolipoprotein C2 is part of VLDL and chylomicrons and facilitates the interaction
with LPL and also serves as an important co-factor for the hydrolytic action of LPL (Cryer, 1981;
Wang and Hartsuck, 1992). After lipoproteins attach to LPL it undergoes a conformational change
thereby exposing it’s hydrolytic site. Through this action of LPL TAG is separated from the
lipoprotein particle and hydrolyzed into non-esterified fatty acids and 2-monoacyl glycerides
(Mahmood Hussain and Kancha, 1996), which are now available for tissue utilization. In adipose
tissue fatty acids are re-esterified for energy storage. In the heart muscle fatty acids are oxidized to
serve as an energy source (Cryer, 1981). Remnants of chylomicrons are transported to the liver where
one of their components, apolipoprotein E (apo E), regulates their uptake into hepatocytes. Twelve to
fourteen hours after a meal all chylomicrons are cleared from the blood stream (Mahmood Hussain
and Kancha, 1996). Remnants of VLDL are called low density lipoproteins (LDL). They contain
cholesterol, play an important role for cell membrane stability and are an important source of
cholesterol for the synthesis of steroids and bile acids (Fielding and Fielding, 1991). Hydrolysis of
lipoproteins is the result of a series of attachments and detachments of LPL to the lipoprotein particle
(Eisenberg and Rachmilewitz, 1975). At each locus of attachment up to 40 LPL molecules may act
simultaneously on a lipoprotein substrate, maximizing the rate of hydrolysis (Scow and Olivecrona,
1977). In addition, it has been shown, that LPL itself can dissociate from the endothelium or may
remain attached to the remnant particle (Saxena and Witte, 1989; Vilella and Joven, 1993). This
displacement of functional LPL prevents an oversupply of fatty acids to peripheral tissues under
conditions of excessive biolysis (Braun and Severson, 1992).

4
2.1.4. LPL Gene
Lipoprotein lipase is an extra hepatic enzyme synthesized in adipose tissue, heart muscle, skeletal
muscle, and the lactating mammary gland (Braun and Severson, 1992; Camps and Reina, 1990;
Camps and Reina, 1991). The genetic sequence of the LPL gene shares many similarities with genes
encoding for classical pancreatic and hepatic lipase, and it is hypothesized that all 3 derive from a
common ancestral gene (Hide et al., 1992).
The LPL gene has been sequenced in a number of species including human, guinea pig, mouse, rat,
chicken, baboon, ox, sheep, pig, and fish (Enerback and Gimble, 1993; Oku and Ogata, 2002;
Raisonnier and Etienne, 1995). Homology of the primary protein sequence of LPL between different
mammalian species is in excess of 90%, except in the case of the guinea pig, where the homology
with LPL in other mammalian species is 80%. Comparison of the avian and mammalian sequence of
LPL shows a slightly lower degree of homology of 70%. On the basis of nucleotide sequence, the
homology of the LPL gene among different species of mammals is 77–82% and that between birds
and mammals 61% (Enerback and Gimble, 1993; Raisonnier and Etienne, 1995).
The LPL gene consists of ten exons and nine introns. The size of the individual exons is highly
conserved across species (Enerback and Gimble, 1993; Raisonnier and Etienne, 1995). The human
LPL gene is more than 30kb long and is situated on chromosome 8p22
(www.ncbi.nlm.nih.gov/entrez). The major part of the genetic sequence is formed by the nine introns
with a 9kb intron being one of the longest introns (fig. 2.1). Exon 1 – 9 encode for a protein with 475
amino acids, whereas exon 10 forms the untranslated 3’ end.
Figure 2.1: Structure of the human LPL gene: Exons 1 - 10 are interrupted by introns of various sizes

5
2.1.5. Synthesis and Structure of Lipoprotein Lipase
Although LPL-mediated hydrolysis occurs at the capillary endothelium no mRNA could be identified
within endothelial cells. However, mRNA was present in many other cell types, such as adipose
tissue, skeletal muscle, heart muscle, and the lactating mammary gland (Braun and Severson, 1992;
Camps and Reina, 1990; Camps and Reina, 1991). LPL is also synthesized by hepatocytes during the
fetal stage, but its production is suppressed shortly after birth (Staels and Auwerx, 1992). Therefore,
LPL is referred to as an extra hepatic enzyme.
The initial step in LPL synthesis is the transcription of the LPL gene in the nucleus of parenchymal
cells. Translation of the LPL mRNA into a nascent polypeptide occurs in the rough endoplasmatic
reticulum (ER), followed by post-translational processing. During translation of the polypeptide
chain, glycosylation is initiated. During transport of the protein to the Golgi apparatus this
oligosaccharide is further modified. N-linked glycosylation is crucial for the catalytic activity of the
mature enzyme. After sorting of the enzyme in the Golgi apparatus the peptide is directed to
secretory vesicles, from where it either gets passed on to lysosomes for degradation or to the
parenchymal cell surface where it binds to HSPG (Ben-Zeev and Mao, 2002; Braun and Severson,
1992). LPL is ultimately translocated to HSPG binding sites on the luminal surface of the capillary
endothelium. Two complex oligosaccharide chains form the majority of the carbohydrates of the
mature enzyme, which has an overall carbohydrate content of 12 % (Masuno and Schultz, 1991;
Vannier and Ailhaud, 1989).
The three dimensional structure of LPL has been modeled based on the crystal structure of classical
pancreatic lipase (Van Tilbeurgh et al., 1994; Winkler and D'Arcy, 1990). In its active form, human
lipoprotein lipase is a homo dimer and consists of 448 amino acids. The enzyme contains a large N-
terminal domain (312 amino acids) and a small C-terminal domain (135 amino acids) that are
connected by a flexible region. Binding to the lipoprotein substrate is mediated by the C-terminus,
whereas catalysis is a function of the N–terminal portion of the enzyme. Functionally important are
the highly conserved active site triad (Ser 132, Asp 156, His 241), the oxyanion hole (Trp 55, Leu
133), a polypeptide lid (residues 216-239) and a β5 loop (residues 54-64) (Dugi and Dichek, 1992;
Faustinella and Smith, 1992). Based on these findings Mead et. Al. derived a model, in which the

6
access of the substrate to the catalytic site is blocked by the polypeptide lid. When the lipoprotein
substrate binds to LPL a conformational change is induced that leads to an opening of the lid.
Additionally, the β5 loop folds back, making the active site even more accessible and also bringing
the oxyanion hole into position. These changes increase the hydrophobicity of the catalytic triad
attracting fatty acid side chains of potential substrate molecules. The conformation of LPL forces
TAG into a position that makes the glycerol backbone accessible to the oxyanion hole for hydrolysis
(Mead et al., 2002). Similar models have been described for classical pancreatic lipase as well as
other lipases (Derewenda and Brzozowski, 1992; Grochulski and Li, 1993).
Several heparin binding sites have been identified in both subunits of the enzyme. Most important
sites in the N-terminus are in the regions 279–282 and 292–304. About 50 different binding sites
have been identified in the C-terminal region with Lys 319, Lys 403, Arg 405, Lys 407 and Lys 413
being most important (Berryman and Bensadoun, 1993; Hata and Ridinger, 1993; Lookene and
Nielsen, 2000).
For maximal activity LPL requires apolipoprotein C2 (apoC2) as a co-factor. A charge/charge
interaction has been proposed between the two proteins (Fielding and Fielding, 1976). The apoC2
binding site is located at Lys 147/Lys 148 in the N-terminal subunit (Murthy et al., 1996; Yang and
Gu, 1989).
Five disulfide bridges are formed by ten cysteine residues (Cys 27 - Cys 40, Cys 216 - Cys 239, Cys
264 - Cys 283, Cys 275 - Cys 278, Cys 418 - Cys 438 ) (Raisonnier and Etienne, 1995). Other amino
acids important for dimerisation of LPL are Ala 176, Gly 188, and Gly 195 (Hata and Ridinger,
1992; Keiper and Schneider, 2001).
Mutations of the LPL gene in regions encoding for most of these functional domains can lead to LPL
malfunction. The following section explores the effect of LPL gene mutations on the lipid turnover.
2.1.6. Regulation of LPL Gene Expression
LPL tissue expression is regulated based on specific metabolic demands. During lactation LPL
expression is shifted from the adipose tissue to the lactating mammary gland, whereas feeding results
in an increase in enzyme synthesis in adipose tissue and a decreased synthesis in muscular tissue

7
(Hamosh and Clary, 1970; Lithell and Boberg, 1978). A variety of hormones are responsible for
changes in LPL expression and activity, including insulin, catecholamines, growth hormone, and
estrogen.
Altered LPL expression is also found in patients with certain disease states, such as atherosclerosis,
diabetes, cachexia, or infection (Beauchamp and Renier, 2002; Michaud and Renier, 2001;
Sartippour and Lambert, 1998).
2.1.7. Pathophysiological Importance of LPL
Due to its central role in the lipid turnover LPL is involved in the pathogenesis of several diseases.
Hyperlipidemia is characterized by insufficient clearance of lipoproteins from the blood. Increased
serum concentrations of TAGs result in clinical abnormalities, such as abdominal pain or
hepatomegaly, or clinical syndromes such as pancreatitis, xanthoma, and/or lipemia retinalis. Major
causes include familial LPL deficiency, untreated diabetes mellitus, certain pharmaceutical agents,
and alcohol abuse (Santamarina-Fojo, 1998).
Obesity is a complex disorder that involves multiple factors including genetic, metabolic, and
behavioral factors. The central role of LPL in lipid metabolism and it’s effect on energy storage and
utilization have been described by various authors (Eckel, 1989; Greenwood, 1985; Kern, 1997),
indicating that LPL is one of several factors in this multifactorial disorder of obesity.
Alzheimer’s disease, atherosclerosis, as well as dyslipidemia associated with diabetes mellitus,
insulin resistance, infection, or cancer are other disease conditions where LPL is thought to play an
important role (Baum and Chen, 1999; Hardardottir and Grunfeld, 1994; O'Brien and Gordon, 1992;
Renier and Skamene, 1993; Tisdale, 1999).
2.1.8. Mutation of the LPL Gene and Familial LPL Deficiency
A total of 107 different mutations of the LPL gene have been described in humans, with 71 of these
mutations resulting in complete absence of LPL activity and the other 36 leading to partial LPL
deficiency with less severe hyperlipidemia (Human Gene Mutation Database (HGMD),

8
http://archive.uwcm.ac.uk/uwcm/mg/hgmd0.html). Nonetheless, complete LPL deficiency is a rare
condition (1/1 Mio worldwide) in humans. Partial LPL deficiency on the other hand is common (3 –
5%) in populations of European descent and due to alterations in the lipid profile may, as was
mentioned earlier, lead to conditions such as atherosclerosis (Bijvoet and Gagne, 1996; Jukema,
1996; Reymer and Gagne, 1995). The majority (79) of these 107 mutations are missense or nonsense
substitutions, 7 substitutions affect splicing, and while others are characterized as deletions or
insertions. Mutations have been identified all across the LPL gene (fig. 2.2) with a tendency to
cluster within regions encoding for the major protein domains.
Figure 2.2: Mutations of the human LPL gene superimposed on the LPL amino acid sequence (HGMD 2005)
Familial LPL deficiency refers to a condition, where the genetic cause of LPL deficiency can be
traced back within a certain pedigree. Several of the above mentioned mutations can represent an
inherited defect. Familial LPL deficiency has been shown to follow an autosomal recessive trait and
is characterized by hyperlipoproteinemia, recurrent acute pancreatitis, exocrine pancreatic
insufficiency, diabetes mellitus, and xanthomas (Murthy et al., 1996).
Animal models for LPL deficiency have been developed in the mouse and the cat. Transgenic and
gene-targeted mice have been engineered to study the role of LPL in lipid metabolism, and have been
proven to be a useful model. But mice homozygous for an LPL defect do not survive beyond the first
day of life (Coleman and Seip, 1995; Weinstock, 1995). However, a population of cats with
heterozygous as well as homozygous carriers of LPL deficiency has been successfully established.
The LPL deficiency in these cats results in a lipid and lipoprotein phenotype that predominantly
parallels human LPL deficiency (Ginzinger and Clee, 1999).

9
2.2. Canine Genetics
2.2.1. Genetic Defects in the Dog
Molecular genetics are now widely used to identify the genotypic background for certain phenotypic
expressions in dogs. This includes traits such as coat color, but also a variety of diseases. Naturally
occurring genetic disorders are believed to be more common in dogs than in any other non-human
species (Dukes-McEwan, 2002; Patterson, 2000). There are documented breed predispositions for
various diseases, which are believed to occur due to unique breed population structures (Ostrander
and Galibert, 2000). The separation of dogs into different breeds with closed studbooks has created a
barrier against the mixing of genes, resulting in isolated breeding populations, in which certain
genetic defects can accumulate(Dukes-McEwan, 2002). Another reason for this accumulation is the
so called “popular sire effect”, where dogs carrying a genetic defect may be bred repeatedly because
of their outstanding conformity to breed standards (Ostrander, 2000). However, the documented
multi-generational pedigrees available for the dog provide a statistical advantage for genetic studies,
and since many genetic diseases in the dog resemble those in humans, the dog has become an
attractive model for research on hereditary diseases in humans (Dukes-McEwan, 2002; Galibert,
1998). Veterinary clinicians commonly encounter diseases that are associated predominantly with a
specific breed. More than 450 hereditary diseases have been described in the dog, and approximately
half of them model a human disease (Online Mendelian Inheritance in Animals:
www.angis.org.au/omia). Most of these diseases follow a recessive trait, are a consequence of
genetic homogeneity in purebred dog populations, and constitute a major health problem in purebred
dogs (Dukes-McEwan, 2002; Patterson, 2000). Unlike in humans, most autosomal dominant diseases
in the dog are not propagated because breeders choose not to breed affected dogs. In contrast,
recessive diseases are much more difficult to control because breeders are generally unable to
distinguish between normal dogs and asymptomatic carriers or breeders underestimate the
significance of breeding an asymptomatic carrier.
Hereditary diseases are a major concern for breeders of purebred dogs (Mellersh and Langston,
1997). Thus veterinarians are frequently consulted for advice. The veterinary practitioner should

10
therefore be able to discuss available screening methods and how they can best be used to benefit the
individual dog as well as the breeding population (Metallinos, 2001).
2.2.2. Genetic Analysis in the Dog
2.2.2.1. Genetic Markers
A genetic marker is like a fixed landmark that helps a geneticist to determine certain positions on the
genome and is not necessarily linked to a disease. The genetic markers most commonly used are
microsatellites. Microsatellite markers are widely distributed throughout the entire genome and
consist of a repeating DNA sequence (e.g. CAACAACAA). While the pattern of each microsatellite
stays the same, each marker can show significant variation in size due to a variable number of
repeats between individuals (e.g. CAACAACAA vs. CAACAACAACAACAACAACAA). The
different sizes in which a specific marker appears are the so called alleles of that marker(Lewin,
1997). When performing a whole genome screen, known markers are evaluated and the allele of each
marker is determined for each dog. Since evaluating all of the 3,270 markers of the canine genome
that have been described to date is impractical, the canine genetics community has developed two
Minimal Screening Sets (MSS-1 and MSS-2) (Guyon, 2003). The MSS-1 consists of 172
microsatellite markers, while the MSS-2 is composed of 327 microsatellite markers (Richman et al.,
2001). By performing polymerase chain reactions (PCRs) using genetic material (i.e. DNA) extracted
from dogs with a known phenotype (e.g. pancreatic acinar atrophy) each marker-allele is determined.
Evaluating several microsatellites within the same PCR reaction can accelerate data analysis and is
called “multiplexing”. Reports concerning the use of multiplexing are available for both the MSS-1
and the MSS-2 (Clark L et al., 2004, in press; (Cargill et al., 2002)). Both the multiplexed MSS-1
and MSS-2 are now widely used to perform whole genome screens in dogs.
Sequencing of the canine genome, termed canine genome project, is currently under way by
Ostrander et. al. This project will offer new possibilities, for example the identification of new
genetic markers such as SNPs (single nucleotide polymorphisms). This work will also allow high
resolution mapping of the canine genome for certain diseases (Kirkness and Bafna, 2003).

11
2.2.2.2. Linkage Analysis
Linkage analysis is one form of genetic analysis. The first successful linkage analysis for a canine
genetic disease was carried out by Yuzbasiyan-Gurkan et al., who identified a marker for copper
toxicosis in the Bedlington Terrier (Yuzbasiyan-Gurkan, 1997). The basic concept of linkage
analysis is that a genetic marker close to or within a disease gene is inherited along with that gene.
Whenever a mutation is present in the gene of interest the marker also shows a different allele. The
geneticist then tries to identify a correlation between the appearance of a certain marker allele and the
disease without looking at the gene itself.
A whole genome screen is one approach to carry out linkage analysis. For example, the MSS-1 and
MSS-2 are used to analyze known genetic markers in the genome of a given pedigree(Dukes-
McEwan, 2002; Greer et al., 2003; Richman et al., 2001). Statistical methods are then used in order
to identify one or more markers with an allele that is significantly correlated with a specific disease
phenotype. The position of this linked marker on a physical map of the canine genome can then be
determined and the gene segregating with the marker can be identified in some cases.
A slightly different approach is used if a multigenerational pedigree cannot be established. By using
linkage disequilibrium analysis the individuals are divided into two groups: affected and unaffected.
Once again, a whole genome scan is performed to identify a marker allele that segregates with the
affected group of dogs. However, this method is statistically not as informative as linkage
analysis(Greer et al., 2003).
2.2.2.3. Candidate Gene Approach
The most direct method for genetic analysis is the candidate gene approach, where a selected number
of genes are evaluated. A candidate gene is chosen either based on its role for an analogous disease
in another species, based on pedigree-analysis, and also based on the phenotype of affected and non-
affected individuals. (Greer et al., 2003; Kijas and Miller, 2003). The gene is then evaluated either by
direct sequencing and identification of specific mutations or by linkage analysis with an associated
marker.
An example for a successful candidate gene approach is the evaluation of the canine rhodopsin gene

12
to determine the genetic cause of progressive retinal atrophy in the English Mastiff (Kijas and Miller,
2003).
2.2.2.4. The LPL Gene as a Candidate Gene for Pancreatitis in the Miniature Schnauzer
This work focuses on the evaluation of the LPL gene and its role in the development of
hyperlipidemia and pancreatitis in the Miniature Schnauzer. The LPL gene has been chosen as a
candidate gene for the following reasons.
First, based on the high prevalence of hyperlipidemia and chronic pancreatitis in the Miniature
Schnauzer, several authors have postulated a genetic predisposition for pancreatitis in this breed
(Hänichen and Minkus, 1990; Williams, 1996). One genetic study has been carried out already to
identify the genetic basis for chronic pancreatitis in this breed, excluding the cationic trypsinogen
gene as a possible cause for this condition (Bishop and Steiner, 2002). Thus, additional genetic
studies are warranted.
Second, and as mentioned earlier, mutations of the LPL gene have been shown to result in
hyperlipidemia and pancreatitis in humans, cats, and mice. Phenotypes resulting from LPL mutations
are very similar among these species (Ginzinger and Clee, 1999), and parallel the condition found in
Miniature Schnauzers. Due to the similarities in the phenotype we propose that mutations of the LPL
gene are the underlying cause for hyperlipidemia and pancreatitis in the Miniature Schnauzer.
Third, the LPL gene has been shown to be well conserved between mammalian species. Therefore,
mutations of the LPL gene in Miniature Schnauzers are expected to result in similar phenotypes as
found in familial LPL deficiency in humans, cats, and mice.

13
2.3. The Exocrine Pancreas of the Dog
2.3.1. Anatomy
The pancreas of dogs consists of two lobes that diverge from the vicinity of the pylorus. Both lobes
are connected by a small central body. The left lobe is directed caudo-medially and follows the
pyloric part of the stomach. It is situated in the deep leaf of the greater omentum with direct contact
to the liver and the transverse colon (Dyce, 1996; Evans and Christensen, 1979; Schummer et al.,
1979). The longer right lobe is directed caudo-dorsally and accompanies the dorsal surface of the
descending duodenum. It is situated in the mesoduodenum and makes contact to the liver. The
pancreas develops from the ventral and dorsal primordia that arise from the embryonic small
intestine and can be viewed as an extension of the duodenal glandular mucosa (Schummer et al.,
1979). Two secretory ducts form the remnant connection between the pancreas and the duodenum.
The duct of the ventral primordium develops into the pancreatic duct and joins the bile duct on the
major duodenal papilla, 3 to 6 cm distal to the pylorus. The accessory pancreatic duct, which serves
as the main secretory channel in the dog, emerges from the dorsal primordium. It opens on the minor
duodenal papilla 3 to 5 cm further distal into the duodenum (Dyce, 1996). The color of the pancreas
depends on the amount of blood it contains and ranges from pale pink during the fasting state to dark
red following a meal (Bernard, 1985). The exocrine tissue accounts for more than 98 % of the
pancreas and is mainly composed of acinar cells that are responsible for the synthesis and storage of
the digestive enzymes. Additional components of the exocrine pancreas are the branching duct
system, blood vessels arising from the celiac and cranial mesenteric arteries, veins draining into the
portal vein, and nerve fibers derived from the vagus and splanchnic nerves (Holst, 1993; Williams
and Goldfine, 1993).
2.3.2. Physiology
The pancreas synthesizes and secretes a fluid that is rich in digestive enzymes into the duodenum to
facilitate the digestion of proteins, lipids, and polysaccharides. There is a wide variety of pancreatic

14
enzymes secreted by pancreatic acinar cells, including trypsin, chymotrypsin, elastase,
carboxypeptidase, phospholipase A2, pancreatic lipase, and colipase (Rinderknecht, 1993). To
prevent autodigestion some of these enzymes are synthesized and secreted as catalytically inactive
zymogens, and stored in zymogene granules within the acinar cells. Activation of trypsinogen, the
zymogen of trypsin, occurs after secretion into the duodenum through cleavage of trypsinogen
activation peptide by another enzyme, enteropeptidase. Once trypsin is activated an activation
cascade is initiated, resulting in sequential activation of other digestive zymogens through trypsin.
Another defense mechanism against autodigestion is the cosynthesis, costorage, and cosecretion of
pancreatic secretory trypsin inhibitor (PSTI), which is synthesized, stored, and secreted along with
pancreatic enzymes. PSTI inhibits active trypsin to prevent initiation of the activation cascade within
the pancreas, and therefore prevents self digestion of the organ (Eddeland and Ohlsson, 1976;
Laskowski and Kato, 1980; Rinderknecht, 1998). Pancreatic juice is also a major source of
bicarbonate necessary for adjustment of the pH in the duodenal lumen. It is secreted by the
centroacinar cells of the pancreatic duct system. A variety of nervous and hormonal mechanisms
regulate pancreatic secretion in response to cephalic stimulation in anticipation of food, as well as
gastric and intestinal stimulation in the presence of food (Chey, 1993; Singer, 1993). Pancreatic
secretion is biphasic with a first peak after one to two hours after feeding and a second peak after
eight to eleven hours after feeding. Pancreatic juice is rich in enzymes during the first peak, and rich
in bicarbonate during the second peak (Singer, 1993).
2.3.3. Diseases of the Exocrine Pancreas
2.3.3.1. Pancreatitis
Pancreatic inflammation in the dog can be acute or chronic. Acute pancreatitis is characterized as a
sudden onset of pancreatic inflammation that may continue to occur in repeated bouts. If
inflammation persists leading to permanent morphological changes and impairment of organ
function, the condition is referred to as chronic pancreatitis (Banks, 1994; Bradley, 1993; Sarner,
1993). Depending on the severity of the disease the affected pancreas appears edematous and
swollen. Also, accumulation of fluid may be found within the peritoneal cavity. Areas of hemorrhage

15
and chalky fat necrosis also can be found in the pancreas as well as the surrounding area. Fibrous
adhesions to adjacent organs may be present (Jubb et al., 1985). Inappropriate proenzyme activation
and auto digestion are believed to be the underlying mechanisms for pancreatitis (Reber et al., 1993;
Steer and Saluja, 1993). Pancreatic elastase and phospholipase A promote coagulation necrosis and
vascular injury, while trypsin and chymotrypsin promote pancreatic edema and proteolysis and
further aggravate the activation cascade. Proteolytic enzymes also spill into the vascular space, where
plasma protease inhibitors act as scavengers of these proteases. However, an oversupply of
pancreatic enzymes may lead to depletion of these protease inhibitors, leading to unbound proteases
in the vascular space that can activate the kinin, coagulation, fibrinolytic, and complement cascade
systems resulting in disseminated intravascular coagulation and shock (Lasson, 1984; Lasson and
Ohlsson, 1984; Ohlsson et al., 1971).
The inciting events resulting in acute and chronic pancreatitis usually remain unknown. However
several potential factors have been identified. Ingestion of a high fat meal and concurrent
hyperlipidemia can trigger the disease. It has been suggested, that abnormally high TAG
concentrations may lead to the release of toxic fatty acids, resulting in damage of pancreatic
capillaries (Guzman et al., 1985; Pitchumoni and Scheele, 1993; Saharia et al., 1977). Hypercalcemia
due to hyperparathyroidism has been associated with the development of pancreatitis in some dogs
(Simpson, 1993). Certain drugs such as azathioprine, thiazide diuretics, sulfonamides, tetracyclines,
L-asparaginase, and potassium bromide are also suspected to cause pancreatitis in dogs (Gaskell et
al., 1975; Mallory and Kern, 1980). Pancreatitis can be induced experimentally by pancreatic duct
obstruction, pancreatic trauma, duodenal reflux, and pancreatic ischemia. However, their importance
in the development of spontaneous disease remains unknown (Jacobs et al., 1985; Lerch and Adler,
1994; Westermarck and Saario, 1989). Furthermore, bacterial, viral, mycoplasmal, and parasitic
infections may be associated with pancreatitis (Steer, 1986).
The clinical picture of acute pancreatitis is characterized by a sudden onset of vomiting, anorexia,
depression, dehydration, abdominal pain or discomfort, and in some cases diarrhea. Abdominal
discomfort may only be evident upon abdominal palpation. In dogs with systemic involvement, signs
of shock, respiratory distress, bleeding disorders, and cardiac arrhythmias may also be present. Signs
of chronic pancreatitis are more variable and non-specific (Pidgeon, 1987b; Rutgers et al., 1985).

16
Diagnostic imaging studies can include radiography, ultrasonography, or computed tomography of
the abdomen. Radiographic signs of pancreatitis include dilated intestinal loops, an increased
density, diminished contrast, and granularity in the right cranial abdomen, and transposition of
abdominal organs. However, these findings are not very sensitive or specific. In contrast, abdominal
ultrasonography is highly specific for pancreatitis if stringent criteria are applied (Steiner, 2003).
Pancreatic enlargement alone is not sufficient to make a diagnosis of pancreatitis, because pancreatic
edema can also be observed in other conditions. The pancreas may appear hypoechoic when
pancreatic necrosis is present and may appear hyperechoic in cases where pancreatic fibrosis has
developed (Hess et al., 1998). Also, pancreatitis is often associated with various degrees of
peripancreatic fluid accumulation. A loss of echodensity is indicative of pancreatic necrosis (Nyland
et al., 1983). Serum chemistry findings may vary and usually include leucocytosis, an increased
packed cell volume, azotemia, hypercholesterolemia, and fasting hypertriglyceridemia (Hill and Van
Winkle, 1993; Schaer, 1979). Additionally, the release of high concentrations of toxic substances
from the pancreas into the portal blood may result in increased hepatic enzyme activities (Jacobs et
al., 1985). Necrotizing pancreatitis in dogs is often accompanied by hyperglycemia, potentially in
response to stress-related increases in catecholamines and cortisol (Hill and Van Winkle, 1993).
Serum lipase activity has been used for the diagnosis of pancreatitis for several decades but is neither
very sensitive nor very specific for the diagnosis of pancreatitis in the dog (Strombeck et al., 1981).
Measurement of serum pancreatic lipase immunoreactivity is the most sensitive and specific
diagnostic test for canine pancreatitis currently available. This assay is now widely used for the
diagnosis of pancreatitis in the dog (Steiner et al., 2003).
Withholding oral intake of food and water for 3 to 5 days has been recommended as standard therapy
of pancreatitis in the dog. However, recent studies in human patients with pancreatitis would suggest
that this practice may not only be unnecessary but detrimental to the patient (Kahl et al., 2003). If the
patient is vomiting such practice may be justified and slow introduction of a low-fat maintenance
diet should be attempted after the animal stops to vomit. If drugs or other agents are suspected to be
the cause of the condition, these substances should be withdrawn and replaced by alternative agents.
Fluid therapy over several days is required to counterbalance dehydration as well as fluid and
electrolyte losses (Drazner, 1986; Pidgeon, 1987a).

17
2.3.3.2. Chronic Pancreatitis in the Miniature Schnauzer
The clinical picture in this breed is characterized by recurrent signs of pancreatitis (Lasson and
Ohlsson, 1984; Rogers et al., 1975), and based on the high prevalence of pancreatitis in the
Miniature Schnauzer (Williams, 1996), several authors have also postulated a genetic predisposition
for pancreatitis in this breed (Zawie, 1996). Hereditary pancreatitis is a well-known disease in
humans. Genes involved in the development of chronic pancreatitis are the cationic trypsinogen gene
(Whitcomb, 2000), lipoprotein lipase gene (Peterson and Amir, 2002), cystic fibrosis gene (Sharer
and Schwarz, 1998) and pancreatic secretory trypsin inhibitor gene (Hirota and Kuwata, 2003). The
role of the cationic trypsinogen gene in Miniature Schnauzers with chronic pancreatitis has been
evaluated (Bishop et al., 2004), however, no evidence was found that mutations within that gene
were responsible for the disease in Miniature Schnauzers. As mentioned earlier mutations within the
human LPL gene can cause changes at the major binding sites of the enzyme, thereby leading to a
lack in lipase activity of LPL. Humans having these mutations showed severe hyperlipoproteinemia
and pancreatitis (Peterson and Amir, 2002). According to the high incidence of idiopathic
hyperlipidemia in Miniature Schnauzers in the United States a disruption within the lipid metabolism
was proposed to be the inciting event of the disease process in Miniature Schnauzers rather than a
pancreatic disease itself (Williams, 1996; Zawie, 1996).
2.3.3.3. Exocrine Pancreatic Insufficiency (EPI)
The pancreas is known to have a large functional reserve, and clinical signs due to exocrine
pancreatic insufficiency do not occur until a significant portion of pancreatic function, approximately
90%, has been lost (DiMagno et al., 1973). The most common cause of EPI in the dog is pancreatic
acinar atrophy, whereas EPI due to chronic pancreatitis, which is the most common cause of EPI in
people, occurs less commonly in the dog (Holroyd, 1968; Rimaila-Pärnänen and Westermarck,
1982). Pancreatic acinar atrophy (PAA) is most commonly recognized in German Shepherd dogs
(GSDs) and rough-coated Collies, but other breeds may also be affected. The prevalence of PAA in
the German Shepherd dog is higher than in any other breed (Westermarck et al., 1989; Westermarck
et al., 1993). Initial studies evaluating several pedigrees suggested an autosomal recessive mode of

18
inheritance (Westermarck, 1980). Recently, statistical analysis has been carried out in 2 unrelated
multigenerational pedigrees of 135 German Shepherd dogs and the results strongly suggest an
autosomal recessive mode of inheritance in these pedigrees (Moeller et al., 2000). However, after 10
years of follow up only 2 of 6 dogs from a litter bred from 2 affected parents developed PAA (Elias
Westermarck , personal communication, 2004), observations that are not consistent with such a
mode of inheritance. Thus the trait of PAA, at least in some lines, may well be polygenic. Linkage
studies using the MSS-1 and the MSS-2 are under way in order to identify a genetic marker for PAA
in the German Shepherd dog (Clark et.al., personal communication, 2004).
PAA is characterized by progressive atrophy of pancreatic acinar tissue along with scattering and
disorganization of pancreatic acinar cells (Westermarck et al., 1993). Islets of Langerhans are
disorganized, but remain otherwise unaffected. Concurrent diabetes mellitus is not a feature of dogs
with PAA.
There is considerable evidence that immune-mediated mechanisms play a major role in the
pathogenesis of PAA (Wiberg et al., 1999). Once acinar cell atrophy is almost complete, the lack of
digestive enzymes results in malabsorption and eventually the classical clinical signs of EPI. Not
only are pancreatic enzymes crucial for nutrient digestion, but they also affect small intestinal
mucosal function, brush border enzyme activity, and the small intestinal microflora. Concurrent
small intestinal bacterial overgrowth (SIBO) is observed in more than 70% of the German Shepherd
dogs diagnosed with PAA (Sorensen et al., 1988; Williams et al., 1985).
At the time of diagnosis dogs are usually between 1 and 5 years of age. Feces are soft and
voluminous with a grey-yellowish color, and borborygmus and flatulence may be marked. Severe
weight loss and polyphagia are common findings in cases that are not diagnosed early in the disease
process. Additionally, vomiting and bouts of anorexia have been reported in some GSDs with PAA
(Raiha and Westermarck, 1989; Rogers et al., 1983; Westermarck et al., 1989).
Canine trypsin like immunoreactivity (cTLI) is the diagnostic test of choice for diagnosing EPI
(Williams and Batt, 1988). Recently, an assay for the measurement of elastase in feces has been
developed, but this assay has a poor positive predictive value for canine EPI (Spillmann et al., 1998).
Affected dogs generally respond well to supplementation of the diet with powdered pancreatic
extract (2 tsp/20 kg/meal) (Pidgeon and Strombeck, 1982). Additionally, supplementation with

19
vitamin E (400-500 IU/20 kg once daily with food for 1 month initially) and cobalamin (250-1000
µg SC once a week for 4-6 weeks initially) should be considered, since deficiencies of these vitamins
are common, may not resolve with enzyme supplementation alone, and yet are safely and
inexpensively supplemented. Additional therapeutic measures are required in a minority of patients
(Sarner, 2003).
2.3.3.4. Pancreatic Neoplasia
Pancreatic neoplasia is uncommonly diagnosed in dogs and is mainly found in older animals.
Adenocarcinomas originating from acinar or duct cells have both been described, and the Airedale
terrier appears to have an increased incidence for pancreatic adenocarcinomas (Withrow, 1996). At
the time of diagnosis metastases are usually present in the duodenum, the liver, and/or the local
lymph nodes. Clinical signs are mainly nonspecific and may include weight loss, anorexia,
depression, and vomiting. Additionally, metastases obstructing the bile ducts or pancreatic ducts
might result in icterus and/or EPI (Bright, 1985). Abdominal radiographs and ultrasonic imaging are
helpful to identify pancreatic masses. However, pancreatic biopsy is required for a definitive
diagnosis. The prognosis for animals with carcinomas of the exocrine pancreas is extremely poor
(Banks, 1993), and supportive therapy should be targeted at associated conditions, such as diabetes
mellitus and EPI (Bright, 1985).

20
3. Materials and Methods
3.1. Study Subjects
The database of the Gastrointestinal Laboratory at Texas A&M University was screened for
Miniature Schnauzer dogs for which a serum sample was available. Serum sample were available
from 170 Miniature Schnauzers and serum cPLI concentrations were measured in each sample using
an in-house ELISA (Steiner et al., 2003). Serum cPLI exclusively measures lipase that originates
from the exocrine pancreas. Serum cPLI has been shown to be specific for exocrine pancreatic
function in the dog and is also highly sensitive for canine pancreatitis (82%). Serum cPLI is the most
sensitive and specific diagnostic test currently available for the diagnosis of canine pancreatitis. A
serum cPLI concentration above 200.0 µg/L was considered diagnostic for a diagnosis of
pancreatitis. A value of 102.1 µg/L and below was considered normal and dogs with serum cPLI
concentrations below this value served as control dogs.
Two study groups were established. The first group consisted of 12 affected dogs based on a serum
cPLI concentration above 200.0 µg/L, a clinical history compatible with pancreatitis and a serum
triglyceride concentration above the upper limit of the reference range. Also, 9 healthy control dogs
were chosen based on a serum cPLI concentration of 102.1 µg/L or less, a lack of clinical signs
compatible with pancreatitis, and a serum triglyceride concentration within the reference range.
DNA was then collected from these 21 dogs using DNA extraction techniques as described below.
3.2. Isolation of DNA
3.2.1. DNA Extraction from White Blood Cells
DNA extraction from white blood cells using whole blood samples was performed using Puregene
DNA Purification Kit (Gentra Systems, Minneapolis, MN, USA) according to manufacturer’s
instructions. Briefly, a 300 µl peripheral blood sample was taken from the jugular vein and

21
anticoagulated in EDTA. Red blood cell lysis solution (Puregene, Gentra Systems), 900 µl, was
added and the sample was incubated at room temperature for 10 min, then centrifuged for 30 seconds
at 15,000 x g (Centrifuge 5417C, Eppendorf). The supernatant was discarded and the pellet was
vigorously vortexed to resuspend the white blood cells. The cells were lysed by addition of 300 µl
cell lysis Solution (Puregene, Gentra Systems). The protein was then precipitated by addition of 100
µl protein precipitation solution (Puregene, Gentra Systems) followed by vigorous vortexing for 20
sec and centrifugation for 3 min at 15,000 x g. The resulting supernatant, containing the DNA, was
retained and transferred into a new tube. DNA was precipitated by addition of 300 µl isopropanol
(100%), followed by centrifugation for 4 min at 15, 000 x g. The resulting DNA pellet was dried by
addition of 300 µl ethanol (70 %) followed by centrifugation for 2 min at 15,000 x g. Samples were
air dried for 15 min. The DNA was rehydrated by incubation of the sample with 100 µl of DNA
Hydration Solution (Puregene, Gentra Systems) overnight at room temperature. The DNA samples
were stored at -20ºC until use.
3.2.2. DNA Extraction from Mucosal Cells
DNA extraction from buccal mucosal cells was performed using Puregene DNA Purification Kit
(Gentra Systems) according to the manufacturer’s instructions. Briefly, samples were collected by
rolling cytology brushes (CytoSoft, Medical Packing Corporation) over the buccal mucosa of the
dogs. Four samples were collected from each dog. The brush was placed into a tube and 300 µl of
Cell Lysis Solution (Puregene, Gentra Systems) and 1.5 µl Proteinase K (20 mg/ml) (Puregene,
Gentra Systems) were added. The tube was inverted several times to ensure distribution of the
solution over the entire brush, and the sample was incubated over night at 55˚C (Branson 2210,
Branson Ultrasonic Corp., CT, USA). The brush was removed and 100µl protein precipitation
solution (Puregene, Gentra Systems) were added and votexed for 20 sec prior to incubation for 15
min at -20˚C. The sample was centrifugation for 5 min at 15, 000 x g. The resulting supernatant,
containing the DNA, was retained and transferred into a new tube. The DNA was precipitated by
addition of 500 µl isopropanol (100%) and 4 µl glycogen (12 mg/ml; Purescript, Gentra Systems),
followed by 30 min incubation at -80˚C and centrifugation for 5 min at 15, 000 x g. The resulting

22
DNA pellet was dried by addition of 300 µl ethanol (70 %), followed by centrifugation for 2 min at
15,000 x g. Samples were air dried for 15 min. The DNA was rehydrated by incubation of the sample
with 40 µl of DNA Hydration Solution (Puregene, Gentra Systems) overnight at room temperature.
The DNA samples were stored at -20ºC until use.
3.2.3. Quality Control and DNA Concentration
Gel electrophoresis
Gel electrophoresis was used to estimate the DNA yield and quality. One µl of each sample was run
on a 2.5 % agarose gel (Agarose Low EEO, Fisher Scientific, Hampton, NH, USA) prepared in TAE
– buffer (Tris – Acetate – EDTA Buffer, Sigma-Aldrich, St.Louis, MO, USA) in an electrophoresis
chamber (BioMax MP1015, Kodak, Rochester, NY, USA) for 90 min at 90 volt (Model 300 Power
Supply, VWR Scientific, West Chester, PA, USA). The gel was stained in an ethidium bromide (0.5
µg / ml) bath for 10 min, followed by a de-staining for 25 min in water. The DNA was cross-linked
by exposure to UV light for 1 sec and its banding pattern was documented with a digital camera.
Samples that exhibited degradation were not included in the analysis. An estimate of the sample
concentration was made based on the comparison with a reference sample (2 – log Ladder, BioLabs
Inc., Beverly, MA, USA).
Spectrophotometry
To standardize amplification the DNA was quantified by spectrophotometry. The extinction for each
probe was measured at a wavelength of 260 nm (E260
) for DNA and 280 nm (E280
) for protein
(Ultrospec 2000, Pharmacia/Pfizer, New York, NY, USA). Calculation of the DNA concentration:
CDNA = E260
x 50 ng/µl x 35
Samples were diluted or reconcentrated to 100 ng/µl. Protein contamination has the potential to
interfere with amplification. Therefore, samples showing a high protein content (E260
/ E280
ratio ≤

23
1.5) underwent on additional step of protein precipitation (see 3.1.1.). If protein content remained
high after the second precipitation the samples were not included in the analysis.
The collected DNA samples were then used to determine the nucleotide sequence of the LPL gene in
the 21 canine subjects. Sequences were analyzed and compared between the affected dogs and the
healthy control dogs to determine if sequence differences correlate with the affected phenotype. The
methodology used is described in detail in the following section.
3.3. Primer Design
3.3.1. Nucleotide Sequence of the Canine LPL Gene
The nucleotide sequence of the lipoprotein lipase gene (LPL) has been published for a variety of
species, but not for the dog. Therefore, coding DNA sequences of the human
(www.ncbi.nlm.nih.gov/entrez, NM_000237), bovine (www.ncbi.nlm.nih.gov/entrez, AY216661,
M16966), porcine (www.ncbi.nlm.nih.gov/entrez, NM_214286), murine
(www.ncbi.nlm.nih.gov/entrez, M63335) and avian (www.ncbi.nlm.nih.gov/entrez, NM_205282)
LPL gene were used for reference in this study. The LPL gene is very well conserved among species
(see 2.1.4.). By comparing (ClustalW, www.ebi.ac.uk/clustalw/) the cDNA of the non-human species
against the human exons, it was possible to clearly identify the respective exonic regions within the
other species (fig. 3.1). The same approach was used to identify the unknown sequence of exon 1 – 9
in the canine genome. Human LPL cDNA was used as a reference. The complete sequence of the
canine genome has recently been identified and is available in an on-line database (Trace Archive,
www.ncbi.nlm.nih.gov/Traces/trace.cgi). However, the majority of canine genes, including the LPL
gene, had not been characterized at the beginning of this study. Each exon of the human LPL gene
was compared with the canine genome to identify clones of high homology with the respective exon.
Specifically, the on-line service Megablast (www.ncbi.nlm.nih.gov/BLAST/mmtrace.shtml) was
used to screen the Trace Archive database and retrieve the sequence for exon 1 through 9 of the
canine LPL gene.

24
Figure 3.1: Example of a multiple sequence alignment among the different species
The results were then compared to the entire NCBI database (www.ncbi.nlm.nih.gov) using
Megablast to exclude the possibility that the identified nucleotide sequences encode for similar genes
(e.g. pancreatic lipase, hepatic lipase) instead of the LPL gene.
3.3.2. Identification of Primer Sites
The Trace Archive blast provided a variety of canine clones for each exon as well as the neighboring
intronic regions of the canine LPL gene. The respective clones of each exon were compared in a
multiple sequence alignment (ClustalW, www.ebi.ac.uk/clustalw/) to verify the given sequence and
to exclude amplification and sequencing errors. The intronic regions surrounding each exon were
then searched for suitable sites for primer design. Regions with repetitive sequence motives were
avoided. Goal of the primer design was to obtain primers that could be used to amplify the complete
exon as well as the exon/intron boundaries, which give additional information about splicing sites.

25
3.3.3. Primer Design
The on-line software Netprimer (www.premierbiosoft.com/netprimer/index.html) was used for
primer design for identified sites. Netprimer combines primer design algorithms with a web-based
interface allowing the user to analyze primers over the Internet. All primers are analyzed for melting
temperature (Tm) using the nearest neighbor thermodynamic theory to ensure accurate Tm prediction.
Primers are analyzed for all secondary structures including hairpins, self-dimers, and cross-dimers in
primer pairs. This ensures the availability of the primer for the reaction, as well as, minimizing the
formation of primer dimers. Table 3.3 shows the designed primer pairs including their respective
comprehensive analysis report. The following variables were used as the main decision making
criteria.
Rating
The rating of a primer allows for simplified identification of the predicted efficiency of a primer as
well as choosing between closely matched primers; the higher the rating of a primer, the higher is it’s
amplification efficiency. The rating of individual primers is based on the stability of its secondary
structures and was calculated as:
Rating = 100 + (∆G (Dimer) * 1.8 + ∆G (Hairpin) * 1.4)
Melting Temperature (Tm)
The melting temperature was calculated using the formula based on the nearest neighbor
thermodynamic theory and is defined as the temperature at which half of the oligonucleotides are
bonded (Freier et al., 1986). Tm was calculated as:
Tm = ∆H / (∆S + R * ln(C/4)) + 16.6 log ([K+] / (1 + 0.7 [K+])) - 273.15
∆H = enthalpy for helix formation
∆S = entropy for helix formation
R = molar gas constant (1.987 cal/°C * mol)
C = the nucleic acid concentration
[K+] is the potassium salt concentration

26
GC%
GC% is the percentage of G and C of the primer. It is calculated by dividing the sum of G and C with
the total number of bases present in the primer. An optimal value of 50 – 60 % has been suggested.
3' end stability
The stability of the primer determines its false priming efficiency. An ideal primer has a stable 5' end
and an unstable 3' end. If the primer has a stable 3' end, it may anneal to a site, which is
complementary to, but different from the target with its 5' end unattached. This may lead to
amplification of unwanted sequences.
Primers with low stability at the 3' ends function well because the 3' end annealing to false priming
sites are too unstable to extend. The 3' end stability is expressed by the ∆G value of the 5 bases of the
primer taken from its 3' end. The lower this value, numerically, the more liable the primer is to show
secondary bands.
Free Energy (∆∆∆∆G)
∆G is the free energy of the primer calculated using the nearest neighbor method (Breslauer et al.,
1986). ∆G is calculated by the formula ∆G = ∆H - T∆S. Here ∆H is the enthalpy of primer, T is the
temperature, ∆S is the entropy of primer. T is set to 25ºC.
∆∆∆∆H
∆H is the enthalpy of the primer as calculated by the nearest neighbor method (Table 3.1) (Breslauer
et al., 1986). ∆H is calculated from the nucleotide sequence. For example ∆H for a pentamer
ATGCA is calculated as follows:
∆H (ATGCA) = ∆H (AT) + ∆H (TG) + ∆H (GC) + ∆H (CA)

27
Table 3.1: Enthalpy values ∆H of a nearest neighbor nucleotide (in -cal/°K/mol)
Second Nucleotide → First Nucleotide ↓
dA dC dG dT
dA 9100 6500 7800 8600
dC 5800 11000 11900 7800
dG 5600 11100 11000 6500
dT 6000 5600 5800 9100
∆∆∆∆S
∆S is the entropy of the primer as calculated by the nearest neighbor method ( Table 3.2) (Breslauer
et al., 1986).
∆S is calculated based on the nucleotide sequence of the primer. For example, ∆S for a pentamer
ATGCA is calculated as follows:
∆S (ATGCA) = ∆S (AT) + ∆S (TG) + ∆S (GC) + ∆S (CA)
An initiation value of 15.1 is added to the ∆S calculation.
Table 3.2: Entropy values ∆S of a nearest neighbor nucleotide (in -cal/°K/mol)
Second Nucleotide → First Nucleotide ↓
dA dC dG dT
dA 24.0 17.3 20.8 23.9
dC 12.9 26.6 27.8 20.8
dG 13.5 26.7 26.6 17.3
dT 16.9 13.5 12.9 24.0
5' end stability
Stability of the 5' terminus allows for efficient annealing of the primer to the target site. This stable 5'
region is called the GC clamp. It ensures adequate binding of the primer to the template. Use of
primers with optimal stability allows for the use of lower annealing temperatures without the

28
production of secondary bands. Notice that the 3' end should not be very stable and the 5' end should
have a strong GC clamp. The GC Clamp is the ∆G value of the 5 bases of the primer taken from its 5'
end. The lower this value, numerically, the more efficient is the primer.
Repeats and Runs
Repeats and runs increase the likelihood of false priming. Primers having 3 or more dinucleotide
repeats or 3 or more base runs were reported.
Secondary Structures of Primers
Hairpins
A hairpin loop is formed when primer folds back on itself and is held in place by intramolecular
bonds. Because hairpin loop formation is an intramolecular reaction, it can occur with as few as 3
consecutive homologous bases. The free energy represents the stability of the hairpin loop. The free
energy of the loop is based upon the energy of the intramolecular bond and the energy needed to
twist the DNA to form the loop. If this free energy is greater than 0, the loop is too unstable to
interfere with the reaction. However, if the free energy is less than 0, the loop could reduce the
efficiency of the amplification rection.
Dimers and Cross Dimers
Dimers occur when a region of homology is present within a primer (self-dimer) or between the
sense and anti-sense primer (cross-dimer). This results in annealing of the two primers, increasing
production of the primer dimer artifact and reducing product yields.
This is particularly problematic when the homology occurs at the 3' end of either primer. The 3' end
will extend readily leading to primer-dimer artifact.

29
Table 3.3: Forward and reverse primer for amplification of exon 1 of the canine LPL gene
Oligo Name Ex1-U(2)-F Ex1-U(2)-R
Sequence GAGTGGGAACAGTGTCAGACTCG CCAACGCCTGAGGTTCTCC
Bases 23 19
Rating 90 92
Tm (°C) 61.04 60.09
GC% 56.52 63.16
∆G (kcal/mol) -35.99 -34.53
3' end stability (kcal/mol) -8.13 -7.82
∆H (kcal/mol) -157.9 -150
∆S (kcal/mol) -0.41 -0.39
5' end stability (kcal/mol) -6.47 -8.31
Hairpins (kcal/mol)
Dimers (kcal/mol) -5.52 -4.17
Palindromes (kcal/mol)
Repeats
Runs GGG
Cross Dimers (kcal/mol) -5.86
Table 3.4: Forward and reverse primer for amplification of exon 2 of the canine LPL gene
Oligo Name WGS-Ex2(2)-F WGS-Ex2(2)-R
Sequence TAGCATCGGTGGTAGTTGC TTAGATTCCACAGTCCTCACC
Bases 19 21
Rating 86 100
Tm (°C) 54.17 53.97
GC% 52.63 47.62
∆G (kcal/mol) -31.53 -32.01
3' end stability (kcal/mol) -8.38 -7.94
∆H (kcal/mol) -143.9 -148.5
∆S (kcal/mol) -0.38 -0.39
5' end stability (kcal/mol) -7.65 -6.08
Hairpins (kcal/mol) -1.59
Dimers (kcal/mol) -6.09
Palindromes (kcal/mol)
Repeats
Runs
Cross Dimers (kcal/mol) -7.37

30
Table 3.5: Forward and reverse primer for amplification of exon 3 of the canine LPL gene
Oligo Name Ex-3-U(1)-F Ex-3-U(1)-R
Sequence CAAGTTGTAAGTGGTTATTTTAGG TTATCATAATGCTGCTTTCTGG
Bases 24 22
Rating 92 92
Tm (°C) 53.73 55.58
GC% 33.33 36.36
∆G (kcal/mol) -35.63 -34.73
3' end stability (kcal/mol) -7.57 -8.2
∆H (kcal/mol) -179.1 -165.2
∆S (kcal/mol) -0.48 -0.44
5' end stability (kcal/mol) -6.84 -5.95
Hairpins (kcal/mol)
Dimers (kcal/mol) -3.91 -4.38
Palindromes (kcal/mol)
Repeats
Runs TTTT TTT
Cross Dimers (kcal/mol) -4.38
Table 3.6: Forward and reverse primer for amplification of exon 4 of the canine LPL gene
Oligo Name WGS-Ex4(4)-F WGS-Ex4(4)-R
Sequence GAGTTAATTTTCAGCATTGCC TCGCTTCTGACAGTAGGTGG
Bases 21 20
Rating 88 100
Tm (°C) 54.82 55.88
GC% 38.1 55
∆G (kcal/mol) -33.97 -32.3
3' end stability (kcal/mol) -10.11 -9.43
∆H (kcal/mol) -161.7 -145
∆S (kcal/mol) -0.043 -0.38
5' end stability (kcal/mol) -6.46 -9.92
Hairpins (kcal/mol) -0.32
Dimers (kcal/mol) -6.09
Palindromes (kcal/mol)
Repeats
Runs TTTT
Cross Dimers (kcal/mol) -5.13

31
Table 3.7: Forward and reverse primer for amplification of exon 5 of the canine LPL gene
Oligo Name Ex-5-U(1)-F Ex-5-U(1)-R
Sequence GATCCAATCACTACAGAATAAGG CAAGTGCTATACATGTGACCAG
Bases 23 22
Rating 91 85
Tm (°C) 53.12 53.37
GC% 39.13 45.45
∆G (kcal/mol) -33.46 -31.98
3' end stability (kcal/mol) -7.57 -7.96
∆H (kcal/mol) -163.3 -150.2
∆S (kcal/mol) -0.44 -0.4
5' end stability (kcal/mol) -7.69 -6.84
Hairpins (kcal/mol)
Dimers (kcal/mol) -4.62 -8.07
Palindromes (kcal/mol) ACATGT
Repeats
Runs
Cross Dimers (kcal/mol) -4.89
Table 3.8: Forward and reverse primer for amplification of exon 6 of the canine LPL gene
Oligo Name WGS-Ex6-F WGS-Ex6-F
Sequence TCGAGCTGTTAACTGCCACC AGGCTGCTGCATAGAGTAGTGC
Bases 20 22
Rating 86 84
Tm (°C) 58.61 59.25
GC% 55 54.55
∆G (kcal/mol) -34.21 -36.19
3' end stability (kcal/mol) -9.43 -8.03
∆H (kcal/mol) -151.8 -164.6
∆S (kcal/mol) -0.39 -0.43
5' end stability (kcal/mol) -8.36 -9.41
Hairpins (kcal/mol) -1.99
Dimers (kcal/mol) -7.53 -7.05
Palindromes (kcal/mol) GTTAAC
Repeats
Runs
Cross Dimers (kcal/mol) -4.3

32
Table 3.9: Forward and reverse primer for amplification of exon 7 of the canine LPL gene
Oligo Name WGS-Ex7-F WGS-Ex7-R
Sequence CTGAATTGCCTGCTTATCTGG CCTACTCTTCTTCTGTTCTAAAGACC
Bases 21 26
Rating 90 86
Tm (°C) 57.79 57.25
GC% 47.62 42.31
∆G (kcal/mol) -35.02 -38.32
3' end stability (kcal/mol) -8.2 -7.58
∆H (kcal/mol) -160.3 -187.4
∆S (kcal/mol) -0.42 -0.5
5' end stability (kcal/mol) -7.07 -6.97
Hairpins (kcal/mol) -2.02
Dimers (kcal/mol) -5.36 -6.12
Palindromes (kcal/mol)
Repeats
Runs AAA
Cross Dimers (kcal/mol) -4.54
Table 3.10: Forward and reverse primer for amplification of exon 8 of the canine LPL gene
Oligo Name WGS-Ex8-F WGS-Ex8-R
Sequence CCTACATGCCATTGATCC GGGAGGCTCCATTATCC
Bases 18 17
Rating 89 86
Tm (°C) 50.74 51.58
GC% 50 58.82
∆G (kcal/mol) -29.08 -29.71
3' end stability (kcal/mol) -7.69 -7.08
∆H (kcal/mol) -133.7 -136.6
∆S (kcal/mol) -0.35 -0.36
5' end stability (kcal/mol) -6.97 -9.31
Hairpins (kcal/mol) -1.34
Dimers (kcal/mol) -5.62 -6.24
Palindromes (kcal/mol)
Repeats
Runs GGG
Cross Dimers (kcal/mol) -5.64

33
Table 3.11: Forward and reverse primer for amplification of exon 9 of the canine LPL gene
Oligo Name WGS-Ex9-F WGS-Ex9-R
Sequence GTCGCTGACCAGAATGG AGCCACAAGAATCAGTGC
Bases 17 18
Rating 88 91
Tm (°C) 51.11 50.46
GC% 58.82 50
∆G (kcal/mol) -28.27 -28.65
3' end stability (kcal/mol) -8.44 -8.03
∆H (kcal/mol) -125.5 -130.8
∆S (kcal/mol) -0.33 -0.34
5' end stability (kcal/mol) -9.67 -9.76
Hairpins (kcal/mol) -0.82 -0.2
Dimers (kcal/mol) -6.02 -4.3
Palindromes (kcal/mol)
Repeats
Runs
Cross Dimers (kcal/mol) -6.13
The designed primer pairs were then used to amplify exon 1 through 9 of the LPL gene in the 21
Miniature Schnauzers.
3.4. Polymerase Chain Reaction (PCR)
3.4.1. Primer Concentration
The commercially produced primer (Sigma–Genosys, St.Louis, MO, USA) were reconstituted in
TAE – buffer and used at a final primer concentration of 10 µmol/L.
3.4.2. Optimization of Amplification Conditions
To determine the optimal amplification conditions for each primer pair 9 different premixes (#1-9),
containing different concentrations of buffered salt solution with nucleotides, Mg2+ and MasterAmp
PCR enhancer with betaine, were tested at different annealing temperatures. Reactions with a total

34
volume of 25 µl were prepared on ice. A mastermix [95 µl sterile water, 10 µl forward primer
solution, 10 µl reverse primer solution, 5 µl DNA (100 ng/µl) and 5 µl DNA polymerase mix
(MasterAmp Extra – Long DNA Polymerase Mix; 2.5 U / µl, Epicentre, WI, USA)] was used. The
mastermix (12.5 µl) was combined with the respective premix (12,5 µl; MasterAmp Extra-Long
PCR 2X Premixes 1 – 9). A negative control was prepared using 10 µl sterile water, 1 µl forward
primer solution, 1 µl reverse primer solution, 5 µl DNA polymerase mix (MasterAmp Extra – Long
DNA Polymerase Mix; 2.5 U / µl) and 12.5 µl premix. All samples were centrifuged at low speed for
5 sec. A Mastercycler Gradient Thermal Cycler (Eppendorf, Hamburg, Germany) was programmed
using the following variables:
• Initial denaturation at 94 ºC for 45 seconds.
• Denaturation at 94 ºC for 45 seconds for 30 cycles.
• A touchdown approach was used for annealing. The first cycle used an annealing temperature
3ºC above the calculated primer melting temperature. During each of the following 6 cycles
the annealing temperature was decreased by 1 ºC, and then held constant at 3 ºC below the
calculated melting temperature for the following 23 cycles. During each cycle the annealing
temperature was held constant for 1 min.
• Extension at 72ºC for 2.5 min for 30 cycles.
• Final extension at 72ºC for 18 min.
Additionally, a positive contol (21 µl sterile water, 3 µl Contol Lambda DNA Template/Primer, 1 µl
DNA polymerase mix (MasterAmp Extra – Long DNA Polymerase Mix 2.5 U / µl) for each premix
was prepared whenever a new batch of MasterAmp Extra-Long PCR Kit was purchased.
Amplification conditions were as follows:
• Initial denaturation at 98ºC for 1 min
• Denaturation at 98ºC for 20 seconds for 20 cycles
• Annealing at 56ºC for 1 min for 20 cycles
• Extension at 68ºC for 20 min for 20 cycles

35
An agarose gel was prepared as described in section 3.2.3. PCR tubes were put on ice, 5 µl running
buffer (6X Type I Loading Solution, Sigma) were added and mixed with the sample. The gel was
loaded with 17 µl of the mixture per well. A reference sample comprised of a log ladder (2 – log
Ladder, BioLabs Inc.) was loaded into a separate well. Staining, de-staing and evaluation of the gel
were performed as described in 3.2.3.
A premix was chosen that resulted in one band of the desired template size (fig. 3.2). Using this
premix, PCR reactions were performed at different temperatures to determine the optimal annealing
temperature. These conditions were then used for large scale amplification of the samples from the
Miniature Schnauzer.
Figure 3.2: Example for PCR optimization: amplification of exon 3 using different premixes. The second
column shows the reference sample.
If no specific amplification could be achieved the primer pair for the corresponding exon was
discarded and a new primer pair was designed.

36
3.4.3. Sequencing
3.4.3.1. Amplification Conditions for Exon 1 - 9
Each exon was amplified in two 50 µl reactions containing:
• 2 µl forward primer
• 2 µl reverse primer
• 1.5 µl DNA
• 19 µl sterile water
• 1 µl Taq
• 25 µl Premix
Different conditions were used to amplify the 9 exons of the canine LPL gene (Table 3.4).
Table 3.12: Amplification conditions exon 1 - 9
Tm (°C) Premix
Exon 1 65 2
Exon 2 61 4
Exon 3 58 1
Exon 4 60 3
Exon 5 58 4
Exon 6 63 2
Exon 7 61 1
Exon 8 58 6
Exon 9 58 9
3.4.3.2. Direct Sequencing of Exon 1 - 9
DNA fragments from PCR reactions were purified using a QIAquick PCR Purification Kit (Qiagen,
Hilden, Germany) as specified by the manufacturer. The two identical PCR products from each exon
were combined in this step to increase the final DNA concentration. Spectrophotometry was used to
determine the concentration of the PCR product as specified in section 3.2.3.
Sequencing reactions were carried out in 6 µl volumes containing 100 – 200 ng PCR product, 2 µl
Big Dye® Terminator v 1.1 Cycle Sequencing Mix (Applied Biosystems, Foster City, CA, USA), 10

37
pmol primer, and sterile water. Thermal Cycling was performed on a Mastercycler Gradient Thermal
Cycler (Eppendorf) using 30 cycles of 96ºC for 30 seconds, 55ºC for 15 seconds and 60ºC for 4 min.
Primer, shown in Tables 3.4 through 3.11, were used for sequencing reactions of exon 2 through 9.
No specific amplification could be achieved for exon 1 (fig 3.3). Therefore, nested primers were used
to sequence exon 1:
Ex1-S(1)-F: 5’TCTCGGAGGGAACCAGC
Ex1-S(2)-F: 5’CGAGATGGAGAGCAGAGC
Ex1-S(1)-R: 5’CCAACGCCTGAGGTTCTCC
Figure 3.3: Amplification of exon 1
Reactions were purified by diluting the samples with 25 µl sterile water, adding the solution onto
Spin-50 Mini-Columns (USA Scientific, Ocala, FL, USA) and centrifuging it for 4 min at 1000 x g.

38
Samples were then dried completely using a vacuum centrifuge (SC 210A modular multicomponent
system, Savant Instruments, Holbrook, NY, USA). Automated sequencing was performed on an ABI
3100 Genetic Analyzer (Hitachi, Tokyo, Japan).

39
4. Results
4.1. LPL Gene Sequence in the Miniature Schnauzer
The LPL gene was amplified and sequenced in 21 Miniature Schnauzers. 3 sequences were obtained
from each dog. A triplicate that showed identical nucleotide sequences was compared to the other
dogs in the study. If a triplicate was not homogeneous further sequencing was performed in order to
verify those variations. Figures 4.1 through 4.9 show the complete cDNA sequence, the amino acid
sequence (one letter code) and the sequence for the exon/intron boundaries (3’ and 5’ end of the
respective intron) for the LPL gene that was common in all Miniature Schnauzers evaluated.
Figure 4.1: This figure shows the nucleotide and protein sequence of exon 1
Exon 1
atggagagcagagccctactcctggtggccctgggcatgtggctgcagagtctggccgcc
M E S R A L L L V A L G M W L Q S L A A
gccgcccgaattccag
A A R I P
The 14 underlined nucleotides represent the area of the sequence for primer placement.
Figure 4.2: This figure shows the nucleotide and protein sequence of exon 2
Exon 2 Intron 1 (3’end): CAACTTTTCCTTTTTTAGGAATTCCAG
Exon 2: gaggaaatgattttgtagatatcgaaagtaaatttgctctaaggacccctgaagacacag
G N D F V D I E S K F A L R T P E D T
ctgaggatacctgccacctcattcccggagtgatagaatctgtggctaactgccacttca
A E D T C H L I P G V I E S V A N C H F
atcacaccagcaagacctttgtggtgatccatggctggacg
N H T S K T F V V I H G W T
Intron 2 (5’end): GTAAGACAGTTTCTTAGGGAAGGAGCAGATTGGGGTAGACCAGGCAT
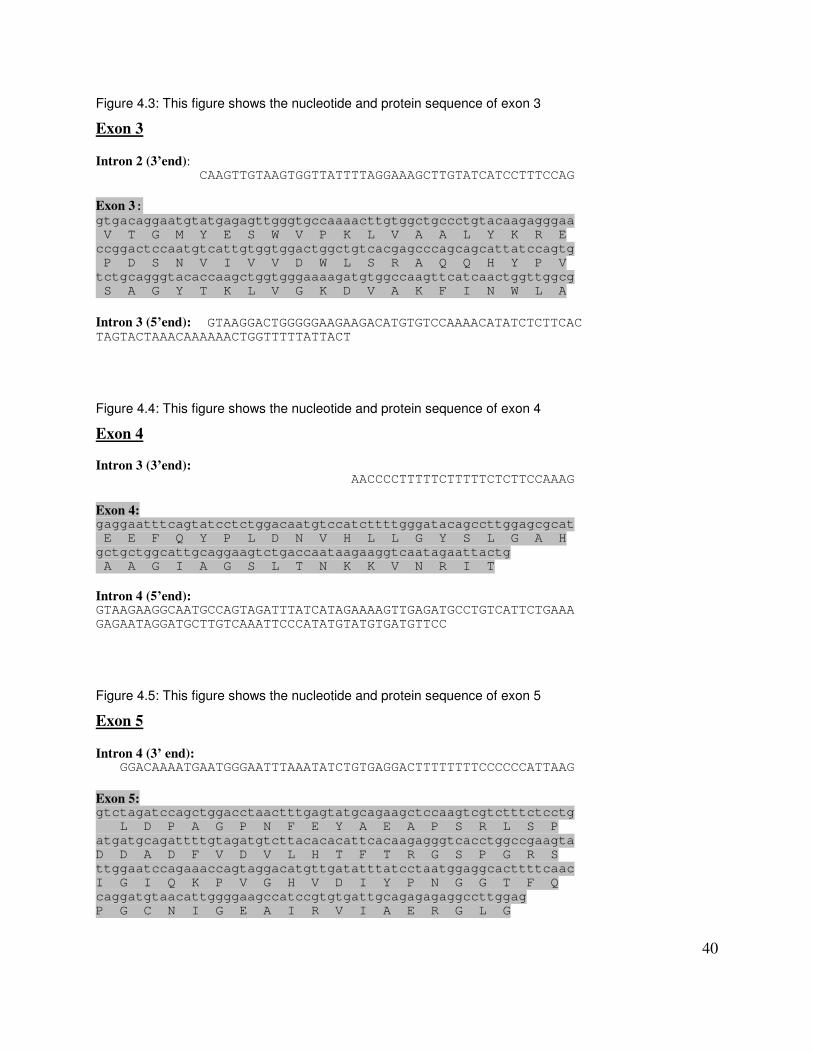
40
Figure 4.3: This figure shows the nucleotide and protein sequence of exon 3
Exon 3 Intron 2 (3’end): CAAGTTGTAAGTGGTTATTTTAGGAAAGCTTGTATCATCCTTTCCAG
Exon 3: gtgacaggaatgtatgagagttgggtgccaaaacttgtggctgccctgtacaagagggaa
V T G M Y E S W V P K L V A A L Y K R E
ccggactccaatgtcattgtggtggactggctgtcacgagcccagcagcattatccagtg
P D S N V I V V D W L S R A Q Q H Y P V
tctgcagggtacaccaagctggtgggaaaagatgtggccaagttcatcaactggttggcg
S A G Y T K L V G K D V A K F I N W L A
Intron 3 (5’end): GTAAGGACTGGGGGAAGAAGACATGTGTCCAAAACATATCTCTTCAC TAGTACTAAACAAAAAACTGGTTTTTATTACT
Figure 4.4: This figure shows the nucleotide and protein sequence of exon 4
Exon 4
Intron 3 (3’end): AACCCCTTTTTCTTTTTCTCTTCCAAAG
Exon 4: gaggaatttcagtatcctctggacaatgtccatcttttgggatacagccttggagcgcat
E E F Q Y P L D N V H L L G Y S L G A H
gctgctggcattgcaggaagtctgaccaataagaaggtcaatagaattactg
A A G I A G S L T N K K V N R I T
Intron 4 (5’end): GTAAGAAGGCAATGCCAGTAGATTTATCATAGAAAAGTTGAGATGCCTGTCATTCTGAAA
GAGAATAGGATGCTTGTCAAATTCCCATATGTATGTGATGTTCC
Figure 4.5: This figure shows the nucleotide and protein sequence of exon 5
Exon 5 Intron 4 (3’ end): GGACAAAATGAATGGGAATTTAAATATCTGTGAGGACTTTTTTTTCCCCCCATTAAG
Exon 5: gtctagatccagctggacctaactttgagtatgcagaagctccaagtcgtctttctcctg
L D P A G P N F E Y A E A P S R L S P
atgatgcagattttgtagatgtcttacacacattcacaagagggtcacctggccgaagta
D D A D F V D V L H T F T R G S P G R S
ttggaatccagaaaccagtaggacatgttgatatttatcctaatggaggcacttttcaac
I G I Q K P V G H V D I Y P N G G T F Q
caggatgtaacattggggaagccatccgtgtgattgcagagagaggccttggag
P G C N I G E A I R V I A E R G L G

41
Intron 5 (5’ end): GTAACTATGATTTAGAAGTTAATTAAACTGTTTCGTTCTTAATTCTTACTGATCTAGTCT
CCTACCCATTCCCCACAAGTAAGTAGTTTTAATATATACATTTAGCCAAGAAATG
Figure 4.6: This figure shows the nucleotide and protein sequence of exon 6
Exon 6 Intron 5 (3’ end): TGAAACACTTATTATGGACTTTCATGGAATTGAATTTTCTTTGTGCTTCTTTCTTCCCAG
Exon 6: atgtggaccagctagtgaaatgctcccatgagcggtccattcacctctttattgactctc
V D Q L V K C S H E R S I H L F I D S
tgttgaatgaagaaaatccaagtaaggcctaccggtgcaactcaaaggaagcctttgaga
L L N E E N P S K A Y R C N S K E A F E
aagggctttgcctgagttgcagaaagaaccgttgcaacaacatgggctatgagatcaata
K G L C L S C R K N R C N N M G Y E I N
aggtcagagccaaaagaggcagcaaaatgtacctgaagactcgctctcagatgccttaca
K V R A K R G S K M Y L K T R S Q M P Y
aag
K
Intron 6 (5’ end): GTAGGCTGGAGAATGTTGTGAGTAGGGAAGATCAATTTGATCCTATTTTTTTGTCATGCT
CATTGCCTCCATGTACTGAGT
Figure 4.7: This figure shows the nucleotide and protein sequence of exon 7
Exon 7 Intron 6 (3’ end): TTGCATAAAAACTGATTAGCACTTGTTCCCTACATTTTCTCCCTACA
Exon 7: gtcttccattaccaagtaaagatacatttttctgggactgagagtgatgcacagaccaac
V F H Y Q V K I H F S G T E S D A Q T N
caggccttcgagatctctctgtatggcactgtggctgagagtgagaacatcccttttacc
Q A F E I S L Y G T V A E S E N I P F T
ct
Intron 7 (5’ end): GTGAGTAGCCACATGGTTTAACC

42
Figure 4.8: This figure shows the nucleotide and protein sequence of exon 8
Exon 8 Intron 7 (3’ end): CCCAAAACAAAAAAACTTGTTTCTAAACTAACCAAATATGCTGATTTTTTTCTTCAG
Exon 8: gcctgaagtttctgctaataagacatactcttttctaatttacacggaggtggatattgg
P E V S A N K T Y S F L I Y T E V D I G
agaactgctaatgttgaaactcaaatggaagagtgattcatacttcagctggtcagactg
E L L M L K L K W K S D S Y F S W S D W
gtggagcagccctggctttgctattgagaagatcagagtaaaagctggagagactcagaa
W S S P G F A I E K I R V K A G E T Q K
aaa
Intron 8 (5’ end): GTAATTAAATTTATTTTTT
Figure 4.9: This figure shows the nucleotide and protein sequence of exon 9
Exon 9 Intron 8 (3’ end): TAACCAAATCATATATTTTTTGAACAACTGTTTCTCTTTTCCCATATGACATGTTCACAT
TCATTTTCTTCTACAG
Exon 9: ggtaatcttctgttccagggagaaagtgtctcatctgcagaaaggaaagtcgtctgtggt
V I F C S R E K V S H L Q K G K S S V V
atttgtgaaatgccatgacaagtctctgaataagaagtctggctg
F V K C H D K S L N K K S G
Intron 9 (5’ end): GTGAGCATCATGGGCTAAAGTTCCTTGGGTATCCTGAGCTTGCAGTTAGGGGACACGGCT
TTATACATTGCTCTTCATCCCATAACTTAAAGA
A multiple sequence alignment was performed to determine the similarity of the identified sequence
in the Miniature Schnauzer with the sequence published on the Trace Archive database obtained
from a boxer (fig 4.10). Two variations were identified in the Miniature Schnauzer. A nucleotide
substitution 826 C>T within exon 6 as well as an insertion of a G at the beginning of exon 7.

43
Figure 4.10: Multiple sequence alignment Trace Archive vs. Miniature Schnauzer. Please note that the numbers for the position of the Trace Archive nucleotides are generic and therefore do not correlate with those of the Miniature Schnauzer.
However, a comparison of the protein sequences (Protein Id: XP_534584.1) showed 100% sequence
homology between the two.

44
4.2 Single Nucleotide Polymorphisms (SNPs) identified in the Miniature Schnauzers
studied
All dogs in this study showed the nucleotide sequence shown in Figures 4.1 through 4.9.
Additionally, 10 SNPs could be identified in exons of single dogs (Table 4.1 and Figures 4.11
through 4.15). SNPs are DNA sequence variations that occur when a single nucleotide (A, T, C, or
G) in the genome sequence is altered. Each individual has many single nucleotide polymorphisms
that together create a unique DNA pattern for that individual.
Table 4.1: Overview of SNPs found in exon 2, 3, 5, and 7 in 21 Miniature Schnauzers
SNPs
Exon 2 Exon 3 Exon 5 Exon 6 Exon 7
1
2
4 84 T>C
5 826 T>C
6 826 T>C
Affected 8
Dogs 15
16 546 A>C
17 269 A>C, Lys(90)Thr
18 690 T>C
20 699 C>T
21
3
7 302 A>G, Asp(101)Gly
9
Healthy Control 10
967 A>G, Lys(323)Glu
Dogs 11
12
13 957 A>G
14 1057 A>G
19

45
Exon 2
A 84 T>C substitution (fig. 4.11) was found in one of the affected dogs. This allele does not lead to a
change in the protein sequence.
Figure 4.11: SNP in exon 2
SNP 84 (T>C):
gaggaaacgattttgtagatatcgaaagtaaatttgctctaaggacccctgaagacacagc
G N D F V D I E S K F A L R T P E D T A
tgaggatacctgccacctcattcccggagtgatagaatctgtggctaactgccacttcaat
E D T C H L I P G V I E S V A N C H F N
cacaccagcaagacctttgtggtgatccatggctggacg
H T S K T F V V I H G W T
Exon 3
One nucleotide polymorphism 269 A>C (fig. 4.12) was identified in one affected dog, leading to a
single amino acid substitution; Lys(90)Thr.
Figure 4.12: SNPs in exon 3
SNP 269 (A>C):
gtgacaggaatgtatgagagttgggtgccaacacttgtggctgccctgtacaagagggaa
V T G M Y E S W V P T L V A A L Y K R E
ccggactccaatgtcattgtggtggactggctgtcacgagcccagcagcattatccagtg
P D S N V I V V D W L S R A Q Q H Y P V
tctgcagggtacaccaagctggtgggaaaagatgtggccaagttcatcaactggttggcg
S A G Y T K L V G K D V A K F I N W L A
Another single nucleotide polymorphism 302 A>G was identified in one healthy control Miniature
Schnauzer, causing a single amino acid substitution; Asp(101)Gly.
SNP 302 (A>G):
gtgacaggaatgtatgagagttgggtgccaaaacttgtggctgccctgtacaagagggaa
V T G M Y E S W V P K L V A A L Y K R E
ccgggctccaatgtcattgtggtggactggctgtcacgagcccagcagcattatccagtg
P G S N V I V V D W L S R A Q Q H Y P V
tctgcagggtacaccaagctggtgggaaaagatgtggccaagttcatcaactggttggcg
S A G Y T K L V G K D V A K F I N W L A

46
Exon 5
SNPs were found in three of the affected dogs. Each dog showed a different SNP. 546 A>C, 690
T>C, and 699 C>T (fig. 4.13) are all nucleotide substitutions that do not result in amino acid
substitutions.
Figure 4.13: SNPs in exon 5
SNP 546 (A>C):
gtctagatccagctggccctaactttgagtatgcagaagctccaagtcgtctttctcctga
L D P A G P N F E Y A E A P S R L S P D
tgatgcagattttgtagatgtcttacacacattcacaagagggtcacctggccgaagtatt
D A D F V D V L H T F T R G S P G R S I
ggaatccagaaaccagtaggacatgttgatatttatcctaatggaggcacttttcaaccag
G I Q K P V G H V D I Y P N G G T F Q P
gatgtaacattggggaagccatccgtgtgattgcagagagaggccttggag
G C N I G E A I R V I A E R G L G
SNP 690 (T>C):
gtctagatccagctggacctaactttgagtatgcagaagctccaagtcgtctttctcctga
L D P A G P N F E Y A E A P S R L S P D
tgatgcagattttgtagatgtcttacacacattcacaagagggtcacctggccgaagtatt
D A D F V D V L H T F T R G S P G R S I
ggaatccagaaaccagtaggacatgttgatatttatcccaatggaggcacttttcaaccag
G I Q K P V G H V D I Y P N G G T F Q P
gatgtaacattggggaagccatccgtgtgattgcagagagaggccttggag
G C N I G E A I R V I A E R G L G
SNP 699 (C>T):
gtctagatccagctggacctaactttgagtatgcagaagctccaagtcgtctttctcctga
L D P A G P N F E Y A E A P S R L S P D
tgatgcagattttgtagatgtcttacacacattcacaagagggtcacctggccgaagtatt
D A D F V D V L H T F T R G S P G R S I
ggaatccagaaaccagtaggacatgttgatatttatcctaatggaggtacttttcaaccag
G I Q K P V G H V D I Y P N G G T F Q P
gatgtaacattggggaagccatccgtgtgattgcagagagaggccttggag
G C N I G E A I R V I A E R G L G
Exon 6
Two affected dogs showed the same nucleotide substitution 826 T>C. In one healthy control dog
another SNP, 957 A>G (fig. 4.14), was found. None of these SNPs are associated with a change in
the amino acid sequence.

47
Figure 4.14: SNPs in exon 6
SNP 826 (T>C):
atgtggaccagctagtgaaatgctcccatgagcggtccattcacctctttattgactctct
V D Q L V K C S H E R S I H L F I D S L
gctgaatgaagaaaatccaagtaaggcctaccggtgcaactcaaaggaagcctttgagaaa
L N E E N P S K A Y R C N S K E A F E K
gggctttgcctgagttgcagaaagaaccgttgcaacaacatgggctatgagatcaataagg
G L C L S C R K N R C N N M G Y E I N K
tcagagccaaaagaggcagcaaaatgtacctgaagactcgctctcagatgccttacaaag
V R A K R G S K M Y L K T R S Q M P Y K
SNP 957 (A>G):
atgtggaccagctagtgaaatgctcccatgagcggtccattcacctctttattgactctct
V D Q L V K C S H E R S I H L F I D S L
gttgaatgaagaaaatccaagtaaggcctaccggtgcaactcaaaggaagcctttgagaaa
L N E E N P S K A Y R C N S K E A F E K
gggctttgcctgagttgcagaaagaaccgttgcaacaacatgggctatgagatcaataagg
G L C L S C R K N R C N N M G Y E I N K
tcagagccaagagaggcagcaaaatgtacctgaagactcgctctcagatgccttacaaag
V R A K R G S K M Y L K T R S Q M P Y K
One healthy control dog showed a 967 A>G substitution, leading to a single amino acid substitution,
Lys(323)Glu.
SNP 967 (A>G):
atgtggaccagctagtgaaatgctcccatgagcggtccattcacctctttattgactctct
V D Q L V K C S H E R S I H L F I D S L
gttgaatgaagaaaatccaagtaaggcctaccggtgcaactcaaaggaagcctttgagaaa
L N E E N P S K A Y R C N S K E A F E K
gggctttgcctgagttgcagaaagaaccgttgcaacaacatgggctatgagatcaataagg
G L C L S C R K N R C N N M G Y E I N K
tcagagccaaaagaggcagcgaaatgtacctgaagactcgctctcagatgccttacaaag
V R A K R G S E M Y L K T R S Q M P Y K
Exon 7
One normal control dog showed a 1057 A>G substitution (fig. 4.15). This allele does not lead to a
change in the protein sequence.
Figure 4.15: SNP in exon 7
SNP 1057 (A>G):
gtcttccattaccaagtaaagatacatttttctgggactgagagtgatgcgcagaccaacc
V F H Y Q V K I H F S G T E S D A Q T N
aggccttcgagatctctctgtatggcactgtggctgagagtgagaacatcccttttaccct
Q A F E I S L Y G T V A E S E N I P F T

48
Also, variations within the adjacent intronic regions of exon 1 – 9 could be identified. Table 4.2
shows the nature and distribution of these findings.
Table 4.2: Overview of SNPs found in intron 1, 2, 3, 4, and 6 in 21 Miniature Schnauzers
Intronic Variations Intron 1 Intron 2 Intron 3 Intron 4 Intron 6
1
2
4 G>A, 27 bp downstream Ex3
5
6
Affected 8
Dogs 15
16
A>G, 8bp upstream Ex2
17
18
20
A>C, 8bp upstream Ex2
T insert 31 bp upstream Ex5
21
3
7
9
Healthy Control Dogs 10
C>T, 12 bp upstream Ex5
CC>TT, 5,6 bp upstream Ex7
11 A insert, 29 bp downstream Ex3
12
A>C, 8bp upstream Ex2
T>G, 36bp downstream Ex2
13
14
19

49
5. Discussion
The lipoprotein lipase (LPL) gene was chosen as a possible candidate gene for the development of
hyperlipidemia and pancreatitis in Miniature Schnauzers because of the central role of LPL in lipid
metabolism. Also, LPL has been associated in humans affected with a similar syndrome that also
leads to hypertriglyceridemia and chronic pancreatitis and is termed LPL deficiency. Finally, the LPL
gene shows a highly conserved structure and function among mammals, which justified the
evaluation of the LPL gene in the dog. Miniature Schnauzers with hypertriglyceridemia and
concomitant pancreatitis were selected to make up the affected group. Goal was to sequence the LPL
gene in the dog and to determine if a statistically significant difference exists in the LPL nucleotide
sequence between affected Miniature Schnauzers and healthy control dogs. Additionally, intron/exon
boundaries of the coding sequence were screened for nucleotide variations that could interfere with
splicing.
We sequenced the complete LPL cDNA from 21 dogs. When compared to other species (fig. 5.1)
closest similarity was found with the bovine and human sequence, as expected according to
phylogenetic data.
Figure 5.1: Phylogram tree of LPL genes in different species
Exons 2 through 9 showed a conserved length among all mammalian species recorded. Exon 1 in
the dog showed four nucleotide deletions, resulting in a total length of 76 bp as compared to 88 bp in
the human LPL gene. This lack of conservation can be attributed to less stringent requirements for
this region, which is noncoding. Exon 1 of the LPL gene makes up the 5’ untranslated region (5’
UTR), while exon 2 starts with the initiator codon ATG (Murthy et al., 1996). Therefore, even
though the lipoprotein lipase is very well conserved among species, sequence differences in exon 1
can occur.

50
107 reported mutations have been linked to LPL malfunction resulting in hyperlipidemia and
pancreatitis in humans (2.1.8). These mutations mainly cluster around regions that encode for the
major protein domains. Exon 4, 5, and 6 of the human LPL gene show so called “hot spots” (fig.
2.2). Mutations in these regions affect the enzyme function by interfering with the 3 major binding
sites for HSPG, apo C2, and the triglyceride substrate as well as dimerization (Murthy et al., 1996).
Figure 5.2: DNA sequence diversity in a 9.7-kb region of the human lipoprotein lipase gene (Murthy et al., 1996)
a) The entire gene spans approximately 30 kb of genomic DNA. b) The region sequenced in 71 individuals spans 9.7 kb of the LPL gene from the 3´ end of intron 3 to 5´ end of intron 9. d), The types and distribution of repeat sequences within the target region identified by RepeatMasker. d) The location of the 88 DNA variants identified by sequencing the 71 individuals across the 9.7-kb region.

51
In a study of 71 humans unselected for health status 88 sequence variations had been found in the
LPL gene (fig. 5.2), including those that would lead to amino-acid substitutions. The amount of
DNA variation found in LPL highlights the potential problems associated with interpreting genetic
studies (Nickerson et al., 1998). The variation found in this gene is considerably greater than
generally appreciated in biomedical genetics. These data suggest that the levels and patterns of
sequence variation found in the human LPL gene could pose a challenge in identifying sites, or a
combination of sites, that influence variation in risk of disease within and among populations.
10 exonic SNPs and 9 intronic SNPs were identified in 21 Miniature Schnauzers. Upon analysis,
none of the alleles identified in this study showed alterations that were associated with the disease
status.
Twenty-one study dogs were chosen from all across the United States, and therefore are likely to be
from different pedigree lines, although they are derived from a common ancestral stock. The
appearance of SNPs among dogs from different ancestral lines is a common phenomenon in purebred
dog populations. Our findings suggest that the nucleotide substitutions we identified in the canine
LPL gene are due to pedigree line differences rather than disease status. Similar to microsatellites
(2.2.2.), SNPs are commonly used markers for certain lines of origin as well as disease traits.
We also identified two differences in the LPL nucleotide sequence between the Trace Archive
sequence derived from the Boxer and the Miniature Schnauzer. The sequence on Trace Archive has
not yet been curated, and it is likely that these findings are due to sequences trace problems. Also,
breed differences between the Boxer and the Miniature Schnauzer are a possible explanation. More
importantly, upon further analysis, both nucleotide sequences resulted in the same amino acid
sequence.
In conclusion, based on the study population examined here, the syndrome of hypertriglyceridemia
and pancreatitis in the Miniature Schnauzer is not linked to mutations in the mRNA or the splicing
regions of the lipoprotein lipase gene.

52
6. Summary
Lipoprotein Lipase (LPL) is a key enzyme in lipid transport. It catalyses the hydrolysis of the
triacylglycerol component of chylomicrons and very low-density lipoproteins (VLDL), providing
non-esterified fatty acids for tissue utilization. The gene encoding for LPL has already been
identified in several species except the dog. Mutations of the human LPL-gene have been shown to
cause partial or complete malfunction of the enzyme, resulting in accumulation of lipoproteins in the
blood. This condition is called familial LPL deficiency. LPL malfunction results in
hyperlipoproteinemia, recurrent acute pancreatitis, and ultimately pancreatic insufficiency.
Several authors have postulated a genetic cause for pancreatitis in the Miniature Schnauzer. An
idiopathic increase in serum triglyceride concentration can also be found in this breed.
Based on these findings we were evaluating a possible role of the lipoprotein lipase gene in the
development of pancreatitis and hyperlipidemia in the Miniature Schnauzer. First, we identified the
genetic sequence of the LPL gene in the dog. We determined clones on the Trace Archive database
for the canine genome project that contain the genomic sequence of a particular exon as well as its
adjacent intronic regions. Based on these findings we designed primers for each exon using the
software Netprimer (www.premierbiosoft.com/netprimer/index.html). Canine subjects were chosen
from a pool of 170 Miniature Schnauzers from the database at the Gastrointestinal Laboratory at
Texas A&M University. Based on clinical history, serum cPLI concentrations, and serum triglyceride
concentrations 21 Miniature Schnauzers were chosen and were selected into a clinically normal
control group (9 dogs) and an affected group (12 dogs). DNA was then collected from either white
blood cells or mucosal cells of these dogs. After PCR optimization, exon 1 through 9 including the
adjacent intronic regions were amplified in all dogs using MasterAmp Extra – Long PCR Kit
(Epicentre, WI, USA) and were sequenced in triplicates. Differences in the nucleotide sequences
were then compared among the two groups. 10 exonic SNPs and 9 intronic SNPs were identified.
Upon analysis, none of these variations could be associated with the disease status.
We conclude that pancreatitis associated with hyperlipidemia in the Miniature Schnauzer is not
linked to mutations of the lipoprotein lipase gene or its splicing regions.

53
7. Zusammenfassung
Die Lipoprotein Lipase (LPL) ist ein Enzym mit zentraler Bedeutung im Fettstoffwechsel. Das
Enzym katalysiert die Hydrolyse der triglyzerid Komponente von Chylomikronen und Very Low
Density Lipoproteinen (VLDL). Dabei werden unveresterte Fettsäuren freigesetzt, welche dann zur
Gewebeaufnahme zur Verfügung stehen. Das Gen, welches für die LPL kodiert, wurde bereits bei
zahlreichen Spezies identifiziert, jedoch noch nicht beim Hund. Ferner wurde gezeigt, dass
Mutationen im humanen LPL Gen die Enzymfunktion teilweis oder vollständig einschränken,
wodurch es zu einer Ansammlung von Lipoproteinen im Blut kommt. Dieses Krankheitsbild wird als
familiärer LPL Mangel bezeichnet. Hyperlipoproteinämie, rezidivierende akute Pankreatitis, sowie
im weiteren Verlauf exokrine Pankreasinsuffizienz sind die vorherrschenden Symptome dieser
Erkrankung. Mehrere Autoren vermuten eine genetische Ursache für Pankreatitis beim
Zwergschnauzer. Ebenso ist eine idiopathische Erhöhung der Triglyzeride im Serum bei dieser Rasse
zu finden. Basierend auf diesen Beobachtungen haben wir das Lipoprotein Lipase Gen auf dessen
potentielle Rolle bei der Entstehung von Pankreatitis und Hyperlipämie im Zwergschnauzer
untersucht.
Zuerst wurde die Basensequenz des LPL Gens beim Hund bestimmt. Hierzu wurden Klone der Trace
Archive Datenbank des Canine Genome Projects identifiziert, welche die Basensequenz für ein
bestimmtes Exon sowie dessen angrenzende Introns enthielten. Die so bestimmten Gensequenzen
dienten unter Verwendung der Software Netprimer (www.premierbiosoft.com/netprimer/index.html)
als Vorlage bei der Gestaltung von Primerpaaren für die jeweiligen Exons.
Aus 170 Zwergschnauzern von der Datenbank des Gastrointestinal Laboratory an der Texas A&M
University wurden anhand von klinischen Symptomen, cPLI Werten und Serum-Triglyzerid
Konzentrationen 21 Hunde für diese Studie ausgewählt. In 12 Hunden war das Krankheitsbild
ausgeprägt, während 9 Hunde klinisch gesund waren. Anschliessend wurde von allen Hunden DNA
aus weissen Blutzellen oder Schleimhautzellen gewonnen. Nach Optimierung der PCR wurden under
Verwendung eines MasterAmp Extra-Long PCR Kits (Epicentre, WI, USA) Exon 1 bis 9
einschliesslich der jeweils angrenzenden Intron Regionen in allen Hunden amplifiziert, und

54
anschliessend dreifach sequenziert.
Insgesamt konnten 10 SNPs in Exons, sowie 9 SNPs in den angrenzenden Intron Regionen
identifiziert werden. Weitere Untersuchungen ergaben, dass keine dieser Variationen mit dem
Krankheitsbild in Verbindung steht.
Aus unseren Ergebnissen schliessen wir, dass Pankreatitis verbunden mit Hyperlipämie beim
Zwergschnauzer nicht mit Mutationen des Lipoprotein Lipase Gens oder dessen Splicing Regionen
in Verbindung steht.

55
8. References
Afinsen, C. B. and E. Boyle. The role of heparin in lipoprotein metabolism. Science 115, 583-586. 1952.
Banks, P. A. 1993. Medical management of acute pancreatitis and complications. In: V. L. W. Go, E. P. DiMagno, J. D. Gardner, E. Lebenthal, H. A. Reber, and G. A. Scheele (Eds.) The pancreas: biology, pathobiology and disease. pp. 593-613. Raven Press, New York.
Banks, P. A. 1994. A new classification system for acute pancreatitis. Am. J. Gastroenterol. 89:151-152.
Baum, L. and L. Chen. Lipoprotein lipase mutations and Alzheimer's disease. Am.J.Med.Genet. 88, 136-139. 1999.
Beauchamp, M. C. and G. Renier. Homocysteine induces protein kinase C activation and
stimulates c-fos and lipoprotein lipase expression in macrophages. Diabetes 51, 1180-1187. 2002.
Ben-Zeev, O. and H. Z. Mao. Maturation of lipoprotein lipase in the endoplasmatic reticulum.
J.Biol.Chem. 277, 10727-10738. 2002.
Bernard, C. 1985. Memoir on the pancreas and on the role of pancreatic juice in digestive processes. Particularly in the digestion of neutral fat. Translated by Henderson, J. Monographs of the Physiological Society No. 42. Academic Press, New York.
Berryman, D. E. and A. Bensadoun. Site-directed mutagenesis of a putative heparin binding domain of avian lipoprotein lipase. J.Biol.Chem. 268, 3272-3276. 1993.
Bijvoet, S. and S. E. Gagne. Alterations in plasma lipoproteins and apolipoproteins before the
age of 40 in heterozygotes for lipoprotein lipase deficiency. J.Lipid Res. 37, 640-650. 1996.
Bishop, M. and J. M. Steiner. 2002. Evaluation of the cationic trypsinogen gene for potential mutations in Miniature Schnauzers with pancreatitis. J. Vet. Int. Med. 16:384.
Bishop, M. A., J. M. Steiner, L. E. Moore, and D. A. Williams. 2004. Evaluation of the cationic trypsinogen gene for potential mutations in miniature schnauzers with pancreatitis. Can. J. Vet. Res. 68:315-318.

56
Bradley, E. L. 1993. A clinically based classification system for acute pancreatitis. Arch. Surg. 128:586-590.
Braun, J. E. A. and D. L. Severson. Regulation of the synthesis, processing and translocation of lipoprotein lipase. Biochem.J 287, 337-347. 1992.
Breslauer, K. J., R. Frank, and H. Blocker. 1986. Predicting DNA duplex stability from the base sequence. Proc. Natl. Acad. Sci. U. S. A 83:3746-3750.
Bright, J. M. 1985. Pancreatic adenocarcinoma in a dog with a maldigestion syndrome. J. Am. Vet. Med. Assoc. 187:420-421.
Camps, L. and M. Reina. Lipoprotein lipase: cellular origin and functional distribution. Am.J.Physiol 258, 673-681. 1990.
Camps, L. and M. Reina. Lipoprotein lipase in lungs, spleen and liver: synthesis and
distribution. J.Lipid Res. 32, 1877-1888. 1991.
Cargill, E. J., L. A. Clark, J. M. Steiner, and K. E. Murphy. 2002. Multiplexing of canine microsatellite markers for whole-genome screens. Genomics 80:250-253.
Chey, W. Y. 1993. Hormonal control of pancreatic exocrine secretion. In: V. L. W. Go, E. P. DiMagno, J. D. Gardner, E. Lebenthal, H. A. Reber, and G. A. Scheele (Eds.) The pancreas: biology, pathobiology and disease. pp. 403-424. Raven Press, New York.
Coleman, T. and R. L. Seip. COOH-terminal disruption of lipoprotein lipase in mice is lethal in homozygotes, but heterozygotes have elevated triglycerides and impaired enzyme activity. J.Biol.Chem. 270, 12518-12525. 1995.
Cryer, A. Tissue lipoprotein lipase activity and its action in lipoprotein metabolism. Int J
Biochem 13, 525-541. 1981. Derewenda, U. and A. M. Brzozowski. Catalysis at the interface: the anatomy of a
conformational change in a triglyceride lipase. Biochemistry 31, 1532-1541. 1992.
DiMagno, E. P., V. L. W. Go, and W. H. J. Summerskill. 1973. Relations between pancreatic enzyme outputs and malabsorption in severe pancreatic insufficiency. N. Engl. J. Med. 288:813-815.
Drazner, F. H. 1986. Diseases of the pancreas. In: B. D. Jones and W. D. Liska (Eds.) Canine and Feline Gastroenterology. pp. 295-344. W. B. Saunders Company.

57
Dugi, K. A. and H. L. Dichek. Human lipoprotein lipase: loop covering the catalytic site is essential for interaction with lipid substrates. J.Biol.Chem. 267, 25086-25091. 1992.
Dukes-McEwan, J. The promises and problems of linkage analysis by using the current canine
genome map. Mamm Genome 13, 667-672. 2002.
Dyce, K. M. 1996. The Abdomen of the Carnivores. In: K. M. Dyce, W. O. Sack, and C. J. G. Wensing (Eds.) Textbook of Veterinary Anatomy. pp. 430-431. WB Saunders, Philadelphia.
Eckel, R. H. 1989. Lipoprotein lipase: A multifunctional enzyme relevant to common metabolic diseases. N. Engl. J. Med. 320, No.16:1060-1067.
Eddeland, A. and K. Ohlsson. 1976. Purification of canine pancreatic secretory trypsin inhibitor and interaction in vitro with complexes of trypsin-α-macroglobulin. Scan. J. Clin. Lab. Invest. 36:815-820.
Eisenberg, S. and D. Rachmilewitz. Interaction of rat plasma very low density lipoproteins with lipoprotein-rich (post-heparin) plasma. J.Lipid Res. 16, 341-351. 1975.
Enerback, S. and J. M. Gimble. Lipoprotein lipase gene expression: physiological regulators at
the transcriptional and post-transcriptional level. Biochim.Biophys.Acta 1169, 107-125. 1993.
Evans, H. E. and G. C. Christensen. 1979. The digestive apparatus and abdomen. In: H. E. Evans and G. E. Christensen (Eds.) Millers Anatomy of the Dog. pp. 411-506. W.B.Saunders, Phildelphia.
Faustinella, F. and L. C. Smith. Functional topology of a surface loop shielding the catalytic center in lipoprotein lipase. Biochemistry 31, 7219-7223. 1992.
Fielding, C. J. and P. E. Fielding. Mechanism of salt-mediated inhibition of lipoprotein lipase.
J.Lipid Res. 17, 248-256. 1976. Fielding, P. E. and C. J. Fielding. Dynamics of lipoprotein transport in the circulatory sustem.
Elsevier , 427-459. 1991.
Freier, S. M., R. Kierzek, and J. A. Jaeger. 1986. Improved free-energy parameters for predictions of RNA duplex stability. Proc. Natl. Acad. Sci. U. S. A 83:9373-9377.
Galibert, F. The importance of the canine model in medical genetics. Bull.Avad.Natl.Med. 182, 811-821. 1998.

58
Gaskell, C. J., A. H. Leedale, and S. W. Douglas. 1975. Pansteatits in the cat: a report of four cases. J. Sm. Anim. Pract. 16:117-121.
Ginzinger, D. G. and S. M. Clee. Lipid and lipoprotein analysis in cats with lipoprotein lipase deficiency. J.Clin.Invest 29, 17-26. 1999.
Greenwood, M. R. The relationship of enzyme activity to feeding behavior in rats: lipoprotein
lipase as the metabolic gatekeeper. Int.J.Obes. 1, 67-70. 1985. Greer, K. A., E. J. Cargill, and M. L. Cox. Digging up the canine genome-a tale to wag about.
Cytogenet.Genome Res. 102, 244-248. 2003. Grochulski, P. and Y. Li. Insights into intefacial activation from an open structure of Candida
rugosa lipase. J.Biol.Chem. 268, 12843-12847. 1993. Guyon, R. A 1-Mb resolution radiation hybrid map of the canine genome.
Proc.Natl.Acad.Sci.U.S.A 100, 5296-5301. 2003.
Guzman, S., F. Nervi, O. Llanos, P. Leon, and V. Valdivieso. 1985. Impaired lipid clearance in patients with previous acute pancreatitis. Gut 26:888-891.
Hahn, P. F. Abolishment of alimentary lipemia following injection of heparin. Science 98, 19-20. 1943.
Hamosh, M. and T. R. Clary. Lipoprotein lipase activity of adipose and mammary tissue and
plasma triglyceride in pregnant and lactating rats. Biochim.Biophys.Acta 210, 473-482. 1970.
Hänichen, T. and G. Minkus. 1990. Retrospektive Studie zur Pathologie der Erkrankungen des exokrinen Pankreas bei Hund und Katze. Tierärztliche Umschau 45:363-368.
Hardardottir, I. and C. Grunfeld. Effects of endotoxin and cytokines on lipid metabolism. Curr.Opin.Lipidol. 5, 207-215. 1994.
Hata, A. and D. N. Ridinger. Missense mutations in exon 5 of the lipoprotein lipase gene.
Inactivation correlates with loss of dimerization. J.Biol.Chem. 267, 20132-20139. 1992. Hata, A. and D. N. Ridinger. Binding of lipoprotein lipase to heparin. Identification of five
critical residues in two distinct segments of the amino-terminal domain. J.Biol.Chem. 268, 8447-8457. 1993.

59
Hess, R. S., H. M. Saunders, T. J. Van Winkle, F. S. Shofer, and R. J. Washabau. 1998. Clinical, clinicopathologic, radiographic, and ultrasonographic abnormalities in dogs with fatal acute pancreatitis: 70 cases (1986-1995). J. Am. Vet. Med. Assoc. 213:665-670.
Hide, W. A., L. Chan, and W.-H. Li. 1992. Structure and evolution of the lipase superfamily. J. Lipid Res. 33:167-178.
Hill, R. C. and T. J. Van Winkle. 1993. Acute necrotizing pancreatitis and acute suppurative pancreatitis in the cat. A retrospective study of 40 cases (1976-1989). J. Vet. Int. Med. 7:25-33.
Hirota, M. and K. Kuwata. 2003. From acute to chronic pancreatitis: The role of mutations in the pancreatic secretory trypsin inhibitor gene. Journal of the Pancreas 4:83-88.
Holroyd, J. B. 1968. Canine exocrine pancreatic disease. J. Sm. Anim. Pract. 9:269-281.
Holst, J. J. 1993. Neural regulation of pancreatic exocrine function. In: V. L. W. Go, E. P. DiMagno, J. D. Gardner, E. Lebenthal, H. A. Reber, and G. A. Scheele (Eds.) The pancreas: biology, pathobiology and disease. pp. 381-402. Raven Press, New York.
Jacobs, R. M., R. J. Murtaugh, and W. D. DeHoff. 1985. Review of the clinicopathological findings of acute pancreatitis in the dog: use of an experimental model. J. Am. Anim. Hosp. Assoc. 21:795-800.
Jubb, K. V. F., P. C. Kennedy, and N. Palmer. 1985. The Pancreas. In: K. V. F. Jubb, P. C. Kennedy, and N. Palmer (Eds.) Pathology of Domestic Animals. pp. 313-327. Hartcourt Brace Jovanovich, Orlando.
Jukema, J. W. The Asp9Asn mutation in the lipoprotein lipase gene is associated with increased progression of coronary atherosclerosis. Circulation 94, 1913-1918. 1996.
Kahl, S., S. Zimmermann, and P. Malfertheiner. 2003. Acute pancreatitis: Treatment strategies. Dig. Dis. 21:30-37.
Keiper, T. and J. G. Schneider. Novel site in lipoprotein lipase (LPL 414-438) essential for substrate interaction and dimer stability. J.Lipid Res. 42, 1180-1186. 2001.
Kern, P. A. Potential role of TNF-alpha and lipoprotein lipase as candidate genes for obesity.
J.Nutr. 127, 1917-1922. 1997. Kijas, J. W. and B. J. Miller. Canine models of ocular disease: outcross breedings define a
dominant disorder present in the English Mastiff and Bull Mastiff dog breeds. J.Hered. 94, 27-30. 2003.

60
Kirkness, E. F. and V. Bafna. 2003. The Dog Genome: Survey Sequencing and Comparative Analysis. Science 301:1898-1903.
Korn, E. D. Clearing factor, a heparin activated lipoprotein lipase: Isolation and characterization of the enzyme from normal rat heart. J.Biol.Chem. 215, 1-14. 1955.
Laskowski, M. and I. Kato. 1980. Protein inhibitors of proteinases. Ann. Rev. Biochem. 49:593-626.
Lasson, Å. 1984. Acute pancreatitis in man. A clinical and biochemical study of pathophysiology and treatment. Scand. J. Gastroenterol. [Suppl] 99:1-57.
Lasson, Å. and K. Ohlsson. 1984. Acute pancreatitis. The correlation between clinical course, protease inhibitors, and complement and kinin activation. Scand. J. Gastroenterol. 19:707-710.
Lerch, M. M. and D. Adler. 1994. Experimental animal models of acute pancreatitis. Inter. J. Pancreatology 15:159-170.
Lewin, B. 1997. Simple sequence DNA. In: B. Lewin (Ed.) Genes. pp. 727-741. Oxford University Press, Oxford.
Lithell, H. and J. Boberg. Lipoprotein lipase activity in human skeletal muscle and adipose tissue in the fasting and the fed states. Atherosclerosis 30, 89-94. 1978.
Lookene, A. and M. S. Nielsen. Contribution of the carboxy-terminal domain of lipoprotein
lipase to interaction with heparin and lipoproteins. Biochem.Biophys.Res.Commun. 271, 15-21. 2000.
Mahmood Hussain, M. and R. K. Kancha. Chylymicron assembly and catabolism: role of
apolipoproteins and receptors. Biochim.Biophys.Acta 1300, 151-170. 1996.
Mallory, A. and F. Kern. 1980. Drug-induced pancreatitis: A critical review. Gastroenterol. 78:813-820.
Mamputu, J. C. and A. C. Desfraits. Lipoprotein lipase enhances human monocyte adhesion to aortic endothelial cells. J.Lipid Res. 38, 1722-1729. 1997.
Mamputu, J. C. and A. C. Desfraits. Proliferative effect of lipoprotein lipase on human vascular
smooth muscle cells. Arterioscler.Thromb Vasc Biol. 20, 2212-2219. 2000. Masuno, H. and C. J. Schultz. Glycosylation, activity and secretion of lipoprotein lipase in
cultured brown adipocytes of newborn mice. Biochem.J 277, 801-809. 1991.

61
Mead, J., S. Irvine, and D. Ramji. Lipoprotein lipase: structure, function, regulation, and role in disease. J.Mol.Med. 80, 753-769. 2002.
Mellersh, C. S. and A. A. Langston. A linkage map of the canine genome. Genomics 46, 326-
336. 1997. Metallinos, D. L. Canine molecular genetic testing. Vet.Clin.North.Am.Small.Anim.Pract. 31,
421-431. 2001. Michaud, S. E. and G. Renier. Direct regulatory effect of fatty acids on macrophage lipoprotein
lipase: potential role of PPARs. Diabetes 50, 660-666. 2001. Moeller, E. M., J. M. Steiner, K. E. Murphy, D. A. Williams, M. Stankovics, and A. Vose.
Inheritance of pancreatic acinar atrophy in american German Shepherd dogs. Journal of Veterinary Internal Medicine 14, 377. 2000.
Murthy, V., P. Julien, and C. Gagné. 1996. Molecular pathobiology of the human lipoprotein lipase gene. Pharmacol. Ther. 70:101-135.
Nickerson, D. A., S. L. Taylor, K. M. Weiss, A. G. Clark, R. G. Hutchinson, J. Stengard, V. Salomaa, E. Vartiainen, E. Boerwinkle, and C. F. Sing. 1998. DNA sequence diversity in a 9.7-kb region of the human lipoprotein lipase gene. Nat. Genet. 19:233-240.
Nyland, T. G., M. H. Mulvany, and D. R. Strombeck. 1983. Ultrasonic features of experimentally induced acute pancreatitis in the dog. Veterinary Radiology 24:260-266.
O'Brien, K. D. and D. Gordon. Lipoprotein lipase is synthesized by macrophage derived foam cells in human coronary atherosclerotic plaques. J Clin Invest 89, 1544-1550. 1992.
Ohlsson, K., P. O. Ganrot, and C.-B. Laurell. 1971. In vivo interaction between trypsin and some plasma proteins in relation to tolerance to intravenous infusion of trypsin in dogs. Acta Chir. Scand. 137:113-121.
Oku, H. and H. Y. Ogata. Organization of the lipoprotein lipase gene of red sea bream Pagrus major. Comp.Biochem.Physiol. 131, 775-785. 2002.
Ostrander, E. A. Unleashing the canine genome. Genome Research 10, 1271-1274. 2000. Ostrander, E. A. and F. Galibert. Canine genetic comes of age. Trends Genet 16, 117-124. 2000. Patterson, D. F. Companion animal medicine in the age of medical genetics. J.Vet.Intern.Med.
14, 1-9. 2000.

62
Peterson, J. and F. Amir. 2002. Structural and functional consequences of missense mutations in exon 5 of the lipoprotein lipase gene. J. Lipid Res. 43:398-406.
Pidgeon, G. 1987b. Exocrine pancreatic disease in the dog and cat Part 1: Acute pancreatitis. Companion Animal Practice March:67-71.
Pidgeon, G. and D. R. Strombeck. 1982. Evaluation of treatment for pancreatic exocrine insufficiency in dogs with ligated pancreatic ducts. Am. J. Vet. Res. 43:461-464.
Pitchumoni, C. S. and G. A. Scheele. 1993. Interdependence of nutrition and exocrine pancreatic function. In: V. L. W. Go, E. P. DiMagno, J. D. Gardner, E. Lebenthal, H. A. Reber, and G. A. Scheele (Eds.) The pancreas: biology, pathobiology and disease. pp. 449-473. Raven Press, New York.
Raiha, M. and E. Westermarck. 1989. The signs of pancreatic degenerative atrophy in dogs and the role of external factors in the etiology of the disease. Acta Vet. Scand. 30:447-452.
Raisonnier, A. and J. Etienne. 1995. Comparison of the cDNA and amino acid sequences of lipoprotein lipase in eight species. Comparative Biochemistry and Physiology Part B: Biochemistry and Molecular Biology 111:385-398.
Reber, H. A., G. Adler, N. Karanjia, and A. Widdison. 1993. Permeability characteristics of the main pancreatic duct in cats: models of acute and chronic pancreatitis. In: V. L. W. Go, E. P. DiMagno, J. D. Gardner, E. Lebenthal, H. A. Reber, and G. A. Scheele (Eds.) The pancreas: biology, pathobiology and disease. pp. 527-550. Raven Press, New York.
Renier, G. and E. Skamene. High macrophage lipoprotein lipase expression and secretion are associated in inbred murine strains with susceptibility to atherosclerosis. Arterioscler.Thromb Vasc Biol. 13, 190-196. 1993.
Renier, G. and E. Skamene. Induction of tumor necrosis factor alpha gene expression by
lipoprotein lipase. J.Lipid Res. 35, 271-278. 1994. Reymer, P. W. and E. Gagne. A lipoprotein lipase mutation (Asn291Ser) is associated with
reduced HDL cholesterol levels in premature atherosclerosis. Nat.Genet. 10, 28-33. 1995.
Richman, M., C. S. Mellersh, C. Andre, F. Galibert, and E. A. Ostrander. 2001. Characterization of a minimal screening set of 172 microsatellite markers for genome-wide screens of the canine genome. J. Biochem. Biophys. Methods 47:137-149.
Rimaila-Pärnänen, E. and E. Westermarck. 1982. Pancreatic degenerative atrophy and chronic pancreatitis in dogs: a comparative study of 60 cases. Acta Vet. Scand. 23:400-406.

63
Rinderknecht, H. 1993. Pancreatic secretory enzymes. In: V. L. W. Go, E. P. DiMagno, J. D. Gardner, E. Lebenthal, H. A. Reber, and G. A. Scheele (Eds.) The pancreas: biology, pathobiology and disease. pp. 219-251. Raven Press, New York.
Rinderknecht, H. 1998. New Developments on the Aetiogenesis of Chronic Pancreatitis: Implications for Treatment and Disease Prophylaxis - Papers based on a symposium held on September 7, 1998 during the World Congresses of Gastroenterology, Vienna, Austria, September 6-11, 1998 - Foreword. Digestion 59:NIL6.
Rogers, W. A., E. F. Donovan, and G. J. Kociba. 1975. Lipids and lipoproteins in normal dogs and in dogs with secondary hyperlipoproteinemia. J. Am. Vet. Med. Assoc. 166:1092-1100.
Rogers, W. A., T. M. O'Dorisio, S. E. Johnson, S. Cataland, R. P. Stradley, and R. G. Sherding. 1983. Postprandial release of gastric inhibitory polypeptide (GIP) and pancreatic polypeptide in dogs with pancreatic acinar atrophy. Dig. Dis. Sci. 28:345-349.
Rutgers, H. C., D. S. Herring, and E. C. Orton. 1985. Pancreatic pseudocyst associated with acute pancreatitis in a dog: ultrasonographic diagnosis. J. Am. Anim. Hosp. Assoc. 21:411-416.
Saharia, P., S. Margolis, G. D. Zuidema, and J. L. Cameron. 1977. Acute pancreatitis with hyperlipidemia: Studies with an isolated perfused canine pancreas. Surgery 82:60-67.
Santamarina-Fojo, S. The familial chylomicronemia syndrome. Endocrinol.Metab.Clin.North.Am. 27, 551-567. 1998.
Sarner, M. 1993. Pancreatitis Definitions and Classification. In: V. L. W. Go, E. P. DiMagno, J. D. Gardner, E. Lebenthal, H. A. Reber, and G. A. Scheele (Eds.) The pancreas: biology, pathobiology and disease. pp. 575-580. Raven Press, New York.
Sarner, M. 2003. Treatment of pancreatic exocrine deficiency. World J. Surg. 27:1192-1195.
Sartippour, M. R. and A. Lambert. Stimulatory effect of glucose on macrophage lipoprotein lipase expression and production. Diabetes 47, 431-438. 1998.
Saxena, U. and L. D. Witte. Release of endothelial cell lipoprotein lipase by plasma lipoproteins
and free fatty acids. J Biol Chem 264, 4349-4355. 1989. Scanu, A. Serum high-density lipoprotein: effect of change in structure on activity of chicken
adipose tissue lipase. Science 153, 640-641. 1966.
Schaer, M. 1979. A clinicopathologic survey of acute pancreatitis in 30 dogs and 5 cats. J. Am. Anim. Hosp. Assoc. 15:681-687.

64
Schummer, A., R. Nickel, and W. O. Sack. 1979. Digestive System. In: pp. 21-203. Springer-Verlag, New York,Heidelberg,Berlin.
Scow, R. O. and T. Olivecrona. Effect of albumin on products formed from chylomicron triacylglycerol by lipoprotein lipase in vitro. Biochim.Biophys.Acta 487, 472-486. 1977.
Sharer, N. and M. Schwarz. 1998. Mutations of the cystic fibrosis gene in patients with chronic pancreatitis. N. Engl. J. Med. 339:645-652.
Simpson, K. W. 1993. Current concepts of the pathogenesis and pathophysiology of acute pancreatitis in the dog and cat. Comp. Cont. Ed. Prac. Vet. 15:247-253.
Singer, M. V. 1993. Neurohormonal control of pancreatic enzyme secretion in animals. In: V. L. W. Go, E. P. DiMagno, J. D. Gardner, E. Lebenthal, H. A. Reber, and G. A. Scheele (Eds.) The pancreas: biology, pathobiology and disease. pp. 425-448. Raven Press, New York.
Sorensen, S. H., J. E. Riley, R. W. Lobley, P. W. Pemberton, D. A. Williams, and R. M. Batt. 1988. Investigation of physical properties of dog intestinal microvillar membrane proteins by polyacrylamide gel electrophoresis: a comparison between normal dogs and dogs with exocrine pancreatic insufficiency. Biochim. Biophys. Acta 955:275-282.
Spillmann, T., E. Eigenbrodt, and A. Sziegoleit. 1998. Die Bestimmung und klinische Relevanz der fäkalen pankreatischen Elastase beim Hund. Tierärztliche Praxis 26:364-368.
Staels, B. and J. Auwerx. Perturbation of developmental gene expression in rat liver by fibric acid derivates: lipoprotein lipase alpha-fetoprotein as models. Development 115, 1035-1043. 1992.
Steer, M. L. 1986. Etiology and pathophysiology of acute pancreatitis. In: V. L. W. e. a. Go (Ed.) The Exocrine Pancreas: Biology, Pathobiology and Diseases. pp. 465-474. Raven Press, New York.
Steer, M. L. and A. K. Saluja. 1993. Experimental acute pancreatitis: studies of the early events that lead to cell injury. In: V. L. W. Go, E. P. DiMagno, J. D. Gardner, E. Lebenthal, H. A. Reber, and G. A. Scheele (Eds.) The pancreas: biology, pathobiology and disease. pp. 489-500. Raven Press, New York.
Steiner, J. M. 2003. Diagnosis of pancreatitis. Vet. Clin. North Am. Small Anim Pract. 33:1181-1195.

65
Steiner, J. M., S. R. Teague, and D. A. Williams. 2003. Development and analytic validation of an enzyme-linked immunosorbent assay for the measurement of canine pancreatic lipase immunoreactivity in serum. Can. J. Vet. Res. 67:175-182.
Strombeck, D. R., T. Farver, and J. J. Kaneko. 1981. Serum amylase and lipase activities in the diagnosis of pancreatitis in dogs. Am. J. Vet. Res. 42:1966-1970.
Tisdale, M. J. Wasting in cancer. J.Nutr. 129, 243-246. 1999.
Van Tilbeurgh, H., A. Roussel, J.-M. Lalouel, and C. Cambillau. 1994. Lipoprotein lipase. Molecular model based on the pancreatic lipase x-ray structure: Consequences for heparin binding and catalysis. J. Biol. Chem. 269:4626-4633.
Vannier, C. and G. Ailhaud. Biosynthesis of lipoprotein lipase in cultured mouse adipocytes. J.Biol.Chem. 264, 13206-13216. 1989.
Vilella, E. and J. Joven. Lipoprotein lipase in human plasma is mainly inactive and associated
with cholesterol-rich lipoproteins. J.Lipid Res. 34, 1555-1564. 1993. Wang, C. S. and J. Hartsuck. Structure and functional properties of lipoprotein lipase.
Biochim.Biophys.Acta 1123, 1-17. 1992. Weinstock, P. H. Severe hypertriglyceridemia, reduced high density lipoprotein and neonatal
death in lipoprotein lipase knockout mice. J.Clin.Invest 96, 2555-2568. 1995.
Westermarck, E. 1980. The hereditary nature of canine pancreatic degenerative atrophy in the German Shepherd dog. Acta Vet. Scand. 21:389-394.
Westermarck, E., R. M. Batt, C. Vaillant, and M. Wiberg. 1993. Sequential study of pancreatic structure and function during development of pancreatic acinar atrophy in a German Shepherd Dog. Am. J. Vet. Res. 54:1088-1094.
Westermarck, E., P. Pamilo, and M. Wiberg. 1989. Pancreatic degenerative atrophy in the Collie breed: a hereditary disease. J. Vet. Med. A 36:549-554.
Westermarck, E. and E. Saario. 1989. Traumatic pancreatic injury in a cat - a case history. Acta Vet. Scand. 30:359-362.
Whitcomb, D. C. 2000. Genetic predispositions to acute and chronic pancreatitis. Med. Clin. North Am. 84:531-547.

66
Wiberg, M. E., S. A. M. Saari, and E. Westermarck. 1999. Exocrine pancreatic atrophy in German Shepherd dogs and Rough-coated Collies: An end result of lymphocytic pancreatitis. Vet. Pathol. 36:530-541.
Williams, D. A. 1996. The Pancreas. In: D. R. Strombeck, W. G. Guilford, S. A. Center, D. A. Williams, and D. J. Meyer (Eds.) Small Animal Gastroenterology. pp. 381-410. W.B. Saunders, Philadelphia.
Williams, D. A. and R. M. Batt. 1988. Sensitivity and specificity of radioimmunoassay of serum trypsin-like immunoreactivity for the diagnosis of canine exocrine pancreatic insufficiency. J. Am. Vet. Med. Assoc. 192:195-201.
Williams, D. A., R. M. Batt, and L. McLean. 1985. Reversible impairment of protein synthesis may contribute to jejunal abnormalities in exocrine pancreatic insufficiency. Clin. Sci. 68:37P.
Williams, J. A. and I. D. Goldfine. 1993. The insulin-acinar relationship. In: V. L. W. Go, E. P. DiMagno, J. D. Gardner, E. Lebenthal, H. A. Reber, and G. A. Scheele (Eds.) The pancreas: biology, pathobiology and disease. pp. 789-802. Raven Press, New York.
Winkler, K. and A. D'Arcy. Structure of human pancreatic lipase. Nature 343, 771-774. 1990.
Withrow, S. J. 1996. Tumors of the gastrointestinal system: exocrine pancreas. In: S. J. Withrow and E. G. MacEwen (Eds.) Small Animal Clinical Oncology. pp. 243-244. W.B. Saunders, Philadelphia.
Yang, C. Y. and Z. W. Gu. Structure of bovine milk lipoprotein lipase. J.Biol.Chem. 264, 16822-16827. 1989.
Yuzbasiyan-Gurkan, V. Linkage of a microsatellite marker to the canine copper toxicosis locus
in Bedlington Terriers. Am.J Vet Res. 58, 23-27. 1997. Zawie, D. 1996. Diseases of the pancreas. In: T. Tams (Ed.) Handbook of Small Animal
Gastroenterology. pp. 461-481. W.B. Saunders, Philadelphia.

67
Appendix
A.1. List of Figures
Figure 2.1: Structure of the human LPL gene: Exons 1 - 10 are interrupted by introns of various sizes Figure 2.2: Mutations of the human LPL gene superimposed on the LPL amino acid sequence (HGMD 2005) Figure 3.1: Example of a multiple sequence alignment among the different species Figure 3.2: Example for PCR optimization: amplification of exon 3 using different premixes. The second column shows the reference sample. Figure 3.3: Amplification of exon 1 Figure 4.1: This figure shows the nucleotide and protein sequence of exon 1 Figure 4.2: This figure shows the nucleotide and protein sequence of exon 2 Figure 4.3: This figure shows the nucleotide and protein sequence of exon 3 Figure 4.4: This figure shows the nucleotide and protein sequence of exon 4 Figure 4.5: This figure shows the nucleotide and protein sequence of exon 5 Figure 4.6: This figure shows the nucleotide and protein sequence of exon 6 Figure 4.7: This figure shows the nucleotide and protein sequence of exon 7 Figure 4.8: This figure shows the nucleotide and protein sequence of exon 8 Figure 4.9: This figure shows the nucleotide and protein sequence of exon 9 Figure 4.10: Multiple sequence alignment Trace Archive vs. Miniature Schnauzer. Please note that the numbers for the position of the Trace Archive nucleotides are generic and therefore do not correlate with those of the Miniature Schnauzer. Figure 4.11: SNP in exon 2 Figure 4.12: SNPs in exon 3

68
Figure 4.13: SNPs in exon 5 Figure 4.14: SNPs in exon 6 Figure 4.15: SNP in exon 7 Figure 5.1: Phylogram tree of LPL genes in different species Figure 5.2: DNA sequence diversity in a 9.7-kb region of the human lipoprotein lipase gene (Murthy et al., 1996)

69
A.2. List of Tables
Table 3.1: Enthalpy values ∆H of a nearest neighbor nucleotide (in -cal/°K/mol) Table 3.2: Entropy values ∆S of a nearest neighbor nucleotide (in -cal/°K/mol) Table 3.3: Forward and reverse primer for amplification of exon 1 of the canine LPL gene Table 3.4: Forward and reverse primer for amplification of exon 2 of the canine LPL gene Table 3.5: Forward and reverse primer for amplification of exon 3 of the canine LPL gene Table 3.6: Forward and reverse primer for amplification of exon 4 of the canine LPL gene Table 3.7: Forward and reverse primer for amplification of exon 5 of the canine LPL gene Table 3.8: Forward and reverse primer for amplification of exon 6 of the canine LPL gene Table 3.9: Forward and reverse primer for amplification of exon 7 of the canine LPL gene Table 3.10: Forward and reverse primer for amplification of exon 8 of the canine LPL gene Table 3.11: Forward and reverse primer for amplification of exon 9 of the canine LPL gene Table 3.12: Amplification conditions exon 1 – 9 Table 4.1: Overview of SNPs found in exon 2, 3, 5, and 7 in 21 Miniature Schnauzers Table 4.2: Overview of SNPs found in intron 1, 2, 3, 4, and 6 in 21 Miniature Schnauzers

70
A.3. Abbreviations LPL: lipoprotein lipase apo C2: apolipoprotein C2 TAG: triacyglycerol VLDL: very low density lipoprotein HSPG: heparin sulfated proteo glycans apo E: apolipoprotein E kb: kilobase bp: basepair ER: endoplasmatic reticulum Lys: Lysine Arg: Arginine Cys: Cysteine Gly: Glycine Ala: Alanine Thr: Threonine Asp: Aspartate Glu: Glutamate HGMD: human gene mutation database MSS-1/2: minimal screening set 1/2 PCR: polymerase chain reaction SNP: single nucleotide polymorphism PSTI: pancreatic secretory trypsin inhibitor EPI: exocrine pancreatic insufficiency PAA: pancreatic acinar atrophy SIBO: small intestinal bacterial overgrowth GSD: German Shepherd dog cTLI: canine trypsin like immunoreactivity cPLI: canine pancreatic lipase immunoreactivity cDNA: complementary DNA ∆H: enthalpy for helix formation ∆S: entropy for helix formation R: molar gas constant (1.987 cal/°C * mol) C: the nucleic acid concentration [K+]: potassium salt concentration Taq: polymerase isolated from the bacteria Thermophilus aquaticus Tm: melting temperature A: adenine G: guanine T: thymine C: cytosine Ex: exon

71
A.4. Curriculum Vitae
Name: Ralph Schickel
Geburtsdatum: 17.08.1976
Geburtsort: Augsburg
Eltern: Dieter und Roswitha Schickel
1984 – 1988: Rote Tor Schule, Augsburg
1988 – 1996: Rudolf-Diesel-Gymnasium, Augsburg
1996 – 1997: Zivildienst an der Diakonie Augsburg
1997 – 2003: Studium der Tiermedizin an der Ludwig-Maximilians-Universität,
München
24.Februar 2003: Abschluss des dritten Abschnitts der Tierärztlichen Prüfung
20.Mai 2003: Approbation als Tierarzt
März 2003 bis
März 2005: Anfertigung der vorliegenden Dissertation am Gastrointestinal
Laboratory at Texas A&M University, College Station, TX, USA
Seit August 2004: Studium des Master of Business Administration an der Mays
Business School at Texas A&M University, College Station, TX, USA