aus 4 awg-14 satellite communication questionnaire … · web viewthe following reference materials...
TRANSCRIPT

APT REPORT ON
STUDIES ON THE CO-EXISTENCE BETWEEN IMT-2000 TECHNOLOGIES AND BETWEEN IMT-2000 TECHNOLOGIES AND OTHER WIRELESS ACCESS TECHNOLOGIES IN ADJACENT AND
NEAR-ADJACENT FREQUENCY BANDS
No. APT/AWG/REP-4(Rev.2)Edition: February 2016
Adopted by
The 19th Meeting of APT Wireless Group (AWG-19) 2 – 5 February 2016
Chiang Mai, Thailand

APT/AWG/REP-04(Rev.2)
APT REPORT ON
STUDIES ON THE CO-EXISTENCE BETWEEN IMT-2000 TECHNOLOGIES AND BETWEEN IMT-2000 TECHNOLOGIES AND OTHER WIRELESS ACCESS TECHNOLOGIES IN ADJACENT AND
NEAR-ADJACENT FREQUENCY BANDS
Introduction
This Report examines the co-existence between different wireless access technologies in various frequency bands and is intended to provide a compilation of useful reference material for the benefit of APT members. A number of APT members have requested guidance on handling co-existence scenarios within their domestic allocation and licensing processes. This Report is expected to address the needs of these APT members.
This Report contains information on the results of analytical studies and live testing measurement that were contributed to the AWG. A number of relevant reference documents have also been embedded into this report.
This Report is not intended to be comprehensive. It is also understood that future modifications to this Report will be made to include additional sharing study results based on further contributions to the AWG.
Interference Scenarios Covered by this Report
1) Co-existence between CDMA2000 and WCDMA at 1.9 GHz
See ATTACHMENT 1
2) Co-existence between TD-SCDMA and PHS
See ATTACHMENT 2
3) Co-existence between CDMA2000 and GSM at 900 MHz
See ATTACHMENT 3
4) Co-existence between CDMA2000 networks operating in the 450 – 470 MHz band and other services
See ATTACHMENT 4
Other Reference Material
The following reference materials were also considered relevant to the work of Task Group on Sharing Studies on IMT Systems. The reference texts listed below are also included as embedded documents.
Page 2 of 30

APT/AWG/REP-04(Rev.2)
a) ITU-R
RECOMMENDATION ITU-R M.1580-5: Generic unwanted emission characteristics of base stations using the terrestrial radio interfaces of IMT-2000 (2014). This Recommendation establishes spurious emission mask limits to assist the deployment of multiple IMT-2000 interfaces.
RECOMMENDATION ITU-R M.1635: General methodology for assessing the potential for interference between IMT-2000 or systems beyond IMT-2000 and other services (2003). This Recommendation provides a methodology for assessing the potential for interference between IMT-2000 and other services in co-frequency and adjacent band deployments.
Report ITU-R M.2031: Compatibility between WCDMA 1800 downlink and GSM 1900 uplink (2003). This report analyses band edge interference issues between 1800 MHz WCDMA downlinks and 1900 MHz GSM uplinks and includes deterministic calculations and Monte Carlo simulations that might be useful to a number of interference scenarios.
Report ITU-R M.2039-3: Characteristics of terrestrial IMT-2000 systems for frequency sharing/interference analyses (2014). This report provides the baseline characteristics of terrestrial IMT-2000 systems
b) Other
Analysis of interference between WCDMA and CDMA2000. China Communications Standards Association. This report studies incidents of mutual interference between WCDMA and cdma2000 systems operating in adjacent frequency bands.
Interference analysis and guidelines for coexistence. Qualcomm Inc. This document examines sharing issues between various mobile technologies in co-frequency and adjacent frequency bands.
3GPP TS 25.104 V11.0.0 (2011-12): 3rd Generation Partnership Project; Technical Specification Group Radio Access Network; Base Station (BS) radio transmission and reception (FDD) (Release 11). 3GPP. This document establishes the Base Station minimum RF characteristics of the FDD mode of UTRA, especially Adjacent Channel Selectivity (ACS) and the limitation set for the condition of co-existence operating in the same geographical area with BTS from other cellular systems, one of which is CDMA system.
3GPP2 C.S0010-E Version 1.0 (December 2011): Recommended Minimum Performance Standards for cdma2000 Spread Spectrum Base Stations. 3GPP2. This document sets minimum performance standards for base stations of CDMA2000 system.
Other scenarios identified for possible inclusion in future studies include:
CDMA2000 uplink in 1850 - 1910 MHz and the GSM downlink in 1805 - 1880 MHz. TDD and FDD systems at 2 GHz.
Page 3 of 30

APT/AWG/REP-04(Rev.2)
PHS systems in the 1885-1920 MHz band and WCDMA uplinks in the 1920-1980 MHz band.
APT members are encouraged to contribute further studies on these scenarios to future meetings of the AWG.
_______________
Page 4 of 30

APT/AWG/REP-04(Rev.2)
ATTACHMENT 1
Co-existence between CDMA2000 and WCDMA at 1.9 GHz
Source: Input Document AWF-2/57 (Rev.1) from DG Postel, IndonesiaInput Document AWG-14/43 (Rev.1) from MCIT, Indonesia
1. Sharing Study Conducted in Indonesia at 2005
1.1 Definition of Interference Scenario There is a potential for interference between the CDMA2000 downlink in 1930 – 1990 MHz and the WCDMA uplink in 1920 – 1980 MHz.
1.2 Results of Live TestingIndonesia submitted an input document to the 2nd meeting of the APT Wireless Forum (AWF) held in September 2005 reporting the results of live testing conducted in Indonesia for this scenario. The test was conducted by DGPT Indonesia together with operators (PT. Telkomsel, PT. Telkom and PT.Indosat) to study the impact of interference on both WCDMA and CDMA 2000 technologies and to determine the required guard band between both technologies.
Previously, DG Posts & Telecommunications (DG Postel) has allocated CDMA 2000 technology at PCS 1900 bands. And recently, DG Postel also allocated WCDMA technology at IMT-2000 band as can be seen in the figure below:
As shown, the CDMA 2000 down link and WCDMA Up link are licensed to operate in adjacent frequency bands. Hence the study and testing was conducted to determine the impact on interference between CDMA 2000 Down link and WCDMA Up link.
Page 5 of 30
Wireless Access Technology
Mobile Station Transmitter (MHz)
Base Station Transmitter (MHz)
DuplexSep (MHz)
CDMA2000 1 850 – 1 910 1 930 - 1 990 80WCDMA 1 920 – 1 980 2 110 - 2 170 190

APT/AWG/REP-04(Rev.2)
1.3 Testing Scenario -- The testing was conducted by comparing the impact on having the WCDMA system implemented with and without guard band toward the CDMA 2000 system. During the test, the following conditions were tested:- Between two systems, guard band of 15 MHz, 5 MHz and no guard band were tested.- 1 WCDMA Node B and 1 CDMA 2000 RBS that close to each other was selected. - 2 worst sectors / cells on WCDMA system was selected in order to determine the
impact of interference on WCDMA up link.- WCDMA system was set under minimum capacity to simplify testing on the impact
of interference toward system capacity.
1.4 Testing Result – The testing result show following important point :- Interference increasing WCDMA noise level -- The noise level of WCDMA system
was increase dramatically when there is no guard band with the CDMA 2000 system. - Interference decreasing WCDMA capacity -- Due to the noise level of WCDMA
were increase, The system capacity reduced by 20% as compare to non interferer condition.
- Under worst condition, no calls on WCDMA system can be made -- Highly interferer WCDMA system, where WCDMA and CDMA 2000 close and head to head to each other, without any guard band between the system, the test result show that no call can be made. Moreover, when the mobile station are close to the CDMA 2000 system, the mobile station were not able to make location update due to very strong interference from CDMA 2000 down link.
- 5MHz guard band improved the noise level -- The test result show that with a guard band of 5 MHz between WCDMA and CDMA 2000 will improve the noise level significantly. Moreover, the maximum capacity of the system can be achieved due to less interference on the WCDMA up link.
1.5 Testing Conclusion- The uplink of WCDMA system is interfered by the downlink of CDMA 2000 system
and will impact to degradation of capacity– while the impact to CDMA 2000 is negligible.
- The testing showed that the different carrier spacing (guard band) and the geographical distance between CDMA 2000 and WCDMA in 1900 MHz band will cause capacity loss due to interference.
- From the test result it was proven that the noise level in a high-interfered cell is higher than one in a low-interfered cell.
- A high-interfered cell has less capacity. Hence, it can support less UE simultaneously, compared to the low-interfered cell. In the test case results, for Video call application, the number of supported UE’s decreases by 20% compared to the low-interfered cell.
- Minimum Guard band of 5 MHz with sites coordination between the CDMA2000 downlink and the WCDMA uplink is required to overcome the interference problem. Moreover, band pass filter is required to minimize the interference using 5 MHz guard band.
- At the worst case where the sites are close to each other and the antennas are facing each other, the interferences show worst impact not only to capacity loss but cause WCDMA can not make any location update.
Page 6 of 30

APT/AWG/REP-04(Rev.2)
2. Sharing Study Conducted in Indonesia at 2012
2.1 Status in Indonesia after conducted sharing study at 2005
After conducting sharing study of CDMA2000 and WCDMA systems at 2005, a year later (2006), MCIT of Republic of Indonesia set frequency arrangements for 2.1 GHz band to be used by WCDMA system is 1920-1970 MHz / 2110-2160 MHz and frequency arrangements for 1.9 GHz band to be used by CDMA2000 system is 1903.125 - 1910 MHz / 1983.125 - 1990 MHz. Thus, there is enough guard band with a wide of 13.125 MHz between the upper limit of WCDMA uplink allocation to the lower limit of CDMA2000 downlink allocation.
Due to the increase demand of data traffic through 3G networks and taking into account the results of sharing study conducted at 2012, MCIT run a selection process for adding the WCDMA band allocation to the existing 3G operators, to become 1920-1980 MHz / 2110-2170 MHz. The impact of this selection process is a reduction of the wide guard band between WCDMA uplink to CDMA downlink, from 13.125 MHz (before selection) to 3.125 MHz (after selection).
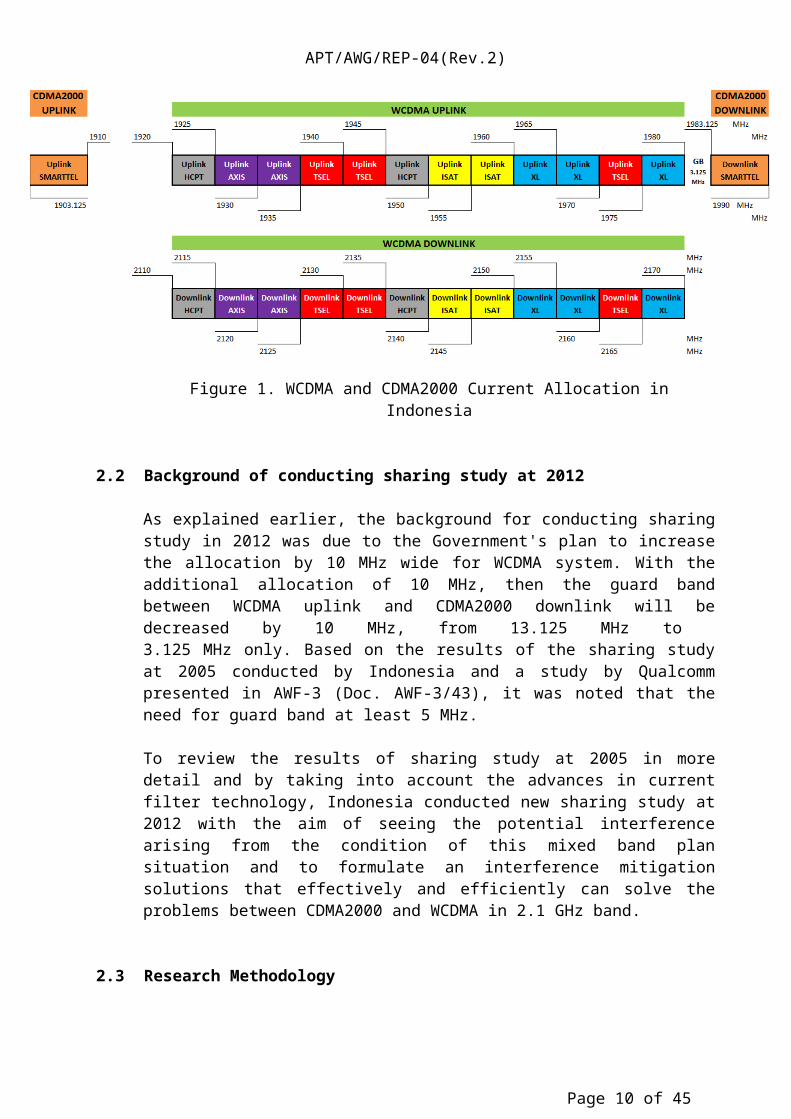
Below is a figure that pictured the current WCDMA allocation, after the selection process run in early 2013, and also the allocation of CDMA2000 in Indonesia (Figure 1). For additional information, that after the selection is done, it will continue by a total refarming process in WCDMA 2.1 GHz band to realign the whole allocations for each operators.
Figure 1. WCDMA and CDMA2000 Current Allocation in Indonesia
2.2 Background of conducting sharing study at 2012
As explained earlier, the background for conducting sharing study in 2012 was due to the Government's plan to increase the allocation by 10 MHz wide for WCDMA system. With the additional allocation of 10 MHz, then the guard band between WCDMA uplink and CDMA2000 downlink will be decreased by 10 MHz, from 13.125 MHz to 3.125 MHz only. Based on the results of the sharing study at 2005 conducted by
Page 7 of 30
APT/AWG/REP-04(Rev.2)
Indonesia and a study by Qualcomm presented in AWF-3 (Doc. AWF-3/43), it was noted that the need for guard band at least 5 MHz.
To review the results of sharing study at 2005 in more detail and by taking into account the advances in current filter technology, Indonesia conducted new sharing study at 2012 with the aim of seeing the potential interference arising from the condition of this mixed band plan situation and to formulate an interference mitigation solutions that effectively and efficiently can solve the problems between CDMA2000 and WCDMA in 2.1 GHz band.
2.3 Research Methodology
Although there are eight possible scenarios of interference between WCDMA system and CDMA2000 system, but taking into account the position of band allocation between those two systems, there are only two possible interference scenarios that should be considered further (see Figure 2) :
1) Scenario 1 : CDMA BTS interfering with WCDMA Node-B; and
2) Scenario 7 : WCDMA UE interfering with CDMA2000 MS.
Note :
1. CDMA2000 BTS Tx interfering with WCDMA Node-B Rx
2. CDMA2000 MS Tx interfering with WCDMA Node-B Rx
3. CDMA2000 MS Tx interfering with WCDMA UE Rx
4. CDMA2000 BTS Tx interfering with WCDMA UE Rx
5. WCDMA Node-B Tx interfering with CDMA2000 BTS Rx
6. WCDMA UE Tx interfering with CDMA2000 BTS Rx
7. WCDMA UE Tx interfering with CDMA2000 MS Rx
8. WCDMA Node-B Tx interfering with CDMA2000 MS Rx
Figure 2. Possible Interference Scenarios between WCDMA and CDMA2000
Page 8 of 30

APT/AWG/REP-04(Rev.2)
Figure 3. WCDMA and CDMA2000 Interference Scenarios
Referring to the results of the sharing study, especially on the uplink simulation, from China Communications Standard Association presented in AWF-3 (Doc. AWF-3/41) and the study from Association of Unified Telecom Service Providers of India (AUSPI), both are published at 2006, the interference scenario of WCDMA UE interfering with CDMA2000 MS can be considered negligible because the interference is expected to occur in a relatively small percentage of time and very low capacity loss occured. Thus, Indonesia just doing research on the interference scenario of CDMA2000 BTS interfering with WCDMA Node-B.
Methodology of the research are as follows :
1) Performing paper-based studies with reference to the documents of ITU, APT, 3GPP, 3GPP2, and the results of similar studies from other countries to explore the theory of the interference problems and also the mitigation proposals;
2) Organizing intensive discussions with the principal of the CDMA technology and also the vendors of the equipments;
3) Organizing continuous discussions with representatives of all WCDMA and CDMA2000 operators;
4) Composing a Standard Operating Procedure (SOP) document as a preparation to conduct joint measurements, in order to analyze the causes of the interference;
5) Conducting joint measurements involving the representatives of the Government and all the WCDMA and CDMA2000 operators;
6) Analyzing the joint measurement results;
7) Based on the joint measurement results, formulating hypothetical interference mitigation solutions;
8) Testing the effectiveness of the solutions by applying it directly in the field using existing WCDMA Node-B and CDMA BTS which are separated in a distance of 5 – 10 meters; and finally
Page 9 of 30
Scenario 1 :WCDMA UE (1920 – 1980 MHz) interfering
with CDMA2000 MS
Scenario 2 :CDMA BTS interfering with WCDMA Node-B
(2110 – 2170 MHz)
APT/AWG/REP-04(Rev.2)
9) Analyzing the results of the field measurements and then determine the provisions to be carried out in the domestic regulations as a guideline for coordination procedures between WCDMA and CDMA2000 operators.
Joint measurement methodologies that are contained in the SOP consists of four different types of measurements, those are :
1) Measurement of spurious emission from the transmitter module inside the CDMA2000 BTS. This measurement intended specifically to get the value of spurious emission level at the point of 1980 MHz when CDMA2000 BTS is transmitting channel 1075 (center frequency = 1983.75 MHz).
2) Measurement of the received filter characteristics in WCDMA Node-B.
3) Measurement of Received Signal Strength Indication (RSSI) read in Operation Support System (OSS) of WCDMA Node-B that is being measured.
4) Measurement of noise floor.
2.4 Analysis to the Results of the Research
Referring to the technical provisions contained in document 3GPP TS 25.104 v11.0.0, there are limitations set by the 3GPP for the condition of co-existence in UTRA FDD BTS operating in the same geographical area with BTS from other cellular systems, one of which is CDMA system. Table 6.11 3GPP TS 25 104 v11.0.0, state that the power of spurious emission shall not exceed -47 dBm with a measurement bandwidth of 100 kHz.
In contrast, document 3GPP2 C.S0010-E which highlighted the recommended minimum performance standards for CDMA2000 BTS, there were no provision mentioned for the conditions of co-existence between CDMA system with other cellular systems. The provision of the spurious emission contained in the 3GPP2 document is about the transmitter spurious emission limits (see Table 4.4.1.1.3-2 3GPP2 C.S0010-E). It was stated that maximum value of spurious emission within 2.25 - 4 MHz from the center frequency of transmitted CDMA200 channel is -13 dBm/1 MHz or equivalent to -23 dBm for a measurement bandwidth of 100 kHz. The value of -23 dBm/100 kHz was required in 3GPP2 C.S0010-E to be achieved when the condition of the transmitting channel measured is at its maximum power (20 Watt, equivalent to 32 dBm/100 kHz).
The measurement result of spurious emission at the CDMA2000 BTS can be seen in Figure 4. From these figure, it can be seen that the spurious emission at 1980 MHz, which means 3.75 MHz away from the center frequency of channel 1075 (fc = 1983.75 MHz), equal to -86.14 dBm/100 kHz.
However, because 40 dB attenuator is used when conducting the measurement, then the actual value of the spurious emission is -46.14 dBm/100 kHz. The value of -46.14 dBm/100 kHz was reached for the transmitted channel power equal to 21.76 dBm/100 kHz (-18.24 dBm/100 kHz + 40 dBm). Thus, by scaling, it can be said that for the condition of maximum transmitted power (32 dBm/100 kHz), the value of spurious emission at 1980 MHz is equal to -35.9 dBm/100 kHz.
When compared with the maximum spurious emission limit in 3GPP2 C.S0010-E, it can be said that the transmitter of CDMA2000 measured had a spurious emission comply with the limitation (max -23 dBm/100 kHz).
Page 10 of 30

APT/AWG/REP-04(Rev.2)
However, when it is compared to the maximum spurious emission limit for co-existence condition as stated in 3GPP TS 25.104 v11.0.0, the spurious emission from CDMA2000 transmitter (-35.9 dBm/100 kHz) certainly not comply with the limitation (max -47 dBm/100 kHz). To make it comply, the CDMA2000 BTS must install an additional filter for each antenna that have rejection value at least -11 dB in 1980 MHz. If the additional filter is not installed, then the receiver at WCDMA Node-B will experience degradation of signal reception sensitivity that is quite severe.
Figure 4. Measurement Result of Spurious Emission from CDMA2000 BTS
The example of CDMA2000 Tx filter specifications can be seen in Figure 5. This example is for rejection value requirement equal to -3.88 dB in 1980 MHz.
After doing research in the CDMA2000 BTS, the research continues in the WCDMA Node-B. For WCDMA Node-B, the conducted measurement is aimed at getting the received filter characteristics. The measurements results on different devices from different vendors indicate that the received filter characteristics installed in WCDMA Node-B still can not reject CDMA transmitted signal at 1983.125 – 1990 MHz very well, even the signal was amplified. Figure 6 shows one measurement result of receiver filter characteristics. It can be seen from the figure that there is no rejection at 1983.125 MHz, the received signal even amplified by 20 dB gain. The rejection value at 1983.125 should be around -3dB to -6 dB. Up to the point of 1990 MHz, the received signal is still amplified, approximately 11 dB gain, and there is no rejection also at this point. The rejection value at 1990 MHz should be -20 dB. Received signal starts not to be amplified at 1995 MHz and the rejection value began to increase thereafter.
Page 11 of 30

APT/AWG/REP-04(Rev.2)
Source : Qualcomm
Figure 5. Example of CDMA2000 Transmitter Filter Specifications
Figure 6. Measurement Result of Received Filter Characteristics at WCDMA Node-B
The received filter characteristics as described in Figure 6 causes Adjacent Channel Interference (ACI) at the receiver of WCDMA Node-B due to the incompatibility situation of Adjacent Channel Selectivity (ACS) limitation, which makes the LNA work in non-linear condition. Solutions that can be taken to address ACI is to combine the antenna isolation techniques with additional filter installation. Based on some experiments, additional received filter at WCDMA Node-B must have a rejection value around -30 dB to -40 dB at 1983.125 MHz. The example of WCDMA Rx filter specifications can be seen in Figure 7. This example is for rejection value requirement equal to -35.96 dB in 1981.5 MHz.
Page 12 of 30

APT/AWG/REP-04(Rev.2)
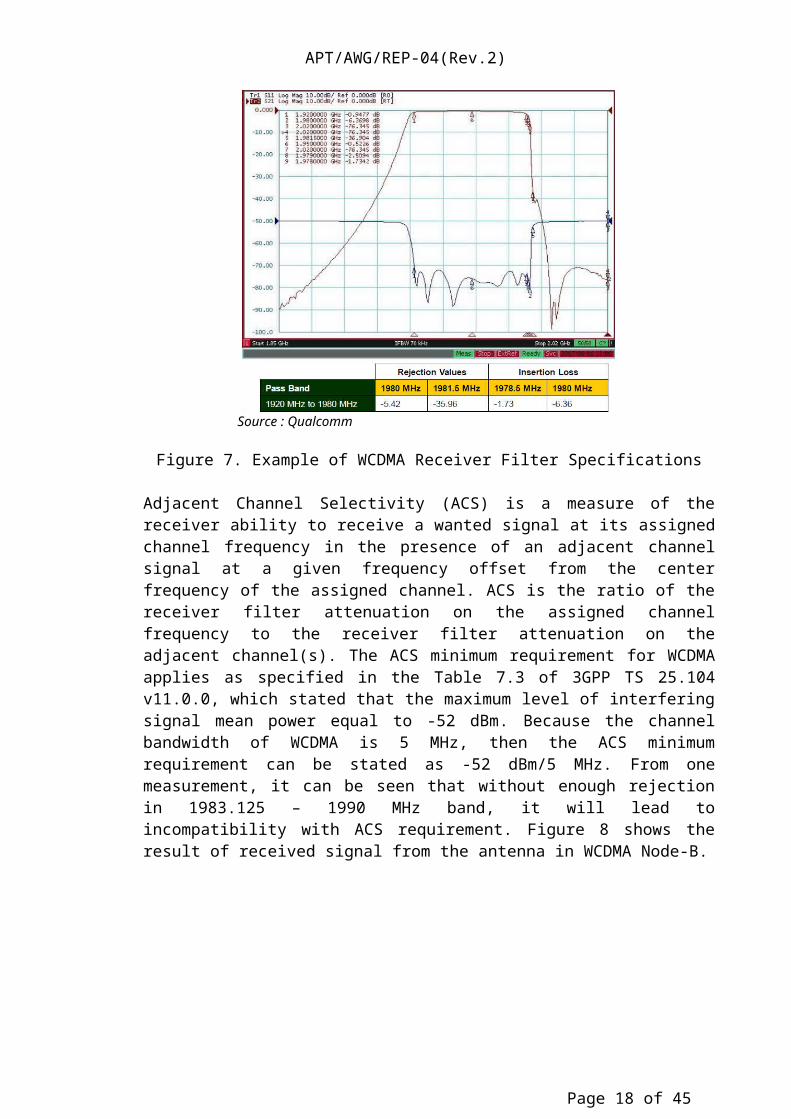
Source : Qualcomm
Figure 7. Example of WCDMA Receiver Filter Specifications
Adjacent Channel Selectivity (ACS) is a measure of the receiver ability to receive a wanted signal at its assigned channel frequency in the presence of an adjacent channel signal at a given frequency offset from the center frequency of the assigned channel. ACS is the ratio of the receiver filter attenuation on the assigned channel frequency to the receiver filter attenuation on the adjacent channel(s). The ACS minimum requirement for WCDMA applies as specified in the Table 7.3 of 3GPP TS 25.104 v11.0.0, which stated that the maximum level of interfering signal mean power equal to -52 dBm. Because the channel bandwidth of WCDMA is 5 MHz, then the ACS minimum requirement can be stated as -52 dBm/5 MHz. From one measurement, it can be seen that without enough rejection in 1983.125 – 1990 MHz band, it will lead to incompatibility with ACS requirement. Figure 8 shows the result of received signal from the antenna in WCDMA Node-B.
Figure 8. Signal Mean Power Measurement Result of 1980 – 1985 MHz band
Page 13 of 30

APT/AWG/REP-04(Rev.2)
Figure 8 shows that without additional received filter, the interfering mean power in the adjacent channel (1980 – 1985 MHz) is higher than the requirement. The measurement result is equal to -13.81 dBm/5 MHz, while the ACS requirement is maximum -52 dBm/5 MHz. After installing an additional received filter in WCDMA Node-B, the interfering mean power measured is better and it ends in a linear operation of the LNA.
Due to some difficulties in providing CDMA2000 Tx filter, there were no test involving both filters installed together, in WCDMA Node-B and CDMA2000 BTS, but the condition after the installation of additional filter in WCDMA Node-B is quite good, the RSSI measured in OSS for 1975 – 1980 MHz band is equal to -103 dBm/5 MHz. Before the installation of the additional received filter, the RSSI measured is equal to -55 dBm/5 MHz. To get the ideal RSSI which is around -105 dBm, the CDMA2000 operator must install additional filter in their BTS transmitter to achieve spurious emission level at 1980 MHz maximum -47 dBm/100 kHz (for transmitted power equal to 32 dBm/100 kHz).
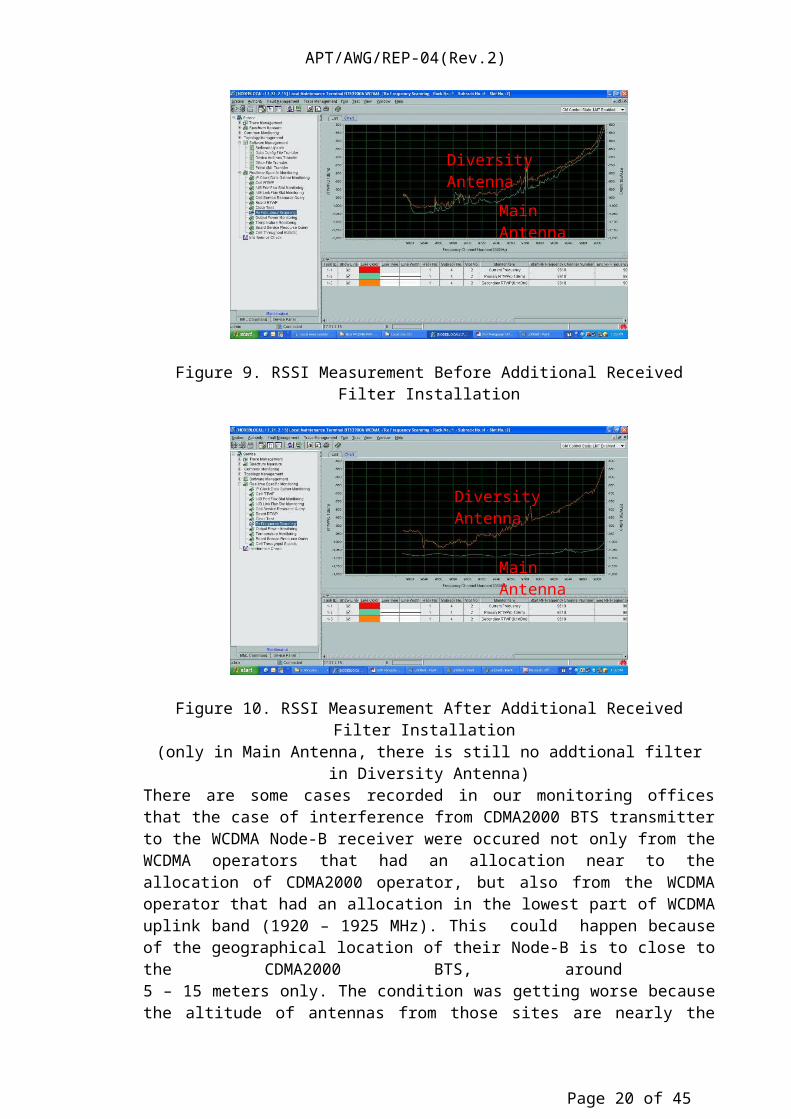
Figure 9 10 show the difference measurement results of installing additional received filter in WCDMA Node-B.
Figure 9. RSSI Measurement Before Additional Received Filter Installation
Figure 10. RSSI Measurement After Additional Received Filter Installation (only in Main Antenna, there is still no addtional filter in Diversity Antenna)
Page 14 of 30
Main Antenna
Diversity Antenna
Main Antenna
Diversity Antenna

APT/AWG/REP-04(Rev.2)
There are some cases recorded in our monitoring offices that the case of interference from CDMA2000 BTS transmitter to the WCDMA Node-B receiver were occured not only from the WCDMA operators that had an allocation near to the allocation of CDMA2000 operator, but also from the WCDMA operator that had an allocation in the lowest part of WCDMA uplink band (1920 – 1925 MHz). This could happen because of the geographical location of their Node-B is to close to the CDMA2000 BTS, around 5 – 15 meters only. The condition was getting worse because the altitude of antennas from those sites are nearly the same and the antennas were situated in a face-to-face condition.
2.5 Conclusion
1. The main interference scenario should be considered for a mixed band plan condition of WCDMA in 2.1 GHz band and CDMA2000 in 1.9 GHz band is CDMA2000 BTS transmitter (downlink) interfering with WCDMA Node-B receiver (uplink).
2. The causes of CDMA2000 BTS transmitter interfering with WCDMA Node-B receiver are generated from both sides :
a) High spurious emission level from CDMA2000 transmitter in 1920 – 1980 MHz band, which the limit is maximum -47 dBm/100 kHz (measured in condition of transmitted power equal to 32 dBm/100 kHz), and
b) Low rejection in the embedded received filter of WCDMA Node-B for interfering signal in 1980 – 1985 MHz, which should reject interfering signal so that the measured mean power is maximum -52 dBm/5 MHz.
3. The solution for high spurious emission level from CDMA2000 transmitter is to install an additional filter between base station cabinet and the antenna that lower the spurious emission level as required.
4. The solution for low rejection in the embedded received filter of WCDMA Node-B is to install an additional filter between antenna and the base station cabinet that can reject interfering signal in the adjacent band to a level as required. To minimize the rejection value needed, WCDMA operator can cooperate with the CDMA2000 operator to reconfigure the physical parameters in both antennas to have higher level of antennas isolation.
5. The most critical factor of the interference potential is geographical locations of the CDMA2000 BTS and WCDMA Node-B, not the allocation of the frequency bands. The closer the location of the sites, the greater the potential for interference occured. Especially when antenna’s altitude of both sites are relatively the same and the azimuth directions of the antennas creates a face-to-face condition, it will lead to a higher potential of interference.
Page 15 of 30

APT/AWG/REP-04(Rev.2)
ATTACHMENT 2
Co-existence between TD-SCDMA and PHS
Source: Input Document AWF-IM3/06 from ZTE Corporation, China
China Communications Standards Association (CCSA) TC5 WG8 workgroup has completed
sharing study between TD-SCDMA and PHS in 1880-1920MHz and the Report
“TC5_WG8_2006_Sharing study between TD-SCDMA and PHS” has been approved in CCSA
TC5 plenary meeting.
This report includes seven parts as below:
Introduction
Research Methodology
Interference analyses
System Parameters
Network Model
Simulation Results
Conclusion and suggestion
The contribution provides useful information of this report.
1 Introduction
In October 2002, the Radio Administration under the Ministry of Information Industry issued
the Notification regarding the Planning of Third Generation Public Mobile Communication
System Frequencies, which stipulated the planning rules for 3G system frequencies in China.
According to this planning scheme, The TD-SCDMA system has a total of 155 MHz available spectrum. The frequency range 1880-1920MHz/2010-2025MHz is used as the
main service frequency range for TD-SCDMA. Meanwhile, Chinese government has allocated
2300-2400MHz to TD-SCDMA as additional spectrum.
Figure 1:TD-SCDMA frequency allocation in china
Page 16 of 30

APT/AWG/REP-04(Rev.2)
60 MHz30 MHz
FDD TDD
100 MHz100 MHz15MHz
40 MHz
155MHz
1785 18501755 1880 1920 1980 2010 2025 2110 2170 2200 2400
Satellite Empty Satellite
2300
In china, the band 1900-1920MHz is used for PHS system. Therefore, CCSA TC5 WG8 decided
to study coexistence between the TD-SCDMA and PHS system in the band 1880-1920MHz in
2004.
2 Research Methodology
The interference scenarios between TD-SCDMA and PHS in adjacent spectrum are as follows.
1) Interference from a PHS Cell station (CS) and PHS Personal Station (PS) to TD-SCDMA
BS
2) Interference from a PHS CS and PHS PS to TD-SCDMA UE
3) Interference from TD-SCDMA BS and TD-SCDMA UE to PHS CS
4) Interference from TD-SCDMA BS and TD-SCDMA UE to PHS CS
In the interference analysis, the TD-SCDMA and PHS systems were modeled as operating in a
microcellular network. Additionally, the analysis was extended to include macrocellular and
picocellular deployment scenarios for the TD-SCDMA system.
This research adopted a simulation methodology to study major incidents of mutual interference
between Cell stations and base stations working in adjacent frequency ranges in an environment
where both the PHS and TD-SCDMA systems exist. Based on the analysis results, this research
will draw a research conclusion with regard to system frequency interference protection and
make recommendations to the relevant departments of the Chinese government on how to
protect against frequency interference.
3 Interference analyses
The causes of interference are diverse. RF interference to mobile communication network may
be caused by such factors as an original dedicated radio system occupying an existing frequency
resource, improper network configurations by different operators, problematic configuration in
the transmitter, cell overlapping, the environment, electromagnetic compatibility (EMC), and
intentional interference. Primary forms of interference to mobile communication systems mainly
Page 17 of 30
APT/AWG/REP-04(Rev.2)
include: common-frequency interference, adjacent-frequency interference, out-of-band emission,
inter-modulation emission, and blocking interference.
Coexistence interference between systems working in different frequencies is caused by
imperfections in the transmitter and the receiver. The transmitter, when transmitting useful
signals, sometimes generates out-of-band emission, which includes adjacent-frequency emission
and out-of-band spurious emission, both due to modulation. While the receiver receives useful
signals, interfering signals falling into the channel may cause the loss of receiver sensitivity, and
the interfering signals falling into the receiving bandwidth may cause in-band blocking;
meanwhile, the receiver also has imperfections due to non-linearity, and out-of-band signals
(useful signals from the transmitter) will cause out-of-band blocking of the receiver. The
interference between the transmitter and the receiver also depends on factors such as the interval
between the working frequency ranges of the two systems and the spatial separation between the
receiver and transmitter.
4 system parameters
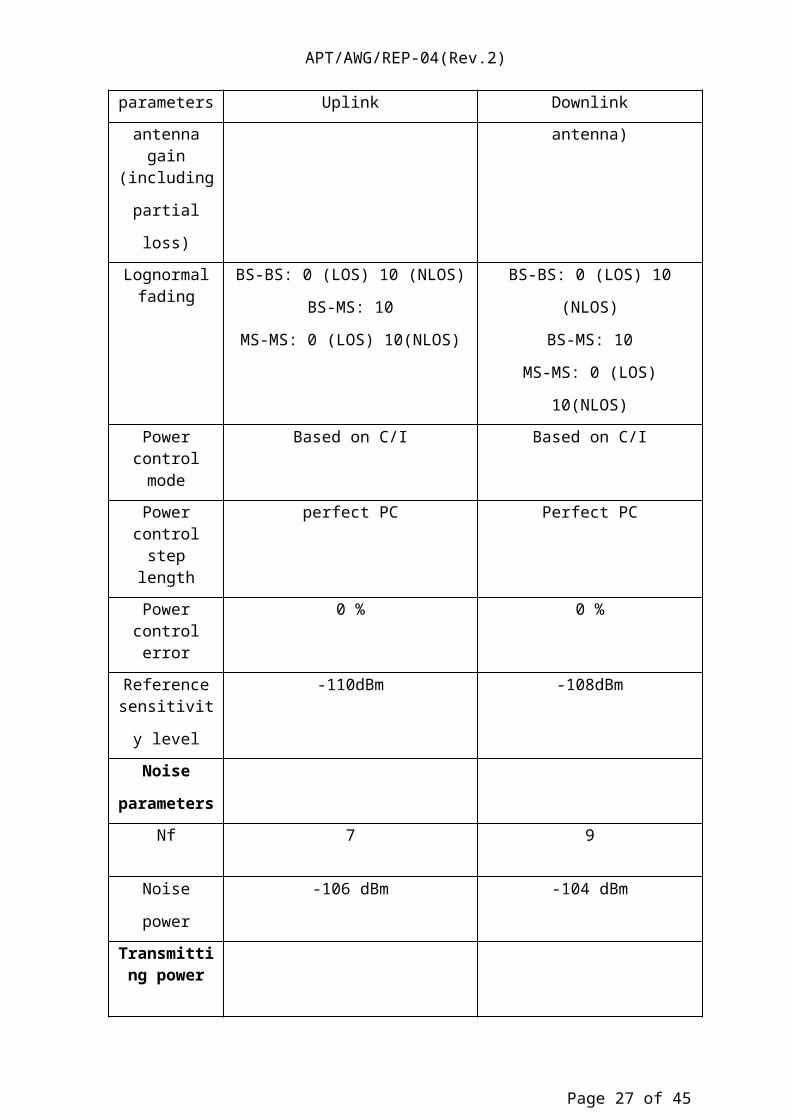
The parameters of TD-SCDMA used in the analyses are given in Table 1.
Table 1TD-SCDMA parameters(directional antenna)
parameters Uplink Downlink
Simulation type Snapshot(>=800) Snapshot(>=800)
Transmission
Parameters
MCL(including
antenna gain)
BS-MS: 70dB
MS-MS: 80dB
BS-BS: 45dB
BS-MS: 70dB
MS-MS: 40dB
BS-BS: 80dB
Receiving antenna gain (including
partial loss)
11+5.3dB(directional antenna) 0 dBi
Transmittingantenna gain(including
partial loss)
0 dBi 11+5.3dB(directional antenna)
Lognormal fading
BS-BS: 0 (LOS) 10 (NLOS) BS-BS: 0 (LOS) 10 (NLOS)
Page 18 of 30

APT/AWG/REP-04(Rev.2)
parameters Uplink Downlink
BS-MS: 10
MS-MS: 0 (LOS) 10(NLOS)
BS-MS: 10
MS-MS: 0 (LOS) 10(NLOS)
Power controlmode
Based on C/I Based on C/I
Power control step
length
perfect PC Perfect PC
Power controlerror
0 % 0 %
Referencesensitivity level
-110dBm -108dBm
Noise
parameters
Nf 7 9
Noise power -106 dBm -104 dBm
Transmitting power
Maximumtransmitting
powerat base station
34dBm
Maximumtransmitting
powerat UE
21 dBm
Power controlrange
70 dB 30 dB
User
distribution
Random uniform distributionAccording to area
Random uniform distributionaccording to area
Table 2 describes system parameters of PHS system.
Table 2PHS System Parameters
parameters Downlink uplink
Maximum 4000mW 80mW
Page 19 of 30
APT/AWG/REP-04(Rev.2)
parameters Downlink uplink
transmitting
power
Transmittingantenna gain
9dBi 0dBi
Receiving antennaGain
0dBi 9dBi
Gain of sending
Diversity
3dB 0 dB
Gain of receiving
Diversity
0 dBi 9dB
C/I 19dB 10dB
Adjacent channel
leakage power
2*△f <800nW3*△f <250nW
2*△f <800nW3*△f <250nW
Bandwidth 288kHz 288kHz
Receiver sensitivity
16dBuv(-91dBm,1*10-2) <8dBμ(99dBm,1*10-2)
Extent of Receiver signal
16∽80dBμ (-91∽-27dBm) 8∽60dBμ (-91∽-47dBm)
Adjacent channel selectivity
2*△f : 〉50dB 2*△f : 〉50dB
5 Network Model
It is assumed that one operator use a network of TD-SCDMA consisting of 27 cells as shown in
figure 2.
Figure2: TD-SCDMA network model
The network model of PHS system is shown as below.
Figure3 : PHS network model
Page 20 of 30

APT/AWG/REP-04(Rev.2)
6 Simulation Result and Analysis
This report gives following simulation results.
6.1 PHS->TD-SCDMA
(1) Interference from PHS PS into TD-SCDMA BS
Figure4: TD-SCDMA uplink capacity loss (PHS UL->TD-SCDMA UL)
Figure 4 shows TD-SCDMA uplink capacity loss when PHS PS interferes into TD-SCDMA BS.
a) When PHS PS interferes into TD-SCDMA BS in the case of TD-SCDMA cell with radius
577m, in order to achieve the TD-SCDMA uplink capacity loss less than 5%, an ACLR of
18dB is required.
b) When PHS PS interferes into TD-SCDMA BS in the case of TD-SCDMA cell with radius
1000m, in order to achieve the TD-SCDMA uplink capacity loss less than 5%, an ACLR of
24dB is required.
c) When PHS PS interferes into TD-SCDMA BS in the case of TD-SCDMA cell with radius
1500m, in order to achieve the TD-SCDMA uplink capacity loss less than 5%, an ACLR of
Page 21 of 30

APT/AWG/REP-04(Rev.2)
31dB is required.
(2) Interference from PHS CS into TD-SCDMA BS
Figure5: TD-SCDMA uplink capacity loss (PHS DL->TD-SCDMA UL)
Figure 5 shows TD-SCDMA uplink capacity loss when PHS CS interferes into TD-SCDMA BS.
a) When PHS CS interferes into TD-SCDMA BS in the case of TD-SCDMA cell with radius
577m, in order to achieve the TD-SCDMA uplink capacity loss less than 5%, an ACLR of
48dB is required.
b) When PHS CS interferes into TD-SCDMA BS in the case of TD-SCDMA cell with radius
1000m, in order to achieve the TD-SCDMA uplink capacity loss less than 5%, an ACLR of
55 dB is required.
c) When PHS CS interferes into TD-SCDMA BS in the case of TD-SCDMA cell with radius
1500m, in order to achieve the TD-SCDMA uplink capacity loss less than 5%, an ACLR of
63 dB is required.
Page 22 of 30

APT/AWG/REP-04(Rev.2)
(3) Interference from PHS PS into TD-SCDMA UE
Figure6: TD-SCDMA downlink capacity loss (PHS UL->TD-SCDMA DL)
Figure 6 shows TD-SCDMA downlink capacity loss when PHS PS interferes into TD-SCDMA
UE.
a) When PHS PS interferes into TD-SCDMA UE in the case of TD-SCDMA cell with radius
577m, in order to achieve the TD-SCDMA downlink capacity loss less than 5%, an ACLR
of 15dB is required.
b) When PHS PS interferes into TD-SCDMA UE in the case of TD-SCDMA cell with radius
1000m, in order to achieve the TD-SCDMA downlink capacity loss less than 5%, an ACLR
of 23 dB is required.
c) When PHS PS interferes into TD-SCDMA UE in the case of TD-SCDMA cell with radius
1500m, in order to achieve the TD-SCDMA downlink capacity loss less than 5%, an ACLR
of 30 dB is required.
Page 23 of 30

APT/AWG/REP-04(Rev.2)
(4) Interference from PHS CS into TD-SCDMA UE
Figure7: TD-SCDMA downlink capacity loss (PHS DL->TD-SCDMA DL)
Figure 7 shows TD-SCDMA downlink capacity loss when PHS CS interferes into TD-SCDMA
UE.
a) When PHS CS interferes into TD-SCDMA UE in the case of TD-SCDMA cell with radius
577m, in order to achieve the TD-SCDMA downlink capacity loss less than 5%, an ACLR
of 15dB is required.
b) When PHS CS interferes into TD-SCDMA UE in the case of TD-SCDMA cell with radius
1000m, in order to achieve the TD-SCDMA downlink capacity loss less than 5%, an ACLR
of 25 dB is required.
c) When PHS CS interferes into TD-SCDMA UE in the case of TD-SCDMA cell with radius
1500m, in order to achieve the TD-SCDMA downlink capacity loss less than 5%, an ACLR
of 33 dB is required.
Page 24 of 30

APT/AWG/REP-04(Rev.2)
6.2 TD-SCDMA->PHS
(1) Interference from TD-SCDMA BS into PHS CS
When using LOW-ALL loss path model between PHS CS and PHS PS, the simulation results
are shown in table3.
Table 3 ACLR values when TD-SCDMA BS interferes into PHS CS
Interference path ACLR
TD-SCDMA DCH interferes into PHS TCH 55dB
TD-SCDMA TS0+DCH interferes into PHS CCH 59~62dB
(2) Interference from TD-SCDMA BS into PHS PS
Figure8: PHS downlink capacity loss (TD-SCDMA DL->PHS DL)
Figure 8 shows PHS downlink capacity loss when TD-SCDMA BS interferes into PHS PS. It
can be seen from above figure that TD-SCDMA BS does not interfere into PHS PS when an
ACLR value is more than 5dB
Page 25 of 30

APT/AWG/REP-04(Rev.2)
(3) Interference from TD-SCDMA UE into PHS CS
Figure9: PHS uplink capacity loss (TD-SCDMA UL->PHS UL)
Figure 9 shows PHS uplink capacity loss when TD-SCDMA UE interferes into PHS CS. It can
be seen that an ACLR value is very small, so TD-SCDMA BS UE does not interfere into PHS
PS.
(4) Interference from TD-SCDMA UE into PHS PS
Figure10: PHS uplink capacity loss (TD-SCDMA UL->PHS DL)
Page 26 of 30
APT/AWG/REP-04(Rev.2)
Figure 10 shows PHS uplink capacity loss when TD-SCDMA UE interferes into PHS DL. It can
be seen from above figure that TD-SCDMA UE does not interfere into PHS PS when an ACLR
value is more than 5dB.
7 Conclusion
According to the above simulation results, this report summarizes the results of interference
between TD-SCDMA and PHS.
1. PHS CS interferes TD-SCDMA BS
According to the simulation result, when TD-SCDMA BS radius increases from 577m to
1500m, an ACLR value changes from 48dB to 63dB.
2. PHS PS interferes with TD-SCDMA BS
According to the simulation result, PHS PS does not interfere into TD-SCDMA BS.
3. PHS CS interferes with TD-SCDMA UE
According to the simulation result, when TD-SCDMA BS radius increases from 577m to
1500m, an ACLR value changes from 15dB to 33dB.
4. PHS PS interferes with TD-SCDMA UE
According to the simulation result, when TD-SCDMA BS radius increases from 577m to
1500m, an ACLR value changes from 15dB to 30dB.
5. TD-SCDMA BS interferes with PHS CS
The simulation results are shown in the above table3.
6. TD-SCDMA BS interferes with PHS PS
According to the simulation result, TD-SCDMA BS does not interfere into PHS PS.
7. TD-SCDMA UE interferes with PHS CS
According to the simulation result, TD-SCDMA BS UE does not interfere into PHS CS.
8. TD-SCDMA UE interferes with PHS PS
According to the simulation result, TD-SCDMA BS UE does not interfere into PHS PS.
_______________
Page 27 of 30

APT/AWG/REP-04(Rev.2)
ATTACHMENT 3
Co-existence between CDMA2000 and GSM at 900 MHz
Source: Input Document AWF-4/INP-37 from PT Indosat, Indonesia
This Attachment provides a summary of a study undertaken by PT Indosat in Indonesia directed towards minimizing the guard band required to allow operation between CDMA2000 systems with a downlink in the band 869 – 894 MHz and GSM or WCDMA systems with uplinks in the band 880 – 915 MHz. With a careful choice of equipment this guard band can be optimized and reduced to a value of 685 kHz. This choice was confirmed by on-site testing.
1.1 Definition of Interference Scenario
There is a potential for interference between the CDMA2000 downlink in 869 - 894 MHz and the GSM or WCDMA uplink in 880 – 915 MHz.
1.2 Indonesia Minister Communication and Information Decree 181 / 06
Since December 2006 Indonesian Government release new decree no. 181 / 06
The main purpose of this decree are :
Frequency Allocation:
M-8 Group : 835,905 – 840,8255 MHz paired with 880,905 – 885,825 MHz (Channel 384, 425, 466 and 507)
PT Indosat : 842,055 – 844,515 MHz paired with 887,055 – 889,515 MHz (Channel 589 and 630)
Naturally Guard Band between CDMA and GSM is 485 kHz Optimum usage of current frequency allocation (based on the audit by
Government)
Channel migration shall be finalized by 31 December 2007.
This decree gives big impact to GSM operator in which too close to CDMA band and that company is PT. INDOSAT.
From the theory CDMA operate close to GSM will create interference or CDMA as interfere and GSM network is the victim.
Page 28 of 30
Wireless Access Technology
Mobile Station Transmitter (MHz)
Base Station Trans (MHz)
DuplexSep (MHz)
CDMA2000 824 – 849 869 – 894 45GSM / WCDMA 880 – 915 925 - 960 45

37
78
119
160
201
242
283
37
384
425
466
507
548
589
630825,49
5829,18
5830,41
5834,10
5
835,905
840,825
842,055
844,515
870,495
874,185875,41
5879,10
5
880,905
885,825887,00
5889,51
5
37
78
119
160
201
242
283
37
384
425
466
507
548
589
630 89
090
0
UPLINK
DOWNLINK
BAND-A
BAND-B
BAND-A
BAND-B
BAKRIE
ESIA
TELKOM
FLEXY
MOBILE-8
FREN
ISAT*1
BAKRIE
ESIA
TELKOM
FLEXY
MOBILE-8
FREN
ISAT*1
New Allocation Scheme
ISAT
GSM
Source: Tim Perpindahan Frekuensi StarOne(Dec 06)
Need to manage
interference
APT/AWG/REP-04(Rev.2)
Figure of this decision can be seen :
2.1 Indosat Way out and share to other States
Indosat has been finalise their research to manage this situation and the result can be proposed are :
Put filter in all suspected sites Global Frequency Plan in GSM During Migration period Indosat borrow Channel 5 Keep GSM Network alive with optimal quality
2.2 Filter Specification
o GSM Filter 890.2 @40B band rejection seems to be better.o CDMA Filter, 890.2 @65dB band rejection can be better performance and advantages as
belowo With those kind of specification there is 685 MHz guard band between CDMA and GSM
Indosat Choose :1. Better Group Delay 2. Better Ripple 3. Better EVM specification in CDMA Networks 4. Better Insertion Loss 5. Better Network Performance & Quality and System stability 6. Easy tuning and mass-production
3 Sharing ExperienceWe in Indosat can optimize frequency guard band between CDMA800 and GSM900 and Indosat can achieve 685 kHz. In the future with sophisticated algorithm and technology we believe better solution will bbe reality.
4 Big Issue and Opportunity in Telecommunication Industry
1. Filter Business will in Booming era2. All Government will come to maximize band opportunity between CDMA and GSM in
serving the community.
Page 29 of 30

APT/AWG/REP-04(Rev.2)
ATTACHMENT 4
Co-existence between CDMA2000 networks operating in the 450 – 470 MHz band and other services
Source: Rep. ITU-R M.2110 (Sharing studies between radiocommunication services and IMT systems operating in the 450-470 MHz band)
____________
Page 30 of 30