uploads5.craft.co€¦ · aurora cannabis inc. 2018 annual report 1 despite receiving its license...
TRANSCRIPT

2018 ANNUAL REPORT
EXPANSION
INTEGRATION
DIVERSIFICATION

The Cannabis Industry’s Fastest Pro-forma Revenue Development

Aurora Cannabis Inc. 2018 Annual Report 1
Despite receiving its license from Health Canada 18 months after its largest competitors, Aurora has dramatically scaled production capacity and total revenue through a mix of rapid organic growth and strategic acquisitions that have produced the preeminent global cannabis leader.
$33.1 MillionPRO-FORMA Q4 2018 REVENUE1
1 Pro-forma revenue includes Aurora, CanniMed, and MedReleaf for all periods presented.
0
5
10
15
20
25
30
35
Competitor 2
Competitor 130-Jun-18
31-Mar-18
31-Dec-17
30-Sep-17
30-Jun-17
31-Mar-17
31-Dec-16
30-Sep-16
30-Jun-16
31-Mar-16
31-Dec-15
30-Sep-15
30-Jun-15
31-Mar-15
31-Dec-14
Qua
rter
ly R
even
ue (C
$mm
)

2 Aurora Cannabis Inc. 2018 Annual Report
Rapid Revenue Development Across All Verticals
Through carefully targeted acquisitions and the rapid development of its production facilities, Aurora has quickly expanded its total revenue base while broadening and diversifying its high-margin product offerings.
Today, Aurora’s growth is driven by a broad mix of revenues from across the cannabis industry value chain, including: Dried Flower, Oil, Patient Counselling, Hemp Products, Home Cultivation, Accessories and Facility Construction.
Aurora will continue to expand its portfolio of products by leveraging the industry’s most experienced science, and research and development teams, created through the combination of the teams at Aurora, CanniMed, MedReleaf and Anandia.
Rep
orte
d R
even
ue (C
$mm
)
Other1
Counselling ServicesOilDried Flower
Q4 2018
Q3 2018
Q2 2018
Q1 2018
0
10
20
30
40
50
60
Fiscal 2018
Fiscal 2017
206%
1 Other reported revenue includes Hempco, BC Northern Lights, Urban Cultivator Inc. and Aurora Larssen Projects Ltd.

Aurora Cannabis Inc. 2018 Annual Report 3
A Strong, Complementary Portfolio of Accretive Assets Creating Significant Shareholder Value
TOTAL AMOUNT INVESTED TO DATE
$326.6MILLION
FAIR MARKET VALUE (JUNE 30, 2018)
$698.6MILLION
UNREALIZED GAIN ON INVESTMENT
$372.0MILLION
ABOUT STRATEGIC RATIONALE
TSX: CLIQ Alcanna retails adult beverages including beer, wine, spirits, and after October 17, 2018, adult consumer use cannabis products
Rapid development of a Canadian, cannabis retail network
TSX/V: RTI Radient extracts compounds from biological material using a patented platform that provides superior purity, yield, and cost outcomes
Consistent, efficient and high-quality cannabis ex-tract production
TSX/V: N Namaste distributes vaporizers and smoking accessories through e-com-merce sites in 26 countries with five global distribution hubs
Expands Aurora’s smoke-free product offering for customers
TSX/V: HEMP Hempco manufactures and sells hemp seed food products for human and animal consumption.
Provides access to a low-cost raw material for the potential production of CBD extracts
ASX: CAN Cann Group is building a world-class Australian business to take advan-tage of opportunities in the emerging medicinal cannabis industry.
Develops Aurora’s inter-national operations in Australia
Private Capcium is a contract manufacturing platform specializing in softgel encap-sulation, providing high-value, high quality cannabis product
Expands Aurora’s differenti-ated, higher-margin product offerings
OTC: CTTH CTT provides safe, flexible, simple and innovative drug delivery systems for pain management therapies and treatments
Provides exclusive access to CTT’s product development pipeline, including oral thin film wafers
CSE: MWM Micron Waste is a leading organic waste technology company that de-veloped an on-site system that turns organic waste into clean water
Cost efficient and environ-mentally friendly waste disposal technology
CSE: CHOO Choom delivers elevated experiences through curated retail environments, handcrafted cannabis supply, and brand diversity for consumers
Positions Aurora to par-ticipate in the emerging craft cultivation market and Chooms Western Canada retail strategy
TSX: TGOD TGOD is a Canadian licensed pro-ducer, growing high quality, organic, medical cannabis with sustainable, all-natural principles
Aurora has the right to pur-chase up to 20% of TGOD’s annual production of organic cannabis from TGOD’s Ancaster and Valleyfield facilities

4 Aurora Cannabis Inc. 2018 Annual Report
Through the construction of its 11 technologically advanced production facilities, Aurora has developed a strong and growing ability to produce high-quality, low-cost cannabis to service both the international and domestic medical markets as well as the emerging Canadian adult consumer use market.
Aurora remains committed to servicing the medical needs of its expanding base of registered patients gained through the combination of Aurora, CanniMed & MedReleaf. The additional production capacity coming online within the next 12-18 months will ensure Aurora can continue to meet the demand of its patients while capitalizing on the significant opportunities ahead in the domestic and global cannabis industry.
1 Grams of Dried Flower Equivalents Produced and Sold is a pro forma figure; and includes contributions of CanniMed and MedReleaf.2 Registered Medical Patients is a pro-forma figure; and includes patients gained through the acquisition of CanniMed and MedReleaf.
The Global Leader in Medical Cannabis Production and Patient Counselling Support Services
0
10,000
20,000
30,000
40,000
50,000
60,000
70,000
0
1,000,000
2,000,000
3,000,000
4,000,000
5,000,000
6,000,000
SEP-16
DEC
-16
MA
R-17
JUN
-17
SEP-17
DEC
-17
MA
R-18
JUN
-18
Produced Sold Patients
Gra
ms
of D
ried
Flo
wer
Equ
ival
ents
1
Reg
iste
red
Med
ical
Pat
ient
s2

AURORA MOUNTAIN
AURORA SKY
CANNIMEDAURORA SUN
MEDRELEAF MARKHAMMEDRELEAF BRADFORDMEDRELEAF EXETER
AURORA EAU AURORA VIE
Aurora Cannabis Inc. 2018 Annual Report 5
1 Cash Cost to Produce and Cash Cost to Sell are non-IFRS measures and are not a recognized, defined or a standardized measure under IFRS. These measures as well as other non-IFRS financial measures reported by Aurora are in the “Non-IFRS Measures” section of the Financial Review.
DENMARK
CASH COST TO PRODUCE1 CASH COST TO SELL1
11%11%
$1.91Q4 2017
$2.09Q4 2017
$1.70Q4 2018
$1.87Q4 2018
>500,000 kg/yearFUNDED PRODUCTION CAPACITY
Industry Leading Production Capacity Providing Significant Scale and Long Term Cost Savings
CANADA
AURORA NORDIC

6 Aurora Cannabis Inc. 2018 Annual Report
Embracing International Opportunities Through a Rapidly Expanding Global Footprint
SPAIN2CANADA
CAYMAN ISLANDS
COLUMBIA
BRAZIL
URUGUAY2
MEXICO
6 Aurora Cannabis Inc. 2018 Annual Report
Sales and operations across five continents

Aurora Cannabis Inc. 2018 Annual Report 7
1 Aurora Nordic will focus on the cultivation and sales of cannabis in Denmark, Sweden, Norway, Finland and Iceland through Aurora’s wholly-owned subsidiary, Aurora Deutschland GmbH.
2 Through the planned acquisition of ICC Labs, Aurora gains entry to Uruguay and Spain.
DENMARK1
ITALY
ISRAEL
SPAIN2
AUSTRALIA
GERMANY
SOUTH AFRICA
LITHUANIA
MALTA
AURORA SUNMedicine Hat, AlbertaSCHEDULED FOR COMPLETION IN 2020

8 Aurora Cannabis Inc. 2018 Annual Report
AURORA SKYEdmonton, Alberta
800,000 square feet, 100,000+ kg/ year cultivation capacity
World’s most technologically advanced cannabis facility
Closed system with complete environmental control
Unprecedented automation delivering optimized yields, plant health and product
8 Aurora Cannabis Inc. 2018 Annual Report
Sustainable production costs well below $1.00 per gram

Aurora Cannabis Inc. 2018 Annual Report 9
Unrivaled Pace of Execution: 15 acquisitions and 12 strategic investments completed or in progress to date
Aurora continues to pursue an aggressive and targeted growth strategy, aided by an unwavering commitment to maintain its rapid pace of execution. The completion of these transactions has created Canada’s premier cannabis company with a fully-aligned strategic vision and production philosophy, as well as complementary assets, distribution networks, products, and capabilities.
Today, Aurora is vertically integrated and horizontally diversified across every key segment of the cannabis value chain, from facility engineering and design to cannabis breeding, genetics research, production, derivatives, high value-add product development, home cultivation, wholesale and retail distribution.
JUNE 2017 SEPT 2017 SEPT 2018DEC 2017 MAR 2017 JUNE 2018

10 Aurora Cannabis Inc. 2018 Annual Report
Fiscal 2018 was a year of tremendous progress in
which Aurora continued to execute consistently on
its high-paced expansion strategy. We have worked
tirelessly and with clear focus towards establishing a
company that meets what we believe are the critical
success factors in becoming a scale and margin
leader in the cannabis industry. We believe we are
exceptionally well positioned to capitalize on the
enormous opportunity presented by the domestic
and international cannabis markets.
To further demonstrate our successful execution,
this time last year, we had one fully-licensed
operational facility, two facilities under construction,
a funded capacity of 108,500 kg of cannabis per
year, and were active in three countries. Presently,
we have seven facilities licensed for production
and five sales licenses. We are on target to have 11
facilities with a combined funded capacity in excess
of 500,000 kg of cannabis per year. We expanded
internationally with operations, investments and/or
sales on six continents. We have a rapidly growing
and well diversified portfolio of high-quality value
add products; as well as a robust product pipeline,
multiple medical and recreational brands, and an
industry leading science and innovation team.
We have grown significantly from a human resource
perspective organically by recruiting at a rapid pace
and through several transformational acquisitions. At
this time last year, we employed 300 people; and are
now exceeding 1,400.
While continuing to rapidly grow organically, mergers
and acquisitions are a core element of our strategy
that has enabled us to grow from a company that
was over 18 months behind our competitors from
obtaining our first sales license, to now being an
industry leader. We have completed 20 transactions
in the past two years starting with the acquisition of
CanvasRx, the country’s leading patient counselling
and physician education outreach organization,
through to our most recent major acquisitions of
CanniMed, MedReleaf and Anandia Labs, three key
players in the international cannabis sector.
We recognized at an early stage that effectively
integrating acquisitions would be key to our success;
and, as a result, integration is now one of our core
competencies. As a measure of our effectiveness,
the integration of CanniMed was completed within
the targeted 90 days; and, we have now started to
accelerate its patient registration, improve cultivation
techniques to increase yield, grow revenue, and
further product development and international
expansion. This same focus on execution is now being
applied to the integrations of both MedReleaf and
Anandia; creating a seamlessly vertically integrated
cannabis company. These transactions enable us
to capture margin throughout the value chain, with
an unparalleled ability to access new and restrictive
markets with a growing portfolio of innovative high-
margin products and services.
While scale is important, we believe that scale
transforms into sustainable leadership only when
combined with the ability to consistently produce the
highest quality products at very low production costs.
To this end, we are developing what we call Sky Class
facilities, named after Aurora Sky, the world’s most
technologically advanced cannabis production facility
to date. These facilities are best described as massive
scale, indoor facilities with a specialty glass roof.
The closed system nature of the facilities enables
full control of all environmental variables, ensuring
consistently high product quality, while a high degree
of automation and other yield optimizing technologies
deliver substantial economies of scale. To illustrate
this point, at Aurora Mountain, Canada’s first purpose
built indoor facility, produces some 4,800 kg per year
of cannabis, requiring approximately 125 people.
Aurora Sky, once up to full capacity, will produce
some 100,000 kg per year of high quality cannabis,
using only approximately 380 people to do so. As a
result, we anticipate that our Sky Class facilities will
have production costs of well below $1 per gram.
Aurora Sky is now nearly fully operational, and we
are ramping up to full capacity, anticipating that the
facility will produce more than 8,000 kg each month
by the beginning of 2019. In addition, we are in the
Dear fellow shareholders,

Aurora Cannabis Inc. 2018 Annual Report 11
process of developing two further Sky Class facilities,
Aurora Sun and Aurora Nordic, with a combined
anticipated production capacity of around 270,000
kg per year. With a sales license for Aurora Vie, the
addition of the CanniMed and the two MedReleaf
facilities, and with plants in Aurora Nordic Phase I, we
are dramatically increasing production and therefore
our revenue generating potential while realizing
economies of scale.
We have developed our key distribution channels
with multiple agreements to supply Provincial
buyers upon the commencement of adult consumer
use on October 17, 2018. We will supply Canada’s
largest pharmacy chains, such as Shoppers Drug
Mart and Pharmasave, which are anticipated to
become important sales channels in the Canadian
cannabis markets.
We have also invested in Alcanna, Canada’s largest
alcohol retailer, to establish a large network of
cannabis retail stores. Alcanna is well positioned to
open the maximum allowed number of 37 stores in
Alberta in year one of adult-use; and, is planning
to open additional stores throughout the country in
provinces where private retail will be permitted.
Beyond our borders, the international medical
opportunity promises to be huge. With external
analysts estimating the global medical market
to grow to approximately 10 million kg per year,
dwarfing the currently announced funded capacity
of the entire cannabis industry. We recognized the
potential of the international markets early; and
have made great progress in leveraging our first
mover advantage by entering a large and growing
number of international markets. We are the
European Union’s (EU) largest distributor of medical
cannabis providing access to restrictive markets
which generally require EU Good Manufacturing
Practices (GMP) certified facilities. We own three of
the world’s seven designated facilities. We are now
active in six continents; and, are actively targeting
additional markets.
We have a strong focus on increasing margins while
at the same time offering competitively priced
products. This strategic objective is spearheaded
by the industry’s most experienced science, and
research and development team resulting in an
expanding portfolio of products, such as topicals,
capsules, gel caps, soft gels, pre-rolls. We are
developing a robust pipeline of marketable IP, novel
drug delivery technologies and additional form
factors. The combination of the teams at Aurora,
CanniMed, MedReleaf and Anandia creates not just
the world leading cannabis science team, it creates
capabilities throughout the value chain, enabling us to
accelerate development of the company and support
our goal of becoming the margin leader.
Today, Aurora is vertically integrated and horizontally
diversified across every key segment of the cannabis
value chain, from facility engineering and design, to
cannabis breeding, genetics research, production,
derivatives, high value-add product development,
home cultivation, wholesale and retail distribution.
We are focused on all the critical success factors
that we believe will make Aurora the pre-eminent
cannabis company globally.
We have also made a number of strategic
investments, which have generated both
competitive advantages and substantial value for
our shareholders. Our portfolio includes The Green
Organic Dutchman, Cann Group Limited, Alcanna,
Radient Technologies, Choom Holdings, Micron
Waste, Wagner Dimas, Evio, CTT Pharmaceuticals
and Capcium. In fact, our total unrealized gain
on investment in public companies approaches
$360 million as at June 30, 2018.
Looking to 2019, we will continue to execute on
our aggressive growth strategy supported by the
incredible dedication and hard work of our people.
Through them, Aurora’s standards continue to set
the industry benchmarks for execution; and I look
forward to sharing new and exciting developments
with you as we reach new milestones on our journey.
On behalf of the Aurora team, I want to thank you for
your ongoing support.
“Signed”
Terry Booth, CEO
VERTICA
LLY INTEG
RATED
HORIZONTALLY DIVERSIFIED

12 Aurora Cannabis Inc. 2018 Annual Report12 Aurora Cannabis Inc. 2018 Annual Report
Aurora intends to be a leader in the domestic adult consumer use market as well as the domestic and international medical cannabis space, both in terms of scale and profitability. To achieve this, the Company has identified a number of factors it deems critical in driving its strategy.
Consequently, Aurora has been executing on an aggressive growth strategy that is focused on developing a vertically integrated company with a diversified portfolio offering.
This dynamic growth strategy focuses on the following areas to ultimately better enable Aurora to capture greater margin across the entire cannabis industry value chain:
Meeting the Critical Success Factors: Capturing Margin Throughout the Cannabis Value Chain
SCALEDevelop large scale, highly efficient production capacity in diverse geographic markets to serve the global demand for medical cannabis.
INNOVATIONDevelop, adopt and acquire innovations across the entire cannabis industry value chain to deliver efficiencies and cre-ate competitive advantages.
SCIENCEDevelop and acquire mar-ketable intellectual property while strengthening our global medical brand and generating increased visibility
BRANDSCreate unique brands and customer experiences that resonate both with the medical community and the adult consumer use market to help capture market share.
DIVERSIFICATIONDevelop a broad portfolio of high value-add products to deliver higher margins.
COST OF PRODUCTIONAdopt a purpose-built, high-technology, automated, yield optimized facility model that is replicable across the Company’s different markets, ensuring consistently high- quality cannabis products, produced at low costs.
DISTRIBUTIONDevelop strong domestic and international distribution part-ners and networks to ensure a broad market reach
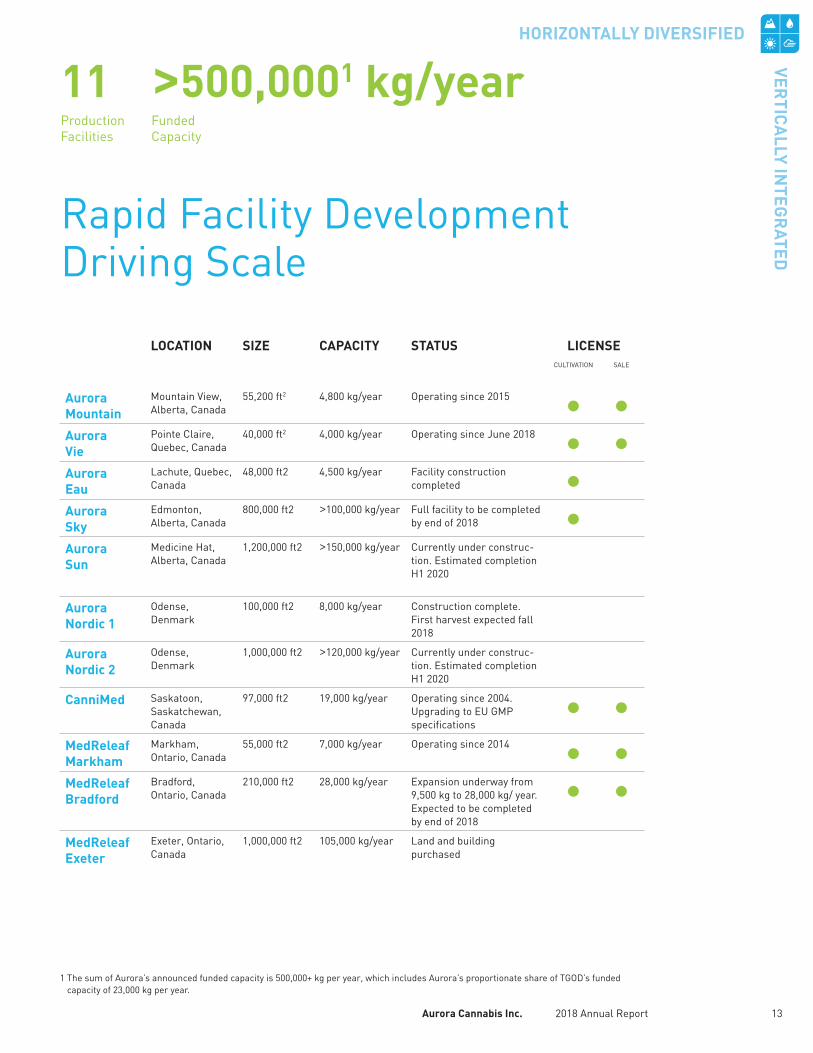
Aurora Cannabis Inc. 2018 Annual Report 13
Rapid Facility Development Driving Scale
LOCATION SIZE CAPACITY STATUS LICENSECULTIVATION SALE
Aurora Mountain
Mountain View, Alberta, Canada
55,200 ft2 4,800 kg/year Operating since 2015 • •Aurora Vie
Pointe Claire, Quebec, Canada
40,000 ft2 4,000 kg/year Operating since June 2018 • •Aurora Eau
Lachute, Quebec, Canada
48,000 ft2 4,500 kg/year Facility construction completed •
Aurora Sky
Edmonton, Alberta, Canada
800,000 ft2 >100,000 kg/year Full facility to be completed by end of 2018 •
Aurora Sun
Medicine Hat, Alberta, Canada
1,200,000 ft2 >150,000 kg/year Currently under construc-tion. Estimated completion H1 2020
Aurora Nordic 1
Odense, Denmark
100,000 ft2 8,000 kg/year Construction complete. First harvest expected fall 2018
Aurora Nordic 2
Odense, Denmark
1,000,000 ft2 >120,000 kg/year Currently under construc-tion. Estimated completion H1 2020
CanniMed Saskatoon, Saskatchewan, Canada
97,000 ft2 19,000 kg/year Operating since 2004. Upgrading to EU GMP specifications
• •MedReleaf Markham
Markham, Ontario, Canada
55,000 ft2 7,000 kg/year Operating since 2014 • •MedReleaf Bradford
Bradford, Ontario, Canada
210,000 ft2 28,000 kg/year Expansion underway from 9,500 kg to 28,000 kg/ year. Expected to be completed by end of 2018
• •MedReleaf Exeter
Exeter, Ontario, Canada
1,000,000 ft2 105,000 kg/year Land and building purchased
11Production Facilities
>500,0001 kg/yearFunded Capacity
1 The sum of Aurora’s announced funded capacity is 500,000+ kg per year, which includes Aurora’s proportionate share of TGOD’s funded capacity of 23,000 kg per year.
VERTICA
LLY INTEG
RATED
HORIZONTALLY DIVERSIFIED

14 Aurora Cannabis Inc. 2018 Annual Report
Aurora’s “Sky Class” facilities incorporate the latest technolog-ical advances including precision environmental controls and a high degree of automation. Coupled with large scale facilities and low labour requirements allows Aurora to reliably produce the lowest-cost, highest quality cannabis in the industry.
• Mobile bench system and automated plant movement
• Harvest to dry provides small-batch quality with mass scale throughput
• Custom process flow supports efficient production under strict GMP/GPP
• Forced air with MERV 14 filtration
• Design supports unsurpassed light availability and penetration
• Best-in-class uniform climate control & specialized irrigation system
• Fully integrated computer control and monitoring
Driving Down the Per Gram Costs of Production
14 Aurora Cannabis Inc. 2018 Annual Report

Management’s Discussion & Analysis 15
CanvasRx, a wholly owned subsidiary of Aurora, is Canada’s trusted resource and marketplace, enabling you to develop a better understanding of medical marijuana and its various strains and uses, as well as information on licensed producers in Canada. With 28 facilities in operation nationwide, CanvasRx is a leading Canadian network of cannabis counseling and outreach centres. To date CanvasRx has assisted over 42,200 patients. Over 9,500 medical doctors across Canada have referred patients to CanvasRx and its affiliated medical clinics.
Diverse and Expansive Domestic Medical Distribution Networks
Aurora has entered into agreements to collaborate with PharmaChoice, Pharmasave and Shoppers Drug Mart on the distribution, sale and marketing of medical cannabis products through their respective networks of pharmacies, subject to Health Canada approval.
This collaboration will see Aurora produce and deliver accredited pharmacy education programs to Canadian pharmacists and eventually distribute medical cannabis through pharmacists across Canada.
VERTICA
LLY INTEG
RATED
HORIZONTALLY DIVERSIFIED

16 Aurora Cannabis Inc. 2018 Annual Report
International Distribution
Aurora continues to execute on its international expansion strategy and is currently active in 9 countries outside of Canada. Through a combination of strategic investments, domestic production, and supply agreements, Aurora has amassed a strong early mover advantage in a growing number of key international markets.
With the EU GMP certification of Aurora Mountain, MedReleaf Markham and Pedanios GmbH, Aurora is one of only a handful of companies globally with this pharma-grade designation across both production and distribution facilities in Canada and Germany respectively, allowing it to sell into the most restrictive and promising markets in the EU, such as Italy.
Reflecting the importance of the European market, Aurora has established a pan-European company, Aurora Europe GmbH, headquartered in Berlin, Germany. Furthermore, the Company has incorporated a number of local subsidiaries, an important step towards becoming part of the cannabis infrastructure in each of these countries.
Pedanios GmbH, Europe’s largest distributor of cannabis, will henceforth operate as Aurora Deutschland GmbH, while the Company has also formed Aurora Italia, Aurora Malta and Aurora Denmark, as well as a number of other, local companies. Aurora currently employs over 70 people in Europe and anticipates this number to grow substantially over the coming quarters as the Company expands its business activities across the continent.
ACTIVE INTERNATIONAL MEDICAL MARKETS:
AUSTRALIA BRAZIL CAYMAN ISLANDS
COLUMBIA DENMARK GERMANY
ITALY MALTA SOUTH AFRICA
16 Aurora Cannabis Inc. 2018 Annual Report
EUROPE
DENMARK DEUTSCHLAND
MALTA ITALIA

Aurora Cannabis Inc. 2018 Annual Report 17
TAILORED CONSUMER RETAIL EXPERIENCES
Aurora and Alcanna have created a unique and engaging, state-of-the-art consumer retail concept that aims to deliver an inviting, inclusive, and educational experience. The stores will feature a variety of brands, including Aurora, MedReleaf and CanniMed as well as a selection of products from other Canadian Licensed Producers. As permitted, Alcanna intends to open additional retail stores across Canada. In Alberta, Alcanna anticipates opening 37 stores, starting October 17, 2018.
• Alcanna will build, own and operate the new cannabis stores, leveraging its experience and expertise as a responsible retailer of controlled substances.
• Alcanna is currently converting several of its existing liquor stores into cannabis retail outlets and will work with commercial landlords to secure a multitude of locations where permitted.
• Alcanna will retain Aurora through CanvasRx, CanniMed and MedReleaf, which have deep experience working with cannabis users, and unparalleled data regarding efficacy and customer experience to assist in training its in-store associates known as Category Specialists.
Adult Consumer-Use Market Distribution Platforms
BRITISH COLUMBIA
NORTHWEST TERRITORIES
YUKON
SASKATCHEWANMANITOBA
PEI
NEWFOUNDLAND
NOVA SCOTIA
NEW BRUNSWICK
ALBERTA
ONTARIOQUÉBEC
Aurora has completed and is in the process of completing agreements with provincial regulators to supply cannabis for the entire Canadian adult consumer market, once legalized. Under the terms of these current and prospective agreements, Aurora will supply the provinces with a wide variety of premium product from its facilities. Supply quantities will be determined based on demand on an ongoing basis.
VERTICA
LLY INTEG
RATED
HORIZONTALLY DIVERSIFIED

18 Aurora Cannabis Inc. 2018 Annual Report
CORE RESEARCH THEMES
INNOVATION & DIVERSIFICATION THROUGH HIGH VALUE PRODUCTS & PARTNERSHIPS
Our Objective: Developing marketable IP and high margin products, while enhancing cultivation efficiencies
Industry Leading Science & Research Teams
Launched Aurora Frost
Introduced hard and soft shell capsules
Developed Innovative cream based topical products
Launched new oil types
Developing exciting beverage and edible products in advance of future legislation
ANALYTICAL SCIENCE
Cannabinoid and terpene profiling, isolation & purification
DISCOVERY SCIENCE
Pre-clinical studiesCannabinoid application
CLINICAL SCIENCE
Health outcomes, economic impact, targeted indications and clinical trials
PLANT SCIENCE
Anandia + growth experiments, plant health, extraction
18 Aurora Cannabis Inc. 2018 Annual Report
+++
01
03
02
04
Processing technology (extraction)
Product diversification, source of low-cost CBD
Novel drug delivery (sublingual)
Softgel production technology
hydroponic home grow systems and supplies
Patented pre-roll technology

Aurora Cannabis Inc. 2018 Annual Report 19
Aurora has secured a broadly diversified portfolio of three recognizable and well- established cannabis brands, including Aurora, CanniMed and MedReleaf, and consumer and wellness brands, such as San Rafael ‘71, Woodstock and AltaVie.
These brands are backed by award-winning products, detailed consumer and marketplace insights and advanced analytical frameworks.
Strong Medical & Adult Consumer Use Brands
DATA DRIVEN DEVELOPMENT • EXPERT GUIDED EXECUTION
VERTICA
LLY INTEG
RATED
HORIZONTALLY DIVERSIFIED

20 Aurora Cannabis Inc. 2018 Annual Report20 Aurora Cannabis Inc. 2018 Annual Report
Building a Global Leader with Expertise Across the Entire Cannabis Value Chain
Today, Aurora is exceptionally well positioned, through its diverse acquisitions and strategic initiatives completed to date, to capitalize on the enormous opportunity across the entire cannabis industry value chain in both domestic and international markets.
ACQUISITIONS
STRATEGIC INVESTMENTS
OCT 2017
OCT 2017
DEC 2017
DEC 2017
MAR 2018
JULY 2018
AUG 2016
JUNE 2018
AUG 2018
MAY 2017 MAR 2017
DEC 2016
JUNE 2018
JUNE 2017 SEP 2017
JAN 2018
JAN 2018 JUNE 2018 JULY 2018
MAY 2018 FEB 2018
MAR 2017
01BUILDING
05CONSUMER
ENGAGEMENT & BRANDS
04DISTRIBUTION
03PLANT SCIENCE &
PRODUCT R&D
02CULTIVATION &
EXTRACTION
SEP 2018 SEP 2018

Management’s Discussion & Analysis 21
Table Of Contents
Non-IFRS Financial Measures 22
About Aurora 23
Financial Results 24
Key Developments During the Fourth Quarter 2018 26
Key Developments Subsequent to June 30, 2018 28
Financial Review 33
Liquidity and Capital Resources 38
Transactions with Related Parties 41
Critical Accounting Estimates 41
New Accounting Pronouncements 44
Financial Instruments and Other Instruments 45
Financial Instruments Risk 47
Summary of Outstanding Share Data 49
Risk Factors 49
Internal Controls Over Financial Reporting 59
Forward-Looking Statements 60
MANAGEMENT’S DISCUSSION AND ANALYSIS

This Management’s Discussion and Analysis (“MD&A”) reports on the consolidated financial condition and operating results of Aurora Cannabis Inc. (the “Company” or “Aurora”) for the three and twelve-month periods ended June 30, 2018 and has been prepared pursuant to the MD&A disclosure requirements under National Instrument 51-102 - Continuous Disclosure Obligations (“NI 51-102”) of the Canadian Securities Administrators. The Company’s continuous disclosure documents, including Annual Information Form, are available on SEDAR at www.sedar.com.
The MD&A should be read in conjunction with the Company’s audited Consolidated Financial Statements for the year ended June 30, 2018 and notes thereto (the “Financial Statements”) which have been prepared in accordance with International Financial Reporting Standards (“IFRS”).
The Financial Statements include the accounts of the Company and its wholly-owned subsidiaries, Aurora Cannabis Enterprises Inc. (“ACE”), Aurora Deutschland GmbH (“Aurora Deutschland”), CanniMed Therapeutics Inc. (“CanniMed”), Aurora Larssen Projects Ltd. (“ALPS”), CanvasRX Inc. (“CanvasRX”), Peloton Pharmaceuticals Inc. (“Peloton” or “Aurora Vie”), H2 Biopharma Inc. (“H2” or “Aurora Eau”), B.C. Northern Lights Enterprises Ltd. (“BCNL”), Urban Cultivator Inc. (“UCI”), and Hempco Food and Fiber Inc. (“Hempco”). All significant intercompany balances and transactions have been eliminated on consolidation.
The Company has reclassified certain immaterial items on the comparative consolidated statement of comprehensive loss to conform with current period’s presentation and improve clarity.
All dollar amounts referred to in this MD&A are expressed in thousands of Canadian dollars, except for share and per share amounts, and where otherwise indicated.
This MD&A has been prepared as of September 24, 2018.
NON-IFRS FINANCIAL MEASURES The Financial Review contains certain financial performance measures that are not defined by IFRS, and are used by management to assess the financial and operational performance of the Company. These include, but are not limited to, the following:
• Cash cost of sales per gram of dried cannabis sold • Cash cost to produce per gram of dried cannabis sold• Gross profit on medical cannabis before fair value adjustments• Gross margin on medical cannabis before fair value adjustments
The Company believes that these non-IFRS financial measures, in addition to conventional measures prepared in accordance with IFRS, enable investors to evaluate the Company’s operating results, underlying performance and prospects in a manner similar to Aurora’s management. These non-IFRS financial performance measures are defined in the following sections.
As there are no standardized methods of calculating these non-IFRS measures, the Company’s approaches may differ from those used by others, and accordingly, the use of these measures may not be directly comparable. Accordingly, these non-IFRS measures are intended to provide additional information and should not be considered in isolation or as a substitute for measures of performance prepared in accordance with IFRS.
22 Aurora Cannabis Inc. 2018 Annual Report

ABOUT AURORAAurora Cannabis Inc. (the “Company” or “Aurora”) was incorporated under the Business Corporations Act (British Columbia) on December 21, 2006. The Company’s shares are listed on the Toronto Stock Exchange (“TSX” or the “Exchange”) under the symbol “ACB” and on the OTCQX under the symbol “ACBFF”.
The Company’s principal business is the production and distribution of medical cannabis in Canada and internationally. The Company produces and distributes dried medical cannabis and cannabis oils in Canada pursuant to the Access to Cannabis for Medical Purposes Regulations (“ACMPR”) and through its wholly-owned subsidiary, Aurora Cannabis Enterprises Inc. (“ACE”), distributes whole-sale medical cannabis in the European Union pursuant to the German Medicinal Products Act and German Narcotic Drugs Act, and in Italy through the January 2018 tender process.
Aurora does not engage in any U.S. cannabis-related activities as defined in Canadian Securities Administrators Staff Notice 51-352. While the Company has held an interest in Australis Holdings LLP (“Australis Holdings” or “AHL”), a U.S. based company, as at June 30, 2018, AHL has not engaged in any cannabis-related activities for the periods ended. Additionally, AHL was spun-out to Aurora shareholders subsequent to June 30, 2018.
Aurora is one of the world`s largest and fastest growing cannabis companies and has created a growing constellation of subsidiaries and strategic partnerships that provide differentiation in terms of geographic reach, production, technology, product offering, and execution.
With a growing number of countries adopting medical cannabis legislation, the Company has embarked on an aggressive international expansion strategy that currently sees Aurora with opera-tions and investments in Germany, Denmark, Italy, Australia, Cayman Islands, Malta, Lithuania, and South Africa.
Management’s Discussion & Analysis 23

FINANCIAL RESULTS Summarized Key Quarterly Results
2018(in thousands except as otherwise noted) Q4 Q3 Q2 Q1 TotalFinancial ResultsRevenue $ 19,147 $ 16,100 $ 11,700 $ 8,249 $ 55,196 Gross margin on medical cannabis (1) 74% 59% 63% 58% 65%Earnings (loss) 79,268 (20,795) 7,194 3,560 69,227 Balance SheetCannabis inventory and biological assets 41,031 29,162 17,325 16,846 41,031 Total assets 1,910,716 1,671,400 732,394 347,834 1,910,716 Operational Results - Medical CannabisCash cost of sales per gram of dried cannabis sold (2) $ 1.87 $ 1.80 $ 1.74 $ 2.16 n/a Cash cost to produce per gram of dried cannabis sold (2) $ 1.70 $ 1.53 $ 1.41 $ 1.87 n/a Active registered patients 43,308 45,776 21,718 19,280 n/a Average net selling price of dried cannabis (3) $ 8.02 $ 7.30 $ 7.86 $ 7.32 $ 7.65 Average net selling price of cannabis oil (3) $ 13.52 $ 12.83 $ 13.35 $ 16.41 $ 13.68 Kilograms produced 2,212 1,206 1,204 1,010 5,632 Kilograms sold 1,617 1,353 1,162 890 5,022
(1) Represents the gross margin on medical cannabis before fair value adjustments.
(2) Represents the cash cost of sales per gram of dried cannabis and cash cost to produce per gram of dried cannabis sold for dried cannabis produced by Aurora.
(3) Represents the net average selling price per gram of dried cannabis or per gram of dried cannabis equivalent.
(in thousands except as otherwise noted) Q4 2018 Q3 2018Medical cannabis segment revenueCanadian dried cannabis $ 7,529 $ 6,304 Canadian cannabis oils 4,710 2,178 European dried cannabis 2,641 2,331 Medical cannabis revenue 14,880 10,813 Patient counselling services 1,553 591 Design, engineering and construction services 1,239 2,979 Other 85 97 Total medical cannabis segment revenue 17,757 14,480 Other segment revenues 1,390 1,620 Total revenue $ 19,147 $ 16,100
The Company’s financial results for the fourth quarter continued to show strong growth in medical dried cannabis and cannabis oil sales. Compared to the prior quarter, medical cannabis revenue increased by 38%, while at the same time allowing for a significant increase in inventory. Cannabis inventory and biological assets increased 41% from the prior quarter in preparation for the com-mencement of the Canadian adult-use market on October 17, 2018.
Compared to Q4 2017, total revenue increased by 223%, primarily due to an increase in the number of active registered patients, increased product availability and the consolidation of the results of acquisitions.
Aurora experienced a strong increase in margins mostly due to a continuing shift of dried cannabis sales to cannabis oils for Aurora products, and the consolidation of CanniMed revenues, which also had a strong oil component. Compared to the prior quarter, sales of oil products as a percentage of medical cannabis revenue increased from 20% to 32%. A planned reduction in new patient promotional discounts also contributed to improved margins in the quarter.
Aurora’s Mountain facility continued to produce high quality cannabis at optimal levels. However, with additional production from new facilities just coming online, the Company chose to constrain international sales to properly serve the Canadian medical market, while also building inventory in
24 Aurora Cannabis Inc. 2018 Annual Report

anticipation of the legalization of the Canadian adult-use market. With Aurora Vie, Sky, and MedReleaf facilities now operational, and with CanniMed yield improvements, this was a short-term constraint.
Cash cost of sales per gram of dried cannabis sold and cash cost to produce per gram of dried cannabis sold increased by $0.07 and $0.17 respectively from the prior quarter, mainly due to the inclusion of CanniMed’s higher per unit production costs, partially offset by lower utility costs in the summer months. The Company has continued to drive yield and efficiency improvements at CanniMed and is now realizing significant rewards.
Production costs per gram are expected to decrease significantly once Aurora Sky is fully opera-tional and the efficiencies from automation, scale and yield expertise are also realized in the CanniMed facilities and other newly acquired Aurora facilities. Management expects that cash costs to produce a gram of cannabis at a Sky Class facility will be well below $1.00 per gram.
During the fourth quarter of 2018, Aurora continued to ramp up investments in infrastructure and talent required to realize the tremendous opportunities in the Canadian and international medical cannabis markets, and the upcoming Canadian adult-use market. Across the company, headcount increased from 300 at June 30, 2018 to over 1,400 currently.
General and administration costs increased primarily due to professional fees related to the signifi-cant volume of strategic corporate transactions, compliance, and other general corporate matters; travel costs resulting from increased market development and integration activities; and higher wages and benefits from additional headcount to support the Company’s growth and strategic objectives. The inclusion of CanniMed’s general and administrative cost accounted for 25% of the increase overall.
Sales and marketing costs also increased compared to the third quarter of fiscal 2018. The increase was primarily due to significant investment in the Company’s overall brand building initiatives, including consumer education and engagement activities in preparation for the impending adult-use market in Canada. The inclusion of CanniMed’s sales and marketing cost accounted for 19% of the increase overall.
The Company continued to invest heavily in production facilities and strategic assets. Aurora is building a diversified and vertically integrated company that can realize the tremendous opportunity of the global cannabis markets.
In June 2017, Aurora estimated the cost of construction of the Sky facility to be approximately $120 million. Because this was the first time these advanced technologies had been brought together in one agricultural production facility, the Company and its advisors took a “Design-Build” approach to the project. As Aurora moved through the construction phases of the facility, design changes and improvements were made as additional information became available. During the project, the Company implemented several improvements and enhancements to the technologies, workflow, and size of this world class facility. As the project nears full completion, the Company expects that the total budget for construction and equipment will be approximately $150 million. At full scale production of at least 100,000 kgs per year, and assuming average pricing and margins on sales to provinces, the Company expects a full payback on this project in a very short number of months. The Company anticipates that future Sky Class facilities, Aurora Sun and Aurora Nordic, will have a lower per square foot cost than Aurora Sky due to refined engineering requirements, project workflow enhancements, and a reduced need for certain corporate and infrastructure facilities to be incorporated into the design of these facilities.
During fiscal 2018, Aurora made a number of investments in publicly traded companies that provide a significant strategic advantage for the company. These companies include TGOD, Radient,
Management’s Discussion & Analysis 25

Alcanna, and Cann Group, as well as a number of others. The Company reflects these invest-ments in its IFRS financial statements as either Marketable Securities, Derivatives, Investments in Associates and/or Joint Ventures. However, under IFRS, these are not necessarily all reflected at current market value. For the publicly traded companies that Aurora has invested in, the market value of the shares, and “in-the-money” warrants and options at June 30, 2018 was $697.6 million.
KEY DEVELOPMENTS DURING THE FOURTH QUARTER 2018Strategic Investments
(a) Strategic Investment in Hempco Food and Fiber Inc. (“Hempco”)
On May 7, 2018, Aurora exercised its right under a private option agreement to purchase an aggregate of 10,754,942 additional common shares of Hempco, increasing its ownership interest to 52.3%. This investment secures Aurora access to low-cost raw material for the potential production of CBD extracts.
(b) Strategic Investment in CTT Pharmaceuticals Inc. (“CTT”)
On May 20, 2018, the Company acquired an initial 9.14% ownership interest in CTT. The Company also holds 20,779,972 warrants in CTT, enabling Aurora to increase its ownership to 42.5%. CTT is developing a fast dissolving, oral thin film wafer that will provide a dose specific, smoke-free delivery of medical cannabis or other active ingredients. This investment will provide the Company with global exclusivity to develop, manufacture and market CTT’s novel oral wafers.
(c) Strategic Investments in Choom Holdings Inc. (“Choom”)
On June 12, 2018, the Company subscribed to 9,859,155 common shares of Choom, representing an 8% ownership interest. Subsequent to the initial investment, Choom acquired Specialty Medijuana Products Inc. This investment positions the Company to participate in the emerging craft cultivation market, as well as in an exciting Western Canada retail strategy with products that are anticipated to resonate strongly with the adult-use market.
(d) Strategic Investment in Capcium Inc. (“Capcium”)
On June 6, 2018, the Company acquired 8,828,662 common shares in Capcium, representing a 19.99% ownership interest. Capcium, an emerging leader in softgel manufacturing, has devel-oped expertise that is ready to be applied to the cannabis industry and deliver high-volume production capacity.
(e) Strategic Investment in The Green Organic Dutchman Holdings Ltd. (“TGOD”)
On May 2, 2018, the Company participated in the initial public officering of TGOD, purchasing 6,341,250 units at $3.65 per unit for a total investment of $23,146. This followed an earlier strategic investment in January 2018. As at June 30, 2018, the Company held a total of 39,674,584 common shares and 19,837,292 warrants, representing an ownership interest of 17% on an undiluted basis with options to increase ownership interest to 50%.
TGOD is currently completing a 14,000 kg per year facility in Ancaster, and constructing an 820,000 square foot, 104,000 kg per annum, high-technology cannabis facility in Valleyfield, Quebec. Aurora currently has rights to 20% of the production output from these two facilities.
(f) Spin-out of Australis Capital Inc. (“ACI”)
In June 2018, the Company began reorganizing for the spin-out of ACI and its United States (“U.S.”) assets, and filed a prospectus for the listing of ACI on the Canadian Stock Exchange (“CSE”). On June 13, 2018, the Company completed a series of intercorporate transactions resulting in Aurora holding a direct interest in 100% of the outstanding shares and warrants of ACI, and ACI holding all the U.S. assets of Aurora and its subsidiaries. The assets primarily
26 Aurora Cannabis Inc. 2018 Annual Report

consisted of the Company’s 50% joint venture interest in Australis Holdings, which was subse-quently increased to 100% for US$500, and rights to a number of SubTerra assets.
On June 14, 2018, the Company entered into a Funding Agreement pursuant to which Aurora advanced $500,000 to ACI, in consideration for which ACI provided Aurora with the Restricted Back-in Right, by issuing to Aurora:
(i) a warrant to purchase 20% of the issued and outstanding shares of ACI at an exercise price of $0.20 per share; and
(ii) a warrant to purchase 20% of the issued and outstanding shares of ACI at an exercise price equal to the five-day volume weighted average trading price of ACI’s shares on the CSE.
Aurora will be prohibited from exercising the Restricted Back-in Right unless all of ACI’s business operations in the U.S. are legal under federal and state laws, and Aurora has received the consent of the TSX and any other stock exchange on which Aurora may be listed.
Subsequent to June 30, 2018, the Company completed the spin-out of ACI and distributed to Aurora shareholders, as a return of capital, units of ACI on the basis of one unit for every thirty-four Aurora shares. Each unit consists of one unit share and one warrant exercisable at $0.25 per warrant for a period of one year.
Supply Agreements and Partnerships
(g) Supplier Agreement with Pharmasave
On April 4, 2018, CanniMed, a wholly owned subsidiary of Aurora, entered into a Letter of Intent with Pharmasave, one of Canada’s leading independent community pharmacy chains, to become a preferred supplier of medical cannabis. With more than 650 independently owned pharma-cies within the Pharmasave network, CanniMed and Aurora will supply and distribute medical cannabis across Canada through Pharmasave pharmacists.
(h) Supplier Agreement with Société des Alcools du Québec (“SAQ”)
On April 11, 2018, Aurora completed an agreement with SAQ to supply a minimum of 5,000 kg of cannabis per annum for the Quebec adult-use market, once legalized.
Aurora will supply SAQ with a wide variety of premium product from its facilities in Quebec, and elsewhere based on consumer demand. Supply quantities will be determined based on demand with no set maximum, and a minimum of 5,000 kg for the first year.
Acquisitions
(i) Acquisition of CanniMed Therapeutics Inc. (“CanniMed”)
On May 1, 2018, the Company completed the acquisition of CanniMed by acquiring the remaining 4.1% interest for $28,679, comprised of $1,746 cash and the issuance of 3,417,951 common shares with a fair value of $26,933. The CanniMed Shares were de-listed from the TSX as at the close of business on May 1, 2018.
The transaction creates strong strategic synergies, in particular for the domestic and interna-tional medical cannabis markets, in terms of distribution, product development, and branding. Integration of CanniMed into Aurora is complete and acceleration of CanniMed’s production and other operations has commenced.
Management’s Discussion & Analysis 27

International Developments
(j) Exporting to Italy
On April 13, 2018, Aurora completed the first ever successful delivery of privately exported medical cannabis from Canada to the Italian government through its wholly-owned German subsidiary Aurora Deutschland GmbH (“Aurora Deutschland,” formerly Pedanios GmbH).
This export followed Aurora and Aurora Deutschland’s success in winning a highly-competitive EU-wide public tender to supply medical cannabis to the Italian government through the Italian Ministry of Defense, who oversee medical cannabis production and distribution in Italy.
(k) Accelerating Growth and Market Penetration in Germany
On May 28, 2018, Aurora, through Aurora Deutschland, signed a collaboration agreement with Heinrich Klenk GmbH & Co. KG (“Klenk”), one of Europe’s largest medicinal plant companies. Klenk’s products are carried in over 25,000 pharmacies throughout Germany and Europe. Under the terms of the agreement, Aurora launched a new cannabis brand called “Cannabis Klenk” which is produced in Canada, imported by Aurora Deutschland, and sold to German pharmacies through Klenk’s existing and wide-reaching pharmaceutical wholesale distribution network.
(l) Market Penetration in Malta
On June 25, 2018, Aurora’s wholly owned German subsidiary Aurora Deutschland, became the first licensed supplier of medical cannabis to patients in Malta. The import license, issued by Malta Medicines Authority, was received on June 5, 2018, and Aurora Deutschland received their export license from German authorities on June 21, 2018, making Malta the third European Union member country where Aurora Deutschland currently sells medical cannabis.
Facility Development
(m) Aurora Sun
On April 16, 2018, Aurora acquired approximately 71 acres of land in Medicine Hat, Alberta, for the construction of “Aurora Sun”, a highly automated cannabis production facility with ultra-low operating costs and robust margins. The facility will be 1,200,000 square feet, 50% larger than Aurora Sky.
(n) Sales License for Aurora Vie
On June 29, 2018, eight months after receiving its cultivation license, the Aurora Vie production facility in Pointe-Claire, Quebec, was granted its Health Canada sales license. The facility, now in full commercial operation, is on target to produce at a rate of 4,000 kg per year by October 2018. Multiple harvests have been completed to date.
KEY DEVELOPMENTS SUBSEQUENT TO JUNE 30, 2018Strategic Investments
(a) Investment in Evio Beauty Group Ltd (“Evio Beauty”)
On July 10, 2018, the Company entered into a Product Development and Distribution Agreement with Evio Beauty, pursuant to which both companies have agreed to collaborate to develop and manufacture a line of at least 3 co-branded topical cosmetic products formulated with a can-nabinoid or cannabinoids. Aurora will earn a 10% royalty on sales of all non-infused products, and Evio Beauty will earn a 10% royalty on sales of all infused products in any geographical area in which Aurora operates.
(b) License Agreement with CannaRoyalty Corp. (“CannaRoyalty”)
On August 1, 2018, the Company and CannaRoyalty entered into an assignment and assumption agreement where CannaRoyalty assigned to Aurora all of its rights, title and interest in an exclusive license for a technology for creating machine-rolled cannabis developed by Wagner Dimas Inc.
28 Aurora Cannabis Inc. 2018 Annual Report

In consideration, Aurora paid to CannaRoyalty $7,000 through the issuance of 756,348 common shares at $9.255 per share. The Wagner technology has now been installed at Aurora, and the large-scale production of pre-rolled product has commenced in preparation to filling orders received from provincial buyers who will be supplying the adult consumer user market.
c) Spin-out of Australis Capital Inc. (“ACI”)
On September 19, 2018, the Company completed the spin-out of ACI, an independent company, and distributed to Aurora shareholders, as a return of capital, units of ACI on the basis of one unit for every 34 Aurora shares. The units commenced trading on the Canadian Stock Exchange on September 19, 2018. ACI is an investment company with a focus on the U.S. cannabis market, which is characterized by large fragmentation and limited access to capital. ACI’s management, board and advisory teams have deep experience and relationships within the cannabis industry, and believe they will be able to secure investments to build significant shareholder value.
Supply Agreements and Partnerships
(d) Supply Agreements
On July 5, 2018, Aurora entered into an agreement with the Alberta Gaming Liquor & Cannabis Commission (“AGLC”) to supply high-quality cannabis products for the adult-use market in Alberta. The AGLC is responsible for regulating private retail cannabis licensing, distribution of cannabis to retail stores, and operation of an online cannabis store for the Albertan market.
On August 21, 2018, Aurora and its wholly-owned subsidiary, MedReleaf, entered into supply agreements with Ontario Cannabis Stores, a key market in the Company’s adult-use strategy. When government-run online sales commence on October 17, Aurora and MedReleaf will supply a broad range of dried flower and higher margin products, such as pre-rolls, oils and capsules.
Acquisitions
(e) Completion of CanniMed Integration
The integration of CanniMed Therapeutics into Aurora was successfully completed as of July 6, 2018, combining Aurora’s execution and agility with CanniMed’s strong medical brand, assets and exceptionally experienced team of scientists and operational cannabis professionals.
Opportunities to increase Aurora’s and CanniMed’s international reach are also being pursued through CanniMed’s relationships in South Africa, the Cayman Islands, and Australia. CanniMed continues to ship oils to both of the latter jurisdictions.
(f) Acquisition of MedReleaf Corp. (“MedReleaf”)
On July 25, 2018, Aurora and MedReleaf closed the world’s largest cannabis industry transac-tion agreement whereby Aurora acquired all of the issued and outstanding common shares of MedReleaf. Completion of the transaction created a cannabis industry leader with a total funded capacity of more than 500,000 kg per year. With MedReleaf, Aurora has gained two facilities built to EU GMP specifications, which will increase product availability for international markets.
Under the terms of the Amended Arrangement Agreement dated May 23, 2018, holders of MedReleaf common shares received 3.575 common shares of Aurora and $0.000001 cash for each MedReleaf common share held. The Company issued an aggregate of 370,120,238 common shares with a fair value of $2,568,634 and 14,033,784 replacement stock options. The exercise price of the stock options is based on the exercise price per MedReleaf stock options adjusted for the Exchange Ratio.
Management’s Discussion & Analysis 29

(g) Acquisition of HotHouse Consulting Inc.
On August 7, 2018, Aurora entered into a Letter of Intent whereby it intends to acquire the cannabis business of HotHouse, a provider of advanced greenhouse consulting services with a focus on large scale cannabis production.
(h) Acquisition of Anandia Laboratories Inc. (“Anandia”)
On August 8, 2018, the Company acquired all of the issued and outstanding common shares of Anandia in exchange for 12,716,482 common shares and 6,358,210 share purchase warrants of Aurora. The warrants are exercisable at $9.3717 per share until August 9, 2023. Pursuant to the terms of the acquisition, upon the achievement of future milestones, Aurora will pay an additional $10,000 by way of the issuance of additional shares and warrants.
Anandia is a global leader in cannabis science (genetics, breeding) and analytical product testing. The transaction enables the Company to develop new strains with specific terpene/can-nabinoid profiles for targeted product applications, as well as strains with improved cultivation characteristics. Management believes these activities will lead to both the development of new, higher-margin products and a further increase in efficiency of its cultivation processes.
(i) Acquisition of ICC Labs Inc. (“ICC”)
On September 10, 2018, Aurora entered into a definitive agreement pursuant to which Aurora intends to acquire all of the issued and outstanding common shares of ICC (for $1.95 per share) payable in common shares of Aurora. The transaction reflects an aggregate purchase price of approximately $290 million.
The Transaction, once approved, creates a strong foundation for expansion and will leverage ICC’s first mover advantage in South America, bringing significant low-cost production capacity of both THC and CBD based products in both Uruguay and Colombia. ICC presently has over 70% market share in Uruguay, the first country in the world to legalize cannabis for adult use. In addition, ICC has extensive distribution channels throughout South America and internationally.
j) Acquisition of Agropro UAB (“Agropro”) and Borela UAB (“Borela”)
On September 10, 2018, the Company acquired 100% of the issued and outstanding shares of Europe’s largest producer, processor and supplier of certified organic hemp and hemp products, Agropro, as well as hemp processor and distributor Borela for total cash consideration of €6,418 of which €960 was paid through the issuance of 170,834 common shares. In addition, the Company paid a finder’s fee of €1,517, which was paid through the issuance of 270,024 common shares, and will also refinance Agropro’s existing debt totaling €2,076.
This acquisition is anticipated to yield significant quantities of CBD for extraction, and is expected to create further synergies through the Company’s CBD and hemp product value chain, which includes majority ownership of Hempco Food and Fiber.
International Developments
(k) Approval for Malta’s First Cannabis Cultivation Facility
On July 24, 2018, Aurora received a Letter of Intent issued from Maltese authorities, approving its application for the establishment of the first seed-to-pharma cannabis operation in Malta, subject to certain conditions.
The project includes the construction of a hybrid cultivation, manufacturing, and distribution facility, with operations to be carried out by a new subsidiary, Aurora Malta, to be formed with Aurora’s local Maltese partner, Cherubino Ltd., the largest pharmaceutical wholesaler in the country. Aurora will be the majority shareholder in the new venture. The Company anticipates the facility, to be
30 Aurora Cannabis Inc. 2018 Annual Report

designed by Aurora Larssen Projects, to be focused on the production of higher margin derivative products, aimed at serving the domestic Maltese and Southern European markets.
(l) Commenced Cultivation at Aurora Nordic
On August 13, 2018, Aurora completed the successful shipment of cultivars from its Mountain facility to Denmark to commence populating the Phase I Aurora Nordic facility, a 100,000 square foot, retrofitted hybrid greenhouse, which will be ramping up to full production capacity of 8,000 kg per year over the coming months. Aurora Nordic is a 51% Aurora owned subsidiary, owned in part-nership with Alfred Pederson & Son. Both the Phase I facility and Phase II, a 1,000,000 square foot, hybrid greenhouse facility with a capacity of more than 120,000 kg per year, have been designed by Aurora Larssen Projects Ltd. and will be completed to EU GMP standards.
(m) New EU GMP Certification
On August 13, 2018, Aurora’s wholly-owned subsidiary MedReleaf received full EU GMP certi-fication for its Markham facility. The certification of the Markham facility will increase product availability for the rapidly growing, higher-margin and heavily regulated EU market. All of the Company’s facilities are being designed and built to EU GMP standards.
(n) Establishing Aurora Europe
On August 13, 2018 Aurora established a pan-European company, Aurora Europe GmbH, head-quartered in Berlin, Germany. Pedanios GmbH, Europe’s largest distributor of cannabis, will henceforth operate as Aurora Deutschland GmbH, while the Company has also formed Aurora Italia, Aurora Nordic (Denmark), and a number of other local companies. Aurora currently employs over 70 people in Europe and anticipates this number to grow substantially over the coming months as the Company expands its business activities across the European continent.
o) MED Colombia
Through the acquisition of MedReleaf, the Company now owns MED Colombia, a licensed cannabis company in Colombia with substantial grow potential and a strong portfolio of genetics. Upon successful completion of the ICC acquisition, MED Colombia will become part of Aurora’s South American platform.
p) Australia
Aurora recently exported oil products to Australia, which were supplied to patients through its partially-owned strategic partner Cann Group. Cann Group has announced it will be con-structing an ALPS (Aurora Larssen Projects) designed high-technology, hybrid cultivation facility at the Melbourne International Airport. Aurora and its wholly-owned subsidiary Anandia have also successfully exported plant tissue culture derived genetics for Cann Group to enhance its cultivation program.
Facility Licensing
(q) Capsules Licenses Granted
On July 3, 2018, Aurora’s wholly owned subsidiary, CanniMed, received Health Canada approval to commence sales of CanniMed Capsules, a line of vegan capsules which became available to patients on August 22, 2018.
Aurora received its Health Canada license to produce encapsulated oil at its Mountain facility. Aurora intends to produce unique, integral hard shells for the medical markets, as well as for the adult-use market, once legalized.
Management’s Discussion & Analysis 31

(r) Health Canada Dealer’s License for Aurora Mountain
On July 30, 2018, Aurora obtained a Health Canada Dealer’s License under the Controlled Drugs and Substances Act for its EU GMP certified Aurora Mountain facility in Alberta. The new license will allow Aurora additional opportunities to produce, assemble, and sell cannabis oils and future novel, derivative products from Aurora Mountain. Furthermore, the license provides additional opportunities to export cannabis to international markets and the potential to carryout research with cannabinoids not covered under an ACMPR license.
(s) Approval for Softgel Capsules
On August 22, 2018, Aurora received Health Canada authorization to produce cannabis softgel capsules at its state-of-the-art Aurora Vie facility in Pointe-Claire, Québec. Immediately fol-lowing the approval, Aurora started production of softgel capsules in partnership with Capcium Inc. Aurora holds a 19.99 % ownership stake in Capcium, and they are Aurora’s exclusive manufacturer of cannabis softgel products in North America.
Financing Activities
(t) Bank of Montreal (“BMO”) Debt Facility
On August 29, 2018, the Company finalized a $200,000 debt facility with BMO consisting of a $150,000 term loan and a $50,000 revolving credit facility, both of which will mature in 2021. The Company also has an option to upsize the facility to a total of $250,000, subject to certain condi-tions. The debt facility will be primarily secured by Aurora’s production facilities and can be repaid without penalty at Aurora’s discretion. The interest rate for the debt facility and revolving credit facility is a set margin over the BMO CAD Prime Rate or a Bankers’ Acceptance of appropriate term.
32 Aurora Cannabis Inc. 2018 Annual Report

FINANCIAL REVIEW Consolidated Key Quarterly Results
2018(in thousands except as otherwise noted) Q4 Q3 Q2 Q1 TotalFinancial ResultsRevenue $ 19,147 $ 16,100 $ 11,700 $ 8,249 $ 55,196 Gross margin on medical cannabis (1) 74% 59% 63% 58% 65%Earnings (loss) 79,268 (20,795) 7,194 3,560 69,227 Earnings (loss) attributable to Aurora Cannabis Inc. $ 79,870 $ (19,215) $ 7,721 $ 3,560 $ 71,936 Balance SheetWorking capital 144,533 338,476 302,526 169,674 144,533 Cannabis inventory and biological assets 41,031 29,162 17,325 16,846 41,031 Total assets 1,910,716 1,671,400 732,394 347,834 1,910,716Operational Results - Medical CannabisCash cost of sales per gram of dried cannabis sold (2) $ 1.87 $ 1.80 $ 1.74 $ 2.16 n/a Cash cost to produce per gram of dried cannabis sold (2) $ 1.70 $ 1.53 $ 1.41 $ 1.87 n/a Active registered patients 43,308 45,776 21,718 19,280 n/a Average net selling price of dried cannabis (3) $ 8.02 $ 7.30 $ 7.86 $ 7.32 $ 7.65 Average net selling price of cannabis oil (3) $ 13.52 $ 12.83 $ 13.35 $ 16.41 $ 13.68 Kilograms produced 2,212 1,206 1,204 1,010 5,632 Kilograms sold 1,617 1,353 1,162 890 5,022
2017Q4 Q3 Q2 Q1 Total
Financial ResultsRevenue $ 5,936 $ 5,175 $ 3,885 $ 3,071 $ 18,067 Gross margin on medical cannabis (1) 58% 58% 54% 53% 56%Earnings (loss) (4,816) 139 (2,678) (5,613) (12,968)Earnings (loss) attributable to Aurora Cannabis Inc. (4,816) 139 (2,678) (5,613) (12,968)Balance SheetWorking capital 170,142 126,530 60,060 23,213 170,142 Cannabis inventory and biological assets 11,791 8,694 5,718 3,103 11,791 Total assets 322,679 197,065 98,219 56,769 322,679 Operational Results - Medical CannabisCash cost of sales per gram of dried cannabis sold (2) $ 2.09 $ 2.31 $ 2.56 $ 3.89 n/a Cash cost to produce per gram of dried cannabis sold (2) $ 1.91 $ 1.91 $ 2.13 $ 3.89 n/a Active registered patients 16,400 13,110 12,200 8,200 n/a Average net selling price of dried cannabis (3) $ 6.79 $ 6.64 $ 5.96 $ 6.32 $ 6.47 Average net selling price of cannabis oil (3)(4) $ 17.91 n/a n/a n/a $ 17.91 Kilograms produced 1,165 847 670 355 3,037 Kilograms sold 755 653 538 436 2,382
(1) Represents the gross margin on medical cannabis before fair value adjustments.
(2) Represents the cash cost of sales per gram of dried cannabis sold and cash cost to produce per gram of dried cannabis produced by Aurora.
(3) Represents the average net selling price per gram of dried cannabis or per gram of dried cannabis equivalent.
(4) The Company received its license to sell cannabis oils in January 2017 and commenced sales of cannabis oils in Q4 2017.
Management’s Discussion & Analysis 33

Selected Annual Information(in thousands except share and per share amounts) 2018 2017 2016Revenue $ 55,196 $ 18,067 $ 1,439 Earnings (loss) 69,227 (12,968) (5,723)Earnings (loss) attributable to Aurora Cannabis Inc. 71,936 (12,968) (5,723)Earnings (loss) per Common Share:
Basic earnings per share (basic EPS) $ 0.16 $ (0.05) $ (0.04)Diluted $ 0.15 $ (0.05) $ (0.04)
Total assets 1,910,716 322,679 18,396 Total non-current financial liabilities 200,760 63,818 4,440 Cash dividends per share Nil Nil Nil
Medical Cannabis
Revenue
The Company primarily operates in the medical cannabis market which includes auxiliary support functions such as CanvasRX patient counselling services, and Aurora Larssen Projects Ltd. (“ALPS”) design, engineering and construction services.
2018 2017(in thousands except as otherwise noted) Q4 Q3 Q2 Q1 Total TotalMedical cannabis segment revenueCanadian dried cannabis $ 7,529 $ 6,304 $ 5,757 $ 4,641 $ 24,231 $ 14,679 Canadian cannabis oils 4,710 2,178 1,508 1,439 9,835 804 European dried cannabis 2,641 2,331 2,483 1,235 8,690 439 Medical cannabis revenue 14,880 10,813 9,748 7,315 42,756 15,922 Patient counselling services 1,553 591 866 923 3,933 2,145 Design, engineering and construction services 1,239 2,979 - - 4,218 - Other 85 97 32 11 225 - Total medical cannabis segment revenue 17,757 14,480 10,646 8,249 51,132 18,067 Other segment revenues 1,390 1,620 1,054 - 4,064 - Total revenue $ 19,147 $ 16,100 $ 11,700 $ 8,249 $ 55,196 $ 18,067
Medical cannabis revenue increased $4,067, or 38%, over the prior quarter. The increase in revenue was primarily due to higher volumes of both dried cannabis and cannabis oils sold coupled with higher average selling prices relative to the prior quarter, both domestically and internationally, due to the following factors:
• Both dried cannabis and cannabis oils sold increased over the previous quarter by 85,063 grams and 178,611 grams equivalents respectively. The inclusion of CanniMed’s sales in the quarter ac-counted for 422,771 grams, or 33%, of total dried cannabis sold and 221,240 grams equivalents, or 64%, of total cannabis oil gram equivalents sold. This was partially offset by lower bulk sales as the Company increased its inventory reserves for the impending legalization of the adult-use market in Canada.
• The average net selling price of dried cannabis increased by $0.72 per gram over the prior quar-ter primarily due to higher prices charged on bulk orders as well as lower promotional discounts offered to new patients. The average net selling price of cannabis oils increased by $0.69 per gram equivalent primarily due to lower promotional discounts for new patients.
• International dried cannabis sales increased by $310, or 25,935 grams, over the prior quarter. On April 13, 2018, the Company completed the first ever private export of medical cannabis to Italy following its win of the highly competitive EU-wide public tender to supply medical cannabis to the Italian government. On June 25, 2018, the Company became the first licensed supplier of
34 Aurora Cannabis Inc. 2018 Annual Report

medical cannabis to patients in Malta and have since successfully completed its first exports of medical cannabis.
Design, engineering and consulting services decreased by $1,740 due to the timing of services provided.
Consolidated medical cannabis segment revenues for fiscal 2018 increased by $33,065, or 183%, over the prior year primarily attributable to:
• Significant increase in Company’s combined active registered patients of 26,908 due to growth in registered patients through CanvasRX’s patient counselling services of 5,538, and the integration of CanniMed’s registered patients of 21,370;
• Increase in dried cannabis produced and sold both domestically and internationally of $17,803, or 1,965,827 grams, including CanniMed sales of $3,300, or 459,821 grams;
• Increase in cannabis oils sold domestically of $9,031, or 673,752 grams, including CanniMed sales of $3,456, or 252,950 in cannabis oil gram equivalents;
• Increase in design, engineering and consulting service revenue of $4,218 from the acquisition of ALPS (formerly known as Larssen Ltd.); and
• Increase in CanvasRX patient counselling services of $1,788 from Licensed Producer referral fees.
Gross Margin2018 2017
(in thousands except as otherwise noted) Q4 Q3 Q2 Q1 Total TotalMedical cannabis segment revenue $ 17,757 $ 14,480 $ 10,646 $ 8,249 $ 51,132 $ 18,067 Medical cannabis segment cost of sales 4,702 4,757 3,680 3,072 16,211 7,876 Gross profit on medical cannabis segment before fair value adjustments (1) 13,055 9,723 6,966 5,177 34,921 10,191 Less: non-medical cannabis revenue (2,792) (3,570) (866) (923) (8,151) (2,145)Add: non-medical cannabis cost of sales 747 277 25 29 1,078 71 Gross profit on medical cannabis before fair value adjustments (1) 11,010 6,430 6,125 4,283 27,848 8,117Gross margin on medical cannabis before fair value adjustments (1) 74% 59% 63% 58% 65% 56%
(1) Gross profit on medical cannabis is a non-IFRS financial measure and is calculated by taking the medical cannabis segment gross profit excluding the effects of revenues and cost of sales from patient counselling services and design, engineering, and construction services. These are considered auxiliary support services for the medical cannabis market and do not directly relate to the production of cannabis.
Gross margin on medical cannabis before the effect of changes in fair value for the three months ended June 30, 2018, was 74% compared to 59% for the prior quarter. The increase was primarily due to a higher average selling price per gram and a change in the sales ratio of cannabis oils to dried cannabis, as cannabis oils have higher profit margin relative to dried cannabis. For the three months ended June 30, 2018, cannabis oils comprised 32% of total medical cannabis revenues compared to 20% of total medical cannabis sales in the prior quarter.
The inclusion of CanniMed’s sales in the quarter accounted for an additional 225,410 grams, or 18%, of total dried cannabis sold and an additional 221,240 grams, or 64%, of total cannabis oil gram equivalents sold. Furthermore, there was an increase in the selling prices of bulk sales of both dried cannabis and cannabis oils compared to the previous quarter.
Management’s Discussion & Analysis 35

Gross margin on medical cannabis before the effect of changes in fair value for the twelve months ended June 30, 2018, was 65% compared to 56% in the prior year. The increase is mostly attribut-able to an increase in the average selling price per gram; from lower cost of sales per gram as the Company realized further economies of scale from the full ramp up of its Aurora Mountain facility; and a change in the sales ratio of cannabis oils to dried cannabis. Cannabis oils made up 23% of medical cannabis revenues in the twelve months ended June 30, 2018, compared to 5% in the prior year.
In accordance with IFRS, the Company is required to record its biological assets at fair value. As biological assets move through the production process, capitalized production costs and the fair value on the eventual sale of the cannabis from the plants are both recognized based on the stage of completion of the biological assets. The fair value portion of the biological assets is recognized as unrealized gains from the change in fair value of biological assets in the statement of operations for the reporting period. At the time of harvest, the biological assets are transferred to inventory and include capitalized production costs to date and the related fair value portion, which is adjusted to the lower of cost or inventory net realizable value. On the eventual sale of inventory, the fair value portion is relieved through unrealized loss on change in fair value on sale of inventory reported in the results of operations.
Cash Cost of Sales of Dried Cannabis and Cash Cost to Produce Dried Cannabis Sold – Aurora Produced Medical Cannabis(in thousands except as otherwise noted) Q4 Q3 Q2 Q1 TotalTotal consolidated cost of sales $ 4,867 $ 6,827 $ 4,837 $ 3,072 $ 19,603 Adjustments:Non-medical cannabis cost of sales (1) 135 (2,993) (1,889) (908) (5,655)Oil and extracts conversion costs (2) (1,534) (862) (451) (217) (3,064)Cost of cannabis purchased (108) (568) (536) (211) (1,423)Cost of consumable raw materials (511) (350) (267) (197) (1,325)Depreciation (301) (293) (203) (125) (922)Cash cost of sales of dried cannabis sold (3) $ 2,548 $ 1,761 $ 1,491 $ 1,414 $ 7,214 Packaging costs (221) (265) (283) (295) (1,064)Cash cost to produce dried cannabis sold (3) $ 2,327 $ 1,496 $ 1,208 $ 1,119 $ 6,150 Grams of dried cannabis sold - Aurora produced 1,366 979 856 653 3,854 Cash cost of sales per gram of dried cannabis sold (3) $ 1.87 $ 1.80 $ 1.74 $ 2.17 $ 1.87 Cash cost to produce per gram of dried cannabis sold (3) $ 1.70 $ 1.53 $ 1.41 $ 1.71 $ 1.60
(1) Non-medical cost of sales consists of patient counselling services and design, engineering and construction services. These are considered auxiliary support services as they are not directly related to the production of medical cannabis.
(2) Oil and extracts conversion costs are costs attributable to the post-production processing of dried cannabis into cannabis derivatives.
(3) Cash cost of sales per gram of dried cannabis sold and cash cost to produce per gram of dried cannabis sold represent the cash cost per gram sold by Aurora, including CanniMed’s costs in Q4 2018.
Cash cost of sales per gram of dried cannabis sold and cash cost to produce per gram of dried cannabis sold increased by $0.07 and $0.17 respectively from the prior quarter, mainly due to the inclusion of CanniMed, partially offset by lower utility costs in the summer months.
Production costs per gram are expected to decrease significantly once Aurora Sky is fully opera-tional and the efficiencies from automation, scale and yield expertise are also realized in the CanniMed facilities and other newly acquired Aurora facilities.
Grams of Dried Cannabis and Grams Equivalent of Oil Produced – Medical Cannabis
Grams of dried cannabis produced in the period refers to the grams of dried cannabis harvested from plants in the period. The Company calculates grams produced in the period based on the
36 Aurora Cannabis Inc. 2018 Annual Report

final recorded weight of dried harvested buds that have completed the drying stage net of any weight loss during the drying process.
Grams equivalent of oil produced represents the equivalent number of dried grams that would be used to produce the cannabis oils. The dried cannabis is first extracted into a bulk concentrate which is then diluted into cannabis oil. The “grams equivalent” measure is used to disclose the volume in grams of oil sold and (or) produced in the period as opposed to milliliters. The actual grams used in the production of cannabis oils can vary depending on the strain of dried cannabis used which yields a different potency and strength in the oil. The Company estimates and converts its cannabis oil inventory to equivalent grams based on the tetrahydrocannabinol (“THC”) and cannabidiol (“CBD”) content in the cannabis oils.
Other Segments
The Company’s other reportable segments include its horizontally integrated businesses and operating expenses.
Revenue
Other segment revenue of $4,067 relates to sales of hemp and home cultivation products, attributable to acquisitions in the year.
Operating Expenses2018 2017
(in thousands except as otherwise noted) Q4 Q3 Q2 Q1 Total TotalGeneral and administration $ 22,557 $ 9,847 $ 7,568 $ 2,993 $ 42,965 $ 6,813 Sales and marketing 14,761 5,880 5,136 3,668 $ 29,445 10,270 Acquisition costs 8,025 5,543 1,756 340 $ 15,664 1,551 Depreciation and amortization 10,121 873 460 634 $ 12,088 716 Research and development 923 477 172 107 $ 1,679 314 Share-based payments 11,636 15,872 7,456 2,486 $ 37,450 7,584 Total operating expenses $ 68,023 $ 38,492 $ 22,548 $ 10,228 $ 139,291 $ 27,248
General and administration costs increased by $12,710, or 129%, compared to the prior quarter. The increase was primarily due to increased audit, legal and accounting fees relating to external financial reporting, audit and tax fees, as well as consulting and legal fees related to the acqui-sition of CanniMed. Travel costs increased due to market development, as well as CanniMed integration activities. Wages and benefits increased as a result of growth in Aurora’s workforce to support its corporate strategy. The inclusion of CanniMed’s general and administrative cost accounted for $3,171, or 25%, of the increase overall.
Sales and marketing cost increased by $8,881, or 151%, compared to the third quarter of fiscal 2018. The increase was mainly due to continued investment in the Company’s brand building initiatives, including consumer education and engagement programs, such as our Illumination Concert Series. The inclusion of CanniMed’s sales and marketing cost accounted for $1,715, or 19%, of the increase overall.
Acquisition cost increased $2,482, or 45%, compared to the prior quarter mainly due to pro-fessional, banking, and legal fees incurred in relation to the successful completion of the acquisitions of both CanniMed and MedReleaf.
Depreciation and amortization expense increased by $9,248, or 1,059%, from the third quarter of fiscal 2018 primarily due to the increase in assets in use at the Aurora Sky facility as well as the consolidation of CanniMed’s depreciation and amortization expense in the quarter.
Management’s Discussion & Analysis 37

Annual operating expenses were $112,043 higher than the prior year primarily due to an increase in the following:
• General and administrative expenses of $36,152 in wages and benefits expense due to in-creased headcount to support the growth of various aspects of the Company; professional and transfer agent fees relating to strategic corporate transactions and general corporate matters; and corporate office charges related to the expansion of operations and business functions;
• Sales and marketing expense of $19,175 due to increased brand, public relations and trade-show activities;
• Acquisition costs of $14,113 related to horizontally diversified and vertically integrated business acquisitions;
• Depreciation and amortization expense of $11,372 from additional capital assets in operational use within Aurora Sky and other facilities; and
• Share-based payments of $29,866 from the issuance of stock options.
The inclusion of CanniMed’s results accounted for 9% of the annual increase in general and administrative expenses and 9% of the annual increase in sales and marketing expense.
LIQUIDITY AND CAPITAL RESOURCES During the twelve months ended June 30, 2018, the Company generated revenue of $55,196 from operations, and financed its current operations, growth initiatives, and met its capital require-ments from debt and equity financings. The Company’s objectives when managing its liquidity and capital resources are to ensure sufficient liquidity to support its financial obligations and execute its operating and strategic plans while maintaining healthy liquidity reserves and access to capital for at least the next twelve months.
The Company manages its liquidity risk by monitoring its operating requirements and preparing budgets and cash forecasts to ensure it has sufficient funds to fulfill obligations.
The table below sets out cash and working capital as at June 30, 2018, and 2017:
(In thousands except as otherwise noted) 2018 2017Cash and cash equivalents $ 89,193 $ 159,715 Working capital 144,533 170,142
As at June 30, 2018, the Company maintained $89,193 in cash and cash equivalents in contrast to $159,715 in cash and cash equivalents as at June 30, 2017.
The Company’s working capital as of June 30, 2018 was $144,533 compared to $170,142 as at June 30, 2017. The decrease in working capital of $25,609 was largely attributable to an increase in the accounts payable and accrued liabilities balance from the timing of payables related to construction of our production facilities.
The table below summarizes total capitalization as at June 30, 2018, and 2017:
(in thousands except as otherwise noted) 2018 2017Convertible notes $ 191,528 $ 63,536 Loans and borrowings 11,683 351 Total debt 203,211 63,887 Total equity 1,563,131 218,933 Total capitalization $ 1,766,342 $ 282,820
Total capitalization increased $1,483,522 compared to the prior year mostly due to an increase in equity of $1,344,198 from the issuance of shares relation to strategic acquisitions as well as from
38 Aurora Cannabis Inc. 2018 Annual Report

the exercise and conversion of stock options, warrants and convertible debentures throughout fiscal 2018.
On August 29, 2018, the Company closed a $200,000 debt facility with Bank of Montreal, consisting of a $150,000 term loan and a $50,000 revolving credit facility, both of which will mature in 2021. The new debt facility will shift the capital structure of the Company to include more traditional debt financing which will lower the cost of capital. The Company anticipates that it will have sufficient liquidity and capital resources to meet its planned expenditures for the next twelve months.
The table below summarizes the Company’s cash flows for the years ended June 30, 2018, and 2017:
2018 2017(in thousands except as otherwise noted) Q4 Q3 Q2 Q1 Total TotalCash used in operating activities $ (45,121) $ (26,915) $ (4,657) $ (4,974) $ (81,667) $ (13,378)Cash used in investing activities (105,548) (323,821) (79,958) (28,432) (537,759) (49,341)Cash provided by (used in) financing activities 8,418 230,873 307,979 1,279 548,549 221,985 Effect of foreign exchange 502 45 (438) 246 355 190 (Decrease) increase in cash and cash equivalents $ (141,749) $ (119,818) $ 222,926 $ (31,881) $ (70,522) $ 159,456
Operating activities
For the twelve months ended June 30, 2018, cash used in operating activities resulted primarily from cash inflows of $35,593 from gross profit before the effect of changes in fair value, offset by cash flows used for operating expenses of $84,717, finance and other costs of $7,159 and cash outflows of $25,384 related to changes in non-cash working capital.
Cash used in operating activities in the prior year resulted primarily from cash inflows of $10,192 from gross profit before the effect of changes in fair value, offset by cash flows used for operating expenses of $18,825, finance and other costs of $2,288 and cash outflows of $1,242 related to changes in non-cash working capital.
Investing activities
For the twelve months ended June 30, 2018, cash used in investing activities were primarily for the purchase of production equipment building improvements and construction of other facili-ties of $136,945, investments of $63,437 in marketable securities and derivatives, investment in associates of $218,183, and the acquisition of assets and business combinations, net of cash, for $108,329.
Investing activities in the prior year consisted primarily of cash outflows of $25,718 for the purchase of equipment and the construction of Aurora Sky, $13,665 for asset acquisitions and business combinations net of cash acquired, and $7,877 from investments in marketable securi-ties and derivatives.
Financing activities
For the twelve months ended June 30, 2018, cash provided by financing activities were primarily generated from the November 2017 bought deal financing for net proceeds of $70,639, the November 2017 special warrant financing for net proceeds of $110,922, the March 2018 convert-ible debenture financing for net proceeds of $222,205, and the exercise of warrants, options and compensation options for $144,967.
Financing activities in the prior year were primarily generated from equity financings for net proceeds of $91,727, net proceeds from convertible debentures of $109,973, and the exercise of warrants, options and compensation options for $29,096.
Management’s Discussion & Analysis 39

Capital Resource Measures
The Company’s major capital expenditures during the three months ended June 30, 2018 mainly consisted of the construction of Aurora Sky and the commencement of construction at Aurora Sun. Subsequent to June 30, 2018, the Company finalized its $200,000 debt facility with BMO. The Company believes it has sufficient cash and resources to fund the Company’s operations and complete construction of its announced facilities for at least the next fiscal year. See “Facilities” for Aurora’s operating, under construction and announced production facilities.
Contractual Obligations
The Company had the following contractual obligations as of June 30, 2018:
(In thousands except as otherwise noted) TotalLess than
1 year 1 to 3 years 3 to 5 yearsAccounts payable and accrued liabilities $ 47,456 $ 47,456 $ - $ - Loans and borrowings 11,747 2,482 2,511 6,754 Contingent consideration payable 23,742 14,438 9,304 - Operating lease 83 60 23 - Convertible notes and interest (1) 251,356 11,604 237,649 2,103Office lease 47,257 5,332 14,764 27,161 Capital projects (2) 38,474 38,474 - - Total contractual obligations $ 420,115 $ 119,846 $ 264,251 $ 36,018
(1) Assumes the principal balance outstanding at June 30, 2018 remains unconverted and includes the estimated interest payable until the maturity date.
(2) Relates to capital commitments that the Company has made to specific vendors for capital projects pertaining to on-going construction projects.
Contingencies
On November 29, 2017, a claim was commenced against the Company regarding 300,000 stock options with an exercise price of $0.39 per share issued to a consultant pursuant to an agree-ment dated March 16, 2015. The agreement was terminated on March 8, 2016, and in accordance to the Company’s stock option plan, the unexercised options expired 90 days from the date of the termination of the agreement.
The option holder is attempting to enforce exercise rights which the Company believes do not exist. The Company believes the action to be without merit and intends to defend this claim vigorously. Due to the uncertainty of timing and the amount of estimated future cash outflows relating to this claim, no provision had been recognized.
Off-balance sheet arrangements
As at the date of this MD&A, the Company had no material off-balance sheet arrangements that have, or are reasonably likely to have, a current or future effect on the financial performance or financial condition of the Company.
40 Aurora Cannabis Inc. 2018 Annual Report

TRANSACTIONS WITH RELATED PARTIESGoods and services
The Company incurred the following transactions with related parties during the years ended June 30, 2018 and 2017:
“ Name and Relationship to the Company” Transaction Year ended June 30, At as June 30,
2018 2017 2018 2017Related Party Transactions Balance Payable (Receivable) (1)
Canadian Cannabis Clinics (“CCC”), a company where Joseph del Moral, is a common director Service fees (2) $ 4,957 $ 3,659 $ - $ (72)
Colour Media Inc., a company partially owned by an officer of the Company, Savior Joseph Marketing fees 2,210 - - -
Belot Business Consulting Corp, a company controlled by Neil Belot, Chief Global Business Development Office Consulting fees (3) 358 780 24 -
Australis Holdings Limited (“AHL”), a 50% owned joint venture company Interest income (4) 49 41 (3,444) (2,096)
The Green Organic Dutchman Holdings Ltd., an associate of the Company
Design, engineering and construction consulting services (5) 240 - (620) -
Cann Group Limited, an associate of the Company
Design, engineering and construction consulting services (5) 239 - (50) -
(1) The amounts are unsecured, non-interest bearing and have no specific repayment terms.
(2) CCC provides operational, administrative and consulting services to CanvasRx.
(3) Consulting fees paid related to the CanvasRx acquisition.
(4) Interest income earned on loans receivable from AHL.
(5) Profit margin generated from services provided to the Company’s associates, based on the Company’s ownership interest at June 30, 2018.
These transactions are in the normal course of operations and are measured at the exchange value being the amounts agreed to by the parties.
Key management personnel compensation
The Company’s key management personnel have the authority and responsibility for planning, directing and controlling the activities of the Company and consists of the Company’s executive management team and management directors.
(in thousands except as otherwise noted) 2018 2017Management compensation $ 5,284 $ 1,934 Directors’ fees (1) $ 210 $ 258 Share-based payments (2) 14,608 6,431
$ 20,102 $ 8,623
(1) Includes meeting fees and committee chair fees.
(2) Share-based payments are the fair value of options granted and vested to key management personnel and directors of the Company under the Company’s stock option plan.
As at June 30, 2018, the amount payable to the directors and officers and a former director and officer of the Company is $1,128 (2017 - $565).
CRITICAL ACCOUNTING ESTIMATESThe preparation of the Company’s Financial Statements in conformity with IFRS requires manage-ment to make judgements, estimates, and assumptions about the carrying amounts of assets and liabilities that are not readily apparent from other sources. The estimates and associated assump-tions are based on historical experience and other factors that are considered to be relevant. Actual results may differ from these estimates.
Management’s Discussion & Analysis 41

The estimates and underlying assumptions are reviewed on an ongoing basis. Revisions to accounting estimates are recognized in the period in which the estimate is revised, if the revision affects only that period, or in the period of the revision and future periods, if the revision affects both current and future periods.
Significant judgements, estimates and assumptions that have the most significant effect on the amounts recognized in the Financial Statements are as follows:
Biological assets
Determination of the fair values of the biological assets requires the Company to make assumptions about how market participants assign fair values to these assets. These assumptions primarily relate to the level of effort required to bring the cannabis up to the point of harvest, costs to convert the harvested cannabis to finished goods, sales price, risk of loss, expected future yields from the cannabis plants and estimating values during the growth cycle. The average grow cycle of plants up to the point of harvest is approximately twelve weeks.
Inventory
The valuation of biological assets at the point of harvest is the cost basis for all cannabis-based inventory and thus any critical estimates and judgements related to the valuation of biological assets are also applicable for inventory. The valuation of work-in-process and finished goods also requires the estimate of conversion costs incurred, which become part of the carrying amount for the inventory. The Company must also determine if the cost of any inventory exceeds its net realiz-able value, such as cases where prices have decreased, or inventory has spoiled or has otherwise been damaged.
Estimated useful lives and depreciation of property, plant and equipment
Depreciation of property, plant and equipment is dependent upon estimates of useful lives and residual values which are determined through the exercise of judgement. The assessment of any impairment of these assets is dependent upon estimates of recoverable amounts that take into account factors such as economic and market conditions and the useful lives of assets.
Investments in associates and joint ventures
The Company uses judgement in its assessment of whether the Company has significant influence. Significant influence is the power to participate in the financial and operating policy decisions of the investee, including but not limited to, the ability to exercise significant influence through board representation, material transactions with the investee, provision of technical information, and the interchange of managerial personnel. Whether an investment is classified as an investment in associate can have a significant impact on the entries made on and after acquisition.
Business combinations and asset acquisitions
Classification of an acquisition as a business combination or an asset acquisition depends on whether the assets acquired constitute a business, which can be a complex judgement. Whether an acquisition is classified as a business combination or asset acquisition can have a significant impact on the entries made on and after acquisition.
In determining the fair value of all identifiable assets, liabilities and contingent liabilities acquired, the most significant estimates relate to contingent consideration and intangible assets. Management exercises judgement in estimating the probability and timing of when earn-outs are expected to be achieved which is used as the basis for estimating fair value. For any intangible asset identified, depending on the type of intangible asset and the complexity of determining its fair value, an independent valuation expert or management may develop the fair value, using appropriate valuation techniques, which are generally based on a forecast of the total expected future net cash
42 Aurora Cannabis Inc. 2018 Annual Report

flows. The evaluations are linked closely to the assumptions made by management regarding the future performance of these assets and any changes in the discount rate applied.
Disposal group held for distribution
The Company held a revenue royalty and an annuity receivable from SubTerra LLC. These assets were held in Australis Capital Inc. which was classified as a disposal group held for distribution to Aurora shareholders. The Company used judgement in estimating the fair value of the SubTerra assets. In determining the fair value of the revenue royalty, management exercised judgement in determining the likelihood of SubTerra generating revenues from the sale of cannabis-based products. The fair value of the annuity receivable was estimated using the effective interest method using a ten-year corporate debt yield at the measurement date.
Goodwill and intangible asset impairment
Amortization of intangible assets is dependent upon estimates of useful lives and residual values which are determined through the exercise of judgement.
Goodwill is allocated to cash generating units (“CGUs”) which are expected to benefit from the syn-ergies of the business combination. CGUs are determined based on the smallest identifiable group of assets that generates cash inflows that are largely independent of cash inflows from other assets or group of assets. Management has exercised judgement in this assessment and determined the Company’s CGUs to be: the production and sale of medical cannabis; patient counselling services; design, engineering and construction consulting services; the production and sale of indoor cultivators; and the production and sale of hemp related food products.
Convertible instruments
The identification of convertible notes components is based on interpretations of the substance of the contractual arrangement and therefore requires judgement from management. The separation of the components affects the initial recognition of the convertible debenture at issuance and the subsequent recognition of interest on the liability component. The determination of the fair value of the liability is also based on a number of assumptions, including contractual future cash flows, discount rates and the presence of any derivative financial instruments.
Share-based payments
In estimating fair value of warrants using the Binomial model, management is required to make certain assumptions and estimates such as the expected life of warrants, volatility of the Company’s future share price, risk free rate, and future dividend yields. Changes in assumptions used to estimate fair value could result in materially different results.
In estimating fair value of options using the Black-Scholes option pricing model, management is required to make certain assumptions and estimates such as the expected life of options, volatility of the Company’s future share price, risk free rate, future dividend yields and estimated forfei-tures at the initial grant date. Changes in assumptions used to estimate fair value could result in materially different results.
Deferred tax assets
Deferred tax assets, including those arising from tax loss carry-forwards, require management to assess the likelihood that the Company will generate sufficient taxable earnings in future periods in order to utilize recognized deferred tax assets. Assumptions about the generation of future taxable profits depend on management’s estimates of future cash flows. In addition, future changes in tax laws could limit the ability of the Company to obtain tax deductions in future periods. To the extent that future cash flows and taxable income differ significantly from estimates, the ability of the Company to realize the net deferred tax assets recorded at the reporting date could be impacted.
Management’s Discussion & Analysis 43

Fair value of financial instruments
The individual fair values attributed to the different components of a financing transaction, notably investment in equity in securities, derivative financial instruments, convertible debt and loans, are determined using valuation techniques. The Company uses judgement to select the methods used to make certain assumptions and in performing the fair value calculations in order to determine (a) the values attributed to each component of a transaction at the time of their issuance; (b) the fair value measurements for certain instruments that require subsequent measurement at fair value on a recurring basis; and (c) for disclosing the fair value of financial instruments subsequently carried at amortized cost. These valuation estimates could be significantly different because of the use of judgement and the inherent uncertainty in estimating the fair value of these instruments that are not quoted in an active market.
NEW ACCOUNTING PRONOUNCEMENTSThere were no new standards effective July 1, 2017, that had an impact on the Company’s consoli-dated financial statements. The following IFRS standards have been recently issued by the IASB. Pronouncements that are not applicable or where it has been determined do not have a significant impact to the Company have been excluded herein.
IFRS 7 Financial instruments: Disclosure
IFRS 7 Financial instruments: Disclosure, was amended to require additional disclosures on transi-tion from IAS 39 to IFRS 9. IFRS 7 is effective on adoption of IFRS 9, which is effective for annual periods commencing on or after January 1, 2018. The Company intends to adopt the amendments to IFRS 7 on July 1, 2018, and does not expect the implementation will result in a significant effect to the financial statements.
IFRS 9 Financial Instruments
In July 2014, the IASB issued the final version of IFRS 9 Financial Instruments, which reflects all phases of the financial instruments project and replaces IAS 39 Financial Instruments: Recognition and Measurement and all previous versions of IFRS 9. The standard introduces new requirements for classification and measurement, impairment, and hedge accounting. IFRS 9 is effective for annual periods beginning on or after 1 January 2018, with early application permitted.
The Company intends to adopt IFRS 9 on July 1, 2018, retrospectively where the cumulative impact of adoption will be recognized in retained earnings as of July 1, 2018; comparatives will not be restated.
The Company has conducted a preliminary assessment of the impact from this new standard. IFRS 9 introduces new requirements to determine the measurement basis of financial assets, involving the cash flow characteristics of assets and the business models under which they are managed. Accordingly, the basis of measurement for the Company’s financial assets may change. IFRS 9 affects the accounting for available-for-sale equity securities, requiring a designation, on an instrument-by-instrument basis, between recording both unrealized and realized gains and losses either through (i) OCI with no recycling to profit and loss or (ii) profit and loss. The Company will be electing to classify its available-for-sale equity investments at Fair Value through OCI as these equity investments are for strategic purposes. The FVOCI election is made upon initial recognition, on an instrument-by-instrument basis and once made is irrevocable. Gains and losses on these instruments including when derecognized or sold are recorded in OCI and are not subsequently reclassified to the Consolidated Statement of Comprehensive Income (Loss).
For other financial instruments, the Company does not expect the implementation will result in a significant change in the classification and measurement of the Company’s financial assets.
44 Aurora Cannabis Inc. 2018 Annual Report

IFRS 15 Revenue from Contracts with Customers
The IASB replaced IAS 18 Revenue, in its entirety with IFRS 15 Revenue from Contracts with Customers. The standard contains a single model that applies to contracts with customers and two approaches to recognizing revenue: at a point in time or over time. The model features a contract-based five-step analysis of transactions to determine whether, how much and when revenue is recognized. IFRS 15 is effective for annual periods beginning on or after January 1, 2018, with early application permitted.
The Company intends to adopt IFRS 15 on July 1, 2018, using the modified retrospective approach where the cumulative impact of adoption will be recognized in retained earnings as of July 1, 2018; comparatives will not be restated.
The Company has conducted a preliminary assessment of the impact from this new standard. Under IFRS 15, revenue from the sale of medicinal cannabis would be recognized at a point in time when control over the goods have been transferred to the customer. The Company transfers control and satisfies its performance obligation upon delivery and acceptance by the customer, which is consistent with the Company’s current revenue recognition policy under IAS 18.
Referral revenues earned from Licensed Producers through CanvasRx are recognized over a period of time as the referred patients remain active with the Licensed Producers. This is consistent with the Company’s current revenue recognition policy under IAS 18 where revenue is recognized on a monthly basis over a specified period of time that the referred patient remains an active purchaser of medical cannabis with the Licensed Producer.
Based on the Company’s preliminary assessment, the adoption of this new standard is not expected to have a material impact on its consolidated financial statements.
IFRS 16 Leases
In January 2016, the IASB issued IFRS 16 Leases, which will replace IAS 17 Leases. This standard introduces a single lessee accounting model and requires a lessee to recognize assets and liabilities for all leases with a term of more than twelve months, unless the underlying asset is of low value. A lessee is required to recognize a right-of-use asset representing its right to use the underlying asset and a lease liability representing its obligation to make lease payments. The standard will be effective for annual periods beginning on or after January 1, 2019, with earlier application permitted for entities that apply IFRS 15 Revenue from Contracts with Customers at or before the date of initial adoption of IFRS 16. The Company intends to adopt IFRS 16 on July 1, 2019, and is assessing the impact of this new standard on its consolidated financial statements.
FINANCIAL INSTRUMENTS AND OTHER INSTRUMENTS Fair Value Hierarchy
Financial instruments recorded at fair value are classified using a fair value hierarchy that reflects the significance of the inputs to fair value measurements. The three levels of hierarchy are:
Level 1 Unadjusted quoted prices in active markets for identical assets or liabilities;Level 2 Inputs other than quoted prices that are observable for the asset or liability, either directly
or indirectly; andLevel 3 Inputs for the asset or liability that are not based on observable market data.
Significant Judgement
The individual fair values attributed to the different components of a financing transaction, notably investment in equity in securities, derivative financial instruments, convertible debt and loans, are determined using valuation techniques. The Company uses judgement to select the methods used to make certain assumptions and in performing the fair value calculations in order to determine
Management’s Discussion & Analysis 45

(a) the values attributed to each component of a transaction at the time of their issuance; (b) the fair value measurements for certain instruments that require subsequent measurement at fair value on a recurring basis; and (c) for disclosing the fair value of financial instruments subsequently carried at amortized cost. These valuation estimates could be significantly different because of the use of judgement and the inherent uncertainty in estimating the fair value of these instruments that are not quoted in an active market.
Summary of Financial Instruments
The carrying values of the financial instruments at June 30, 2018, are summarized in the following table:
(in thousands except as otherwise noted)
Available-for-sale
financial assets
Loans and receivables
Held-for-trading
derivative assets at
FVTPL
Financial assets
designated as FVTPL
Other financial
liabilities
Financial liabilities at
FVTPL Total
Financial AssetsCash and cash equivalents $ - $ 89,193 $ - $ - $ - $ - $ 89,193 Short-term investments - 990 - - - - 990 Accounts receivable - 15,096 - - - - 15,096 Marketable securities 59,188 - - - - - 59,188 Derivatives - - 5,331 119,611 - - 124,942 Financial LiabilitiesAccounts payable (1) - - - - 47,456 - 47,456Convertible notes (2) - - - - 191,528 - 191,528 Contingent consideration - - - - - 21,333 21,333Loans and borrowings - - - - 11,683 - 11,683
(1) Balance includes interest rate swaps of $63 which are included in accounts payable and accrued liabilities on the Statement of Financial Position.
(2) The fair value of convertible notes, including both the debt and equity components.
Fair value hierarchy
The following is a summary of financial assets measured at fair value segregated based on the various levels of inputs:
(in thousands except as otherwise noted) Level 1 Level 2 Level 3 TotalMarketable securities $ 59,188 $ - $ - $ 59,188 Derivative assets - 120,102 4,840 124,942
There have been no transfers between fair value levels during the period.
Changes in level 3 financial assets
Changes in the carrying value of level 3 financial assets for the period were as follows:
(in thousands except as otherwise noted)Convertible Debenture
Warrant Derivatives Total
Opening, June 30, 2017 $ 11,071 $ 292 $ 11,363 Additions - 30,681 30,681 Unrealized gain at inception - 3,050 3,050 Unrealized gain (loss) 830 (9,790) (8,960)Conversion of debenture (11,901) 4,330 (7,571)Exercise of warrants - (23,723) (23,723)Ending balance $ - $ 4,840 $ 4,840
46 Aurora Cannabis Inc. 2018 Annual Report

Unrealized gains (losses) on level 3 financial assets
For the year ended June 30, 2018, the Company recognized unrealized gains (losses) on level 3 financial assets as follows:
(in thousands except as otherwise noted)Convertible Debenture
Warrant Derivatives Total
Gain (loss) on changes in fair value $ 830 $ (9,790) $ (8,960)Amortized deferred inception gains 6,107 5,217 11,324 Unrealized gains (losses) on level 3 financial assets $ 6,937 $ (4,573) $ 2,364
Deferred gains
Changes in deferred gains on convertible debenture and derivatives measured at fair value and included in level 3 of the fair value hierarchy were as follows:
(in thousands except as otherwise noted)Convertible Debenture
Warrant Derivatives Total
Opening, June 30, 2017 $ 10,206 $ 321 $ 10,527 Additions - 3,051 3,051 Conversion of debenture (4,099) 4,099 - Unrealized gains amortized (6,107) (5,217) (11,324)Ending balance $ - $ 2,254 $ 2,254
Contingent consideration
The following is a continuity of contingent consideration liability:
(in thousands except as otherwise noted) BCNL UCI CanvasRx H2 TotalOpening, June 30, 2017 $ - $ 13,221 $ - $ 13,221 Additions from acquisitions 1,119 - 14,957 16,076 Unrealized (gain) loss from change in fair value 123 6,703 1,018 7,844 Payments - (14,040) (1,768) (15,808)Ending balance $ 1,242 $ 5,884 $ 14,207 $ 21,333
The Company’s contingent consideration liability was measured at fair value based on unobserv-able inputs and was considered a level 3 financial instrument. The fair value of these liabilities determined by this analysis was primarily driven by the Company’s expectations of the subsidiaries’ achieving their milestones. The expected milestones were assessed probabilities by management which were discounted to present value in order to derive a fair value of the contingent consider-ation. The primary inputs of the calculation were the probabilities of achieving the milestones and a discount rate.
FINANCIAL INSTRUMENTS RISKThe Company is exposed in varying degrees to a variety of financial instrument related risks. The Board mitigates these risks by assessing, monitoring and approving the Company’s risk management processes:
Credit risk
Credit risk is the risk of a potential loss to the Company if a customer or third party to a financial instrument fails to meet its contractual obligations. The Company is moderately exposed to credit risk from its cash and cash equivalents, trade and other receivables, short-term GIC investments, and advances receivable. The risk exposure is limited to their carrying amounts at the statement of financial position date. The risk for cash and cash equivalents is mitigated by holding these instruments with highly rated Canadian financial institutions. The Company does not invest in asset-backed deposits or investments and does not expect any credit losses. The Company periodi-cally assesses the quality of its investments and is satisfied with the credit rating of the financial institutions and the investment grade of its guaranteed investment certificates. Trade and other receivables primarily consist of trade accounts receivable and goods and services taxes recoverable
Management’s Discussion & Analysis 47

(“GST”). Credit risk from the advances receivable arises from the possibility that principal and/or interest due may become uncollectible. The Company mitigates this risk by managing and monitoring the underlying business relationships.
The Company provides credit to its customers in the normal course of business and has estab-lished credit evaluation and monitoring processes to mitigate credit risk but has limited risk as the majority of sales are transacted with credit cards.
As at June 30, 2018 and 2017, the Company’s aging of receivables was approximately as follows:
(in thousands except as otherwise noted) 2018 20170 – 60 days $ 13,569 $ 1,534 61 – 120 days 1,527 778
$ 15,096 $ 2,312
Liquidity risk
Liquidity risk is the risk that the Company will not be able to meet its financial obligations associ-ated with financial liabilities. The Company manages liquidity risk through the management of its capital structure. The Company has access to CanniMed’s Canadian and U.S. operating lines of credit with a maximum of $1,000 and US$500, respectively. The Canadian and U.S. operating lines of credit bear interest at bank prime rate plus 0.75% and at U.S. base rate plus 0.75%, respec-tively. The lines of credit are secured by a general security agreement covering all assets of the Company and can be accessed to the lesser of the maximum available credit or the aggregate of 90% of Government of Canada receivables, 85% of undoubted receivables and 75% of acceptable receivables, less intercompany and priority claim amounts. These operating lines of credit were undrawn as of June 30, 2018. Subsequent to June 30, 2018, the Company also secured a $200,000 debt facility with BMO. The Company’s approach to managing liquidity is to ensure that it will have sufficient liquidity to settle obligations and liabilities when due.
Market risk
(a) Currency risk
The operating results and financial position of the Company are reported in Canadian dollars. As the Company operates in an international environment, some of the Company’s financial instruments and transactions are denominated in currencies other than the Canadian dollar. The results of the Company’s operations are subject to currency transaction and translation risks.
The Company holds cash in Canadian dollars, U.S. dollars, Danish Krone and Euros, and invest-ments in Australian and U.S. dollars. The Company’s main risk is associated with fluctuations in the Euros, Danish Krone and Australian and U.S. dollars. Assets and liabilities are translated based on the foreign currency translation policy.
The Company has determined that an effect of a 10% increase or decrease in Euros, Danish Krone, Australian dollar, and U.S. dollar against the Canadian dollar on financial assets and liabilities, as at June 30, 2018, would result in an increase or decrease of approximately $79 (2017 - $1,430) to the net loss and comprehensive loss for the year ended June 30, 2018.
At June 30, 2018, the Company had no hedging agreements in place with respect to foreign exchange rates. The Company has not entered into any agreements or purchased any instruments to hedge possible currency risks at this time.
(b) Interest rate risk
Interest rate risk is the risk that the fair value or future cash flows of a financial instrument will fluctuate because of changes in market interest rates. Cash and cash equivalents bear interest at market rates. The Company’s investments and convertible notes have fixed rates of interest.
48 Aurora Cannabis Inc. 2018 Annual Report
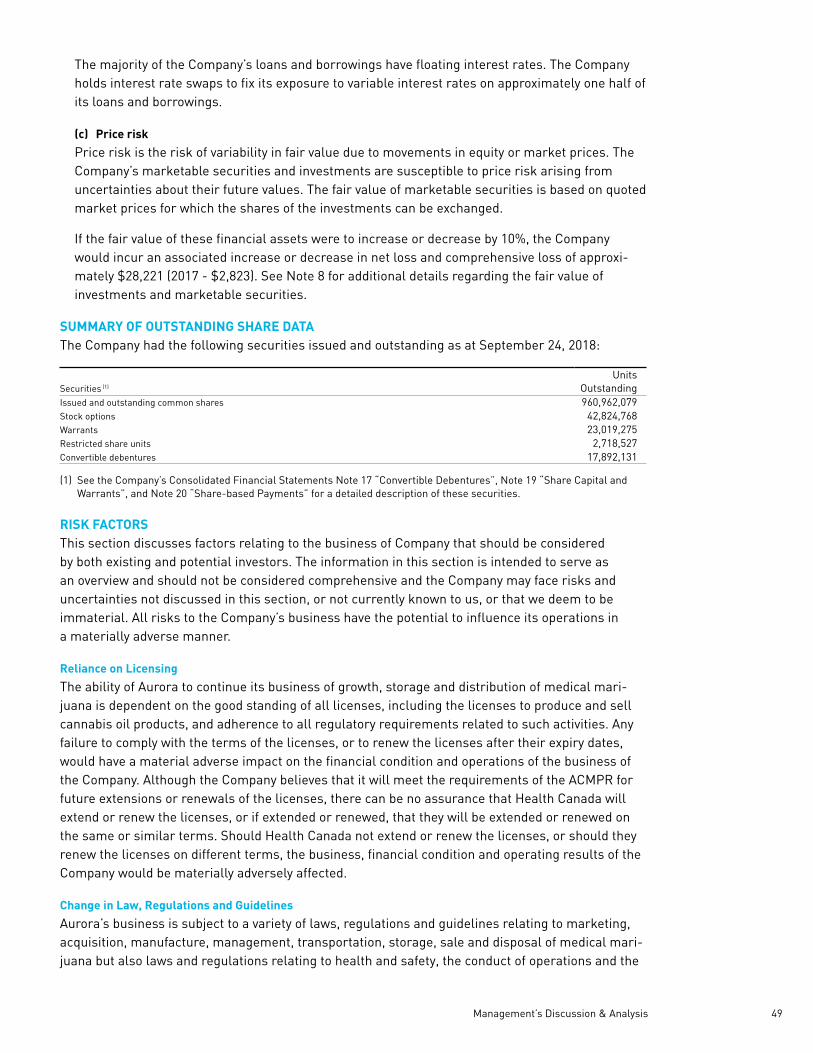
The majority of the Company’s loans and borrowings have floating interest rates. The Company holds interest rate swaps to fix its exposure to variable interest rates on approximately one half of its loans and borrowings.
(c) Price risk
Price risk is the risk of variability in fair value due to movements in equity or market prices. The Company’s marketable securities and investments are susceptible to price risk arising from uncertainties about their future values. The fair value of marketable securities is based on quoted market prices for which the shares of the investments can be exchanged.
If the fair value of these financial assets were to increase or decrease by 10%, the Company would incur an associated increase or decrease in net loss and comprehensive loss of approxi-mately $28,221 (2017 - $2,823). See Note 8 for additional details regarding the fair value of investments and marketable securities.
SUMMARY OF OUTSTANDING SHARE DATAThe Company had the following securities issued and outstanding as at September 24, 2018:
Securities (1)
Units Outstanding
Issued and outstanding common shares 960,962,079Stock options 42,824,768Warrants 23,019,275Restricted share units 2,718,527Convertible debentures 17,892,131
(1) See the Company’s Consolidated Financial Statements Note 17 “Convertible Debentures”, Note 19 “Share Capital and Warrants”, and Note 20 “Share-based Payments” for a detailed description of these securities.
RISK FACTORSThis section discusses factors relating to the business of Company that should be considered by both existing and potential investors. The information in this section is intended to serve as an overview and should not be considered comprehensive and the Company may face risks and uncertainties not discussed in this section, or not currently known to us, or that we deem to be immaterial. All risks to the Company’s business have the potential to influence its operations in a materially adverse manner.
Reliance on Licensing
The ability of Aurora to continue its business of growth, storage and distribution of medical mari-juana is dependent on the good standing of all licenses, including the licenses to produce and sell cannabis oil products, and adherence to all regulatory requirements related to such activities. Any failure to comply with the terms of the licenses, or to renew the licenses after their expiry dates, would have a material adverse impact on the financial condition and operations of the business of the Company. Although the Company believes that it will meet the requirements of the ACMPR for future extensions or renewals of the licenses, there can be no assurance that Health Canada will extend or renew the licenses, or if extended or renewed, that they will be extended or renewed on the same or similar terms. Should Health Canada not extend or renew the licenses, or should they renew the licenses on different terms, the business, financial condition and operating results of the Company would be materially adversely affected.
Change in Law, Regulations and Guidelines
Aurora’s business is subject to a variety of laws, regulations and guidelines relating to marketing, acquisition, manufacture, management, transportation, storage, sale and disposal of medical mari-juana but also laws and regulations relating to health and safety, the conduct of operations and the
Management’s Discussion & Analysis 49

protection of the environment. Changes to such laws, regulations and guidelines may cause adverse effects to the Company’s operations.
The Liberal Party of Canada, which has formed the current federal Government of Canada, has made electoral commitments to legalize, regulate and tax recreational cannabis use in Canada. On April 13, 2017, the Government of Canada introduced the Cannabis Act. On June 19, 2018, Prime Minister Justin Trudeau announced that the Cannabis Act and its regulations will come into force in Canada on October 17, 2018, on order to provide the provinces and territories time to prepare for retail sales. The Cannabis Act passed its final legislative step and received Royal Assent on June 21, 2018.
The legislative framework pertaining to the Canadian recreational cannabis market will be subject to significant provincial and territorial regulation, which will vary across provinces and territories and result in an asymmetric regulatory and market environment, different competitive pressures and significant additional compliance and other costs and/or limitations on the Company’s ability to participate in such market.
Regulatory Risk
Achievement of the Company’s business objectives are contingent, in part, upon compliance with the regulatory requirements, including those imposed by Health Canada, enacted by these gov-ernment authorities and obtaining all regulatory approvals, where necessary, for the sale of its products. Aurora cannot predict the time required to secure all appropriate regulatory approvals for its products, or the extent of testing and documentation that may be required by government authorities. Any delays in obtaining, or failure to obtain regulatory approvals would significantly delay the development of markets and products and could have a material adverse effect on the Company’s business, results of operation and financial condition.
Limited Operating History and No Assurance of Profitability
The Company is subject to all of the business risks and uncertainties associated with any early-stage enterprise, including under-capitalization, cash shortages, limitation with respect to personnel, financial and other resources, and lack of revenues.
The Company has incurred operating losses in recent periods. The Company may not be able to achieve or maintain profitability and may continue to incur significant losses in the future. In addition, the Company expects to continue to increase operating expenses as it implements initia-tives to grow its business. If the Company’s revenues do not increase to offset these expected increases in costs and operating expenses, the Company will not be profitable. There is no assur-ance that the Company will be successful in achieving a return on shareholders’ investments and the likelihood of success must be considered in light of the early stage of operations.
Unfavourable Publicity or Consumer Perception
The success of the medical marijuana industry may be significantly influenced by the public’s perception of marijuana’s medicinal applications. Medical marijuana is a controversial topic, and there is no guarantee that future scientific research, publicity, regulations, medical opinion and public opinion relating to medical marijuana will be favourable. The medical marijuana industry is an early-stage business that is constantly evolving with no guarantee of viability. The market for medical marijuana is uncertain, and any adverse or negative publicity, scientific research, limiting regulations, medical opinion and public opinion relating to the consumption of medical marijuana may have a material adverse effect on our operational results, consumer base and financial results.
50 Aurora Cannabis Inc. 2018 Annual Report

Competition
The market for the Company’s products does appear to be sizeable and Health Canada has only issued a limited number of licenses under the ACMPR to produce and sell medical marijuana. As a result, the Company expects significant competition from other companies due to the recent nature of the ACMPR regime. A large number of companies appear to be applying for production licenses, some of which may have significantly greater financial, technical, marketing and other resources, may be able to devote greater resources to the development, promotion, sale and support of their products and services, and may have more extensive customer bases and broader customer relationships.
Should the size of the medical marijuana market increase as projected the demand for products will increase as well, and in order for the Company to be competitive it will need to invest significantly in research and development, market development, marketing, production expansion, new client identification, distribution channels and client support. If the Company is not successful in achieving sufficient resources to invest in these areas, the Company’s ability to compete in the market may be adversely affected, which could materially and adversely affect the Company’s business, its financial conditions and operations.
Realization of Growth Targets
The Company’s ability to continue production of marijuana is affected by a number of factors, including plant design errors, non-performance by third party contractors, increases in materials or labour costs, construction performance falling below expected levels of output or efficiency, environmental pollution, contractor or operator errors, breakdowns, aging or failure of equipment or processes, labour disputes, as well as factors specifically related to indoor agricultural practices, such as reliance on provision of energy and utilities to the facility, and potential impacts of major incidents or catastrophic events on the facility, such as fires, explosions, earthquakes or storms.
Additional Financing
There is no guarantee that the Company will be able to execute on its strategy. The continued devel-opment of the Company may require additional financing. The failure to raise such capital could result in the delay or indefinite postponement of current business strategy or the Company ceasing to carry on business. There can be no assurance that additional capital or other types of financing will be available if needed or that, if available, the terms of such financing will be favorable to the Company. If additional funds are raised through issuances of equity or convertible debt securities, existing shareholders could suffer significant dilution. In addition, from time to time, the Company may enter into transactions to acquire assets or the shares of other companies. These transactions may be financed wholly or partially with debt, which may temporarily increase the Company’s debt levels above industry standards. Any debt financing secured in the future could involve restrictive covenants relating to capital raising activities and other financial and operational matters, which may make it more difficult for the Company to obtain additional capital and to pursue business opportunities, including potential acquisitions. Debt financings may contain provisions, which, if breached, may entitle lenders to accelerate repayment of loans and there is no assurance that the Company would be able to repay such loans in such an event or prevent the enforcement of security granted pursuant to such debt financing. The Company may require additional financing to fund its operations to the point where it is generating positive cash flows. Negative cash flow may restrict the Company’s ability to pursue its business objectives.
Uninsured or Uninsurable Risk
The Company may be subject to liability for risks against which it cannot insure or against which the Company may elect not to insure due to the high cost of insurance premiums or other factors. The payment of any such liabilities would reduce the funds available for the Company’s normal
Management’s Discussion & Analysis 51

business activities. Payment of liabilities for which the Company does not carry insurance may have a material adverse effect on the Company’s financial position and operations.
Key Personnel
The Company’s success will depend on its directors’ and officers’ ability to develop and execute on the Company’s business strategies and manage its ongoing operations, and on the Company’s ability to attract and retain key quality assurance, scientific, sales, public relations and marketing staff or consultants now that production and selling operations have begun. The loss of any key personnel or the inability to find and retain new key persons could have a material adverse effect on the Company’s business. Competition for qualified technical, sales and marketing staff, as well as officers and directors can be intense, and no assurance can be provided that the Company will be able to attract or retain key personnel in the future, which may adversely impact the Company’s operations.
Jurisdictions Outside of Canada
The Company intends to expand its operations and business into jurisdictions outside of Canada. There can be no assurance that any market for the Company’s products will develop in any such foreign jurisdiction. The Company may face new or unexpected risks or significantly increase its exposure to one or more existing risk factors, including economic instability, changes in laws and regulations and the effects of competition. These factors may limit the Company’s capability to suc-cessfully expand its operations and may have a material adverse effect on the Company’s business, financial condition and results of operations.
Strategic Alliances
The Company currently has, and may in the future enter into, strategic alliances with third parties that the Company believes will complement or augment its existing business. Aurora’s ability to complete strategic alliances is dependent upon, and may be limited by, the availability of suitable candidates and capital. In addition, strategic alliances could present unforeseen integration obsta-cles or costs, may not enhance our business, and may involve risks that could adversely affect the Company, including significant amounts of management time that may be diverted from operations in order to pursue and complete such transactions or maintain such strategic alliances. Future strategic alliances could result in the incurrence of additional debt, costs and contingent liabilities, and there can be no assurance that future strategic alliances will achieve, or that the Company’s existing strategic alliances will continue to achieve, the expected benefits to the Company’s business or that the Company will be able to consummate future strategic alliances on satisfac-tory terms, or at all. Any of the foregoing could have a material adverse effect on the Company’s business, financial condition and results of operations.
Product Liability Claims
As a manufacturer and distributor of products designed to be ingested by humans, the Company faces an inherent risk of exposure to product liability claims, regulatory action and litigation if its products are alleged to have caused significant loss or injury. In addition, the manufacture and sale of cannabis products for medical purposes involves the risk of injury to consumers due to tampering by unauthorized third parties or product contamination. Previously unknown adverse reactions resulting from human consumption of cannabis products alone or in combination with other medi-cations or substances could occur. The Company may be subject to various product liability claims, including, among others, that the products produced by the Company caused or contributed to injury or illness, include inadequate instructions for use or include inadequate warnings concerning possible side effects or interactions with other substances. A product liability claim or regulatory action against the Company could result in increased costs, could adversely affect the Company’s reputation and goodwill with its patients and consumers generally, and could have a material adverse effect on the Company’s business, financial condition and results of operations. There can
52 Aurora Cannabis Inc. 2018 Annual Report

be no assurances that the Company will be able to obtain or maintain product liability insurance on acceptable terms or with adequate coverage against potential liabilities. Such insurance is expen-sive and may not be available in the future on acceptable terms, or at all. The inability to obtain sufficient insurance coverage on reasonable terms or to otherwise protect against potential product liability claims could prevent or inhibit the commercialization of products.
Product Recalls and Returns
Manufacturers and distributors of products are sometimes subject to the recall or return of their products for a variety of reasons, including product defects, such as contamination, unintended harmful side effects or interactions with other substances, packaging safety and inadequate or inaccurate labeling disclosure. If any of the products produced by the Company are recalled due to an alleged product defect or for any other reason, the Company could be required to incur the unexpected expense of the recall and any legal proceedings that might arise in connection with the recall. The Company may lose a significant amount of sales and may not be able to replace those sales at an acceptable margin or at all. In addition, a product recall may require significant management attention. Although Aurora has detailed procedures in place for testing finished products, there can be no assurance that any quality, potency or contamination problems will be detected in time to avoid unforeseen product recalls, regulatory action or lawsuits, whether frivo-lous or otherwise. Additionally, if any of the products produced by Aurora were subject to recall, the reputation and goodwill of that product and/or the Company could be harmed. A recall for any of the foregoing reasons could lead to decreased demand for products produced by Aurora and could have a material adverse effect on the Company’s business, financial condition and results of operations. Additionally, product recalls may lead to increased scrutiny of the operations of Aurora by Health Canada or other regulatory agencies, requiring further management attention, increased compliance costs and potential legal fees, fines, penalties and other expenses. Furthermore, any product recall affecting the medical cannabis industry more broadly could lead consumers to lose confidence in the safety and security of the products sold by Licensed Producers generally, which could have a material adverse effect on the Company’s business, financial condition and results of operations.
New Product Development
The medical cannabis industry is, and the recreational cannabis industry will be, in its early stages of development and it is likely that the Company, and its competitors, will seek to introduce new products in the future. In attempting to keep pace with any new market developments, the Company may need to expend significant amounts of capital in order to successfully develop and generate revenues from new products introduced by the Company. As well, the Company may be required to obtain additional regulatory approvals from Health Canada and any other applicable regula-tory authority, which may take significant amounts of time. The Company may not be successful in developing effective and safe new products, bringing such products to market in time to be effectively commercialized, or obtaining any required regulatory approvals, which, together with any capital expenditures made in the course of such product development and regulatory approval processes, may have a material adverse effect on the Company’s business, financial condition and results of operations.
Conflict of Interest
Certain of the Company’s directors and officers are also directors and officers in other companies. Situations may arise in connection with potential acquisitions or opportunities where the other interests of these directors and officers conflict with or diverge from the Company interests. In accordance with the BCBCA, directors who have a material interest in any person who is a party to a material contract or a proposed material contract are required, subject to certain exceptions, to disclose that interest and generally abstain from voting on any resolution to approve the contract.
Management’s Discussion & Analysis 53
Litigation
The Company may become party to litigation, mediation and/or arbitration from time to time in the ordinary course of business which could adversely affect its business. Monitoring and defending against legal actions, whether or not meritorious, can be time-consuming, divert management’s attention and resources and cause the Company to incur significant expenses. In addition, legal fees and costs incurred in connection with such activities may be significant and we could, in the future, be subject to judgements or enter into settlements of claims for significant monetary damages. While the Company has insurance that may cover the costs and awards of certain types of litigation, the amount of insurance may not be sufficient to cover any costs or awards. Substantial litigation costs or an adverse result in any litigation may adversely impact the Company’s business, operating results or financial condition.
Agricultural Operations
Since the Company’s business will revolve mainly around the growth of medical marijuana, an agricultural product, the risks inherent with agricultural businesses will apply. Such risks may include disease and insect pests, among others. Although the Company expects to grow its product in a climate controlled, monitored, indoor location, there is no guarantee that changes in outside weather and climate will not adversely affect production. Further, any rise in energy costs may have a material adverse effect on the Company’s ability to produce medical marijuana.
Transportation Disruptions
The Company will depend on fast, cost-effective and efficient courier services to distribute its product. Any prolonged disruption of this courier service could have an adverse effect on the finan-cial condition and results of operations of the Company. Rising costs associated with the courier service used by the Company to ship its products may also adversely impact the business of the Company and its ability to operate profitably.
Fluctuating Prices of Raw Materials
The Company’s revenues are in a large part derived from the production, sale and distribution of marijuana. The price of production, sale and distribution of marijuana will fluctuate widely due to how young the marijuana industry is and is affected by numerous factors beyond the Company’s control including international, economic and political trends, expectations of inflation, currency exchange fluctuations, interest rates, global or regional consumptive patterns, speculative activi-ties and increased production due to new production and distribution developments and improved production and distribution methods. The effect of these factors on the price of product produced by the Company and, therefore, the economic viability of any of the Company’s business, cannot accurately be predicted.
Environmental and Employee Health and Safety Regulations
The Company’s operations are subject to environmental and safety laws and regulations con-cerning, among other things, emissions and discharges to water, air and land, the handling and disposal of hazardous and non-hazardous materials and wastes, and employee health and safety. The Company will incur ongoing costs and obligations related to compliance with environmental and employee health and safety matters. Failure to obtain an Environmental Compliance Approval or otherwise comply with environmental and safety laws and regulations may result in additional costs for corrective measures, penalties or in restrictions on our manufacturing operations. In addition, changes in environmental, employee health and safety or other laws, more vigorous enforcement thereof or other unanticipated events could require extensive changes to the Company’s operations or give rise to material liabilities, which could have a material adverse effect on the business, results of operations and financial condition of the Company.
54 Aurora Cannabis Inc. 2018 Annual Report

Intellectual Property
The success of the Company’s business depends in part on its ability to protect its ideas and tech-nology. Aurora has applied for a patent for Aurora Envoy™ in August 2017. AMI has also applied to register the trademark “AURORA” and has received an approval notice from the Canadian Intellectual Property Office. CanvasRx has registered a trademark for “CanvasRx”. Even if the Company moves to protect its technology with trademarks, patents, copyrights or by other means, Aurora is not assured that competitors will not develop similar technology or business methods or that Aurora will be able to exercise its legal rights. Other countries may not protect intellectual property rights to the same standards as does Canada. Actions taken to protect or preserve intel-lectual property rights may require significant financial and other resources such that said actions have a meaningful impact our ability to successfully grow our business.
Political and Economic Instability
The Company may be affected by possible political or economic instability. The risks include, but are not limited to, terrorism, military repression, extreme fluctuations in currency exchange rates and high rates of inflation. Changes in medicine and agriculture development or investment policies or shifts in political attitude in certain countries may adversely affect the Company’s business. Operations may be affected in varying degrees by government regulations with respect to restric-tions on production, distribution, price controls, export controls, income taxes, expropriation of property, maintenance of assets, environmental legislation, land use, land claims of local people and water use. The effect of these factors cannot be accurately predicted.
Growth Expansion Efforts
There is no guarantee that the Company’s intentions to acquire and/or construct additional cannabis production and manufacturing facilities in Canada and in other jurisdictions with federal legal cannabis markets, and to expand the Company’s marketing and sales initiatives will be successful. Any such activities will require, among other things, various regulatory approvals, licenses and permits (such as additional site licenses from Health Canada under the ACMPR, as applicable) and there is no guarantee that all required approvals, licenses and permits will be obtained in a timely fashion or at all. There is also no guarantee that the Company will be able to complete any of the foregoing activities as anticipated or at all. The failure of the Company to successfully execute its expansion strategy (including receiving required regulatory approvals and permits) could adversely affect the Company’s business, financial condition and results of operations and may result in the Company failing to meet anticipated or future demand for its cannabis-based pharmaceutical products, when and if it arises.
In addition, the construction of Aurora Sky, Aurora Sun and Aurora Nordic 2 is subject to various potential problems and uncertainties, and may be delayed or adversely affected by a number of factors beyond its control, including the failure to obtain regulatory approvals, permits, delays in the delivery or installation of equipment by our suppliers, difficulties in integrating new equipment with its existing facilities, shortages in materials or labor, defects in design or construction, diver-sion of management resources, or insufficient funding or other resource constraints. Moreover, actual costs for construction may exceed the Company’s budgets. As a result of construction delays, cost overruns, changes in market circumstances or other factors, the Company may not be able to achieve the intended economic benefits from the construction of the new facilities, which in turn may materially and adversely affect its business, prospects, financial condition and results of operations.
Execution of Future Acquisitions or Dispositions
Material acquisitions, dispositions and other strategic transactions involve a number of risks, including: (i) potential disruption of the Company’s ongoing business; (ii) distraction of
Management’s Discussion & Analysis 55

management; (iii) the Company may become more financially leveraged; (iv) the anticipated benefits and cost savings of those transactions may not be realized fully or at all or may take longer to realize than expected; (v) increasing the scope and complexity of the Company’s operations, and (vi) loss or reduction of control over certain of the Company’s assets.
The presence of one or more material liabilities of an acquired company that are unknown to the Company at the time of acquisition could have a material adverse effect on the results of opera-tions, business prospects and financial condition of the Company. A strategic transaction may result in a significant change in the nature of the Company’s business, operations and strategy. In addition, the Company may encounter unforeseen obstacles or costs in implementing a strategic transaction or integrating any acquired business into the Company’s operations.
Market Risk for Securities
The market price for the Common Shares of the Company could be subject to wide fluctuations. Factors such as commodity prices, government regulation, interest rates, share price movements of peer companies and competitors, as well as overall market movements, may have a significant impact on the market price of the Company. The stock market has from time to time experi-enced extreme price and volume fluctuations, which have often been unrelated to the operating performance of particular companies.
Global Economy Risk
An economic downturn of global capital markets has been shown to make the raising of capital by equity or debt financing more difficult. The Company will be dependent upon the capital markets to raise additional financing in the future, while it establishes a user base for its products. As such, the Company is subject to liquidity risks in meeting its development and future operating cost require-ments in instances where cash positions are unable to be maintained or appropriate financing is unavailable. These factors may impact the Company’s ability to raise equity or obtain loans and other credit facilities in the future and on terms favorable to the Company and its management. If uncertain market conditions persist, the Company’s ability to raise capital could be jeopardized, which could have an adverse impact on the Company’s operations and the trading price of the Company’s shares on the Exchange.
Dividend Risk
The Company has not paid dividends in the past and does not anticipate paying dividends in the near future. The Company expects to retain its earnings to finance further growth and, when appropriate, retire debt.
Volatile Market Price for Company Common Shares
The market price for Common Shares may be volatile and subject to wide fluctuations in response to numerous factors, many of which are beyond the Company’s control, including the following:
• actual or anticipated fluctuations in the Company’s quarterly results of operations;• recommendations by securities research analysts;• changes in the economic performance or market valuations of companies in the industry in which
the Company operates;• addition or departure of the Company’s executive officers and other key personnel;• release or expiration of transfer restrictions on outstanding Company Common Shares;• sales or perceived sales of additional Company Common Shares;• operating and financial performance that vary from the expectations of management, securities
analysts and investors;• regulatory changes affecting the Company’s industry generally and its business and operations;
56 Aurora Cannabis Inc. 2018 Annual Report

• announcements of developments and other material events by the Company or its competitors;• fluctuations to the costs of vital production materials and services;• changes in global financial markets and global economies and general market conditions, such
as interest rates and pharmaceutical product price volatility;• significant acquisitions or business combinations, strategic partnerships, joint ventures or capital
commitments by or involving the Company or its competitors;• operating and share price performance of other companies that investors deem comparable to
the Company or from a lack of market comparable companies; and• news reports relating to trends, concerns, technological or competitive developments, regulatory
changes and other related issues in the Company’s industry or target markets.
Financial markets have recently experienced significant price and volume fluctuations that have particularly affected the market prices of equity securities of companies and that have often been unrelated to the operating performance, underlying asset values or prospects of such companies. Such volatility has been particularly evident with regards to the share prices of medical cannabis companies that are public issuers in Canada. Accordingly, the market price of Company Common Shares may decline even if the Company’s operating results, underlying asset values or pros-pects have not changed. Additionally, these factors, as well as other related factors, may cause decreases in asset values that are lasting and not temporary, which may result in impairment losses. There can be no assurance that continuing fluctuations in share price and volume will not occur. If such increased levels of volatility and market turmoil continue, the Company’s operations could be adversely impacted, and the trading price of Company Common Shares may be materially adversely affected.
Breaches of Security
Given the nature of the Company’s product and its lack of legal availability outside of channels approved by the Government of Canada, as well as the concentration of inventory in its facilities, despite meeting or exceeding Health Canada’s security requirements, there remains a risk of shrinkage as well as theft. A security breach at one of the Company’s facilities could expose the Company to additional liability and to potentially costly litigation, increase expenses relating to the resolution and future prevention of these breaches and may deter potential patients from choosing the Company’s products.
In addition, Aurora collects and stores personal information about its patients and is responsible for protecting that information from privacy breaches. A privacy breach may occur through procedural or process failure, information technology malfunction, or deliberate unauthorized intrusions. Theft of data for competitive purposes, particularly patient lists and preferences, is an ongoing risk whether perpetrated via employee collusion or negligence or through deliberate cyber-attack. Any such theft or privacy breach would have a material adverse effect on the Company’s business, financial condition and results of operations.
Furthermore, there are a number of federal and provincial laws protecting the confidentiality of certain patient health information, including patient records, and restricting the use and disclo-sure of that protected information. In particular, the privacy rules under the Personal Information Protection and Electronics Documents Act (Canada) (“PIPEDA”) protect medical records and other personal health information by limiting their use and disclosure of health information to the minimum level reasonably necessary to accomplish the intended purpose. If the Company was found to be in violation of the privacy or security rules under PIPEDA or other laws protecting the confidentiality of patient health information, it could be subject to sanctions and civil or criminal penalties, which could increase its liabilities, harm its reputation and have a material adverse effect on the business, results of operations and financial condition of the Company.
Management’s Discussion & Analysis 57

Information Technology Risks
The Company has entered into agreements with third parties for hardware, software, telecom-munications and other information technology (“IT”) services in connection with its operations. The Company’s operations depend, in part, on how well it and its suppliers protect networks, equip-ment, IT systems and software against damage from a number of threats, including, but not limited to, cable cuts, damage to physical plants, natural disasters, intentional damage and destruction, fire, power loss, hacking, computer viruses, vandalism and theft. The Company’s operations also depend on the timely maintenance, upgrade and replacement of networks, equipment, IT systems and software, as well as pre-emptive expenses to mitigate the risks of failures. Any of these and other events could result in information system failures, delays and/or increase in capital expenses. The failure of information systems or a component of information systems could, depending on the nature of any such failure, adversely impact the Company’s reputation and results of operations.
The Company has not experienced any material losses to date relating to cyber-attacks or other information security breaches, but there can be no assurance that the Company will not incur such losses in the future. The Company’s risk and exposure to these matters cannot be fully mitigated because of, among other things, the evolving nature of these threats. As a result, cyber security and the continued development and enhancement of controls, processes and practices designed to protect systems, computers, software, data and networks from attack, damage or unauthorized access is a priority. As cyber threats continue to evolve, the Company may be required to expend additional resources to continue to modify or enhance protective measures or to investigate and remediate any security vulnerabilities.
Holding Company Status
The Company is a holding company and essentially all of its operating assets are the capital stock of its subsidiaries. As a result, investors in the Company are subject to the risks attributable to its subsidiaries. As a holding company, the Company conducts substantially all of its business through its subsidiaries, which generate substantially all of its revenues. Consequently, the Company’s cash flows and ability to complete current or desirable future enhancement opportunities are dependent on the earnings of its subsidiaries and the distribution of those earnings to the Company. The ability of these entities to pay dividends and other distributions will depend on their operating results and will be subject to applicable laws and regulations which require that solvency and capital standards be main-tained by such companies and contractual restrictions contained in the instruments governing their debt. In the event of a bankruptcy, liquidation or reorganization of any of the Company’s subsidiaries, holders of indebtedness and trade creditors will generally be entitled to payment of their claims from the assets of those subsidiaries before any assets are made available for distribution to the Company.
Integration of MedReleaf
It is expected that the acquisition of MedReleaf will result in enhanced production capacity, increased earnings and cost savings by taking advantage of operating and other synergies to be realized from the consolidation of MedReleaf and the Company and enhanced growth opportunities for the combined company. These anticipated benefits will depend in part on whether MedReleaf and the Company’s operations can be integrated in an efficient and effective manner. The integra-tion of the two companies will present challenges to management, including the integration of systems and personnel of the two companies, and special risks, including possible unanticipated liabilities, unanticipated costs, and the loss of key employees. The performance of operations acquired from the Company from the acquisition of MedReleaf could be adversely affected if the combined company cannot retain key employees to assist in the integration and operation of the Company and MedReleaf. As a result of these factors, it is possible that the cost reductions and synergies expected from the combination of MedReleaf the Company will not be realized.
58 Aurora Cannabis Inc. 2018 Annual Report

INTERNAL CONTROLS OVER FINANCIAL REPORTINGIn accordance with National Instrument 52-109 Certification of Disclosure in Issuers’ Annual and Interim Filings (“NI 52-109”), the establishment and maintenance of Disclosure Controls and Procedures (“DCP”) and Internal Control Over Financial Reporting (“ICFR”) is the responsibility of management. The DCP and ICFR have been designed by management based on the 2013 Internal Control Integrated Framework issued by the Committee of Sponsoring Organizations of the Treadway Commission (“COSO”) to provide reasonable assurance that the Company’s financial reporting is reliable and that its financial statements have been prepared in accordance with IFRS.
Pursuant to NI 52-109, the Company has limited the scope of the design of DCP and ICFR to exclude controls, policies and procedures over entities acquired by the Company not more than 365 days before the end of the financial period. These recently acquired entities include BCNL and UCI (acquired September 29, 2017), Hempco Food and Fiber Inc. (acquired November 14, 2017 with 52.3% interest held at June 30, 2018), H2 Biopharma Inc. (acquired November 30, 2017), Larssen Ltd. (acquired December 4, 2017), Aurora Nordic Cannabis A/S (51% interest acquired February 12, 2018) and CanniMed Therapeutics Inc. (acquired March 15, 2018). Additionally, the Company does not have a reasonable basis for making the representations on the adequacy of internal controls for Hempco, which is proportionately consolidated based on the Company’s percentage ownership interest as of June 30, 2018, as it does not have sufficient access to design and evaluate those controls, policies and procedures carried out by that subsidiary. Excluding goodwill and intangible assets generated from these acquisitions, on a combined basis, BCNL, UCI, Hempco, H2, Larssen, Aurora Nordic and CanniMed represent approximately 22% of the Company’s current assets, 6% of total assets, 14% current liabilities, 11% total liabilities, 35% revenue, and 12% net loss for the twelve months ended June 30, 2018.
Regardless of how well the DCP and ICFR are designed, internal controls have inherent limitations and can only provide reasonable assurance that the controls are meeting the Company’s objectives in providing reliable financial reporting information in accordance with IFRS. These inherent limita-tions include, but are not limited to, human error and circumvention of controls and as such, there can be no assurance that the controls will prevent or detect all misstatements due to errors or fraud, if any.
Based on the COSO control framework, the CEO and CFO concluded that the design and opera-tion of DCP and ICFR as at June 30, 2018 were effective and provides reasonable assurance that material information relating to the Company is made known to them, information required to be disclosed by the Company is reported within the required time periods as specified in such legislation, and that the Company’s financial reporting is reliable and its financial statements have been prepared in accordance with IFRS. The CEO and CFO are also responsible for disclosing any changes to the Company’s internal controls during the most recent period that have materially affected, or are reasonably likely to materially affect, its internal control over financial reporting. There have been no changes to the Company’s internal control over financial reporting during the three months ended June 30, 2018 that have materially affected, or are likely to materially affect, the Company’s internal control over financial reporting.
Management’s Discussion & Analysis 59

FORWARD-LOOKING STATEMENTS This MD&A may contain “forward-looking information” within the meaning of Canadian securi-ties legislation (“forward-looking statements”). These forward-looking statements are made as of the date of this MD&A and the Company does not intend, and does not assume any obligation, to update these forward-looking statements, except as required under applicable securities leg-islation. Forward-looking statements relate to future events or future performance and reflect Company management’s expectations or beliefs regarding future events. In certain cases, forward-looking statements can be identified by the use of words such as “plans”, “expects” or “does not expect”, “is expected”, “budget”, “scheduled”, “estimates”, “forecasts”, “intends”, “anticipates” or “does not anticipate”, or “believes”, or variations of such words and phrases or statements that certain actions, events or results “may”, “could”, “would”, “might” or “will be taken”, “occur” or “be achieved” or the negative of these terms or comparable terminology. In this document, certain forward-looking statements are identified by words including “may”, “future”, “expected”, “intends” and “estimates”. By their very nature forward-looking statements involve known and unknown risks, uncertainties and other factors which may cause the actual results, performance or achievements of the Company to be materially different from any future results, performance or achievements expressed or implied by the forward-looking statements. The Company provides no assurance that forward-looking statements will prove to be accurate, as actual results and future events could differ materially from those anticipated in such statements. Accordingly, readers should not place undue reliance on forward-looking statements.
Certain forward-looking statements in this MD&A include, but are not limited to the following:
• pro forma measures including revenue, registered medical patients and grams produced; • the completion of construction of production facilities, associated costs, and receipt of licenses from
Health Canada to produce and sell cannabis and cannabis related products from these facilities; • the successful integration of CanniMed and MedReleaf into Aurora’s operations;• strategic investments and capital expenditures, and related benefits;• future growth expansion plans;• expectations regarding production capacity, costs and yields; and • product sales expectation and corresponding forecasted increase in revenue.
The above and other aspects of the Company’s anticipated future operations are forward-looking in nature and, as a result, are subject to certain risks and uncertainties. Although the Company believes that the expectations reflected in these forward-looking statements are reasonable, undue reliance should not be placed on them as actual results may differ materially from the forward-looking statements. Such forward-looking statements are estimates reflecting the Company’s best judgement based upon current information and involve a number of risks and uncertainties, and there can be no assurance that other factors will not affect the accuracy of such forward-looking statements. Such factors include but are not limited to the Company’s ability to obtain the necessary financing and the general impact of financial market conditions, the yield from marijuana growing operations, product demand, changes in prices of required commodities, competition, government regulations and other risks as set out under “Risk Factors” in the Company’s Annual Information Form dated September 24, 2018 filed on SEDAR at www.sedar.com.
60 Aurora Cannabis Inc. 2018 Annual Report

Table Of Contents
Management’s Responsibility for Financial Reporting 62
Independent Auditors’ Report 63
Consolidated Statements of Financial Position 64
Consolidated Statements of Comprehensive Income (Loss) 65
Consolidated Statements of Changes in Equity 66
Consolidated Statements of Cash Flows 68
Notes to the Consolidated Financial Statements 70
CONSOLIDATED FINANCIAL STATEMENTS
Financial Statements 61

Management’s Responsibility for Financial Reporting
To the Shareholders of Aurora Cannabis Inc.:
Management is responsible for the preparation and presentation of the accompanying consolidated financial statements, including responsibility for significant accounting judgements and estimates in accordance with International Financial Reporting Standards and ensuring that all information in the annual report is consistent with the statements. This responsibility includes selecting appro-priate accounting principles and methods, and making decisions affecting the measurement of transactions in which objective judgement is required.
In discharging its responsibilities for the integrity and fairness of the consolidated financial state-ments, management designs and maintains the necessary accounting systems and related internal controls to provide reasonable assurance that transactions are authorized, assets are safeguarded, and financial records are properly maintained to provide reliable information for the preparation of consolidated financial statements.
The Board of Directors and Audit Committee are composed primarily of Directors who are neither management nor employees of the Company. The Board is responsible for overseeing manage-ment in the performance of its financial reporting responsibilities, and for approving the financial information included in the annual report. The Board fulfils these responsibilities by reviewing the financial information prepared by management and discussing relevant matters with management and external auditors. The Committee is also responsible for recommending the appointment of the Company’s external auditors.
MNP LLP, an independent firm of Chartered Professional Accountants, is appointed by the share-holders to audit the consolidated financial statements and report directly to them; their report follows. The external auditors have full and free access to, and meet periodically and separately with, both the Committee and management to discuss their audit findings.
September 24, 2018
“Terry Booth” “Glen Ibbott”Terry Booth Chief Executive Officer
Glen Ibbott Chief Financial Officer
62 Aurora Cannabis Inc. 2018 Annual Report


CONSOLIDATED STATEMENTS OF FINANCIAL POSITIONJune 30, 2018 and 2017 (In thousands of Canadian dollars)
Notes June 30, 2018 June 30, 2017$ $
Assets Note 3Current
Cash and cash equivalents 4 89,193 159,715Short term investments 5 990 81Accounts receivable 6, 24(c), 29(a) 15,096 2,312Marketable securities 8 59,188 14,845Biological assets 9 13,620 4,088Inventory 10 29,595 7,703Prepaids and other current assets 7,594 3,126
215,276 191,870 Assets held for distribution to owners 15, 24(c) 4,422 1,736
219,698 193,606Property, plant and equipment 11 246,352 45,523Convertible debenture investment 7 - 11,071Derivatives 8 124,942 292Investment in associates and joint venture 12 334,442 -Intangible assets 16 256,232 31,087Goodwill 16 729,050 41,100Total assets 1,910,716 322,679LiabilitiesCurrent
Accounts payable and accrued liabilities 24(c), 29(b) 47,456 8,753Income taxes payable 1,659 -Deferred revenue 2,266 1,421Loans and borrowings 18 2,451 69Contingent consideration payable 28(e) 21,333 13,221
75,165 23,464Convertible notes 17 191,528 63,536Loans and borrowings 18 9,232 282Deferred gain on convertible debenture 7, 28(d) - 10,206Deferred gain on derivatives 8, 28(d) 2,254 321Deferred tax liability 23 69,406 5,937Total liabilities 347,585 103,746Shareholders’ equity
Share capital 19 1,466,433 221,447Reserves 4,920 20,745Accumulated other comprehensive income (loss) (533) 5,167Retained earnings (deficit) 87,749 (28,426)
Total equity attributable to shareholders of Aurora 1,558,569 218,933Non-controlling interest 13(a)(ii)(iv), 14 4,562 -Total equity 1,563,131 218,933Total liabilities and equity 1,910,716 322,679
Nature of Operations (Note 1)
Commitments and Contingencies (Note 25)
Subsequent Events (Notes 12(a), 15, 18(a) and 31)
The accompanying notes are an integral part of these Consolidated Financial Statements.
64 Aurora Cannabis Inc. 2018 Annual Report

CONSOLIDATED STATEMENTS OF COMPREHENSIVE INCOME (LOSS)Years ended June 30, 2018 and 2017 (In thousands of Canadian dollars, except per share amounts)
Notes 2018 2017$ $
Revenue from sale of goods 46,975 15,922Revenue from provision of services 8,221 2,145Total revenue 55,196 18,067Cost of sales 19,603 7,875Gross profit before fair value adjustments 35,593 10,192Changes in fair value of inventory sold 17,624 16,908Unrealized gain on changes in fair value of biological assets 9 (25,550) (22,772)Gross profit 43,519 16,056Expense
General and administration 24(a) 42,965 6,813Sales and marketing 29,445 10,270Acquisition costs 15,664 1,551Depreciation and amortization 11, 16 12,088 716Research and development 1,679 314Share-based payments 20(a)(b), 24(b) 37,450 7,584
139,291 27,248Loss from operations (95,772) (11,192)Other income (expense)
Interest and other income 2,514 861Finance and other costs 22 (13,162) (6,582)Foreign exchange (1,038) (215)Recovery of receivables 12(d) 1,400 -Share of loss from investment in associate 12 (2,242) -Unrealized loss on changes in contingent consideration fair value 28(e) (7,844) -Unrealized gain (loss) on debenture 7, 28(c) 6,937 (1,135)Unrealized gain on marketable securities 8 20,083 1,334Unrealized gain (loss) on derivatives 8 166,450 (335)
173,098 (6,072)Income (loss) before income taxes 77,326 (17,264)Income tax recovery (expense)
Current 23 (1,659) 19Deferred, net 23 (6,441) 4,277
(8,100) 4,296Net income (loss) 69,227 (12,968)Other comprehensive income (loss)
Deferred tax (55) (885)Unrealized gain (loss) on marketable securities 8 (6,616) 6,077Foreign currency translation gain (loss) 86 (25)
(6,585) 5,167Comprehensive income (loss) 62,642 (7,801)Net income (loss) attributable to:
Aurora Cannabis Inc. 71,936 (12,968)Non-controlling interests (2,709) -
Comprehensive income (loss) attributable to:Aurora Cannabis Inc. 65,351 (7,801)Non-controlling interests (2,709) -
Earnings (loss ) per shareBasic 21 $ 0.16 $ (0.05)Diluted 21 $ 0.15 $ (0.05)
The accompanying notes are an integral part of these Consolidated Financial Statements.
Financial Statements 65

CONSOLIDATED STATEMENTS OF CHANGES IN EQUITY Years ended June 30, 2018 and 2017 (In thousands of Canadian dollars, except share amounts)
Share Capital Reserves AOCI
NoteCommon
Shares Amount
Share-Based
Compen-sation
Compen-sation
Options/Warrants
Con-vertible
Notes
Change in Ownership
InterestTotal
ReservesFair
ValueDeferred
Tax
Foreign Currency
TranslationTotalAOCI Deficit
Non-Controlling
Interests Total
# $ $ $ $ $ $ $ $ $ $ $ $ $
Balance, June 30, 2017 366,549,244 221,447 7,591 3,420 9,734 - 20,745 6,077 (885) (25) 5,167 (28,426) - 218,933
Shares issued for acquisitions and investment in associates 19(b)(i) 78,769,707 825,085 - - - - - - - - - - - 825,085
Warrants issued for acquisition 13(a)(i) - - - 136 - - 136 - - - - - - 136
Shares issued for contingent consideration 19(b)(ii) 5,318,044 16,321 - - - - - - - - - - - 16,321
Private placements 19(b)(iii) 25,000,000 75,000 - - - - - - - - - - - 75,000
Share issue costs 19(b)(iii) - (6,646) - 2,285 - - 2,285 - - - - - - (4,361)
Conversion of notes 19(b)(iv) 42,473,435 177,127 - - (37,061) - (37,061) - - - - - - 140,066
Equity component of convertible notes - - - - 76,201 - 76,201 - - - - - - 76,201
Deferred tax on convertible notes - - - - (7,082) - (7,082) - - - - - - (7,082)
Deferred tax on share issuance and convertible debenture costs - 2,540 - - - - - - - - - - - 2,540
Exercise of stock options
19(b)(iv), 13(a)(ii) 4,809,443 12,006 (6,175) - - - (6,175) - - - - - 2,027 7,858
Exercise of warrants 19(b)(iv) 43,200,881 136,293 - (3,680) - - (3,680) - - - - - 1,669 134,282
Exercise of compensation options/warrants 19(b)(iv) 1,865,249 6,051 - (1,854) - - (1,854) - - - - - - 4,197
Exercise of restricted share units 19(b)(iv) 127,128 1,209 (351) - - - (351) - - - - - - 858
Forfeited options - - (531) - - - (531) - - - - 531 - -
Share-based payments 20 - - 37,801 - - - 37,801 - - - - - - 37,801
Non-controlling interest from acquisitions
13(a)(ii)(iv), 14 - - - - - - - - - - - - 38,577 38,577
Change in ownership interests in subsidiaries
13(a) (ii)(iv) - - - - - (75,514) (75,514) - - - - - (35,002) (110,516)
Unrealized gain on Cann Group marketable securities 8(a) - - - - - - - 43,442 - - 43,442 - - 43,442
Cann Group marketable securities transferred to investments in associates, net tax
8(a), 12(b) - - - - - - - (50,463) - - (50,463) 50,463 - -
Deferred tax for marketable securities transferred to investment in associates - - - - - - - - 830 - 830 (6,755) - (5,925)
Unrealized gain on CanniMed marketable securities 8(b) - - - - - - - 10,423 - - 10,423 - - 10,423
CanniMed marketable securities derecognized upon acquisition of control 8(b) - - - - - - - (10,423) - - (10,423) 10,423 - -
Comprehensive income (loss) for the year - - - - - - - 405 - 86 491 61,513 (2,709) 59,295
Balance, June 30, 2018 568,113,131 1,466,433 38,335 307 41,792 (75,514) 4,920 (539) (55) 61 (533) 87,749 4,562 1,563,131
The accompanying notes are an integral part of these Consolidated Financial Statements.
66 Aurora Cannabis Inc. 2018 Annual Report

Share Capital Reserves AOCI
NoteCommon
Shares Amount
Obligation to Issue Shares
Share-Based
Compen-sation
Compen-sation
Options/Warrants
Related Party
LoansConvert-
ible NotesTotal
ReservesFair
ValueDeferred
Tax
Foreign Currency
TranslationTotalAOCI Deficit Total
# $ $ $ $ $ $ $ $ $ $ $ $ $
Balance, June 30, 2016 135,576,365 17,148 2,335 608 1,184 1,403 200 5,730 - - - - (16,916) 5,962
Shares issued for acquisitions 19(b)(i) 27,091,007 34,540 - - - - - - - - - - - 34,540
Shares issued for contingent consideration 19(b)(ii) 2,926,103 7,408 - - - - - - - - - - - 7,408
Private placements 19(b)(iii) 90,837,500 98,009 - - - - - - - - - - - 98,009
Share issue costs 19(b)(iii) - (10,913) - - 4,630 - - 4,630 - - - - - (6,283)
Deferred tax on share issue costs - 1,846 - - - - - - - - - - - 1,846
Conversion of notes 19(b)(iv) 29,020,319 38,037 - - - - (4,800) (4,800) - - - - - 33,237
Equity component of convertible notes - - - - - - 20,587 20,587 - - - - - 20,587
Equity component of convertible note transaction costs - - - - - - (900) (900) - - - - - (900)
Deferred tax on convertible notes - - - - - - (5,353) (5,353) - - - - - (5,353)
Warrants issued on amendment of convertible notes - - - - 877 - - 877 - - - - - 877
Exercise of stock options 19(b)(iv) 2,001,700 1,399 - (578) - - - (578) - - - - - 821
Exercise of warrants 19(b)(iv) 54,936,306 28,648 - - (2,046) - - (2,046) - - - - - 26,602
Exercise of compensation option/warrants 19(b)(iv) 4,084,434 2,966 - - (1,292) - - (1,292) - - - - - 1,674
Forfeited options & warrants - - - (23) (32) - - (55) - - - - 55 -
Shares issued for compensation 19(b)(v) 25,510 13 (13) - - - - (13) - - - - - -
Performance shares 19(b)(v) 20,000,000 2,322 (2,322) - - - - (2,322) - - - - - -
Shares issued for loan 19(b)(v) 50,000 24 - - - - - - - - - - - 24
Transfer from derivative liabilities - - - - 99 - - 99 - - - - - 99
Reclassification upon repayment of related party loans - - - - - (1,403) - (1,403) - - - - 1,403 -
Share-based payments 20(a) - - - 7,584 - - - 7,584 - - - - - 7,584
Comprehensive income (loss) for the year - - - - - - - - 6,077 (885) (25) 5,167 (12,968) (7,801)
Balance, June 30, 2017 366,549,244 221,447 - 7,591 3,420 - 9,734 20,745 6,077 (885) (25) 5,167 (28,426) 218,933
The accompanying notes are an integral part of these Consolidated Financial Statements.
CONSOLIDATED STATEMENTS OF CHANGES IN EQUITY (CONTINUED)Years ended June 30, 2018 and 2017 (In thousands of Canadian dollars, except share amounts)
Financial Statements 67

CONSOLIDATED STATEMENTS OF CASH FLOWSYears ended June 30, 2018 and 2017 (In thousands of Canadian dollars)
Notes 2018 2017$ $
Cash provided by (used in) Operating activitiesNet income (loss) for the year 69,227 (12,968)Adjustments for non-cash items
Unrealized gain on changes in fair value of biological assets 9 (25,550) (22,772)Changes in fair value included in inventory sold 17,624 16,908Depreciation of property, plant and equipment 11 8,004 1,087Amortization of intangible assets 16 4,256 -Share-based payments 20 37,450 7,584Share of loss from investment in associate 12 2,242 -Unrealized (gain) loss on debentures 7, 28(c) (6,937) 1,135Unrealized (gain) loss on derivatives 8 (166,450) 335Unrealized gain on marketable securities 8 (20,083) (1,334)Loss on changes in fair value of contingent consideration 28(e) 7,844 -Recovery of receivables 12(d) (1,400) -Accrued interest and accretion expense 11,135 3,459Interest and other income (78) (78)Deferred tax expense (recovery) 6,441 (4,277)
Changes in non-cash working capital GST recoverable (6,470) (963)Accounts receivable (5,887) (654)Biological assets 1,447 -Inventory (10,437) (1,679)Prepaid and other current assets (8,236) (2,224)Accounts payable and accrued liabilities 3,105 2,610Income taxes payable 1,659 -Deferred revenue (573) 453
Net cash used in operating activities (81,667) (13,378)
Investing activitiesShort-term investments 5 (399) (81)Marketable securities and derivatives 8 (63,437) (7,877)Convertible debenture 7 - (2,000)Purchase of property, plant and equipment 11 (136,945) (25,718)Acquisition of businesses, net of cash acquired 13 30,393 (6,917)Acquisition of assets 13 (138,722) (6,748)Acquisition of non-controlling interest (10,158) -Loans assumed on acquisition (308) -Additions in investment in associates 12 (218,183) -
Net cash used in investing activities (537,759) (49,341)
Financing activitiesLoans and borrowings 97 (193)Proceeds of convertible notes 17 345,000 115,000Repayment of short term loans (281) (6,215)Repayment of long term loans - (4,000)Financing fees (11,873) (3,430)Shares issued for cash, net of share issue costs 215,606 120,823
Net cash provided by financing activities 548,549 221,985Effect of foreign exchange on cash and cash equivalents 355 190Increase (decrease) in cash and cash equivalents (70,522) 159,456Cash and cash equivalents, beginning of year 159,715 259Cash and cash equivalents, end of year 89,193 159,715
68 Aurora Cannabis Inc. 2018 Annual Report

Notes 2018 2017$ $
Cash and cash equivalents consist of:Cash 75,795 159,715Restricted cash 13,398 -
Supplementary information:Property, plant and equipment in accounts payable 16,294 4,383Capitalized borrowing costs 5,710 1,370Interest paid 7,066 471Interest received 2,295 485
The accompanying notes are an integral part of these Consolidated Financial Statements.
CONSOLIDATED STATEMENTS OF CASH FLOWS (CONTINUED)Years ended June 30, 2018 and 2017 (In thousands of Canadian dollars)
Financial Statements 69

Table Of Contents
Note 1. Nature of Operations 72
Note 2. Significant Accounting Policies and Significant Judgements 72
Note 3. Change in Accounting Policy 76
Note 4. Cash and Cash Equivalents 76
Note 5. Short-term Investments 77
Note 6. Accounts Receivable 77
Note 7. Convertible Debenture Investment 77
Note 8. Marketable Securities and Derivatives 78
Note 9. Biological Assets 84
Note 10. Inventory 86
Note 11. Property, Plant and Equipment 87
Note 12. Investments in Associates and Joint Venture 89
Note 13. Business Combinations and Asset Acquisitions 94
Note 14. Controlling Interest in Aurora Nordic Cannabis A/S (“Aurora Nordic”) 105
Note 15. Assets Held for Distribution to Owners 106
Note 16. Intangible Assets and Goodwill 107
Note 17. Convertible Debentures 110
Note 18. Loans and Borrowings 112
Note 19. Share Capital 114
Note 20. Share-based Payments 119
Note 21. Earnings (Loss) Per Share 122
Note 22. Finance and Other Costs 123
NOTES TO THE CONSOLIDATED FINANCIAL STATEMENTS
70 Aurora Cannabis Inc. 2018 Annual Report

Note 23. Income Taxes 123
Note 24. Related Party Transactions 125
Note 25. Commitments and Contingencies 127
Note 26. Construction Contracts 128
Note 27. Segmented Information 128
Note 28. Fair Value of Financial Instruments 129
Note 29. Financial Instruments Risk 132
Note 30. Capital Management 134
Note 31. Subsequent Events 134
Notes to Financial Statements 71

1. NATURE OF OPERATIONSAurora Cannabis Inc. (the “Company” or “Aurora”) was incorporated under the Business Corporations Act (British Columbia) on December 21, 2006. The Company’s shares are listed on the Toronto Stock Exchange (the “Exchange”) under the symbol “ACB” and on the OTCQX under the symbol “ACBFF”.
The head office and principal address of the Company is Suite 500 – 10355 Jasper Avenue, Edmonton, Alberta, Canada, T5J 1Y6. The Company’s registered and records office address is Suite 1500 - 1055 West Georgia Street, Vancouver, BC V6E 4N7.
The Company’s principal business is the production and distribution of medical cannabis in Canada pursuant to the Access to Cannabis for Medical Purposes Regulations (“ACMPR”) and the distri-bution of wholesale medical cannabis in the European Union pursuant to the German Medicinal Products Act and German Narcotic Drugs Act. During the year ended June 30, 2018, the Company expanded its business to include the production and sale of indoor cultivation systems and hemp related food products through its recent acquisitions (Note 13).
Aurora does not engage in any U.S. cannabis-related activities as defined in Canadian Securities Administrators Staff Notice 51-352. While the Company has held an interest in Australis Holdings LLP (“Australis Holdings” or “AHL”)(Note 12(a)), a U.S. based company, as at June 30, 2018, AHL has not engaged in any cannabis-related activities for the periods ended. Additionally, AHL was spun-out to Aurora shareholders as part of the Australis Capital Inc. spin-out completed subse-quent to June 30, 2018 (Note 15 and 31).
2. SIGNIFICANT ACCOUNTING POLICIES AND SIGNIFICANT JUDGEMENTSCertain of the Company’s accounting policies that relate to the consolidated financial statements as a whole, as well as estimates and judgements it has made and how they affect the amounts reported in the consolidated financial statements, are incorporated in this section. This note also describes new standards, amendments or interpretations that are effective and applied by the Company during 2018 or are not yet effective. Where an accounting policy, estimate, or judgement is applicable to a specific note to the accounts, it is described within that note.
(a) Basis of presentation
The consolidated financial statements of the Company have been prepared in accordance with International Financial Reporting Standards (“IFRS”) as issued by the International Accounting Standards Board (“IASB”) and interpretations of the IFRS Interpretations Committee (“IFRIC”) in effect for the year ended June 30, 2018.
The Company has reclassified certain immaterial items on the comparative consolidated statement of financial position and statement of comprehensive income (loss) to conform with current period’s presentation.
These consolidated financial statements were approved and authorized for issue by the Board of Directors of the Company on September 24, 2018.
72 Aurora Cannabis Inc. 2018 Annual Report

(b) Basis of consolidation
These consolidated financial statements include the accounts of the Company and its subsidiaries with intercompany balances and transactions eliminated on consolidation. Subsidiaries are those entities over which Aurora has the power over the investee, is exposed, or has rights, to variable returns from its involvement with the investee, and has the ability to use its power to affect its returns. As of June 30, 2018, major subsidiaries over which the Company has control include:
Major subsidiaries Percentage ownershipAurora Cannabis Enterprises Inc. (“ACE”) 100%Aurora Deutschland GmbH (“Aurora Deutschland”, formerly Pedanios GmbH) 100%CanniMed Therapeutics Inc. (“CanniMed”) 100%Aurora Nordic Cannabis A/S (“Aurora Nordic”) 100%Aurora Larssen Projects Ltd. (“ALPS”) 100%CanvasRx Inc. (“CanvasRx”) 100%Peloton Pharmaceuticals Inc. (“Peloton” or “Aurora Vie”) 100%H2 Biopharma Inc. (“H2” or “Aurora Eau”) 100%B.C. Northern Lights Enterprises Ltd. (“BCNL”) 100%Urban Cultivator Inc. (“UCI”) 100%Hempco Food and Fiber Inc. (“Hempco”) 52.33%
(c) Basis of measurement
The consolidated financial statements have been prepared on a historical cost basis except for certain financial instruments, biological assets and acquisition related contingent consideration which are measured at fair value.
(d) Functional and presentation of foreign currency
The consolidated financial statements are presented in Canadian dollars unless otherwise noted. The functional currencies of the Company, its subsidiaries and associates are as follows:
Aurora Deutschland GmbH and CanniMed Germany are the European Euro; Aurora Nordic Cannabis A/S is the Danish Krone; Australis Holdings LLP, SubTerra LLC and CTT Pharmaceutical Holdings Ltd. are the US dollar;Cann Group Limited is the Australian dollar; and Aurora and its remaining subsidiaries and associates are the Canadian dollar.
(e) Foreign currency translation
Foreign currency transactions are translated into Canadian dollars at exchange rates in effect on the date of the transactions. Monetary assets and liabilities denominated in foreign currencies at the consolidated statement of financial position date are translated to Canadian dollars at the foreign exchange rate applicable at that date. Realized and unrealized exchange gains and losses are recognized in the consolidated statements of comprehensive income (loss). Non-monetary assets and liabilities that are measured in terms of historical cost in a foreign currency are translated using the exchange rate at the date of the transaction.
The assets and liabilities of foreign operations are translated into Canadian dollars at period end exchange rates. Income and expenses, and cash flows of foreign operations are translated into Canadian dollars using average exchange rates. Exchange differences resulting from the transla-tion of foreign operations are recognized in other comprehensive income (loss) and accumulated in equity.
2. SIGNIFICANT ACCOUNTING POLICIES AND SIGNIFICANT JUDGEMENTS (CONTINUED)
Notes to Financial Statements 73

(f) Revenue recognition
Revenue is recognized at the fair value of consideration received or receivable. Revenue from the sale of goods is recognized when the Company has transferred the significant risks and rewards of ownership to the buyer and it is probable that the Company will receive the previously agreed upon payment. Significant risks and rewards are generally considered to be transferred when the Company has delivered the product to customers.
Referral revenue from Licensed Producers through CanvasRx are recognized when the amount of revenue can be measured reliably, it is probable that the economic benefits associated with the transaction will flow to the entity, the stage of completion of the transaction at the end of the period can be measured reliably, and the costs incurred for the transaction and the costs to complete the transaction can be measured reliably. The stage of completion is generally determined based on the passage of time as services are rendered over time. See Note 26 for the accounting policy for revenue generated from design, engineering and construction consulting services.
(g) Significant accounting judgements, estimates and assumptions
The preparation of the Company’s consolidated financial statements in conformity with IFRS requires management to make judgements, estimates, and assumptions about the carrying amounts of assets and liabilities that are not readily apparent from other sources. The esti-mates and associated assumptions are based on historical experience and other factors that are considered to be relevant. Actual results may differ from these estimates.
The estimates and underlying assumptions are reviewed on an ongoing basis. Revisions to accounting estimates are recognized in the period in which the estimate is revised, if the revision affects only that period, or in the period of the revision and future periods, if the revision affects both current and future periods.
Significant judgements, estimates and assumptions that have the most significant effect on the amounts recognized in the financial statements include accounts receivable (Note 6), biological assets (Note 9), inventory (Note 10), estimated useful lives and depreciation of property, plant and equipment (Note 11) and intangible assets (Note 16), investment in associates and joint ventures (Note 12), business combinations and assets acquisitions (Note 13), disposal group held for distribu-tion (Note 15), goodwill and intangible asset impairment (Note 16), convertible instruments (Note 17), fair value of share purchase warrants (Note 19), share-based payments (Note 20), deferred tax assets (Note 23), segmented information (Note 27) and the fair value of financial instruments (Note 28).
(h) Recent accounting pronouncements
There were no new standards effective July 1, 2017 that had an impact on the Company’s consoli-dated financial statements. The following IFRS standards have been recently issued by the IASB. Pronouncements that are not applicable or where it has been determined do not have a significant impact to the Company have been excluded herein.
(i) IFRS 7 Financial Instruments: Disclosure
IFRS 7 Financial Instruments: Disclosure, was amended to require additional disclosures on transition from IAS 39 to IFRS 9. IFRS 7 is effective on adoption of IFRS 9, which is effective for annual periods commencing on or after January 1, 2018. The Company intends to adopt the amendments to IFRS 7 on July 1, 2018 and does not expect the implementation will result in a significant effect to the financial statements.
2. SIGNIFICANT ACCOUNTING POLICIES AND SIGNIFICANT JUDGEMENTS (CONTINUED)
74 Aurora Cannabis Inc. 2018 Annual Report

(ii) IFRS 9 Financial Instruments
In July 2014, the IASB issued the final version of IFRS 9 Financial Instruments, which reflects all phases of the financial instruments project and replaces IAS 39 Financial Instruments: Recognition and Measurement and all previous versions of IFRS 9. The standard introduces new requirements for classification and measurement, impairment, and hedge accounting. IFRS 9 is effective for annual periods beginning on or after 1 January 2018, with early applica-tion permitted. The Company intends to adopt IFRS 9 on July 1, 2018 retrospectively where the cumulative impact of adoption will be recognized in retained earnings as of July 1, 2018 and comparatives will not be restated.
The Company has completed its assessment of the impact from this new standard. IFRS 9 introduces new requirements to determine the measurement basis of financial assets, involving the cash flow characteristics of assets and the business models under which they are managed. Accordingly, the basis of measurement for the Company’s financial assets may change. IFRS 9 affects the accounting for available-for-sale equity securities, requiring a designation, on an instrument-by-instrument basis, between recording both unrealized and realized gains and losses either through (i) other comprehensive income (“OCI”) with no recycling to profit and loss or (ii) profit and loss. The Company will be electing to classify its available-for-sale equity invest-ments at Fair Value through OCI (“FVOCI”) as these equity investments are for strategic purposes. The FVOCI election is made upon initial recognition, on an instrument-by-instrument basis and once made is irrevocable. Gains and losses on these instruments including when derecognized or sold are recorded in OCI and are not subsequently reclassified to the consolidated statement of comprehensive income (loss).
For other financial instruments, there are no significant changes in the classification and measurement of the Company’s financial assets.
(iii) IFRS 15 Revenue from Contracts with Customers
The IASB replaced IAS 18 Revenue, in its entirety with IFRS 15 Revenue from Contracts with Customers. The standard contains a single model that applies to contracts with customers and two approaches to recognizing revenue: at a point in time or over time. The model features a contract-based five-step analysis of transactions to determine whether, how much and when revenue is recognized. IFRS 15 is effective for annual periods beginning on or after January 1, 2018, with early application permitted.
The Company intends to adopt IFRS 15 on July 1, 2018 using the modified retrospective approach where the cumulative impact of adoption will be recognized in retained earnings as of July 1, 2018 and comparatives will not be restated.
The Company has completed its assessment of the impact from this new standard. Under IFRS 15, revenue from the sale of medicinal cannabis would be recognized at a point in time when control over the goods have been transferred to the customer. The Company transfers control and satisfies its performance obligation upon delivery and acceptance by the customer, which is consistent with the Company’s current revenue recognition policy under IAS 18.
Referral revenues earned from Licensed Producers through CanvasRx Inc. are recognized over a period of time as the referred patients remain active with the Licensed Producers. This is consistent with the Company’s current revenue recognition policy under IAS 18 where revenue is
2. SIGNIFICANT ACCOUNTING POLICIES AND SIGNIFICANT JUDGEMENTS (CONTINUED)(h) Recent accounting pronouncements (Continued)
Notes to Financial Statements 75

recognized on a monthly basis over a specified period of time that the referred patient remains an active purchaser of medical cannabis with the Licensed Producer.
Construction contract revenues earned through Aurora Larssen Projects Ltd. are recognized over a period of time as the performance obligations for design, engineering and construc-tion consulting services are completed. This is consistent with the Company’s current revenue recognition policy under IAS 11 where revenue is recognized based on the stage of completion.
Based on the Company’s assessment, the adoption of this new standard does not have a material impact on its consolidated financial statements.
(iv) IFRS 16 Leases
In January 2016, the IASB issued IFRS 16 Leases, which will replace IAS 17 Leases. This standard introduces a single lessee accounting model and requires a lessee to recognize assets and liabili-ties for all leases with a term of more than twelve months, unless the underlying asset is of low value. A lessee is required to recognize a right-of-use asset representing its right to use the under-lying asset and a lease liability representing its obligation to make lease payments. The standard will be effective for annual periods beginning on or after January 1, 2019, with earlier application permitted for entities that apply IFRS 15 Revenue from Contracts with Customers at or before the date of initial adoption of IFRS 16. The Company intends to adopt IFRS 16 on July 1, 2019 and is assessing the impact of this new standard on its consolidated financial statements.
3. CHANGE IN ACCOUNTING POLICY Effective July 1, 2017, the Company elected to change its accounting policy for step acquisitions of significant influence investments, where the investment classification changes from available-for-sale marketable securities to investment in associates. Previously, the Company had transferred the cost of the equity securities into investments in associates in accordance with IAS 28. IAS 28 allows entities to make an accounting policy choice to transfer in the equity securities at either cost or at fair value. Management determined that the transfer of equity securities at fair value into investment in associ-ates would provide more relevant information as it better reflects the fair value of the investment at the time of the transaction. As such, management changed the accounting policy to transfer equity securities from marketable securities to investment in associates at fair value.
See Note 12 for the Company’s revised accounting policy on step acquisitions of significant influence investments, from available-for-sale marketable securities to investments in associates.
There was no impact of this voluntary change in accounting policy on prior period amounts.
4. CASH AND CASH EQUIVALENTS
Accounting PolicyCash and cash equivalents are classified as loans and receivable financial assets and are measured initially at fair value and subsequently on an amortized cost basis. Cash and cash equivalents include restricted cash, cash deposits in financial institutions and other deposits that are readily convertible into cash.
As of June 30, 2018, the Company held $13,398 (2017 - $nil) restricted cash in a legal trust relating to an investment in a private company (Note 31).
2. SIGNIFICANT ACCOUNTING POLICIES AND SIGNIFICANT JUDGEMENTS (CONTINUED)(h) Recent accounting pronouncements (Continued)
(iii) IFRS 15 Revenue from Contracts with Customers (Continued)
76 Aurora Cannabis Inc. 2018 Annual Report

5. SHORT-TERM INVESTMENTS
Accounting PolicyShort-term investments are classified as loans and receivable financial assets and are recognized initially at fair value and subsequently on an amortized cost basis using the effective interest method, less any impairment losses.
Short-term investments held at June 30, 2018 consist of an aggregate of $990 (2017 - $81) in guaranteed investment certificates (“GIC”) with maturity dates between October 3, 2018 and July 9, 2019, bearing annual interest rates ranging from prime less 2.10% to prime less 2.60%. The GICs are restricted and held as security against the Company’s corporate credit cards.
6. ACCOUNTS RECEIVABLE
Accounting PolicyAccounts receivables are classified as loans and receivable financial assets. Accounts receivables are recognized initially at fair value and subsequently measured at amortized cost, less any provisions for impairment. When an accounts receivable is uncollectible, it is written off against the provision. Subsequent recoveries of amounts previously written off are credited to the consolidated statements of comprehensive income (loss).
Significant JudgementThe determination of when amounts are deemed uncollectible requires judgement.
June 30, 2018 June 30, 2017$ $
Trade receivables 6,665 1,346Construction contract receivables 1,969 -Dividends receivable (Note 12(c)) 828 -GST recoverable 5,634 966
15,096 2,312
7. CONVERTIBLE DEBENTURE INVESTMENT
Accounting PolicyConvertible debenture investments are hybrid instruments which were elected to be classified as financial assets at fair value through profit or loss. Upon initial recognition, the investment is recognized at fair value with directly attributable transaction costs expensed as incurred. If the transaction price does not equal fair value, management measures the fair value of each component of the investment and any unrealized gains or losses at inception is either recognized in profit or loss or deferred and recognized over the term of the financial instrument, depending on whether the valuation inputs are based on observable market data. Subsequent changes in fair value are recognized in profit or loss. Refer to Note 28 for significant judgements in determining the fair value of the convertible debenture instruments.
Notes to Financial Statements 77

The Company held the following convertible debenture at June 30, 2018:
Financial asset hierarchy level 3 Radient$
Balance, June 30, 2016 -Additions at cost 2,000Unrealized gain recognized at inception 12,564Unrealized loss on changes in fair value (3,493)Balance, June 30, 2017 11,071Unrealized gain on changes in fair value 830Conversion of debenture (11,901)Balance, June 30, 2018 -
On February 13, 2017, the Company purchased a $2,000 unsecured 10% convertible debenture of Radient Technologies Inc. (“Radient”), convertible into units at $0.14 per unit. Each unit consisted of one common share and one warrant exercisable at a price of $0.33 per share expiring February 13, 2019. During the year ended June 30, 2017, the Company recognized an aggregate $1,135 unreal-ized loss on the debenture comprised of $3,493 unrealized loss on changes in fair value and $2,358 unrealized gain on the amortization of deferred inception gains.
On July 28, 2017, the Company received 14,285,714 units of Radient pursuant to the mandatory conversion of the debenture. The Company also received an aggregate of 181,707 units of Radient for its interest payments of $91. On conversion, the Company recognized an unrealized gain of $830 on the debentures and fully amortized the remaining deferred inception gain balance of $6,107 on the share portion of the debenture (Note 28(c)). The convertible debenture was classified as a level 3 financial asset and the $11,901 fair value on conversion was estimated by measuring the fair value of the shares at a quoted market price of $0.53 and the warrants using the Binomial model with the following assumptions: risk-free interest rate of 1.57%; dividend yield of 0%; stock price volatility of 91.53%; and an expected life of 1.57 years (Note 8(d)).
8. MARKETABLE SECURITIES AND DERIVATIVES
Accounting Policy
Available-for-saleThe Company classifies investments in common shares as available-for-sale financial assets. Available-for-sale financial assets are non-derivative financial assets that are designated as available-for-sale or are not classified in any other financial asset categories. They are initially and subsequently measured at fair value and the changes in fair value, other than impairment losses, are recognized in other compre-hensive income (loss) and presented in the fair value reserve in shareholders’ equity. When the financial assets are sold or an impairment write-down is required, losses accumulated in the fair value reserve recognized in shareholders’ equity are reclassified to profit or loss. Refer to Note 28 for significant judgements in determining the fair value of available-for-sale financial instruments.
7. CONVERTIBLE DEBENTURE INVESTMENT (CONTINUED)
78 Aurora Cannabis Inc. 2018 Annual Report
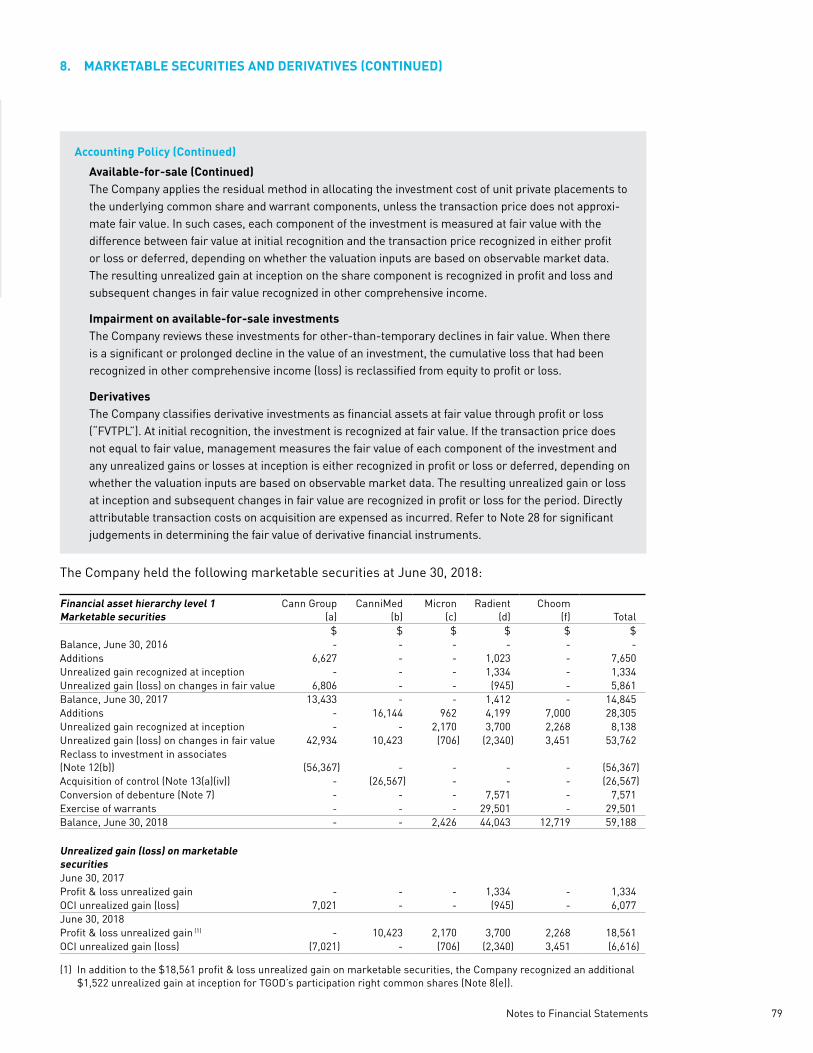
Accounting Policy (Continued)
Available-for-sale (Continued)The Company applies the residual method in allocating the investment cost of unit private placements to the underlying common share and warrant components, unless the transaction price does not approxi-mate fair value. In such cases, each component of the investment is measured at fair value with the difference between fair value at initial recognition and the transaction price recognized in either profit or loss or deferred, depending on whether the valuation inputs are based on observable market data. The resulting unrealized gain at inception on the share component is recognized in profit and loss and subsequent changes in fair value recognized in other comprehensive income.
Impairment on available-for-sale investmentsThe Company reviews these investments for other-than-temporary declines in fair value. When there is a significant or prolonged decline in the value of an investment, the cumulative loss that had been recognized in other comprehensive income (loss) is reclassified from equity to profit or loss.
DerivativesThe Company classifies derivative investments as financial assets at fair value through profit or loss (“FVTPL”). At initial recognition, the investment is recognized at fair value. If the transaction price does not equal to fair value, management measures the fair value of each component of the investment and any unrealized gains or losses at inception is either recognized in profit or loss or deferred, depending on whether the valuation inputs are based on observable market data. The resulting unrealized gain or loss at inception and subsequent changes in fair value are recognized in profit or loss for the period. Directly attributable transaction costs on acquisition are expensed as incurred. Refer to Note 28 for significant judgements in determining the fair value of derivative financial instruments.
The Company held the following marketable securities at June 30, 2018:
Financial asset hierarchy level 1Marketable securities
Cann Group(a)
CanniMed(b)
Micron(c)
Radient(d)
Choom(f) Total
$ $ $ $ $ $Balance, June 30, 2016 - - - - - -Additions 6,627 - - 1,023 - 7,650Unrealized gain recognized at inception - - - 1,334 - 1,334Unrealized gain (loss) on changes in fair value 6,806 - - (945) - 5,861Balance, June 30, 2017 13,433 - - 1,412 - 14,845Additions - 16,144 962 4,199 7,000 28,305Unrealized gain recognized at inception - - 2,170 3,700 2,268 8,138Unrealized gain (loss) on changes in fair value 42,934 10,423 (706) (2,340) 3,451 53,762Reclass to investment in associates (Note 12(b)) (56,367) - - - - (56,367)Acquisition of control (Note 13(a)(iv)) - (26,567) - - - (26,567)Conversion of debenture (Note 7) - - - 7,571 - 7,571Exercise of warrants - - - 29,501 - 29,501Balance, June 30, 2018 - - 2,426 44,043 12,719 59,188
Unrealized gain (loss) on marketable securitiesJune 30, 2017Profit & loss unrealized gain - - - 1,334 - 1,334OCI unrealized gain (loss) 7,021 - - (945) - 6,077June 30, 2018Profit & loss unrealized gain (1) - 10,423 2,170 3,700 2,268 18,561OCI unrealized gain (loss) (7,021) - (706) (2,340) 3,451 (6,616)
(1) In addition to the $18,561 profit & loss unrealized gain on marketable securities, the Company recognized an additional $1,522 unrealized gain at inception for TGOD’s participation right common shares (Note 8(e)).
The Company held the following convertible debenture at June 30, 2018:
Financial asset hierarchy level 3 Radient$
Balance, June 30, 2016 -Additions at cost 2,000Unrealized gain recognized at inception 12,564Unrealized loss on changes in fair value (3,493)Balance, June 30, 2017 11,071Unrealized gain on changes in fair value 830Conversion of debenture (11,901)Balance, June 30, 2018 -
On February 13, 2017, the Company purchased a $2,000 unsecured 10% convertible debenture of Radient Technologies Inc. (“Radient”), convertible into units at $0.14 per unit. Each unit consisted of one common share and one warrant exercisable at a price of $0.33 per share expiring February 13, 2019. During the year ended June 30, 2017, the Company recognized an aggregate $1,135 unreal-ized loss on the debenture comprised of $3,493 unrealized loss on changes in fair value and $2,358 unrealized gain on the amortization of deferred inception gains.
On July 28, 2017, the Company received 14,285,714 units of Radient pursuant to the mandatory conversion of the debenture. The Company also received an aggregate of 181,707 units of Radient for its interest payments of $91. On conversion, the Company recognized an unrealized gain of $830 on the debentures and fully amortized the remaining deferred inception gain balance of $6,107 on the share portion of the debenture (Note 28(c)). The convertible debenture was classified as a level 3 financial asset and the $11,901 fair value on conversion was estimated by measuring the fair value of the shares at a quoted market price of $0.53 and the warrants using the Binomial model with the following assumptions: risk-free interest rate of 1.57%; dividend yield of 0%; stock price volatility of 91.53%; and an expected life of 1.57 years (Note 8(d)).
8. MARKETABLE SECURITIES AND DERIVATIVES
Accounting Policy
Available-for-saleThe Company classifies investments in common shares as available-for-sale financial assets. Available-for-sale financial assets are non-derivative financial assets that are designated as available-for-sale or are not classified in any other financial asset categories. They are initially and subsequently measured at fair value and the changes in fair value, other than impairment losses, are recognized in other compre-hensive income (loss) and presented in the fair value reserve in shareholders’ equity. When the financial assets are sold or an impairment write-down is required, losses accumulated in the fair value reserve recognized in shareholders’ equity are reclassified to profit or loss. Refer to Note 28 for significant judgements in determining the fair value of available-for-sale financial instruments.
8. MARKETABLE SECURITIES AND DERIVATIVES (CONTINUED)
Notes to Financial Statements 79

The Company held the following derivative investments designated at FVTPL at June 30, 2018 on level 2 of the fair value hierarchy:
Financial asset hierarchy level 2Derivative investments designated at FVTPL
TGOD(e)
CTT(i) Total
$ $ $Balance, June 30, 2017 - - -Additions 55,000 1,319 56,319Unrealized gain on changes in fair value 153,043 18,821 171,864Reclass to investment in associates (Note 12(g)) (108,572) - (108,572)Balance, June 30, 2018 99,471 20,140 119,611
The Company held the following held-for-trading derivative investments at June 30, 2018:
Financial asset hierarchyHeld-for-trading derivative investments
Level 3Micron
(c)
Level 3Radient
(d)
Level 3Alcanna
(g)
Level 2Namaste
(h) Total$ $ $ $ $
Balance, June 30, 2016 - - - - -Additions - 306 - - 306Unrealized gain recognized at inception - 380 - - 380Unrealized loss on changes in fair value - (394) - - (394)Balance, June 30, 2017 - 292 - - 292Additions 538 2,083 28,060 1,333 32,014Unrealized gain recognized at inception 1,213 1,837 - - 3,050Unrealized gain (loss) on changes in fair value (723) 16,593 (25,660) (842) (10,632)Conversion of debenture (Note 7) - 4,330 - - 4,330Exercise of warrants - (23,723) - - (23,723)Balance, June 30, 2018 1,028 1,412 2,400 491 5,331
The following is a summary of derivative instrument investments and a reconciliation of the unrealized gain (loss) on changes in fair value of derivatives:
June 30, 2018
June 30, 2017
$ $Total derivative instrumentsDerivative investments – Level 2 119,611 -Derivative investments – Level 3 5,331 292
124,942 292
Unrealized gain (loss) on changes in fair value of derivativesInception gains amortized
Derivative investments – Level 3 5,217 59Changes in fair value
Derivative investments – Level 2 171,023 -Derivative investments – Level 3 (9,790) (394)
166,450 (335)
(a) Cann Group Limited (“Cann Group”)
On April 25, 2017, the Company subscribed to the initial public offering (“IPO”) of Cann Group on the Australian Securities Exchange for 21,562,314 fully paid ordinary shares at a price of A$0.30 per share for a total investment of $6,627 (A$6,469).
As at June 30, 2017, the fair market value of the shares of $13,433 (A$13,476) was based on a quoted market price of A$0.625 and an unrealized gain of $6,806 in the fair value of marketable securities was recognized during the year ended June 30, 2017, comprised of $7,021 unrealized gain on changes in fair value and $215 foreign exchange losses.
8. MARKETABLE SECURITIES AND DERIVATIVES (CONTINUED)
80 Aurora Cannabis Inc. 2018 Annual Report

On December 11, 2017, the Company acquired an additional 7,200,000 shares of Cann Group, bringing the Company’s total ownership interest to 21.8%. As a result, the Company obtained significant influence in Cann Group and the investment was accounted for under the equity method. The 21,562,314 shares had a fair value of $56,367 (A$58,218) based on a quoted market price of A$2.70 and was reclassified to investment in associates (Note 12(b)). The cumulative unrealized gains of $50,463 at December 11, 2017 was reclassified from other comprehensive income to deficit. Subsequent to obtaining significant influence, the Company further increased its ownership interest to 22.9% (Note 12(b)).
(b) CanniMed Therapeutics Inc. (“CanniMed”)
On November 24, 2017, the Company formally commenced an offer to purchase all of CanniMed’s issued and outstanding common shares. During the year ended June 30, 2018 and prior to obtaining control on March 15, 2018, the Company purchased an aggregate of 700,600 common shares of CanniMed at an average price of $23.043 per share for $16,144.
On March 15, 2018, the Company acquired control of CanniMed and the shares had a fair value of $26,567. On acquisition of control, the fair value of the shares was reclassified to the invest-ment in CanniMed and included as part of the determination of goodwill on the acquisition date (Note 13(a)(iv)). The Company recognized in the statement of comprehensive income (loss) a realized gain on the cumulative changes in fair value of $10,423 for the CanniMed marketable securities.
(c) Micron Waste Technologies Inc. (“Micron”)
On January 10, 2018, the Company subscribed to 4,411,765 units of Micron at $0.34 per unit for a total cost of $1,500. Each unit consisted of one common share and one common share purchase warrant exercisable at $0.50 per share expiring January 12, 2020.
The fair value of the investment differed from the transaction price at initial recognition. At incep-tion, the fair value of the shares of $3,132 was based on a quoted market price of $0.71 per share, and the warrants had a fair value of $1,751 which was estimated using the Binomial model using historical volatility, which is a Level 3 input. As such, the $2,170 unrealized gain at inception for the shares was recognized immediately through profit or loss, and the $1,213 unrealized gain at inception for the warrants was deferred over the term of the warrants.
At June 30, 2018, the fair value of the shares of $2,426 was based on quoted market prices of $0.55 and the $1,028 fair value of the warrants was estimated using the Binomial model with the following assumptions: risk-free interest rate of 2.16% (inception – 2.11%); dividend yield of 0% (inception – 0%); historical stock price volatility of 81.18% (inception – 85.65%); and an expected life of 1.54 years (inception – 2 years). If the estimated volatility increases or decreases by 10%, the estimated fair value would increase or decrease by approximately $97.
(d) Radient Technologies Inc. (“Radient”)
The Company acquired the following securities of Radient:
Date TransactionsCost
($)Shares
(#)Warrants
(#)
Warrant Exercise Price ($)
March 9, 2017 Private placement of units @ $0.45 per unit 1,250 2,777,800 1,388,900 0.70May 13, 2017 Convertible debenture interests (Note 7) 50 104,167 104,167 0.48July 28, 2017 Convertible debenture interests (Note 7) 41 77,540 77,540 0.53July 28, 2017 Debentures converted (Note 7) 2,000 14,285,714 14,285,714 0.33Dec 11, 2017 Private placement of units @ $1.37 per unit 6,222 4,541,889 4,541,889 1.71Dec 11, 2017 Exercise of warrants 5,778 15,856,321 (15,856,321) 0.36
15,341 37,643,431 4,541,889
8. MARKETABLE SECURITIES AND DERIVATIVES (CONTINUED)(a) Cann Group Limited (“Cann Group”) (Continued)
Notes to Financial Statements 81

As at June 30, 2017, the Company held an aggregate of 2,881,967 common shares and 1,493,067 warrants of Radient. At June 30, 2017, the $1,412 fair value of these shares was based on a quoted market price of $0.49 per share (inception - $0.83) and the $292 fair value of the warrants was estimated using the Black-Scholes pricing model with the following weighted average assumptions: risk-free interest rate of 1.10% (inception – 0.82%); dividend yield of 0% (inception – 0%); stock price volatility of 99.05% (inception – 101.40%); and an expected life of 1.69 years (inception – 2.00 years).
On December 11, 2017, the Company exercised an aggregate of 15,856,321 warrants of Radient for a total cost of $5,778. For the period ended June 30, 2018, the Company recorded unrealized gains on changes in fair value of these derivatives of $19,083 and fully amortized the deferred inception gains of $4,421 on the warrants. The aggregate fair value of the exercised warrants of $23,723 was estimated using the Binomial model with the following weighted average assumptions: share price of $1.83; risk-free interest rate of 1.70%; dividend yield of 0%; historical stock price volatility of 96.70%; and an expected life of 1.19 years.
As at June 30, 2018, the 37,643,431 common shares had a fair value of $44,043 based on a quoted market price of $1.17 per share and the 4,541,889 warrants had a fair value of $1,412 which was estimated using the Binomial model with the following weighted average assumptions: risk-free interest rate of 2.14%; dividend yield of 0%; historical stock price volatility of 80.37%; and an expected life of 1.45 years. If the estimated volatility increases or decreases by 10%, the estimated fair value would increase or decrease by approximately $251.
(e) The Green Organic Dutchman Holdings Ltd. (“TGOD”)
On January 4, 2018, the Company invested in 33,333,334 subscription receipts of TGOD at $1.65 per subscription receipt for a cost of $55,000. Each subscription receipt was converted into units of TGOD consisting of one common share and one-half of one share purchase warrant, with each whole warrant exercisable at $3.00 per share expiring February 28, 2021. The common shares and warrants are subject to a lock-up period for six and twelve months, respectively. In connection with the subscription receipt investment, the Company entered into an Investor Rights Agreement with TGOD where the Company received milestone options and a participation right for future TGOD equity financings. The milestone options allow the Company to increase its pro rata interest to over 50% and to purchase the shares at a 10% discount to the listed market price upon achievement of certain milestones. The Company elected to measure the subscription receipts and milestone options together as a single compound financial instrument at fair value through profit or loss.
Pursuant to the participation right, the Company subscribed to TGOD’s IPO of 6,341,250 units at a price of $3.65 per unit for a total investment of $23,146. Each unit consisted of one common share and one-half of one share purchase warrant of TGOD. Each whole warrant is exercisable at $7.00 per share expiring on May 20, 2020, subject to accelerated expiry if TGOD’s shares trade at or above a VWAP of $9.00 for any 10 consecutive trading day period.
On May 2, 2018, TGOD completed its IPO and the Company obtained significant influence upon conversion of the subscription receipts and receipt of the participation right common shares and warrants. The subscription receipts and milestone options had a fair value of $155,358 of which $108,572, $31,016 and $15,770 was allocated to the common shares, warrants and milestone options, respectively. The $108,572 fair value of the common shares was estimated based on a quoted market price of $3.89 per share, offset by the $21,095 fair value of the common share lock-up period which was estimated using the Binomial model with the following assumptions:
8. MARKETABLE SECURITIES AND DERIVATIVES (CONTINUED)(d) Radient Technologies Inc. (“Radient”) (Continued)
82 Aurora Cannabis Inc. 2018 Annual Report
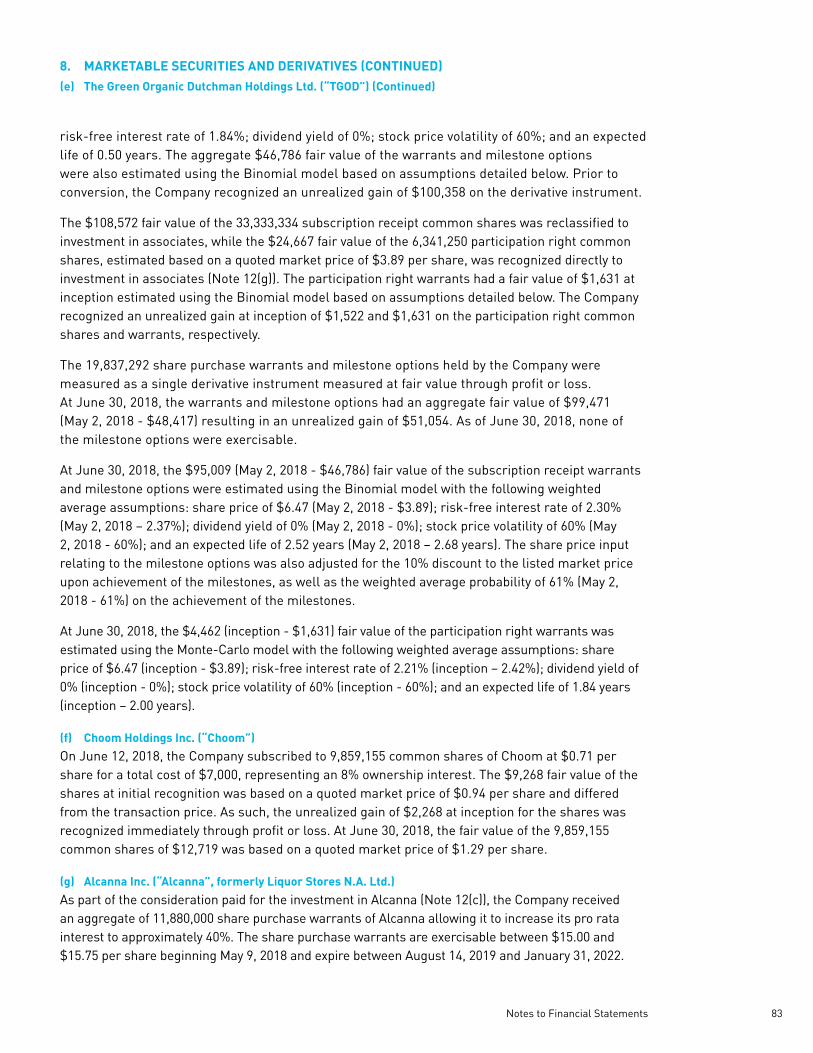
risk-free interest rate of 1.84%; dividend yield of 0%; stock price volatility of 60%; and an expected life of 0.50 years. The aggregate $46,786 fair value of the warrants and milestone options were also estimated using the Binomial model based on assumptions detailed below. Prior to conversion, the Company recognized an unrealized gain of $100,358 on the derivative instrument.
The $108,572 fair value of the 33,333,334 subscription receipt common shares was reclassified to investment in associates, while the $24,667 fair value of the 6,341,250 participation right common shares, estimated based on a quoted market price of $3.89 per share, was recognized directly to investment in associates (Note 12(g)). The participation right warrants had a fair value of $1,631 at inception estimated using the Binomial model based on assumptions detailed below. The Company recognized an unrealized gain at inception of $1,522 and $1,631 on the participation right common shares and warrants, respectively.
The 19,837,292 share purchase warrants and milestone options held by the Company were measured as a single derivative instrument measured at fair value through profit or loss. At June 30, 2018, the warrants and milestone options had an aggregate fair value of $99,471 (May 2, 2018 - $48,417) resulting in an unrealized gain of $51,054. As of June 30, 2018, none of the milestone options were exercisable.
At June 30, 2018, the $95,009 (May 2, 2018 - $46,786) fair value of the subscription receipt warrants and milestone options were estimated using the Binomial model with the following weighted average assumptions: share price of $6.47 (May 2, 2018 - $3.89); risk-free interest rate of 2.30% (May 2, 2018 – 2.37%); dividend yield of 0% (May 2, 2018 - 0%); stock price volatility of 60% (May 2, 2018 - 60%); and an expected life of 2.52 years (May 2, 2018 – 2.68 years). The share price input relating to the milestone options was also adjusted for the 10% discount to the listed market price upon achievement of the milestones, as well as the weighted average probability of 61% (May 2, 2018 - 61%) on the achievement of the milestones.
At June 30, 2018, the $4,462 (inception - $1,631) fair value of the participation right warrants was estimated using the Monte-Carlo model with the following weighted average assumptions: share price of $6.47 (inception - $3.89); risk-free interest rate of 2.21% (inception – 2.42%); dividend yield of 0% (inception - 0%); stock price volatility of 60% (inception - 60%); and an expected life of 1.84 years (inception – 2.00 years).
(f) Choom Holdings Inc. (“Choom”)
On June 12, 2018, the Company subscribed to 9,859,155 common shares of Choom at $0.71 per share for a total cost of $7,000, representing an 8% ownership interest. The $9,268 fair value of the shares at initial recognition was based on a quoted market price of $0.94 per share and differed from the transaction price. As such, the unrealized gain of $2,268 at inception for the shares was recognized immediately through profit or loss. At June 30, 2018, the fair value of the 9,859,155 common shares of $12,719 was based on a quoted market price of $1.29 per share.
(g) Alcanna Inc. (“Alcanna”, formerly Liquor Stores N.A. Ltd.)
As part of the consideration paid for the investment in Alcanna (Note 12(c)), the Company received an aggregate of 11,880,000 share purchase warrants of Alcanna allowing it to increase its pro rata interest to approximately 40%. The share purchase warrants are exercisable between $15.00 and $15.75 per share beginning May 9, 2018 and expire between August 14, 2019 and January 31, 2022.
8. MARKETABLE SECURITIES AND DERIVATIVES (CONTINUED)(e) The Green Organic Dutchman Holdings Ltd. (“TGOD”) (Continued)
Notes to Financial Statements 83

At June 30, 2018, the 11,880,000 warrants had a fair value of $2,400 (inception - $28,060) resulting in an unrealized loss of $25,660 since initial recognition. The fair value of the warrants was esti-mated using the Binomial model with the following weighted average assumptions: share price of $9.14 (inception – $11.95); risk-free interest rate of 2.12% (inception – 2.12%); dividend yield of 0% (inception – 0%); historical stock price volatility of 30.15% (inception – 52.03%); and an expected life of 1.49 years (inception – 1.86 years). If the estimated volatility increases or decreases by 10%, the estimated fair value would increase or decrease by approximately $3,012.
(h) Namaste Technologies Inc. (“Namaste”)
Namaste issued 500,000 stock options to the Company exercisable at $3.35 per share expiring December 27, 2021, vesting quarterly over 12 months. At June 30, 2018, the options had a fair value of $491 (inception - $1,333) resulting in an unrealized loss of $842 since initial recognition. The fair value of the options was estimated using the Black-Scholes pricing model with the following weighted average assumptions: share price of $1.49 (inception – $3.35); risk-free interest rate of 2.39% (inception – 2.21%); dividend yield of 0% (inception – 0%); stock price volatility of 125% (inception – 125%); and an expected life of 3.50 years (inception 4.00 years).
(i) CTT Pharmaceuticals Inc. (“CTT”)
On May 20, 2018, the Company purchased a $1,319 (US$1,000) unsecured 5% convertible deben-ture of CTT with a term of 3 years, convertible at the option of the holder into common shares at US$0.268 per share. Pursuant to the terms of the convertible debenture, the Company also received 20,779,972 share purchase warrants of CTT allowing it to increase its pro rata interest to approxi-mately 42.5% on a fully diluted basis (Note 12(e)). Each warrant is exercisable into one common share of CTT at US$0.35 per share until May 20, 2021.
The convertible debenture and warrants were accounted for as a single compound instrument with embedded derivatives classified as fair value through profit or loss financial assets. At June 30, 2018, the compound instrument had a fair value of $20,140 (inception - $1,319) resulting in an unrealized gain of $18,821. The fair value of the compound instrument was estimated using the Binomial model with the following weighted average assumptions: share price of US$0.89 (inception - US$0.27); risk-free interest rate of 2.85% (inception – 2.90%); dividend yield of 0% (inception – 0%); stock price volatility of 20% (inception - 20%); and an expected life of 2.89 years (inception – 3.00 years).
9. BIOLOGICAL ASSETS
Accounting PolicyThe Company’s biological assets consist of medical cannabis plants and are valued using the income approach. Production costs are capitalized to biological assets and include all direct and indirect costs relating to biological transformation. The Company measures and adjusts the biological assets to the fair value less cost to sell up to the point of harvest, which becomes the basis for the cost of finished goods inventories after harvest. Unrealized gains or losses arising from the changes in fair value less cost to sell during the period are included in the results of operations for the related period.
8. MARKETABLE SECURITIES AND DERIVATIVES (CONTINUED)(g) Alcanna Inc. (“Alcanna”, formerly Liquor Stores N.A. Ltd.) (Continued)
84 Aurora Cannabis Inc. 2018 Annual Report

Significant JudgementDetermination of the fair values of the biological assets requires the Company to make assumptions about how market participants assign fair values to these assets. These assumptions primarily relate to the level of effort required to bring the cannabis up to the point of harvest, costs to convert the harvested cannabis to finished goods, sales price, risk of loss, expected future yields from the cannabis plants and estimating values during the growth cycle. The average grow cycle of plants up to the point of harvest is approximately twelve weeks.
The Company’s biological assets consist of cannabis plants. The changes in the carrying value of biological assets are as follows:
$Balance at June 30, 2016 1,845Changes in fair value less cost to sell due to biological transformation 22,772Transferred to inventory upon harvest (20,529)Balance at June 30, 2017 4,088Production costs capitalized 9,902Biological assets acquired from CanniMed (Note 13(a)(iv)) 2,535Changes in fair value less cost to sell due to biological transformation 25,550Transferred to inventory upon harvest (28,455)Balance at June 30, 2018 13,620
As of June 30, 2018, the weighted average fair value less cost to complete and cost to sell was $6.46 per gram (2017 - $6.52 per gram).
The fair value of biological assets is categorized within Level 3 on the fair value hierarchy. The inputs and assumptions used in determining the fair value of biological assets include:
(a) Selling price per gram; Level 3 input(b) Attrition rate; Level 3 input(c) Average yield per plant; Level 3 input(d) Standard cost per gram to compete production Level 3 input(e) Cumulative stage of completion in production process Level 3 input
Significant unobservable assumptions used in the valuation of biological assets, including the sensitivities on changes in these assumptions and their effect on the fair value of biological assets, are as follows:
Effect on fair value
Significant inputs & assumptions Range of inputs SensitivityJune 30,
2018June 30,
2017Selling price per gram (1) $7.25 to $8.96 Increase or decrease of $1.00 per gram $1,763 $599Average yield per plant (2) 20 to 51 grams Increase or decrease by 5 grams per plant $1,999 $529
(1) Selling price per gram is based on average selling prices for the period.
(2) Average yield per plant includes yields for new facilities that recently started production.
The Company’s estimates are, by their nature, subject to change and differences from the anticipated yield will be reflected in the gain or loss on biological assets in future periods.
As of June 30, 2018, the biological assets were on average 45% complete (2017 – 43%). During the year ended June 30, 2018, the Company’s biological assets produced 5,631,913 grams of dried cannabis (2017 – 3,036,829 grams). As of June 30, 2018, it was expected that the Company’s
9. BIOLOGICAL ASSETS (CONTINUED)
Notes to Financial Statements 85

biological assets would yield approximately 3,794,770 grams (June 30, 2017 – 599,245 grams) of medical cannabis when harvested.
10. INVENTORY
Accounting PolicyInventories of purchased finished goods and packing materials are initially valued at cost and subsequently at the lower of cost and net realizable value. Inventories of harvested cannabis are transferred from biolog-ical assets at their fair value less costs to sell at harvest which becomes the deemed cost. Any subsequent post-harvest costs are capitalized to inventory to the extent that the cost is less than net realizable value. Net realizable value is determined as the estimated selling price in the ordinary course of business less the estimated costs of completion and the estimated costs necessary to make the sale. Cost is determined using the average cost basis. Products for resale and supplies and consumables are valued at lower of cost and net realizable value. The Company reviews inventory for obsolete, redundant and slow-moving goods and any such inventory are written-down to net realizable value.
Significant JudgementThe valuation of biological assets at the point of harvest is the cost basis for all cannabis-based inventory and thus any critical estimates and judgements related to the valuation of biological assets (Note 9) are also applicable for inventory. The valuation of work-in-process and finished goods also requires the estimate of conversion costs incurred, which become part of the carrying amount for the inventory. The Company must also determine if the cost of any inventory exceeds its net realizable value, such as cases where prices have decreased, or inventory has spoiled or has otherwise been damaged.
The following is a breakdown of inventory at June 30, 2018:
Capitalizedcost
Fair valueadjustment
Carryingvalue
$ $ $Harvested cannabis
Work-in-process 2,215 6,337 8,552Finished goods 5,637 7,742 13,379
7,852 14,079 21,931Cannabis oils
Work-in-process 550 782 1,332Finished goods 1,099 1,364 2,463
1,649 2,146 3,795Capsules
Finished goods 166 90 256Indoor cultivation systems and hemp seed food products
Raw materials 1,160 - 1,160Work-in-process 701 - 701Finished goods 323 - 323
2,184 - 2,184Accessories, supplies and consumables 1,429 - 1,429Balance, June 30, 2018 13,280 16,315 29,595
9. BIOLOGICAL ASSETS (CONTINUED)
86 Aurora Cannabis Inc. 2018 Annual Report

The following is a breakdown of inventory at June 30, 2017:
Capitalizedcost
Fair valueadjustment
Carryingvalue
$ $ $Harvested cannabis
Work-in-process 304 373 677Finished goods 2,332 2,836 5,168
2,636 3,209 5,845Cannabis oils
Work-in process 342 790 1,132Finished goods 147 397 544
489 1,187 1,676Supplies and consumables 182 - 182Balance, June 30, 2017 3,307 4,396 7,703
During the year ended June 30, 2018, the Company recognized $37,227 (2017 - $24,783) of inventory expensed to cost of goods sold including $17,624 (2017 - $16,908) non-cash expense relating to the changes in fair value of inventory sold.
11. PROPERTY, PLANT AND EQUIPMENT
Accounting PolicyProperty, plant and equipment is measured at cost less accumulated depreciation, residual values and impairment losses. Cost includes expenditures that are directly attributable to the acquisition of the asset. The cost of self-constructed assets includes the cost of materials and direct labor, any other costs directly attributable to bringing the asset to a working condition for the intended use and borrowing costs on qualifying assets. During their construction, items of property, plant and equipment are classified as construction in progress. When the asset is available for use, it is transferred from construction in progress to the appropriate category of property, plant and equipment and depreciation on the item commences.
Depreciation is calculated on a straight-line basis over the following estimated useful lives: Computer software and equipment 3 years Production equipment 2 - 4 years Furniture and fixtures 5 years Building and improvements 10 - 50 years
An asset’s residual value, useful life and depreciation method are reviewed at each financial year-end and adjusted if appropriate.
Gains and losses on disposal of an item are determined by comparing the proceeds from disposal with the carrying amount of the item and are recognized in profit or loss.
The Company capitalizes borrowing costs on capital invested in projects under construction. Upon the asset becoming available for use, capitalized borrowing costs, as a portion of the total cost of the asset, are depreciated over the estimated useful life of the related asset.
10. INVENTORY (CONTINUED)
Notes to Financial Statements 87

Accounting Policy (Continued)
Impairment of property, plant and equipmentThe Company assesses impairment on property, plant and equipment when an indication of impairment occurs, such as evidence of obsolescence or physical damage. In assessing impairment, the Company compares the carrying amount to the recoverable amount which is determined as the higher of the asset’s fair values less costs of disposal and its value in use. Value in use is assessed based on the estimated future cash flows, discounted to their present value using a pre-tax discount rate that reflects current market assessments of the time value of money and the risks specific to the asset. An impair-ment loss is recognized whenever the carrying amount of the asset exceeds its recoverable amount and is recorded in the consolidated statements of comprehensive income (loss).
Significant JudgementDepreciation of property, plant and equipment is dependent upon estimates of useful lives and residual values which are determined through the exercise of judgement. The assessment of any impairment of these assets is dependent upon estimates of recoverable amounts that take into account factors such as economic and market conditions and the useful lives of assets.
Building &Improve-
ments
Construc-tion in
progress
ComputerSoftware &Equipment
Furniture& Fixtures
Production & Other
Equipment
Finance Lease
Equipment Total$ $ $ $ $ $ $
CostBalance, June 30, 2016 10,831 - 444 109 1,020 - 12,404
Additions 1,944 26,571 398 149 778 544 30,384Additions from business combinations andasset acquisitions 4,407 - 63 34 364 - 4,868Disposals - - - - (12) - (12)
Balance, June 30, 2017 17,182 26,571 905 292 2,150 544 47,644Additions 16,896 115,653 3,333 2,859 12,750 - 151,491Additions from business combinations and asset acquisitions 45,404 4,323 588 615 5,405 247 56,582Disposals (397) - (753) (289) (1,087) - (2,526)Foreign currency translation - - 5 - 4 - 9
Balance, June 30, 2018 79,085 146,547 4,078 3,477 19,222 791 253,200
Accumulated DepreciationBalance, June 30, 2016 616 - 162 19 237 - 1,034
Depreciation 438 - 221 40 351 39 1,089Disposals - - - - (2) - (2)
Balance, June 30, 2017 1,054 - 383 59 586 39 2,121Depreciation 1,435 888 403 364 2,052 102 5,244Disposals (53) - (206) (74) (188) - (521)Foreign currency translation - - 4 - - - 4
Balance, June 30, 2018 2,436 888 584 349 2,450 141 6,848
Net Book ValueJune 30, 2017 16,128 26,571 522 233 1,564 505 45,523June 30, 2018 76,649 145,659 3,494 3,128 16,772 650 246,352
11. PROPERTY, PLANT AND EQUIPMENT (CONTINUED)
88 Aurora Cannabis Inc. 2018 Annual Report

As at June 30, 2018, costs related to the construction of production facilities were capitalized as construction in progress and not amortized. Amortization will commence when construction is completed, and the facility is available for its intended use.
During the year ended June 30, 2018, $5,710 (2017 - $1,370) in borrowing costs were capitalized to construction in progress at a weighted average rate of 20% (2017 – 22%).
12. INVESTMENTS IN ASSOCIATES AND JOINT VENTURE
Accounting PolicyAssociates are companies over which Aurora has significant influence and are accounted for under the equity method. Significant influence is assumed when the Company has 20%-49% ownership interest, unless qualitative factors overcome this assumption. In assessing significant influence, potential voting rights that are currently exercisable are taken into account.
Joint ventures are joint arrangements whereby the parties that have joint control of the arrangement have rights to the net assets of the arrangement.
Investments in associates and joint ventures are accounted for using the equity method and are initially recognized at cost, excluding financial assets that are not in-substance common shares and inclusive of transaction costs. When the Company holds available-for-sale or derivative financial assets and subsequently obtains significant influence in that investee, the fair value of the financial instruments are reclassified to investments in associates as the deemed cost with the cumulative unrealized gains or losses in other comprehensive income (loss), if any, transferred to deficit. For each additional acquisition of owner-ship interest within the investment in associate classification and prior to obtaining control, the difference between the cost of the incremental investment acquired and the investee’s fair value of identifiable net assets is allocated to goodwill. The carrying amount of goodwill arising from the acquisition of associates and joint ventures is included in the carrying amount of the investments in associates and joint ventures.
The consolidated financial statements include the Company’s share of the income and expenses and equity movement of equity accounted investees. In accordance with IFRS, the investee’s most recent available financial statements are used in the application of the equity method. Where the investee’s reporting period differs from the Company’s, the investee prepares financial information as of the same period end as the Company, unless it is impracticable to do so. Otherwise, the Company will adjust for its share of income and expenses and equity movement based on the investee’s most recently completed financial statements, adjusted for the effects of significant transactions. The Company does not recognize losses exceeding the carrying value of its interest in the associate or joint venture.
ImpairmentThe entire carrying amount of the investment is assessed for indicators of impairment annually. An impairment test is performed when there is objective evidence of impairment, such as significant adverse changes in the environment in which the equity-accounted investee operates or a significant or prolonged decline in the fair value of the investment below its carrying amount. An impairment loss is recorded when the recoverable amount becomes lower than the carrying amount.
Notes to Financial Statements 89

Significant JudgementThe Company uses judgement in its assessment of whether the Company has significant influence. Significant influence is the power to participate in the financial and operating policy decisions of the investee, including but not limited to, the ability to exercise significant influence through board represen-tation, material transactions with the investee, provision of technical information, and the interchange of managerial personnel. Whether an investment is classified as an investment in associate can have a significant impact on the entries made on and after acquisition.
The carrying value of investments in associates and joint ventures consist of:
Note%
Interest
Balance,Jun 30,
2017 Additions
Trans-action costs
Dividendincome
Dis-position
Share of net
income (loss)
OCI foreign
exchangegain
(loss)
Balance,Jun 30,
2018$ $ $ $ $ $ $ $
Australis Holdings (a) 50% - - - - - - - -Cann Group Limited (b) 23% - 81,927 - - - (781) 37 81,183Alcanna Inc. (c) 25% - 109,940 1,586 (1,449) - (500) - 109,577SubTerra LLC (d) 0% - 78 - - (78) - - -10647594 Canada (d) 20% - 134 - - - - - 134CTT Pharmaceutical (e) 0% - - - - - - - -Capcium Inc. (f) 20% - 11,270 - - - (14) - 11,256TGOD (g) 17% - 133,239 - - - (947) - 132,292
- 336,588 1,586 (1,449) (78) (2,242) 37 334,442
The following is a summary of aggregate financial information for the Company’s associates and joint ventures:
Cann Group
(b)Alcanna
(c)Capcium
(f)TGOD
(g) Other
June 30, 2018Total
June 30, 2017
Other$ $ $ $ $ $ $
Statement of financial positionCash and cash equivalents 48,243 78,595 252 261,816 1,317 390,223 107Current assets 79,225 197,131 11,935 270,712 1,319 560,322 1Non-current assets 5,258 252,262 6,701 48,078 3,029 315,328 2,300
Current financial liabilities, excluding trade and other payables and provisions 4 1,380 - - 1,737 3,121 283Current liabilities 887 54,263 1,293 13,992 2,087 72,522 283Non-current financial liabilities 16 72,697 18,583 - 2,057 93,353 2,415Non-current liabilities 16 131,561 18,583 - 2,057 152,217 2,415
Statement of comprehensive income (loss)Revenue 552 223,991 104 - - 224,647 -Depreciation and amortization - (4,455) - (121) - (4,576) -Interest income - - - 381 - 381 -Interest expense (7) (1,916) - (32) (57) (2,012) (110)Income tax recovery - 751 - - - 751 -Loss from continued operations (3,334) (2,108) (69) (5,578) (471) (11,560) (183)Loss from discontinued operations, net tax - (242) - - - (242) -Other comprehensive income - 1,402 - - - 1,402 -Total comprehensive loss (3,334) (974) (69) (5,578) (471) (10,426) (183)
12. INVESTMENTS IN ASSOCIATES AND JOINT VENTURE (CONTINUED)
90 Aurora Cannabis Inc. 2018 Annual Report

(a) Australis Holdings
On April 7, 2015, the Company’s wholly-owned subsidiary, Australis Capital Inc. (“ACI”), entered into a Limited Liability Partnership Agreement with AJR Builders Group LLC (“AJR”) and formed Australis Holdings LLP (“Australis Holdings” or “AHL”), a Washington Limited Liability Partnership. Each of ACI and AJR holds a 50% interest in Australis Holdings. Australis Holdings purchased two parcels of land in 2015 totaling approximately 24.5 acres (the “Property”) in Whatcom County, Washington for US$2,300, with the initial intention to construct a new cannabis production and processing facility.
Pursuant to a promissory note dated April 10, 2015, the Company through ACI loaned $1,645 to Australis Holdings to fund the purchase of the Property. The note bears interest at a rate of 5% per annum and had an original maturity date of October 31, 2017 which was extended to October 31, 2018. In the event of a default, interest will be charged at 12% per annum. The note is secured by a first mortgage on one parcel of the Property and a second mortgage on the other title, as well as a general security agreement granting ACI security over all present and after acquired property of Australis Holdings. As of June 30, 2018, the loan had a carrying amount of $1,785 (2017 - $1,736) including accrued interest of $140 (2017 - $91). During the year ended June 30, 2018, the Company accrued interest of $49 (2017 - $41) related to this loan. The loan plus accrued interest were reclassified to assets held for distribution to owners (Note 15).
The Company has advances of $1,659 to Australis Holdings (2017 - $360), of which $1,235 (2017 - $nil) was held by ACI and reclassified to assets held for distribution to owners (Note 15). The advances are unsecured, non-interest bearing and have no fixed terms of repayment.
As of June 30, 2018, the carrying value of the investment is $nil (2017 - $nil). The Company’s share of losses in AHL is recognized only to the extent of reducing the carrying value of the investment to $nil. Total unrecognized share of AHL’s losses for the year ended June 30, 2018 and unrecognized cumulative losses was $98 and $243, respectively.
Subsequent to June 30, 2018, the Company acquired the remaining 50% interest in AHL from AJR (Note 31), as well as completed the spin-out of ACI and the AHL investment to Aurora shareholders (Notes 15 and 31).
(b) Cann Group Limited (“Cann Group”)
Cann Group is a public company listed on the Australian Securities Exchange and its principal activities consist of the cultivation of medicinal cannabis for both medicinal and research purposes and commercializing the outputs for medicinal uses in Australia.
On December 11, 2017, the Company obtained significant influence in Cann Group through the acquisition of an additional 7,200,000 shares at A$2.50 per share for a cost of $17,577 (A$18,000). As a result, the $56,367 fair value of the previously held 21,562,314 shares in Cann Group were reclassified from marketable securities to investment in associates as the deemed cost (Note 8(a)). On January 4, 2018, the Company also acquired an additional 3,194,033 shares at a cost of $7,983 (A$7,985). As of June 30, 2018, the Company held an aggregate of 31,956,347 shares of Cann Group with a carrying value of $81,182 in investment in associates, representing a 22.9% ownership interest. Management continues to work on refining the estimate of the Company’s share of the fair value of identifiable net assets acquired. As such, the allocation of the purchase price to the various assets acquired is subject to change.
12. INVESTMENTS IN ASSOCIATES AND JOINT VENTURE (CONTINUED)
Notes to Financial Statements 91

Based on Cann Group’s closing price of A$3.50 on June 30, 2018, the shares held by the Company have a fair value of approximately $108,861 (A$111,847).
(c) Alcanna Inc. (“Alcanna”)
On February 14, 2018, the Company subscribed to Alcanna’s non-brokered private placement for 6,900,000 common shares at $15.00 per share for a total cost of $103,500, representing a 19.9% interest in Alcanna. The Company also subscribed to 2,300,000 subscription receipts of Alcanna at $15.00 per subscription receipt for a total cost of $34,500 which was converted to common shares on May 9, 2018, increasing the Company’s ownership to approximately 25% on an undi-luted basis. As part of the consideration transferred, the Company also received 11,880,000 share purchase warrants of Alcanna. The total transaction price of $138,000 was allocated first to the common shares and subscription receipts based on Alcanna’s closing market price of $11.95 as of February 14, 2018, resulting in total cost of $109,940 allocated to the investment in associate and $28,060 being the implied fair value of the warrants. The warrants are recognized as derivatives measured at fair value through profit or loss (Note 8(g)). The Company also recognized $1,586 transaction costs and $1,449 dividends to investment in associates. Of the $1,449 dividends, $828 remains receivable as of June 30, 2018 (Note 6). Management continues to work on refining the estimate of the Company’s share of the fair value of identifiable net assets acquired. As such, the allocation of the purchase price to the various assets acquired is subject to change.
Alcanna is an Alberta based public company listed on the TSX and its principal activity is the retailing of wines, beers and spirits in Canada and the United States of America. Alcanna also has advanced plans to develop and launch a retail cannabis business in Canadian jurisdictions where private retailing will be permitted upon legalization. Management determined that the Company has significant influence over Alcanna and accounts for the investment under the equity method.
Based on Alcanna’s closing price of $9.14 on June 30, 2018, the shares held by the Company have a fair value of $84,088. The Company assessed the carrying value of the investment against the estimated recoverable amount and determined that no impairment was necessary on the investment.
(d) SubTerra LLC (“SubTerra”) and 10647594 Canada Inc. (“10647594 Canada”)
Pursuant to the acquisition of CanniMed (Note 13(a)(iv)), the Company acquired a 19.9% interest in SubTerra, a Michigan limited liability company, and a 19.9% interest in 10647594 Canada which hold certain assets known as the Interleukin 37 protein.
On May 18, 2018, the Company sold its 19.9% interest in SubTerra to CanniMed’s former Chief Executive Officer in exchange for $78 cash. Additionally, in exchange for the cancellation of $4,665 (US$3,580) promissory notes and receivables from SubTerra, the Company received the following assets with an estimated fair value of $1,400:
(i) 5% of any gross revenues of SubTerra earned annually from the sale of cannabis and cannabis-based products grown and/or processed at its facility for the period commencing June 1, 2018 and ending May 31, 2028; and
(ii) a payment of $150 annually for the period commencing June 1, 2018 and ending May 31, 2028.
The promissory notes and receivables from SubTerra were previously written off prior to Aurora’s acquisition of CanniMed. As such, the Company recognized a recovery of $1,400 upon receipt of the above assets.
12. INVESTMENTS IN ASSOCIATES AND JOINT VENTURE (CONTINUED)(b) Cann Group Limited (“Cann Group”) (Continued)
92 Aurora Cannabis Inc. 2018 Annual Report

As part of the sale agreement, the Company also received a two-year option to purchase a parcel of land located in White Pine, Michigan for US$3.
No income or loss was recognized on the investment in associate from acquisition date to disposition.
Subsequent to June 30, 2018, the revenue royalty, annuity payment and land purchase option were spun-out as part of the ACI spin-out transaction (Notes 15 and 31).
(e) CTT Pharmaceutical Holdings Ltd. (“CTT”)
The Company holds securities of CTT which if converted and exercised would increase the Company’s ownership interest to 42.5% on a fully diluted basis (Note 8(i)).
As of June 30, 2018, the Company held 0% non-diluted ownership interest in CTT. Based on the Company’s potential voting rights of up to 42.5% and other qualitative factors, the Company has determined it holds significant influence in CTT and has accounted for its investment under the equity method. As the Company has no present voting interest in CTT, the compound financial instrument is measured as a financial asset at fair value through profit or loss (Note 8(i)).
CTT is Ontario based and is in the business of developing dose specific fast dissolving oral thin film wafers that provide a dose specific, smoke-free delivery of medical cannabis or other active ingredients. CTT’s common shares are listed on the OTC under the symbol “CTTH“.
(f) Capcium Inc. (“Capcium”)
On June 6, 2018, the Company acquired a 19.99% ownership interest in Capcium by subscribing to 8,828,662 common shares. The consideration was paid through the issuance of 1,144,481 common shares of Aurora with a fair value of $10,770 and $500 cash. Capcium is a Montreal-based private company in the business of manufacturing soft-gels.
Based on the Company’s voting rights and other qualitative factors, the Company has deter-mined it holds significant influence in Capcium and has accounted for its investment under the equity method.
(g) The Green Organic Dutchman Holdings Ltd. (“TGOD”)
TGOD is an Ontario based licensed producer of medical cannabis in Canada. The Company’s invest-ments in TGOD consist of compound instruments which were classified as derivatives at fair value through profit or loss. On closing of TGOD’s IPO and the conversion of subscription receipts into common shares and common share purchase warrants, based on the Company’s 18% ownership interest and other qualitative factors, the Company obtained significant influence in TGOD and the aggregate $133,239 fair value of the 39,674,584 common shares were reclassified to investment in associates (Note 8(e)). Management continues to work on refining the estimate of the Company’s share of the fair value of identifiable net assets acquired. As such, the allocation of the purchase price to the various assets acquired is subject to change.
Based on TGOD’s closing price of $6.47 on June 30, 2018, the shares held by the Company have a fair value of approximately $256,695.
12. INVESTMENTS IN ASSOCIATES AND JOINT VENTURE (CONTINUED)(d) SubTerra LLC (“SubTerra”) and 10647594 Canada Inc. (“10647594 Canada”) (Continued)
Notes to Financial Statements 93

13. BUSINESS COMBINATIONS AND ASSET ACQUISITIONS
Accounting PolicyBusiness combinationsA business combination is a transaction or event in which an acquirer obtains control of one or more businesses and is accounted for using the acquisition method. The total consideration paid for the acquisition is the aggregate of the fair values of assets given, liabilities incurred or assumed, and equity instruments issued in exchange for control of the acquiree at the acquisition date. The acquisition date is the date where the Company obtains control of the acquiree. The identifiable assets acquired and liabilities assumed are recognized at their acquisition date fair values, except for deferred taxes and share-based payment awards where IFRS provides exceptions to recording the amounts at fair value. Acquisition costs are expensed to profit or loss.
Contingent consideration is measured at its acquisition-date fair value and included as part of the consideration transferred in a business combination. Contingent consideration that is classified as equity is not remeasured at subsequent reporting dates and its subsequent settlement is accounted for within equity. Contingent consideration that is classified as an asset or a liability is remeasured at subsequent reporting dates in accordance with IAS 39, or IAS 37 Provisions, Contingent Liabilities and Contingent Assets, as appropriate, with the corresponding gain or loss being recognized in profit or loss.
Non-controlling interest in the acquiree, if any, is recognized either at fair value or at the non-controlling interest’s proportionate share of the acquiree’s net assets, determined on an acquisition-by-acquisition basis. For each acquisition, the excess of total consideration, the fair value of previously held equity interest prior to obtaining control and the non-controlling interest in the acquiree, over the fair value of the identifiable net asset acquired, is recorded as goodwill.
Certain fair values may be estimated at the acquisition date pending confirmation or completion of the valuation process. Where provisional values are used in accounting for a business combination, they may be adjusted retrospectively in subsequent periods. The measurement period is the period from the acquisition date to the date complete information about facts and circumstances that existed as of the acquisition date is received. However, the measurement period does not exceed one year from the acquisition date.
Asset acquisitionsAcquisitions that do not meet the definition of a business combination are accounted for as an asset acquisition. Consideration paid for an asset acquisition is allocated to the individual identifiable assets acquired and liabilities assumed based on their relative fair values. Asset acquisitions do not give rise to goodwill.
94 Aurora Cannabis Inc. 2018 Annual Report

Significant JudgementClassification of an acquisition as a business combination or an asset acquisition depends on whether the assets acquired constitute a business, which can be a complex judgement. Whether an acquisition is clas-sified as a business combination or asset acquisition can have a significant impact on the entries made on and after acquisition.
In determining the fair value of all identifiable assets, liabilities and contingent liabilities acquired, the most significant estimates relate to contingent consideration and intangible assets. Management exercises judgement in estimating the probability and timing of when earn-outs are expected to be achieved which is used as the basis for estimating fair value. For any intangible asset identified, depending on the type of intangible asset and the complexity of determining its fair value, an independent valuation expert or man-agement may develop the fair value, using appropriate valuation techniques, which are generally based on a forecast of the total expected future net cash flows. The evaluations are linked closely to the assumptions made by management regarding the future performance of these assets and any changes in the discount rate applied.
13. BUSINESS COMBINATIONS AND ASSET ACQUISITIONS (CONTINUED)
Notes to Financial Statements 95

(a) Business combinationsCompleted during the year endedJune 30, 2018
BCNL / UCI(i)
Hempco(ii)
Larssen(iii)
CanniMed(iv) Total
$ $ $ $ $Total considerationCash paid 3,294 946 3,500 130,979 139,435Common shares issued 248 - - 706,874 707,122Share purchase warrants issued 136 - - - 136Loan settlement 716 2,301 - - 3,017Contingent consideration 1,119 - - - 1,119
5,513 3,247 3,500 837,853 850,113Net identifiable assets (liabilities) acquiredCash 138 908 - 38,883 39,929Accounts receivables 394 1,388 - 986 2,768Short-term investments - 511 - - 511Biological assets - - - 2,535 2,535Inventories 874 1,875 - 10,269 13,018Prepaid expenses and deposits 55 178 - 223 456Investments in associates - - - 212 212Property, plant and equipment 149 2,876 - 45,316 48,341Intangible assetsCustomer relationships 105 - - 7,000 7,105Permits and licenses - - - 65,100 65,100Brand 654 - - 127,000 127,654Patents 521 - - 1,700 2,221Deferred tax asset - - - 11,663 11,663
2,890 7,736 - 310,887 321,513Accounts payable and accruals (818) (968) - (24,334) (26,120)Income taxes payable (26) - - (20) (46)Deferred revenue (86) - - - (86)Loans and borrowings - - - (11,825) (11,825)Deferred tax liability (335) - - (58,083) (58,418)
1,625 6,768 - 216,625 225,018Purchase price allocationNet identifiable assets acquired 1,625 6,768 - 216,625 225,018Fair value of previously held equity interest - - - (26,567) (26,567)Non-controlling interests - (5,935) - (32,586) (38,521)Goodwill 3,888 2,414 3,500 680,381 690,183
5,513 3,247 3,500 837,853 850,113Non-controlling interest at acquisition (%) 0% 77.7% 0% 12.8%Net cash outflowsCash consideration paid 3,294 946 3,500 130,979 138,719Cash acquired (138) (908) - (38,883) (39,929)
3,156 38 3,500 92,096 98,790Acquisition costs expensedYear ended June 30, 2018 65 71 30 7,235 7,401Net accounts receivables acquiredGross contractual receivables acquired 504 1,420 - 986 2,910Receivables expected to be uncollectible (110) (32) - - (142)Net accounts receivables acquired 394 1,388 - 986 2,768
(i) BC Northern Lights Enterprises Ltd. (“BCNL”) and Urban Cultivator Inc. (“UCI”)
On September 29, 2017, the Company acquired BCNL and UCI to cater to the home grow cannabis market. BCNL is in the business of the production and sale of proprietary systems for the safe, efficient and high-yield indoor cultivation of cannabis and UCI is in the business of the production and sale of state-of-the-art indoor gardening appliances for the cultivation of organic microgreens, vegetables and herbs in home kitchens. The transaction was accounted for as a business combination.
13. BUSINESS COMBINATIONS AND ASSET ACQUISITIONS (CONTINUED)
96 Aurora Cannabis Inc. 2018 Annual Report

The Company acquired all of the issued and outstanding shares of BCNL and UCI for aggregate consideration of $5,513 comprised of $3,294 cash consideration, settlement of $716 loan receiv-able, 89,107 common shares with a fair value of $248, share purchase warrants with a fair value of $136 exercisable at $2.8056 per share until September 29, 2020, and $1,119 contingent con-sideration representing the estimated fair value of the $4,000 gross consideration to be paid in cash or common shares at the election of Aurora over a period of 3 years on the achievement of future milestones related to aggregate earnings before interest, taxes, depreciation and amor-tization (“EBITDA”). As of June 30, 2018, the fair value of contingent consideration was $1,242 (Note 28(e)).
At the date of acquisition, management was in the process of gathering the relevant informa-tion that existed as at the acquisition date to determine the fair value of net identifiable assets acquired. As such, the initial purchase price was provisionally allocated based on the Company’s estimated fair value of the identifiable assets acquired and the liabilities assumed on the acquisi-tion date. Subsequently, the Company finalized the purchase price allocation and has adjusted the values for the working capital holdback pursuant to the acquisition agreement, contingent consideration, intangible asset and goodwill. Accordingly, the purchase price allocation has been retrospectively adjusted to reflect changes to the assets acquired and liabilities assumed at the acquisition date as follows:
Provisional allocationat acquisition Adjustments Final
$ $ $Net identifiable assets acquired 846 779 1,625Goodwill 6,551 (2,663) 3,888
7,397 (1,884) 5,513
Goodwill represents expected synergies, future income and growth, and other intangibles that do not qualify for separate recognition, as well as the deferred tax liability recognized for all taxable temporary differences. None of the goodwill arising on this acquisition is expected to be deductible for tax purposes.
For the year ended June 30, 2018, BCNL and UCI accounted for $2,424 in revenues and $1,379 in net loss since September 29, 2017. If the acquisition had been completed on July 1, 2017, the Company estimates it would have recorded an increase of $1,062 in revenues and an increase of $41 in net loss for the year ended June 30, 2018.
(ii) Hempco Food and Fiber Inc. (“Hempco”)
On November 14, 2017, the Company acquired a 22.3% ownership interest in Hempco by sub-scribing to its private placement of 10,558,676 units at $0.3075 per unit for gross proceeds of $3,247. Each unit consisted of one common share and one warrant exercisable at $0.41 per share for a period of two years, subject to accelerated expiry if Hempco’s shares trade at or above a VWAP of $0.65 for any 30-day period. The gross proceeds paid were offset against the $2,301 loan principal and accrued interest receivable from Hempco.
The Company also entered into a call option agreement to acquire up to an aggregate of 10,754,942 shares from the majority owners of Hempco, which upon exercise would bring the Company’s total ownership interest in Hempco to over 50.1% on a fully diluted basis. As a result, due primarily to potential voting rights, the Company has control over Hempco, and the results of Hempco have been consolidated in these financial statements. The non-controlling interest
13. BUSINESS COMBINATIONS AND ASSET ACQUISITIONS (CONTINUED)(a) Business combinations (Continued)
(i) BC Northern Lights Enterprises Ltd. (“BCNL”) and Urban Cultivator Inc. (“UCI”) (Continued)
Notes to Financial Statements 97

recognized at the acquisition date was recorded at its proportionate share of Hempco’s fair value of identifiable net assets.
Hempco, a Canadian public company listed on the TSX Venture Exchange, is a producer of indus-trial hemp products and is developing hemp foods, hemp fiber and hemp nutraceuticals. The Company anticipates regulations preventing industrial hemp producers from harvesting leaves, flowers and buds, which contain Cannabidiols (“CBD”) will be revised to allow for processing of CBDs which Aurora intends to use for the production of capsules, oils and topicals.
At the date of acquisition, management was in the process of gathering the relevant informa-tion that existed as at the acquisition date to determine the fair value of net identifiable assets acquired. As such, the initial purchase price was provisionally allocated based on the Company’s estimated fair value of the identifiable assets acquired and the liabilities assumed on the acquisition date. Management continues to work on finalizing the purchase price allocation and identifying the fair value of identifiable net assets acquired.
Provisional allocationat acquisition Adjustments
Adjustedbalance
$ $ $Net identifiable assets acquired 7,499 (731) 6,768Non-controlling interest at acquisition (77.7%) (6,503) 568 (5,935)Goodwill 2,251 163 2,414
3,247 - 3,247
Goodwill represents expected synergies, future income and growth, and other intangibles that do not qualify for separate recognition. None of the goodwill arising on this acquisition is expected to be deductible for tax purposes.
If the acquisition had been completed on July 1, 2017, the Company estimates that it would have recorded an increase of $305 in revenues and an increase of $329 in net loss based on its 22.3% initial interest in Hempco upon obtaining control.
Non-controlling interest
Non-controlling interest has been recognized at the non-controlling interest’s proportionate share of the acquiree’s net assets. On March 22, 2018 and May 7, 2018, the Company increased its ownership interest in Hempco to 35.12% and 52.3% through the exercise of 10,558,676 share purchase warrants at $0.41 for a cost of $4,329, and the exercise of its call option to purchase 10,754,942 shares from two founders at $0.40 per share for a cost of $4,302, respectively. As a result, the non-controlling interest was reduced proportionately for Aurora’s increase in ownership. The $1,941 difference between the $2,361 proportionate change in non-controlling interest and the $4,302 fair value of consideration paid was recognized in equity attributable to the Aurora. The $4,329 fair value consideration paid for the exercise of Hempco warrants was eliminated upon consolidation.
13. BUSINESS COMBINATIONS AND ASSET ACQUISITIONS (CONTINUED)(a) Business combinations (Continued)
(ii) Hempco Food and Fiber Inc. (“Hempco”) (Continued)
98 Aurora Cannabis Inc. 2018 Annual Report

The following is a continuity of Hempco’s non-controlling interest:
$Balance, June 30, 2017 -Non-controlling interest arising on acquisition of Hempco 2,905Non-controlling interest relating to outstanding Hempco vested share options and warrants at acquisition (1) 3,030Non-controlling interest relating to exercised Hempco share options and warrants (1) 3,649Non-controlling interest transferred to Aurora for increase in ownership (2,361)Share of loss for the year (2,376)Balance, June 30, 2018 4,847
(1) As at the acquisition date of November 14, 2017, directors, officers, employees and consultants of Hempco held options to purchase 2,851,000 common shares of Hempco which expire between April 2019 and April 2022, of which 777,917 of the outstanding stock options had vested. Hempco also had 2,505,120 warrants outstanding exercisable into common shares which expire between November 2017 and March 2019.
$3,030 represents the market-based measure of these vested options and warrants in accordance with IFRS at the date of acquisition. During the year ended June 30, 2018, the Company recognized share-based payments of $1,519 for Hempco’s stock options vested during the period from the date of acquisition.
During the year ended June 30, 2018, 667,000 stock options and 12,850,709 warrants were exercised into common shares of Hempco. Of the 12,850,709 warrants exercised, 10,558,676 were exercised by Aurora. Accordingly, the Company recognized total stock option reserves of $1,738 and warrant reserves of $588 which were allocated to non-controlling interest (Note 19(b)(iv)).
(iii) Larssen Ltd. (“Larssen”)
On December 4, 2017, the Company, through its wholly-owned subsidiary, Aurora Larssen Projects Inc., completed the acquisition of Larssen, a Canadian company that provides consulting on the design, engineering and construction oversight for advanced greenhouse cultivation facilities. The Company brought Larssen’s expertise in-house to construct Aurora’s production facilities as well as facilities for the Company’s strategic partners.
The Company acquired all of the issued and outstanding shares of Larssen for aggregate consid-eration of $3,500 cash. As part of the acquisition agreement, an aggregate of $4,000 gross cash contingent consideration is to be paid out on the first and second anniversaries of the acquisition date subject to the continued employment of the President and Owner of Larssen. Additionally, the acquisition agreement included an aggregate $6,000 gross project contingent consideration to be paid out on achievement of future performance milestones related to construction projects completed by Larssen. The project contingent consideration can be satisfied at the election of Aurora in cash or common shares based on the VWAP of the Company’s shares for the first five trading days of the next calendar year when a milestone is met. Both the cash and project contingent consideration are accounted for as post-combination services and expensed through profit and loss. During the year ended June 30, 2018, the Company accrued $1,250 compensa-tion expense for the cash contingent consideration. None of the project milestones were met at June 30, 2018.
13. BUSINESS COMBINATIONS AND ASSET ACQUISITIONS (CONTINUED)(a) Business combinations (Continued)
(ii) Hempco Food and Fiber Inc. (“Hempco”) (Continued)
Notes to Financial Statements 99

The transaction was accounted for as a business combination. At the date of acquisition, management was in the process of gathering the relevant information that existed as at the acquisition date to determine the fair value of net identifiable assets acquired. As such, the initial purchase price was provisionally allocated based on the Company’s estimated fair value of the identifiable assets acquired and the liabilities assumed on the acquisition date. Subsequently, the Company finalized the purchase price allocation and has adjusted the fair value of contingent consideration. Accordingly, the purchase price allocation has been retrospectively adjusted to reflect changes to the assets acquired and liabilities assumed at the acquisition date as follows:
Provisional allocationat acquisition Adjustments Final
$ $ $Net identifiable assets acquired - - -Goodwill 9,724 (6,224) 3,500
9,724 (6,224) 3,500
Goodwill represents expected operational synergies, future income and growth, and other intan-gibles that do not qualify for separate recognition. None of the goodwill arising on this acquisition is expected to be deductible for tax purposes.
For the year ended June 30, 2018, Larssen generated revenues of $4,218 and accounted for $3,000 in net income since December 4, 2017.
(iv) CanniMed Therapeutics Inc. (“CanniMed”)
On March 15, 2018, the Company acquired an 87.2% ownership interest in CanniMed pursuant to an offer (the “Offer”) to acquire all of the issued and outstanding CanniMed Shares not owned by Aurora. The Offer provided CanniMed shareholders with the right to elect to receive for each CanniMed share:(a) 3.40 common shares of Aurora;(b) $0.43 in cash; or(c) any combination of common shares and cash, subject to proration of a maximum aggregate
cash amount of $140,000.
Total consideration paid upon acquisition of control was $837,853 comprised of $130,979 cash and 62,833,216 common shares with a fair value of $706,874. The Company acquired CanniMed to increase production capacity, international presence, research and development portfolio, patient count and revenue growth. CanniMed is a Canadian company previously listed on the TSX and is in the business of production and distribution of medical cannabis pursuant to the ACMPR.
At the date of acquisition, management was in the process of gathering the relevant informa-tion that existed as at the acquisition date to determine the fair value of net identifiable assets acquired. As such, the initial purchase price was provisionally allocated based on the Company’s estimated fair value of the identifiable assets acquired and the liabilities assumed on the acquisi-tion date. Management continues to work on finalizing the purchase price allocation for the fair value of intangible assets acquired and the allocation of goodwill.
13. BUSINESS COMBINATIONS AND ASSET ACQUISITIONS (CONTINUED)(a) Business combinations (Continued)
(iii) Larssen Ltd. (“Larssen”) (Continued)
100 Aurora Cannabis Inc. 2018 Annual Report

Provisional allocationat acquisition Adjustments
AdjustedBalance
$ $ $Net identifiable assets acquired 54,204 162,421 216,625Fair value of previously held equity interest (Note 8(b)) (26,567) - (26,567)Non-controlling interest at acquisition (12.8%) (6,971) (25,615) (32,586)Goodwill 817,187 (136,806) 680,381
837,853 - 837,853
Goodwill represents expected synergies, future income and growth, and other intangibles that do not qualify for separate recognition. None of the goodwill arising on this acquisition is expected to be deductible for tax purposes.
On both a consolidated basis and stand-alone entity basis before the elimination of intercompany transactions, for the year ended June 30, 2018, CanniMed generated $6,715 in revenues and accounted for $3,250 in net and comprehensive loss since March 15, 2018. If the acquisition had been completed on July 1, 2017, the Company estimates that it would have recorded an increase of $11,710 in revenues and an increase of $37,640 in net loss based on its initial 87.2% interest in CanniMed.
Non-controlling interest
Non-controlling interest has been recognized at the non-controlling interest’s proportionate share of CanniMed’s fair value of identifiable net assets. On March 26, 2018 and May 1, 2018, the Company increased its ownership interest in CanniMed by 8.7% and 4.1%, respectively, and obtained 100% interest in CanniMed. The Company paid $106,214 for the additional 12.8% interest comprised of $14,304 in cash and 9,913,630 common shares of Aurora with a fair value of $91,910. As a result, the non-controlling interest was reduced proportionately for Aurora’s increase in ownership. The $73,573 difference between the $32,641 proportionate change in non-controlling interest and the $106,214 fair value of consideration paid was recognized in equity attributable to the Aurora.
The following is a continuity of CanniMed’s non-controlling interest:
$Balance, June 30, 2017 -Non-controlling interest arising on acquisition of CanniMed 32,568Non-controlling interest relating to outstanding CanniMed vested share options at acquisition (1) 18Non-controlling interest relating to exercised CanniMed share options (1) 47Non-controlling interest adjustment for Aurora’s increase in ownership (32,641)Share of income in the period 8Balance, June 30, 2018 -
(1) As at the March 15, 2018 acquisition date, a CanniMed employee held fully vested options to purchase 10,000 CanniMed common shares expiring October 31, 2018. $18 represents the market-based measure of these vested options in accordance with IFRS at the date of acquisition. During the year ended June 30, 2018, the remaining 10,000 stock options were exercised into CanniMed common shares and accordingly, the Company recognized total stock option reserves of $47 which was allocated to the non-controlling interest.
13. BUSINESS COMBINATIONS AND ASSET ACQUISITIONS (CONTINUED)(a) Business combinations (Continued)
(iv) CanniMed Therapeutics Inc. (“CanniMed”) (Continued)
Notes to Financial Statements 101

At June 30, 2018, CanniMed held $30,360 current assets, $34,833 non-current assets, $4,042 current liabilities and $8,986 non-current liabilities before the elimination of intercompany transactions.
Completed during the year ended June 30, 2017CanvasRx
(v)Pedanios
(vi) Total$ $ $
Consideration paidCash 1,825 3,019 4,844Common shares - 20,709 20,709Loan 450 - 450Patient milestones achievedCash 1,575 - 1,575Common shares 11,440 - 11,440Other liabilities assumed 18 - 18Contingent consideration 21,819 - 21,819
37,127 23,728 60,855Net identifiable assets (liabilities) acquired
Cash - 743 743Accounts receivables 251 358 609Inventories - 328 328Prepaid expenses and deposits - 6 6Office, furniture, equipment - 13 13Intangible assetsCustomer relationships 4,250 - 4,250Permits and licenses - 22,544 22,544
4,501 23,992 28,493
Accounts payable and accruals (109) (264) (373)Deferred revenue (939) - (939)Deferred tax liability (836) (6,590) (7,426)
2,617 17,138 19,755Purchase price allocation
Net identifiable assets acquired 2,617 17,138 19,755Goodwill 34,510 6,590 41,100
37,127 23,728 60,855Net cash outflows
Cash consideration paid 3,400 3,019 6,419Bank overdraft (cash acquired) 18 (743) (725)
3,418 2,276 5,694Acquisition costs expensed
Year ended June 30, 2017 1,022 243 1,265Year ended June 30, 2018 884 28 912
Net accounts receivables acquiredGross contractual receivables acquired 251 358 609Receivables expected to be uncollectible - - -Net accounts receivables acquired 251 358 609
(v) CanvasRx Inc. (“CanvasRx”)
On August 17, 2016, the Company completed the acquisition of all of the issued and outstanding shares of CanvasRx pursuant to a Share Purchase Agreement dated August 9, 2016, as amended and restated on August 16, 2016 for a total consideration of $37,127 comprised of $1,825 cash, $11,440 fair value of 17,875,000 common shares and $1,575 cash for performance milestones achieved related to patients, $450 loan to CanvasRx, $18 other liabilities assumed and $21,819 contingent consideration. The Company is indemnified from any tax liability arising from pre-acquisition transactions of CanvasRx through adjustments to the purchase consideration.
13. BUSINESS COMBINATIONS AND ASSET ACQUISITIONS (CONTINUED)(a) Business combinations (Continued)
(iv) CanniMed Therapeutics Inc. (“CanniMed”) (Continued)
102 Aurora Cannabis Inc. 2018 Annual Report

Goodwill represents the expected benefit of future market share, future income growth, and other intangibles that do not qualify for separate recognition. None of the goodwill arising on this acquisition is deductible for tax purposes.
Contingent consideration represents the estimated discounted value of the $26,750 gross consid-eration to be paid out over three years on achievement of future performance milestones related to new counseling rooms opened, patient accruals and revenue targets. This consideration may be satisfied, at the Company’s sole discretion, in cash or common shares at a 15% discount to the market price at the date of issuance, unless the market price of the Company’s share is $0.47 or below, at which point the consideration is convertible into a fixed number of shares. In any case, the issuance of the Company’s shares should not result in former CanvasRx shareholders accumulating 50% or more of the Company’s shares. If the consideration payments cannot be satisfied in cash and the issuance of shares would result in the former shareholders of CanvasRx accumulating 50% or more of the Company’s shares, a convertible debenture will be issued.
During the year ended June 30, 2018, certain patient and counselling room performance mile-stones were achieved, and the Company paid $Nil cash (2017 – $2,608) and issued 5,318,044 shares (2017 – 2,926,103 shares) at a weighted average price of $2.71 per share (2017 – $2.532 per share) to the former shareholders of CanvasRx. As of June 30, 2018, the fair value of remaining contingent consideration was $5,884 (2017 - $13,221).
The Company acquired CanvasRx to access its database on cannabis strains and related efficacy data, as well as information on physician preferences and ordering patterns. CanvasRx is a coun-seling and outreach service provider with over 24 physical locations in the provinces of Ontario and Alberta, Canada. The transaction was accounted for as a business combination.
For the year ended June 30, 2017, CanvasRx accounted for $1,702 in net loss since August 17, 2016, including revenues of $2,145. If the acquisition had been completed on July 1, 2016, the Company estimates it would have recorded an increase of $159 in revenues and an increase of $920 in net loss for the year ended June 30, 2017. Acquisition costs of $884 incurred in the current year (2017 - $1,022) related to certain contingent consideration and post-closing costs were excluded from the consideration transferred and were recognized as an expense in the current period.
(vi) Pedanios GmbH (“Pedanios”), Renamed Aurora Deutschland GmbH (“Aurora Deutschland”)
On May 30, 2017, the Company completed the acquisition of Pedanios, a registered wholesale importer, exporter and distributor of medical cannabis in Germany. The acquisition positions the Company to seize on opportunities in Germany and the EU’s emerging cannabis industry. The Company acquired all of the issued and outstanding shares of Pedanios for a total consideration of $23,728 comprised of €2,000 cash and 8,316,782 common shares with a fair value of $20,709. The transaction was accounted for as a business combination.
Goodwill reflects the deferred tax liability recognized for all taxable temporary differences. None of the goodwill arising on this acquisition is deductible for tax purposes.
For the year ended June 30, 2017, Pedanios accounted for $294 in net loss since May 30, 2017, including revenues of $439. If the acquisition had been completed on July 1, 2016, the Company estimates it would have recorded an increase of $1,702 in revenues and an increase of $18 in net loss for the year ended June 30, 2017.
13. BUSINESS COMBINATIONS AND ASSET ACQUISITIONS (CONTINUED)(a) Business combinations (Continued)
(v) CanvasRx Inc. (“CanvasRx”) (Continued)
Notes to Financial Statements 103

(b) Asset acquisitions
Completed during the year ended
June 30, 2018H2 (i)
June 30, 2017Peloton
(ii)$ $
Consideration paidCash paid - 4,717Common shares issued 15,283 1,486Cash acquisition costs paid 636 2,186Shares issued for acquisition costs - 905Loan settlement 3,000 -Contingent consideration 14,957 -
33,876 9,294Net identifiable assets (liabilities) acquiredCash 205 -Accounts receivables 369 -Property, plant and equipment 8,304 4,846Intangible assets – Permits and licenses 27,165 4,448
36,043 9,294Accounts payable and accruals (2,167) -
33,876 9,294
(i) H2 Biopharma Inc. (“H2” or “Aurora Eau”)
On November 30, 2017, the Company acquired 100% of the net assets of H2 for a total consid-eration of $33,876 comprised of 1,910,339 common shares with a fair value of $15,283, of which 181,622 were placed in escrow, settlement of $3,000 loan receivable, $14,957 contingent con-sideration payable and $636 acquisition costs. The contingent consideration payable represents the discounted value of the $15,028 gross consideration to be paid out over a five-year period on achievement of future performance milestones related to completing the construction of the facility and obtaining the relevant licenses to cultivate and sell cannabis. This consideration is to be paid in common shares based on the VWAP of the Company’s shares for the last five trading days immediately prior to the Company confirming that the particular milestone has been achieved. On closing, the Company issued and deposited 2,878,934 common shares into escrow for the contingent consideration. As of June 30, 2018, the fair value of contingent consideration was $14,207 (Note 28(e)).
During the year ended June 30, 2018, 238,044 common shares with a fair value of $1,904 were released from escrow upon the achievement of milestones (Note 19(b)(ii) and 19(c)).
At acquisition, H2 was completing a purpose-built 48,000 square foot cannabis production facility, which upon completion, is projected to produce approximately 4,500 kilograms of cannabis per annum. The facility is located on 46 acres of land located in Lachute, Quebec which H2 has the right to acquire for $136.
The facility, known as Aurora Eau, completed construction and received both its cultivation and sales license from Health Canada in September 2018.
(ii) Peloton Pharmaceuticals Inc. (“Peloton” or “Aurora Vie”)
On April 28, 2017, the Company, through its wholly-owned subsidiary, 10094595 Canada Inc., acquired 100% of the net assets of Peloton, a late-stage ACMPR applicant, out of bankruptcy pro-tection. The transaction was accounted for as an asset acquisition. The Company acquired all of the common shares of Peloton for a total consideration of $9,294 comprised of 573,707 common
13. BUSINESS COMBINATIONS AND ASSET ACQUISITIONS (CONTINUED)
104 Aurora Cannabis Inc. 2018 Annual Report

shares with a fair value of $1,486, $4,717 cash, and acquisition costs of $3,091 of which $2,186 was paid in cash and $905 was paid through the issuance of 325,518 common shares.
In October 2017, the Company completed construction of the former Peloton 40,000 square foot cannabis production facility located in Pointe Claire, Quebec. The facility, known as Aurora Vie, received its cultivation and sales license from Health Canada on October 27, 2017 and June 29, 2018, respectively.
14. CONTROLLING INTEREST IN AURORA NORDIC CANNABIS A/S (“AURORA NORDIC”)On February 12, 2018, the Company and Alfred Pederson & Søn (“APS”) formed Aurora Nordic, a company located in Odense, Denmark. Pursuant to an agreement with APS, the Company and APS contributed $58 (DKK 255,000) and $56 (DKK 245,000) for the initial capital contribution, resulting in 51% and 49% ownership interest, respectively. $100,000 in total additional capital is to be contrib-uted on a pro rata basis to fund the design, development and construction of a production facility in Denmark. Based on majority voting rights and other qualitative factors, the Company controls Aurora Nordic and has consolidated its results in these financial statements.
Aurora Nordic is in the business of cultivation, production, distribution and sale of medical cannabis. Aurora Nordic is retrofitting an existing 100,000 square foot greenhouse and will be constructing a new 1,000,000 square foot production facility.
Non-controlling interest
The non-controlling interest recognized at inception was recorded at its proportionate share of Aurora Nordic’s initial capital contribution.
$Balance, June 30, 2017 -Non-controlling interest on initial capital contribution 56Share of profit (loss) for the period (337)Share of other comprehensive income (loss) for the period (4)Balance, June 30, 2018 (285)
As of June 30, 2018, Aurora Nordic held $419 current assets, $2,896 non-current assets, $993 current liabilities, and $2,905 non-current liabilities before the elimination of intercompany trans-actions. For the year ended June 30, 2018, Aurora Nordic generated $nil revenues and incurred $688 net and comprehensive loss before the elimination of intercompany transactions.
13. BUSINESS COMBINATIONS AND ASSET ACQUISITIONS (CONTINUED)(b) Asset acquisitions (Continued)
(ii) Peloton Pharmaceuticals Inc. (“Peloton” or “Aurora Vie”) (Continued)
Notes to Financial Statements 105

15. ASSETS HELD FOR DISTRIBUTION TO OWNERS
Accounting PolicyNon-current assets held for sale and disposal groups are presented separately in the current section of the balance sheet when management is committed to immediately distributing the asset or disposal group in its present condition, and this distribution is highly probable and expected to be completed within one year. Immediately before the initial classification of the assets and disposal groups as held for sale or for distribution, the carrying amounts of the assets, or all the assets and liabilities in the disposal groups, are measured in accordance with the applicable accounting policy:
Current assets Amortized cost Loans receivable from AHL Loans and receivable at amortized cost SubTerra assets Fair value at initial recognition and subsequently at
amortized cost Current liabilities Other financial liabilities at amortized cost
Assets held for sale and disposal groups are subsequently measured at the lower of their carrying amount and fair value less cost to sell. Assets held for sale are no longer amortized or depreciated.
Significant JudgementThe Company used judgement in estimating the fair value of the SubTerra assets at initial recognition. In determining the fair value of the revenue royalty, management exercised judgement in determining the likelihood of SubTerra generating revenues from the sale of cannabis-based products. The fair value of the annuity receivable was estimated using the effective interest method using a ten-year corporate debt yield at the measurement date.
In June 2018, the Company began reorganizing the Company for the spin-out of ACI and its United States (“U.S.”) assets, and filed a prospectus for the listing of ACI on the Canadian Stock Exchange (“CSE”). As part of the reorganization, on June 13, 2018, the Company completed a series of intercorporate transactions involving Aurora and its subsidiaries resulting in Aurora holding a direct interest in 100% of the outstanding shares and warrants of ACI, and ACI holding all of the U.S. assets of Aurora and its subsidiaries, consisting of the following:• a 50% joint venture interest in Australis Holdings (Note 12(a)); and• the SubTerra assets (Note 12(d)).
On June 14, 2018, the Company and ACI entered into a Funding Agreement pursuant to which Aurora advanced $500,000 to ACI, in consideration for which ACI provided Aurora with a Restricted Back-in Right, by issuing to Aurora:
(i) a warrant to purchase a number of ACI shares equal to 20% of the issued and outstanding shares as of the date on which ACI shares commence trading on the CSE, exercisable for a period of ten years from the date of issue at an exercise price of $0.20 per share; and
(ii) a warrant to purchase a number of ACI shares equal to 20% of the issued and outstanding shares as of the date of exercise, exercisable for a period of ten years from the date of issue at an exercise price equal to the five-day volume weighted average trading price of ACI’s shares on the CSE or such other stock exchange on which the shares may then be listed.
Aurora will be prohibited from exercising the Restricted Back-in Right unless all of ACI’s business operations in the U.S. are legal under applicable federal and state laws, and Aurora has received the consent of the TSX and any other stock exchange on which Aurora may be listed, as required.
106 Aurora Cannabis Inc. 2018 Annual Report

The assets reclassified for distribution to owners at June 30, 2018 are part of the medical cannabis segment and is comprised of the following:
Note June 30, 2018 June 30, 2017$ $
Total and net assets held for distribution to ownersCurrent assets 2 -Loans receivable from AHL 12(a) 3,020 1,736SubTerra assets 12(d) 1,400 -
4,422 1,736
Subsequent to June 30, 2018, the Company completed the spin-out of ACI (Note 31).
16. INTANGIBLE ASSETS AND GOODWILL
Accounting Policy
Intangible assetsIntangible assets are recorded at cost less accumulated amortization and impairment losses, if any. Intangible assets acquired in a business combination are measured at fair value at the acquisition date. Amortization of definite life intangibles is provided on a straight-line basis over their estimated useful lives, which do not exceed the contractual period, if any, over the following terms:
Customer relationships 2 – 7 years
Patents 10 years
Health Canada licenses Useful life of the facility or lease term
The estimated useful lives, residual values, and amortization methods are reviewed at each year end, and any changes in estimates are accounted for prospectively. Intangible assets with an indefinite life or not yet available for use are not subject to amortization. The Company’s indefinite life intangible assets are comprised of brands and the Aurora Deutschland licenses and permits. The Aurora Deutschland licenses and permits do not expire, and as such, there is no foreseeable limit to the period over which these assets are expected to generate future cash inflows to the Company.
Research costs are expensed as incurred. Development expenditures are capitalized only if development costs can be measured reliably, the product or process is technically and commercially feasible, future economic benefits are probable, and the Company intends to and has sufficient resources to complete development to use or sell the asset. Other development expenditures are recognized as research and development expenses on the consolidated statement of comprehensive income (loss) as incurred. Capitalized deferred development costs are internally generated intangible assets.
GoodwillGoodwill represents the excess of the purchase price paid for the acquisition of an entity over the fair value of the net tangible and intangible assets acquired. Goodwill is allocated to the cash generating unit (“CGU”) or group of CGUs which are expected to benefit from the synergies of the combination.
Impairment of intangible assets and goodwillGoodwill and intangible assets with an indefinite life or not yet available for use are tested for impair-ment annually, and whenever events or circumstances make it more likely than not that an impairment may have occurred, such as a significant adverse change in the business climate or a decision to sell or dispose all or a portion of a reporting unit. Finite life intangible assets are tested when there is an indica-tion of impairment.
15. ASSETS HELD FOR DISTRIBUTION TO OWNERS (CONTINUED)
Notes to Financial Statements 107

Accounting Policy (Continued)
Impairment of intangible assets and goodwill (Continued)The Company has selected June as our annual test date. For the purpose of impairment testing, goodwill and indefinite life intangible assets have been allocated to CGUs representing the lowest level that the assets are monitored for internal reporting purposes. Goodwill and indefinite life intangible assets are tested for impairment by comparing the carrying value of each CGU containing the assets to its recover-able amount. An impairment loss is recognized for the amount by which the asset’s carrying amount exceeds it recoverable amount. The recoverable amount is the higher of the asset’s fair value less costs of disposal and value-in-use.
Impairment losses recognized in respect of a CGU are first allocated to the carrying value of goodwill and any excess is allocated to the carrying amount of assets in the CGU. Any impairment is recorded in profit and loss in the period in which the impairment is identified. A reversal of an impairment loss for a CGU is allocated to the assets of the unit, except for goodwill, pro rata with the carrying amount of those assets. In allocating a reversal of an impairment loss, the carrying amount of an asset shall not be increased above the lower of its recoverable amount and the carrying amount that would have been determined had no impairment loss ben recognized for the asset in prior period. Impairment losses on goodwill are not subsequently reversed.
Significant JudgementAmortization of intangible assets is dependent upon estimates of useful lives and residual values which are determined through the exercise of judgement.
CGUs are determined based on the smallest identifiable group of assets that generates cash inflows that are largely independent of cash inflows from other assets or group of assets. Management has exercised judgment in this assessment and determined the Company’s CGUs to be: the production and sale of medical cannabis; patient counselling services; design, engineering and construction consulting services; the production and sale of indoor cultivators; and the production and sale of hemp related food products.
16. INTANGIBLE ASSETS AND GOODWILL (CONTINUED)
108 Aurora Cannabis Inc. 2018 Annual Report

The following is a continuity of intangible assets and goodwill:
Definite life intangibles subject to amortization Indefinite life intangiblesCustomerRelation-
shipsNotes
13(a)(i)(iv)(v)
Permits and
LicensesNotes
13(a)(iv), (b)(i)(ii)
PatentsNotes
13(a)(i)(iv)
TotalDefinite LifeIntangibles
BrandNotes 13(a)
(i)(iv)
Permits and
LicensesNote 13(a)
(vi)
Total Indefinite
LifeIntangibles
Total Intangible
Assets
GoodwillNote13(a)
Total Intangible
Assets and Goodwill
$ $ $ $ $ $ $ $ $ $CostBalance, June 30, 2016 - - - - - - - - - -Additions from acquisitions 4,250 4,293 - 8,543 - 22,544 22,544 31,087 41,100 72,187Balance, June 30, 2017 4,250 4,293 - 8,543 - 22,544 22,544 31,087 41,100 72,187Additions from acquisitions 7,105 92,421 2,221 101,747 127,654 - 127,654 229,401 687,950 917,351Balance, June 30, 2018 11,355 96,714 2,221 110,290 127,654 22,544 150,198 260,488 729,050 989,538Accumulated amortizationBalance, June 30, 2016 - - - - - - - - - -Amortization - - - - - - - - - -Balance, June 30, 2017 - - - - - - - - - -Amortization 2,224 1,943 89 4,256 - - - 4,256 - 4,256Balance, June 30, 2018 2,224 1,943 89 4,256 - - - 4,256 - 4,256
Net book valueJune 30, 2017 4,250 4,293 - 8,543 - 22,544 22,544 31,087 41,100 72,187June 30, 2018 9,131 94,771 2,132 106,034 127,654 22,544 150,198 256,232 729,050 985,282
Permits and licenses of $22,544 were acquired from Pedanios (Note 13(a)(vi)) and are classified as indefinite life intangible assets as they do not have an expiration date. The remaining permits and license are amortized over the life of the production facilities when they are available for use as intended.
The $22,544 licenses and permits acquired from Pedanios and $127,000 of the brand indefinite life intangibles acquired from CanniMed (Note 13(a)(iv)) are allocated to the group of CGUs that comprise the medical cannabis segment. The remaining $654 of the brand intangibles are allocated to the indoor cultivation CGU (Note 13(a)(i)).
Amortization of intangible assets is included in depreciation and amortization in the statement of comprehensive income (loss).
For the purposes of impairment testing, goodwill associated with the B.C. Northern Lights Enterprises Ltd. and Urban Cultivator Inc. acquisitions belong to the indoor cultivation CGU, goodwill associated with the Hempco Food and Fiber Inc. acquisition belong to the hemp related food products CGU, and goodwill associated for all remaining acquisitions belong to the group of CGUs that comprise the medical cannabis segment. Of the $729,050 goodwill balance at June 30, 2018, $724,981 is allocated to the medical cannabis segment. The remaining $4,069 balance in goodwill is attributable to the indoor cultivation and hemp related food product CGUs.
The Company estimated the recoverable amount of goodwill and indefinite life intangible assets based on the value-in-use method which was higher than the carrying value at June 30, 2018. The key assumptions used in the calculation of the recoverable amount include sales growth per year, changes in cost of sales and capital expenditures based on internal forecasts which were projected out 3 years with a terminal growth rate of 2%. The range of weighted average cost of capital was determined to be approximately 15% - 25% based on a risk-free rate, an equity risk premium
16. INTANGIBLE ASSETS AND GOODWILL (CONTINUED)
Notes to Financial Statements 109

adjusted for betas of comparable publicly traded companies, an unsystematic risk premium, and an after-tax cost of debt. The Company believes that a slight change in the key assumptions would not cause the recoverable amount to decrease below the carrying value.
17. CONVERTIBLE DEBENTURES
Accounting PolicyConvertible notes are compound financial instruments which are accounted for separately by their compo-nents: a financial liability and an equity instrument. The financial liability, which represents the obligation to pay coupon interest on the convertible notes in the future, is initially measured at its fair value and subsequently measured at amortized cost. The residual amount is accounted for as an equity instrument at issuance.
Transaction costs are apportioned to the debt liability and equity components in proportion to the allocation of proceeds as a reduction to the carrying amount of the liability and equity component.
The liability component of the convertible notes was valued using Company specific interest rates assuming no conversion features existed. The resulting debt component is accreted to its fair value over the term to maturity as a non-cash interest charge and the equity component is presented in convertible notes reserve as a separate component of shareholders’ equity.
Significant JudgementThe identification of convertible note components is based on interpretations of the substance of the contractual arrangement and therefore requires judgement from management. The separation of the components affects the initial recognition of the convertible debenture at issuance and the subsequent recognition of interest on the liability component. The determination of the fair value of the liability is also based on a number of assumptions, including contractual future cash flows, discount rates and the presence of any derivative financial instruments.
May 2016(a)
Sep 2016(b)
Nov 2016 (c)
May 2017 (d)
Nov 2017 (e)
Mar 2018 (f) Total
$ $ $ $ $ $ $Balance, June 30, 2016 1,281 - - - - - 1,281Issued - 15,000 25,000 75,000 - - 115,000Equity portion - (2,107) (5,271) (13,209) - - (20,587)Conversion (2,135) (12,605) (16,745) (122) - - (31,607)Interest paid (2) (55) (989) (849) - - (1,895)Financing fees 637 (606) (899) (2,622) - - (3,490)Accretion 117 241 1,277 1,094 - - 2,729Accrued interest 102 132 996 875 - - 2,105Balance, June 30, 2017 - - 3,369 60,167 - - 63,536Issued - - - - 115,000 230,000 345,000Equity portion - - - - (39,408) (39,530) (78,938)Conversion - - (3,688) (63,102) (73,082) (195) (140,067)Interest paid - - (148) (2,131) (1,025) (3,604) (6,908)Financing fees - - - - (2,680) (6,455) (9,135)Accretion - - 218 2,768 809 6,845 10,640Accrued interest - - 249 2,298 1,023 3,830 7,400Balance, June 30, 2018 - - - - 637 190,891 191,528
(a) In May 2016, the Company completed a non-brokered private placement of 10% unsecured convertible debentures in the principal amount of $2,050. The debentures were convertible into common shares of the Company at $0.53 per share for a period of 18 months. In September 2016, the Company issued an aggregate of 5,674,542 shares on the conversion of $2,050 principal amount of debentures (Note 19(b)(iv)).
16. INTANGIBLE ASSETS AND GOODWILL (CONTINUED)
110 Aurora Cannabis Inc. 2018 Annual Report

(b) On September 28, 2016, the Company closed a non-brokered private placement of 10% unsecured convertible debentures in the aggregate principal amount of $15,000. The debentures were convertible into common shares of the Company at a price of $1.15 per share subject to a forced conversion if the VWAP of the Company’s common shares equals or exceeds $2.00 per share for 10 consecutive trading days. On closing, the Company paid the Agent a commission of $600 and legal fees and expenses of $105.
On October 20, 2016, the Company converted all the debentures and accrued interest pursuant to the forced conversion related to the VWAP mentioned above. During the period ended June 30, 2017, the Company issued 13,110,184 common shares on the conversion of $15,000 principal amount of debentures (Note 19(b)(iv)).
(c) On November 1, 2016, the Company completed a brokered private placement of two-year unsecured convertible debentures in the aggregate principal amount of $25,000. The debentures bore interest at 8% per annum, payable semi-annually. The principal amount of the debentures was convertible into common shares of the Company at a price of $2.00 per share subject to a forced conversion if the VWAP of the Company’s common shares equaled or exceeded $3.00 per share for 10 consecutive trading days. On closing, the Company paid the Agent a commission of $1,000 and legal fees and expenses of $139.
On November 6, 2017, the Company elected to exercise its right pursuant to the forced conversion and converted all of the principal amount outstanding of the remaining debentures. During the year ended June 30, 2018, the Company issued 2,310,000 common shares (2017 – 10,190,000 shares) on the conversion of $4,620 principal amount of debentures (2017 - $20,380) (Note 19(b)(iv)).
(d) On May 2, 2017, the Company completed a private placement of two-year unsecured convertible debentures in the aggregate principal amount of $75,000. The debentures bore interest at 7% per annum, payable semi-annually. The debentures were convertible into common shares of the Company at a price of $3.29 per share subject to a forced conversion if the VWAP of the Company’s common shares exceeded $4.94 per share for 10 consecutive trading days. On closing, the Company paid the agent a commission of $2,893 and legal fees and expenses of $289.
On November 16, 2017, the Company elected to exercise its right pursuant to the forced conversion and converted all of the principal amount outstanding of the remaining debentures. During the year ended June 30, 2018, the Company issued 22,750,747 common shares (2017 – 45,593 shares) on the conversion of $74,850 principal amount of debentures (2017 - $150) (Note 19(b)(iv)).
(e) On November 28, 2017, the Company completed an offering of 115,000 special warrants exercisable into convertible debentures for gross proceeds of $115,000. The Company paid financing fees of $4,077 comprised of underwriters’ commissions of $3,734, legal fees of $304 and regulatory and transfer agent fees of $39.
On January 12, 2018, the special warrants were exercised into $115,000 principal amount of convertible debentures. The debentures are unsecured, bear interest at 6% per annum and mature on November 28, 2022. The principal amount of the debentures is convertible into common shares of the Company at $6.50 per share subject to a forced conversion if after 4 months and 1 day following closing, the VWAP of the Company’s common shares equals or exceeds $9.00 per share for 10 consecutive trading days.
During the year ended June 30, 2018, the Company issued 17,394,146 common shares on partial conversion of $113,062 principal amount of debentures (Note 19(b)(iv)).
(f) On March 9, 2018, the Company completed a private placement of two-year unsecured convertible debentures in the aggregate principal amount of $230,000. The debentures bear interest at 5% per annum, payable semi-annually. The debentures are convertible into common shares of the Company at a price of $13.05 per share subject to a forced conversion if the VWAP of the Company’s common shares exceeded $17.00 per share for 10 consecutive trading days. On closing, the Company paid the agent a commission and expenses of $7,473, legal fees of $304 and regulatory fees of $18.
During the year ended June 30, 2018, the Company issued 18,542 common shares on partial conversion of $242 principal amount of debentures (Note 19(b)(iv)).
17. CONVERTIBLE DEBENTURES (CONTINUED)
Notes to Financial Statements 111

18. LOANS AND BORROWINGS
Accounting PolicyLoans and borrowings are classified as other financial liabilities and are measured at fair value at initial recognition and subsequently at amortized cost. Transactions costs are amortized over the term of the liability.
A lease of property, plant and equipment is classified as a finance lease if it transfers substantially all the risks and rewards incidental to ownership to the Company. A lease of property, plant and equipment is classified as an operating lease whenever the terms of the lease do not transfer substantially all of the risks and rewards of ownership to the lessee. Finance leases are capitalized at the commencement of the lease at the lower of the fair value of the leased property and the present value of the minimum lease payments. Property acquired under a finance lease is depreciated over the shorter of the period of expected use on the same basis as other similar property, plant and equity or the lease term.
The changes in the carrying value of loans and borrowings are as follows:
June 30, 2018
June 30, 2017
$ $Opening balance 351 -Additions - 374Assumed on acquisition (Note 13(a)(iv)) 11,825 -Principal payments (493) (23)Ending balance 11,683 351
As at June 30, 2018, the Company had the following loans and borrowings:
June 30, 2018
June 30, 2017
$ $Term loans (a) 9,971 -Debentures (b) 1,264 -Finance leases (c) 448 351Total loans and borrowings 11,683 351Current portion (2,451) (69)Long-term 9,232 282
(a) Term loans
The term loans were acquired through the CanniMed acquisition (Note 13(a)(iv)) and consist of the following:
June 30,2018
June 30,2017
$ $Capital loan, due for renewal November 2019(interest rate of Bank Prime Rate plus 1.75%) 7,800 -Capital loan, payable in blended monthly instalments of $60, due for renewal November 2019 (5.20%, based on Bank Prime Rate plus 1.75% per annum). 2,171 -
9,971 -Current portion (1,111) -
8,860 -
The term loans are secured by a general security agreement covering all of CanniMed’s assets. Subsequent to June 30, 2018, the Company repaid the full balance of the term loans.
112 Aurora Cannabis Inc. 2018 Annual Report

Covenants
As of June 30, 2018, the Company had met all covenants on its term loans.
(b) Debentures
The debentures were acquired through the CanniMed acquisition (Note 13(a)(iv)) and consist of the following:
Prescribed Rate Maturity Date
June 30,2018
June 30,2017
$ $Debentures 5% December 1, 2018 1,091 -Debentures 12% January 31, 2022 173 -
1,264 -Current portion (1,138) -
126 -
The debentures are secured by all present and after-acquired property of CanniMed and are subordinate to all of CanniMed’s other loans and borrowings.
(c) Finance leases
In September 2016, the Company entered into finance lease agreements related to three production equipment transactions totaling $543, of which down payments of $169 were made. The finance leases are repayable over a period of 3 to 4 years expiring January 2021 and December 2021.
As part of the CanniMed acquisition (Note 13(a)(iv)), the Company acquired a finance lease with monthly principal payments of $10. All amounts outstanding under this lease are repayable on demand, unless and until otherwise demanded, in monthly installments of principal plus interest at prime rate plus 1.00% per annum. Each advance under the finance lease is repayable in full 48 months after the initial advance.
June 30, 2018
June 30, 2017
$ $Less than 1 year 232 108Between 1 and 5 years 279 344Total minimum lease payments (Note 29(b)) 511 452Less: amount representing interest at approximately 8.19% to 20.26% (63) (101)Present value of minimum lease payments 448 351Less: current portion (202) (69)
246 282
18. LOANS AND BORROWINGS (CONTINUED)(a) Term loans (Continued)
Notes to Financial Statements 113

19. SHARE CAPITAL
Accounting PolicyShare capital issued for non-monetary consideration is recorded at an amount based on fair market value of the shares on the date of issue. Transaction costs directly attributable to the issuance of common shares are recognized as a deduction from equity. The proceeds from the exercise of stock options or warrants together with amounts previously recorded in reserves over the vesting periods are recorded as share capital.
The Company issues share purchase warrants and determines the fair value using the Binomial model. The fair value of broker warrants are recognized as share issue costs and recorded to reserves.
Significant JudgementIn estimating the fair value of warrants using the Binomial model, management is required to make certain assumptions and estimates such as the expected life of warrants, volatility of the Company’s future share price, risk free rate, and future dividend yields. Changes in assumptions used to estimate fair value could result in materially different results.
(a) Authorized
The authorized share capital of the Company is comprised of the following:
(i) Unlimited number of common voting shares without par value Each Common Share carries the right to attend and vote at all general meetings of share-holders. Holders of Common Shares are entitled to receive on a pro rata basis such dividends, if any, as and when declared by the Board at its discretion from funds legally available for the payment of dividends and upon the liquidation, dissolution or winding up of the Company and are entitled to receive on a pro rata basis the net assets of the Company after payment of debts and other liabilities, in each case subject to the rights, privileges, restrictions and conditions attaching to any other series or class of shares ranking senior in priority to or on a pro rata basis with the holders of Common Shares with respect to dividends or liquidation. The Common Shares do not carry any pre-emptive, subscription, redemption or conversion rights, nor do they contain any sinking or purchase fund provisions.
(ii) Unlimited number of Class “A” Shares each with a par value of $1.00 Class A shares may be issued from time to time in one or more series, and the directors may fix from time to time before such issue the number of Class A shares of each series and the designation, rights and restrictions attached thereto including any voting rights, dividend rights, redemption, purchase or conversion rights, sinking fund or other provi-sions. The Class A shares rank in priority over Common Shares and any other shares ranking by their terms junior to the Class A shares as to dividends and return of capital upon liquidation, dissolution or winding up of the Company or any other return of capital or distribution of the assets of the Company. No Class A Shares were issued and outstanding.
(iii) Unlimited number of Class “B” Shares each with a par value of $5.00 Class B shares may be issued from time to time in one or more series, and the direc-tors may fix from time to time before such issue the number of Class B shares of each series and the designation, rights and privileges attached thereto including any voting rights, dividend rights, redemption, purchase or conversion rights, sinking fund or other
114 Aurora Cannabis Inc. 2018 Annual Report

provisions. The Class B shares rank in priority over Common Shares and any other shares ranking by their terms junior to the Class B shares as to dividends and return of capital upon liquidation, dissolution or winding up of the Company or any other return of capital or distribution of the assets of the Company. No Class B Shares were issued and outstanding.
(b) Issued and outstanding
At June 30, 2018, 568,113,131 common shares (2017 – 366,549,244) were issued and fully paid.
(i) Shares for business combinations, asset acquisitions and investment in associates
During the years ended June 30, 2018 and 2017, the Company issued the following shares for business combinations, asset acquisitions and investment in associates:
Note
Number ofshares issued Share capital
# $Fiscal 2018Acquisition of BCNL and UCI 13(a)(i) 89,107 248Acquisition of CanniMed 13(a)(iv) 72,746,846 798,784Acquisition of H2 13(b)(i) 4,789,273 15,283Investment in Capcium 12(f) 1,144,481 10,770
78,769,707 825,085
Fiscal 2017Acquisition of CanvasRx 13(a)(v) 17,875,000 11,440Acquisition of Pedanios 13(a)(vi) 8,316,782 20,709Acquisition of Peloton 13(b)(ii) 899,225 2,391
27,091,007 34,540
(ii) Shares for earn out payments
During the years ended June 30, 2018 and 2017, the Company issued the following shares for earn out payments:
Note
Number ofshares issued Share capital
# $Fiscal 2018CanvasRx earn out payments 13(a)(v) 5,318,044 14,417H2 earn out payments (1) 13(b)(i) - 1,904
5,318,044 16,321
Fiscal 2017CanvasRx earn out payments 13(a)(v) 2,926,103 7,408
(1) On November 30, 2017, 3,060,556 common shares were issued for the H2 acquisition and were placed in escrow pending achievement of milestones. During the year ended June 30, 2018, 238,044 common shares with a fair value of $1,904 were released from escrow upon the achievement of milestones (Note 13(b)(i)).
19. SHARE CAPITAL (CONTINUED)(a) Authorized (Continued)
Notes to Financial Statements 115

(iii) Shares for equity financings
During the years ended June 30, 2018 and 2017, the Company completed equity financings and issued the following shares:
Number ofshares issued Share capital Reserves
# $ $Fiscal 2018November 2, 2017 (1)
Gross issuance 25,000,000 75,000 -Cash share issuance costs - (4,361) -Compensation warrants - (2,285) 2,285
25,000,000 68,354 2,285Fiscal 2017August 17, 2016 (2)
Gross issuance 57,500,000 23,000 -Cash share issuance costs - (1,804) -Compensation warrants - (1,848) 1,848
February 28, 2017 (3)
Gross issuance 33,337,500 75,009 -Cash share issuance costs - (4,479) -Compensation warrants - (2,782) 2,782
90,837,500 87,096 4,630
(1) The Company issued 25,000,000 units at $3.00 per unit. Each unit consisted of one common share and one warrant exercisable at a price of $4.00 per share for a period of three years. An aggregate of 1,333,980 compensation warrants were issued to the underwriters. The compensation warrants are exercisable into one common share at an exercise price of $3.00 per share and expire on November 2, 2020. The fair value of the compensation warrants at the date of grant was estimated at $1.71 per warrant based on the following weighted average assumptions: Stock price volatility – 85.49%; Risk-free interest rate – 1.40%; Dividend yield - 0.00%; and Expected life - 3 years.
(2) The Company issued 57,500,000 subscription receipts in conjunction with the acquisition of CanvasRx. Each subscription receipt was converted into units of the Company at $0.40 per unit upon the satisfaction of the conditions precedent to the acquisition. Each unit consisted of one common share and one-half of one common share purchase warrant of the Company. Each whole warrant is exercisable into one common share of the Company at an exercise price of $0.55 per share expiring August 9, 2018. A portion of the net proceeds from the Offering was used to satisfy the cash component of the acquisition. An aggregate of 3,775,000 compensation options were issued to the agents. The compensation options have the same terms as the private placement and expired August 9, 2018. The fair value of the compensation options at the date of grant was estimated at $0.33 per warrant based on the following weighted average assumptions: Stock price volatility - 79%; Risk-free interest rate - 0.70%; Dividend yield - 0.00%; and Expected life - 2 years.
(3) The Company issued 33,337,500 units at $2.25 per unit. Each unit consisted of one common share and one-half of one share purchase warrant. Each warrant is exercisable into one common share at $3.00 per share for two years, subject to a forced exercise provision if the Company’s VWAP equals or exceeds $4.50 for 10 consecutive trading days. An aggregate of 1,865,249 compensation options were issued to the underwriters. The compensation options have the same terms as the private placement and expire February 28, 2019. The fair value of the compensation options at the date of grant was estimated at $0.99 per warrant based on the following weighted average assumptions: Stock price volatility - 79%; Risk-free interest rate - 0.70%; Dividend yield - 0.00%; and Expected life - 2 years.
19. SHARE CAPITAL (CONTINUED)(b) Issued and outstanding (Continued)
116 Aurora Cannabis Inc. 2018 Annual Report

(iv) Shares for convertible debentures, options, warrants, compensation warrants and RSUs
During the years ended June 30, 2018 and 2017, the Company issued the following shares on the conversion of convertible debentures, exercise of options, warrants and compensation warrants, and vesting of restricted share units (“RSUs”):
NoteNumber of
shares issued Share capital Reserves# $ $
Fiscal 2018Conversion of convertible debentures 17(c)-(f) 42,473,435 177,127 (37,061)Exercise of options (1) 4,809,443 12,006 (6,175)Exercise of warrants (2) 43,200,881 136,293 (3,680)Exercise of compensation warrants 1,865,249 6,051 (1,854)Vesting of RSUs 127,128 1,209 (351)
92,476,136 332,686 (49,121)
Fiscal 2017Conversion of convertible debentures 17(a)-(d) 29,020,319 38,037 (4,800)Exercise of options 2,001,700 1,399 (578)Exercise of warrants 54,936,306 28,648 (2,046)Exercise of compensation warrants 4,084,434 2,966 (1,292)
90,042,759 71,050 (8,716)
(1) Included in reserves for the exercise of options is $1,738 reserves for the exercise of 667,000 Hempco stock options (Note 13(a)(ii)).
(2) Included in reserves for the exercise of warrants is $588 reserves for the exercise of 2,292,033 Hempco warrants, excluding the warrants exercised by Aurora (Note 13(a)(ii)).
(v) Other shares issued
During the year ended June 30, 2017, the Company also issued the following shares:
Number ofshares issued Share capital Reserves
# $ $Fiscal 2017Issued for compensation 25,510 13 (13)Performance shares 20,000,000 2,322 (2,322)Issued for loan 50,000 24 -
20,075,510 2,359 (2,335)
(c) Escrow securities
A summary of the status of the escrowed securities outstanding follows:
Shares Warrants# #
Balance, June 30, 2016 29,812,500 9,000,000Issued (Exercised) 20,000,000 (8,000,000)Forfeited - (1,000,000)Released (36,875,000) -
Balance, June 30, 2017 12,937,500 -Issued 3,060,556 -Released (13,175,544) -Balance, June 30, 2018 2,822,512 -
(i) Pursuant to an escrow agreement dated September 18, 2014, 60,000,000 common shares of the Company were deposited into escrow with respect to the RTO. In addition, warrants at $0.02 per share expiring December 9, 2019 and stock options at $0.001 per share expiring December 1, 2019 were also subject to the escrow agreement. Under the
19. SHARE CAPITAL (CONTINUED)(b) Issued and outstanding (Continued)
Notes to Financial Statements 117

escrow agreement, 10% of the escrowed common shares were released from escrow on December 9, 2014, the date of closing of the RTO, and 15% were released every six months thereafter over a period of 36 months. As of June 30, 2018, all of these shares had been released from escrow.
(ii) Pursuant to an escrow agreement dated November 30, 2017, 3,060,556 common shares of the Company were deposited into escrow with respect to the acquisition of H2 (Note 13(b)(i)) The escrowed common shares are to be released upon achievement of certain milestones relating to the completion of construction of the H2 facility and receipt of relevant licenses to cultivate and sell medical cannabis.
(d) Share purchase warrants
Each whole warrant entitles the holder to purchase one common share of the Company. A summary of the status of the warrants outstanding follows:
WarrantsWeighted average
exercise price# $
Balance, June 30, 2016 28,750,590 0.40Issued 50,173,466 1.36Forfeited (1,000,000) 0.02Exercised (54,936,306) 0.48
Balance, June 30, 2017 22,987,750 2.32Issued 27,355,709 3.91Exercised (43,200,881) 3.08
Balance, June 30, 2018 7,142,578 3.81
During the year ended June 30, 2018, the Company recorded share-based payments of $2,285 (2017 - $nil) for 1,333,980 broker warrants with a fair value of $1.71 per broker warrant issued related to the financing (Note 19(b)(iii)). The 25,000,000 warrants attached to the financing units (Note 19(b)(iii)) have a fair value of $1.52 per unit warrant and was determined using the Binomial Tree model with the following assumptions: risk-free interest rate of 1.88%; dividend yield of 0%; stock price volatility of 85.49%; and an expected life of 3 years.
The following table summarizes the warrants that remain outstanding as at June 30, 2018:
Exercise Price Warrants Expiry Date$ #
0.55 61,500 August 9, 20180.55 301,000 August 17, 20182.81 89,107 September 29, 20203.00 633 November 2, 20204.00 6,690,338 November 2, 2020
7,142,578
19. SHARE CAPITAL (CONTINUED)(c) Escrow securities (Continued)
118 Aurora Cannabis Inc. 2018 Annual Report

(e) Compensation options
Each compensation option entitles the holder to purchase one common share and one-half of one share purchase warrant of the Company. Each whole warrant is exercisable into one addi-tional common share of the Company for a period of two years. A summary of the status of the compensation options outstanding follows:
Compensationoptions
Weighted averageexercise price
# $Balance, June 30, 2016 309,434 0.53
Issued 5,640,249 1.01Exercised (1) (4,084,434) 0.41
Balance, June 30, 2017 1,865,249 2.25Exercised (1) (1,865,249) 2.25
Balance, June 30, 2018 - -
(1) The weighted average share price at the time of exercise was $4.43 (2017 - $2.26).
20. SHARE-BASED PAYMENTS
Accounting PolicyEquity-settled share-based payments to employees are measured at the fair value of the stock options at the grant date and recognized in expense over the vesting periods.
Share-based payments to non-employees are measured at the fair value of goods or services received or the fair value of the equity instruments issued, if it is determined the fair value of the goods or services cannot be reliably measured, and are recorded at the date the goods or services are received. The corresponding amount is recorded to the share-based payment reserve.
The fair value of options is determined using the Black–Scholes option pricing model which incorporates all market vesting conditions. The number of options expected to vest is reviewed and adjusted at the end of each reporting period such that the amount recognized for services received as consideration for the equity instruments granted shall be based on the number of equity instruments that eventually vest. Amounts recorded for forfeited or expired unexercised options are transferred to deficit in the year of forfeiture or expiry.
Upon the exercise of stock options, consideration received on the exercise of these equity instruments is recorded as share capital and the related share-based payment reserve is transferred to share capital.
Significant JudgementIn estimating fair value of options using the Black-Scholes option pricing model, management is required to make certain assumptions and estimates such as the expected life of options, volatility of the Company’s future share price, risk free rate, future dividend yields and estimated forfeitures at the initial grant date. Changes in assumptions used to estimate fair value could result in materially different results.
Stock options and restricted share unitsOn September 25, 2017, the Board adopted a “rolling maximum” or “evergreen” plan which fixed a maximum number of shares issuable thereunder at 10% of the issued and outstanding securities of the Company. The Board of Directors may from time to time, in its discretion, and in accordance with the Exchange requirements, grant to directors, officers, employees and consultants, non-transferable options to purchase common shares and restricted share units, provided that the number of common shares reserved for issuance under the plan and all other share compensation arrangements of the Company will not exceed 10% of the issued and outstanding common shares of the Company.
19. SHARE CAPITAL (CONTINUED)
Notes to Financial Statements 119

(a) Stock options
A summary of the status of the options outstanding follows:
StockOptions
Weighted AverageExercise Price
# $Balance, June 30, 2016 5,309,834 0.37
Granted 12,170,000 2.21Exercised (1) (2,001,700) 0.41Forfeited (244,568) 0.74
Balance, June 30, 2017 15,233,566 1.84Granted 18,530,000 7.16Exercised (1) (4,809,443) 1.91Forfeited (798,004) 2.66
Balance, June 30, 2018 28,156,119 5.36
(1) The weighted average share price during the period was $9.05 (2017 - $2.31).
The following table summarizes the stock options that remain outstanding as at June 30, 2018:
Expiry DateOptions Outstanding
(#)Exercise Price
($)Options Exercisable
(#)September 2018 63,112 0.30 63,112May 2020 113,300 0.34 113,300August 2020 418,627 0.295 – 0.30 306,960March 2021 200,000 0.58 200,000May 2021 500,000 0.46 100,000August 2021 1,731,666 2.25 1,731,666September 2021 704,569 1.30 704,569January 2022 1,850,000 2.56 1,062,500March 2022 2,500,000 2.27 1,041,667May 2022 2,142,501 2.49 354,168August 2022 1,151,667 2.39 210,417September 2022 2,949,507 2.76 963,257November 2022 2,713,336 4.64 400,836December 2022 1,337,834 7.00 – 7.10 212,834January 2023 2,525,000 9.60 – 13.63 577,084February 2023 2,425,000 10.13 – 11.53 210,415March 2023 925,000 9.03 – 11.74 77,083April 2023 850,000 7.72 – 9.07 -May 2023 2,030,000 7.20 – 8.38 -June 2023 1,025,000 8.18 – 9.99 -
28,156,119 8,329,868
During the year ended June 30, 2018, the Company recorded aggregate share-based payments of $34,062 (2017 - $7,584) for all stock options granted and vested during the period including Hempco stock options vested from the acquisition date (Note 13(a)(ii)).
The fair value of stock options granted during the period was determined using the following weighted average assumptions at the time of grant using the Black-Scholes option pricing model:
2018 2017Risk-Free Annual Interest Rate 1.73% 0.68%Expected Annual Dividend Yield 0% 0%Expected Stock Price Volatility 81.02% 79.0%Expected Life of Options 2.97 years 3.03 yearsForfeiture Rate 4.59% 5%
Volatility was estimated by using the average historical volatility of the Company. The expected life in years represents the period of time that options granted are expected to be outstanding.
20. SHARE-BASED PAYMENTS (CONTINUED)
120 Aurora Cannabis Inc. 2018 Annual Report

The risk-free rate is based on Canada government bonds with a remaining term equal to the expected life of the options.
The weighted average fair value of stock options granted during the year ended June 30, 2018 was $4.11 (2017 - $1.15) per option. As at June 30, 2018, stock options outstanding have a weighted average remaining contractual life of 4.13 years (2017 – 4.22 years).
(b) Restricted Share Units (“RSU”)
Accounting PolicyRSUs are measured at fair value on the date of grant based on the closing price of the Company’s shares on the date prior to the grant, and is recognized as share-based compensation expense on a straight-line basis over the vesting period. The corresponding amount is recorded to the share-based payment reserve. Upon the exercise of RSUs, the related share-based payment reserve is transferred to share capital.
On September 25, 2017, the Company adopted a RSU plan for directors, officers, employees and consultants of the Company (“Participants”). Under the terms of the plan, RSUs are granted to Participants and the shares issued vest over a period of up to three years from the date of grant. Each RSU gives the Participant the right to receive one common share of the Company. The Company has reserved 10,000,000 common shares for issuance under this plan.
On September 29, 2017, the Company granted 2,127,128 RSUs to directors, officers, employees and consultants of the Company, of which 127,128 relate to fiscal 2017 which vested immediately. The rest of the RSUs vest annually.
On January 15, 2018, the Company granted 150,000 RSUs to an officer of the Company vesting annually over 3 years.
A summary of the status of the RSUs outstanding is as follows:
RSUsWeighted average
exercise price# $
Balance, June 30, 2017 - -Issued 2,277,128 3.26Vested (127,128) 6.75
Balance, June 30, 2018 2,150,000 3.29
The weighted average fair value of RSUs granted in the year ended June 30, 2018 was $3.29. During the year ended June 30, 2018, the Company recorded share-based payments of $3,739 for 2,150,000 RSUs granted and vested during the period. Share-based payments of $351 for 127,128 RSUs were accrued during the year ended June 30, 2017.
The following table summarizes the RSUs that remain outstanding as at June 30, 2018:
RSUs Outstanding RSUs Vested Expiry Weighted Average Price per Share$
525,000 - September 29, 2018 2.761,475,000 - September 29, 2020 2.76150,000 - January 15, 2021 10.322,150,000 - 3.29
20. SHARE-BASED PAYMENTS (CONTINUED)(a) Stock options (Continued)
Notes to Financial Statements 121

Employee Share Purchase Plan (“ESPP”)
On September 25, 2017, the Company adopted an ESPP whereby eligible employees may contribute to the ESPP at least 1% but no more than 10% of their annual gross salary up to a maximum of $10,500, to purchase common shares of the Company in the open market at prevailing market prices. The Company contributes an amount equal to 50% of the employee’s contributions which are expensed as incurred as there are no vesting provisions.
The Company contributed $58 to the ESPP during the year ended June 30, 2018.
21. EARNINGS (LOSS) PER SHARE
Accounting PolicyThe Company calculates basic earnings (loss) per share by dividing net income (loss) by the weighted average number of common shares outstanding during the year. Diluted earnings per share is deter-mined by adjusting profit or loss attributable to common shareholders and the weighted average number of common shares outstanding, adjusted for the effects of all dilutive potential common shares, which comprise convertible debentures, restricted share units, warrants and share options issued.
The following is a reconciliation for the calculation of basic and diluted earnings (loss) per share:
Basic earnings (loss) per share2018 2017
Net income (loss) attributable to Aurora shareholders $ 71,936 $ (12,968)Weighted average number of common shares outstanding 459,782,532 279,029,226Basic earnings (loss) per share $ 0.16 $ (0.05)
Diluted earnings (loss) per share2018 2017
Net income (loss) attributable to Aurora shareholders $ 71,936 $ (12,968)Dilutive effect on income - -Adjusted net income (loss) attributable to Aurora shareholders $ 71,936 $ (12,968)
Weighted average number of common shares outstanding - basic 459,782,532 279,029,226Dilutive effect of options outstanding 7,121,278 -Dilutive effect of warrants outstanding 3,211,970 -Dilutive effect of RSUs outstanding 1,202,699 -Dilutive effect of convertible debentures outstanding 18,232 -Weighted average number of common shares outstanding - diluted 471,336,711 279,029,226Diluted earnings (loss) per share $ 0.15 $ (0.05)
Diluted loss per share is the same as basic loss per share as the issuance of shares on the exercise of convertible debentures, restricted share units, warrants and share options is anti-dilutive.
Subsequent to June 30, 2018, the Company issued shares for business acquisitions, the exercise of options and warrants, and the conversion of convertible debentures which would change the number of ordinary shares or potential ordinary share outstanding at the end of the period and would affect the calculation of basic and dilutive loss per share (Note 31).
20. SHARE-BASED PAYMENTS (CONTINUED)(b) Restricted Share Units (“RSU”) (Continued)
122 Aurora Cannabis Inc. 2018 Annual Report

22. FINANCE AND OTHER COSTS Years ended June 30,
2018 2017$ $
Accretion expense 10,641 3,570Bank charges 214 28Financing fees 25 1,692Interest expense 2,282 1,292
13,162 6,582
23. INCOME TAXES
Accounting PolicyTax expense recognized in profit or loss comprises the sum of current and deferred taxes not recognized in other comprehensive income or directly in equity.
Current taxCurrent tax assets and/or liabilities comprise those claims from, or obligations to, fiscal authorities relating to the current or prior reporting periods that are unpaid at the reporting date. Current tax is payable on taxable profit, which differs from profit or loss in the financial statements. Calculation of current tax is based on tax rates and tax laws that have been enacted or substantively enacted at the end of the reporting period.
Deferred taxDeferred taxes are calculated using the liability method on temporary differences between the carrying amounts of assets and liabilities and their tax bases. Deferred tax assets and liabilities are calculated, without discounting, at tax rates that are expected to apply to their respective period of realization, provided they are enacted or substantively enacted at the end of the reporting period. Deferred tax liabilities are always provided for in full.
Deferred tax assets are recognized to the extent that it is probable that they will be able to be utilized against future taxable income. Deferred tax assets and liabilities are offset only when the Company has a right and intention to offset current tax assets and liabilities from the same taxation authority.
Changes in deferred tax assets or liabilities are recognized as a component of tax income or expense in profit or loss, except where they relate to items that are recognized in other comprehensive income or directly in equity, in which case the related deferred tax is also recognized in other comprehensive income or equity, respectively.
Significant JudgementDeferred tax assets, including those arising from tax loss carry-forwards, require management to assess the likelihood that the Company will generate sufficient taxable earnings in future periods in order to utilize recognized deferred tax assets. Assumptions about the generation of future taxable profits depend on management’s estimates of future cash flows. In addition, future changes in tax laws could limit the ability of the Company to obtain tax deductions in future periods. To the extent that future cash flows and taxable income differ significantly from estimates, the ability of the Company to realize the net deferred tax assets recorded at the reporting date could be impacted.
Notes to Financial Statements 123

The net tax provision differs from that expected by applying the combined federal and provincial tax rates of 26.5% (2017 - 26%) to income (loss) before income tax for the following reasons:
2018 2017$ $
Income (loss) before tax 77,327 (17,264)Combined federal and provincial rate 26.5% 26%Expected tax recovery 20,492 (4,489) Change in estimates from prior year (244) (205)Non-deductible expenses 13,557 2,294Non-deductible portion of capital gains (623) -Permanent portion of rate difference on capital items (23,751) -Difference in statutory tax rate (126) (16)Effect of change in tax rates 488 (21)Changes in deferred tax benefits not recognized (1,693) (1,859)Income tax expense (recovery) 8,100 (4,296)
The statutory combined federal and provincial tax rate increased from 26% to 26.5% due to an increase in the provincial tax rate on January 1, 2018.
Deferred taxes reflect the tax effects of temporary differences between the carrying amounts of asset and liabilities for financial reporting purposes and their tax values. Movements in deferred tax assets (liabilities) at June 30, 2018 and 2017 are comprised of the following:
As ofJune 30,
2017
Deferred tax assets (liabilities)
assumed from acquisition
Recovered through
(charged to) earnings
Recovered through
(charged to) other com-prehensive
income
Recovered through
(charged to) equity
As of June 30,
2018$ $ $ $ $ $
Deferred tax assetsNon-capital losses 7,637 10,207 14,612 - - 32,456Finance costs 3,520 1,075 759 - 2,533 7,887Investment tax credit 75 381 137 - - 593Others - - 657 - - 657Total deferred tax assets 11,232 11,663 16,165 - 2,533 41,593
Deferred tax liabilitiesConvertible debenture (4,170) - 347 - (7,082) (10,905)Marketable securities (788) 885 (3,841) (55) - (3,799)Investment in associates - (903) (3,540) - (5,870) (10,313)Derivatives 43 - (15,573) - - (15,530)Customer relationships (1,126) (1,778) 231 - - (2,673)Brand - (31,882) 657 - - (31,225)Patents - (425) - - - (425)License and federal permits (6,617) (16,275) (1,218) - - (24,110)Property, plant and equipment (98) (4,637) 2,997 - - (1,738)Inventory (1,672) (2,877) (424) - - (4,973)Biological assets (1,088) (325) (1,626) - - (3,039)Total deferred tax liabilities (15,516) (58,217) (21,990) (55) (12,952) (108,730)
Net deferred tax assets (liabilities) (4,284) (46,554) (5,825) (55) (10,419) (67,137)Deferred tax assets not recognized (1,653) - (616) - - (2,269)
(5,937) (46,554) (6,441) (55) (10,419) (69,406)
23. INCOME TAXES (CONTINUED)
124 Aurora Cannabis Inc. 2018 Annual Report

23. INCOME TAXES (CONTINUED)
As ofJune 30,
2016
Deferred tax assets (liabilities)
assumed from acquisition
Recovered through
(charged to) earnings
Recovered through
(charged to) other com-prehensive
income
Recovered through
(charged to) equity
As of June 30,
2017$ $ $ $ $ $
Deferred tax assetsNon-capital losses 3,240 321 4,076 - - 7,637Finance costs 232 - 238 - 3,050 3,520Investment tax credit - - 75 - - 75Total deferred tax assets 3,472 321 4,389 - 3,050 11,232
Deferred tax liabilitiesConvertible debenture (195) - (226) - (3,749) (4,170)Marketable securities - - 97 (885) - (788)Derivatives - - 43 - - 43Customer relationships - (1,126) - - - (1,126)License and federal permits - (6,617) - - - (6,617)Property, plant and equipment (158) (4) 64 - - (98)Inventory (313) - (1,359) - - (1,672)Biological assets (498) - (590) - - (1,088)Total deferred tax liabilities (1,164) (7,747) (1,971) (885) (3,749) (15,516)
Net deferred tax assets (liabilities) 2,308 (7,426) 2,418 (885) (699) (4,284)Deferred tax assets not recognized (2,308) - 1,859 - (1,204) (1,653)
- (7,426) 4,277 (885) (1,903) (5,937)
Deferred tax assets have not been recognized with respect to the following items:
2018 2017$ $
Non-capital losses carried forward (2,269) (449)Share issue costs - (1,204)
(2,269) (1,653)
The Company has income tax loss carryforwards of approximately $122,369 (2017 - $32,605) which are predominately from Canada and, if unused, will expire between 2031 to 2038.
24. RELATED PARTY TRANSACTIONS
Accounting PolicyThe Company considers a person or entity as a related party if they are a member of key management personnel including their close relatives, an associate or joint venture, those having significant influence over the Company, as well as entities that are controlled by related parties.
Notes to Financial Statements 125

(a) Goods and services
The Company incurred the following transactions with related parties during the year ended June 30, 2018:
Years ended June 30,2018 2017
$ $Operational, administrative and service fees paid or accrued pursuant to an agreement between CanvasRx and a company having a former director in common with the Company 4,957 3,659Consulting fees paid or accrued related to the CanvasRx acquisition to a company owned by an officer of the Company 358 780Marketing fees paid or accrued to a company partially owned by an officer of the Company 2,210 - Interest income earned from a 50% owned joint venture company (Note 12(a)) 49 41
7,574 4,480
During the year ended June 30, 2018 and based on the Company’s existing interest in associates, the Company generated $239 profit margin from design, engineering and construction consulting services to Cann Group (Note 12(b)) and $240 profit margin from TGOD (Note 12(g)).
These transactions are in the normal course of operations and are measured at the exchange value being the amounts agreed to by the parties.
(b) Compensation of key management personnel
The Company’s key management personnel have the authority and responsibility for planning, directing and controlling the activities of the Company and consists of the Company’s executive management team and management directors.
Years ended June 30,2018 2017
$ $Management compensation 5,284 1,934Directors’ fees (1) 210 258Share-based payments (2) 14,608 6,431
20,102 8,623
(1) Includes meeting fees and committee chair fees.
(2) Share-based payments are the fair value of options granted and vested to key management personnel and directors of the Company under the Company’s stock option plan (Note 20).
(c) Related party balances
The following related party amounts were included in (i) accounts receivable, (ii) accounts payable and accrued liabilities, and (iii) note receivable:
June 30, 2018
June 30, 2017
$ $(i) A company having a director in common (1)
(i) Associates where the Company holds significant influence (2)
(ii) Companies controlled by directors and officers of the Company (1)
-1,554
24
72--
(ii) Directors and officers and a former director and officer of the Company (1) 1,128 565(ii) A company partially owned by an officer (1) 1,976 -(iii) A 50% owned joint venture company (Note 12(a)) 3,444 2,096
(1) The amounts are unsecured, non-interest bearing and have no specific repayments term.
(2) Amounts are due upon the issuance of the invoice, are non-interest bearing and unsecured.
24. RELATED PARTY TRANSACTIONS (CONTINUED)
126 Aurora Cannabis Inc. 2018 Annual Report
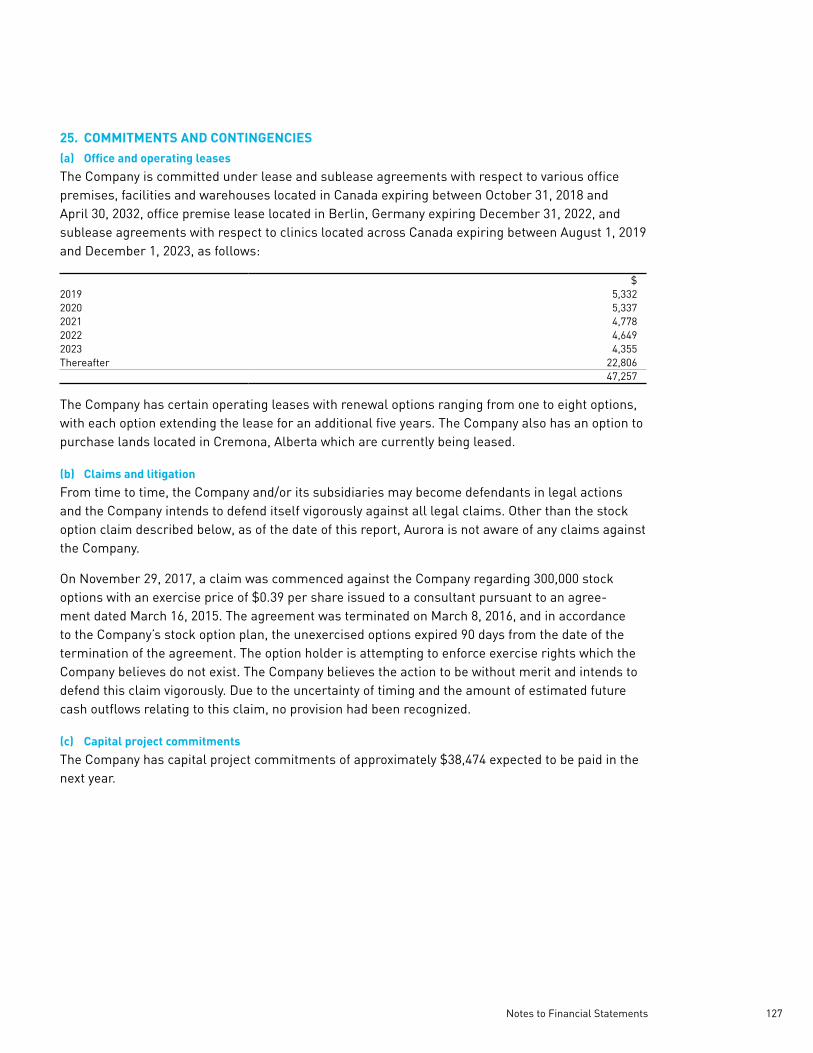
25. COMMITMENTS AND CONTINGENCIES(a) Office and operating leases
The Company is committed under lease and sublease agreements with respect to various office premises, facilities and warehouses located in Canada expiring between October 31, 2018 and April 30, 2032, office premise lease located in Berlin, Germany expiring December 31, 2022, and sublease agreements with respect to clinics located across Canada expiring between August 1, 2019 and December 1, 2023, as follows:
$2019 5,3322020 5,3372021 4,7782022 4,6492023 4,355Thereafter 22,806
47,257
The Company has certain operating leases with renewal options ranging from one to eight options, with each option extending the lease for an additional five years. The Company also has an option to purchase lands located in Cremona, Alberta which are currently being leased.
(b) Claims and litigation
From time to time, the Company and/or its subsidiaries may become defendants in legal actions and the Company intends to defend itself vigorously against all legal claims. Other than the stock option claim described below, as of the date of this report, Aurora is not aware of any claims against the Company.
On November 29, 2017, a claim was commenced against the Company regarding 300,000 stock options with an exercise price of $0.39 per share issued to a consultant pursuant to an agree-ment dated March 16, 2015. The agreement was terminated on March 8, 2016, and in accordance to the Company’s stock option plan, the unexercised options expired 90 days from the date of the termination of the agreement. The option holder is attempting to enforce exercise rights which the Company believes do not exist. The Company believes the action to be without merit and intends to defend this claim vigorously. Due to the uncertainty of timing and the amount of estimated future cash outflows relating to this claim, no provision had been recognized.
(c) Capital project commitments
The Company has capital project commitments of approximately $38,474 expected to be paid in the next year.
Notes to Financial Statements 127

26. CONSTRUCTION CONTRACTS
Accounting PolicyConstruction contracts include contracts for the rendering services which are directly related to the construction of the asset, including services of project managers. Revenue from a construction contract is recognized when the total contract revenue can be measured reliably, it is probable that the economic benefits associated with the contract will flow to the Company, both the contract costs to complete the contract and the stage of completion at the end of the period can be measured reliably, and the contract costs attributable to the contract can be clearly identified and measured reliably so that actual contract costs incurred can be compared with prior estimates. The Company generates construction contract revenue from design and construction consulting services. The stage of completion is determined based on the level of completion of each phase of design and construction. If the outcome of the construction contract cannot be estimated reliably, revenue is recognized only to the extent of contract costs incurred that is probable that will be recoverable, and contract costs are recognized as an expense in the period they are incurred.
The following is a summary of construction contract revenues and contracts currently in progress:
June 30, 2018
June 30, 2017
$ $Construction contract revenue 4,218 -Gross accounts receivable 2,179 -Contracts in progressRecognized profits 3,276 -Costs incurred 942 -
27. SEGMENTED INFORMATION
Accounting PolicyOperating segments are components of the Company that engages in business activities from which they earn revenues and incur expenses (including revenues and expenses related to transactions with other components of the Company), the operations of which can be clearly distinguished, and the operating results of which are regularly reviewed by the chief operating decision maker (“CODM”) for the purposes of resource allocation and assessing its performance.
As part of the integration of the Company’s recently acquired businesses, the CODM has revised the manner in which they review the operations and business performance of the Company. Key measures used by the CODM in assessing performance and in making resource allocation decisions include revenues, gross profit and net income (loss). The Company’s operating results are divided into two reportable operating segments plus corporate. The two reportable operating segments are medical cannabis and horizontally-integrated businesses and other. The Company primarily operates in the medical cannabis segment which includes support services such as CanvasRx patient counselling services and design, engineering and construction consulting services. Comparative historical segmented information has been restated to conform with the organization of segments in the current period.
Significant JudgementOperating segments are determined based on internal reports used in making strategic decisions that are reviewed by the CODMs. The Company’s CODMs are the Chief Executive Officer, Chief Operating Officer and the Chief Financial Officer.
128 Aurora Cannabis Inc. 2018 Annual Report

Operating Segments
Year ended June 30, 2018Medical
CannabisHorizontally Integrated Businesses and Other Corporate Total
$ $ $ $Revenue 51,129 4,067 - 55,196Gross profit 42,845 674 - 43,519Net income (loss) (1,622) (7,239) 78,088 69,227
Year ended June 30, 2017Medical
CannabisHorizontally Integrated Businesses and Other Corporate Total
$ $ $ $Revenue 18,067 - - 18,067Gross profit 16,056 - - 16,056Net loss (1,051) - (11,917) (12,968)
Geographical Segments
Year ended June 30, 2018 Canada European Union Other Total$ $ $ $
Non-current assets 1,658,793 32,225 - 1,691,018Revenue 44,061 8,690 2,445 55,196Gross profit 39,654 3,459 406 43,519
Year ended June 30, 2017 Canada European Union Other Total$ $ $ $
Non-current assets 122,469 6,604 - 129,073Revenue 17,628 439 - 18,067Gross profit 15,916 140 - 16,056
28. FAIR VALUE OF FINANCIAL INSTRUMENTS
Accounting Policy
Fair Value HierarchyFinancial instruments recorded at fair value are classified using a fair value hierarchy that reflects the significance of the inputs to fair value measurements. The three levels of hierarchy are:
Level 1 – Unadjusted quoted prices in active markets for identical assets or liabilities;Level 2 – Inputs other than quoted prices that are observable for the asset or liability, either directly
or indirectly; andLevel 3 – Inputs for the asset or liability that are not based on observable market data.
Significant JudgementThe individual fair values attributed to the different components of a financing transaction, notably invest-ments in available-for-sale equity securities, derivative financial instruments, convertible debt and loans, are determined using valuation techniques. The Company uses judgement to select the methods used to make certain assumptions and in performing the fair value calculations in order to determine (a) the values attributed to each component of a transaction at the time of their issuance; (b) the fair value measurements for certain instruments that require subsequent measurement at fair value on a recurring basis; and (c) for disclosing the fair value of financial instruments subsequently carried at amortized cost. These valuation estimates could be significantly different because of the use of judgement and the inherent uncertainty in estimating the fair value of these instruments that are not quoted in an active market.
27. SEGMENTED INFORMATION (CONTINUED)
Notes to Financial Statements 129
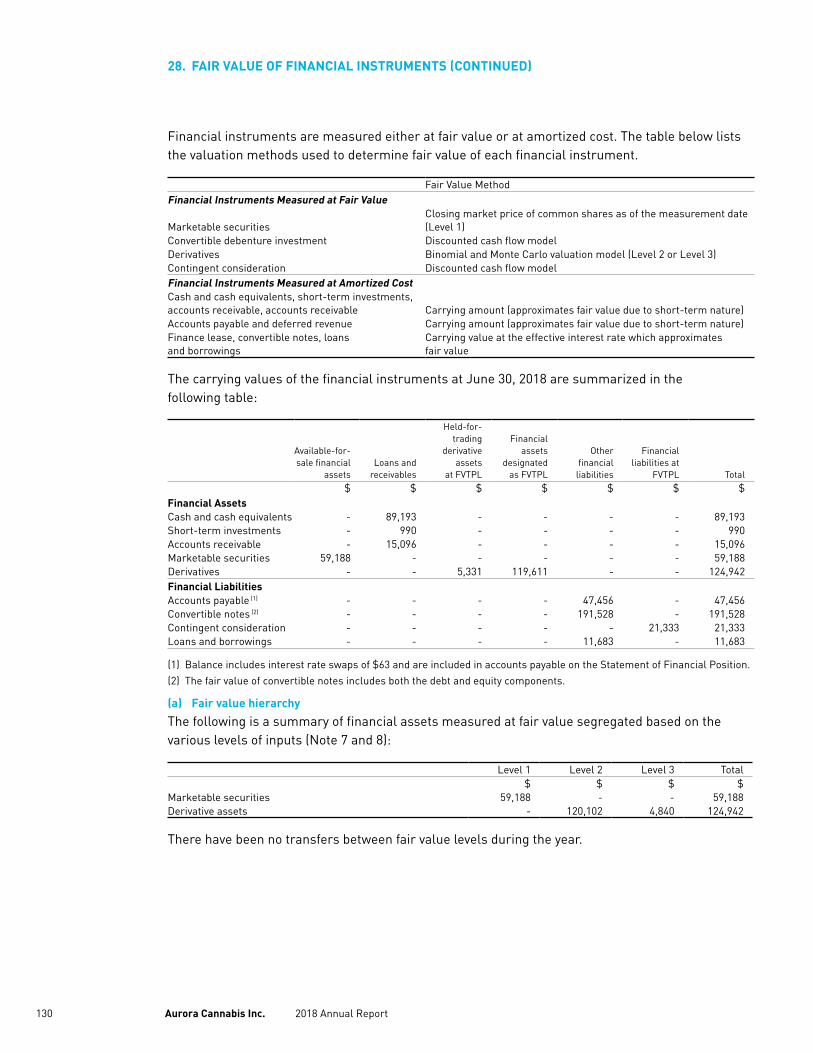
Financial instruments are measured either at fair value or at amortized cost. The table below lists the valuation methods used to determine fair value of each financial instrument.
Fair Value MethodFinancial Instruments Measured at Fair Value
Marketable securitiesClosing market price of common shares as of the measurement date (Level 1)
Convertible debenture investment Discounted cash flow modelDerivatives Binomial and Monte Carlo valuation model (Level 2 or Level 3)Contingent consideration Discounted cash flow modelFinancial Instruments Measured at Amortized CostCash and cash equivalents, short-term investments, accounts receivable, accounts receivable Carrying amount (approximates fair value due to short-term nature)Accounts payable and deferred revenue Carrying amount (approximates fair value due to short-term nature)Finance lease, convertible notes, loans and borrowings
Carrying value at the effective interest rate which approximates fair value
The carrying values of the financial instruments at June 30, 2018 are summarized in the following table:
Available-for-sale financial
assetsLoans and
receivables
Held-for-trading
derivative assets
at FVTPL
Financial assets
designated as FVTPL
Other financial
liabilities
Financial liabilities at
FVTPL Total$ $ $ $ $ $ $
Financial AssetsCash and cash equivalents - 89,193 - - - - 89,193Short-term investments - 990 - - - - 990Accounts receivable - 15,096 - - - - 15,096Marketable securities 59,188 - - - - - 59,188Derivatives - - 5,331 119,611 - - 124,942Financial LiabilitiesAccounts payable (1) - - - - 47,456 - 47,456Convertible notes (2) - - - - 191,528 - 191,528Contingent consideration - - - - - 21,333 21,333Loans and borrowings - - - - 11,683 - 11,683
(1) Balance includes interest rate swaps of $63 and are included in accounts payable on the Statement of Financial Position.
(2) The fair value of convertible notes includes both the debt and equity components.
(a) Fair value hierarchy
The following is a summary of financial assets measured at fair value segregated based on the various levels of inputs (Note 7 and 8):
Level 1 Level 2 Level 3 Total$ $ $ $
Marketable securities 59,188 - - 59,188Derivative assets - 120,102 4,840 124,942
There have been no transfers between fair value levels during the year.
28. FAIR VALUE OF FINANCIAL INSTRUMENTS (CONTINUED)
130 Aurora Cannabis Inc. 2018 Annual Report
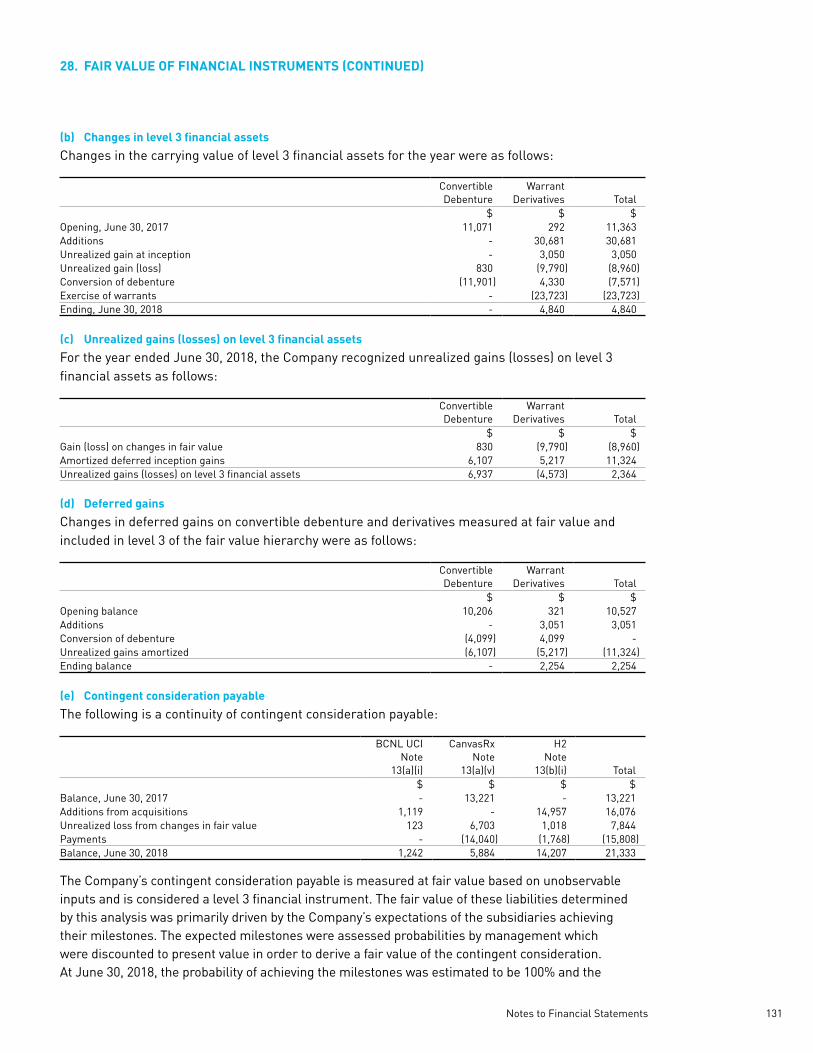
28. FAIR VALUE OF FINANCIAL INSTRUMENTS (CONTINUED)
(b) Changes in level 3 financial assets
Changes in the carrying value of level 3 financial assets for the year were as follows:
ConvertibleDebenture
Warrant Derivatives Total
$ $ $Opening, June 30, 2017 11,071 292 11,363Additions - 30,681 30,681Unrealized gain at inception - 3,050 3,050Unrealized gain (loss) 830 (9,790) (8,960)Conversion of debenture (11,901) 4,330 (7,571)Exercise of warrants - (23,723) (23,723)Ending, June 30, 2018 - 4,840 4,840
(c) Unrealized gains (losses) on level 3 financial assets
For the year ended June 30, 2018, the Company recognized unrealized gains (losses) on level 3 financial assets as follows:
ConvertibleDebenture
Warrant Derivatives Total
$ $ $Gain (loss) on changes in fair value 830 (9,790) (8,960)Amortized deferred inception gains 6,107 5,217 11,324Unrealized gains (losses) on level 3 financial assets 6,937 (4,573) 2,364
(d) Deferred gains
Changes in deferred gains on convertible debenture and derivatives measured at fair value and included in level 3 of the fair value hierarchy were as follows:
Convertible Debenture
Warrant Derivatives Total
$ $ $Opening balance 10,206 321 10,527Additions - 3,051 3,051Conversion of debenture (4,099) 4,099 -Unrealized gains amortized (6,107) (5,217) (11,324)Ending balance - 2,254 2,254
(e) Contingent consideration payable
The following is a continuity of contingent consideration payable:
BCNL UCINote
13(a)(i)
CanvasRxNote
13(a)(v)
H2Note
13(b)(i) Total$ $ $ $
Balance, June 30, 2017 - 13,221 - 13,221Additions from acquisitions 1,119 - 14,957 16,076Unrealized loss from changes in fair value 123 6,703 1,018 7,844Payments - (14,040) (1,768) (15,808)Balance, June 30, 2018 1,242 5,884 14,207 21,333
The Company’s contingent consideration payable is measured at fair value based on unobservable inputs and is considered a level 3 financial instrument. The fair value of these liabilities determined by this analysis was primarily driven by the Company’s expectations of the subsidiaries achieving their milestones. The expected milestones were assessed probabilities by management which were discounted to present value in order to derive a fair value of the contingent consideration. At June 30, 2018, the probability of achieving the milestones was estimated to be 100% and the
Notes to Financial Statements 131

discount rates were estimated to range between 15% and 36%. If the probability of achieving the milestones decreased by 10%, the estimated fair value of contingent consideration would decrease by approximately $2,034. If the discount rate increased or decreased by 5%, the estimated fair value of contingent consideration would increase or decrease by approximately $356.
29. FINANCIAL INSTRUMENTS RISK The Company is exposed in varying degrees to a variety of financial instrument related risks. The Board mitigates these risks by assessing, monitoring and approving the Company’s risk management processes.
(a) Credit risk
Credit risk is the risk of a potential loss to the Company if a customer or third party to a financial instrument fails to meet its contractual obligations. The Company is moderately exposed to credit risk from its cash and cash equivalents, trade and other receivables and short-term GIC invest-ments. The risk exposure is limited to their carrying amounts at the statement of financial position date. The risk for cash and cash equivalents is mitigated by holding these instruments with highly rated Canadian financial institutions. The Company does not invest in asset-backed deposits or investments and does not expect any credit losses. The Company periodically assesses the quality of its investments and is satisfied with the credit rating of the financial institutions and the invest-ment grade of its GICs. Trade and other receivables primarily consist of trade accounts receivable and goods and services taxes recoverable (“GST”).
The Company provides credit to its customers in the normal course of business and has estab-lished credit evaluation and monitoring processes to mitigate credit risk but has limited risk as the majority of sales are transacted with credit cards.
As at June 30, 2018, the Company’s aging of receivables was approximately as follows:
June 30, 2018
June 30, 2017
$ $0 – 60 days 13,569 1,53461 – 120 days 1,527 778
15,096 2,312
(b) Liquidity risk
Liquidity risk is the risk that the Company will not be able to meet its financial obligations associated with financial liabilities. The Company manages liquidity risk through the management of its capital structure. The Company has access to CanniMed’s Canadian and U.S. operating lines of credit with a maximum of $1,000 and US$500, respectively. The Canadian and U.S. operating lines of credit bear interest at bank prime rate plus 0.75% and at U.S. base rate plus 0.75%, respectively. The lines of credit are secured by a general security agreement covering all assets of the Company and can be accessed to the lesser of the maximum available credit or the aggregate of 90% of Government of Canada receivables, 85% of undoubted receivables and 75% of acceptable receivables, less intercom-pany and priority claim amounts. These operating lines of credit were undrawn as of June 30, 2018. Subsequent to June 30, 2018, the Company also secured a $200,000 debt facility with BMO (Note 31). The Company’s approach to managing liquidity is to ensure that it will have sufficient liquidity to settle obligations and liabilities when due.
28. FAIR VALUE OF FINANCIAL INSTRUMENTS (CONTINUED)(e) Contingent consideration payable (Continued)
132 Aurora Cannabis Inc. 2018 Annual Report

In addition to the commitments outlined in Note 25, the Company has the following gross contractual obligations subject to liquidity risk:
Total <1 year 1 - 3 years 3 - 5 years > 5 years$ $ $ $ $
Accounts payable and accrued liabilities 47,456 47,456 - - -Convertible notes and interest (1) 251,356 11,604 237,649 2,103 -Loans and borrowings (2) 11,747 2,482 2,511 1,415 5,339Contingent consideration payable 23,742 14,438 9,304 - -
334,301 75,980 249,464 3,518 5,339(1) Assumes the principal balance outstanding at June 30, 2018 remains unconverted and includes the estimated interest
payable until the maturity date.
(2) The term loan balance of $9,971 at June 30, 2018 was fully repaid subsequent to year-end (Note 18(a)).
(c) Market risk
(i) Currency risk
The operating results and financial position of the Company are reported in Canadian dollars. As the Company operates in an international environment, some of the Company’s financial instru-ments and transactions are denominated in currencies other than the Canadian dollar. The results of the Company’s operations are subject to currency transaction and translation risks.
The Company’s main risk is associated with fluctuations in Euros, Danish Krone, Australian and U.S. dollars as the Company holds cash in Canadian dollars, U.S. dollars, Danish Krone and Euros, and investments in Australian and U.S. dollars. The Company’s main risk is associated with fluctuations in the Euros, Danish Krone, and Australian and U.S. dollars. Assets and liabili-ties are translated based on the foreign currency translation policy.
The Company has determined that as at June 30, 2018, an effect of a 10% increase or decrease in Euros, Danish Krone, Australian dollars and U.S. dollars against the Canadian dollar on financial assets and liabilities would result in an increase or decrease of approximately $79 (2017 - $1,430) to net income and comprehensive income for the year ended June 30, 2018.
At June 30, 2018, the Company had no hedging agreements in place with respect to foreign exchange rates. The Company has not entered into any agreements or purchased any instruments to hedge possible currency risks at this time.
(ii) Interest rate risk
Interest rate risk is the risk that the fair value or future cash flows of a financial instrument will fluctuate because of changes in market interest rates. Cash and cash equivalents bear interest at market rates. The Company’s investments and convertible notes have fixed rates of interest. The majority of the Company’s loans and borrowings have floating interest rates. The Company holds interest rate swaps to fix its exposure to variable interest rates on approximately one half of its loans and borrowings.
(iii) Price risk
Price risk is the risk of variability in fair value due to movements in equity or market prices. The Company’s marketable securities and investments are susceptible to price risk arising from uncertainties about their future values. The fair value of marketable securities is based on quoted market prices for which the shares of the investments can be exchanged.
29. FINANCIAL INSTRUMENTS RISK (CONTINUED)(b) Liquidity risk (Continued)
Notes to Financial Statements 133

If the fair value of these financial assets were to increase or decrease by 10%, the Company would incur an associated increase or decrease in net and comprehensive income (loss) of approximately $29,502 (2017 - $2,823). See Note 8 for additional details regarding the fair value of marketable securities and derivatives.
30. CAPITAL MANAGEMENT The Company’s objectives when managing capital are to ensure that there are adequate capital resources to safeguard the Company’s ability to continue as a going concern and maintain adequate levels of funding to support its ongoing operations and development such that it can continue to provide returns to shareholders and benefits for other stakeholders.
The capital structure of the Company consists of $1,766,342 (2017 – $282,820) in shareholders’ equity and debt. The Company manages its capital structure and makes adjustments to it in light of changes in economic conditions and the risk characteristics of the Company’s underlying assets. The Company plans to use existing funds, as well as funds from the future sale of products to fund operations and expansion activities.
As disclosed in Note 18, the Company has various loan facilities in place. Certain loans have finan-cial covenants which are generally in the form of leverage and liquidity ratios. During the years ended June 30, 2018 and 2017, the Company was in compliance with all covenants. The Company does not have any other externally imposed capital requirements.
31. SUBSEQUENT EVENTS The following events occurred subsequent to June 30, 2018:
(a) On July 2, 2018, the Company subscribed to a US$10,000,000 convertible debenture in a private company (“Investee Company”) which if fully converted would provide the Company with a 14.3% interest. The debentures bear interest at 1.5% per annum payable in cash or common shares equal to the fair value of shares at the time of issuance. The debentures are convertible into common shares of the Investee Company at US$4.9585 at the option of the Aurora until July 2, 2023. The Company had advanced the funds to a legal trust account as of June 30, 2018 (Note 4).
The Company also entered into an Investor Rights Agreement where Aurora has the right to participate in any future offerings of equity of the Investee Company to allow Aurora to maintain its percentage ownership interest, as well as the right to nominate a director to the Investee Company’s Board of Directors as long as the Company owns at least 10% interest.
(b) On July 10, 2018, the Company entered into a Product Development and Distribution Agreement with Evio Beauty Group Ltd. (“Evio”) pursuant to which both companies have agreed to collaborate to develop and manufacture a line of at least 3 co-branded topical cosmetic products formulated with a cannabinoid or cannabinoids. The agreement has an initial term for 6 years and following expiry of the term, unless renewed, neither party shall continue to sell the products. Aurora will earn a 10% royalty on sales of all non-infused products, and Evio will earn a 10% royalty on sale of all infused products in any geographical area in which Aurora operates.
29. FINANCIAL INSTRUMENTS RISK (CONTINUED)(c) Market risk (Continued)
134 Aurora Cannabis Inc. 2018 Annual Report

The Company also entered into an Investor Rights Agreement where Aurora has the right to participate in any future offerings of equity or debt convertible into equity of Evio to allow Aurora to maintain its ownership interest.
(c) On July 17, 2018, the Company acquired the remaining 50% interest in AHL from AJR for US$500 (Note 12(a)).
(d) On July 25, 2018, Aurora completed the acquisition of all of the issued and outstanding common shares of MedReleaf Corp. (“MedReleaf”). Under the terms of the Amended Arrangement Agreement dated May 23, 2018, holders of MedReleaf common shares received 3.575 common shares of Aurora and $0.000001 cash for each MedReleaf common share held (the “Exchange Ratio”). The Company issued an aggregate of 370,120,238 common shares with a fair value of $2,568,634 and 14,033,784 replacement stock options and 10,278,125 replaced warrants. The exercise price of the stock options are based on the exercise price per MedReleaf stock options adjusted for the Exchange Ratio.
(e) On August 1, 2018, the Company and CannaRoyalty entered into an assignment and assumption agreement where CannaRoyalty assigned to Aurora all of its right, title and interest in an exclusive license for a technology for creating machine-rolled cannabis devel-oped by Wagner. In consideration, Aurora paid to CannaRoyalty $7,000 through the issuance of 756,348 common shares at $9.255 per share.
(f) Pursuant to the spin-out transaction (Note 15), ACI completed a non-brokered private placement financing in two tranches on July 5, 2018 and August 3, 2018. ACI issued 85,000,000 shares at $0.20 per share for gross proceeds of $17,000.
(g) On August 7, 2018, the Company entered into a Letter of Intent to acquire HotHouse Consulting Inc. (“HotHouse”), a provider of advanced greenhouse consulting services, for $2,000 to be paid in common shares of Aurora.
(h) On August 8, 2018, the Company completed the acquisition of Anandia Laboratories Inc. (“Anandia”), a private company that holds a Dealer’s License by Health Canada and provides analytical testing services to Licensed Producers and patients. Anandia was acquired for its research and development portfolio, including the exclusive rights to a number of key genes in the cannabinoid pathway, patents pending for genetic markers, as well as its product testing and product development facilities. Aurora acquired all of the issued and outstanding common shares of Anandia in exchange for 12,716,482 common shares and 6,358,210 share purchase warrants of Aurora. The warrants are exercisable at $9.3717 per share until August 9, 2023. Pursuant to the terms of the acquisition, upon the achieve-ment of future milestones, Aurora will pay an additional $10,000 by way of the issuance of additional shares and warrants.
(i) On August 20, 2018, the Company fully converted its US$1,000 debenture into common shares of CTT (Notes 8(i) and 12(e)).
(j) On August 29, 2018, the Company closed a $200,000 debt facility with Bank of Montreal (“BMO”) consisting of a $150,000 term loan and a $50,000 revolving credit facility, both of which will mature in 2021. The Company also has an option to upsize the facility to a total of $250,000, subject to certain conditions. The debt facility will be primarily secured by Aurora’s production
31. SUBSEQUENT EVENTS (CONTINUED)
Notes to Financial Statements 135

facilities and can be repaid without penalty at Aurora’s discretion. The interest rate for the debt facility and revolving credit facility is a set margin over the BMO CAD Prime Rate or a Bankers’ Acceptance of appropriate term. Based on the current BMO CAD Prime Rate, the interest payable is expected to be in the mid to high 4% per annum range over the term of the loans.
(k) On September 10, 2018, the Company announced it had entered into a definitive arrange-ment agreement pursuant to which Aurora intends to acquire all of the issued and outstanding common shares of ICC Labs Inc. (“ICC”) for $1.95 per share, payable in common shares of Aurora valued at the VWAP during the 20-day trading period ending the second to last trading day on the TSX prior to the effective date. The transaction will be effected by way of a plan of arrangement under the Business Corporations Act (British Columbia).
(l) On September 10, 2018, the Company acquired 100% of the issued and outstanding shares of Agropro UAB (“Agropro”) and Borela UAB (“Borela”) for total consideration of €6,418 of which €960 was paid through the issuance of 170,834 common shares. In addition, the Company paid a finder’s fee of €1,517, which was paid through the issuance of 270,024 common shares, and will also refinance Agropro’s existing debt totaling €2,076. Agropro is a hemp seed contracting and processing company, and its sister company, Borela, is a processor and distributor of organic hulled hemp seeds, hemp seed protein, hemp flour and hemp seed oil.
(m) On September 19, 2018, the Company completed the spin-out of ACI and distributed to Aurora shareholders, as a return of capital, units of ACI on the basis of one unit for every thirty-four Aurora shares outstanding on the August 24, 2018 record date (Note 15). Each unit consisted of one common share and one warrant exercisable at $0.25 per warrant for a period of one year. The results of ACI were deconsolidated from the Company upon completion of the spin-out.
(n) 8,043,385 common shares were issued on the exercise of 8,043,385 stock options for gross proceeds of $21,336.
(o) 759,638 common shares were issued on the exercise of 759,638 warrants for gross proceeds of $2,659.
(p) 11,999 common shares were issued on the conversion of $77,994 principal amount of debentures (Note 17(c)).
31. SUBSEQUENT EVENTS (CONTINUED)
136 Aurora Cannabis Inc. 2018 Annual Report

Aurora Cannabis Inc. 2018 Annual Report 23
Corporate Directory
DIRECTORS
Michael Singer Chairman
Norma Beauchamp Director
Terry Booth CEO, Aurora Cannabis
Steve Dobler President, Aurora Cannabis
Dr. Jason Dyck Director
Ronald Funk Director
Diane Jang CEO, Hempco Food and Fiber Inc.
Adam Szweras Director
SHAREHOLDER INFORMATION
Stock Exchange Listing TSX: ACB
Registrar and Transfer Agent Computershare Ltd. Vancouver 510 Burrard St, 3rd Floor Vancouver, BC V6C 3B9 Tel.: 1-604-661-9400Fax: 1-604-661-9549
Auditors MNP LLP, Vancouver
INVESTOR CONTACTS
Phone: 1-855-279-4652Email: [email protected]
Robert KellyDirector of Investor RelationsAurora
Marc LakmaakerVice President, Investor Relations and Corporate DevelopmentAurora
OFFICERS
Terry Booth CEO
Steve Dobler President
Neil Belot CBDO
Cam Battley CCO
Glen Ibbott CFO
Allan Cleiren COO
Darryl Vleeming CIO
Debra Wilson CHRO

www.auroramj.com