aura - halo labs
TRANSCRIPT
Aura S Y S T E M S
HIGH-THROUGHPUT AGGREGATE AND PARTICLE CHARACTERIZATION
AND IDENTIFICATION
Protein vs Non-Protein IDCapsid Aggregate IDCell Aggregate IDProduct Purity5 µL – 10 mL Sample Volume96 Sample Automation
AURA AGGREGATE ANALYSIS

Product Quality Analysis Re-imagined
ONE BOX, MULTIPLE APPLICATIONS
Analyze aggregates and subvisible particles in your protein, gene, and cell therapies with the Aura™. Added bonus? You can also perform cell viability and cell type differentiations assays.
MACHINE LEARNING-FREE AGGREGATE ID
Label aggregates fluorescently to get specific ID without having to rely on morphology, spectroscopy, or machine learning libraries.
KNOW YOUR AGGREGATES
Get reproducible and quantitative count, size, morphology, and ID in one system. Finally!
OPTIMIZE THERAPEUTIC PERFORMANCE
Definitively ID aggregate sources to know exactly how to troubleshoot stability issues.
SAMPLE VOLUMES THAT MEET YOUR NEEDS
Use as little as 5 µL of sample per analysis if you are sample limited. Or process an entire 10 mL sample if you want to leave no stone unturned. It’s up to you.
SAVE TIME AND MONEY Avoid costly downstream setbacks. Screen precious early-stage samples to gain key stability insights and make decisions about your therapeutic sooner rather than later.
FAST ANSWERS… Process a full 96-well plate in hours, not weeks. Why wait for answers?
… WITH NO FUSS Get started right away — the Aura is automated and always ready to go. Disposable membrane plates mean no cleaning between runs and no chance for cross-contamination
FLUIDICS-FREE PEACE OF MIND
Analyze samples without worry about clogging.
TRUST YOUR DATA WITH MINIMAL OPTIMIZATION
Measure 100% of your sample. Everything is counted without having to optimize image capture conditions
EASY METHOD TRANSFER
Use Aura from early development all the way through lot release. Membrane microscopy is an established USP method.
AUTOMATION READY Increase your efficiency. Liquid handlers and robotics can automate your plate prep and assays.
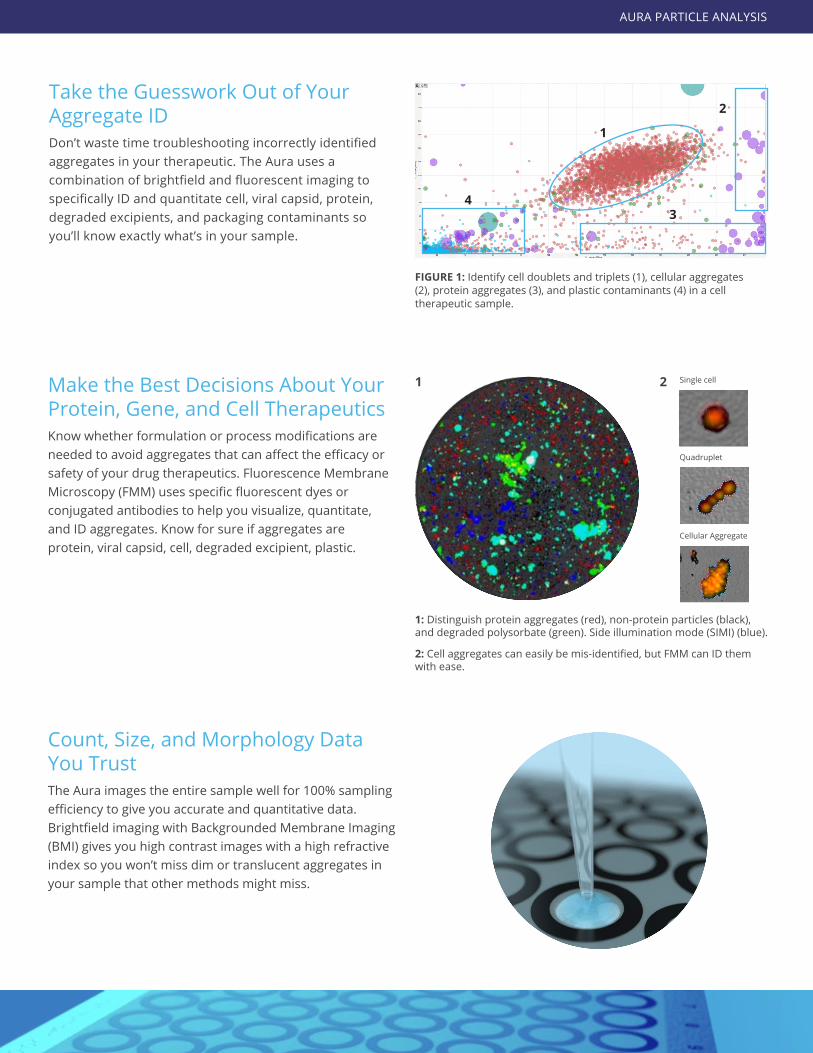
Take the Guesswork Out of Your Aggregate IDDon’t waste time troubleshooting incorrectly identified aggregates in your therapeutic. The Aura uses a combination of brightfield and fluorescent imaging to specifically ID and quantitate cell, viral capsid, protein, degraded excipients, and packaging contaminants so you’ll know exactly what’s in your sample.
Make the Best Decisions About Your Protein, Gene, and Cell TherapeuticsKnow whether formulation or process modifications are needed to avoid aggregates that can affect the efficacy or safety of your drug therapeutics. Fluorescence Membrane Microscopy (FMM) uses specific fluorescent dyes or conjugated antibodies to help you visualize, quantitate, and ID aggregates. Know for sure if aggregates are protein, viral capsid, cell, degraded excipient, plastic.
FIgure 1: Identify cell doublets and triplets (1), cellular aggregates (2), protein aggregates (3), and plastic contaminants (4) in a cell therapeutic sample.
1: Distinguish protein aggregates (red), non-protein particles (black), and degraded polysorbate (green). Side illumination mode (SIMI) (blue).
2: Cell aggregates can easily be mis-identified, but FMM can ID them with ease.
Count, Size, and Morphology Data You TrustThe Aura images the entire sample well for 100% sampling efficiency to give you accurate and quantitative data. Brightfield imaging with Backgrounded Membrane Imaging (BMI) gives you high contrast images with a high refractive index so you won’t miss dim or translucent aggregates in your sample that other methods might miss.
Single cell
Quadruplet
Cellular Aggregate
1 2
1
2
34
AURA PARTICLE ANALYSIS
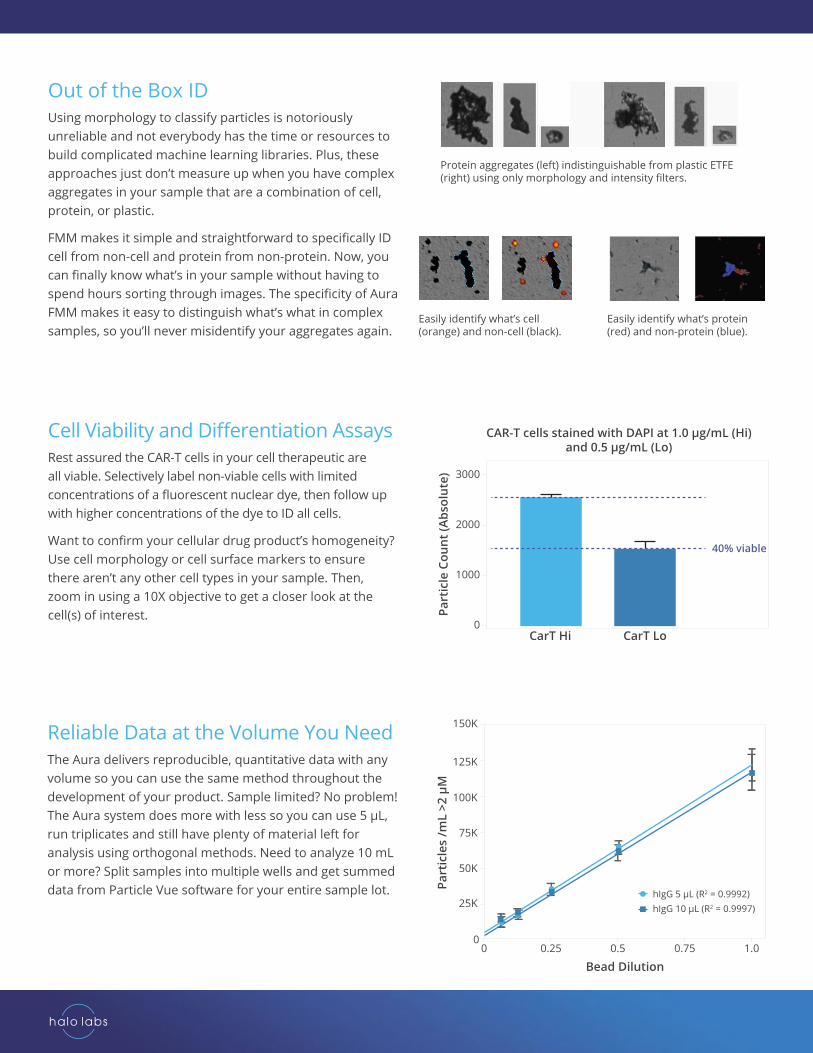
Out of the Box IDUsing morphology to classify particles is notoriously unreliable and not everybody has the time or resources to build complicated machine learning libraries. Plus, these approaches just don’t measure up when you have complex aggregates in your sample that are a combination of cell, protein, or plastic.
FMM makes it simple and straightforward to specifically ID cell from non-cell and protein from non-protein. Now, you can finally know what’s in your sample without having to spend hours sorting through images. The specificity of Aura FMM makes it easy to distinguish what’s what in complex samples, so you’ll never misidentify your aggregates again.
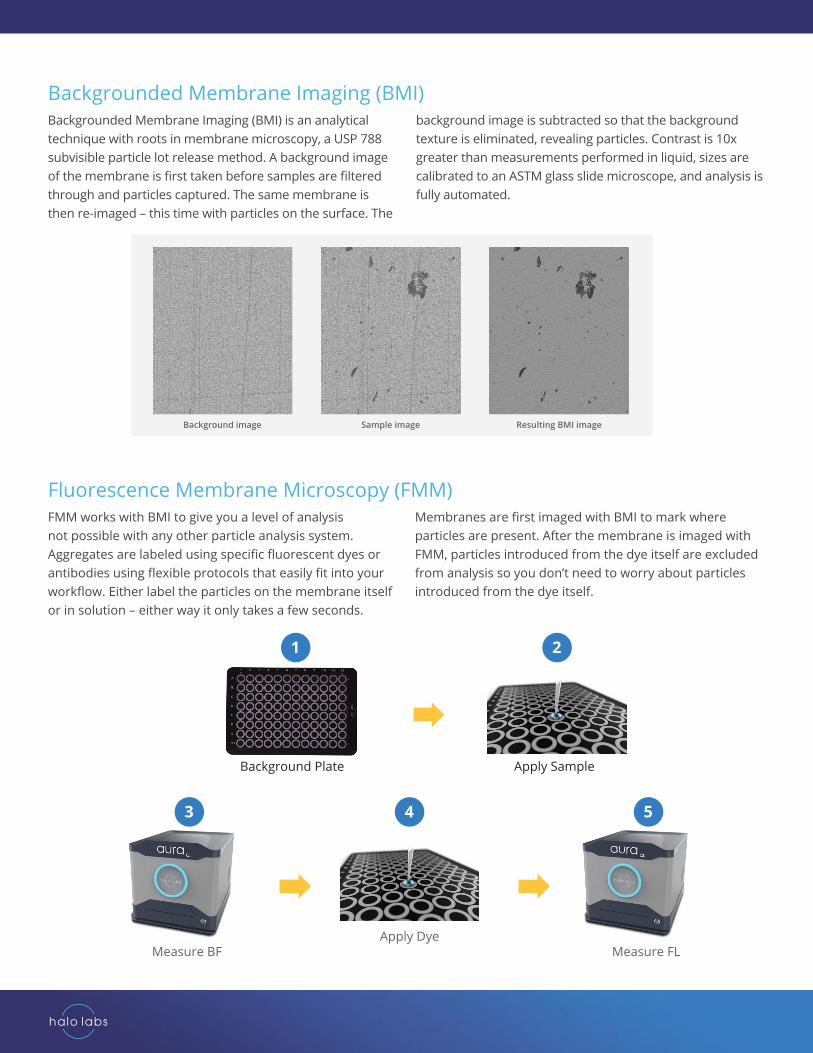
Reliable Data at the Volume You NeedThe Aura delivers reproducible, quantitative data with any volume so you can use the same method throughout the development of your product. Sample limited? No problem! The Aura system does more with less so you can use 5 µL, run triplicates and still have plenty of material left for analysis using orthogonal methods. Need to analyze 10 mL or more? Split samples into multiple wells and get summed data from Particle Vue software for your entire sample lot.
Cell Viability and Differentiation AssaysRest assured the CAR-T cells in your cell therapeutic are all viable. Selectively label non-viable cells with limited concentrations of a fluorescent nuclear dye, then follow up with higher concentrations of the dye to ID all cells.
Want to confirm your cellular drug product’s homogeneity? Use cell morphology or cell surface markers to ensure there aren’t any other cell types in your sample. Then, zoom in using a 10X objective to get a closer look at the cell(s) of interest.
3000
2000
1000
0
Part
icle
Cou
nt (A
bsol
ute)
CarT Hi
CAR-T cells stained with DAPI at 1.0 µg/mL (Hi)and 0.5 µg/mL (Lo)
CarT Lo
40% viable
0
150K
125K
100K
75K
50K
25K
Part
icle
s /m
L >2
µM
Bead Dilution0 0.25 1.00.5
hIgG 5 µL (R2 = 0.9992)hIgG 10 µL (R2 = 0.9997)
0.75
Protein aggregates (left) indistinguishable from plastic ETFE (right) using only morphology and intensity filters.
Easily identify what’s cell (orange) and non-cell (black).
Easily identify what’s protein (red) and non-protein (blue).

After evaluating all of the options for subvisible particle instruments, I concluded there really is no other choice besides getting an Aura. Nothing else can match its capabilities.— Analytical Scientist, Major Biopharmaceutical Company
AURA PARTICLE ANALYSIS
Backgrounded Membrane Imaging (BMI) Backgrounded Membrane Imaging (BMI) is an analytical technique with roots in membrane microscopy, a USP 788 subvisible particle lot release method. A background image of the membrane is first taken before samples are filtered through and particles captured. The same membrane is then re-imaged – this time with particles on the surface. The
background image is subtracted so that the background texture is eliminated, revealing particles. Contrast is 10x greater than measurements performed in liquid, sizes are calibrated to an ASTM glass slide microscope, and analysis is fully automated.
Fluorescence Membrane Microscopy (FMM)FMM works with BMI to give you a level of analysis not possible with any other particle analysis system. Aggregates are labeled using specific fluorescent dyes or antibodies using flexible protocols that easily fit into your workflow. Either label the particles on the membrane itself or in solution – either way it only takes a few seconds.
Membranes are first imaged with BMI to mark where particles are present. After the membrane is imaged with FMM, particles introduced from the dye itself are excluded from analysis so you don’t need to worry about particles introduced from the dye itself.
Background image Sample image Resulting BMI image
Apply Sample
1
3
Background Plate
2
4 5
Measure BFApply Dye
Measure FL

Which Aura is Right for You?
Application Aura BMI Aura FL1 Aura FL2 Aura CL
Particle Detection/Quantitation
Extrinsic Particles
Protein ID
Polysorbate ID
Cell Aggregate ID
Immunoassays
Cellular Assays
Custom FL Applications
Therapeutic Area Aura BMI Aura FL1 Aura FL2 Aura CL
Protein/Antibody
Small Molecule
Gene Therapy
Cell Therapy
AURA PARTICLE ANALYSIS

halolabs.com [email protected]
© 2021 Halo Labs. All rights reserved. The Halo labs logo, Aura, Aura BMI, and Aura CL are trademarks and/or registered trademarks of Halo Labs. All other brands or product names mentioned are trademarks owned by their respective organizations.
Rev B
Product Specifications
Technology Backgrounded Membrane Imaging (BMI) and Fluorescence Membrane Microscopy (FMM)
Imaging area 24.6 mm2
Brightfield illumination (BF) LED 455 nm
Side Scatter illumination (SIMI) LED 465 nm
Fluorescence illumination (FL) LED
FL channel 1 (protein/non-protein) Ex: 440/40 nm, Em: 500/40 nm
FL channel 2 (polysorbate) Ex: 482/35 nm, EM: 524/24 nm
Other available FL channel 2 options Ex: 376/30 nm, Em: 440/40 nm Ex: 605/50 nm, Em: 670/50 nm Ex: 540/50 nm, Em: 600/37 nm Ex: 488/50 nm, Em: 544/24 nm Custom excitation and emission
Sampling efficiency 100%
Minimum sample volume 5 μL (assay dependent)
Resolution 1.0 pixel/μm
Particle size range (detection and quantitation)
>1 µm
Maximum particle concentration (1.6 μm particle size)
>3,000,000 particles/mL
Brightfield read time (BMI) 1 minute/sample
Fluorescence read time (FMM) 30 seconds/sample
Sample format 96-well filter membrane
Membrane type 1 (brightfield) White — polycarbonate track etched 0.4 μm pores or 0.8 μm pores
Membrane type 2 (fluorescence) Black — polycarbonate track etched 0.4 μm pores
Robotic compatibility Yes