auinoe title it zchools. institution australian … classes regression analyses. 170 table 8.4 the...
TRANSCRIPT

ED. 173 067
AUINOETITLE
INSTITUTION
PUB DATENOTE.
AV AILAKL-E, FROM
DOCUMENT. RESUME
,Ainley, John G,The Australian Science F-acilities Program: A Study ofIt Influence on Science Education, in AustralianZchools. ,
Australian Council for'EducatjEpnal ResearCh,Hawthorn.
SE 026 852
7.8300p:; Contains occasional light type; Not.evailablein hard copy due. to copyright restrictionsTh4 Australian Council .for Educational Research Ltd.,P.O. Box 210, Hawthorn, Victoria, Australia..3.122--,($A14.00)
A
EDRS PRICE MF01 Plus Postage. PC Not Available from EDRS._DESCRIpTORS Academic rOhievement; *Educational Research";
.. Eduat lional Resources; *Elementary Secondary.. Educa 1:; -*Laboratory Equipment; National Surveys;
L ,
*ProgrAEvaluation; *Science Education; ScienceEquipment; *Science Facilities; Teaching Methods
ABSTRACTThis report is a study conducted by the Australian,
Council for.EducatiOnal,RTsearch to :.valuate the inalhence Of sciencematerial resources, provided under the Australian Science Facilities,Program, on science education in AustraliaUnder the Australian,Science 4iFilities:Ptogram,some $123 million was Spent, between July/1964 and June 1975, on laboratories and apparatus in both government
t and non - government schools. The 'study is "baSed on the.iummination ofthree levels of impact of the:program: (1) .the impact of the programon the standard of science. facili+ies In schools of different types;.(2) the influence on'the standard 'of resoUrces.on tile quality ofScience teaching; and (3) the effects of better resources anddifferent.teachinq methods in student achievement. In addition, an4xhaustiveltxaiination of the administration of the program is, , .
reported. The report showS that while therefwas.a general improve)Ontit the standard of :resources for science teaching over the periOdofthe .program, Some.schools wiIh inadequate facilitiesremain.Questionnaires used in.thatudy and a t of references re. alsoincluded. (Author/HM).
-Pr****#*************************************************************
ReproductionS supplied by ERRS are the best that can be made *
from the original document. *,**********I4************************************* *****************45**

THE AUSTRALIAN SCIENCE FACILITIES PROGRAM:
.A STly -OF ITS INFLUENCE ON
SCIENCE EDUCATION /IN AUSTRALIAN SCHOOLS
by 4..
JOHN G. AINL Y
Thiiudy constitutes oneof al.serie; of.evalUatsiori studies sponsoredfinanciallyAby the Schools Commission and was conducted independently
by the Aistrallan Diuncil 'for tducaiiofial Research.
e Wstralian Council for EduCational Research Limited.Frederick Street, HawthOrn,
. . .
1978

Published by
The Australian Council'fOr'Educational/R
Frederick StreetyHawthorn, Victoria 312,.
December 1978.
yrnted 'and bound by
GlobePress Pt?, Ltd,
430 George Street, Fitzroy/Victoria
./ /je.
National Library of Australia Cataloguing4n,-PublicatiOn data.
4.
'1'-Tanley,/John G.
// The/Australian Science Facilities Progra
science education in Australian
or
//iCER research monograph; *no).
ISBN 0 85563 187 2t
study of its.influence
.1
1. Federal aidto/edu ation Austealia. 2. Science -Study'and
teaching (Sedon'ary)- A4A4alia T Fi e. I. Title. (Series: Australian*
.codhcAllior Eddcational Reekrcb, R sea'rc'h monograph; no.2)
579:'121-1'0 94 /r
Copyright .0/ ACER 1978
.4
his:publication May be reproduced'in any
of the publisher.
T

Table of Contents
'51
Yi
Page
Acknowledgmenes. ; ° (x)t
Chapter 1: '. Thekustrallan Science FaCilities Programin Context
s'....1i
The General SignifiCance of the Program- s.
1;
The Background to the Proposal .,.. .
'3The Needs of Science'Education.i . ` 12
^ ,
Chapter 2 ' ;.Evaluating the'. Science Facilities erograffi 21'
2 21
.29
43
43.
52
55
66
67.
67
76
A Framewbrk for the Evaluation... .
.
Studies Related,tosthe PrOVision'of Science Facilities .
A Plan for the Evaluation
..Chapter 3 Conducting the Evaluation.IP-..- .4
The'''s114iyio chool Science Facilities C.,
TheliSchpol 1hSitsr AliThe Student Question ire
Systemic Effects anndministration.
Chapter.4,' Systemic Features of:the -Scienpe Facilities Ptdgram.General Organization
. c1
ihe'Non-Government School Program. ,
The Government.School Program
'11fruarY..
Chapter 5, Concomitant Developments,
Laboratory AssiStants
curriculum Development
The.54iply of Apparatus
The DAign.of'Sdiscw Rooms
. Chapter,6 Rooms for Teaching Scienc
Looking at Science Faci ities
The Avair011ity of.Sci ce Rooms
The Provision of Scienc 'Rooms in
The Quality, of Science'Rooms.
Access to Science\Rooms'
Sumnp4y
in Educatibnal
for Science 1,1.isons
Schools
97.
98
102
110
121
121
123
.e. 133
141
144
147

SI
)0aking.Use of Science Rooms
Fa iXitating EffectiVe Use of Rooms
The Sup y.of:Apparatus
Laboratory Assistants in.Schools
, Facilities as an Impediment to Practical Work ;._
Diferentes Between States in Teaching Science
..
Chapter 8 The -Impact of FaCilities on Science Teaching
apd.Leatning .
,163
t.a). kThe. Vielltlof Non-.Government School Principals 163
.. /Student Views about Studying Science
165
Science Facilities and Science Learning: A Between-Class
'''
Analysis, 167
..
Cofielations Involving School Facilities'173
'Tie Locatioh of Science Rooms175
. .
Conclusions176
Page
149
.149/
150
153
156
158
Chapter 9 ' A Closer Look at Some Schools 179
BaCkground to the Visits179
, Tile Context of the School Visits181
Ruraton High SchOol .
. 183
'ir, Riverside. High.School188 .
Petrin High School .
191
Casterbridp High School194
4Westerp College198
The AVhoofs : A Resume200
.
Q '
l
Chapter 10 Teacher Retention and Student Enrolments 1 .203
-"----.Intrdauction203
.Science Teactiers in. Australian Schools
203
Factors As§ociated With High Stability of Staff 207
0
Teaches' Attitudes to Science Teaching 210
-; .Student Enrolments in Scierice SUbjets 211
-7--
Chapter 11 In Retrospect ' $...'.,221.
The Provision of' Science Facilities222
. ,
The,,Influence of the Scince FaCilities Program. 226.
lle Origins of the Program 1 . 2-29
The Administration of the PrOgram 250
A Concluding Comment a -1
233
,,, cr
>

References
Page
235
Appendix A A Summary of Que,stions About theAustralian Science Faciliti!e5. Program 251
Appendix' B\ The Schobl Questionnaire 253
Appendix C Details of Sampling and Weighting 271
Appendix D \Letters to Schools 275
AppendiO .`The Student Questionnaire. 285
Appendix F Items Used in Scales from the. Student Questionnaire 291
Appendix G Measures-of Science Facilitiet 295
Appendix Expenditure Under.the Australian ScienceFacilities Program 297, .
299Appendix I Teadher Attitude to SGience Teaching Scale _
O

Tables
Page
. ,
x
ble 1.1 gercentage of Science Rooms not Considered to be
SatiSfactory in 196113%
Table 1.2 Science Staff in Secondary Schools in 1961 14
Table 1.3 Percentage of Science Classes Held in Satisfactory
Laboratories in 196415
Table 3.1 Questionnaires Returned from Each State and School
System .
50'. .
Table 3.2 Number.of Questionnaires Returned by State and Date :.51--.
Table 3.3 Factor Anakais of the Student Questionnaire Views
of Sci6hae.Classrooms (Secti.on A) 63
, -
Table 3%.4 Factor Analysis Of the'Student Questionnaire Views
of Science Classrooms (Section B) ".64
Table 3.5. Scale Statistics for the Student Qq:§tionnaire
Views of Science ClassroomS r 65
Table 4.1 Total Funds Made Available Under the Science 4.
Facilities Program-75 -
Table 4.2 Per Pupil Allocations of theSzience Facilities
-.Program
Percentage of Science Facilities Program Funds
Spelt on Apparatus - Non-Government Schools. 80
.Table 4.4 Science Bui,lding and Equipment Programs
Government Schools 1964-1g71
Table 4.3
Table 4.5 Estimated Building Costs
Table. 4.6 Laboratory Costs' in Government :and Non-Government
Schools
Table 4.7
88
99
Percentage of s"cience FacilitlegLPiogram Used,for
the Provision of ApparatuS in GovernmNt Schools 92
Table 4.8 Percentage of Available Funds Expended 1964-65
(Government Schools) -94
Table 5.1 The ffsefultess of Certain. Items of Equipment
'...--Supplied to Schools -- 1967
103
Table 5.2 Usefulness o? Certain Items'of Apparatus - 1975 : . 104'
Table 5.3 Preferred Method of Arlocating_Apparatus
1Teachers Comments in 1967 . .
105
Table 5.4 Issues Related to the Use of Apparatus :
Teachers Comments in 1967105'
. ,
Table 5.5 Types of Science RooMs in Australian SkhoOls 113
Table 6.1 Factor Analysis of Responses to ,the Questionnaire :
Science Facilities in Australian Schools '122
Table 6".2 Science Rooms Built. or Renovated since 1964 in
Schools Established before. 1964 123
Table 6.3 .Cortelations between Various Indices of Need.4
for Science Rooms124'
(vi)-8

Page
Table 6.4 Availability of Science Rooms in SecondarySchools 126
.
Table 6.5 Mailability of Dual Purpose Science ms inSecondary Schools . 127
Table 6'.6 'Room Availability for School Sysiems in Each Statein 1975 127
-
Tale 6.7 Dual Purpose Room AvailAbility for School Systemsin Each State in 1975 128
Table 6.8 Mean Values of Room Availability and Dual PurposeRoom Availability.by. School Location forGovernment Schools in 1975 129,
Table 6.9 Clusters of School,s with Similar Provision ofScience Rooms 132
Table"6.10 'Mean Number of Hours per Week Per Class Allocatedto Teaching Science in 1975 (Science.StudentsOnly)
Table 6.11, Mean Number df Hours per Week per Class Allocatedto Teaching Science at Year 8 in City andCountry Schools in 1975 da, 135.
.
Table 6.12 Percentage of Students in Year 10 who did not StudycSgence in 1975 136 .
Table 6.13 Mean Number of flours per Week Allocated to Science,per Pupil in 1975 ;k. 137
lean Values of the Science Enrolment Index forSchool Systems in Each State in 1975 137
Table 6.15 Science Rooms and Dual Purpose Science Rooms per10.00 Students by State and School System-in 1975 139
Table-6.16 Science Rooms \rrItl Dual Purpose Rooms per 1000Students by School Location in 1975 o 140
-;
Table 6.17 Different Ratings of.Similar Rooms - MelbourneSchools
135
".Table 6.14
Mean Ratings of Science Room Quality by ScienceTeachers
Table 6.19 Percentage of Schools Where Rooms Rated .as%,Signifibant Impediment to Practical Work-
Table 6.20 Percentage of Science Lessons held in Non-ScienceRooms in 1975
Table 6.21 The Use of Rooms Prolided Und r the ScienceFacilit'es Program
4Table 7.1 Percentag of Schools with requent Deficiencies inApplfa us .
Tablli 7.2 Correlations Between. Various Measures of theAdequacy of Apparatus
Table 7.3 Lack of Basic Apparatus Regarded as a ProbleM-inPractifal Work
142
142
143
.145
146
150.
151
152

Page
Table 7.4 Correlations Between MeaSures Related to the
- Proyision of Ancillary Staff 154
Table 7.5 Laboratory Assistants per 1000 Students 154
Table 7.6 . Percentages of Schools in which Aspects of.Assistance Rated as a Significant Impedimentto Practical Work 155
Table 7.7 Aspects of Facilitiet Least and Most FrequentlyRegarded as Impediments to Practical Work 157
.
Table 7.8 . Group Size for Practical Work in Year 9 158
Table 7.9 -Percentage EXperimentalWork in Year 9 .159
Table 7.10 'Number of liaboratorN Exercises in BSCS Biology 160'
Table 8.1 The Views of Non-:Government School Principals aboutImproved Facilities for Science 164.
Table-8.2 Between and Within Class Variation in Responsesto the Student Questionnaire 166
'Tattle. 8,3 The Impact of Science Facilities on the ScienceLearning Envitonment : Between Classes RegressionAnalyses . 170
Table 8.4 The Association between Facility Measures andEnvp'onment Indices (coefficient of Contribution) 171
Table The Impact of Science Facilities on Activities inLearning' Science : Between ClaSses RegressionAnalyses 172
Table68A8.6 Coefficients Between Facility Measures
and Descriptions ofLearning (School Facilities) 174- .
The Association Between Reports of Science LearningTable 8.7and the Location of Science. Rooms 175
Table 10.1 Percentage of Science Teachers witha'CompletedTertiary QualIfication in, Science 204
.,.
Table 10:2 Percentage. pf Science Teachers .in 1975 who were.Female . 205
Table 10.3 Number of YearsTeaching Experience of ScienceTeachers
)
206.
Table 10.4 'Number of Years at Present School 207
Table 10.5 Teachers Attitudes to Teaching Science 211'
Table 10.6 Enrolments. in Science Subjects from 1964 to 1971-
. , in Victoria ... 213
Table 10.7_ Enrolments in Science Subjects from.1964 to 1975in Western Austialia 214
. ,
Table 10.8 Percentage of Year 12 Students Enrolled in ScienceSubjects -.
"-- Table 10.9 ABetweemStatesAnalysis of the Association BetweenTime Allocationto Science and the ScienceEnrolment Index .
. 22
215

Figures
Page
Figure 2.1
Figure 3.1
Figure 3.2
ExpecOricins(31 the Australian iCienceFacilities Program
A Science.goom Built with FuncIS from theScience Facilities PrograM
An Activity Based Science Lesson
25
. 5.8"'
58
Figure 4.1 - Allocation of Funds Under the ScienceFacilities Program
. Figure 4.2 Procedure Leading to an Offer of Assistance 78
-Figure 5.1 A Single Purpose Labotatory Designed forChemistry Practical Work 115
Figure 5.2 A Dual Purpose Room based on Fixed Benches 115
Figure 5.3 An Island Bench Science Room. 116
Figure 5.4A,
A Science Room with all the Servic s at thePerimeter of the Room 116
Figure 5.5
) .
(A Science Room with Peripheral S icesin which the desks have been rangedfor discuSsion groups . 117
Figure 5.6 A Science Room with-Separate Iabo tory.Work, Areas at the Edge -ofteRm 117.
FigUe 5.7 A Science Room incorporatin P4,11arsMovable Tables 118
Figure.5.8 A Science Room with Elongated Pillars and.A .
. .-Movable Benches. 118
Figure 6.1
4
AID Analysis to Determine the Distributionof the Availability of Science Rooms inAustralian Seconddry Schools .131
Figure 10.1 AID Analysis of Teacher Mobility 209
Figure 10.2 AID Analysis of Science Enrolments 217
Figure 10.3 The Association between Science Enrolmentsand Time Allocated to .Science. 220
4

Acknowledgments
Many people have.helped me with this I wish to thank therm fotthat
help.'I am grateful to the members of my advisory-committee.for the comments
--they offered on my early proposals for study, my interpretation of data,
and my draft versions of the report. The embers of the advigory commi ee
were Dr T.W. Field, Mr E.D. GaNiner, Mr III:Hall, Dr J.P. Kee4s,'\Profe sor
Kwong tee'Dow, Professor L.D. Mackay, Wr D.G. Morgan, Mr R. O'Sullivan, and
ProfessOr R. .Selby Smith who was the chairman.
I spent a great deal of.time discussing the-project with Dr J.P. Keeve,
Professor Kwong Lee Dow, and Mr J.M. Owen. Itha0c them for their encourage--
ment, sound adVice and. constructive criticism.
I gratefully acknowledge the co-operation of each State EducatiOn.
,Department for the assistance they provided. In particular .i.should-mention
Mr F. Jones (ACT), MisR.B. Roberts (NS'), Mr I.M. Hall (Vic), Mr G. Robins
"(Old), Dr E. Best andlDr 5.M. Mayfield (SA), Mr K. Betjeman (WA) and Mr G.
Fish (Tag). Thanks are also due to the officiLs of the Science FaCilitips
Section of the Commonwealth Department of Education who helpad me with access
to files inAhat department.
Science teachers in a large number of,schools thrdughout Australia took
time to complete questionnaires, talk to me,'and allow me access to their
classes. 'For this I am-most grateful.
For the duration of this project I was seconded from the Melbourne State
College. I wish to thank the administration of ghat college for making it
possible for me to undertake this study.
Finally, I wish to thank the clerical ; library, research and typing
staff pf the Australian Council for Educational Research for their help with
various aspects of the project.
John G.-Ainley

O
PTER'ONE
. ,if .!4
THEAUSTRALfAN SCIENCE FACILITIES PROGRAM
IN CONTEXTCONTBxT ,
.
The General Significance of the Program-
.
1
.On 12 November 1963 the'Prid.Minister:R.G. Menzies, delivered an electioh
policy speech on behalf of the NAberaljarty. In that Speech, just a littlea ,
,..4ft-.
le'se tan three weeks prior to he Federal election prematurdly called for.,
special40,November, special assistanc for science teathing was promised. Meniies.
affnOUnCed that,.
if returned to-government, his party would,. a 41
make,avai1able £5 million per annum fot the provision
5 of building and equipment facilities for science feach.ing j.n secondary schools. Odnzies, 1963 .,; 22)
ql
.The money MO million) was intendWIfo meet the special needs for'improed
4 ,
-'science teaching' and was to be'avaijabl2 to both government and non-A'...
goVernrilent schools on the'basts of school .population. So began. the AUstralian:'
.. 4 '. ,
. Science Facilities'Program.
,
Enabling.legislation1
passedassea by Parliament in May 1964 so that.1
finance was available fl.oM,1.-July of that year. In ensuing years successive .
Acts Of Parliament2amended and extended the original Program. When it
concluded'on 30 June 1975 alittle,more than $1,23 million had been provided'
for !or committed to ,Secondary schools. Even though there were snail
'zdifferences between the successive ActS the'provisionS made under them have
been considered to constitute a continuing PrograM: In recent times this
has bent.' known as'tlie Australian Science Facilitils Program though it ha
often been referred to'as the 'Federal Science Grant' or the 'Commonwealt04- Sciendd Scheme'.
The%qinal announcement of the proposal-, for science aid in late 1963, was uneRpected. However its-enduring consequences have been considerable.0 A,
Not:411 of EhZksWconseluenceS have.bden confined to tht precincts of science03
.;,,
1
5, :education, liliough those whiCil were provide the focus of, this report...
i
02-,,-,
1 The Stateg'Granis.-4condary Schools Science Laboratories and -:
Act 196e
TeF,Sfates GV61.tsSecondiry Schools Science Laboratories) Acts 1965,1207,1968;197f. ''f7k
.L.'N
"13
.."
3,' .. ., G.3 din, .
2
47'
t

2.
Studies by Gill (1965); Smart (1975) and Tomlinson (1976). have shaven the
forMatiVe influence of ,political factors uponthe genesis and development'
theof the Program: These studies also sugpAstecil that the Program had an 1 .
effect upon subsequent developments in the financial provision fos schooling
in AuStralia.
IThb Science Facilities Program was.the first direct involvement. by the
%%Commonwealth Government in secondary education. Smart (1974) and'Tomilirison
(1976) have demonstrated that-this prograhrprovided a precedent for,;the
School.libraries Program.3 Tomlinson (1976)'extended his analysis
so that the ScienCe Fact ities'Prosgram was seen'in-context as the first of
a series of'COmmonwealt government initiatives which tulminated in per
capita grants to non-goVtrnment'schools and uncotditiOnal grants to the State8
for. capital, expenditure.on primary and secondary schools. As a result of
these prograMs the complex relations betureenState and Commonwealth,
'governments within tefederal system were altered. Tannock (1976:30)
consideredthat.because the States became so 'dependent upon the Commonwealth
they surrendered some of theirauionomy in the fOrmation of education
policies.
In addition to proving a significant turning point.in Commonwea7De h--,
'State relations the Science Facilities Program had important ramifications, .
for the relationship.between Church and Government in the financing of
education. Money was allocated to non-government schools, and it was4he
fact that this occurred which helped to re-kindle the embers ofa debate.-over the tole of Church and Statein education. Subsequent programs .,a
.extended the assistance available to non7government schools. Tomlinson
(1976) showed that this,was paTt of a re-examination of policy by, the Liberal.
Party in government. A similar study of the evolution oiAustrall Labot
Party policy is not available. Yet it is apparent that the "aid according
to needs" policy was.developed as a response to the issue of aid to non
government schools. wIlich was consistent with the more general principle of
equal 'educational opportunity (Fitzgerald and Mathews, 1975; Spaull, 1974).
Not only political parties were forced to re-examine the question of
financial assistance to non-government.schools. Gill C1965)0 presented
evidence which dembnstrated that non-catholic churches were impelled to
clarify their attitude towards government assistance. Initially same
were reluctant to accept the assistance offered under the Australian Science
3 The States Gtants (Secondary Schools Libraries) Acts 1968,'1971.
'14

3.
,. Facilities' Program. By the time he Science Facilities Program terminated
"the tradition of separation of de1ominational schools froMpublic funds
had been destroyed" (rannock,1976:30)..
'.. `.., ...-,'" .
In the course of a study of the development of education pent), In
,4 Liberal Party, Tomlinson (1976) concluded that the announcement of the
Science Facilities Program had had considerable impact.
. Menzies achieved in a single unexpected statement aresolution of the state aid argument, the creation of.a new rolesfor theCommbnwealth'in providing for schools, and a reversal ofthe firM.Liberal policy that section 96. grants should be madeonly at the spetifid requests of the States. After thatstatement_,'... the Commonwealth became involVed in cumulative
"-but separable and specific programs df assistance to schoolsgovernment and independent, withintite States. '(Tomlinson,1976:\284).
. ..
8 .
Th/
Background to the Proposal
Political Exigencies
Gill (1965) has presented cotvinding.evidefte of the political advantage
which the announcement of aid for science facilities created. Such 4 .
scheme simultaneously met the demands of those arguing for assistance to
non-government schools, those who supported greater assistance from the
Commonwealth government for government schools, . and thoske who pleaded the
specialcase for. science. Yet it was sufficiently specific, and so
tdirected to a perceived national(11 ed, that it did,not offend greatly the
opponents. of Commonwealth invoiveme t in secondary or primary education.
Moreover the proposition was onewhisch, when raised through the New South
Wales branch of the.Australian Labor Party earl/er that year,.had created
dissension in the Opppsitiop party (Gill, 1965)..
Constitutional Interpretation
Particular proposals such as the. SCience. Facilities Program assume
significanCe only when they,. are a tespOnse to more lasting developments.
Smart (1975)'and Tomlinson (1976) both examined the complex of factors
which.preceded Menzie' announcement on 12 November, 1963. Smart (1975)4
added to the short term political exigencies aconsideration of long t
and medium term develbpMents. A changed view of constitutional power
was the principal long term development. In education, as in other areas

ft
-
-
of government, constitutional amendments,4
judicial challenges. culminating
in the Uniform Tax Decisions,5 and,the greater financial resource-s
Commonwea h, led to a growth of the powers of the CoMmonwealth'government.
Tomlinson (1976) examined in detail the constitutional power.of the
Commonwealth government to provide funds,for.education. He argued that
there was no legal limitation upon_the capacity.of the Commonwealth
government.to fund educational activitiep through Section 96 grants.6
Menzies had recognized this in.a speech as OpPositioh readef in 1945-*. ,
(Menzies,,..CPD 1945: 4618)7. All that was required for the Lib e 41 Party to,
act under this provision was a circUmstance.in which such.an action could
be accommodated witblii the.tradItion4tqut changinvprincipleef federalism.-,
These long term developments in constitutional interpretation rendered it
..
,
possible for the Commonwealth government to provide fUndS directly for
.
secondary education.. °
4.emmonWealth Aid. to Government Schools
'the influences which Smart (1975)Classified as 'medium term' emerged. in
0
the late fifties and early sixties. He-categorized them, as belonging to
three clustqts of demands. The Science Facilities Program was a respense
to/the confluenee of these three sets of demands. The triad of demands
included arguments in support of Federal aid to education, supplications
requesting government aid-to non-government schools, and requests for'
. ..
i4 For example ection 51 (XxiiiA) which provides for benefits to be
. made availab e'to students by the Commonwealth Government..---------,
5 Thse arose in,J942 and 1957 from, inter alia, the States Grants.
.
(Income Tax Reimbu ement) Act, 1942, the. Income Tax (Assessment)
Act, 1942, and the Income Tax Act of 1942. As a result the Commonwealth' ..
government became doubtedly the major taxing power.. (Tomlinson, 1976:9)
'6 'Section 96 at the Constitition of the Commonwealth of Australia_
provides the Commonwealth with the power to provide. financial assistance
to the States..
96 During the period of tenyears after the establishment
I of the Commonwealth and thereafter until Parliament.
otherwise .provides; the Parlia'ment may grant financial
assistance to any State on such terms and conditions
`as the Parliament thinks fit.
4'For a disc ,Q tn br the relevance-ofhis section to educational- finance
see Tomlin orn (1976:3) '-
7 the notation CPD has been used to indicate a 'speech made in the Commonwealth
Parliament. The year and page number in the Commonwealth Parliamentary
Debates are indicated.
I6

5.
le
..speci ill:OssstalFe for the teaching of tcielice.1.0.Rising costs of schooling.
were at the root of all ree elemenip of the triad. In-government and
; non-government School's the ost-war pov.ilation_Aulge18 exacerbated the 0-.. ,11111.gtkain created by the 'trend: f7studentst6 reptaingsChool, ,mil. ..
..... J a\ - . ' 4.
This created difficulties often
.>
,
nsitred to be of 'crisis''proport'ions
i:(Fitzgerald, d970) in governmeW sc ol.sysfeMs. StategoyernmentsAad.
limited finandialsources from which eet the incredst& colt of, t o
. .
staffing, accommodation and sophisticattO ipment. Theargument that
these problems could di-lly.be alleviated by Fescil aid.ioi education
°.*....714"-----,
*as. advanced by a number' of froups. Smart:(1975: 8 cite role of
/national .parnt and teacher organizatiOns in ,lobbying Stoee\and Obtimonwelth
ministe4s, conducting national education conferencesaand campaigning to
'raise Federal aid to schools. as an election issue.- Wilhiff the Commonwealth
"'ornament the Opposition often demanded ifiatthe Commonwealth Government,,;r
hould become,more involved in education.( *gest influential,-in the view
of Smart (1975: 88)'was a statement, prepared by the Australian Education
. Council, whichdreW attention to the need for additional,fundS, to be made
'available to the States for education. The AUstralien Education Council
included among its members the Directors General of Education from eadh-..45-
State, and carried authority which ensured, that its deliberations would
be carefully considered:
Government Aid to. NonGovernmeht Schools- ,
Similarly in non-government schools rising costs which were attributable
to demographic changes and greater per capita costs (Bourke, 1969) prompted '
Roman Catholic school.authorities to intensify their efforts to secure
financial assistance. The problems of Roman Catholic schools 'were increased.
because expanding requirements for staff had to be met (' by increasing the
proportion of non-religious staff in these schools (Bourke, 1969).! Parent
organizetiOns and the.church-.0-6-rarchy both argued strongly for the
introduction of government assistance to church schools. The argUments
were presented to Commonwealth and-State governments.. The desirability
of assisting non:-government schools became an important, olitical issue. e4At times the debate was bitter. It was alWays intense. However,"the
demand for aid came from some non.-Catholic schools also. Smart (1975: 76.
, . .
ft ted tle .changed,attittide of the Headmasters' Conference towards
8 The term 'bulge' .refers to the transient increase in the population of'successive age groupS of people-born after World War II. The 'trend'of students xemaining longer it school is a more lasting phenomonen...These terms are used,by Layard, King and Moser (1969).

N
rgovernment assistance. This association othd Headmasters 'Of prestigious
Independent t 'schools agreed, the late. fif los', to atteept to. persuade
'school coUncils of the'need for government assistance. Caution restrained
them toargue,only foirthp-accepttce of capita rants(thich would not
coMpromiSe their independence. - After thp payment staff salaries, the
next mOsi!expensive cost io.cSchoOls.was the piovision.of accommodation:,' 4
Science uaccommodation Was_particularly exp4hsivebecanse f6involved -
expensive pjuMbing; gas %fittings And electrical'work: Grants fnrbuildings .
were specifically mentioned by the Headmastegs'. Conference as atarea of
.special need (Smart, 1975: 77). On'betialf of RomanvathOlic schools "the
Afthbishop of Sydney had spe ifically mentioned assistance witn.science
. - buildings as one a.five p rrits 'presenied to 'the Premier of NeW Souih
.
.0. , .in,1962 (Smart, 1975:1.85).-Thus'demands for Commonwealth assistance to
\,
education we"e made on behalf of Government, Cathoric,*d Independent
The Special Plea for Science
-.1 The third of the medium term:influences which Smart (1975) saw.:as leadingr.
to the Science Facilities Program was a conglomer to of various arguments
which supported special assistance for silence t ailing. It now appears
Ipossible to rtcognize,this'third element of the lad as different from the
otherwO:': They were gener nests for Co onwealth assistance to
government and non - government schools respectively. As. such they were
'initiating'yfaCtoes throughwhich-the attention of the Commonwealth was
-p
drawn to the diffi5ulties in SchoolS. The plea for science was more
Specific, Herlc e thecase'for science aid was a 'formati;,e' factor which
guided the CoMMonyealth's response to the demands placed before it.
Pressure.forscience assistance was formative in'two ways, Firstly; it
influenced the decision to aid science teaching rather -than other facets
of'the.school curriculum: secondly the nature of the case helped shape
.w y innwhich aid to science was given. ,eFor these reasons it is
necessary ter,xaminethe case 'presented for aid to science in some detail.
Various elements were present in the special pleas for assistance to
science educatiOn. The pressures for special aid to science' teaching
have often been seen aS,exclusively concerned with the supply y of technical
manpower. The successful launclung by the Soviet Union of a satelfite. in,-(/
space was just one examplesof, a number of developments whic increased
9 Throughout this Report the term Independent, as first suggested by Gordon
(1957),-hasbeen'used to refer to non-catholic, non-government schools.
The'problems associated with its use are recognized but it is a convenient
'term.1 8
11 -11
'11 I
.aWarenes Of7the importancd Certainly a!numb` of
uOiceS ar ued in'terms('of theNnetd to increa e the available*.tee nological
ArDskill ,an manpower, Without an expanded scientific Orkforce, it was
T.argued, the. viability of'competitive mode n'industrrwas threated&d,
However, tile ratheTtmikt mated Ogument2based Upon the belief that)Opience.
wasa necesOry'constituent of a general edUcation cannot'be ignored.
*'ThiS'was recognizab1R, the bas'is Of sameargdMents for an.improlTement
Bo tit utilitarian and%1
liberal views of science education-Were sod to argue for improyjed
4conditions ..for school science- ,In.,1957 the Australian Academy of Scienee (1957) presentedda'report
on ,sciedtific and technical manpoy.dr-SapPly to the' Prime Minister. This
report expressed concern thiLaithgconomie devel ent of Australiawas,
being hindered by-a shortage of skill d manpoWer. In additAn4
ft-
in the. arrangemens made for teachillif4cienCe-!_:. 4
to proposing that this was a serious robleb the Academy attritutedmudh
of its 'cause to s'ellools and in plliticulerA the-4.hOrtage or,:7qualified
science teachers.*
The trouble beginS at the.setOndary4school where there is1- A'ap, insufficient encouragement for the student totake up. a
. .
scientific caress,. There is a grave shortage of competentandteacherS of si6nce nd mathematics'. this must be owercome
7 speedily if Australia's industrial stability-is not to be.;threatened. ..4 N-, .. -, .,
bb
. .: . :. (Australian.Academy of Science, 195,7:.3)
.,
In the very-month that the Academy of Science presented its report to the..
Prime-Minister another committee reported on its deliberations. The
Committee oktAustralian Universities" (1997). although not directly' concerned I'
'X \
with secondary schools; did place special stress on the need to
"-improve scientific'and technical education. In doing this, it reinforceds.. ..
the comments of the AcadeMY'ofScience about the supgly'of qualified
science teachers % either the Academywnor the Committee on university
edutation made any comment about science facilities in secondary schools.
Both of the reports. emphasized the.utilitarian view of science education:-
science was related.to the improvement of material coinfoit)
The endeavours of the Industrial Fund were a response to the problem;\
identified in these Reports. Modelled on the Industrial Fund,for the
Advancement of Science .in England (Merrillees, 1958), it Was founded in
1959. Its purpose was to Ilse the financial resources of industry to
°
revide assistance for ui ing school science laboiatories.
Bede clrieshof the were all non-goverhment4boys school§. This
was a policy gopied Arom that of the.Indust;ial. Fund the United Kiilgdo's
(Mei-PU60)-19SO. There s evidencetlav-theadministrators of the
Fund conSi4ered that these schools were the most likely oufte of
Pat4ntili1972Y. SchOolAsvere invited for
Assistance after they were_xat;ed on two triterid. A priority rating -
.
consideredthe extent to which hey, producddscience st.udents6ipLtert'ary
educati-6,kneeds 'rating a se'ssed the degree to which thelschool
f-tta labNatories ,satisfied the. standardssucified by.the Industrial Fund
(Smart,'1972). By 1g63 the-Fund haddispersed over .1600;000 in as4isting.
some 35 sch/oors (Smart, 1975) . All of these sthools were bOs schools,
all were ,members of the Healclitiasters2. Conference and all were schools
considered to prodtilt a large proportion of potential scehtlsts.: Few
Catholic schdols received assistance. Studies' by tin-ac.:it (1972, 1975) >d
TomlinSon'(1976) suggest that theOperatinn'ofthe.IridUstrial Fund was- an
1
important!'influenite'on thedecision-to announcea government
funded Science
-Facilities Program. It appears that it focussed attention on the comments
made by other bodies about the state of science teaching,'prmiided an
indication of a form of assistance which -could be made to schools, and
even suggested a method of opera -for tch a Program. Menzies.(1970:
95) 'acknowledgedthe-debt w1-15.eh the cony tion of the Science Facilities. .
$rogram .owed to the Industrial Fund. In Britain the IndustriilTund
had hoped that its .efforts would stimulate govermien.raction to provide.
better science'i.acilitiesin maintained schoolS.
Menzies indicated, in
Apeech at Scotch College inMelboune during early 1964., thhtlie was
aware of this avd did/not intend to neglect govOnment. schools.lg Smart
(.072, 1975) hasdemoristrte'dhaf many of the procedures used in theenon-
goirernMeni school'section of the,ScienceFacilities Program were similar
to those used by the Industrial' Fund. The notion c.fhpeeds' as the numb
Qf science rooms for science periods taught -was one aspett which continued:
In addition such aconnection with a Fund concerned with schools likely to
produce scientists,..mayhave.direcked the Science Facilities. Program
towards the needs ofschodi science in its early years: Thus the
Industrial Fund was a formative i fluence in two ways._ Firstly, its
existence directedatten,ion to the needs of science educatioh. Secondly,
its priorities and administrativeprocedurds shaped those which were
followed by the Science Facilities Program.
Interview with Professor 12.11t1by Smith, 10 February 1977.
20

The Australian Science Teachers AsSociatiOn (ASTA) drew its members
from a wider spettruM of Schools than those assisted by the Industrial .
. .
Fund. Many of its members came from non-gOvernment schobis which; did not\ '
'belong to the Headthasters' Conference. Others were science teachers in..
goyernme t Schools. Asan organization it was helped by a number of. . .
commercial firms (Richards, 1957) and if had suggested ways in vhich
industry could assist scipnee teaching_(Berpdt, 1957). The first article\ -.--\..
inthe first issue of its journal (ASTA, 1955) drew attention to the
shortage of trained scientists' in Australia as did the leading article in
its second issue (Richardson, 1955). One session .of the sixth conference.,
...
of ASTA,Was devoted.to the role of the science teacher in expanding. technical
and scientific manpower." The chairman.(Olsen;'1956: 19) not only asserted,
that d6cisions against scientific careers were made in science classrooms
but also recognizedthe non-vocatiOal.role of\ sciende teaching. The
point was admirably amplified by Schonell.
Th& secondary Schodis are prime educators in science for itsown sake and no claims of technology must ever,be allowed tbdistort their educating mission; but more important, perhaps,they must teach those who are not to be scientists ... to thinkabout science,-o appraise its results, nd recognize itslimitations. (Schonell, 1956:21).
Contribu ing papers (Kevin,-1956; .Merrilees, 19.56; Pfitzner,' 1956). .
expressed the same important point.: science teaching had dual responsibilities
and one ould not be subordinate to the other. Pfitzner (196) widened the
deb to include a criticism of the simplistic notion of manpower planning
which, he-said,. ignored both detailed consideration of the demand for mahpower
'and-the multipurpoSe nature of society. Science teachers were cai4oned by
Pfitzner 0956) against becoming too zealous in encouraging. able students
to scientific careers. Science-teachers continued t0 express their
responsibility to those who did not become scientists in debates about science
curricula (Anders, 1959;, Hughes, -1963;. Keeves, '059). A statement agreed
upon by the members of the eleventh conference of ASTA 1l962) detailed the
changes and derlopment in pupils which it was hoped to.foster through
science teaching. It clearly assumed that.s94ence was to btregarded as
a component of general education rather than a specific'vocational prepara-
tion. Hence in the view of members of ASTA the liberal education purposes
of science teaching were important. In addition to this extra perspective
on the problems of teaching science ASTA members were aware of the need for
Commonwealth funding. Merrilees (1956) as President of the. Science Teachers
Association of Weern Australia argued that because theamounts. involved
21

10.
\
,,were beyond-the resources d( StategOve141iiients Commonwealth assistance
should be sought. He aritIga;4Ilat,4STA'STioUld press for greate funding7'4.
of education in generale:0d science del4gOon in particular. In its
campaign to improve the provi6ion ler Setence 6ducation in 1964; ASIA
prepaied,a statement of the' needs' of science duction (ASIA, 1964)It.'
As this document provides a succinct statement of conditions for science
teaching it will be considered later in this chapter. ASTA was thus
involved in argumen;s'about the future of "science teaching. It, recognized
that additional-funds would need to be, provided by the Commonwealth_"
government, it argued that science teaching nteded'additiOnal assistance'
and its members argued for a liberal view of science eduCation which .
. .
'leavened the prey- occupation of other groups with utilitarian purposes off
,
science teaching.
-'In New South Wales the Secondary Teachers' Association .and the. New
South Wales Teachers' Federation jointly sponsored asNew Deal fOr School
Science Conference in November 1961 (Cull, 1962). 'It was followed by
a School Science convention the next year (New South Wales Teachers'
Federation, 196-2). These conferences were significant in several Ways.
They involved collaboration :between a general teachers union and science
teachers.. The support of non scientists was obtained. Parents'.and
teachers' organizations, trades-unions, professional associatibns.and
academics all supported the conferences (New South Wales Teachers'
Federation, 1961 a). The conference in 1961 had the support. of the Director
General of Education (Cull, 1962). Yet the most important as of.the
ConFerence. was the political acumen with which it was organized and through
which it sought to have its-deliberations implemented. State and
Commonwealth members of parliament were invitedo attend the conference.
Subsequently a deputation presented the decisions of the conference to the
Premier. -All delegates were asked to secure the support of their organiza-
tionsfor the conference decisions and to write to the Premier. The
problems of science teaching and the conference-decisions continued to be
publicized through an illustrated paMphlet (New-South WaPesifeachers
Federation, 1962):
.Several main resorutions were carried by the. conference. They-were
addressed to the recruitment and training of science. teachers, the
conditions.of rooms and equipment, the problems of class,size and t e laCk
of laboratory assistants, the need to revise the junior s ience syllabus,
'22

and the necesgity for Federal financial assistance to primary and secondary
4i.eduCtion (New South Wales Teachers' Tederation, 1961 d).
- Broader purposes than the creation and development of technical
manpower were envisaged by most participants in the .conference. The_ -
mimeographed letter sent to potential participant's stated :
you zre in a better position than most people to appreCiatethe importance of .a sound training in science as part of. abalanced secondary'education.
(New South Wales Teachers' Fedei-ation, 1961 b)
In its preamble the conferente papers stressed the same theme.. One
background paper (Cull, 1961) placed the role of science education in
national development in .a different perspective. °I-laving acknowledged
the need for a country to develop its scientific Potential.,it elaborated
that this meant that all, concerned with the application. a-scientific
knowledge
from the highest policy makeis to the man in the. street.,e Owhospinions and whose voice must influenceoolity decisions,.
should have some ekperience'in and understand the background,of scientific work.
' (Cull, 1961:.3)
Only schools, he argued, could provide the necessary background im.science,
and only if they were/iveh better conditions.--
It has been noted already that the first political group to propose
a science facilities program was the New South Wales branch of the .
Australian Labor Party at its. June, 1963 conference. This form of
assistance had been requested from the State government by the Roman
Catholic Archbishop of Sydney (Gill, 1965). It was reqUeSted as one of
five points in that submission. That it was given precedence above the
other four requests sugtsts that the New Deal for. School Science Conference
may have exerted some influence.. In addition to the more general publicity
and pressure group activity which resulted, some conference participants
were in especially influential positions. Trades Unions were :involved
in the conference as were a number of leading political figures in the
Australian. Labor Party.
Hence in the period before 1963 the two aspects of the special plea,
for science assistance were interwoven: The utilitarian view of science
education saw it as a contribution to industrial development. The
liberal view argued for-the place of science in a general education. In

12..
.
the a4guments-prg_sInt.pd by various interest groups* each was detectable.
The firgt was predominant (n the, work of the Industrial Fund, the.
second in the activity of science teacherS and general' education
`groups., Both of these views ledto a desire to improve science teaching:
ch- interest grauP.drew attention tosimilar problems in science t aching..
Wheh MenzieS introduced thp States Grant's (Science Laboratories a
Technical Training) Act 1964 he wassognizan'of both points of view.
There are two ends to be served. The first is to raise
the general level of education in t society which is
becoming increasingly dependent on the scientific use of
resources. The second is the special education necessary
for those young people who are to take up scientitic'and
itethncal careers of sorts,' and who must come forward
in increasing numbers, and must have an ever deeper under-.
gtanding of science both theoretical and applied,
(Menzies, CPD 196k:
The. Needs of Science 'Education")
Facilities for Science Teaching
The claim that science education required -assistance is Supported I)))
evidence which was availgble.at the time and also by evidence which has
since become available. A study was conducted. by the ACER of the provision
for science teaching in non -government schools.,in 1958 (ACER,,1958).This
coiniCed with the :time when consideration was being given'to establishing
the Industrial Fund. Its two main conclusions were at funds were needed
on an 'extensive scale-and that maximum benefit woulik have resulted if thg
funds were concentrated on girls schools. The first conclusion was based'.
. on the cost of proViding suitable accalmodation and modern equipment in
all non-doverntent'schools.The second was based .upon an analysis of data
which showed that only nine percent of the girls in the third last year of
school studied science courses in their final. year. The corresponding
figure for boy was 31 percent.
The Industrial Fund.did not act on this second conclusion. (Its members
preferred to concentrate their resources on slals which were'traditional
sources of'science specialists. Seven years later a report requested by
ASTA suggested that the facilities for teaching physical science in girl'
schools were still poor (Carter, 1965), The report conceded some recent
improvement in such schools'but raised'-other problems. Discrimination in
scientific employment, the influerice of occupational stereotypes-, the fact
24

13.
Table 1.1 Percentage of Science Rooms Not Considered to be Satisfactory
in 196149
State
-RoomiHWithoui%Lab. Benches Unsatisfactory Rooms
used in Practical Work
. 6overnment Non-Government Government Non-GovernMent
,New South Wa"nsr 42 24
14ctoriak
19 24 86 61
Queensland 33 (" 12 86 71
Sou-INAu4leralia '16 _24 53- 49
Western'Avstralia \43 14 93. 74
Tasmania 21 '21 57
Australia '29 24 63
Source/ Keeves (1966)
that donations from parent groups tended to. favour' domestic arts and they
Jack of. female science teachers were mentioned as possible factors
discouraging girls from pursuing scientific careers.
In 1961 ASTA cpnducted a survey of. the conditions for science education
in schools throughout' Australic0Keeves, 1966). As only 45 percent
of the questionnaires, sent to every secondary School in Australia,
were returned there was the possibility'of bias,in the results. The.
response was 51 percent for Government schools, 29 percebt for Catholic.
: schools; and 51 percent for. Independent schools. ThoUgh the results
.quoted underestimate the contribution of Catholic Schools,the picture.
they revealed was alarming. One quarter of the rooks used principally for
teaching science were equipped with only desks The'greater
detail Trovided in Table 1.1 is an indicationthat variatiopg existed
between States in this regard. Schools in New South Wales and Western
.Australia appear to have been particularly poorly provided. The Ta4le also
-records theTercentage.of those rqoms used for practical work which
satisfied certain criteria.II
It appears that government schools had
11 These standards were as follows: ,
(a) Bench space: 2.5 feet per student.(b) Taps andcsinks: 2 per room in.Biology and Physics and
1 per 4 students in Chemistry and Science.(c) Gas. outletS: leper 2 students.(d) Power points: 1 pe 2 students in Physics and Biology
and 2 per room in Chemistry an Science.(e) ' Fume cupboards: 1 per room in Che try.
1

Table 1.2. Science Staff in Secondary Schoois, in 1961
A
Laboratory Assistantsper school
'Government Non-GovernmCnt
4
.0New Southyyales
-eVictoria
Queensland
South Australia
Western Australia-
Tasmania-. ...
A...,i
Australia
°
-
0.07
f.
0.25
-
0.22
0.07.
Percentage of ScienceMachers without Tertiary.
': Science Qualifications(Ail Schools)
'.49.0.5',, :
0.18. 32
0.03. 36
0.05 , '. .40
.0.6697
0.17/ 31
. 0.lt'-- 37,
Source: KO .eve (1966)
poorer'science rooms than schools, and that there were .lion -government
differences between States: fdi example Tasmania and South Australia seemed
better prOvided thanQueensland. Other evidence (Keeves, 1966) suggests that
girls schools were not as well provided with science facil.ities'as boys schools.
In addition to there being many,.science rooms which were poorlyequipped, there .
were very few schools which had any laboratory assistants. Table 1.2 records
the numbers of laboratory assistants in schools in 1961. Science teachers
considered the apparatus available to be, rather better that:the science rooms
Eighty percent of schools considered the expendable : apparatus which they.'
possessed as either sufficient or involving onlyminot:. shortages.-.The same
comment was made by 82. percent of schools about their minor13
apparatus but-.
only 69 percent regarded-the supply of majo apparatus as adequate.
The survey. also collected information bout the qualifications of scieace
teachers.. It found that 30 percent had no qualifi ions in,science'.
or. related fields. There.waS some variation between s a can be seen.in
Table 1.2 but abreakdoWn by school .system was not reported. Unfortunately
the different rate of response from each school system would 1 ve dist-orted
the aggregate figures. :
r12 Expendable apparatus referred to items such as test tubes'; beakers .
and stock reagents. t-::, .
. _. :
13 Minor apparatus referred to-items such as-bun-sen burnedors,-,stands and
magnets.
.
14 Major apparatus referred to items such as balances, electridal meters
and microscopes. . : . .
2 6

0
15.
Table 1.3 Percentage of Science Classes-Held in 'Satisfactory' Laboratories
in 1964
, Non-GovernmentState
CatholicNan-Government
Independent
New South Wales 20 56
Victoria 24 45
Queensland 76 . 20
South Australia 27 19
Western Australia 26 '" 53
Tasmania ,0 /.
56
Mean (All Non-GoVernment schoOls) 33
Sou : Commonwealth Department'of Education File Number 68/52 (101)
Other informatiOn confirms the view that school science was being taught
under-poorconditions. One bf the.first actions taken by the Commonwealtho
governMent,, when administering the Science Facilities Program, was to obtain
data abOut the science facilities available in non-government .schools.
Information was obtained from,a'questionnaire sent to all non-goveinment.°3
schools. From this it was estimated that Only 33'percent of science lessons
in theseschOols were held in satisfittor'y rooms (CDE, File:68/52 (100)15. It
can be seen in Table 1.3 that difference$ sted between States and school
systems. Rorilan CathblicSthools weregekerally less able to accommodate
their science classes in science rooms than were other min-government
schools.. Comparabl'e figures for government schoblS' existed, only for
Western Australia. In.thai State, in 1964, 32 percent of sci nce eriods
in Senior High Schools, and.28.percent of science periods in,Hig hools;
were not held in science rooms. (
Science Curricula
The needsHoCScience education at this time were not confinedtoorooms and.
apparatus'. .' ASTA,prepared a comprehensive statement of needs for the.
council of the AUstralian and New, Zealand Association for the Advancement
of Science (ANZAAS) in January 1964 (ASTA,A964). statement'argued
that needs other than rooms and equipment should be considered. While it
acknOwledged the need for functional labdratori'eS and,sufficient:simple
apparatus, it asserted that there Was' 'danger,in concentrating efforts
on one aspect of the problem. Providing. laboratories alone,wou144be,
unlikely ta provide an effective answer to the problems, of science education..
15 This notation has been used to,refer to files held by theyCommonwealth Department of Education. :
27
CDE, File '64/1006) .

16.
Like the New Deal for Science conference it drew attention to the need
to develop new courses, and to improve-the expertise of science teachers:
It also argued that adequate numbers of ancillary staff would be needed
for facilities to be fully utilized: ASTA concluded that the problems
of science education should be stu by a Federal organization.
Consequently it ..recommended the establishment of an independent Australian
Science Education Foundation (Stanhope', 1964).. .
It was intended that the Foundation would be involved in the
development of courses, the design of aPparatus'and rooms, and -even giving
advice on how best to spend -the annual science grantof $5 million: The
sugges on was supported by the ANZAAS Council (Stanhope, 1964). ASTA
sought support for the establishment of the proposed Foundation from the
.
Commonwealtfi government, the Industriai Fund and the Australian Academy4
of Science (ASTA, undated). Its formation was often discussed in the
ASTA Journal (Bassett, 1965; Tisher, 1965; Yaxley, 1964), and in 1967,
the Federal Council(ASTA, 1967) reasserted the need to establish
n ional foundation concerned with curriculum development in science.
he foundation was never formed Eventually the Commonwealth goyernment
provided substantial assistance ili}rough the Australian Council for
Educational Research for-an Australian Science Education 'Project to produce
curriculum materials (Owen, 1977). e
The desire to revise science curricula was evident at the time the
SCience Facilities-Program-commenced.' Tt was another facet of the general
concern with'the %tate of scierWe.education.One issue was whether science
in the lower secondaryschool ought to be taught as a combined or integrated
Study rather than as a 5tt of separate disciplines (Anders, 1959; Keeves,
1959; Stanhope, 1959). At that time General Science was pn,ly firmly ,
established as a subject for most juniorsecondary-students in Victoria
.'and Tasmania (Stanhope, 1961). Science is now taught as a single subject
to most students in ythrs 7 to 10 throughout Australia (Shepherd, 1970)..
-Other Aspects of lower secondary school science.also received .
"attention. Content was considered dated and poorly organized with the
result that major principles were not clearly developed (Stanhope, 1965).
The Science course introduced in New South Wales as part of the Wyndham
Scheme in 1962 was an early response to'curriculum problems. It
emphasized the need to make science more modern and better organized around
'big ideas' (Barker, 1963). An important feature of the course was a

17.
comprehensive textbook (Messel et al, 1964). Claiming to be integrated,
but in practice treating each science discipline separately, this book was
a compendium of the information around which the course was structured.
While the role of experiments in this course was greater than previously
had been the case, it was not as important as in other new courses.
A changed approach to teaching sciencewas manifest in another
development Which began at a similar. time. In October 1963 the Science..
Standing Committee of the Victorian Universities and Schools Examinatjon.
Board (VUSEB)convened a conference on lower secondafy school science
(VUSEB, 1963). At this conference the invited participants considered
,overseas developments in science curricula, principles' which.ought te.be
followed, and action to follow the conference. ,Specific comment was
made that a concentration on revising contenand preparing text books
would not be sufficient: considei4tion.needed to be given to appropriate
methods of teaching science. As a-result of this conference a series of
changes were made to the lower school .scierice syllabus from 1966 onwards
(VUSEB, 1966: 320). More importantly in 1966 the Junior Secondary
Science Project V8SP) commenced.(Dale, 1966): Through this project
curriculum materials for use in the new science syllabuses were developed.
Ramsey (1972) claims that limited financial resources restricted the scope
of JSSP. However by 1969 a number of units for use in years 7 and 8 had
been developed. Moreover it was of special significance in the development
of'science education.. Is origin's Zoincided with the commencement of
the Science Facilities Program, its direction focussed attention upon
matters other than content, and it was 4:101rect precursor to .the 'Australian
Science Education Project (ASP) (Ramsey, 1972). Subsequently. ether
curriculum materials developed reflected some of the approach adopted in
JSSP. (Western Australia, 1972).
Senior science curricula also changed during the sixties. Stanhope
(1967). considered that, there were four. different approaches to curriculum
change in Australian senior science Courses.'
1.: The traditional method of eclectic additions to and deletions from
the content of an existing course.
2. The adoption of a course developed in another country, usually the
United States; as occurred with PSSC.Physics in Victoria and CHEM.
STUDY CheMistry. in Queensland, Tasmania, and Western Australia:
29

18.
3. The adaptation and modification of an overseas course as was done
in producing an Australian adaptation of the'BSCS Biology materials.
..
4, The local development f new.courses, albeit-with-Some overseas
influence, as. in the ctOrian ''structural view' Chemistry and
'New South Wales Senio Science courses.. .
'Several of these innovations resulted from,decisions taken in the period.
during which the Science Facilities' Program was introduced.
In November 1963, the Biology Standing Committee of the Schools Board
of Victoria esthblished a committee to evaluate the BSCS Biology programs
(Morgan,-1963).- Pilot programs were conducted in some.Victorian schools
in 1964 and as a result it was decided to adapt the BSCS'materials for use
in Victoria (Morgan, 1964). A parallel development occurred in South
Australia.where some BSCS text materials were used (Best, 1967).. Consequently
that State became-involved in the Victorian trials and adaptation procedures'
(Morgan, 1964). Adaptation, rather than adoption, was decided on because.
the original United States materials had been built around American
organisms and designed for a different position in the School program.
Extensiye changes were made to content but not to approach. The course
stressed the teaching of Biology.asenquiry (Schwab, 1962). It involved
an approach in which each topic began with observations, where statements
of.uncertainty featured; and when" laboratory work was intended to be
?investigdiOry, special attention being given to training in scientific r
thinking (Morgan, 1967: 7). After an extensive trial in Victorian schools
in 1966 the BSCS materials were produced under the sponsorship of the
Australian Academy of Science (Stanhope, 1967). They.were.introduced in
Victoria and South Australia in 1967 and subsequently in every Australian
State (Morgan, 1970).
It was alSo in 1963 that the Physics Standing Committee of .the Schools
Board of Victoria decided to adopt the PSSC Physics materials. Since this
involved .direct adoption with minormodifications the time delay before
the materials were introduced was shorter:. schools were using them in Year. r
11 in 1965. It should be noted however that thiS was nine years after the
PSSC project had begun in the USA (Lee Dow, 1971).. The PSSC Materials were
subsequently used in Queensland schools in 1969 and strongly influenced
the Western Australian Physics course which started in 1968 (Stanhope,
1967); The other widely adopted overseas course was _CHEM STUDY.' It arose
a little later being tried in Wettern Australia in 1966 prior to its

19:
use from 1968 onward. Queensland tried. the material in 1966 (Dettrick,
1966) and introduced it in,1967 (Stanhope,41967)..
The Victorian Year 12 Chemistry course whibh was first taught. in
+' 1966 resulted from a project begun in 1963 (Lee DoW, 1971). This differed
from the BSCS adaptation and the PSSC and CHEM STUDY adoption in that it was
Tentirely locally developed. Cognizance wastaken of overseas courses,_'
particularly the American Chemical Bond Approach maerial, but'i,t was
essentially locally del5red. for local circumstances. It also differed
froM the previously mentionedcourses in not emphasizing a partidAr
approach to teaching. It was essentially a complete restructuring and
revising of content. The group who wrote the material said that,they:
unanimously endorsed the principle that there is no one wayto teach Chemistry well., (Heffernan et al, 1964: 5)
The other loCally developed curriculum to. originate in this period
was the senior Science course in New South Wales. As part of the Wyndham
.1..;scheme which began in 962 this course,was first taught to Year 11 in 1966.
Like the lower seconda school science course it was offered at four levels,
level 3 providing a senio-r science course for non-specialists. Unlike. .
the senior science courses in other States it.encompassed all the major
science disciplines within the one course (Stanhope, 1967). It was
organized around an encyclopaedic textboOk (Messel et al, 1966) and-became
a centre of controversy in New South Wales (Lee Dow, 1971: 59)- In a
similar fashion to the Victorian Chemistry courseit did not emphasize
teaching science as enquiry to the extent of the overseas adoptions or
adaptations. It appears that the limited funds available for curriculum
development in Australi at this time restricted the possibility of developing4
that type of course. Hence, the chclice was between adopting an overseas
Course which was enquiry based or locally developing a course which was not.
The thorough adaptation of BSCS was possible through the financial
support of the Australian Academy. of Science. Until the adVent of ASEP
little Commonwealth government support was available far curriculum
development in science. Stanhope concluded that:
greatprbenefit would accrue to science teachingin Australiaif some of the $10 million provided annually by the Federal'
. government wholly for material facilities were diverted to-financing curriculum development by (such) modern.methods.(Sfanhope,.1967:.13)
31

A Matter ofChoice
, . 20.
It is aparent thq the needs of science education in the early sixties
were rather more extensive than 'a lack of adequate Material facilities.
There was a shortage of.qualified teachers, a lack of laboratory assistance
and'a need to develop new curricula. These defici cies in science
education were interrelated; by breaking the cycl at one point it was
hoped to stimulate action in other. areas16
.Certainly it had been
suggested that what schools could offer was limited by the facilities
available. Removing this one barrier, it was hoped, would be tantamount
to removing a limiting step in the improvement of science education.
More importantly perhaps, the provision. of material facilities was more
amenable to Commonwealth government action. Such an action would partly
satisfy the demands for general Commonwealth. assistance to governmentand
non-government schools. It also ensured that such assistance would be
immediate and visible. The delay between-starting a curriculum project
and imhementing it in schools would have been several years. Even when
introduced it would not have been 'such a visible contribution as.suites
of.science rooms. The complexities in the issue of science teacher supply
were even greater. This problem depended upon the general teaching salary
scales. and the availability of scientifically trained people. It was
therefore beyond the reach of immediate Commonwealth action. At the time
the Science'FdcilitiesProgramwas introduced the Commonwealth government
was constrained by tradition from a direct involvement in primary a
secondary education. The provision of material facilities was
way to commence..
f
.Notwithstanding this caveat the view taken in this report is that
Which was expressed by the Commonwealth'sAdvisoryCommittee on Standards
for Science Facilities in SeCondary Schools (1976).17
This was that the
Program would -have been more effective had 6eater attention been given
to such matters as ancillary staff, in-service education, and curriculum
. .
revision. That these needs were ignored probably limited the potential
impact. of the Program on science teaching.
16 Interview with Professor R. Selby Smith, 18 May'1976.
17 Where this Committee is subsequently mentioned a'short title will
be used: The Commonwealth Standards Committee.
32
CHAPTER TWO
EVALUATING THE SCIENCE FACILITIES PROGRAM_
A Framework for the Evaluation
The Science Facilities Program differed from many educational initiatives
taken by the Commonwealth Government during the sixties and:seventies. It
was not based upon recommendations made in a report totheGovernmenv.-.*As
a, result it began operating with neither data which would have indicated
areas of need, nor an investigation which would have clarified' objectives.
-The necessary data and.the explication of objectives came as the Program
progressed. Writing generally of social programs Maling-Keepes(1978).'dentified
as one characteristic a 'planning stage' which involved some assessment of
the basis of, the program in terms of needs it would attempt to meet, likely
attitudes and other resources of'clients, and the developcent of knowledge
required for subsequent planning. In the Science Facilities. thisti
stage was rather truncated so that the objectives of the scheme Were not
clear at the hoginning. -Clarification of the goals ofithe Program was there-
fore an important prelude to the evaluation. Guidance came from statements
of intention and expectation made by those involved with-the Program and also
from a consideration of criticisms which were made.
General Statements of Intention
Chapter One explored the multifarious influences which led to and shaped the
Science Facilities Program. Why of these infldences were only marginally
related to science education. Even'among those which were directly concerned .
with science. teaching no single cause could be identified. As a conseqience
no unique purpose was clear. Through the provision of funds it was hoped
that a range of benefits would <f.low to science education.. Certainly.a
ary purpose was to improve the quality and abundance of science teaching
facilities. .However.this primary purpose was usually seen as an intermediate'
step in the quest of other go-t1S. Unfortunately the definitions of somecof
these subsequent goals are more elusive.
, -
'Among-the statements of Commonwealth Ministers of Education and the:.
Department of Education were references to the e-proCess of science educatiOn
and to the outcomes of science education. Often one or the other were
21 .

'22- 7assumed -to be the result of improved facilities and sometimes it was made
explicit that the outcomes and the process were related in sequence to the
provision :of facilities. .Rowever the terms which were used to describe
anticipated or alleged results of the Program were often-global and rarely
elaborated. In addition, because the Program operated for some twelve years,
.
differences in terminology and even in aims resulted from changing circum-
stances. For these reasons it is hard to discern precise goals for the
Program.
In November 1975 the Commonwealth Department of Education prepared a
resume of its activities for the new Minister. Of the Science. Facilities
Program it said that it had
begun in 1964 in order to improve the quality of
science education in Australian secondary schools
-through the provision of adequate science facili-
ties.SCDE, File 1972/1547.)
Of necessity the resume was terse.. Yet in indicating. that the provision of
.
facilities was seen as a,means of improving the quality of science education r
it was rather similar '& a°Ministerial statement in 1971.
The expenditure of these funds has improved markedly
the quality of science teaching facilities available
to students and,haS,.without.dgmbt, contributed to
the iimprOvement in the quality of teaching of science
subejects. (Fairbairn, CPD 1971 ; 2665)
When the scheme began in the sixties similar intentions were expressdd in
different terminology. In introducing the States Grants.(Sciende Laborator-
ies la Technical Training) Bill 0464.Menzio6 indicated his expectations.
I believe tha,t. the new grapts are going.to have a
stimulating:effect:on, the teaching of science in
schools throughout the country. Emphasis on the
significance of this is hardly necessary.(Menzies, CPD 1964 1639)
SiMilarly the firSt Minister responsible for Commonwealth activities in
education wrote that good facilities at. the disposal of good teachers would
enhance'effective teaching.
34

23'.
The effective teaching of any.subject is primarilydependenton the existence of knowledgeable andinspiring teachers. But in the case of science,the skill of the teacher is greatly enhanced by theexistence of modern laboratories adequatelyequipped with apparatus. (Gorton, 1966 : 1)
'41)
The replacement of the term 'effeci.l.f teaching' by .the. more vague 'quality .
of education'-woUld appear to reflect a change-over time. In part the change
has been one of fashion in educatiON terminology, but it also reflelts -a
change in science teaching and science curricula. The change was in the
direction of.less reliance upon the teacher as an overt instructor. However.
.both terms are abstr se The operational definitions of these terms was left.
.
to the professional hsultants who were members of the Commonwealth Standards
.Committee. PolitiCians were usually satisfied to extend the terms by suggesting,
relationships with subsequent objectives.
One example of an extension of these expectations to alleged or'antici-,
pated outcomes was contained in the continuation of Fairbairn's remarks which-..
were quoted previously.
As a result, young people are better prepared inscience than would otherwise have beeh the case.
.(Fairbairn, CPD 1971. : 2665)
UnforfUnately this extension was not sufficiently specific to clarify the
alleged benefits of the PrograM. Neither the way in which young people 'were.
'better prepared' nor the purpose for which they were 'bettet pi-eiYared' was
explained. Menzies was a little more specific when he reflected on the Science
a
Facilities, Program.
Each provision was, of-course, directed to theneed for improved science teaching in the gecon-dary schools, a need which had bedn made quiteclear by the too-high failure rate in first yearat the universities, and to the urgent need, ina growing'technological age for the encouragementand improvement of technicial training.
(Menzies, 1970 : 94)
Improved science teaching thus would be recognizable by fruits. When
introducing the States Giants (Science Laboratories and Technical Training)
.Bill 1964 he extended his remarks about stimulating teaching outcomes.
The two purposes mentioned in the quotation .in Chapter One were a wider
1 See page 12
3:75

24.
understanding of science in the general community and a deeper understanding
among an increased number Of science specialists (Menzies, CPD 1964 : 1640).
Gorton echoed these sentiments.
For the individual, a good general educati9n
cannot be complete without some knowledge both
of science_and of thehumanities and, 'for a
Modern'nation, the efficient development of its
industries and utilization of its resources
.cannot take place without.there being a increas-
ing number of people with a special knowledge'of
science (Gorton, 1966 : 1).
Intended outcomes-of. theProgram were not always expressed in relation
to the process of science education. When introducing the States Grants
(Science Laboratories) Bill 1968 the Ministerclaimed support for the pro-
vision 'because of the social utilitarianbenefits which could accrue from a
concentration upon the production of skilled science specialists.
These grants for the construction and equipping
of science-laboratoriesrepresent' one part of
what can be regarddd as an overall government
prograMme to upgrade scientific skills in
Australia. The governMent recognizes'that if
Australia is to develop as we wish and if weare
to make the greatest use of our own resources we
need a greater number of well trained scientists
and technologists.If we are to maintain and improve our position in
the moderfl scientific age it is clear that the
government must give attention to the standards'
of training ...It was cicaf that students entering universities
would not be able to make themaximum use of the
increased facilities being provided unless adequate
facilities were-providedfor their training at .
school.
Three Levels of Impact
(Fraser, CPD 1968 : 515).
There appear to 1-e, implicit in these statements, three levels at which the
Science Facilities Program was expected to have an impact on schools. The
first level of, impact was the most direct.: science teaching facilities would
be more abundant and of better quality. This raises questions concerning the
perceptions of the recipients as.to the quality of.the facilities provided
and whether at the conclusion of the Program schools had adequate provision.
It also raises-questions as to the relative abundance of facilities in differ
.
ent types of schools, and of the access of students in schools.to those
facilities. .
3

,Provision of
Funds
Retention of
Qualified
Teachers
Availability
and Quality of
Facilities
2
Science
Teaching
Processes
Student
Attitudes
0
Student
Achievement
Figure 2.1 Expectations of the.Australian Science FacilitieS. Program
The second level of,
intended impact was upon the science teaching pro-:
cess. Better facilities were"expected to affeCt the qUality of science,1
education. No attempt was made by the politicians responsible for the pro-
gram to elaborate the meaning of that global term. Statements of what the
,new,buildings and apparatus were intended to facilitate were left to the
professional consultants of the Commonwealth Standards Committee and the
State Education Departments.
Thirdly, it was-hoOed that the provision of better facilities would re-
sult In changes in several outcomes of science education on secondary school
students,. Often these were expressed in terms of a' utilitarian view of
science education. It was hoped that more students would pursue scientific
careers, more would becomeinqtested in science and that the level of skill
and 'understanding in science would be enhanced. Sometimes the liberal view
of science education was invoked. It was hoped to quicken the interest in,
and widen the understanding of science among non-specialists. Especially at
this third level the expectations were wide and often given varied emphasis.
It was not a single purpose Program at all. TheArarious expectations of the
Science Facilities. Program have been represented in Figure 2.1.
37

26.
L
Griticisms of the Science.Facilities Pro ram
The expect ions of those responsible.fcommitted to the Science
Facilities rogram provide part of yle fra ework for this evaluation. Comments
made by critics of the Program are also important for they balanced some of
the grand expectations and even suA4542.ther important.issues. Particularly
in its early stage the Science Facilities Program attracted considerable.
A
public comment. As suggested in Chapter One, much of the debate about the
Program concerned Federal-State and Church-State relations. The issues which
most directly concern thejrogram as a science program can be grouped in three
:I
categories; equity., authority and effectiveness.
Equity. in the provision to government and non-government schools, became
a controversial issue, after 1966. In !he election of that y i^ a` n undertaking
was given to alter the ratio of the allocations to government an&non-
government schools .(Holt, 1966 : 7); Until.then the total sum had been
partitioned in proportionto-the,school poRulation in each system: From July
1967 onward. the per capita allocation to non-government schools was^tO be .
double that for government schools. It was a point which drew frequent .
comment from the Opposition. Consid r, as an example, the debate in 1971
when the Opposition moved that the Bill be withdrawn and redrafted so that
the per capita grants for government, and non-government schools were identical.
When the States Grants. (Science Laboratories).Bill
was introduced originally, the formula used was
based'on the enrolment in secondary schools -
roughly on the ratio of 3 to 1. After the first
triennium the amount going to private schools was
doubled, so that it has been in the 'ratio of 3 to
2. This Bill provides .fbrA26m for State Schools.
and $17m for private schools over the 4 years.
The previous ratios, when expressed as a per capita
amount per pupil, show what has.happened. The
science grants foe'Stateschools represented $10.58
per pupil. For Catholic schools it was-$23.16 per
pupil. For the other private schools it was $24.08.
No matter where one turns, the accusation is being
made against the Government that what it is doing'in
educatibn favours the affluent.(Beazley, CPD 197.1 : 2814)'
The rejoinder from the government to this accusation of unfairness was
twofold. .It drew attention to other -schemes'of Commonwealth assistance to
the States such as that for\ technical training and.it argued that States
were expected to provide science facilities fer government schools from
other resources.

27.
There -is noeparticular reason why.funds being madeavailable to schOols for a particular purposeshould be broken up in the same way between the-two categories of schools, government and indepen-dent, because it is relevant to bear in mind thatgovernmentschoOls are financed almost entirely bygovprnMent funds from the States, a significantproportion of which comes indirectly from theCommonwealth. .
(Fraser, CPD 1968: 988)
-Opposition spokesmen (heazley, CPD 1971: 2815) regarded the inclugion of
technical training grants as spurious becausethey were largely applied to
poSt secondary. further educAdon. As such the facilities provided were
used by former students of government and non.government schools alike. The.
,capacity of. the States to -use general revenue to provide science facilities
in addition to those unded by the Science Faciiies Program was a more a. .complex isSue:
.
As mentioned in several debates the relative 'needs, of
various, school systems were unknoWn. Some argued that. the initial need
was greater among government schools .(Cairns, J., CPD 19.68: 974) while others
.seemed to imply that non-governMentschools had been equally 'or more poorly
provided with science facilities when the Program began (Cairns; K., CPD 1968:
984). In relation to this?. issue of equity it is importants-
to determine the -
extent to which schools in various States and systems have been brought to a
satisfactory level'of provision..
The second, area of criticism concerned the authority for determining
priorities in educational spending. Smart (1975) produced evidence that
some State governments and. State Education Departments regarded the Science
Facilities Program as having placed.C6nstraints on their scope for deter=
mining educational policies. They argued that they were better placed than
the Commonwealth to be aware of particular educational needs. SoMetimes it
was suggested that the conditions imposed by the.Commonwealth reflected too
much the requirements of administrative efficiency. This raises questions
about Programs intended to meet a perceived national need which ar -admin-
'istered through a variety of agencies. The extent to which poliCy va 'es,
in spite of general guidelines, would appear to reflect differences in
.cpntext in which those authorities operated. The issue also raises the
question.of school authority. Priorities for educational spending within
a school may not be congruent with those which are deemed part of a Program
tomeet a national need.
*, 9

28.
Criticism was also directed at. the effectivianess of theScience.,
Facilities Progrp.----It was argued that concentrating upbcapital resources
.was not the most effective way to improve science education. Some Comments:,.
.
about the need for CurriculUm development and increasedecruitment of
qualified teachers2-were made in Chapter One. These.were matters of public
comment as. evidentiri a Parliamentary debate in 1971.
I shave pointed outfrequently in this House how
the Government'introducedgrants to schools for
science blocks without giving the slightest con-
sideetion to ways of providing teachers and
supporting- laboratory staff'for these laboratories.
I have said that in many instances science,laboratdries
provided under the legislation are mot staffed'by
competently trained science teachers, nor,are they,
adequately equipped or serviced - -by trained laborathry
staff. (Barnard, CPD, 1971 : 1265) . 4
However it was always hoped by people associated with implementing the Program"
that improved facilities. ould attract qualified scientistS:to teaching and..
encourage them to remain at a school longer3
.The extent to which this '-
occurred is -d facet of the Program worthy of investigation, .particularly in:.
light of the value placed by Gortoni(1966) on the primry importance,of
good teachers.. ,
.
1°'----N---/-_ ,,,
./ --'',
. g
One ot&r aspe-ct of effectiveness concerned more especiallyt4p Program--.:'
in the government schoolsof_Victoria and New, 5outh.Wales. Some items of
.
.
apparatus provided in bulk consignments to schools in those States wery.con-
.
....
..
sidered unnecessary, even useless. The astronomfcarIelescppe usual'ly.was
cited.as an eiampl of an unnecessary purChase4. Yet it is poSsible-that
such items may have proved useful. over a-longer period of time.
The-Impact on.School Systems
While the main purpose of this study was to examine the impact of the
Program on schools it was important to take cognizance.of the context in
whiCh schoolS were provided with' additional, facilities.Government school's
received 'the benefits of these fluids through State, Educatibn Departments who
also prolped other material resources. The. distinction between different -
2 See pages 15 - 20.
Interview with profeSior B. Selby Smith, 18 May 1976.
4 Sydney Morning Herald, 22 July 1968 : 7.
'...-
4V

29.
sources of funds for appatatuS provided was often notinal. For these reasong.it would seem. important to include a consideration of the impact of the..
scheme, on the administration of science teaching in school systems.
The additional.financial resources which this Program placed at the dis-
posal oradministratOrs in State Edudation Department's was bound to have widerepercussionS. Such administrative matters, aS the systet'by which schoolswere supplied' with .apparatus could.have been affected by the addifiO
finandial resources available. Moreover State. Education Departments cduldouse the 'resourCet to stimulate the development of new subjeCtS and new curricula.Even policy decisions .conterning,the commitment of State-resources., as for..
example in,the employment of laboratory assistants, could have been influencedby the presence of CommOnwealth funds. Such changes as these'at.a systemic
level would also affect the work of schools. These effects would not berevealed by considering differences between schools as most schools in a systemwould have been affected similarly.
In order that these system-wide effects are not neglected a study of the°impact of the Program on school systemS-haeen made. An additional aspect.
of such a study was that it could examine Any policy differences in Education
:Departments which were. operating under the sage policy guidelines.
A Review of the.Framework
From the statements. of intention, alleged outcomes,. and criticisms of the.
Science Facilities Program a number of questions about its_ impact were devised.They:are summarited in Appendix.A. These .questionsnave been written as they
AO arise and no attempt has been made at this stage to consider the inter-'actionbetween the issues involved. It was not pbssible to report on all of theseissues in'this.report. Some, particularly thOSe concerned with students'
'. . achievements and attitude, will be the, subject of subsequf ent reports. ThisReport.concentrates upoh those questions concerned with the way.science isstudied and taught in schools. It...is-in that area that one miglit'ekpect toP
observe the more immediate changes wrought by the improvement of facilities.6
Studies Related to the Provision of Science Facilities.:.A Review.. ,
Englehardt (19661 considered that the term 'facility' was often wrongly used..Facility was .too often used as a synonym for teaching space. He argued thata teachidg space only became a-facility when it was equipped with apparatusand occupied by teachers. Usage of the term facility during the period of
the Science Faelities Program has suggested that it would be More appropriate
4/

4
. 30.
if facilities were taken to include the material resources'for teaching science.
In addition the provisiono4anCillary,staff has been considered as an,nspect .
related.to science
PUblished articles abb t science facilities. form two groups ::descriptive
and analytic. DescriptiveLstudies include those which assess or recommend
standardS for school science facilities. -Frequently they have been limited
to, the provision and design of rooms. Their purpose was immediate and,prac-.
tical : to influence the type of science rooms provided in schools. Some of
these articles-were also interpretative:.Proposed designs were based on an
assessment of an existing or desired curriculum or teaching method. Connections
between facilities and' he'teaching process were assumed but not investigated.
In the second group are the analytic studies. These studies attempted
to examine systematically the possible effects of varyihg standards and types
of, provision of science facilities. Various aspects.of science facilities.
were treated as independent variables. The Outcomes investigated were diverse,
ranging from facets'of teaching style, through achievement, to _aspects of
attitudes and interest. This second group of studies is small in number
suggesfing a rather neglected area of work.
The Provision and Design of Science Rooms
In Britain the Industrial Fund for the:Advancement-of Scientific. Education'
in Schools stimulated reconsideration of what constituted appropriate science
facilities.' Because of its financial contribution to the building of science
facilities its standards were widely accepted. The brochures it published
proved a source of guidance fo:those planning science facilities (Industrial
Fund; 1957a, 1957b).. The standards it adopted for its own buildings reflected
an awareness of the central role of the labo4-atbry in modern science teaching.
The design of science facilities in Britain bias gained more recent stimu-
lation from the Oxford Project (Department of Education and Science, 1967).
In Australia the CommOnwealthStandardsiCommittce was strongly influenced by
,
these standards. The Ii'idustrial Fund had addressed itself to the number of
rooms, size of rooms, specialization of rooms, ancillary services and design.
(SaVage; 1958). Of particular importance was the principle that a science
room ought to have a number of 'fallow periods', being.vacant. for between one
third and one quarter of the teaching timeThe suggestikon became the policy
of the Science Teachers' Associations (Thee Four Associati,bns,:1960.)
4 2

31.
This development in Britain paralleled principles enunciated in the
..,United States. Johnson (1956 : 14) recommended that science rooms in United
States schOols should not be used more than 70 percent of the available
teaching time. The National Science Teathers' Association b970) adopted the
principle of fallow periods but with a maximum usage rate of 80 percent. When
the commonwealth Standards-CoMmittee urged a standard 75 percent utilization
it was within the Mainstream of overseas patterns.
A number of publications from the United States made general recommen-
dations about the type.of science facilities which would suit the new curri-
cula introduced during the sixties (Arkansas Department of Education, 1966;
California Department.ofEduCation,.1964; 1960; Mississi* Depart-
ment of Education, 1966; Schlessinger; 1961)% The common theme was the
central role of experimental work in the new'curricula and the need for'
flexible classroom-laboratories for-teaching. This intention was Consistent.
with the orientation of the Commonwealth Standards CoMmittee toward dUal purpose
science rooms. A review of science facilities (Baas,.1973) considered thistrend to flexible multi-functional science rooms to be a feature of develop-,
ments in science room design. It was, in his view, evidence of
a primary concern for individual student'sinvolvement in the methodologies and re-sults. of the scientific process..
(Baas, 1973 3)
Baas' view received support a study by Novak (1972). In that study
of exemplary facilities an evolving pattern was detected. The chain. of
evolution was from separate lecture and'laboratoryspace. with massive-fixed
furniture, through integrated claSsroom laboratories to flexible open space
'provisions.- As the author concedes the result could perhaps have been. partly
'influenced by the tacit assumptions made when selecting exemplary schools
(Novak, 1972 : 22). However. his general assessment of trends in this area'
57-does match those of other observers such as'Baas(1973),. In addition to
elucidating an 'evolVing pattern in the nature of science facilities Novak (1972)
made an attempt to: link this pattern with concomitant developments in'curri-
cula, educational technology and teaching. roles.' The nature of the study,:
precluded the empirical testing of these.hypothesized links.
ArtiCleS concerned with science facilities in other, countries fellow a
simil preach,. The Ontario Department of Education (1968) in a publica-
tion on,th design of science facilities argued for maximum flexibility.

The.purpose,it said, was to permit various, methods of operation in rooms
which could be adjusted to the personal 'preferences of.teachers and changing
requirements in organization, curricula and methods. Laboratories, it said,,
should also be multifunctional in that they should allow effectivefteaching
in different 'Sciences. One issue of theAustralianScience Teachers Journal
(1974) was devoted to changes in science facilities. In that issue contri-
butors from New South Wales (Turner, 1974), Victoria (Hall; 1974), Queensland
(Robins, 1974), Western Australi Betjeman,:1974) and Tasmania (Fish, 1974)
descpbed the most recent develo n iniscience room design in the Australian
. States. A common emphasis was on the mo7e'.fleXible designs which had been
developed to suit modern science curricula. 'Articles by Fish (1974) and
.Betjeman (1974) explicitly 'related the design changes which had dteurred
in response to,the perceived needs of modern sciencecurricula. Prosser and
Woolley (1974) discussed the:archttecturalramification's of 'science facilities
intended for an open plap.school.The.hookletsuhliShed by the Commonwealth
Standards Committee (1964, 1973) alsoshoW,a trend to more flexible designs.
The most flexible designs appeaKed in a supplement published near.the end of
their'period,of work (Commonwealth 'Standards committee, 1975). It is inter-
.
esfing to note that when one member of that Committee reviewed its work
attention was concentrated on the development of flexible designs (Field,,1974).
A difficulty with(the commonly recurring theme of greater 'flexibility.,
is that different meanings were attached tTit. In some places just one of
the possible interpretations wasintended,while in others it seemed to in-
clude severalsimultaneOuslY.
1 It could refer to 'a room iA which the basic furniture can be quickly and
easily rearranged for a given lesson or. during a ltson. In this sense
the'term versatility:wouldseemiappropriate.\ .
2 Sometimes the term flexibility was'applied to rooms where accommodation
arrangements can be altered. to suit the preferente of teachers or
course requirements. Since.most buildings last longer than the courses
for which they were intended this is an important attribute. Rooms
with the.capacity for such substantial alteration could be considered
adaptable.
Rooms which-were designed for the teaching of more than bne,science sub-
discipline. were sometimes called flexible. More appropriately they. should
be called miXtlfunctional.
Rooms designed .for particular, requirements of science courses which em-
phasize 'group discuSsion and/or individual progression were called flex-
ible. Often this was a misuse of the term for they were unsuited to any
other course.. 44

33.
.While flexibility was often mentioned its usefulness as a concept,
either, in description or specification, is limited by the fact that it en-
compassed such a variety of meanings.
The Effects Of Science Facilities on the Teaching Process
It has been noted that the potential relationship between the provision of
science facilities and the teaching of science was usually expressed in terms
of providing suitable facilities for a new curriculum. Englehardt (1966) ex-
plored the possiOe influences which"the nature of science rooms could have
upon teaching practices. Two means of influence were distinguished. Firstly,
the provision of suitable science rooms could remove a barrier to certain
activities. In this .sense rooms were a potentially limiting factor. Secondly,
the presence of suitable rooms may suggest the possibility of new activities.
Hence the notion of 'suggestive space' was advanced. It was conceded that in
practice it may be hard to isolate each means of influence. Yet the argument
served the valuable purpose of visualizing facilities as exerting more than a
limiting influence.
Several articles considered facilities as possible limitations on certain
sorts of praOtiA'l work.(Dark and Squires, 1975; Robertson, 1962). Kerr (1964 :
73) produced evidence that, in English schools, insufficient laboratory fa-en-
ities, over-use of labOratories, a shortage of qualified teachers, lack of
: assistancq(and:large classes impaired the effectiveness of laboratory work.
Kelly and Monger (1974a, 1974b) reported an evaluation of Nuffield 0-Level .
Biolo67'course materials. They, (Kelly and Monger, 19''74b :1105) drew attention
to apparent inconsistencies between the objectives and contentof the course,
teachers' understanding of those objectives and contentand the actual conduct
ofthe'course. Among reasons for these inconsistencies, they postulated that
rick of facilities may have influenced the way the course was conducted. In
an evaluation of the Nuffield A level Biological Science Project lack of
facilities whs cited as a factor which could have influenced the decision to
adopt the course (Kelly and Nicodemus, 1973) but not the achievement of
students AiKelly, 1972).. Brown (1977) reported that teachers in schools with
poor science facilities viewed the Scottish Integrated Science Scheme less
favourably than those with good facilities..
,In an exploratory paper Englehardt (1966) had argued that the type of
room provided could have a suggestive influence, as well as a limiting.in-
.fluence, upon the teaching of science. In addition, he ,developed a 'pro
cedural planning model which related goals, methods and facilities. This
45

34.
model incorporated a number of basic determinants of educational specifica-
tions: the pattern of science teaching_in the school, the number of students
in each space, the services required and the location in relation to the
school. In the empirical study which followed,Englehardt (1968) investigated
a number of aspect's of the relationships between characteristics of science
rooms and,science teaching.methods. Nearly 500 teachers in 59 schooli in the
.New England States of the USA were interviewed. Their responses to questions
about teaching practices, were related to Englehardt's observations of
characteristics of the rooms in which they taught. His results were illumina-
ting for some characteristics ofthe architectural space were found to be
significantly associated with teaching practices. It was found that class-
room laboratories were significantly associated with the use of 'enquiry
methods' in science laboratory work especially when the teachers had adequate
preparation time, easy access to the laboratory area and taught mainly in one
room each. Other significant associations were reported between suitable
sinks and the frequency of laboratory work in Biology and Earth Sciences,
the provision of individual laboratory space and the frequency of individual
projects, and the proximity of the library and the use of library assignments.
It needs to be remembered that information about the practices which teachers.,
followed was derive from interviews with the teachers, with the possibility
that' the answers may ave been biased. Other features also suggest that the
findings shoul be treated with caution. Some of the spatial variables may
have
been ass cia Tr ith other attributes of 'the school which were not
specified. reo er the possibility exists that teachers were attracted to
schools whir ha the facilities they sought. Englehardt assumed that
.teachers were influenced by the facilities which were at the school. -However,
despite these cauti, the proposition that facilities do influence teach-
ing methods was an assumption of the Program under review and will need
examination.
Assuming that Englehardt's (1968) results were not just the results of-
the operation of some unmeasured personality variables there are two possible
explanations of .his positive results. Firstly, his examination of spatial
influences included..consideratibn of the presence'of necessary features. It
was not restricted to design differences. Secondly, by conducting the in-.
vestigation.within.a specific context, science, it was possible to choose
dependent variables which were most likely to be influenced by the presence
or arrangement of facilities. However it should be noted that Englehardt's
(1968) study suggested an associationbetween facilities and certain teacher
6'

35..
practices rather than causation. Alternatives to the postulate that
facilities influence teaching practices exist. Dawson (1964) suggested that
new curricula such as BSCS Biology influenced the science facilities in
schools. In addition it is possible that good teachers might exert great
efforts to secure good facilities in their schools.
Teaching Methods in Areas other than Science
Outside the specific context of teaching science there have been studies
of the effects of facilities on teaching. Many of the examinationsqf
educati4ii.have not been able to separate, 'open education philosophies' fro
'open space design' because the schoolsmere-built-for that-purpose--
(Lovegrove; 1974, 1975). In the Australian Open Area SchoolsPrOject an
attempt was made to_look specifically' at the effect of, architecture on teach-
ing. ;Fitzpatrick and Angus (1974) destribed some of the belieTs'of teachers
in open plan schools.' In general those. teachers felt uncertain of what
changes.in behaviour were expected o£ them. An obserition study (Angus,
-Evans, and Parkin,. 1975) suggested that school 'design was not a factor which
could ekplain many. differences in the nature and frequency of interaction.
between pupils and teachers. Architectural features did not seem to be a
decisive influence on styles of teaching. This conclusionAlt consistent
with those similar studies reviewed by Angus et al (1975:).TAn,ihterpretive
comment was made that the differences in the conditions euezlenced by\ .4student's in open plan and conventional schools were less. pronounced than
might be imagined. Improvized modifications in many open plansdhools
resulted in teachers .working in effectively self contained a
Drew (1971) reviewed a number of studies of the4psyClIological and.
behavioural effects of the physical environmeTveral of." e studies
in diverse contexts suggested effects other tintithe.dmOosa. !T.40physiCalAt A-
.
restraint. HoWever there were also a numbex00E,:strd). eh results. wereinconclusive. Drew 11971) concluded that depiiW n al;fawareness'that
manipulation of the physical environment might%pr044e:ChahOs-.,i0ehaViour
patterns, the mechanisms of theSe changes had not;
comments have notyet been extended bytUdie

36.
The Effect of ScienceFacilities on Achievement
One expectation of the provision of science facilities was that students
would better understand the science they studied. This understanding should
be reflected in various measures of achievement. Studies of the effect of
science facilities on the achievement ofstudents form a subset of studies
of school effects in general. In a review of school effects on educational
achievement Guthrie (1971) grouped school'factorsrelated to performance in
the categories; school facilit,.ifs, teacher char teristics,.inttructional
.materials and student environment. There are disparities between studies ,
in the extent.to which they suggest schools contribute to the educational
%achievement of students. These differences arise-bechuse different aspects
of achievement are used, different popUlations are studigt, different
methodi are used to collect data, and different methods of analysis are em-
employed. Since the publication of a study by Coleman (1966) the view has
been widely accepted that schools do not greatly influence the educational
achievement of their pupils. earr of the reason for this may be that
measures of, school resourt c. and learning conditions have been school
variables. Within a school there is often much variation between classes n
access to resources and in the learning conditions they experience as well
was in initial ability (Ross, 1976 : 41). Were studies of school effects to
use the class as the unit of analysis rather than the school the effects might
be found to be stronger.
'In general, studies using a measure of educational achievement involving
a large component of verbal or literary skill attribute less influence to
,:sch-601..-1:actors than do these'studies of achievement in SciencePor Mathematics.
The'wide4...,luoted study by Coleman (1966), for example,.used a test.ofreading
-5'.ie.:crit-eritiiimeasi,tye and suggestedschools had little impact on educational
a6bibyementiibdies reviewed by Guthrie (1970) which used tests of
,verbal.alii.litYOMAikallowance for home background, have suggested some
feattli7600*ted to achievement in this area Among the features
mentionelk*d*e*ReildOilte per pupil, teachers ipxperience, classroom atMos-
;pheie.,'06404IttAieSiWability, science laboratory facilities, building age,
.;.0,;:.;;t-kfag'it'.
temporaxx.A400,00* library volumes and classrooms per 1000 students. .At
1.east..sdiiiZE4fieSe features were scfiool facilities though the possirlity
cannot,be.dismissed ;hat they were manifestations 'of unmeasured dimensions.
Peaker"(1967). studied English Primary school children and suggested that two
thirdS of the variation in reading comprehension could be accounted for by
three factors. In order of importance these were; parental, attitudes, home
4

37.
circumstances, and attributes of schools or teachers. Guthrie. (1970) makes
the useful point that.
Presumabl$, schools are established to instructstudents in moderately well defined subject matter
'.areas,.not to increase some quality as amorphous' ,
aswerbal.ability. -
(Guthrie, 1970 : 38)
In-studies of science achievement it seems that school effects are more
strongly correlated to outcomes than is the case in other disciplines (Dyei,
1968). This is shown in the results of the IEA studies of Educational''
Achievement (Purees and Levine,' 1975 : 23-30), particular in theresults
of some of the multiple regression analyses in that study. Learning conditions
made some contribution to the variance in science achievement in most countries.'
The contribution. was greater when there was less variation in home background,
as in Sweden, or when learning conditions did not parallel home background as
in.England. Keeves (1972 : 220), in a study of.students in the firsi,year of
secondary school, reported that the number of science periods in a laboratory
sassociated with higher science achievement. Shaycoft (1967)'in a
.40rigitudinal study of students. from grade 9.to grade 12 showed gains in scores
in most subject areas as well as variations in those gains between schools. *
She concluded that school programs did contribute to educational,performance
on these achievement tests. However, no measures of such factors as staff
quality, resource availability or facility adequacy were included.
Two most interesting studies extended the IEA Science Achievement
analysis. Owen (1975) and Wilson (1975) made use of the Population IV
(Year 12) and Population II (14 year-old) data respectively for Victoria.
'Both studies were designed to identify school factors'which affected the
performance of students in science. Using Dyer's (1969) model a predicted
school science score, based on 'home background' and 'sex bias' of the school,.
was.caldulated and compared with the actual score obtained by averaging the
, scores of each student in. the sample. Tw6.groups.of schools were.then
identified; one group which performed better than expected and the other which
had not performed as well as would have been predicted. A comparison of the .
two groups-of schools was made so that some factors affecting performance might
be" identified. Wilson found greater differences in facilities betw n above
and below expectation schools among the 14 year-old sample than did (Nen among 40141
the Year 12 sample.
4.9

38.
The accommodation and facilities available foir science,
also appeared to be related'to the level of achieve-
ment of the students 'in a school. In those schools
where students achieved less well than was predicted
from their sex and home background; the accommodation
for science was inadequate. Many of these schoolt.
reported that there were'not enough classrooms and
that makeshift arrangements were necessary to accommo-
date some lessons, that many science classes were held
out of laboratories, that nonscience lessons'were
held in laboratories-and that the laboratories were
rarely vacant during the day to'enable-adequatePreparation of-the-rooms-for science-lessons.
wilson, 1975 : 39)
Owen (1975) did not find such differences between the standard of facilities
in 'above' and 'below expectatiOn' schools in the Year 12 sample. It seems
as if the different results of these two studies-could reflect the different
age groups studied. Two possible expianationS could be postulated for this
difference. One is that good science facilities are more important to the
achievement of younger:students than those in the final year of secondary
school.._ The alternative is that the results reflect the greater variation
in facilities available to younger:students. The report of-the study of
schools in the 14 year-old sample also commented on the effect of facilities
upon some teaching practices.
Few clear relationships have emerged -in- -this study
concerning practical work.- Teachers in the 'above-,
expectation' and 'below expectation' schoolsdid-
not display marked differences. in opinion concerning
thq,importance.of.such work. However, the facilities
.fodnd in the 'below expectation''schoolssuggestedthat, at the. .junior levels in particular, the type of
practical exercise postible was very limited and in
these schools students were unable to do effettive
work. Because of the recent trend in Victoria away
froM teacher oriented science Lessons to those based
on the individudl.student's practical experience, it
is important that the effects of such methods are
known. A study which carefully docuMents the amount
and type of practital work.done with different kinds
of facilitieS and the relationship between the type
offacilities.provided and achievement in junior
science, is greatly needed.(Wilson, 1975 '43)
-
Science Facilities and Interest in. Science
Many of the early statements-about the Sciencejacilitits Project implied'
that with better school facilities more students would become interested in
Science and would be encouraged to follow scientific careers. Most publica-
tions abcut science enrolments Ilve been concerned. to document trends and

39.
interpret them in teimsof broad societal changes (Dainton, 1568; Fensham,
1970; ,Lee Dow, 1971; Stranks,,1969). Broad societal changes are sometimes
seen in the status accorded science within schools (Fensham, 1970). It is
rare for enrolment patterns to be considertd in relatiOn to school attributes
as specific as the level of faailities. Taylor, Christie and Platts (1973)
made one study of factors relating to the choice of science among able fourth
year secondary school' pupils in England. They reported that boys other than
those, who were most able, who were taught in schools with good facilitieS.ih,
early secondary school were more likely to opt. for science Understandably
personal characteristics, school policy 'and teaching style contributed to the
choice'of discipline for further study. It is interesting that facilities were
able to explain some four percent ef the total variance or ten percent of the
explained variance. The small sample and the imprecise measure of,the standard'
of facilitiell which was based on-impressions from inspectorsT-limited the
degree to which the results could be generalized. In addition it is poSsible
that.better.teachers tended to be in schools with better facilities. The
measure of teaching style which was used did not assess the quality of teaching.
Notwithstanding this, the suggestion that school factors including facilities
may influence subject chqice is at least interesting.
In a review: of pupils attitudes to; science Ormerod and Ockworth(1975)
do not mention any studies, other than that of Taylo'f' et al (1973),. of the in-
fluence of facilities upon attitudes or interests. They do indicate that` the
age range over which pupils interests in science seems to:bearoused coincides
with the late primary and early 'secondary school years. This is a conclusion
which has significant implications for the allocation of resources within
schools.
General Considerations
A Plan for kthe Evaluation
The relatively recent emphasis on the evaluation of wide-ranging social and
educational programs has had repercussions on techniques of evaluation. In
general. the.techn*es which are applied are how broader. Some of this has
resulted from evaluator. considering that previously, too much attention had.
been paid to measurable changes in-student behaviour but too.little to educa:.
tional proceses and problems-identified by schools. One development was
to make greater use of observational data'within the framework of flexible, .

40.
research Wesigns, and thusallow'Unanticipated events to be taken into account
(Stenhouse, 1975 115). Nevertheless there are highly experienced evaluators
who.argue for rather.tighter design and more rigorous data collection (Cooley
and 'Alines, 1976).Conflicting approaches to evaluation are now common.
One attempt at resolving. these conflicts was that proposed by,Slieldrake
and Berry (1975). They were concerned'with the illuminative apprpach espoused
by Parlett and Hamilton (1973) as well as more traditional methods of testingi,
They argued that both approaches had value for the higher education project
in which they were engaged.
...while recognizing the need to be reflective
and interpretive we have also supported our
views with empirical evidence where possible.(Sheldrake and Berry, 1975:3)
There was a recognition'that crucial information was missed by a detached
Observer while the involved observer developed views and interpretations .
that ,were partly a result of his own participation. In shortthetwo. .
approaChes were'needed to give a balanced evaluation.Sheldrake and Berry
(1975) place the two approaches on a two dimensional grid of research style,
One dimension was concerned with'whether, theresearch was analytic or
descriptive while the other categoriz d the research method as involved or
detached. In fact, these claSSifications. are probably too simple. EValuation°
methods are probably. multifaceted.
Maling-Keepes (1977) has reviewed some of the featuresof recent
evaluation studies with the intention of defining key characteristics,
through which they -could, be-compared and examined. She argued tliat the
growing diversity in approach was partly attributable to two factors: the
varied background of the evaluators and the diverse nature of the programs
being evaluated. Concerning the nature of the programs she observed,that few
were short-term well-defined programs with specific' Most-were long-
term.programs for which goals were loosely specified, and sometimes implicit;
and where the program varied over time. Maling-Keepes (1977) observes that
while the variety and voluMe of evaluations have multiplied, methods have
received little systematic attention. The key features proposed by Haling-.
Keepes will help to systematize discussion of evaluative metfiods. An im-
portant aspect of the development of them was the fact that the methods of

41.
N
evaluation were always considered. inlhe context of the program being
evaluated. Different methods suit different programs or, more precisely,
different methods are likely to be appropriate to different questions-about
any given program:
Specific Considerations
The Science Facilities. Program was an example of a program Whichextended
over a considerable time and which had global rather than specific objectives.
It.had been administered not centrally but federally through several agencies.
Given these features it was similat id'some of the prograMs Maling-Keepes
(1977) regarded as having given rise to a diverse range of evaluation methods.
HoWever, two constraints. precluded certain approaches tp its evaluation.
Firstly, there were no systematic data which described the provision of
science, facilities at,the time the Program commenced. Henceits.impact onq existing facilities was-difficult.to assess. As an alternative it was
decided to assess the ccintribution of the Program, to facilities being used
,and .to determine whether the provision of facilities in schools at the endOf the Program were satisfactory
: satisfactory being determined according
to the Program's own standards.
The second factor which. precluded certain approaches to evaluating the
Program was the time that the eValuition commenced. When the evaluation
began the program had finished. Hehce the opportunity to study the effect'
upon a school of gaining new facilities under this Program did not exist.
The absence of before and". after data on individual schools meant that .use
had to be made of existing variaisions:in school facilities. Schools which
had different standards of science facilities could be chosen, aspects of
their science teaching studied and the relationships between the two inves-tigated. In this way it was hoped to explore possible effects of the standard
of facilities'on science teaching. However, the very effectiveness of the,
Science Facilities Program in removing cases,of extreme shortage did limit ,
the range cf the indepehdent variable.
A third consideration warms that rather than embark upon a thorough
chievement and attitude testing program the results of the IEAS study
\/would be available. That extensive and thorough program:was conducted in1970 at which time the Science Facilities Program was not complete. If .
:International AsS'ociation for the Evaluation of Educational Achievement;,(Comber & Keeves, 1973):
.53

42.
the.Program.was. effective greater variations in the standard of facilities
would have existed.between,sdhocilethan in 1975. Some additional data aboUt
.studentS in those samples were also available6. Howeverlin order to use the
data additiOnal information Was required about the science facilities in those
schools. in 1970. I
. Four Phases of the Evaluation
As a result of these considerationS the evaluation f the Science Facilities
Program was planned to include'four phases.'These were chosen to. relate to
the three levels of impact orr schools and the fou th level of indirect impact,
through'system-Wide effects, on schools.
1 The first phase was a study of theKacilities for teaching science. in
schools and the contribution Of"the ScienCeFacilities Program to%
° 'those facilities. It was planned to include siich.features as the
availability and quality of rooms, the avLlability of apparatus and
the provision of ancillary services.
The second phase was planned to be a stlly of the effect's of facilities
on tle teaching learning process. The main part of it was intended to',
be a series of visits to schools in which teachers would be interviewed
students would complete a questionnai e and general. observatiOns Macie.
In addition .some survey data about /eacher retention land some IEA data
about teacher attivides was to ige Used.
The third phase was planned as a)4tudy of' some-outcomes of science
/
education :achievement. in, int rest in, and attitudes to.science.
Data obtained in 1975 would b used-tor enrolment.loatterns bmLIEA
data were to be reanalyzed conjunction with information about
facilities for the bulk o this phase:.
4 . Finally, a study:Of thadministration.ofthe Program and its wider,
impact on educational systems'was planned. To this end'it w4srintended
to examine official/ records and to interview, a number. of people involved
with implementing/the Program.
Time and space as prevented much of the 'work undertaken in the third phase
being reported in t is volume. . This-study. of the influence Of'facilities on
.
!student aclOeVeMep in.and attitudes "to science will appear, in a Su6sequent
report.I.
This additionalAata included.-.
(a) for the' Year 12 sample, tho'Higher School Certificate results for1970,
and ti Commonwealth SecondaryScholarship result two year's earlier, .-
(b); for tpe sample of 14 year-olds tIle results on a SCieni test administered
two fears later. , ..--° :5'4.
. %
..%

CHAPTER THREE
CONDUCTING THE EVALUATION
This chapter- describes the way ;the plan, which was disOussed in Chapter Two,
was 'applied to:this .evaluationl- For this plan to be implemented it.was
necessary to define some concepts more cloiely, to construct appropriate
'in4iCes, to deViso'sampling procedures and to develop questionnaire and
interview schedules: These prbcedures as they applied to both fhe.survey
and the school visit phases are described In addition the proceduresfsjlowed
in the survey, the school visits., and the visits to education departments are
also described.
-
The Survey0of School Facilities4
The School' Questionnaire
AS indicated in Chapter Two, the first' level at which the ScienceFacilities" 0
Program was to have an..impaCt was upon the science facilities in schools.
Information about facilities was not' uniformly available from records for the
scho s,tif every system. Nor was it Tossible to visit the number of schOols
neede to give an accurate assessment of the provision of facilities. In
order that an impxessdon of the present facilities could be obtained a
questionnaire, to'.be
completed by the teacher in charge of Science, was00*
develoPed.
The questionnaire was intended to provide information to:
assess the adeqUaCy of the present provision of science facilities
in Australian schools including an estimation of theicontribution
of the Science 'Facilities Program.to those facilities,.
.
test some hypothesized xelatiOns between thestandard of scllence
facilities and such outcomes as 'teacher'mobility, student egrolment
patterns'and teaching practices, and '_..
.
generate data to be Used inthe selection of schoolS.for case studies
,in which theimpact*'facilities, on 'the ieaChipg process could be
exaMined. further: .
That part of the questionhairekvhichwas.cOncerned with present facilities
'iwas so structured that ilArmation.wai obtained abbut four facets of science
6facilities. The'asPects considered were:
a
0 0 o

fro
. it
. ,
1., It* availability of sciencetrooms in relation to the schools science
,..
0tea0ing'prbgraMpd in relationaotte school enrolment,
' +' '7.1 ..4,y-60-
2. the qualityor functional adequacy ofii iionce rooms in the school,
1
,-4
the'adqquacy qf tire supply 9f apparatus to the school,_
At
the numbei5'Of suppqr staff for sciellcein relation to the school
.A 0 I'4 h .
'. '' 0I
T. : size. al%
The responses tO qdbstions aboutwoms wereobtained.in such a way. that
was possible t associato the data viith the age andtpource'of financeTor
thee room..,Informa,tieriOaStut the jiseito .wM' h each room was put .was also sought
44.
in additionto'details of the non -science rooms used fOrstience. As certain
*
items of apparatus had provedtontroversial,mhensupplied to the government
SOhools'in two,States, schools were asked.abt the usefulness of those items
*
in comparison .to other items generally 'felt to bt useful.
A copy of the SchoolQueStionnaire is included in Appendix B.' In
developing the trial, form three gOvernMent schools in Vittoria were.visited.
Alp that discussions could be held' with senior science staff. A first trial
form was administered to eight government schools in that State while.the
.
second and third trial forms were used in a total of 29 schools. Of thege
29 schools,18ere Victorian Government schools, thr4e were Victorian
Catholit schools, five. were Victorian Independent schOols, and the' remainingAs
three were GOVernment schoOls froM other,States. Sc4ence co7Ordinators involved
;in.these trials were invited_to 'Commentupon'and criticize the qUestionnaire
whilst completinein- .In addition copieS of the questionnaire were .sent to a
number 'of people. concerned with science education in each State.. .As- a result
,t
of this.processa number of'questionsvere_mOdified and some were eliminated.
In PWticular thechecklist'f,or the functiolial adequacy of science'prooms was
,.
modified 'The trialversions enabled some initial. analyses to. be performed.to
obtain.an indication, of.tle'range,of valAs'on,' and the ..dilcriminant power
of, several indices.
. .
Science .Room'
:The developmentof.appropriate indices of the 'provision of:Sc4.ence rooMS.was
crucial to the assessmen the. adequacy. of provisions: Indices of room:
availability and 'tom qualify were. eveloped.
4

45.
The most important indices of rood availability were those derived .from
the Commonwealth Standards .Committee. When assessing the number of science:
rooms required'by a school the main criterion adopted was that there should
be a science room available for every science lesson held Moreover the
cOmmittee.incorporated.the notion of fallow time in specifying.that each
room-should be used for only 75 percent of the total teaching time.
by
On this basis the number of science rooms required in a school is giVen
EPN =
. 0.75 x T
where EP = the total number of science periodsin a week
T = the number of teaching periods:on-which the timetable is based
Hence the adequacy of the number of science rooms (Q1), or the science room
availability, could be calculated as a percentage excess, or deficit if negative.
(k-N) .x 100Ql where . the actual number of .
N 'equipped. science rooms'.
'This-index includes all available science rooms, whether they were deMon
stration theatres or laboratories. However, the thrust of the Commonwealth
Standards Committee. was td encourage the building of dual-purpose classroom
laberafories.:, 'In addition Englehardt (1968) certainly suggested that it was
the availability of dual-purpose rooms which was influential in shaping'the
science teaching priofities in the school. Hence, an index bas00 only on
rooms.whicfi, were equipped for students to do experiMents was develOped (Q2).
Thus:
92
The Western,Australian Education Department adopted a similar approach
to this but specified an 45 percent usage, rate for rooms. Hence .on that
criterion:
S -N) x 100
Nwhere S = the number of. rooms. equipped
for student experiments
1)Na =
0.85 x T
and Q01-N,ox 100
3 Na

46.
In the indices Q1 and Q2, room availability was based on the actual
science teaching program of the school. They therefore allow that different
schools may have. different science orientations and, thoug of similar en-.
rolment, have different needs. However,' these indices suff r the disadvantage
of.not taking account of the fact thatischoolS may have red ced their_science,
program as a result'.of having a shortage of facilities. An alternative approach
is to base the assessment of the science rooms required upon he school's en-
rolment.' Thus, every school of similar size is treated as7ha ng a similar
potential commitment. to science teaching. This approach was in eneral that
folloWed by most of the State education systems: Two.basic variants existed
within this approach depending on whether junior (up to Year 10) enrolments
were treated differently from senior' (Years 11 and 12) enrolments in assessing
school needs.
Thus,.in the New South WalesState education system, assessMents of need
were based on Seven science rooms for a school of one thousanctpupils (CDE,
File 68/2764).
Hence, = 7 x,E .where E = total school enrolment
and, ..t'.}
1000
=7. (R-N ) x 100
'1;
where R = total science-rooms
in the Victorian State educationsystem assessments were based on:
ti) the,eStimatedavcrage amount of science taken up to Year ten;
(ii) the average retention of student's to. Years 11 and 12;
(iii) the average proportions of students, in Years 11 and 12 taking
science subjects and the time commitment involved. (CDE, File
71/5752)
ThiS ghVe an indication of the number of science rooms ne&ded.
Hence,
N (E + 2 x'(Y + Z)1
200
.(R-Nc) x 100
. Nc
where E = total enrolment !'
Y = Arolment in.Year 11
Z enrolment in'YearIT2'

47.
The South Australian Education Department based its estimates of science
accommodation needs on two premises. One was that science rooms should be used
for only725 of a poisible 35 teaching periods each week. The other was that
laboratories should be able to accommodate 30 to 35 students (CDE, File 68/2764).
The practical planning which followed from these, premises specified three
science rooms (including one demonstration room) for schools of 300 students,,
and six science rooms for schools containing 600 students. Schools enrolling
1000 students were entitled to two additional science rooms, while those with
1300 students could claim four additional science rooms {CDE, File 68/2764).
On this basis it was possible to calculate the number.of science rooms required- .
by,schools (Nd) and the adequacy. of the actual provision.(R - Nd) x 100.
Q6 Nd.
In Queensland the basis for planning science accommodation was not as
clear. Until the mid-sixties planning was based on the provision of one Physics
and one. Chemistry laboratory for every 600 students (CDE,.-File 68/2764). From
the mid-sixties onward a senior science block incorporating three laboratories
was planned for schools with Year 11 and 12 students. In addition a school's
requirement for laboratories for junior classes was based.on'the enrolments in
Years:eight, nine and ten.- Up to 350 students entitled a school to two
laboratories, schools. with 350 to 500 students were to have three laboratories;.-
while those. schools with beNeen 500 and 900 students' were planned to have four
junior laboratories. Very large schools were to be provided with proportion-
ately more junior science rooms (CDE,:File 68/2764). From these complex criteria
it was possible to estimate-schools!' requirements for 'science rooms (Ne) and
hence the adequacy relative. to, those requirements.
(R - x 100Q7 Ne
In Tasmania the provision of science rooMs'in different High Schools was
compared using the ratio of number of science Towns to the school enrolment.
This suggested two...simple indices for comparing schools. One was the'number
of science rooms per 1000 students.
R x 1000L1 E
The other was the number of dualikurpose rooms per 1000 students.
L2 = S x 1000E
Of these various' indices it was intended to make most use of Q1, Q2,:.11
and L2. They represented the. simplest measures of the'two basic approaches
i)

48.
to school needs science lessons and school enrolments.
The quality, or functional adequacy, of rooms was measured by means of
a.lisf of importantfeatures of science rooms. The science co-ordinator was
asked to rate each of the science rooms in the school for 14 key features'
using a four-poipt scalefrom 'non existent' to 'adequate'. Thus, the total
score for each room ranged, in principle, from 0 to 42 and, in practice, from
10 to 42.. The scorerange'described rooms which were cramped with minimal or
inaccessible services of,,gas, electricityand water, and poor working and
seating conditions to rooms which were spacious and provided with adequate
accessible service points and in which conditions were conducive to easy
variations in work patterns.Since the same person within each school rated
'that school's rooms it was possible to compare rooms from different sources
of funds and different ages. -
The Sample
'It was consideredthatinformation-Obtained from a sample yielding a high
response-weUld be morerellabie,ihan that from a survey of all schools whic
could at best. eXpecronly'a moderate fate of response. Hence, a sample o
schools was drawn for the survey`.thigvreduced the extensive use of sch ols-
and enabled resources to be diteqtmd to achieving,a high:respons ate. While
.sampling could be random, non-responseas usuallknot.random.
The schools were chosen from a sampling fraMeACch listed all secondary
schools,,other than special schools, in Australia. The: frame was stratified
by State,'system(Government; Catholic and Independent) and location (metro-
politan and-non-metropolitan).Within each stratum, schools were.grOuped into
'various sub - strata. For example in Nictoria,.governMent schools were classified
as either technical or high schools. In the sample drawn no distinction was
made, between non-systemicand systemic Catholic schools. Such a distinction
was not officially recognized for most of the period over which the Science
Facilities Program operated.
These were-derived from the brochurepublished-by- the Commonwealth
Science FacilitiesCommittee and entitled The Design of Science Rooms
(Commonwealth of Australia,'1973)._

49.
The selection of schools rrom the sampling frame was,'O'Verlied0Kthe';
following criteria.
1. The seleCtion should be random within stratified. groUp:
2. The sample of schoolS should'refiect the_varioUs tYpef
school in the population.
3. In accord with the system, of:adMinistratio of he:;SedenOi'
Facilities Program sufficient schools shoul be. ChOserOmeach State.
A simple random sample would not have been the best posible l'ef,tWote4s.ons.
Firstly it would lack precision in.the representation;:OP.eaahstrptOMWeendly
by giving each school an equal probability of wglild
small, rural schools in relation to the hiicli;'they
AccOrdingly a stratified probability, sample
This stratification does not imply a great departurerpOOdOin%inCe'
schools were still selected at randoM, by, a randort"00taiii.PTterva,1
method from each stratum. It does, howevdr, redUc'e,theandririferreit (Moger
and. Kelton, 1975 : 85) as a consequence 9f.eaclifiatIlrOi6P-4:*4reciiy rep-.`
resented in the sample. The'sampling!was perferM404cihk,exchgchtiO1 bad
a probability of selection proportional tir its side:'; T}ie` index of; size which,.
was used was the number of 14. year cildtudentS::at:'the. school. this information
was uniformly available .for ali,tchopls.and hasr relatively uncontaminated by speirthingSaseli§01A§TePeallit.
The basicprobabili,XY' sample-s,were, to coma -in 50:0feeTs7)ACh of New---
South Wales, Victoria,, QUAenslapd and. South:' Austr'ai,ia;`4,0;; "s,cho01 s in Western
Australia. and Tasmania,.anA,dfl.h scheols:iniAhet*Ii4n Capital Territory.
However, while such .A'sample wouldjoe adeqUaWflagovet0Menthools it would
contain too fewnonoverfiment...schools in SOM.e..*dtds..foraWieliable estimate
to be made for those.scHOels-, .:Therefore an. Kt'saMple,was:takenef thef-non.
government,sehool strata $uch.that in711T:State:there.WappiOximately 15
Catholic and 15Indegendent schools': : To adhieWth0*eamPlingifraction
was multiplied by an appropriate integral :1/'qlu0;..-fer'.ekititatuM, ThiS:tech-.. 2 .
nique enabled,the..basic piobabIlity sample;to.be analyses where.,.
weighting wOuicip-fove!tOO:cOMp*ek but:preVi.40a:.:disepeqionate stratified:
sample for between'straia..CoMparlk14% :A.'s.UMM*ry'O-fthesampling details is:.
contained in Appendix
4

.
SO.
Table 3.1 Questionnaires Returned from each State and School System
State Goliernment Catholic Independent Total
N N . % N %. N
ACT 12 92 4' 80 2. 67 18 86
New South'Wales 38 97. 15. 88 13 93 66. 94
Victoria 37 97 15 88 15 94 ' 67 94
` QUeensland 38 100' 14 88 r3 93 65 .96
South AUstralia 38 97 13 100 13 100 64 98.
Western Australia 31 .100 17 100 .12 92 60 98'
Tasmania 36 b 95 11 85 8 89 55, 92
Australia 230 47 89 .92 76. 93 395 95
.
Total number of questionnaires dispatched = 415
This figure includes 7 matriculation colleges
7
The seven Matriculation CdOegesloflaspania were unique in enrolling
only students in Year 11 and 12 with no other government schoolS in-that, .
State enrolling students in those years. To gain some understanding of .the
provision of science facilities in those colleges a questionnaire was sent to
each .of them. This was treated separately as an additional sample'.
Administration of the Survey
'Permission was sought froM-the:DireetorsIGereral- of Education in each.Siate,
and from the Chief Education OffiCer Of.the Australian Capital Territory, to
approach schools directly for the survey and subsequent stages Of the.project.
Permission was granted in each case. In .each State the Director -General "'
anominated, at our invitation, a liaison officer for contact with schoolS:
A brief statement about the evaluation was submitted for publication in
the Science Tea ers Association:journals-in each State. This statement
.mentioned in par ular the proposed survey as the initial phase of the
project... A stat about the project"was also included in the ASTA notes
,
of the Australian Scf nce Teachers Journal.
In Oct r a ter was sent to the Principal of every school in the
'sample inviting the participation of that school and informing him that the
project officer would soon be communicating with the science co-ordinator.
In fact four letter formswereupd depending on whether the school was a
.g-overnment or non-government school and'whether the school had recently-taken
part in another ACER study. 62

51.
.Table 3.2 Number of Questionnaires Returned by State and Date
State Questionnaires Returned Before.
Later
Returns'Nov 17 Nov 24 'Dec 1 Dec 8 Dec 15ACT .5 3 3 3' 1 3
New SouthWales 44: 6 6 2 3 5
Victoria 38. ,' 8 7 ... 6 5 3
Queensland 38 6 8 10 : 1 2
South Australia 44 7, 4 6J.,
1 2
Western Autralia 41 . . 8' 5 3 1 2..
Tasmania 25 6 4 5 4 .-1l,-4g,
'Australia 235'A-
37 35 . 16 28
Cumulative % 56 67 76 85 88 . 95
. 4Non-
Returns
3.
4
4
3
1
1
21
The questi6nhaire was posted to Science co-ordinator's an 21 October 1975.
It was accompanied by a' letter explaining the project and requeSting a reply
by 14 November. A.Stamped and addressed.envelope for 'reply was included,
ltOgither with a letter of endorsement from the President of the Australian
SCience Teachers Association.
If no reply hadfbeen receivedby 19 NoVember a reminder letter wassent
to the science co-ordinator. Two. weeks bgfore the end of the school year...if no reply had been received a second reminder letter was sent to the schobl,,,.
and the Liaison Officer was asked to contact the schOol. Those schools which',
had not .replied by the last week of the school year wemc,either. teleph
visited by the Project Officer direct. -Copies ofeihe'leNersto schools ha
been included:in Appendix D.
As a result of:this follow-up procedure 95 percent of all questionnaires
posted were returned. This compares favourably with the return rates often
reported for mail questionnaires. (Oppenheim, 1966 :A4)'. , Moreover the rate
`Of :return from each school system in each State was suffiCiently high for the °
returrisyto be analysed with some confidence. The percentage returned for
each school system and State. is shown in Table 3:1., The effect of the follow
up procedure is shown in Table 3.2. Only 56 percent had replied by the due
date, 76 percent by the date requested'in the reminder letter and 95 pprcentby the end of the year. This roughly corresponds to the observation of Moserand Kalton (1975 ; 266) that the same proportion of people sent questionnaires.respond to each mailing.

52.
Data Management
The returned questiOnnaires werecoded according to a prepared coding manual
and the data punched_on computer cards. These cards were then used to f
generate an SPSS2 computer data file. Some of the.variables on the file thus
created were primaryVariables'from thequestionnaire while others were
secondary variables created br,computationinvolving the primary data. An
analysis of frequency distributions3 enabled any discrepant values to be
identified and corrected.The file was able to be used readily for subsequent-
analyses.
The file consisted of 13 sub-files,, there being two sub-files for each
State and one for the ACT. In each State one sub."file consisted of the basic
sample and the other of the schools in the oversample.Two series of weighting
. .
variables were calculated and.,assigneclto each school
according. to tlie stratum
of origin. One was aseries'of weights to be applied within State analyses.
It allowed for.oversampling of non -government schools and
for the non response
.of some; 'schools.
The second was a series of'weights to be applied to naticipal
analyses.. In addition to the factorscantribpting to the within State-Weiglits
it allowed for tAp different size of each State. Hence by using
'weighting variablesin the analyses it was possible to use sample statistics,`,
to estimate population parameters. The weighting variables used haVe been
included in Appendix C.
The School Visits
The Purpose of the School.Visits
In the secondphase.of the evaluation a small number of schools were selected.
for more detailed.observation and analyses than was possible in the survey.,
The purpose was to examine and clarify the effects of good- facilities on
science teaching.Chapter Two drew attention to the claim that the Science
Facilities Program had improved 'the quality of. science education'. Two
approaches were adopted. The first involvedinterviews with teachers and
observation of the .se made of facilities: Little research had been done on
.
the effects of good science facilities, and this "loosely structured approach
was intended to allow the identification of concomitant4 effects'of good
2 Statistical Package for the,Social 5cionws (Nie et a], 1975).
3 The SPSS programsFREQUENCIES (Nie et al; 1975:..194) and CROSSTABS
(NiO et,al, 1975 :218) were used for. this.
4 MalingAtepes (1978)'argues that concomitant effects is a better term
than ini.anticipated outcomesfor these effects are not really unexpected.
StakeW(1967) argues for a fuller countenance of educations evaluation
which considers inter alia a wide;,, range of outcomes.
53.
facilities. The other, complementary, approach was to systematically analyse.
differences in appects.of 'the quality of science education' among schools
with different standards of facilities. To d9 this it was necessary to define:
more specifically those changes which were expected to result from better
facilities.
Selection of Schools.4,'Itt
t"The schools used for case study obiervations were drawn froM the sample :: ' 'fb
-alredy.involved in the questionnaire analysis. .Again it w s important...that Al '""":. .
the'schOols studied included a wide range of standards of cience facilities. ..'4 ?;,
Arl :..The Science Facilities Program had concluded when the evaluation was *
conducted, therefore a 'before and after! study was notpossible. 5 Schoolswere chosen for investigation using thedfferences between tyPeSof'Schools''revealed by the survey. The survey data had demonstrated that'important
.
variations in the alti ability of dOal-plaiv science.*pose sciencrooms, existed.betWeen
)1 'eschools' of different
. A technique of clustering schools 6 accordingto the extent to which they were provided with science*Soms was used. Theclusters formect were of .schools which were most similar in the provision of
'7:science rooms.' Thenoat' least one School.-from each of the clusters or terminalgroups was chosen:for study. From'the larger groups more than one school was
sen. 'High', 'middle', and 'IOW! schools frOm each government school
qstem '(except TaSmania)'las well as from the two clusters of,non-government
schools were included.' Thirty schoolS; from all:States, were visited in theschool study phase:- twenty=tWo.were.government secondary schools,6including
one Matriculation'College. :Eight were non-government secondary schools.
A copy of the letter sent to each school requesting permission to visithas been included.asAppendix D. Schools were most helpful in assisting to
fit the activities for the visits iA16-.the time available.
5.-
Though a few schools which had recently acquired new suites of rooms.werevisited as a separate venture.
'6 The technique used the Automatic Interaction Detector (Sonquist and Morgan,164). Its application to this probleM hasbeen disCussed elsewhere .
(Ainley, 1976).

54.
Teacher' Interview and School Observation Schedules .
The reasons for includ.ifig some relatively open methods of informatiori.gathering
in this evaluation haye already been discuSSed.- From the information gathered
in this way case' 'Study descriptions of each school were developed.. It waso.also,
intended to draw generalizations and identify cOffiMon features after grouping
the.case studies.. Therefore -it was considered' necessary that comparable in-
formation should be-obtained from each school. This implied that common pro-
cerdures"be followed in schools, and that common themes be used in interviews.
As a result a core of information which was comparable:between schools was
obtained,,, in addition to observation and comment which was unique to each
individual school. A sufficiently large number of schools was visited so
that each school visit could be considered in alwider context'and so that
some generalizations could.be inferred from the results. In these respects,
the. approach adopted had much in common.with that.of Goodlad arld'Klien (1974)
in a'study-ofelementarYThchools., That study made use of visits to 67
schools in the. United States. Data was gathered from three sources; interviews
,with teachers, interviews with principals-and observation'of activities
(Goodlad and Klien, 1974':. 34). The interviews and the observations were
structured around 12 rather broad categories so that the information gathered
in different schools was comparable. By using this approach the authors were
able to suggest broad conclusions which could.be.applied'to elementary schools
in the United States.
In each school which was viitelothe sdience'co-ordinator, every teacher
of Year 9 Science, the Principal and the laboratory staff, were interviewed.
For the interviews with the science co-ordinator and the science teachers,
a tape recorder was used'.. These interviews lasted about thirty minutes. A
guide for these interviews which had been prepared during some trial visits
to schools Was used. There. were, therefore, common questions but digressiofis
'were invited sc that the interview was not restricted to.theguide. Inter-
views with the school principal and the laboratory staff. were not recorded on.
tape but each followed a Tre-determined pattern between schools. Less formal
discussions with other science 'staff members and informal visits to classes,
'were also arranged.'
The categories were; milieu, instructional activities, subject matter,
materials and equipment, involvement; interaction, inquiry, independence,
.:,curriculum balance, curricular adaptation, expectancy, and staff
utilization.
66

The guide for It1;erViews wit'Olie'scienCe:teachers was constructed
around'thejopoWing generaiH.s.soes'
the*teachersydpinions of the facilities available;
2 the teachers' opinions of aspects of the facilitiesOr their deployMentwhich affett science teaching,-
3 'h'e teaChers,purposesin science teaching in relationto. experimental work,
:4 the adequacy of-the facilities:aVailable.for'preparationandHstildy:;,.and'[
some
. ,
the importance of good facilitieS for satisfaction in`teaching science;
.The 'guide for .intervieWs.'t,vith the 'science co- ordinators
extensions of.titSejtsoes' to More. general concerns:
.,
the suitability P.f.:the facilities'available for.
Sclepcpclepartmentr,the
2 the'degre0o which the Odilable.faCilitieS could befully utili.ied,
the priority given to particular areas in using facilities,S,
centred upon
4 ;.the science curricula of the sChoOL, their organization,':type and usage
, '
5 the.organizationof,the science. department and:the morale ofits members, and
.
6 extra -scienCe,.adilvities available:for studentsschoO1-...
in the
The use .of: the interviett4eS:did.not.preVent specific concerns of. .
individuals being:discosse&-The9 mereIrprevided a base of common ground
between the interviews. In additiptirtheSt-istoes prOVided a guide to the
bbservationS,made:in the Schoolarid,cIasSrOoMs% A., particularly detailed
analysis of,the schOols aCtbal*faciliiies was made;
The Student Questionnaire
In developing the student questionnaire it was 'decided to focus attention upon'
4.
Year 9 science teaching. This decision Was baSed upon a Consideration o
previotts studies, by Owen (1'975) and Wilson (1975). It.was inferred frpm these
studies.that:facilities had a greater effect on jouniorkSience teaching than
addition such a choice was Alc-ely to achieve maximum
to science Classes The surveY
was greater vdriationin the' quality of
Year 7 was not Part.of theSecondar
d Year 10 studentS in some States were involved_ .
that in Year 1 and 12. In
variation in the facilities available
suggeSted, that in Years 7 to 10 there
'.facilities used than in Years 11 and 12.
school system in three States.a
'6 7

- .
rin assessm@nt and moderation. procedures. Year 8had the disadvantage of
/ being the first year of secondary sctrooy:in threelStateswhile Year 914d.the.
v.
56. 1
.
advantage of containing most 14 year-olestudents about whom other science
data existed.
.The views of students were considered to be of greatest' potential Value
-
in providinginforMation:,aboUt ttib, Main possible effects of science
. ../
. .
the science classroom environment or .
classmomconditionS as-theyinfluente learning; and
. .
the nature of the. science-teaching and,learning process or
the type of activities receiving; greaiest.eMphais jd
%..
science classes:.
.
I. .
. .
:
.
/..
.
--,
The., sa-two dimensionscorrespond.to the two approaches to the assessment. of tie:.
. ,
..,clasSroOm learningenviryntentWhich weres4dentified
by Randhawa and Fu (1273)::,
I Ons approach. asN., ba s ed upo n '.st uaAe n.t.p cep tao ns .0 1
their classroom environment'.:
facilities:
°-thrd4gh such instruments, as
ths.Learning EnvironmentInventory (Anderson and, -,,..:,',.
:
WalbeVg, 1974) while the othei/- ncentrated.pn thaittiVities. which Charaeidr.-:y .
ized the .class through a' C`1 ss Activities Questionnaire. (Steele, House,Ahd. ..a.
..
.-:it. it . :. ,
Kerins; 19.71). In the pr/sent study.cach.qf these.two dimensions formed
sep4rate sections of the'questionnaite:Which was developed_
TWScience Classroopf Environment'
ifIhe.stated objectres of the Commohwealth-Siandards Committee
concerned bOth
the environment in :which -Sei.encewas:studiedand the activities employedAn % -/-./
teachingscienst. Three concepts 'seemed to,be importapt for the environment'-. /
.te.::.
.., of sCiOnce roo,116.: involvement,organization and stimulation:th-rough variet.,2
/
i '' i..
-:. / . k
'\.
'"The iohcept.pfq-nvolvementoccursmany tunes in document's concerned-.with,
the CommitieeS deliberations. New science curricula which emerged during theo.
sixties yere to be accommodated in thone*.science.rooms..,,SuCh'curricUla we, '.
.......
seen asiemphasizinglearniiig-through":What might be called guideddiScoxTerY:, :7
,.(CommonwdalthfAustrafia,-- 1976 :-15rwith pupilS.acti'vely involved- in\doing -,
.. i '.:. .
.
.
. .
.'experimeri'ts, participatingin,disous,Sions, and contributig to
..
Orations. Even when the tather4eMonstratdd an aspect of science, the enyiron-
to'be such.asaflow'CVery.tudent to 'see Clearly and-beinv ve4
'-'!:(CoMmonwealthof Australia, 1973'11) In. comments made about one of the best
science rooms designed by the CoMMitee,-one Member referrscLtC-lan-arr ngement
Which achievAl.
amore intimate setting._ with the likelihood Ofbetter._
pupi-l-pupil and pupil- teacher disOussion,/

.57.
rn
Smith (1967 S) deplored-tte lack Ofpupil practical work '.in the first two
years of secondary school wherepracticalwork:consisted almost:entirely. of
demenst4ations by the teacher with few exiittiments perfoimed by4the,pupil.
During.the sixties the curricula 'used in science changed so ihat'pupils were
more actively involved in science learning,,:,, :fhe-Standqds Committee-Wiiiied
..to accommodate, and facilitate tb.is dtwelopment::. _
t Another concern of the Commonwealth Stkndards CoMmitteeowas organiiatiomRooms should be well organised Places-of work where students cbtad. conduct
.
experiments" 't 4he necessary equipment; servi.s a workingbenches' available and."
conveniently located. So that,ihe ieaChei [could]effective-supervision over the activities of the
The.desig"brochure (CdmmonAalth of AustraIia,.:197$)
exercise.&ass. (Smith; 1975 : 1
produced by the'.
Standards'Committee gave considerable attention to th spacelreqUirement-a,room'for orderly working; theHstatige and distribution, arrangement,' anc17: he
'-conditions which would be- helpful to good management..
. The third concern of the tommittee was that science lessons shouIcrte
stimulating through the variety of Methods used.. Stimulation was seen as
coming through:both.provisidn for varied and flekible instruction and ppo7
visiOn,of.a'wide vvariety. of stimulating 'Materials in the room: In its final
report the Committee stated that a science room shoulbe suitable for allkinds Of activity including inter demenstrations, pupil experimeDts,
group discussions,%films, or a mixture of activities at the One time.(Commen7
wealth of AuStrali,a;. 1976 :"16). Individual members of ;the committee stressed
the satheyoint- One member argued for the need to'provide variety:::in teaching
through. , .
arlaboratory.....designedtoallow complete. flexibility in thetibe ofActiyity to be followed at any given time-in. the onelesson. .,(Smith, 1967 : 6)
Anothr,.member of the CommitteejField, 1974 : 35) in 'commenting on two of
the best:examples of laboratories built.to 'plans specifically drew 4i;,
attention to the different. possible arrangements'ofjorni.Ore to suit theteaching Method. Stimulation through a lz!idevarietx.of teaching
was also important. One of the Committee expressed asqii.ieQ;bf theehnes
of the materials to be .availab10.ft a science room.
It .should.be exciting place' where interesting,modls,'chartsand books, rock and Minerals, plant'and animal,spcimens andscience apparatus are displayed on the walls o&in display IN!
cabinets. (Smith; 1967 : ' Ai

fr... .1r,6Figiire 3.1 .A SCience-R6omA5141A,Undei
the Science facilities Program.
.
..
. .
9.
Figure-3.2. An Activity-Based Science LeSson'-
?'p
44,1,

ji
As further evidence of desire to iiroVide for varied teaching the Common-wealth Standard Committee had agreed on the need for such ancillary facilitiesas 'project rooms' and 'growing rooms'.8 (Commonwealth of Australia, 1976 : i3)..4
While a nuMber-of instruments haVe been developed to assess students'views:6T their classroom environment, most were cOnSidexed inappropriate forthis study. Such instruments as the Learning Environment Inventory (Walberg,
. ,
1969',' 1975)7 the Classroom.Climate Questionnaire (Walberg and Anderson, 1968)
rand the Science Classroom Inventory (Northfield, 1976). were more orientatedto-the social than the physical environment. Thee inventories were based onafheoreiical podel.of the' class as a social system enunciated by Getzels and.Thelen (1960). ,COnseqUentlY scales measuring s-tOent views of'!iheir science4room environment were developed.
Concepts similar to those mentioned previously existed in studies of
teachersharacteristios,teacher behaviour and environmental press. In a,study of some six thousand teachers Ryans 0960) identrfie&three patterns ofteacher behaviour.
Pattern X '- warm, understanding, friendly versusalopf, egocentric, restricted behavior.
Pattern'Y repons. le businesslike, systematic,.versu evasive, unplanned, slipshod, teacherbehav or.
Pattern Z stith latipg, imaginative,.surgent, versusdull .routine, teacher behaviOr.
. (Ryans, 1960: 582)
,. '...-."' , - attern-Y.and Pattern a, seemed to be prialogous to two of the conceptslty
:.discerned in the work of. the Science- Facill.ties 'Cowittee. . In a review.
w.,..r,
,investigating teaching bekiNfriobr and student achievement Rosenshine (1974)4
'sawRyans' Pattern Y .as:overlapping with both:goal:difected behaviour and...
. .prga ,ed behaviour. Tfierfis miperato rind consistent association Of these-:,...:. ...t
t..).riables l'ith higherltitden- ach4evement(Roenshine, 1971 : 100).I,! 1
Keeves (1971*: 254). identified a'process variable,. which was called 'Thee'rai1%n Work Habits inc 0rdc?'`ar which was similar to Attern Y. -*
4/ .
e./
i.
41'
Pattern. Z was very similar to the.classroom process variable 9 which`Anthonyto(1967).called Stimulation.
Antbdny's.measure of stimulation. included-...
assessing variety in materials,fechnigies::n,d..feedback toStuderifs.
$' At the direCtion of the Minister funds were not made available forthese ancillary.fifacflitie#. -- .
. i::- . . .
'' 9; This was.defid& as 'a 'Ioriacess or foreein- the classroom Which.is.67- ilcOnsiderediessentia1:- for optimum educational achieveilient' (Anthony,1967:167).
. 7/.. ..
4.. \14. tii
1,

'Rosenshine (1971) included these two variables in the categOry4 studies
using fleXible of varied behavkour. Keeves (1971) also used avariable called
'stimUlation for iearnih' which incorporatedmeasures of the- variety of
methods used by teachers in cl'agSrooms.
Ryans! (1960) Pattern X did not quitecorrespond to the notion of
involvement which was 'being sought. ,A much clOser analogue was the second
process. variable. which Anthony (1967) related to achievement: Self Involve-
.
Ment Opportunities.-Keeves (1971) included two process -variables milar to
this: Affiliation with ClaSs and Interattion with Students. Wh. e they have
,sometMng in common with both Anthony's (1967) Self Involvement portunty
and Ryans (1960). Pattern X. they do not correspond directly to the notion of
involvement being studied.
Hence, the three conceptsdiscerned in the stated and implied intentions
riod-liare,CommonwealthStandardsPCommittee when
designing rooms were also found
in studies of teacher behaviour and classroomTrocesseS:The science room
environment secti,on of the questionnaire was structured- around the.following
three major concepts.
I InvolveMent : An analogue of Anthony's (1967) selfinvilvement
opportunities, as found in a classroom process study:
0 Organization : An environmentalanalogue:of Ryans' (1960)
Pattern Y (businesslikebehaviour)" which was intended as a
measure of-the orderliness and tonvenienceMf the workplace,
An'having space to work and beihg'able to obtainc:the necessary
.apparatus-and services when required.
V Stimulation through Variety : An. environmental analogue of Ryans'
(1960) Pattern Z but refined in the manner suggested by Anthony
(1967) and Keeves- (1971) to mean variety, in materials and
techniques of teaching.
Activities in Learning Science
The principal justificati* forbuilding.laboratuies in schools mUSt. surely .
be that students are thereby able to conductexperiments,. It was therefore
considered desirable to ascertain whether students enjoying better facilities
than their peers in other sChOols would report different emphases in the
science teaching which they experienced.. During the sixtias and seventies, ,*
increased-importance was attaChed,io providing, students With'first hand.
.:experience of the phenomena.studied in science, and to using activitieswhith
-incorpo*.ated:elements of original,investigation.There is little doubt that-
-first hand experience and original experience have become eruczlil Lemenvg". .
modern science curricula (Lee Dow, -1971; Ramsay and 9we, 190; Ramsay; 1972).
72

61.-
Science rooms built under the aegis. of the Australian Science Facilities
Program were, intended to accg5modate and foster these teaching methods. This
. was evident in articles by Fish (1974) and Betjeman (1974) who yere"involved
in science room design in State systems of education. The intentions of the
Commonwealth Standards Committee were also clear. Standards were set so that
schools would have sufficient science rooms of suitable design to allow student
experimental work, as appropriate,.in any science 1,esson.
In many of the 'syllabuses-being introduced indifferent Australian states, the laboratory isassuming a new role. The teaching approaclr'inthe past has tended to be dogmatic, with thelaboratory being used merely to reinforce workdone. in the classroom and.to develop experimentaltechniques. Often it has not been used:ai all forthe junior classes. The laboratory has now,becomea primary plate of learning where the'studentsmake,observations and perform experiments for whichthe -results are'not kindwn in advance, and.thusexperience adventure in the discoveries of.science.(Commonwealth of,..Australia, 1973.: 4) _
It was stated by at least one member, of the Committee that shortages of
science rooms, apparatus and laboratory staff were principal impediments to
the development of labOtatory and activity -based science teaching (Smith,196
Through the Science Facilities Program it was intended that at least the-fir
two of these barriers would be reduced.
The development of instruments through which students can report. up
the emphaSes in the science teaching they experience has proved teasingly
-.difficult. The lEA 'Description of.Sciphce Teaching' scales (Comber and
Keeves, 1973) and further modifications OfYthem by Cokb4ati .(1974) and by
Kelly (1976) were considered for possible use in this study.
One of the two IEA.scales was concerned with the emphasis upon, -;, . 1t44'
'laboratory work' as opposed to 'textbook learning'. The secondSattemped to
.assess the type of laboratory work: structured as opposed to unstructured.
Ih the lEA study the use of responses to th8 scales had been distorted 1).y.a
priNting error in the instructions given to students.' As a result the
reliabilitigs'wefe.low (Pea'ker, 1975:,195).
Coihead and Whitfield (1975) challenged the theoretical.content of these .
scales'an4 argued that the assumption. that more practicalTwork meet' less
tektbook use and the belief.that. more unstructured experithental.work implied
les'structured experimental work were unsound. From these considerations
Cokhead .(19.74) developecrand used a modified fOrmc9f the IEA questionnaire.
.73

62.
,
Another approach to Mo4fying the IEA scales was that psed.by Kelly ,(,1976)..
In this study the data collected in 1970 was used A new factor..anal'ySis'was'
conducted and the face validity of each item examined. As a result two scales.
were proposed. One was described as 'learning science through exploration'
while the other was, called 'science teaching by appeal.to,aUthotitr. .
The results of a trial questionnaire in Victorian,schoola. priOt.t0.the
main study suggested that the most promising approach was t6:us6-the,Items
which had been used in-the initial IEA study.. Two .changes mere.Made:lo:.the...
fotmat. A five point, -rather than a three point, rZ',sponserkey.was..used. . in :
addition to this, the instructions were modified so that a More:specifitmean-,..
ing was given toeach of the five categories. There was inSuf4ciek:time
try, this form prior to the. main study.. It.waS hoped thatthe%Pattern:mhiCh.-..,
Kelly (1976) had foUnd in 1970 data would still be valid.';.
-6
Th three f to whic emerged from the analysis of the main study-
% .
were of irect re vance to t Seib Faci itiea Project.. They teseMbled'.
the concepts of l..oratory work, enquiry rear g, and texthOokjearning.
around which.the or IEA scales were formed but did .not:assUme, the same
bipolarity. Scales which were able to'be formed from theserpe faCtorS. ,.. ,
had sufficiently good reliabilities to be used as.meaSures'of,,c1ass actilnty,,-
in science. The interpretation of ,the factors and henCe th'aretiliutes
assumed to be measured by the scales are listed as foifOWs.: '. -''.:.
(
'..7: '- ,;. .... .'44
E Encouragement to Activity and Exploration .:,.the,extenttw T.
which students are given encouragement to partici-patt.16
active science learning in 'and outside school..,
-_Textual :the degtee.ro Which science teaclqngj.i. .1.'
based upo i textbooks:,
-Practicalthe,..-emphasijs uptin. practicill work an.-s6.enee
Characteristics' the Student QuestionnOire'
In its final:fem., the,. student quesiennakte.wda.aaminl-St&ed to 41mi:1St 3A0
Year 9 Students in.-29 Australian School$,....A-,Cdpy. of the questionnaire,.
is included as Appendix E. Tile:Vlection Of SChobls4eboen.:06.dpuSly
tAIliSeuSsec.. -Within each school hree or. pu6Year 9 scienc'cIasses:kere chosgl:
at_. random' that a total q Ut,100 StUdents7from 64ch'SchOol.Wereinclude'd.IB
Choosing.classes seemed imp. tAtit-':ie a,caus mony,of stUdied,-
were, possibly more charaCt6"rTs't0Of:p1.;;Sesil4anef4'.*1.Als',I,ThilehOimodO.
it possible to use the cl. .
vS.
.
Yea. .
.
4;701.,
r.

Table 3.3
63.
Factor' Analysis ,of 'Student ,Questionnairer.
Views of acience Classrooms .:(Section A)
Item: Factor. Loadings Itet, Allocation
-s
Notes Only )gitpatei. than.o: are recbrded and deiMal pointshave been dropWd. 'if '
.,*fieie.'sit:hi..WCtli ,a. 1e.ddirik legs: tYian. 0.30 were included irris,tale.the.%1Oidilt..lida;laeerhownHin,pareptheses.
'.ItIVOlv.eMOTI,t.,: .. ,,:. - .,
0 ..:.-, ,-(Tigaiii:zati
... ,
' f-,.§titi0:4ti611 ztii.i,ty .._-,,',,
.- .,....t.
'Before :exafiini.rig the result's,"1 b a Ile augh. he questionnaife its'structure 'was' .fa401;:,ialyst.s of cVion A, dedling with theclassroom enyifeemeri, cOrifirmed the basia ;-atruct e found in the trials.thr'ed-facter solut7on extxacled..facfoors'coha'ireot with the original inter-,
(0) and imu 1 at ion thrOughVariety. 'Four .items 4etc. ;i6 re-ctecf was possible to form a seven-.
iteih aCate to measure each df theThypdthes6,zed V.orpects of the science room
erivireriment. -
tt* the aespits of ..ihe:

64.
Table 3.4 Factor Analysis of Student Questionnaire
Views of Science Classrooms (Section B)
e
Item Factor Loadings
o
Item Allocationb,
T P Rejected
26'
27 54,
28' '44 .
29 50
30' 35
312 32 .' 58
3$ 45
34 .4(35.
3637 42
38.
39 .39
40 4341 39
42' 34
4344 44
45 48
56.
42
36
59
46 55
0
0
00
0
0
o
0
0
0
PtfcentVariance 15:0 '.*,10.b 9.7
Notes: a Only oadings greater than 0.30 are recorded and dbciMal points
have n dfopped.
"b %E = ncouragOtnt to ExploreT 7 Textuaj::P 7'.PrOctical'
A factor unalysi-s of responses to Section.B dealing with activities in
learning science revealed the presence of three factors: -Encouragement to
Explore (E), Textual.(T), and,Practical.(P). The results of the factor
analysis are shownidTablc3.4.' The scales formed were not completely
independent'of-each .other. Two items, number's 34 and 38, loaded-on more than
one factor.' Since, the naturc'of the itemssuggested that this was a logical
outcome the scales were constructed with each:of these items included in two
scales.

65.
Table 3.5' Scale Statistics for.the Student Questionnaire
Views of Science Classrooms
Scale T
0umber.of Items
Between Students -:(11= 2991)
7 6
Reliability (CoefficieniHa) 0.59 Q.75 0.55 0.64 0.66 0.66
Mean 19.6 23.8 19.0 24.1 17.7 18.8 .
Standard Deviation . 4.7 5.7 4.6 5.3 4.8' 4.4
Between Classes (N = 1V.5i
Reliability (Coefficient a) 0.82 0.89 0.68 0.73. 0.84 0.85
Mean 19.5 23.6 18.9 24.3 17.7 19.0*
Standard Deviation 2.3 3.3 2.6 2.6 3.3 3.1
Notes = Involvement0 Organiiation.V = Stimulation through VarietyE`= tncoUragement to EXploreT = TextualP = Practical
Reliabilities10
were Calculated or each scale.in two Ways.
the values using. the student responses were calculated. .SeCondly, class means
for eich.iteM were cempUied for each of the 104 classes and the'reliability
of each scaleusing class means Was'Calculateth
important statistics ar&.,presenied.in_Table 3.5.
satisfactory for researCh purpbses, 11 especially
students were the units of analysis. :A listing of
Reliabilities and other
The reliabilities were quite
Since classes rather than
the items forming each
scale is presented in Appendix F.
Data. Management
The student questionnaire was administered to intact classes. AvSPSS file
of student responses to the questionnaire was built and an examination made
of the frequency,diStri tiOns12
for each item. The.student responses were
10 TheSPSS program RELIABILITY was used (Nie et al., 1975).
Z1 1Nunally (1967-: 26).suggests that for basic research reliabilities.of. 0.6 to 0.8-are adequate.
12 Using the program FREQUENCIES (Nie et al, 1975.: 194)

then aggregated3 .tO give a file of, class mean
responSes to which was added
to the facility Variables. from the original survey data'apd facility variables
from observations during the school visits. The. .facility :variables weft-... . .
. . .
bothschool' variables
-
and.class variables. Appendix G contains a list of the.
.
Variables related to facilities which were added to the file. .,
Systemic Effects andAdMinistration.
One of the purposes of the project as outlined in Chapter Two was to,detect
system wide effects of the Science Facilities. Project and to study some,:.
features of its administration. To this end examinations of:official reco-.Z4;
a series of interviews and the.analysis-of some other data.were.used.
The files'Of the CommonwealthDepartment'Of Education were made available,
for this 6r ect. In addition to providing information about pOlicy develop-.
.11n :
ment these're11
Ords contain detailed records'of the administration of the
Program. In each State Education Department access to:records relating to
. the administration of.ihe Science Facilities;PrograM' wasobtained. 'A ndmber
of interviews was held with people who could provide:details about the function-
ing of the Program at:bothState-and,CommonWealth level. Some additionaldata
gathered during the Program by Cohen15 werealso.osed. These data resulted
from an unpublished surveyconducted for the Science Teachers Association of
-Victoria (STAN). .This'survey was of teachers' redotions to the Science.
FacilitiessPropam in thaf State, and tothe'iteMS of apparatus which had-
.been supplied. Survey data collected by thet56Menwealth Department of
-'-Education-was also,used. These data were collected from:all non7government
schoOls in 1964, 1967 and 19715. It included detailed information abOut the
science facilities available in schools. The 1970 survey also included the
opinions of school Principals about the effects.of,he Science Facilities Program.
-
13 Using the program AGGREGATE.(Nieet al, 1975 : 20)::,
14 Using,the program ADD VARIABLES (Nie et al, 1975 : 151)
15 D. Cohen 'conducted.'a survey for STAV in 1967; Seience teachers4.
were asked ,about their, reactions to aspects of-the Science
Facilities. Program. Data from the survey were made available
to the Schools Commission forthis project.
..

CHAPTER FOUR
SYSTEMIC FEATURESOF THE SCIENCE FACILITIES PROtRAM-
.
Geneal Organization,
Legislative Provision
The legislation which enabled as.sistance to be provided for school. science
'facilities was encompassed in five Acts of the Commonwealth Parliament.
While there; existed a common intention in each there were some variations,
which reflectted the way in which the'Program was developing. All were
deVoid ofddtail concerning hOw'aSistance was to be. applied;
The iaitial'Actovered die:kinancial year &mill July 1964: Contained
Withia: the one'Sill was provision for assistance to science facilities and
technical training.. On subsequent occasions provision for assistance to
science facilities.wasmade in separate-,legislation from that for technical
training.% Smart'S (1975) interpretation of this feature of th.e 1964 At
was that it allowed the government to mollify. critics of the aid given:to';
non - government schools. Of the combined sum-the proportion given tosuch_.
schools could be made twappear small. In subsequent yeaxeven-when-the
Acts were separate, the proportion of total Commonwealth funds given:to
noft-goVernMent schools was quoted.. Of the purpose andmtaps of apPliCatioP
the Act specified tittle; it merely stated the total amount of money to be
allocated to each State without any di,i.Tision between schocasystemsiapd.
briefly stated the purpose for whicW.the money was to be applied..
GWPnyment.of an amount to a State under this1.'§erZtion is subject to the condition that theamount_ will be applied by the State;.asapproved by the Mihister,,for purposes inConnection with laboratories and equipment,for'Use in the teaching of science in schoolsat thasecondary level of education.
(Commonwealth. of AustraliacPP1964)
0
1 The5tatestrants (Science1964, A-ct i\lo,50 of. 1964.
Laboratories and 'Technical Training
7,
Act
_...793

Subsequent Acts in 1.9,652 and 1968. were similaily.brief. In two re-
Spectsthey differed from the initial legislation. 'Pirstly,they were
specifically sciencelabOratoriesAd;sand did not encompass the field of 'AA
tecifriical.training.SeCondly,theycovered'triennia ra \her than a:single
year., The latter development was important in that-it.enabled schools and
Statq.ZduCatiqn Departments.toplan more effectively. It is interesting to
note that Commonwealth Standard's Committee recommended to. the Minister in
1965'that a continuing three year program be implemented (CDE., File
.64/8924). This would have been an advantage to schools and systems in that
they:wou4d have been able -to plan three years ahead. The Act of 19674.:
altered the schedUle limiting payments to States for the remainder of the
.1965-68 triennium enabling payments.to non-government schools-tolbe doubled.:
SubsequentlY the-1968 and 19.71 Actsincorporated the:double rate to non-
government schools. Because the .quadrennium from 1 July 1971 was to conclude
the Program,the Act which was ,passed byyarliament in 1971 differed from
previous legislation., Rather more detail6 about.the way funds.were to be
allocated-was provided. The limit. to be provided for Government, Catholic.
and In pendent schools in each State was specified in the.schedule'..
.This wa because:allocations aMong.the :total available for non-goveinment
schools were determined according to ncedinown te.theCommonweaLth7govern-,
ment at:that time. Previously the allocationS were;determined by tilt Federal,
Minister on the basis of demographic statistics. The Act even provided that the
amounts specified for'Catholic and lndependent schoolS..00nld be Variedby
regulation, provided that thetotal-non-government allocation was unaltered,
and the iotal.sum for all schools remained the same,,
The Allocation of Funds
'.':tifeliough the legislation covering the Period om1964. to 1971 presented
tlic
.
riOCations to each State,the primary division of funds_was.allways be,
::.c.OVernment and non- government schciols. The basis for allocating funds
The States Grants,(Science-Laboratories) Act 1965; ACt No.40 of 1965.
The States Grants tScienceLaboratories) Act 1968, Act No.12 of 1968.,'
4 The States Grants(SciencLaboratories) Act'.1967, Act No 9 of 1967.
The.States Grants '(Science taborator,ies) Act 19.71, Act No.65'of 1971.
Smart (1975 182) suggests that such detail was omitted from the early.
legislation to avoid a. possibie.cohstitutional,challenge. .

Total Isis
Before
1. The allocation between govermett and
oomovernment schools was based OA total
condary ',1oitplly, a per capita
after 1961 the basis.changed' to
11.in:favour of oiloveriontscheels.
2. Until 1911 the allocation betvieon states
made in propOrtion to gross population.
After 1911 for goverment schools the basis
be that of sMondary 0116110%
3 The basis,o1 allocations to Schools iithin
State school systems varied,
fOr nomoverment schools each state
the sMovallable w s divided:betileencatholic
and (101}'.C30011(211001SAttOrdiq to'SChidi
enrolmonts.
Ihe sup available was disbursed aeccillOg
to recermendatien of !tate'PriorIty C ittots
b.. Biter 1911 the totalim for non! :.
Too AS distributed,directly
to.schnols accordiog,to reeds.ltoOwn' to pdst
that tipAllocation
leten '
igurb 4,1 'Al location of Funds" under Science Prozarn,
aI

to schools is summarized in Figure 4.1.
General-Of Education7 'the initial basis of the allocation was establish0:-
qi
In a mem,randum to Direetors-
' The total amount was flys0i.ded between -government and non-government,-.
schools on the basis 'ofI
total se.eOridary enrolments. That portion available.
to goVernment schoolswastthen:di.Vided,betWOen States according to their.
gross population. State authorities:then appliecitheir-allocation.to schools
..as their own priorities'determihed...'tunds for non-government schools.were-.
similarly partitioned between States in :proportion,to grosS population.
rie,ch'itate allocations were. determined for Catholic andIndependeni4
e!!Iw s' on. the basis of the secondary enrolments in. each: Within the limit's.
Letshe Commonwealth applied fUnds to- non - government schools using
furiiiShedly the Commonwealth Standards .0 mittees and
vice, on priorities Which came.from te Advisory'COmMittees.a.
-. There were anoffialiesin this system- hich led to differences- in the per.
pupil.allocation betweengrObps oschoors- These anomalies arose from :
- .
(a) variations between States in the age structure of the 4'
population,.
(b) variations 'in the. relative proportion of the school
'population in nop-governme07 schools, anal.
(c).
4
itfferences in the'Year.at-whIch secondary school
commenced. .--
The problems associated With.such anomalies were raised by the Squth
Australian Government .which argued that it would be better to first. divide
_
funds between States ona'population basis and then between school syStems_.e,
within each State- (CD8 Fi1e'64/1086). 314art (1975 : 211) records that thef
Tasmanian. Government, was dissatisfied wig& the basis for allocation of funds.
As. Tasmania had 3:7 percent of the Australian- school populati' but only 3.4
percent of the t tal population they argued for an allocation based on enrol-
meats,.- It is p Bible that constitutionaLrestActionSmay.have prevented. m
the bosing of all cations. entirely .on%school enrolments. ./
''"
.
The system'of allocating funds 41617Ks modified as the4rogram:developed: How-.-.
'.ever, the main. modification had little to de .mith.tile anomalies above. From..
-.1967 onwards the assistance per s;udent'availabletO non-government: Schools was,.
%%!..
'double :that for goecrIntschools: YerriVle.explanation,ma,s given for°
.Wwc, decision savethe'defence, cited in Cha tertwo;that government schools.
*\: 'enjoyed other forms of,assistance from theCOMmOnwealth government. 'Smart'
The:74iemoranda to the'DireetoYs-General Were identical though they setreached 'Ir -
out tie.CommonWealth°s impression q, unarstaiding w.*4 each,
'Minister. (CDE, File 64n17).
1
et

°
,S
(1975) proposed the plausible.interprepation that the decision Was'a result.of an earlier. government _commitment: The government had undertaken- to.
meet eventually the full reasonable cost of-those laboratories which had
.been- partly assisted iiridr.the Science Facilities Program. In some groups
olaschools the policy followed had resulted in prbviding some- assistance to as
mw projects as possible. Consequently; the Commonwealth wis.comitted to
meet the residual cost of many ventures. In a letter to non-goyepment. .
schools, in JanuatY,A965; the Minister had\Made clear the iovernmines.
.
intention.
4
I should -also. reiterate that, although a State Advisory.Committee may perhaps recommend the payTent of partonly of the cost of a particular.projectin any oneyear; it is proposed ultimatelyrIlat the whole costwill be met provided that the amount appears reason-able-in the light of clPrrent building costs. Exactlywhen'a school will receive payment will depend uponthe priorities set up' by the State Committee.
(Gorton, 1965 :.-2)
. At the W. 1965 a minute from the 'minister was tabled at a
CoMmonwealth Standards`Cvmmittee meeting. It,- contained an expliCA indic-
ation that the government was concerned to know its degree of commitment.
e
The next-urgent, step;equired in the implementationof the presentscheMe is to assess the liability ofthe Commonwealthoin reSpect.of the laboratories sofar built so that i've know where we stand with Moreprecision.,
(CDE, File 65/10157)_ 'N.<
To clear thiS commitment it was necessary to increase the .rate bf
assistance. In addition the.ComMonwcalth had-:Suggested:that, provided
money was available ancrthd Program Continued; it would meet the, cost of
some previougkvOnfunded'projettS (Smart, 19.75 : 259). To qualify for such
assistance the 1COMS' had, to haire been built to appmiverS,tandards, and within° the assessed needs of the school. Thd existence of such unfun4ed. projects may
have provided a-further incentive to double thcassistance.to non-goveynmentschools.
.An unfortunate effect ofthis deciSion0%!as that it resultctin an
exacerbation of the differences between government. and,non-,government schools.
No similar increase in the rate of filnding:was, made to gouernment,athools.re

The undertaking to.9eet the fullreasonable cost of a facility had two
4
important benefits for non-government sch6oIs. It enabled them to plan the
deVelopment of their science facilitieS within their' assessed needs: A,4Ong
term program Could be plannedin the knowledge that funds probably would be .
available eventually. It is likely that this obviatedAhe need for piece-
meal additions to many schools. SecOndly,.it undoubtedlystimulated schools
to use their ownresources to preitide science facilities
immediately at h...
time whenthe'Commonwealth could not finance these.
However, even among non-
.government schools the concomitant reswas-that the situation Could be
more rapidly exploited by. hose.Apn-go ernmentschools which had the:capacity
to-borrow and build.8
SuchOn advantage wound have been.shortterm had the:.
I
Program mef all the If8ad's.,of non-governMents.chz.15..bythe.time it concluded.
0E.
In 1971'twOmodrifii'ations were made to the system of alyating funds.
One applied to non-a0 wh oment schools ile the her cOricernedSgoVernMent
\
schools.It,hacibeen,i)ntended to
base funding to sc of systems for the
final quadrehnium on the 'needs'whichwere known to exist.
It is our intention in the txtensi4on of the scheme
to revise the. basis of allocationof nts among.
.
States and among groups pf Government schbols,
Roman Catholic Independent schools .and 3ndependent.
`schoolsother-than.Roman Catholic,
b that the -'
.0-ants availablewill be 'in relatio to Outftanding
needs, which we expect to .vary consi erably at that:
time.' In addition to com leting the.present-progra
we will also seekko cont nue to make grants toward
new needs that Wiil°orise from time to time.
t
(Fraser, CPD, l969.:250-
Needs, in this:Program, referred to the-atience of. a-necessary facility.
rather than the absence.: of, or the inability to Obtain; fundS ith to
provide the facility (CDE;4fle68/2764'(1). . For non-govern
theCommonwealth-waswejl:placed to plan oh the basis of needs. Visits to
schools by member .of th606pmonwealth'StaridardsCOMmittee, and dath from
questionnaireS,hadjilfnI,She*ihe g6vornMentwith
detailed inf6rmation
ab6ut school neads.%..Thd:MifsTsterwasVobliged to provide Parliament with
details of the assistancegiven to each non-government
Yschool.
mart (19'75 : 2
enable. the rate
P
interprets: this as queue jumping. However,,it)did
building to'exceed the rate of supply of funds..

73.
Very little information was known by the Commonwealth about'theneeds of
goVernment schools. The Minister'had only to provide Parliament.wiib'the total
amount spent in each State and with the names of schools receiving sbine as§isf=.A
ance.9 Autonomy of the States to spend money on education had meant that no
cumulative records.of facilities in government schools existed.in the'1 CoMmon-
wealth files. State authorities also adopted.different criteria for/ using the
Money allotted to them and: more iMportantly, they used differaweAkhdards for
assessing.the adequacy of science:facilities. At the request of theNrhister
the Commonwealth Department of Education attempted to determine the Yillgttrma--
tion needed from State gdvernments for planning on the basis, of'needs:(CDE,
File 68/2764). In October 1968 the Commonwealth Minister wrote tb,aIl State. .
Miiisters informing them that officers of the department would be.sell4ng:,
information abbut the States needs, for science facilities beyond'1971(CDE,
File 68/2764). The eventual request was for rather less informatIon'than.. -
had been first proposed. as these was some evidence,of a reluctatice amono
. State authorities to provide more information thadrwas strictly, nece'asark.-
'The lgtter seeking information was sent in DeceMb,er.J9694or reply by
February 1970. 10 Unfortunately the data provided were Rot sufficient for f.4/:
planning on a needs basis. Estimates varied considerably §s a result ofOr
ifferent-criteria of satisfactory facilities ibeingtapplied, dispaTate build
ing costs and varied initial Conditions. In any,case ''there was pote*ial
for injustice in the proposed procedure The disparity the StA4 4depended pdr ly on the extent to which Statefiinds had been used to supplement
Commonwealth funds. y future funding was on the .basis of Olisting needs the
those States which had done least to shplemeht.thciScience Facilities Pitgram'
would o tain, a greater share.4
Any departur43bfrom a perkapita4dllocationd
Would have attracted, criticism not.ontiin Federal Parliament bet from the
States Which received less assistance under such a procedure.12 AS:a resulta ,
,a
. 47 0,4
9 This was a totally2useless pie ce of lnformaTion as0t normally includedevery school in -the state. ,
10 It is possibly indicatiVe of tensions between State and 'Commonwealth'.authorities that two replies were not received until after April.
11 A note on the file indicates that the inforAption was in. sortie Cases,. re,luciantly given and that its reliability marled. (CDE, File' 68/276401),
12 For example, Reynolds (1971 .::2827) criticized the allocation Oh the basisof per pupil difference. While_ft valid compariSon between gkl governmentand non-goyernment schools it should not have'been applied to comparriSonsbqtween non2goverhment schools in each State becausein that case theallocations were b sad on assessed needs.
,
8 61 )4.7

74.
of these considerations the decisionwas...taken to allocate only the noh-
.0Sy
government schools portion of the funds according to ki-lewh' needs. _Therotal
amount tobe spent on non-government schools was d >terMined from an asOSs-
dent ma'ie of all needs known to exist at that 'time.
The total to be divided among governMent schools was calcUlated after
that for non-government schools was determined: It was decided to-maintain
the existing. propOrtfonte distribution' betWeen 'government and. non-government
scheoA under which the former received half the per pupil allocation of the
latter. isevidence that the Minister raised the possibility of'chapg- ..0;.:
ing this policy so tHat the per pupil allocations became equal (CDE,'File .. -,
.: ' 'F,,
68/2764(4)); It was Ergued that this ought to be achieved by increaSing rhe-
total rather. than by 'reducing the amount for non - government schial"WhoSe..
..
needs had been ac,curately assessed The estimate of needs pro
DepartMents sUggested that nearly $29 million was.required but,
There
!y State
Tang that, -
the States continued:to ..contribute. 30 pereent; the Commonweairh.n
13.,. °4
PTovidesenly:$20 million.The proposed fomula guaranteed the gov
schools some $26 million: Hone° there was no strong claim for changi
arrangement (PE, File 68/2764(4).)'. In retrospect it appears, that s,
underestimated their needs and'ia the criteria on which they asse.
needs were generally not so sayere as, those applied to. non-governmenr/I,,
An additional complication was' therrapid escalation of buildihg plAt
seventies. The continuation of the 0.:30 ratio of Commonwealth -to State.'- ,
.,fuilds also seems inappropriate. That ratio which emerged between 1964-afid.:.
''1971 had included.building in new schools but theneedg ker..01e
quadrienniUm were only actual needs in existinkschbOs It would
that.a stropgly argued case from more than one StatelVovarnmentbased on, , -
criteria equivalent to those applied in,non-government ebool:S,coirld,have...., ....°,H4
a modification of the policy for distrillu ng cd,S.- ItWaN:4k;t,',..r.,:?`..
42.;'''
lost for:want of sua thfermation, -1:.iqe V.K4>': ""`,'....'-..
. _
."'*<'1:.:. ';It' ' '''''''.: '';'
N ' , ': .:.''-.. : ...:.
,.The amouht.of money made available for t ent=ire Pro 'ram -was aoniderable: .
1 , :- Nover $123 million. Previously described
tprosfor pportioning the-funds.
.
resulted in the allocations to. various s..s.q,doLsysteMs.iiceackSrate which are:-. -...: > ...
. ..:. .
shown in Table 4.1. Appendilli contains-allocations over varie011ods of,%tim(.
.
.:....';-:- =N
.
Theratio of 30 percent Was the actual figu c for the perioc096471..'
Total costs Were estimated on the basis of $29,Mper laboratory
resulted.in
opportuhity
The-amount of Money Allocated
which. Was the non - government school cost-at thetiMe.

;Tabie-4: . Total 'Fpnds','Made Available 'ultddr the Science Facilities.Program-from. 1964 to 1975`Ql.crney. in $) -
st4'e GovernmentNon-Government
. 'Catholic Independent : Total'
e,NeLc.t .8.duth14a1 es 8.i:411)780
Yi,CEo'ria ; 22,35302-0queensland. 10.,411
South Althttatil.a 4 , 925
'Western 'Auattalia' I2-68'3, 26 b
8,372,765-4;829,3.20
1,735,127
2". . 979;147
3,898;710 '44,770,1205,358,415 . ' 36;0,83,2002,744,100 17,985,0001;667;398 10;777,456
.1,411,391 9,358,7406./0,683 :4).333,090
..-30,804,-303 12$;07;600 . 4
nGT
Tptaij, 6;555 ;OM
_SQurce,;,r .;
1,.;'Cant nOnweal: th, ,Depli,rtMesi)t .Education
.
File 72/1547:
ie 'Some of ttievroblems irnM1ved .Vn 'the method .t.led to divide funds amongst.tehool systemic` and States have;have been ,mentiiined. !.A; e'learer..1indieation of theanomalies. whi'eh;;*9Sulted 'Otitainea:::fx'Ork the calculated pet, pupil. a.nnualgrant., in -Tativ a.:2. From 1 :July...1964.ft 9..31 June. :1967 the per pupil giantsShould kive equal biit as, :can be sCen. 'from the .1964'-65 there weredisparitiV.S: 1967: to 1971 per pupid' grartt4,Shoiild have
. . , ,been eq government and non-goiiernment. systemS, eyen though naally th er-pupil grants for the latter-zwere 'dOuble'those for the form.In Syl!1114rdisscrepancies, existed -for this period as in 196465. Theyeal! '1968 to 30 June 1969' provides a fair indication of thesedisell'ep dies' as this was the year in .Which, allocations were revised on .the
4 basis of cent statistics For the four years froM 1071 to l975 pe,pupil giHnis ave ...less meaning... The allocation system was changed so tin .governmebt scliiOls ger pupil gi-ant should have been equal In rion-
.,goVernment schools grants 'Were ba-ed. on need so that it was not intendedthat they should be equal _V
The result of neglOcting:. differences in population age structure, s'choolretentivity, a,pd Whethered.i4hdary schoolin the total per pupil sal, each, State.secondary school commended at Year
commenced at Year 7 or, 8' is appai,entA State such as Victoria where
7 and which had a high re4entivity
ti

Nietoria..
Queensland
4tOrn.AustraliA
-?i
1442 -14'):1'
11'76' 1.1.9
14 fl:'gr
15.3
14.0
15.0 14.2
15.3 11.9
'7.6 3.4
10.4
IL 5
7,
.4nYo tics derived from:Sehools,BU1letins of the
;f:Jlipfstics referto:the beginning of August.:
c honey al40.ons derived from Ministerial statements to
Parliament. -. '
,_71-lac1,.0'Obwer p0pupi giant than Queensland Where-,Year 8:iilas the first year
60Aeond* y.',Gfio,44 and retentivityof pupils was low:- This can be seen most
clearly
0;:',03; e p rt,e tots /between Statesgovernmeht'ichools Tasmania
(4.1114PAP4nAIA14hile..for4lop-government;More generou4 assisted than,Vicioria.
.
,
The p-Od from 1964 to 1971 was one in. which
,g.funarreillied in anomalies. The final cidadrennium probably, compensated
Othi's'in,AOh-gdyernment schools, :but not in government schools.
1964 figures which are:.unaffected by different rates to non-
sc CaiiiteMs. These factors combined:Wj:th
:
:O0,146,ts in gov4nment,and non- government, differences in the
schools, to give
within government and non-governMent systems.
received notably less assistance per pupil
schools South Australia was rather
the method of allocating
for
The Non-Government School Program
.
General Organization
at'Tortion of the Science Facilities Program which:wasdirected to.non-
ommonwealth authorities.14'. Payments
g'o'vernment schools was administered.
:14 At first this was the Education Division of'the Prime Ministers
Department. After December 1966 the Commonwealth Department of
Education and SCience was formed° was responsible for the pro-
gram. Ftom'December 1972 on ds the Department of Education was
created _as-a separate'enti
8 9

77.
to schoolstrequire4 the co- ;operation of State .gevernments. The Commonwealth
'government allocated.money.for non-gbyerhment as. well as government schools if
to'State Treasuries. Upon notification from Commonwealth.authorities the --
necessary amounts were paid by the State-Treasuries to schools.15 For-each
Act under 'which assistance was given'it wag necessary for the Commonwea
Minister for Education to seek the agreement f his counterparts in the
States to continue to transmit grants t nomin4ted non-government schoo"°S.
The .administration of science grants,to nongbvernment,sehools was
tharaCterized by central executive action, devolution of authority for
standardS and priorities., and considerable school autonomy in spending the
money allocated.. There were two State Advisory Committees in each State
covering Catholic and Independent schools respectiveiy.16 These committees
;,were provided with infermation'about the peeds 17 -oP individual schools for
science facilities. Information 'about needs was first obtained from
questionnaires and checked through visits to schools by members of the
Commonwealth Standards COmmittee. The State AdVisory Committees then advised
the Minister of the priorities .to be given to various projects, for. buildings
and apparatus. On this hdVice the Minister made offers to schools. An
important feature of the procedure was the separate determination of standards
by the Commonwealth Standards Committee, and the4objectiNe assessment of
.needs related to those standards. Once a grant was offered to a school it
could appoint an architect, consult a member of the Standards Committee,. and
let building conta'acts after approval of the necessary drawings had been given
by the Minister. This procedure is summarized in Figure 4.2.
Ater the school received an offer of a grant it sh itted.sketch
plans and or drawings prepared by its drchitect to e Commonwealth.
A member of the.Comthonwealth Standbrds Committee was involved in consulta-
tion with the schoo? and the architect at this stage. In fact it was on
15 This was necessary because of the provisions of section 96 of theConstitution under which grants can.be made to States. Thde'was. nolrway in which grants could be made direct to schools.
X16 The composition of, the State,Advisory Committees is discussed by Smar(1975). They.Were rel ively informal b9dies. The honQatholic:SACswere 'set up,by the Ang an Archbishop 6 each capital city.
17 The specific meaning of the term needs in thiS Program has beennon page 72. (CDE, File ,64/8961)...

School
Questionnaire
CSC Report on
School Visits
Grant Offered
to School
Ministerial
Decision on
Offer
Planning
Proceeds
Figure 4.2 Procedure Leading to an, Offer cifsistance.
the reCommendationof a Committee member, acting for:the Committee, that
the Minister gave approval feCthe plan'and.outhorized.tbe commencement of
building.. Some. .grant mone was paid to the school after..it had advised the
Commonwealthtthat constr Lion had commenced". An inspection was made during
construction 'by the. Co ittce member -in addiliOn to a final inspection, when
the buildihg was complete.

79.
Determining Priorities
It is worth extending the comments about the role of State Advlsory
Committees in.the determination of priorities. The priorities which these
committees advised upon included which schools should first receive'assist:
ance; what proportion of the cost of a facility. should be provided, and
whether..to assist, buildings4apparatus;or both. It was hoped ,that the -local
Illirwledge-possessed by, these committees would ensure that the money was dis-
tributed fairly and spent effectively:...,
At the time that:.the Program commenced it was decided that only build-_
ing projects which had begun after 1 December 196318 would be eligible for
assistance. It was also appafent.that insufficient funds existed 'to assist
all eligible-schools immediately (Gorton, CPD 1964 : 1325). In the first year
of the Program's operation at the request of the Minister (CDE, File 64/
8961) ,.the Education Division of the Prime Minister's DepartMent drew up
schedules of schools in two categories those considered to be in immediate
need and those whose need forAsistance was not so immediate. The priority.
given to schools in these schedules was outside the terms of refere7be of
the CommOnwealth Standards Committee. One heavily weighted criterionjor.
allocation to the category of 'first consideration was the readiness of the
school to commence building (CDE, File 64/8961). When these schedules
wereprepafed they were provided to the State AdvisOrY'CommitteeS to decide
on priorities and the amounts to be grated; The Roman Catholic State AdviSory
ComMittee in Victoria declined to recommend the amounts. to be granted,
While.they were. prepared to allot priorities they considered that the, 4
Commonwealth Standards Committee was better placed to recommend amounts to
be .given (CDE, File 64./-$946) 'Certainly there were early variations in
the amount.of assistantogiven to,projects. Some State Advisory Committees-
.made smaller grants to a large number, of schools while others concentrated
mord Substantial assistance on fewef schools. .Noting that in .Queensland, ,
Catholic schools had been-granted an average 40 percent of- total. cost the
Standards Committee recommendet that' grants should be a suhStantial-propor-
tion of the coslt.19,('CDE, File" 64/8930)..
-1$ It,is hardto decide when the Program began. An announcement was madeeligible,in November. 1963; prdjects begUn after 1 December 1963 were
the,Aet. passed Parliament and received Royal Assent in. May 1964, andfinance.was available. from 1 July. 1964.. ,-
ts19 A figure of approximately 80 Pererit was suggested
s'. - y
It

i '80.
Table 4:3 Percentage of Science Facilities' Program Funds Spept on
Apparatus - Non Government Schools
State Independent
;New: South Wales 8
Victoria 10,
Queensland 7
South Australia 8
Westerr. Australia .J .9
Tasmania 11
Australia.
Prj
.
11
9
10
11.
11
10
-This yrOcedure, was followed only in the, initial stages of the Program..
The Commoriwealth Standards ComMitte.6-set anearly goal of visiting applicant
schools as soon as possible so thattState Advisory Committees could-be pro-
Added with detailed informationabout'needs20 (CDE, Tile 64/8946). The
.
commitment given to meet the full reasonable cost of approved projects-re-
some of the .pressure on State Advisory Committees and also had other
ramifications for their, work. In presenting the StateS'Granis (Science
.:;
'Laboratories) Bill',1968the Minister indicated that not all of the money
would be allocated on the recommendation of. State Advisory Commiettees
'.(Fraser, CPD, 1968 :516).21 ,Hence from 1968 some money,was.allocated by
,
.Commonwealth authorities toprojects which had bedn completed within a school's'
assessed needs, but which hAd., been either notpreviously assisted, or only
partly assisted, by the Program.
20 ,These visitsWere,important.becausC it was found that.a school's science.'
facilities were often not well represented on paper. Many listed science
rooms were found to Ile of,an unsatisfactorystandard (Commonwealth of
Auttralia, 1976 : 0) .
.. 21 The statement read-as follows:
) ,In relation toIndependent schools it has been decided that part of the
totaramount available will be, used, in the first place, to meet the
balance of the reasonable cgst of science buildings already assisted
and then to make grants"to schools whichlave built science laboratories
.,:to plans approved.bythe Minister on the.advice.of the Standards
Committee. but for which they have not received any-assistance.. -The other
part will be available for allocation op the recommendations of State
Advislory Committees for completely new projects at independent secondary
schOols.

81.
At. the beginning of the Program it was intended that the initial
,.emphasis would be laboratories (CDE, File 64/8961): In terms of money
spent that emphasis continued so that 90 percent of the money available
was spent on buildings. The data which are shoW-n j..n Table 4:3 reflect the
fairly uniform proportion of fundS"spenton apparatus across. Australia.
New,South Wales and Western. Australian Independent schools spent the largest
proportion of-funds on appaatus while Queens.land Catholic schools spent the
least.:. A rather. greater variation existed in the detail oftpending patt-
erns over time. Victorian .Independent schools did hot. receive substantial
apparatus grants until late in the final qundriennium (Commonwealth of
Australia, 1976 18).. By contrast Western Australian Independent schools.22
began the Program by spending money on apparatus (Smart, 1975 : 234)
C'
The Commonwealth Standards Committee2
.
3:
'The Commonwealth Standards Committee was an important element in thenon-
:government sc of section of the Stience Facilities Program. Its role in-
clu ed tabl sting standards for science facilities, providing advice to
indilvidual schools-in buildirig, providing general advice%on laboratory
design in. schools, and even tendering advice on policy to the Minister. The
terms orreference within which it operated emphasized three elements of.4f
the 'advice it would provide. P.
To-report generally as required by the Minister-in-Charge" of Commonwealth Activities in .Education and.Research upon matters in rel4ion to science buildingsand equipment for independent schools, and in..particular::
.
EnY. to. advise oh the standards to be reOgniSed by the-Commonwealth in assisting in/ the construction andequipping of such..buildings;
upon n-reference from.the Minister,.to .a.dvise.uPenrequests for assistance received from indivtidual
.
schools; 1 !
to serve as ahexpe14. body,to which scho ls 4'
developing proposals'for improving the' Science!teaching couldlookjor.advi as to the bestemeans of meeting-their part. lat needs.:
(Commo.nwealth!o 1976.: 5)
22 Smart' adsOnetes that the allocatitp to Tls 'schools, in Western AUstralia4. was given .early priority becAusethey Mad been shown..to We less. w0,11.
provided.. . .
(
. .
Y .
23 The full title of this committee was...theCo onwealth Advisory Committeeon Standards for SciencelFpcilifiesIlli Inde endent Se &ondary Schools, .
iy.
A"C
9 I ,H .
qi A
VP-
(

Y.
82.
work of the Committee in terms of ierier'al adviCe, on design and
establi hment,. Of standards and its specific consultationwith °scivols was of
.'great benefit. in the implementation of the Program. costs incurred in
visiting schools ,and in Meetings were net a chal-ge against the- Science
ities Program. ,Nor, indeed, was the cost of staffing and operating the Science
ies Section -ofc the Faqilities Branch24. in the Commonwealth Department
of Education, debited to the Science-Facilities Prograni.IThe money. allocated,. .
for science facilities" was entire ly. expended' on the provision OC=facilities..
The administrative and adviSOry irifra-structure was budgeted separately and '
.
was an :additional 'benefit to noir=government 'sbhools
The standards developed by he COmmittee included the numberiof- rooms. _ .
required and the quality of those rooms. Its requirement POI- sufficient .rooms.
to accommodate all' science lessons within_a' 73 percent, usage -rate has been ti
.. : `
mentioned previously.23 While this was .not Wlgidly applied .where Aie number
of rooms calcblated was not an integral,Aumber:, ,nor- where either the schdoly.:
or senior classes were smaq,26,,
. it was an important guideline:.': 'AS a .standdr4
it was generally'- moregenerous to Schop1s:than,.that Which, applied -i.AgOvertiment' -- '
schoolS. -, 'Likely' grewth in a school, and the:potentj. al TorvOdOetngAzia!
. .
.
.. .,
24 'According to the Annual -Report of the Department of. Ealscation and Science
(19!71) in 1971 there were 1.5-establisHed positions in .the Science Library
. Facilities Branch. .:.It.can be assumed that about 7 were in the Science
. Program.
23 Sec page 45 for more detail.- The -'tiitemenf elaborating this was the
foljowing: $ -..
.. . k
In view .of the _need -t6 assemble and to remove apparatus and,material, a science room. should not belbccupied by classesfor more than three-qu4rters 'of the meekjs 'teaching, time. ,
'(Commonwealth of Austral AI, 1973 : .4)_ ', '0, . .
26 For small 'senior classes a,specially deSigned prqparat ion -roOri:was often,..prov.ided ...(Comillohwea lth of Australia, 1976 : 12) . . -Tor . ima 1 1.- schpols , .'.'
whiCh were defined as 'having less than 28 periods per week, special pro,At is ion was .iiiade-.
.
_
.:Ciitegory .A :4 school ,that has:a. total 'secendary enrolment-of-about 20 students, . .
. .
;'Such schools should be provided with ffleil it Les7-in,an existing
room, 'e, e. wall benehes,:movabie tables, ,serviceS,'.7storivge- ..
cupboaords, apparatus, etc. .
..
.
.
Category B,.!
A school that has severiil setondary, claSses and.. .
which nee@ . to provi de,- for 'se i enee- classes of
. .. about 18 f o _24 Students, ,- : .,. .
Such sehoolS should be provided. with..a 1:1lb-oratoryof 600 - 759.";
sq. ,ft,.;. but'ao not need a sbgaraie 'Preparat icon/store. .roop., '
tategoryC, . A school that has 7seVeraI, secondary:clas'Ses 'nd a
,
1
.,-
.
'which .needs to provide for science claS'ses of Q.
.- -H 'more than 24 /studenis. . .
Such 'schools. should he prOv iaed with ISboriitory 'Of 160 'sla.ftd, ,
but .do.not need a Sa,iial-Gte PreParati /Store robin:, 0
. .-27 See page' 46-:' 9 .

size were also consider,ed in determining the '. number of rock's required..(Cenunonwealth of AUstralia, 1976 ; 12). Assessing the viability of schoolswas a, difficult problem as money could be wasted' in providing laboratories
schools which may: haAre;klesed shof,tly afterwards :28.
Concerning the quality of rooms a principle was always adhered to that'd,service\s suth as. water, gas ,and eleetriCity shoUld be easily accessible
,tb the. working 'area of 'each pair 'Of Students. (Commonwealth of Australia,1976 ::171:. A series of workihg rules was established which was baSed on ,
, ,.decisions concerning area (92 to 104 m2
per room), etudentefi-laces (32 for! junior classesT, storage Treparation,#ea (-23 m
2 per room) and specific'749' 50matters 'sueh as bench and.seatTheight4,f, -In discussions and openationS.
the Committee expressed a 431-efeItInce. 'for multi- purpose and multi-functionalrooms.
'' Thet.¢ stAndards and guidelifies were implerlienqd in a number of ways-.The most k influerkial Was in,. discussion with individual 'schools. Schools were'-
: obliged'ito; have fheir plans- apprOved by the Commonwealth Standards,Cfifinnittee. to ensure that standards were Satisfied. They were. also, adv -ised ,that the
Standards tiantIttee .shoald In: consulted when :developments were first con- ' .,-sidered (Gorton 1965) Discussions With schools' staffs often :broadeged,
, . rfrom the planning of faeilities to . encompass teaching methods; curricula, andlaboratory organization. Anieven wider -inf.luence was achieved thrbugh the .
fiVe editions 9f 'a design brochure (CommonWealth of Australia, 1964, 1966, 1.196a,1971,,19'73) and its: planning' ,suppleMent ( Commonwealth of Australia, 19.75).-The brochure contained, cnar' SPecification 'of requirements fe'r plans to beapproved:, erielal -guidance in planning and a ,numl5er, of sample plans. the plans. 4
added in la er editions Tftected the .development Of'LMo're adaptable versatilelc i".designs which siiited new curricul001:.-ftic{iogy aud Sitience. , Plans were develop-
,f
ed to suit the SCS' Biology,.ourse: hiiiittroup developing-ASEP materialslt:was,,- - ,28, problem ,was discussed at a eting -6 the, Committee in January '1970.
It was dtlficult to assess the. viabi;Iity stall Roman Cathblic schools',becauSe of structural changes in, those sistems. 1,. In additiop'the Viabil-.. ,
'aItY of some 'sillopls ,depended on gaining a CommonWealth grant. :. s. - .9:',":=The decisions taken by the. Committee ok.such matters° Were aecwmulated
:5 from the :''very. first meeting and summarized in a digest of decisions'-',prepared by the Chairman (E.D. dardimer) (CDE, , File 72/1296) . '°.- . .
30 ,. One rnember of the Committee at the second 'meeting recorded dissent from..the attempt to Specifyguideline whi;11 he considered too rigid. (CUE,File 64/8940 . .
% ' -31. Single $cierice rooms wdre'approved only ih laite schools,

84.
> ' mans20°I
consulted about laboratories which would best suit its approach (CIE,_ Fide.
70/608'1).32 In the'
laterAyears of the Program consideration was giVen to
-ways Of reducing costs while maintainingessential features, of design (CDE,
File 71/2233).' It would be valuable if these conclusions were documented
and. made public for future Consideration.33
o
:Lists of recommended quantities and types of apparatus were prepared
for schools 'in each State. ' These lists were for guidance only since schools'
sc
cpuld Purchase apparatug of their own. choosing subject only to the condition
that it be'non-congumatle'..,Suh lists were most useful for relatively.'
isolated non-metropolitan sclfocifs.The.npparatus grants 'for equipping labor7'
+aterieS were made on the basis of $2000 per science rgom. That this amount
was.too small was first discussed by the ComMIttee in 1966 (CDE! 'File 651
10157) and an increase to $3000 and $4000 per ,room for junior and senior
rooms.respectively'was recommended in June 1967Z(CDE, File67/4951). 'The
Committee was notified that the Minister had app the increased grants
(CDE, File 67/1571) but these were never implemefite espite the matter
havig,been raised. Again in 1970. (CDE, File 70/1590) and 1974 (CDE, File
74/1547(39)).
Through its visits to, and consultation with schools, the Committee built
up considerableexpertise.It is regrettable thatia similar body, or
a combined body,' was-not available to help government schools
-way. For government schoolsAffell to existing staff to
Science FaCilitles Program.
in a similar
administer the'
32 There was some diScussion within the Committee of its 15th meeting in
February 1971 as to whether plan 8-(fifth edn) was" suitable for other
than BSCS Biology. In a letter the ASEP Misistant Director indicated
that plan 4 or plan 8 would suit the ASEP material. The Committee dis--
cussion appears to have centied on 'flexibility' versus 'specific
purpose'.considerations.
53 Among the mearts agreed were runnels rather than sinks, use of standard
furniture, timber floors,no Arawers in fixed benches, reduced numbers
of taps in junior science rooms, restricting' ume cupboards to'chemistry
rooms only etc. It'was recommended, however, that architects shot.tld
always be employed..
"V-
97

85.'1/4,
As a result of the fund of knowledge. it acquired the Standards Committee
-was an influential source of policy advice for the Minister and the Department.
of Education. While it was' unsuccessful in achieving*incrZased apparatus
giants and in having approyed provision fdk much ancillary space (Commonwealth
of Australda,.19"16': 13), its adviCC was acc pted in other areas, Particularly
when the Department was planning for the fin 1 ,quadrennium of the Program on
*the basis of needs the CommOnwealth'Standards Committee's knowledge was
essential.34
0 '
The Gcr..),,-c-tnmbnt School Program
Commonwealth Constrain .on State Policy
The Commonwealth government adMinistered the Science Facilities Program in
On-government school, but State aut orities-Were:responsiblejor spending
the sums allotted to governMent.schools. In spending money under tiles-Science
Facilities Program State governments were obliged, to comply with a r of.
conditions. Through these conditions the Commonwealth was able to srUtinize
the policy of each State. .Hence 3tate governments were not compltely free
to determine their'own pTipritic : they operated withinunifOrm constraints.
The conditions which applied, to thistProgram were specified in a memor-.
andum of discussionS betwecn.ComMonWeal1th and State Minister.S and officials
held during february 1964..0",
(i) Th ,.rant must be spent on science buildings.and fOrc ment associated directly with the teaching ofscience at secondary level.--
.
The things- on which it is spent, and the source shotildbe clearly identified in .the State Budget.
(iii) The Commonwealth expects that the State will treat thegrarit as, supplementary and additional to the'amountwhich theState would normally make available for cdu-cation'purposesfrom its own budget,
(Western Australia, file 64/1207)
4.0thercondition:swer6illsoappli-ed.. ;Following discussions between
Commonwealth and State officials in May 4964 it was agreed that'only non-
34 For the final quadrennium finance was estimated on the basis 'of 831,000'.per new labOrat6ty. arid' $16,000 per conversion (Commonwealth.of Abstralia,1976 ; 9). .
.
98

86..
consumable apparatus35 would be-purchased, lists of apparatus would be
approved by the Commanwealth,36 and n*11)5tate spending on scienc, buildings
and apparatus would continue. The agTeement'also allowed soma continuation.L
of spending beyond afinabtial year and attempted define subjects not
eligible for.asistance.37
At the beginning.ofeach loriennium oriNiadrennium-
the respective SZatesindicated the gen6ral.prOgram of spendi-mrerroposed. .
-(CDE, File 7211547).. The .CommOnwealth Minister, Would then indicate whether
the program, was appoved. From 196:538. onward State authorities submitted in
advance of each quarter a sYnopsis;af past-spencling.and.an indication of an-..
tic-ipaed expenditure for diat'q aster. Advances were then made available.to
State Treasuries (CDC, File. 67/ 855). As.the.l'rograni developed, specific
scrutiny of spending on apparatus
.
.
Commorealth authorities were also concerned with the cost ,of buildings
provided in government. schoois. Early versioAs of p ovided in
Queensland schools were noted to he extravagant and wasteful of space (CDE,
File 67/1857). 'Subsequent huildiags avoided the separatelahordtory andI
tcachin reaswhicll drew Commonwchlth comment. Similarly the Cost of one
science,block to be provided by;the Tasmanian government *s thought to be too
great. Indeed"further detaills were sought before approval wus given. Only
after detailed supportin argument in terms of the proposed use of space and.
site difficulties, with t esinclusion of plans, wad the.proj.ect approved
' (Tasmania, File 8547).
35
N...._-" . .
Originally defined as apparatus costing more -Ulan $20, (CDE, File
064/108, it :!,,as .amended,thbe°constrained to aNlowei limitof.$10.in.;lovemb6r-1964 (CDM,:File°64/I081).. Subsequently-in July 1965 non-
. ,,,.
consumable was defined as those Articles which may be.tised rekatedly
for a considerable period of time (Tkmania; .Fil& 85A7). Thij appesrs
to havebeen a tacit. rCcognitipnof.the -impossibility of closely specify-..
ing.a term such as non-consumable, .
.
_,., . .
. .
3.9..;, The Coymonwealth,Filps i' icatc that this detailed approval was not sq..
Zal
. .
.
V e.7 'stringently enforced aft'r the first ;few yean.i of the Program..
37 Domestic Science was noti-cligible, It was.suggested that Geography and
Mathematics might be considered in some circumstancee
38 Before /965 one quarter of pie annual sum-pas paid to State TreasUries
at the beginning of each.quarter.
,---..,,

. 87.
: -
Jhecondition:which possibly caused most disharmony wp. that requiring'
the maintenance of normal State spending:: Smart (1975 ::214) notes, the
differende between the February and May conditions on this matter;. The
former referrea.Io general educational spending:thedatterto spending on
science buildings and equipment specifically. Whileithe 1465Premiers':
conference resolved that the reference should be to general.Spending on
-0Pcation; evidence.' presented by Sthart '(1975) suggests that the ComMonwealth
Minister attemPted,tq maintain State spending on science educafgCl..!,The,
conflict was ie"ktbetween the Tasmanian governmelit and the Commonwealth.
In late 1964'the.Cconionwealth Minister asked the Tasmanian-Minister:fqr
Education for an,a*surance,t4at State'expendituu on secondary. education39
had,not declined, befoxe did grant would be paid (Tasmania, File 85471,
Tasmania had spent a conSiderable,sum on science education just prior to
. the.SCience FacilitieMrogram. AsSmart (1975) suggests, it w e fficult
that the -level of those years shrd be maintained.' In Ot er
states there
,et
that..expenOT.
s,kless cOnflict 'over this provision though there is evilnce
State funds on science educition did dec nedn Some
; instances (Smat, 1975 : 252)..
,The onlAiions explicitly stated together witkimplicit aspects of
CbTmonwe,aith policy set the boundaries.within which State authorities could'
.1 Use th e.Facilities Program. Within those limits-tolicies could and
did vary each gl-ate... In many,ways the differences between States suggeSt
. that rather thah beingtone program of assistance the Science Facilities Pro-.
gram was a conglomerate of seven inter cking schemes. A
.The CoMmonwealtn.Co tribdtion to State Programs
t.The replies from S ate Education Departments to the Commonwealth author ties
'in 197SproVide i formation,about the extent to which the Science- Facilities
Program contribut d to the provision of- Science facilities in governm t0
sChocils'up to 30 une 197.1.40 In the period from 1964 to 1971 it appea
that 70 pel-cent f thes
SdienCe rooms built'in4 and 50 percent of appar tus
supplied-to, government schools 'was' part of the Science Facilities Program.
The 30 percent Ontribution'4&m State resources to buitelng lakoratories
--(suggests that the 1vernment schools 4,1ding prografi,wns slew than in-
39 514-assurance ought referred to totai expenditure on secondary 'education.-rbut concern expressed. about a: decline in science education expenditure:
40 Because some ubt has been expressed by the ammonweal4h Department ofEducation about the reliabildy of.this data it been checked againstState ,records when. possible.

Taltle 4.4
88..::
Science Building and Equipment Programs
Government Schools 1964-1971
1'
No. of Science Rooms to:Apparatus- Expendityrea
SFP State %SFP , SFP Total. . %SFP
New South. Wales.
.
Victoitia
Queensland
SouthAustraliab
agtern Australiac
Tasmaniad
Australia
662 281 .
69
i
300 134 69
193 82 70
172 64 73
97 67 59
54 .47 ' 53
1468 671 69 7-
Science Facilities-o
2757 5646 49
3600 ' 5200 69 6:
569. e 11.10 '' Si
783. 41540 51
371 ' 849 44'.
.339. 885 38
.13429 .1.5228.: 55-
Note$: a Units are thousands-of dollarS.
...
'b Only includes laboreteties f &demonstration rooms: The table
on Commonwealth Departme q -Education Files includes prOara-
tion storagepDomsln .4,dditibri..
c :Taken. from State EducationDepartMeril files 40 .
. .
.
d Includes ten Major Oonversions'froe.7heProgramand eight-.from state funds.
. ,
SoUrce Commonwealth Departmentof Education, : 5
iFile Number 68/2764(2),
Science-Facilities Scheme Proposals
for Extension. .''`
,
'... ,
. .
nongoyernment.sches.Sincetik'per capita grant to, the latir was double'
that to government schools as50 Orcent contribution from State resources ..
wouft hhve been needed to kmpensate if the rate of bui1diniF in-governmnt%
. _
schools was to be Rept\Up to that' non - governmentnod-goverent schools. As shown in.
T ijable 4:4 only in Western Alitr i.a and Taaania did ihij .occur. ',J,
.4
In the case.of Western Australia AA was possible to examinb the#sCience
.
.
. r I/
.
.
.
,.building program beyond 1971. For the total period from 1964 to 1975 the
ScipnceFacilitie;''ProamoontribuSed some 146 n rooms and provided for
..
the improvement or conversion of 25additional roc , Over the same period.
J.
State resources were used to provide-137 new science rooms. Hence,the con-
tribution.of the Science Facilities Program to science.room,Constructivn wa$
between 52 and:55 percenidepeg ing on theeigting givento conwersion§. ''
L .
UnfortUnately.this analysis c nnot beretrUcated forother.States.but it is/.

4
reasonable to assume that thecontribution of the Science Facilities Program,4to the provision of science f4Olities, continued to be substantial.
li. .,
th
State Education Departments..
indicated to the Commonwealth;thatimost of
new laboratories were to meet-t a increased enrolments attributably to
.the growing retentivity of school Systems (CDE, File 68/2764(2)). It can
be inferred from this that additional fund; could have been useflilly.emVoyed
to.replace existing science .ppoms.of pbor quality
The Cost of Science Rooms
While it is difficult to estimate aQuratety the cost of building science rooms,
theiTe"is. evrdence of considerableyariation between State systeMs. One set4 !
of estimates was compijed by the,Commonwealth Department of Education (CDE,
File 68/337(16)). Estimateof laboratory.costs were also among the inforco
mation provided by state education departments in',1970 (CDE, File 68/2764(2)).
A third approach adopted in this project was to estimate an average cost
betweep 1964 and 1971 by combining-total Science Facilities Program building
expenditure wig the number of labdratorieS provided. While this was ,a crude4
approximation it was considered an indicator of relative costs: These cost
estimates are recorded in Tatyle 4.5. .
91 .9,;NotwithStanding the reservations about themethods us ' to reach these
estimates the correlationtbetween them are fairly high. he 'variations
'betWeen States are consistent in each set of data.: No simple explanation
for the variations is obvic6s. .ft does seem that.States provided rooms.and
preparation rooms of differkt floor area.' The 1968 data shOwed that
Victorian rooms were serviced by Alarger preparation area than those in
other States while Commonwealth science rooms in Queenslanq schoRls had a
laTger teaching'area (CDE, File 68/337). The calculated.average
have been distorted by'funds being used for small building alterations. .The
Science Newsletter of theb7'victoTian Edudation'Department.in May 1972 observed:.4-
'A . .
HundiedsoilS=11 bills at....1.1.r.t'ten against Commonwealthsciences moneys every quarter,jor maintenance, for ..rounds,
for smll'adjustMents, for fittings... These coaiume tensof thRbsanils of dollars 'anquall)7. (Victoria; 4'02 : 2)
Another source ofvariation in 6stvias in-the services'pTovided in rooms.
For example, rooms in V'ictorian'sehools were more eXtensivelyp'rovided with.
watel', gas and electricity outlets than'similar room's in New South Wales
. .
.

90.-
Table 4.5 Estimated Building Costs ($ per laboratory).
. Estimatea
Estimate b Averagec
State1968 . 1970 1964 - 71
01* /New South Wales 23664 27395 24747-
Victoria31666 '.,
37500. 35679
Queensland - 30000.- mboo 35172
South,Australia26600 - 23227 d
Westernl'Australia2733. ?
e32000 33894
,f
.1asmania : 24286 '27000 '27,809
(34000)
Notes. a Taken from CommonwealthDepartMent of Education file number
68/337.
b Provided by State EducationDepartments in 1970 to the
Cbmmonwealth (CDE, File 68/2764).
c Estimated using the method described above.
d .South Australia provided some timber prefabricated units as
nil as solid brick units. The former were more'economical
than the latter.
Gosts_haerisen up to $40,000 but new plans were expected to
-"reduce this to $32,000. Rooms built in 1971 in fact cost an
an 'average $30,000.
f Rooms in high schools cost $27,000. In Matriculation Colleges'
the cost was $34,000.
schools. In New South Wales the existence of a Schools' Building Research
and Development Group may have helped to restrain costs. -This body was formed
in 1965, before similar groups were established in other States. By, restrain-
ing exuberant architects, it ensured that schools received science laboratories
at a lower cost. Experience accumulated in New'South Wales through developing
a'!wide variety of school buildings since 1945 was valuable in applying the
science-assistance money as effectively as possible.. -As a'result of cost
differences the numberofscience rooms able to be .provided from the Science,
Facilities. Program. was not in proportion to the-money available.
.It also appears that the cost of providing science ,rooms in government.
-schools was generally greater than in non-government schools. -Table 4.6
contains estimates of the cost of science rooms in 'government and'non-
government'schools.Resu'ts are reported for both systems for' the period
A

91.
.Table 4.6 Laboratory Costs in Government and Non-Govel;nMent'SchAls
Non-Govetnment Government'1964-71 1964:75 1964-71
.
Minimum estimate 20265 23356'
.
27561_
Best estimate 22095 ' 25180 "28563
Maximum estimate 24095 26204 2E1975
\from 1964 to 1971 and for non- 'goxer ent school's frOm1964to 1975.''The
minimum estimate assumedvdat'i/mdified and.converted roomS -afid research
laboratories were equal in cost to-new science rooms. Theftaximum:estima,te
excluded these rooms entirely._ Finally the best estimate set-the cost of
such.roomS at 50 percent of the cost of a new r9oM. An estimate of costs
for non-government schools for,the whole Program from 1964 to' 1975 was., made
to ensure that any temporary indebtedness to a.completed project 11141971. .
was not distorting the calculation. The results suggest thait it cost about
10 to 25 pcxcent doss to provide science rooms in non-government schools
than in government Schools.
In-keeping costs low non-government schools enjoyed some advantages;- .
It was possible for them to only let. building contracts at the-most pro- '
pitious time. .SoMeschools; which employed astute managers and bursars,
indicated that they let building contracts when there, was a minor trodth'
in the building industry.' Such 'tactics were not possible for the large
State Education systems. The second advantage was the administrative
structure which enabled the school and its advisers, supported by the
CoMmonwealth Department of Education, to' ,closelY supervise the planning,
construction, and 'completion orprojeCts. The role 0ayed by the
CommonwealthStandards ComMittee was important in helping schools reduce
costs and.deMand what they required from architects in buildings. FOr
government schools no such administrative structure was provided. The
supervision of the Program was an additional task for an already heavily.'
committed system.. New structures within statesysems evolved with the Pro-_
gram but they did not exist in the crucial early stages'. In addition'the
building of laboratories was not so directly supervised by Education personnel.
Relationships between the Education. Departments and the various' Works' Departments
;
ro
1 0

92.
Table 4.7 Percentage of Science Facilities Program Used for the
Provision of Apparatus in Government SChools.
State
Time Period
1964-65 19§5-68 1968-71 1971 -75 1964-75
NeW.SoUth Wales 6 17 1:7 18 16.
Victorifi 75 27 . 17 >10 19
Queensldnd 0 10 4:.
7
South Australia 39 19 ".11 6a6 11
Western Austra l 4 11 8 4. 8
Tasmania 7 18 29 7 13
Australia.14
Source: Annua tatements of Audrors-General,
Co onwe lth Department of Education. ,
Note: a- Estimated as statement included State expenditure.
varied .beteen States:41 In some States officers of the EducationDepart=.
,ment were able .to exercise little supervision once general plans hadD.
been submitted to the Works Department. Superimposed on these considera-
tions is the general observation of such features as foyers and tiered
lecture theatre's. in government school science blocks which were absent from
.those in nen-government schools. It is worth remembering that cost;.
4differences heed not automatically be interpreted as being indicative of
inefficiency.
State Priorities : Building and Apparatus
In general State Education Departments used a larger proportion of the funds
_available under the Science Facilities Program for the provision of apparatus
thandid'the non-goyernment school authorities:. Among the States there"was
variation in this policy. The data in Table 4.7 reflect this variation and/N
the variation in policy-over time. Victoria and New South Wales spent notably
Mote' on a aratus while- Western Australia and Queensland used a smaller pro-.
portion of funds, for that purpose. 'A possible explanations r.this may lie
in thelerceptiOn of New South Wales and Victoria .about the tandard of science.
accommodation' in their schools. Perhaps science rooms were not seen to be so.
. ).much .of a needias was illecase in.other.States. Accordingly more funds could.
41 In some States (e.g. Western Australia) private architects were often
empjoyed.for some tasks but a need to manifest fairness resulted in
work being'Shared amdhglt" firms.

93.
be devoted to apparatus. Interviews with officers of the Western Australian
Education Department revealed that in that State it was part of a long term
plan to use Commonwealth funds mainly for buildings. State funds were seen
as adequate for the provision of apparatus.
Table 4.7 also shows changes in spending patterns vith time. Victoria
d South Australia began by spending a large proportion of funds,on
apparatus., In part this was attributable to the difficulties in starting
a large scale building program at short notice. Some States apparently
elected to spend'the.money on apparatus in case a surplus was not permitted
to be carried into the next year.. .Other States were prepared for a larger
building program and chose to establish buildings as a priority from the
beginning.42
Evidence suggests that.State authorities' were unpreparpd for
the Science Facilities Program. rirly non-government schools had the1
exper-ience of the Industrial'FunCT0 guide them. In fact it has already
been noted,that the Commonwealth government took cognizance of a schools
readiness to commence building in classifying schools in the category of
first consideration for State Advisory Cowl ttees. This ensured that in
that section of the Program money was expende wilhin the year. For govern-
ment schools the task was more difficult as Menzies stated in 1965.
The States have not, for their own good reasons, been able tospend,in this year, all the money made available to them.
(Menzies, CPD 1965 : 1587)
The observation drew a comment from the Opposition.
There can be only one reason why this has happened. Therewas no prior consultation with the'States as to their realneeds, the Commonwealth proposal was not in any way basedon a study of the needs of the States, and no attempt wasmade to dovetail the administration of this scheme with theadministrative processes of the States.(Calwell,CPD 1965.: 1773)
This' comment was 'supported by tf.le.interviews held with Imbers of '
officials.i4.State'Education Departments. In the first years there appear
to have been uncertainties about the purpose of the Program; the restrictions
on'Ahe use of money, and even the administrative procedures which would be
followed.' Table 4.8 shows the small proportion ofavailable funds expended
by the end of the first financial year. These data are testimony to the
difficulties of quickly mounting this Program in,State Education systems,
-42 Tasmania decided' on this policy and indicated this to the other' States.(Tasmania, File 8847).

Table 4.8
94:
Percentage of Available Funds Expended 1964-65
(Government Schools)
,4
State Funds Available ($)-.E.I.inds Spent ($) %. Expended
New South Wales 2710000 1975622
Victoria 2045200 566562
72
28
Queensland 1048400 60454 6
South Australia 675400, 284146 42
Western Australia 517000 198044 38
Tas.aania 284100 129658 52
Adstralia 7244100 3214486 44
Source: .Commonwealth Department of.Education, File 69/3376.
4.
especially as it was the first Commonwealth program in secondary education.
The variations in the proportion of.available funds spent in the first
financial year are also interesting. ew South Wales Used a high proportion
of its finicis in that year. It had already embarked oh a program of improving
facilities and changing curricula. In the late fifties new Physics and .-
Ch'emistty.syllabuses had been introduced and apparatus was being supplied
for these courses. As a result the officials in that State were prepared
with specifications for apparatus (e.g.. oscilloscopes, Quick-fit apparatus)
to be purchased with the money which became available- A building program
and room designs were also at hand so that the newly acquired financial.)
resources could be used to accelerate existing activities. Tasmanin, which
also expended more than half the available-money within one year, had recently
been engaged in a program .to improve science facilities: It was fortuitous
that these two States were placed in a good position to. Spend the money made
available to them Other State Education Departments had little time in which
to initiate the new programs.
Summary .1
.The administration of the Science Facilities Program Was though seven
al systems. As a consequence it is better considered\
as seven interlocking sub-
.schemes rather than a single uniform program. Differences existed betwe6n the
sevelaub,-Sdheines in levels of funding and in policy formation. In general

4 9Or
non-government schoolenjoyed a higher level of funding; while Stale
itucaltion Departments were Unablo to supplement Commonwealth to....
match this.' Non-government sc 'hools Also had the COnefit.of an administra'
tive and advisory infra-structure specifically established for this program. ,
r.
)S/
0 1.

CHAPTER FIVE
CONCOMITANT DEVELOPMENTS-IN EDUCATIONAL SYSTEMS
Funds frdm the Science Facilities Program for government schools were directed
to!schoois throUgh State Education'Departments. As a fesult it was Possible-....
for the program'to influence developments in science educatiqn at the school
system level in addition to affecting science teaching in particular schools.. -
While that Program appears.,,to have assisted systemic t ges it could ntt
be-argued to have been a major deterpinant of those Ch ges. ',These deVelOP--
ments'in school systems were not explicitly stated expectations though it
Was hoped that some general-developments Of this type wduld.result from,the.
Program :; For this reason the term-concomitant developments has been used
.Following the suggestion of MalingKeepes (1978) this term was considered
more appropriate than unexpected outcomes. Such developMents werenot
entirely.unexpected. They represent.changes sought but often gained in.
forms which were not anticipated.
Laboratory Assistants.
Over the period during which the Science Facilities Program operated more
ancillary staff were employed. At the beginning of the Program there were
Very few laboratory assistants in schools.1
In 1975 the position had notice-
ably improyed in all except Catholic schools.2 Such a development does not
imply causality. Not only have there been more ancillary staff employed in
areas other .than science, but some evidence indicates that the demands of new
courses Created a.need for theSe staff. ConSider the comment made. in the
Science. Reports of the Education Department of Western AuStralia.
The introduction' of. the Web of Life programmeand the implementation of the recommendation
.
for Achievement Certificate Science will increase'even further the need for laboratory assistantsin schools. (Western Australia, 1969:11)
However, there is also,:evidence that the new facilities influenced decisions
to employ labOratory assistants. In the Victorian Education Department a
Science Newsletter (Victoria, 1967:67/1248) asked for teacher reaction to a
new design for chemiStry rooms. The authors commented in the introduction
1 See page 14
2 See page 150 /.
9-i:

98. V
that made 'a A aboratory assistant indispensable. Several officials of.
Education Departments claimed that the need to maintain and utilize
sophisticated equipment, and to manage many consumable items was a persuasive
point in,arguing for laboratory staff.
In Western Australia it was argued, in:1965, that maximum efficiency was..
notbeing obtainer: from high standard science rooms and equipment because
teachers did nothave.time or the necessary assistance to prepare experiments
and.demonstrations (Western Australia, File:1277/65). At first the appoint-
ment of laboratory assistants was recommended and made only to those Senior
'High Schools which gained new Commonwealth science blocks. This provided a.
C-pI.ecedent,as ihe.value of such appointments. could then be demonstrated. In
.1966,it was recommended that laboratory assistants bejaPpointed to other ------
schools, including some without new science blocks."' It was argued that theSe
latter schools were disadvantaged both by lack of facilities and lack of
f. laboratory assistants.' Following recommendations made in 1967, country Senioi
High Schools gained laboratory staff in 1969 (Western Australia, 1969:10). By
1970,81(percent of Senior High Schools and 25'percent of High Schools had
laboratory staff (Western Australia,-1970:4). Beyond that time the emplOyment of
part-time and full -time staff grew so that by 1975 all Senior High Schools and many
High School's employed laboratory staff. In addition, 1969 saw the appointment 1,
of technician at some Senior High Schools,who gave assistance in dispensing
and. maintaining ,special provisions and making equipment for some courses. A
Technical Officer for the Education Department was appointed in 1974 (Western
AUstraly, 1974). This.completed a coherent system of laboratory assistance
which began with the Commonwealth Science Program in 1965.-
While this development. would have been desirablein any circumstances it
is worth noting that it .began. in Western Australia, as a response to the Science
Fadilities%Program. Western Australia has been mentioned in detail because the
development of policy regarding the employment of laboratory staff.is better
documented inttEat State. Interviews with officials in some other States confirmed
that similar develenments,had'occurred elsewhere.
Curriculum Development
During the period over which the Science Yacilities Program operated a number
of new curricula were introduced to Australian schools. Some of these were
intended for senior students while others were more concerned to provide material
for'teaching junior science. Courses such as BSCS Biology and PSSC Physics were
adopted in most States. Other courses of more local application to particular
'States were also introduced. The new chemistry courses in South Australia and
.99.
Victoria and be revised science Courses in New South Wales were examples.
of this. In none of these courses was development funded dire ly by the, . ,i_.......---. .
instancesScience FacilitieS Program. However mimany nstances money f om-that Program
was.used to assist in 'the ttAal and implementation of suchnew.courses.
.,,,..0"
PSSC Physics and BSeS Biology were first introduced in Victorian schools
to Year 11 in 1965 and 1967 i'spectively., In both cases special equipment_
.
\..,'
was provided to assist s fools wb4ch were introducing the new programs. This
equipment'was provided nder the.Science Facilities Program (Victoria, 1966:P
A66/147). .Well equipped classrooms were found to be important in the trialslt"
of BSCS materials. The Director of the BSCS adaptation held the view that poor_ 4 0
quality rooms and lack of equipment would have imposed restraints on.implem-
enting the course in its.fullspirit.,3 Wh.itore the innovation would have pro-A-
ceeded in the face of such adversity it would have been truncated ili.oemespecific areas and possibly,in its genei,e1 success. The Director sought and
obtained from thr-Educatiort Department of VAtoria assistance With apparatus
`and material for state school commencing the BSCS course.4
Those schools' '
rece .:Special packs of apparatus according to their size and Biology enrol-
ments (Victoria, 1966:A66/147). The funds for this venture came from `the
Science FacilitieS Program.5
A similar procedure had been followed when PSSC
Physics had been introduced.
In Western Australia specific assistance was given twschools introducing
Biology in 1969. Funds were made available as a basiagrant of $250 plus a
pro-rata amount based on upper school'science enrolments (Western Australia,
File:1968/73). A little more than $1.6,000 was spent on this /- purpose and was
followed in 1970 by the investment of a further $25,500 to help the introduction
of BSCS Biology6
through'the provision of apparatus and films: In both casesA
the money came from the Science Facilities Program Giants (Western Australia,
File:1268/73). A substantial amount of money.was also made available for films
related to the Chemistry Study course which was introduced to all departmental
schools in 1969.
3 Interview, D.G. Morgan : 27 July 1976..
4 Private correspondence, D.G. Morgan./
5 'Minutes of Commonwealth Science Grant Equipment Committee, EducationDepartment of Victoria : Held by I.M. Hall.
6 Web of Life, or BSCS, Biology had been tried in schools in 1968 and in1969. It was intro Aced in all schools in 1970. The money came fromthe 1969-70 SciencelGrant.
1

109.
,
Inv. 'New South Wales the trial of new senior science courses began in 1971
.asan alternative to the then existing multi-level, multi-strand courses.7
The Board'of Senior Schdol Studies was responsible for these Niels in both'
government and non-government schools As the trials progressed more schools
became involved so that.by 1975 nearly half the schools in that State were
using trial materials in Year 12: The new courses were used for Year)11 by
all scbobls in 1975 and for Year 12 by all schools in 1976.8 At an .early,.
planning meeting'it was considered desirable that schools participating in
the trials should be assisted in obtaining apparatus and o4her material. That
assistance was obtained from the Science Facilities Program funds. The new....
;Courses used many of the concepts and ideas of BSCS Biology,. Chem. Studk.
Chemistry, and Harvard Project Physics. Some $80,000 was made.apiilable for
.each of the first two'years of the trials in 1971 and 1972. In fact the cost
rin 1972 was a little_more than this. Half of the money provided went towards
Providing text books and manuals for the schools participating in the trials,
and a further one-fifth was spent on films to suprt the courses. As the .
Board of Senior SchoolStudieShad no funds of its own to support the trial of
the new courses, the mater,i.almade available under the Science Facilities
4
Progi-am was important to the success of the venture (New South Wales, 180:70/4471,. .
In South-Australia some similar deAlopments were reported. A new approach
Ito Chemistry which employedsmell scale ekpetimentS and apparatus was introduced
in the mid sixties.9 While this approach improved safety, especially with
; .
respect to the production of noxious gases, reduced the cost of apparatus
and the consumption of large. amounts of ch micals, it was expensive to commence.
1New small scale appdratus had to be devise and manufactured:to suit the rather
,---
inventive experiments which had4een developed. Such .a venture yas,helpedby
the availability of- sufficient money to contract,the manufacture of this'
apparatus.10 Without such support the imaginative work of those developing the
7
. 1
The trial science courses:Mainly involved,Physits based on Harvard Project
Physics, Biology based on the BSCS program and Chemistry developed from the
Chem. Study materialS. There were also new Earth Science materials and a
few -other courses in varioussubdisciplines tried in the early-'seventies.
All the new courses increased tlz role of, laboratory work in senior-science.
8 The system of various, combinations of units of "singleStrand' and multi-
strand' studies, in principle,provides students in NeW South Wales. with a
wide choice.of scientific studies
9 S. Lberhard, V. EYers and B. Hannaford were the main developers of small
scale chemistry.
10 Interview with D.J. Anders:- 23 April 1976.
Ar 9

new courseewdull have had its 'impact blunted.. Similar support-assisted the _
introduction of Bi§logy in South AustralianigorefFent chools,° BSCS Biology:
beginning in 1967. Aastkecia4ly assisted 6y the increased capacity,to.
purcle..;.)
-, ...
new apparatus to servicean, inereasingly popular subject.
'314st examples of specific assistance for the ..i.Mpflementation of new_
curricula do.not.coustitute an exhaustive-list of such effects of Science
Facilities Program.^Other cases undoUbtedly exist whe' sch. records"
were not available. Moreover the implementation of- new curricula was also1
affectedby the existence ot better science rooms ii'schools. The general
existence of better-science rooms arrd more abundant basic apparatus changed
the parameters within which curriculum developMent could occur. Thus ASEP
Could be developed on the assumption that reasonable access to good.science
rooms would be pos'sible and that basic appaiatus would be availabIe in
schools. The Teachers Guide indicated-that the successful'use of A§EP
required good science rooms and the availability of certain core equipment
(ASEP, 1974:41). One former Assistant Diiectorof ASEP has explained that,
ASEP did not need to prodUce packages of equipment.because'most of the
equipment which was required was already available in. schools from the
Commonwealth Science Grants (Ramsey, 1974).. In Western Australia a new
set of activity Centred curriculum materials for Lower School Science was
introduced with _tha_Achievement Certificate in 1971. Prior to this a
survey of the availability of science rooms in schools was conducted. It
was considerbd important that classes using these materials should have
good access to science rooms. The materials were developed oq'the assumption
that this was the case.
In two ways the Science Facilities Program became a factor in curriculum c'
development and-implementation; The mosipbvious was the direct provision of
apparatus to schools implementing'new courses. Lessi,Gievious were the changes
in the limiting conditions within which those planning and developing curricula
material could operate. While not crucial to the success of the new ventures
the Science Facilities Program did remove.some important barrigrs. However,
the'very fact that small proportions of,the funds available to the' Statei. -
were diverted to help scpools adopt new curricula indicates that limiting
ttheProgram o the provision of science facilities was not in accord with the
needs of science teaching. -The implementation of the Science Facilities
Program shared several assumptions with the new curriculum projects. Not least
of these-was a belief in active participation by students in learning through
first-hand experience of scientific phenomena. Since it was a shared goal,
more co-ordination between facilities provivsien and curriculum development
may have been beneficial.. 1 3

;. 102.
..
The Supplyoof Apparatus
or of
The General Cohtext
k . 7'k -.A general development in the-system through which governme t schools ebtaiited
.i_jpparatus was that'of granting schOolS.moleautenomy'topr er apparatus wh
.
suited their conditions and In part this development coJ rresponded-
t1. 6',the devolutiOn.of autherity.for plannirkg curricula. As sChool science.
curricula diversffied it was necOtsarir. to Modify the central control of
apparatus supply. Thejmotivation.:t4 shift reAponsibility for the purchase and,
An entor bf'sei ratus to schools was also a,result of the growth of -
sc ool.sys ems Many became too large'for such minut to be centrally. admiri-
1S ered. There is also evidence that the Scien e Facilities Pregram.
Co tributed to the D.anges.Ai:ch occurred.
When the Science Facikties. Proimam began most States
re
we
to
th
P9
,controlled the
ply Of.a08 iatus to schools' through an annual requisition system, Schools A
uested apparattis and indicated exiSting.stock each year. The requisitions.
e assessed byScience'Inspectors,modified,and the material requested sent
sctiools.t.1)x22811. a stores branch. The Sciwe Facilities Prograllaltered,
s by making a liable additional funds. The requisition syStem whic
sibly suit the supply of bare essentials was not so appropritte when
became possible to provide schools witA more sophisticated,or special,app atus.
By.providing funds which removed pressure on the'supply system, the Prog am.'
enabled considdration of alternative means of providing schools with material.
In the early stages.of the ProgrdM problems arose whicii.served as salutary-.
lessons for later developments. Because su6 a la4 rgesse had to be spent'
promptly, bulk issues of equipments wer ade to all schools, with but minor)
variati to account for schpoi size. This procedure beCame the subject of4. 11
much public criticism. The supply of astronomical telescopes was particularly
controversial. It was claimed that those instruments were unwanted. and inapprcY,. 9.
priatein schools. The furore Which was gAnerated prOkably influenced the later
decision to allow schools cide"on the apparatus which they need40.
1.1 Spe r example the Sydney Morning Herald, 22 and 23 July 1968, The article
clai s soience teachers regarded the Science. Facilities money as mis-spent
" and w ld have preferred to be. allocated abudget.

Table 5.1.
Item
The Usefulness of Cert
Schools - 1967
Ten Most
APP
-Motion Projector
Microsoofe-s
n Items
1
Jr
Useful.MeanRating, t-
0.-
0
ofEqUipmeDXSURplied to
Tpn Least
t m ,3.9 Gla.s.. -rkers Burner°
. .\3 :9 Altra. Vco e amp'Refrigerator'
Dissecting Microscope
Power" Packs
3.8
3. 7..
3.7
Electrit Balance
0verhead'projecter
Rock SpeCimen Sets
Molecular Mo'dels'
Incltator2!
Notes:
qs.eful
77- men.Rat'ng
213
2.5 .
Wind MecT.e 2.7
.
.
centrifugb-24:7
\'Oscilloscope :2.8
0\
-.5..;.; Cloud Chamber '2.8'
. 3.5
3.5
3.5
3.5
)Thermograph 2:6
. .
.Barograph ° \ .9'2:9\
Telescope - 3.0
Pump\
Vacuum Pump \. t 3.0 4
a ,point scale : 4 = Very usefe1,4,3 ..Someyse.,a Ratings were on a our
2 = Limited use, l'..=,Tklo use.
h Items supplied to only 50 to 60 percent of schools.
44"
Reactions of Teachers
In 1967 survey oft, e'reaction of teachers in ene State to the'Science
Grants was conducted by the Science Teachers Association 'of Victoria. 12.
Teachers were asked to inpicate-the usefulness and quality of 36 items supplied
as part of the consignyents to Sehgel There was .only one conSis.,,tynt pattern
the i.ndications :_most respondents considered most items of satisfactory
quality. Interesting Ilfferences in the ii.ems.considered to be useful were
revealed. .rk listing of the most and least useful items is in Table 5.1. A
surprisingly iarge.number of the ten most usefn itemFoimereaudiovisual'ordisplai
materials: ..The remainder were items used by students. Among the least useful.
ten items was a preponderanct of items mhich would normally be used by teachers
-for demonstrations. However, the
)
12 The survey was conducted for STAV by D. Cohen but results have not been'published. The raw data was supplied to the Schools Commission or this -Project. 222,replies were received representing.a response rate of 50- .percent;'
rthan value's recorded indicate'that not,many.

104. 0\
4 444efulness of Cer.tkinItems of ApParatu 975,
Item
)E1Xtrie Balance
Model Skeleton -
5Aquarium Tank
. Oscilloscope
, s
4
Linear-Air Track.
Vacuum-tPump
TelescRpe
Na South Wales
aLingPerapntSchool's
3.9 '90'
. A. . joo
92
' 4
2.9
-11
(.Q5
'97'
84
,
Victoria -
Mean 'aRating . Scfiool
3.4. 84 °
3.4, 90
3.5. 90:.
'N a
3.2 92
3.2% 65
- 2. 6 80
2.2 95
Notes:.11;
a Items were rated oft a four-point Scale : 4 = Often
...usea, 2 ='Rarely used, 1 = Never used,'.
The percentage of schools reporting posSession of-one
has been recorded. -
used, 3 c Occasionally
or more-of the items.
teachers considered 'any items'withOutuse. Even the telescope was considered
to be of 'sod'' use. Some others (eg. the wind meter) may have found further
appli,cation'in Geography.
When the.Science Facilities Project was.
inators indicated theusefulness of a number
been ade.
.Resuits ha
sChodls.b
.consignments bro schools.. It isinterestingthat teachers in.these States hoid
such similar views in spite 424 teaching different yurricula:_ re astronomical
telescope is considered-only 'rarely' used. Of''coutse one mirght not reasonably
e,
. .
otherwise', It is,perhaps more,salient to indicate tAat only. 10 to 12.,11
percent of the schoolS in each'State indicated .tiiat the telescdpe was neveysed.
While such piece's of apparatus could well have been accordedIP
lower priority.
they are clearly used,albeit rarely, and are not wasted." : .
.
. a .
A similar result was also reported in the ScienceNewslefer ofthe
conducted in 1975 scie co-ord-
of'items about.which comment had
Table 5.2-rec,ords the mean ratings to each of 7 items ofeapparatus:"
ti
e been reported only for New South Wales and Victorian government
use only there we4 these common items madeavailable'bin the early
Victorian Education Department (1969:A69/1015).Some 90 percent of schools
forwarcled pl.iorityof apparatus to the Department in 1969. High prefer-.
ence was shown to items for pupil use (eg. light ray boxes, rock sets) as
opposedmo items for teacher use (eg. Van der.Graaf generators, gas syringegt).
a 1 1 66

11,
105.
Table 5:3 Preferred Method of Allocating Apparatus to Schools 1-
Teachers' Comments in 1967 ,
Present Method (Direct Consignment)
Science Teachers Select from List-
Direff Money:trant to Schools
N .Percent
65 31
-16_ 26.
4q: . 431
211 100
-,..
This confirms the pattern ofyreferenesdiscerned in both the STAV survey
and the SCience Facilities Project. survey,t-: .
. r'
Teachers responding to the STAV survey also answered sever 1 other -
ques ^ ^ns. response to being askedto indicate a preferred:method of .
allocation, two-thirds sought a method which placed more' responsibility with
schools. The-details are contained i4able 5,3. It is in that direction
that policy has shifted.
A. the time tha TAV survey was conducted most schools had only
experienced the benefits of the ence Facilities Program by.receiNing
apparatus. When asked about factors limiting effective use of apparatus. or.
other methods of improving science ed cation, other facets of facilities were
----the most freqUently-mentibned. It is urprising ti5at preparation time and
in-service education op ortunitiesow= e not more frequently mentioned; Table
5.4 contains a list of. t requently mentioned issues. While the. Science
Facilities Program has been said to have overemphasized the importance of
physical resources it should be observed that many science teacherp shared the
view that facilities were important to them:
Table 5.4 'Issues Related to the Use of Apparatus - Teachers' Comments in 1967
Limiting Factors Other Methods of AssistingComment ,ercent Mentioning Comment Percent Mentioning
Storage space 16 BobKs and Libraries- 21
Inadequate Science Rooms 14 . :Improved Bilildings 19 J
Lack of Blackout Facilities 14 Audiovisual aids/ 16/
NoInstructions for"Use 13 In-Service Training 12
InsuffiCient time .13 More Prep'aration Time -10
N = 224

106.
Changes inSupply-Systems in Each State
Two responses to the problems posed by. the availabiritnundstt,IFieh-
tific. equipment could 'be observed in several StatiO,ChOO1 Systems.,w0ne
involved the establishment offorms'of wider consultation on poli, the
other involved changes in administrative procedures sc3 that the was greatdr
devolution. Of authority.
Victoria
The advent of Commonwealth funds for equi!pMent in Victoria resulted in
the establishment of an ad hoc committee i help forMulate policy an the
distribution of apparatus. Membership of this body known as the.Componwealth
Science Grant Eloippent Committee varied over time but it contained Department-
al officials, Inspectors, Science Teachers and.Teachers College Lecturers.13
Initially it decided froM teachers submissions what could be. considered
able items of apparatus in a science department, bulk purchases,were arranged
and were followed by distribution, to schools according to a priority list
devised by the inspectorate.14
Several other developments modified this
.arrangement. The need to supply apparatus &r BSCS and PSSC.courses reduced
the finance available for geneial major apparatus. Increases in school
enrolments and greater emphasis on practical work meant that more Commonwealth
funds were diverted to stores branch for the purchase and supply of basic
apparatus. "When it was observed that the items supplied in bulk werenot
always the same' as those which schools deSired, a shopping list system was
introduced. Under this arrangement'schools could SeleCt,from a list,apparatus
they required up to an amount determined by the school enrolment. This Was used-,
for the Commonwealth funds from 1970 onwards and was later applied to. the
general equipment supply. Two problems of the shopping list were apparent.
Firstly, small schools were often unable to afford an expensive item. Secondly,
the movement of teachers could sometimes result in a new science co-ordinator being
saddled with apparatus which suited the idio:;yncraric interest of a predecessor.
To solve the first problem an allocation to establish parity between schools
'with respect to some basic items was attempted.but was quickly limited by dwindling-,
funds. The second probleni was tackled by inLtlating Droceduresugh which
'13' The Budget meeting 10 December 1969' was held at an inner city high school.In attendance were 6 Inspector's of Secondary Schools, 2 Inspectors of Tech-
nical Schools, 8 Science Teachers, 4 Teachers College Lecturers, an AssiStant
Director of Secondary Education, a member from stores branch and the Principal
and Science Co-ordinator of the host school. The sub-disciplines in which
they had qualified were Physics (5), Chemistry (6); Biology (3). Other Science
(2), Geography (2) and Mathematics (1). : 1 1 8
14k.
Minutes of meetings of the Committee were held by Mr I.M. Hall.

107.
1schools could exchange apparatus.
15It was an interesting attempt but met
with little, response from schoolS'. 'In- addition to this annual supply there
was a basickit of apparatus supplied to every new science laboratory.
New South Wales
Developments in New South Wales were similar to those in Victoria, In*
the first stages the extra. Commonwealth money was used to provide standard
equipment to all schools.16
This was in addition to the school science
departments.' normal 'requisition from State supplies. As a second stage from
1971 onward a Commonwealth Science Grant list was attached to the school
requisition:17
From that list schools could orderp to a budget of abbut
$150 .per laboratory. In 1974-1975 schools received a cash grant from the,
Science Facilities Program for science apparatus. A total of $311,000 was
distributed in this way. The. amount granted.depended on school size with
the most common'grants for High Schools and Central Schools being $900. and
$450 respectively -(New South Wales, File 71/25623). Schools had considerable
freedom in spending that Money,18
Some 'Kerns left in stock were allocated
to schools in need.19
When no more Science Facilities Program funds were
available all apparatus was ordered through the school requisition. How-
ever, the intention for the future was to develop a school based.sytom under
which schools could spend some of their entitlement through credit at the
.Government Stores Department anc1,use the remainder to purchase directly
from suppliers.s
1.
As in Victoria a Science Equipment Ad-visory CoMmittee was established in
1965. -1 This Committee determined items to be added to, and deleted from,
15 Interview With Mr I.M. : 21 October 1975.
16 As in VictoTia this included valuable (eg. oscilloscopes), unwanted (eganaemometer) and esoteric (cg. telescopes) apparatus. A AireCt distribution .system from suppliers who had been awarded contracts, to schools was used.Sqmc quality control spot checks were made.
17 FroM 1971 schools-were allocated a budget'to be divided among departments:General science apparatus was purchased, through government stores, out ofthis amount, The Commonwealth Science Grant List contained more specializeditems of equipment. Some Principals may have reduced the science share ofthe general budget. Interview with Mr C. Macdonald, 5 August 1976..
18 The general condition was that the money was to be used for science. Whereanitem was available from the government stores it was to be purchased there.Other items costing less than $250 could be bought directly while those worthmore than that amount could be referred to the Special Projects Unit.
19 Interview with Mr J. Jacobsen : 5 August 1976.
20 InterView with Mr C. Macdonald : 5 August 1976.
21 The Committee was composed of. nine Science Co-ordinators in schools, aTeachersCollege staff member, a Staff Inspector (who was Chaj.rman) and theSenior. Technical Officer (who was executive officer).' In recent years. twoCurriculum officers have joined the Committee.
1l -9
108.
N'....
lists sent,to schools and from'August 1970 published a series'of Science NpA.
Science Notes were mainly a guide for;-main rnance and safety of the
equipment supplied to schools but they also irovidp'cl a means for teachers
to comment on equipment.22 Suppliers who gave beit value were recommended
'by the Equipment ittee to the Stores Branch. While the Science Notes%
provided'a lot of info ation the Committee also used the network of'science
advisors toldnforce this aspect of in-service'education2 3
South Australia
South'Australia saw developments 'broadly comparable to, those in 'lbw
South Wales and Victoria. A basic bulk order system, with requisitions for
items not on the list was augmented by the Science Facilities Program alloca-
tion. At first bulk. consignments of goods purchased with the Science Facil-
ities Program money were made to sChools.24 This changed so that schools
could select from a Commonwealth Science Lis1,to the value of their alloca-
tion. Both the bulk order and Commonwealth allocations to each .school were
determined ly a formula which took account of science enrolments and the
amount of science taught.25 There were in the early seventies,special alloca-,
-tions for new courses, new Laboratories and small classes. From'1975/76 a
single comprehensive catalogue was used. Schools were allocateda budget,
ordered 'available items from the State Supply Department, and had received a
cash balance (in three. instalments). This balance was to be used for local pur-
chases', repair and maintenance.26
Thus responsibility for management of."'
resources was transferred' to schools...An interesting side issue was that
neighbouring schbols were encouraged:to group and thus share sophisticated
apparatus.
Adviceon the supply and purchase of apparatus to schobls from science
22 5or. examp1e, Science Notes.No.9 (1972) was concerned with the safety of
high voltage discharge tubes and of mercury spillage. It also asked for
suggestions regarding in-service-raining. 'Science Notes No. 8 (1972).
contained information about using a set of two organ pipes to demonstrate
beats and also some Uses of the pH meters. Science Notes No. 11 (4973)
contained suggestions for the use of the Overhead Projector. f
23 Science Notes 11, : 32-34 (1973) -ebntained a description of the Committee's
role and composition.
24 Interview with D.J. Anders : 23 Apri1.1976.
25 Statement prepared by M.Caust,,Education Officer, SA Department of Education.
26 Circular: to School Principals, 18 February 1975.

109.
t
teachers came from the Apparatus sub- committee of the Secondary Science
Curriculum"ComMittee.27
By_acting+as a liaison body with, schools it cqpld
investigate and seek to rectify problems of_supply. It has also been influ-
ential in developing policy for the supply of apparatus to schools and Iliv
f
even been responsible f
tr the cataloguing of items held in the State Supply
DepartMent (South Australia, 1976:7). It.isintereseing that the effective.
and influential Secondary Science.Curriculum Committee has been reported to
have had antecedents in the ad hoc groups formed in the mid-sixties to
proVide advice on the purchase of apparatus and -laboratory design. 28.
Queensland and Tasmania
. The Queensland Education Department ha$ also modified its method of
-supplying apparatus to schools.29 .Where previously schools requisitioned
items.from a list and their order was vetted and approved, now- -a budget
system operates. As in the previously mentioned States, schools can order,
up to a budget limit, the apparatus they choose. It is possible to order
'off the, list' but delay .time in delivery are rather long. There was no
formal apparatus-advisory group.
Tasmanian schools operated in a similar way to those in Queensland when
ordering apparatus% However, while the budget system had.previously applied
to science (sin'ce the earlier years of the Science Facilities Program) now
the school is allotated a budget and within the school the priority to each
subject area is determined.30
When schools have determined orders they are
collated and purchases made 'hrough the Supply and Tender Branch. 'Science
departments-are" able to order items off the budget list.
Western. Australia
Western Australia has continued to use a system of school requisitions
which are vetted by the Science Superintendent. The process begins in Febrpary
with-requisition lists sent to schools. Given optimal circumstances goods are
delivered in October. An automatic data processing system for keeping inventories. ,
.
27 The Secondary Science Curriculum ComMittee is a large body of more than"40'people. It works through a series of sub-committees : Agenda, Apparatus,Audio Visual% Book, Curriculum Design, Evaluation, Laboratory, Design andi_Science Centre. . It is influential in 'policy and involyes a large numberof senior scienceteaChers.
-...,
28 IntervieW with D.J. Anders : 23 April 1976....
29 Interview with G. Robins : 7 June 1976.
30 Interview with G. Fish : 24 May 1976
1

.110.
ofstbdks'is intended to Speed the process considerably. The firgt supplies of -
apparatUs purchased with CoMMonwealth funds were sent to all schools on the
bans of what was deemed necessary. After two years. the DisteM moved'towards
teacher rhoideba'sed on purchase from a list within a-sum IletermineA by.school.. _
.size. This was in addition tothe annual requisition'and applied'OnlY to ,
ComMonwealth funded .apparatus. ItwaS.COnsideteti tobeTh failure beCatise the
purdhhses reflected tla strongly'the personal preferences of the science co-erd-
inators. -,Those idiosyncratic choides Aid not alwayssuit-their sucreqssqrs. Agt
a result the'yenture was discontinued., Commonwealth money was used only f6i
equipping new laboratories and assisting the implementation of new Courses.,
Entrgies were devoted to deyeloping an efficient annual .requisitiOn systtm:-
The changes.in methods of supplying school's withapparatus fo4- ience
can be'partly attributed to the need to respend;to the increased iiversity
among schoolg while at the same. time retaining an efficient and equitable
system. -HOwever; it does seem that the advent of the Science VaCilities.
Program provided both the impetus and the opportunky to. make supplies more
appropriate to each school in the system. Methods tried in the Science Facil-
itiesjirogram were often prototypeOor the general systems which were developed.
At the very ltast the Program was a proving ground for new systems.
The Design of Science Rooms
Two developments pertaining to the design of science rooms over the years
1964 to 1975 are worth noting. The first was an increase in the extent. to
which people involved in science education were consulted about room design..
Secondly, there was a trend to emphasize more versatile multi-functional rpoms,
rather than fixed bench single purpose rooms.
Procedures.
The Victorian Education Department provides one example.of'increased sonsult-
ation-with'science education Orsonnel. A Laboratory Design Committed was
established in 1964. Of its seven members, six were experienced practising
teachers while, the co-ordinator was a senior. science.inspector.31
Its
31 At its August meeting the Assistant Drrector of Secondary Education and twomembers of theJublic Works Department were present. It received suggestions.
from two science teachers not on the Committde
122
A

.
recommendations of general.policy shaped the development of sciente rooms to,
be provided in.Vicrorian secondary schoels.32
. The co-ordinator prepared plans
which were considered in.detail before being modified-for.pr sentation to the
Public Works Department: Some differences arose between the Public Works,,
Department and the Committee over the width of rooms. Tye former favoured
24 feet width-which had been used to that date while thekinsPectorate and, the_
Committee, preferred a32 feet width. After lengthy disussion rooms were
planned with a width of 28 feet, S;'f-lit-.differencts/arose over whether rooms
should be free standing or added to existing structures. At the Very least
a-precedentof involving teachers in planning groups was established.
In QUeensland a similar group was respOnsible for reviewing theidesign
of0.) .
science labOratories (Robins, 1074:-5)-: However, it only-caMe into' .
existence in the early seventies and was not periirdnently established.
There was less provision for feedback from teachers thanY.Victoria. In
Queensland-the best designs were not followed in all laboratories: a distinct-
don was made between State funded- rooms.and.Commonwealth funded room's. ,-The
new designs only applied to the latter. Prior to the formation of this
informal group designs were drawn in sketch form by a science inspec6r and
developed'by-the Works DepartMent.
Since 1965 scienceteacher.s. in New South Wales have been involved in
planning school .scitnee.. facilities (Turner, 197.4:9). The planning was co-
ordinatedthrough the Schools Building Research and.Development Group' which
was established in'that year. This group was staffed by teacher's and inspectors
from the Department of Education as well as architects from the .Public .Work0
Department.- evaluated school facilities, prepared briefs sdhOol.design-
and undertook research in-the construction of buildings. :),1 The planning of
science facilities is,noW co-drdinajed by a research officer whois assisted by
the Science Teachers Building Advisory Panel. This group ofaboUt 24.peOple
comprised, nspectors and a diverse range of teachers. It is not clear'whether
this development had any link to the Science Facilities Program though it
The principal decision Was td support:multiTpurpose rooms rather thanseparate classrooms. and laboratories. . In addition.recommendations weremade about. the number of, rooms (4 in an 800 pupil school), the typejone'for each of ,Biology; Physics, Chemistry and Science) and reqiiisite features(2'doors, maSter,switches, type of furniture and'serviCes).
33See New South Wales Education Department, Public School Architecture in
, .
. .
. ..New South W4les.

.112.
-does appear that the Program did allow greateropportunity to experiment
with room design. A lot of the initial work of the Schools' Building
Research and DevelopmentGrOup involved science laboratories.
The LaborhtbryDesignSub-committee is one of the subsidiaries of the
Secondary Science Curriculum. Committeein.South Australia.
Its five members
include four science teachers-and one Principal Education Officer. Its projects
include aspects of science room design such as the provision of servicing'using
pillars, bollards and overhead trunking. Recommendationsoften resulted from
information obtained from school staff and were placed before the full Secondary
Science Curriculum Committee-. As a Tesult design features were considered in
the context of curriculumdevelopment before being
fbrwarded to the appropriate
section of the Education Department. It has been mentioned in relation to the su
pi6e:di of apparatus. that there was a practical necessity
to_obtain advice about'
laboratory design and apparatus at the commencement of the Science Facilities
Program. That informalnetwork-of advisory groups
was the precursor to the
.Science Curriculum Committee.
Design briefs for esternv Australianschools have always originated with
.-the Science Superi endents. The sieving of ideas and.trerids is therefore
based on the jud nt of those people : no formaldesig,groups have existed
until re ently. esigns of science rooms are now within the framework of a
.docume t' which outlines the general design. for high school complexes (Betjeman,
19,75). Similar documents guide planning in Tasmania for both High Schools
and-MatriculationColleges (Tasmania,:
1975a, 1975b). In Tasmania these
dOcuments were the result of work by two broadly representative committees which
worked with a series of.subjeet area sub-committees.Science was one
of the subject area sub-committees(ffudspeth, 1973). However, this-
.
procedure-b*n only in 1971.. Prior.tothat date a very informal liaison
_between ScienceSupervisor, the Buildings Superintendent
and the Public
Works'Department existed. In-the relativelysffalleducation systems in
=t,
Tasmania and Western Australi4 such informal communicationseems to have presented
less of a-probleth than elsewhere.
In Victoria it was possible to trace chhnged procedures in the planning
of science accommodation to the beginning of the Science Facilities Program.
',A similar development came later in Queenslandbut did not have the same lasting
impact. ,Evidence of a link with the Science Facilities Program in. South Aust-
ralia is largelyanecdotal while in New South-W Ies science room design Was but
1 24

113.
Table 5.5 Types of Science Rooms in Australian Schools
Primary Secondary
Classification Classification
TertiaryClassification
:1. Separate Facilities 1.1 No services. 1.2 Limited Services
(front bench only)
2. Fixed Services
3. Flexible:::Arrangements
1.3 No Teaching.Provision
2.1 'Bar-bench type(with services oneach bench)
: 2.2 Island benchtype
3.1 PeripheralServices (Move- ,
able writingtables in centreof room)
3.2 Service Pillars(with moveablebenches abuttingthese)
1.1.1 Classroom only.1.2.1 Lecture theatre or
tiered demonstrationroom
1.2.2 Demonstration room,1.3.1 Single Purpose.
Laboratory
2.1:1 Long benches acrossroomLongroom
2!1.3. Long benches acrossroom but split withcentre aisle.
2.2.1 4 to 6 seat islandbenches in room -all services
2.2.2 2'seat island benches
3.1!1 Sinks in benchesaround perimeter
-3.1.2 Runnel benches aroundperimeter
3.1.3 Perimeter serviceswith peninsula workareas sepatate fromwriting areaLong runnel 'pillars'with abutting benchesFixeAzillarSMobiTe"pillars' withoverhead trunking ofServices
2,1.2 benches down .
3.2.1
3.2.2
one function Of,the design group forffiqd in 1965. Design and planning procedures
used in Western Australia and Tasmania appear to have developed without the
Science Facilities Program having made a big' impact.
The Design of Science Rooms.
Trends in the design of science rooms in
schools have been in a similar
time at which new designs were
design it is worth classifying
both government and non-government
direction but there were
introduced. To consider
variations in the
thedevelopment of
changes in three stages. The first stage
saw the use of separate'rooms, or
The second stage resulted in dual purpose science rooms which had large fixed
areas, for laboratories and teaching.
.12.5

114.
work benches. Most recently, in the third stage, science rooms have been
developed which are more versatile and multifunctional. Rooms built in this
third, stage have often been called flexible. Table 5 contains a summary
of the typeS of science rooms built.
Stage one science facilities were discouraged in non - government - schools
by the Commonwealth Standards Committee from the outset of the Science Facilities
program. Nost State Departments of EdUcation did not proceed with separate
single purpose facilities. Lecture thCatres were provided in some Western
Australian science.suites when a team teaching concept, was .in vogue. Such
facilitie; are now useful as a school resource but not as a science resource.
Science blocks built in some Queensland schools in the mid sixties included
laboratories of a type unsalted to class teaching. An example is shown in
Figure 5.1. While some early South.AustTalian deSigns were single purpose
laboratories they were also suited tb class teaching. In general the concept
of separate teaching and laboratory areas was losing favour at the time the
Science Facilities Program began. Its demise Was hastened by that scheme.
The second, or fixed bench stage, of science room ddsign predominated in
the early part of the,Science Facilities Program. Fixed benches appear to
have derived from a concern to provide adequate services in science rooms.
Possibly this was a reaction to previous shortage though equally tail be
attributed to the need for stable working areas in Physics and Chemistry, the
sub-disCiplines for which new facilities were then being provided. Variants
of this design are evident in rooms which have long benches either acrosp
room's. or down rooms, and in those rooms where the long fixed benches 'are
divided to giVe a centre aisle (Figure 5.2). The island bench design_
used in New South nips government schools'and ;shown in Figure 5.3 is
nother variant of this theme. It was used in a State where senior as well
as junior curricula involved multi-strand science and was possibly intended
to cater'for that circumstance. Science rooms with fixed benches are still
being built and are favoured by many science teachers because of the stability
of work areas and the easier accessibility.of services.
A combination of pressures to reducethe cost of science rooms and-to
,13roVide facilities for-courses such as BSCS and ASEP led to the development of the
stage three science rooms. ,
These rooms, which give emphasis to one or other of.
the meanings of flexibility, were conceived in the-late sixties but few examples
were built,, until the seventies. Among the various forms of thi-s concept there
2(i
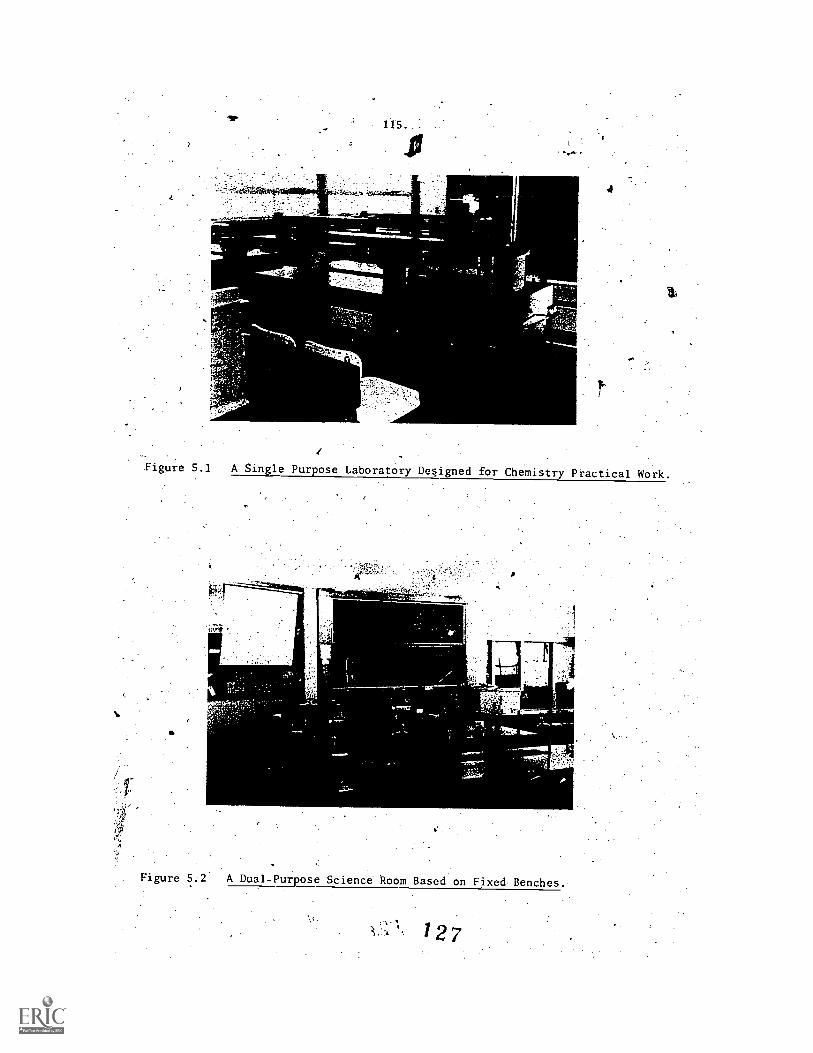
I
r. .
Figure 5.1 A Single Purpose Laboratory Designed for Chemistry Practical Work.
Figure 5.2, A Dual-Purpose Science Room Based on Fixed Benches.
:
127

Figure 5.3 An Island-Bench Des* Science Room.
Cy
Figure 5.4 A Science Room with all the Services at the Perimeter of the Room.
128

117. r
ag.
Figure 5.5 A Science Room with Peripheral Services in which the Deskshave been Arranged for Discussion Groups.
.tfabie
mm..-
Figure 5.6 .A Science Room:with Separate Laboratory Work. Areas at theEdge of the Room.
1 29

118.
1.1.-"7.27,141
5.7 A Science Area Incorporating Service Pillars and Movable Benches.
The Benches have Holders for Trays of Equipment Obtained from the
Service Wall of the Preparation Room:-
S.8 A Science Room with Elongated Pillars and Movable Tables.

119.
are two groups. In one group the emphasislids been on peripheral services,
and work areas, with movable writing tables in the centre of the'room. The
other approach involved providing services at pillars to which movable-/
benches could 'abut.
. Peripheral services carried the advantage.of separating work areas,
with their associated mess and temptations for vandalism, from the commonly
used writing areas. This approach is evident in the mostA!centlaboratories
provided to government schools in Nei South Wales (Figure 5.4), Victoria1
(Figure 5.5),'Queensland (Figure 5.6) and elsewhere. It can also be seen
in some of the designs used by non-government schools.
Service pillars provide better access to services without students
having to move from their work place. A good example of this approach to
the design of science rooms has been shown in Figure 5.7. Rooms intended
for Chemistry in Victorian schools incorporated elongated 'runnel' pillars
with abutting benches (Figure 5.8). The boldest attempt-at flexible
laboratory space incorporated the use of mobile pillars which plugged into
service points trunked though the ceiling. This was tried in several South
Australian government schools but the pfactical problems have proved too.
great and the approach has been discontinued.
oChanges'in the dr8-itn-of science rooms have occurred over the course
of the Science FaCilities Program. It is probable that changes would have
taken place vithouti.the Program: However, the stimulus given to the design
izof rooms by the large amount of money - available possibly hastened the
.changes. It also lessened financial constraints which would have inhibited
the use of some design features.
Summary
A range of developments in science education were influenced by the Science
Facilities Program. The provision of laboratory assistants, new curricula,
apparatus supply systems which were more sensitive to the needs of individual
schools, and more adaptable room designs have all emerged. All have affected
science teaching across systems and have been at least partially influenced
by the Science Facilities Program.'

CHAPTER SIX-
ROOMS FOR TEACHING SCIENCE
Looking at Science Facilities
In Chapter Three the development of the. schoof questionnaire was discussed.
Part-of that questionnaire was concerned with the adequacy. of school science
facilities. Information.was'sought about. four aspects'of science facilities.
1- Whether the school had an adequate number of science rooms..
2 Whether the school had science rooms of good quality.
3 Whether there was 6ufficient.apparatus available, in the school:
4 Whether the schodl employed laboratory assistants in science.
In order to examine the intercorrelations between these aspects of the.
questionnaire a factor analysis was carried out. Variable's of different
sorts were included in the analysis;
1 The indices of room availability for science lessons (Q1 and Q2);
2 The total.number of science rooms and the number of dual purpoSe
'science rooms.per 1000 students (L1 and L2).
3 The functiooal,adequacy, or quality, of the school's science rooms.
The number of equivalent full time laboratory assistants per 1000
students and, per 10 science teachers.
5 The direct responses,of the science co-ordinator to questions about
the adequacy of 'expendable',.'minor', and 'major' apparatus.
6. The Science Co-ordinators' ratings of the degree to which various
features of the school's science faCilities impeded practical work.'.
TheSPSS program FACTOR (Nie et al, 1975:.468) was used. In the analysis
reported in Table 6.1, four _principal components had eigen values greater
than 1. When a:varimax Notation of these components was undertaken the four .
factors extracted had.the loadings shown. From these'loadings it was poSsible
to'icientify the four factors:
l' The availability of science rooms.
2 The provision of support staff;
3. The abundanee GINNparatus in the school.
4. The quality of science rooms..in the school.
Thus the structure of the questionnaire was confirmed. It therefore appeared
reasonable to' consider each of the original four. aspects of science facilities
121.
1,3 2

122.
Table 6.1 Factor Analysis of Responses to the Questionnaire:
Science Facilities in Australian schools.
Variable Factor Loading
1 2 3 4
Functional adequacy -60.
Basic apparatus impedes experiments -77
-Laboratory. design61
Preparation time -51
. Lack of assistance -68
Lack of storage space 65
Expendable apparatus 68
Minor, apparatus 71
Major apparatus41 61
Laboratory assistants/1000 students 84
Laboratory assistants/10 teachers 83
Science room availability (Q1) 76
Dual purpose room availability (Q2 ) 79
Science rooms per 1000 students 90
pUrpose rooms per 1000 studentg 88
Proportion of variance 24.0 22.8, 12.9 9.0.
Note: Only loadings greater than 0.30 have been recorded and decimal point's
have been omitted.
separately. The-nekt two chapters present analyses of these four aspects of
science facilities'. This chapter is-concerned with science rooms: their
abundance and quality. The next chapter considers the supply of apparatus
and the presence of laboratory staff as conditions necessary for the effective
use of rooms.-
Three types of data were used,toexamine each aspect of school science
facilities. Objective, information was provided by the various indices of room
availability and laboratory assistance developed in Chapter.Three. The science
co-ordinator in each school provided informatior(about the functional. adequacy
of rooms and the stock of apparatus. The science co-ordinator also provided
an 'opinion about the degree to which different aspects of the school's science
facilities impeded practical work. These three types of data were considered
complementary Means of obtaining information about sch bo 1.science facilities.
133

123.
Table 6.2 Science Rooms Built or. Renovated Since 1964 in SchoolsEstablished Before 1964.
Government Catholic Independent
% Schools %-Schools % Schoolswith <20% Mean % with <20% Mean %. wiN1 <20% Mean %New Rooms New Rooms New Rooms New Rooms-New '',60ffreNew Rooms'
New South. Wales 5 60 0 .90 8 54:.
!Victoria 8 53 0 -85 7 7S
Queensland 8 59 10 . 86 7 83,
South Australia 14 47 0 -.46 0 81
Western Australia 6 57 9 81 0 87
Tasmania 10 --..74 0 . 96 0!'. 86V
Australia 8 57 2 87. '6 73
The AvailabilitLof Rooms for Science Lessons
The Contribution from the Science Facilities Program
One measure of the impact of the Australian Science Facilities Program on
science .accommodation was the number of additional rooms ;received by schools
.whiCh already existed in 1964. In some States it was difficult. to establish
the source of funds prOvide'd for each science. room. Therefore the total
rebuilding program since 1964 was considered rather than'only those rooms.
identified as provided through Commonwealth funds. An additional reason for
this decision was the Commonwealth requirpment that State governments should
continue to provide funds for some rebuilding of science rooms.(Smart, 1975:
170). The results In Table 6.2 were obtained from the school,questionnaire.
These results show that very:few of these previously existing schoOls had
less than 20 percent of their present science rooms added since 1964. Most
.schools of thig vintage had 40 percent or more of their present,
rooms added during the period when the Science Facilities Program was
operating. The mean for government schools was S7 percent. By Comparison
mostnon-government schools had more than 80 percent of present rooms built
since 1964. Thus while most schools in Australia received.additional science
rooms, non-government schools gdined:m e.new rooms per school than govern-
ment schoolt,
13.J

124.
In addition to noting the differences between goveionment and non-government
schools, two other comments about these, data seem' warranted.' ,Firstly, the
post 1963- buildingprogram had its greatest impact on Catholic schools.
This probably. reflectsthe poor conditiOns
Which existed in those schools
-before 1964. qhe Science FaCilities Program appears. to have rectified that
problem. Secondly, the non-Catholic Ihdependentschools in New South Wales
appear to have gained less benefit than their. counterparts.in Other States.
The explanatIon for this probably lies in the bistory of the Industrial
Fund. The Fund was most active in New South Wales (Smart, 1972): Hence,
for the Independent:schools in thatState, it pre - empted the Science
Facilities Program.Schools which were
assiste(12,by the Fund would not save
beenet assessed as needing so many additional rooms. from the Science Facilities
Program.
Science Rooms for 'Science Lessons
It has been, observedpreviously that a number of authorities was responsible
for administering the Science Facilities PrOgram. These authorities used
different criteria to assess the number of science rooms which a school --L
needed. Table 6.3 shows the correlations between the indices of need which
were derived fromcriteria stated in Chapter'?Three.
All were found to be
correlated..However, two groups were distinguished. One consisted of those
indices whichrelated the number of rooms to the amount of science taught.
The second group of indices related the number of rooms to the school enrol-%
ment. One 'index (Q 7), which'wasbased on Clueensland criteria, was poorly,.
correlated with the others.
Table 6.3 Correlations Between Various Indices of Need for 'Science Rooms.
Q1 Q2Q3 Q4 Qs Q6
L2 . Q7
Q1
(Commonwealth)89 100 61 60 7 '60 55 35
Q2(Commonwealth)
89, 56 ,. 55 49 . 58 62 '21
Q3 (WA)61 60 57 '60 55 35
Q4(NSW)
'94 90 99 97 42
Q5 (Vic),.
81 . 92 89 21
Q6(SA)
89 86 63
.L1
97 48
L
43
2
Q7 (Q1d) 1 a 3 ,.
Notes' a Decimal points have been omitted. 2
b Indices are doffnd on pages 44 to 47'.

125.
'Cable 6.4. Availability of Science Rooms in Secondary Schools (Q ) in 1975(Percentages of Schools in Each Category)
Government 'Catholic, Independent Total ,
iLess than -30 11 8 1 10
-29 to -15 27 19 5 i 2A
-14 to O. 27 16 23 25
1 to, 15 t4 .9. _ 31. -14
16 to 30 . 16 13 - . 27,.F .11
Greater than 30 11 34 13. ' 15
Total 100 147tr 100 100
''Number of Schools 230 89 76 -415
Two authorities, the ComMonwealth Standards Committee- and the Western
Australian Education Department, assessed the needs of schools aCcording7to-
;he amount of science taught. The influence of the Commohwealth Standards
Committee on government policy for funding the final qUadrenniuM of the.'
Science Facilities Program was cliscusse4 in Chaptet.Four. -Tarticulr4mention
was made of the fact that the final .quadrennium was intended to meet school
needs which were known to exist in 1970. In practice only the needs of non-
government schools were known accurately. The amount of money, to be allocated
to government schools was calculated in proportion to the sum determined for
non- government schools. One measurelerTlitiveness of the Science
Facilities Program could be cons-idered to be the extent. to which the
availability of science rooms in school's at the end of.the Program satisfied
the criteria 'of the Commonwealth Standards Committee. Two indices which have
been'discussed previously were used: Q1. related available.science rooms to
the numberof'rooMs specified by the CoMmitte0s formula. Values of Q1
were
the percentage-excess of science-rooms Mich a scjiool possessed relative to jts
assessed needs. -Its assessed needs were based on provision of sufficient
science rooms for every lesson and an allowance of 25 percent non usa. An
ideal.value for Q1would have been zero, Q
2was similar but considered only
those rooms which were aquiPped for'students to do-experiments-.
Values eft q1
and Q2
were calculated from-information 1n'ovided in October
1975, just three months after the Science Facilities Program fihished.
Therefore, It was possible to use this data.to assess whether the Program had
met the needs of schools for science accommodation. The/results in'Table 6.4. a
show the percentages of Government,.Catholic.and independent schools with
LZ

126.
varying levels of science room provision. {~'here the_value of .Q1waslesS
-30 the school wasconsidered seriously deficient in that it had too few
science robmsto possibly accommodate all science lessons. Schools for which
Q1 was less than -15 but greatet.than -30 were classified as
Science lessons could be held in science rooms only at. the Cost of imposingr
restraints on the scheduling of other classes., 'Even so, insufficient time
would have beenavailabie fotithe maintenance.and,servicing. "o science rooms
. '
,to allow them (:),1)6 used to best advantage. A value of Q1
equal to -fs
Corresponded to the 85 percent room usage regarded" as suitable by the Western
Australian Education Department (CDE Fije,68/2764(147)). Those.
schools which`
hadavalueof%greatcr-than -15 but less than.0 were regarded as having an
adequate, but less than ddeal, number Of science rooms. It was possible for.
such schools to accommodate all science lessons in'Science rooms with only
minor inconvenience:
than..
It was clear thai.at'ihe' conclusion of Science FaCilitiesTrogram the
provision of Science rooms. in Australian secondary schools was better than
in 1963 when two-thirds of- science classes were not held in science rooms.
Yet from the data in Table 6:4 it was also 'apparent that about one tenth of
schools had a serious shortage of science rooms for their heeds an an
additional one quarter had a shortage which would impose constraints upon
the teachint they prOvided. -Morebver it was. in, thegovernment schools that
the deficiencies were'most'markcd. Very 'few Independent schools had a
shortage .aT science rooms.
The same cut-off points-were'applied to Q, This implied that"that" only rooms.
equipped for students to do experimentsiwere satisfactory science room's. To
assume this is possibly a little hdrsh tut it was the'cicar preference of the
COmmonwealth Standards Commitfee to build dual purpose rooms .(Commonwealth of
AuSt,ralia, 1976 : 15-16). The results obtained by applying the same" cut -off
points to Q 2 as were "used" for Q1 `arc Shown in Table.6.5" It can he seen that
-an.even treater difference e'xisted between goKernment and non-government schools
: when dual purpose rooms alone were used. Nearly one quarter of the government
schools were seriouslydeficient in dual purpose rooms. Restricting. science -
rooms to those; 0-quipped for student experiments made. little difference to
non-government'schools :only a few could be considered seriously deficient.
The "comparison of government with non -government schoolS across'Australia
Suggested.non-government schools were better provided with'scienceTooms.
HOweverthe :administrative units responsible for implementing the Science
137

127.
Table 6.5 AvailiOilitx:of Dual, Purpose Science Rooms inSeceildary Schools (q.,) in 1975
Cs.
Gov") nment Catholic
Less than -30 ' 8)3 .
IfiCeperident
1
Total
19
-29 to .-15' 29 . 19 10. : 26
.7714' to ..,0 25 . 18 27 24.
1 to 15 \.. 9- .i 16 .33 11
16 to 30' 41, :17 :19 8
Greater thOn30 9 28 .: 10 12
.. .1..
Total Y100 100 100 100
Number of Schools .230 89 76' 405
Facilities Rrogram included State EduCation Departments as well as the
Commonwealth' Department of Education1
Therefore it was necessary to compare
the.availability of science rooms in different States. In order to shoW the
variation between andwithin the school systems in the States two statistics
were compUteth The mean valueS of,Q1
and Q?were recorded in Tables 6.6 and
6.7 respectively. In addition, the percentage of schools 'seriously deficient'
in science rooms (Q1less than -30) or dual purpose science rooms'(Q leSs than
-30) was entered in eachJable.
Table 6.6 Room:AvallaWity (04) for School Systems in Each State in 1975:
Government Catholic independent'
Mean %i a -30. Mean . <-30 Mean % <-30
ACT -8 0 25-. 0. 16
New South Wales -8 .13 0 . 13 7
Victoria 5 33 7 14
Queensland..
16 13 48 : 0. 13 -6
. South Australia -12_
18 18 13 8
Western Australia -8 6 -2 6 6 8
Tasmania 13 10 28
Austral is -3 11.-- 17 8 ..`12 1
1 Refer to. Chapter Four for a description of the changeS.in Iitle of-theCommonwealth Departments which were involved.
138

128.
Table 6.7 Dual Purpose RoomAvailability (Q ) for School Systems in
Ea State in 1975
`P.
Government . Catholic Independent
Mean . %<-30, Mean %<-30
ACT -8 0 25.:
0
New South Wales -14 24 -5 13
Victoria -7 8 30: 7
Queensland -10 27 48 0
South Australia -21 40 10 8
WeStern Australia -21 39- -3 6
Tasmania 7 . 29 4 10
Australia .
o -12 23 14 8
Mean %<-30
8 0
0C/'
8 0
6, 0
7 f '8
6 8
21'
6
. a
The data which are recorded in Tables 6.6 and 6.7 provide a more complete
description of the availability of science rooms for. science lessons. It was
apparent that in addition to variations between the mean values for StateS and
schOol systems there were variations within systems.Moreover there were -
greater variations within some school systems than others. Roman Catholic
schools not only had .a higher mean for Q and Q 'than other non-government
schools but they also included'a greater proportion of schools seriously
deficient in science rooms. That school system contained both well and poorly
provided school: In part this can be explained-by the general diversity
within the Catholic school system which includes sell establishedcollegesas
well as small parochial secondary schools. However in addition to this the
variation of Q1'
and Q2within the Catholic
school'syStem increased as a result
of changes in its administrative structure:(Bourke, 1974). As far as possible
the Commonwealth Standards ComMittee took account of the structural change
'in Catholic education(CommonWealth of Australia, 1976). Indeed: the Committee
occasioI -ly encouragedneighbouring schools to. share science facilities. Yet,
-in spite of this, the process of consolidation and reorganization resulted in
some science rooms being built in schools whose secondary enrolment subse-
quently
.
declined or ceased while other schools grew, so rapidly that their.
science room provision was nolonger adequate.. -in one country 'town, visited
by 'the Project Officer, a Roman Catholic school had a science room provided
through the Science Facilities Program but had since ceased to enrol secondary
students. The gbvernment:school in the same town was sorely pressed for
science accommodation.
3

129.
Variation also existed among government schools in Queensland. The
mean value for QIwas higher,than for other government school systems. Q2
was lower than Q1, indicating a high, proportion. of demonstration rooms, but
still reasonably high compared with other government school systems. Yet an
unexpectedly large number of schools.were, seriously deficient in science
rooms (13 percent) or dual purpose science rooms,(27 percent). This can be
explained by an uneven distribution of science rooms. One contributing
W---.
factor.- was the diSparity between metropolitan and non-me oliton schools in
Queensland. The data in Table 6.8 show the mean values o Q1 and Qafor1
,schools in urban and rural locations. In Queensland ,the disparity U.greatest.
Even within the metropolitan region large variations existed.. Two schools
which were visited had anatiundance.of science rooms as a result of a' decline
in student enrolment.. Facilities provided when the schools were larger now
servecia,declining number of students,
In Tasmania also there was an apparent discrepancy betWeen the high mean
values of Q1 and Q2 and the large proportion of schools considered serifously,
deficient. This discrepancy arose not becaUse of marked differences between:
metropolitan and non - metropolitan Schools but rather betause of the difference .
between High Schools and -1atritulation Colleges. Matriculation. Colleges are.,
. well provided with science rooms (Q1
= 72). Other secondary schools'do not
have such an abundance of science rooms (Q1 = 711.
Table. 6.8 Mean Values' of Room AvailabilitL'(Q4) and Dual-MI-pose RoomAvailability (Q,) by School Location for Government. Schools in 1975
-.".
Q1Q2
Metro. Non-Metro, Metro. Non-Metro.
ACT
New
, .
SoUth Wales
Victoria .
.-8
-8
-3
_
-9
-3
-g
-14
r.6L
-13
-9
Queensland. 33. 6'. .5 -21
8outh'Australia -15 -6: ,-,27 -8
Western Australia -13 0 -28 . -7
Tasmania 10 15

130.'
Grouping Schools with Similar Provision.of Science Rooms
To extend the description of science room availability across all possible
categories of.schools by State, school system, location,type, and coeduca-
tional status would have produced a voluminous set of tables. It .was
therefore considered useful to cluster schools according to the extent with
which they were provided' with science rooms using a technique known as the
Automatic Interaction Detector, or AID; (Sonquist and Morgan, .1964).
The application of the AID to this problem has been described elsewhere:
(Ainley, 1976). The criterion used was the availability of dual. purpose
rooms, Q2. The predic rs entered were tliose characteristics by which
schools are common y identified: State, school system, location, coeduca-
tional status and type. School type referred to the number of years of
secondary schooling offered. The splitting was controlled by specifying that
the variance should be reduced by at least 0.6 percent as recommended in the
OSIRIS manual (Institute for Social Research, 1971). and alSo that each group
should contain at least fifteen gases so that small idiosyncratic.groups
were not formed:
The sample first split on school type with schools.which proceeded only
to Year 10, together with Matriculation Colleges, being better provided than.
other schools. 'The upper group split.further between States as shown in
Figure 2 while the lower group was next divided on school system with non-
government schools being better provided for than government school -s.. The
full pattern of the splitting is shown in Figure 6.1. The terminal groups
of schools which were formed aEp described in Table 6.9.
The AID,: at each successive step, forms groups which 'account forthe.
maximum possible amount of variance in the criterion. The terminal groups
therefore represent the clustering or grouping of schools which 'explains'
more of the variation in the criterion than any other possible grouping based
on those ''predictor' variables entered. Thus the classification formed is
the me -_.economical description of the availability of science rooms.
From the AID analySiS it emerged that three variables were most iffortant
in distinguishing schools on the basisof dual purpose room availability.
These were type, school system, and State.
Schools which only enrolled students up to. Year 10 had a greater number orA .
science rooms for the amount of science taught than other schools which offeredAd.-.
complete secondary program. This was because senior students generally placed greater
demand on science rooms than students in Year 10 and below. Throughout Australia
1 4 1

10 State NSW, I
44 wA,
0 02 100
140
130
110
100
80
70
4 98..7
All Schools
4 120.6
3
73
School 'finishes at
year 10 or liss or
starts at year 11
1 :5.49*,
4 152.4
7 School System
139 lion Govt.
107.2
0=105.9
State
las WA.
a =9381 747 "'
12 School goes to
321 I year 11 or 12
Group Number Mean value of
IT: 96.1
Number in Group Splitting characteristic
Notes:
(1) Smallest group size 15
(2)N :394
(3) i = t-value of split
T 2.82
*'State ACT, Vic, Old`SA las.
14 89,7
0.7:96,1
lop Metro
T 2.41
5:43.61.72.91..
5: 80.22
78.4.
r98 [State NSW, SA
9
[State
figure' 6.1: AID Analysis to Determine Distribution of Avallabilit ooms in Australian Secondar Schools
12
Lou Non Metro

-r
132. _,,
studenfsin Years 11. and 12 study sufficient science to result in an average
of more than one science subject per student. This can be seen for.Year 12,
in Table 6.14. Since these subjectsgenerally occupy as much time as the
single.junior subject,Science, studieS in Years 11 and 12 make greater use
of science facilities than Years 7 to 10. In addition to this, schools
which iproceededonly toYear 10 (except Tasmania) were often non-government
schools and were often small. Their, smalisizemeant that their one or two
science rooms adequately met their modest requirements for science
accommodation.
Table 6.9
i
Clusters of Schools with Similar Provision of Science Rooms
Terminal
Number of % c
Group Q2 aDescription of Group Sample .
14
Number, MeanSchools yr.
. in Group olds
8 -21.6 Government schools proceeding to 99 42
Year 11 or 12 in NSW, SA and'WA
12 -19.8 Government schools proceeding to 33 13
Year 11 or 12 in non-metropolitan
14iareas of VIC and QLD
13 -4.9 Government schools proceeding to 50 20
Year 11 or 12 in metropolitan
areas of ACT, VIC and 'QLD
10 -2.7 Non-government schools in NSW and 44
WA which proceed to Year 11 or 12
45.9 Government schools in TAS
band 50
those. schools in WA which peedto Year 10 only
11 .
11.1 Non- government schoolS in states .95
'Other than NSW or WA which
proceed to Year 11 or. 12
52.3 All schools in NSW, VIC-, QLD Cr . 23
SA which proceed only to Year 10 or 4:
less
Notes: a
9
. .
, .
.
t ..):?.,t.'--;.::Y:...
An ideal value of Q2would be zero (o), A positive valu4 ..i.pdicateSeff'
excess, while a negative value indicates a deficit. -. , ,
.. .
The seven Matriculation Collegeswhich-forM part of Group 47.110.0, 4,
higher value of Q than the'restvf the group. An AID analysis,. which :,:.
specified a smaller group size would separate these fro'm schliqls.,-i4111W. .
proceed, only as far as Year 10'.
..
This column shows the percentage of 14-year-olds throughout t1is,tfadi.: HI.t,:-.,-,
in the schoolsdescribed in each group.
&.-,
.7. .-
.-
143yp,

133.
Other splitS:Made by the AID reinforced the diVisions discussed previously.
The results confirmed the importance Of the school system by indicating that it
accounted for more of the variance between schools than'any variable other
than school'type: and it has been observed that type was partly associated.
with syStem. Differences.existed.between States for government schools and,
to a smaller extent, for non-government schools. The latter differences
would,be expected on two grounds.' Firstly, the .allocatiOnof money for the
Science .Facilities._ Program was divided between States on the. basis of school
population and took no account of differing emphases on science. Secondly,
State Education DepartMents (for government schools) and State Advisory.
Committees (for non-government schools) differed in the proportion of their
allocation spent on buildingg"rather than equipment (Smart, 1975). For
example; among non-government schools,-Western Australian Independent schools
placed greater emphasis en equipMet. This was also true for. New South Wales
Independent sthoolS. In 1075 thes.o schools were among those which werojes4 well
provided with science rooms than their-counterparts elsewhere. By contrast
the Western'Australian Education Department allocated .a large pioportion of
the money available to them to buildings..
Metropolitan schools were significantly better provided than non-metropolitan
schools only in the governMent.chool systemS of Victoria and Queensland. In
no other case was a split madU' on the basis of location:. Nor was there any
difference detected between girls, boys and coeducational schools which was not
previously removed by the school system to which they belonged. One of the
disparities which existed at the beginning of the Science Facilities Prograd
was that girls:khools were ill - Quipped for science. It seems that-that
disparity .has nowteen remOve
.< .
The Prdvasionev.
So far this chapter .has cons4dered 1114.-qvailal.?eielice rooms fqr the
science lessons taught each weeR.:4fhiSCOri**pOneWcV:e0r,the approach of theAA
Commonwealth Stanclifrd coMMittee. AvjiihWk,v.W Ivhbe rooms was believed .%.
to be a potentiar'i4fliienCe upon th 4 IA 1(4ence teaching which was1.% '
conducted. However the indices Q1-
and berestimate the provision
ofroomsinschoolsWhich.t6aChmuch.i:Ornaggerate the provisions .in
those which teach aydiminished amount. Ilence; variations between States were
due not only to differences in the provision of science rooms in schools but
to different demands made upon science facilities. Varying demands'upon the
science facilities prOyidedeould have arisen from three sources.
144

134.
Variations existed in the time allocated to Science each
week for Years 7 to 10.:
Some students in Years 7 to 10 may have studied. no Science
at all and therefore not used the facilities at all.
Schools differed4in the extent to which senior students in
Years 11 anA 12 chose to study science subjects.
The Demand placed upon Science Facilities
From theAnformation provided in the responses to the questionnaire it was
possible to calculate: .
11;
1. the amount of time alloCated to science teaching per week for
studentg who studiedscience in Years 7 to 10,
the proportion of students at each Year level who did not study
science at ail,
3 the average amount of time spent in science per week for
students in Year(by combining 1 orid.2),and.
the proportionVYear 12 students enrolled in .science subjects.
This fourth calculation used a Science Enrolment Index. The value
of this Index was calculated .for each school by dividing a
weighted sum of science subject enrolments by the total Year 12
enrolment. Thcwcighted. sum was calculated by scoring students
enrolled in one science subject as one', those enrolled in two
subjects as two, etc.,and Weighting enrolments in each of the
Wyndham Science courses in NSW .(about half of the school's in
1975) in an appropriate way. This procedure may be stated as
follows:
E Ei Ei = the enrolment in each Science subjectS where T = total year 12 enrolment.
,.and for Wyndham Science Sehools in NSW
E Ei WiS.. -------- . where Wi the weight applied to each level
.-2.0 for level 1
= 1.5 for level 2F1.0 for level- 2S and level 3.
The amount of time allocated for the teaching of science differed signifi:
cantly between the States in each Year level. From the data in Table 6.10
it can be'seen that in Victorian schools"rather less time is spent in the
study of science than:in other States,: By eontrast in Western Australia,
45

135.
Table 6.10 Mean Number of Hours. per Week per'NClass Allocated to TeachingScience in 1975 (Science Students only)
YearState
7 8 9 . 10--
-/
ACT 3.4. 3.3 3.4 3.7
New South Wales 3.4 ' 3.4. 3.4 3.7
Victoria 2.3 2.4 2.6 3.1,
Queensland "3:3 3.6 5:6
South AuSt,raIia - 3.1 3.8 3.9
Western AuStraliai
- 4.0 4.0 3:9
Tasmania 3.2. 3.2 3.4 3.5.:\
Australia 2.9 3.1 3.5
. .
Note: The data in this table have been calculated for those classes whichstudy some.science. Non science classes have been excluded.
wheie science is one of four subjects in the Achievement'Certificate 'corer;
considerably more time is spent in studying science. Only Year 10 students
in South Australia study as much science as students in Western Australia.
There was no significant difference in the time given to science between
Government, Catholic and Independent schools. 'Neither was there a signifi-
Cant difference between boys,:girls and coeducational.schools. However,'as
can be seen from the data.in Table 6.11, Year 7 and 8 students. in non-7
metropolitan schools spent more.time in science lessons than their city4
'.counterparts.
Table 6.11 (tan Number of HOUrs per Week per Class Allocated to TeachingScience .at 'car 8 in City and Country,SCVools in 1975
.
(SZien.C6-81.aeas "only).
.
Year 8 ._
-4.-
State
q
Year 7Metro: . Non-Metro. Metro.
. Non-Metro
ACT 3:4 3.3
New-South*Wales .3.3 3.5 3.3 3.4
Victoria 2.0 - 2.6 2.t 2.7
Queensland 3.2 3.4 -
South Australia 3.0 3.4
Western Australia 4.o 4.0
Tasmania 3.2 3.2 3.2
Australia 3.3
I-4 6',

136.
Table 6.12 .Percentage of Students in Year 10 who did not Study Science
Australia
in 1975
Government Catholic Independent
'3 1
ACT0 0
.New South Wales 0 0 0
Victoria 9 3 0
Queensland .31 . 14 4 .27
South Australia,: 6 3 0
Western Australia 0 .0 . 1
Tasmania
Total
0
7
6
',..0
2
7
Table's 6.10.and 6.11 refer to the amount of time allocated to science
for those students studying some Alliance. In practicenot all students,
even in the lower secondary school, were students of science. While in
Years 7 and 8 nearly all students in secondary school took some science, by
Years 9 and 10 a number had apparently dropped science completely. In
addition there was considerablevariation between StateS in this pattern.
In Year 9, nearly one quarter of Queensland secondary students studied ho
. science at all: in other States veryJew Year .9 students omitted science.
Among Year 10 students more than one quarter; of Queensland students included
no science in, their course.. Other States had a much smaller proportion of
such students.. Victoria had.the'next largest with seven percent. Table
6.12 shows the percentage of Year 10 students ineaclr'State and school system
who did.not include science in their curriculum, The State differences were
significant* In addition differences beVween school systems were also sig-
nificant.'qhe e'was a larger proportion of non-science students in Government
schools.thti. olic or Independent schools. k.
It is interesting to note that the students who studied no science were
mainly girls. In Queensland schools about one half of the girls..in Years 9
and 10 studied no science at all, but virtually no'boys excluded science.
Those girls who. did not take science were fallowing a course of commercial
studies for which science appeats to. have been considered inappropriate.
As a consequence of the variations in efie percentage of students not
doing scienceit was necessary to calculate the amount of time allocated to
science per week for each pupil. Hence those.students whose allocation
147

137..
Table 6.13 Mean, Number of Hours per Week Allocated to Teaching SciencePer Pupil in 1975 (All Students)
StateYear
8 9. 10.
ACT 3.4 3.3 3.3 3.6
-New SouthWales. 3.4 . 3.4 3.4 3.7
Victoria 2.3 2.4 . 2.6 2.8,
Queensland 3.3 2.7' 2.6
South Australia 3.1 3.8 3.7.
Western Australia - 4.0 4.0 3.9
Tasmania 3.2 3..2. 3.4 3.5
Australia 2.9 3.1 3.2 3.3
Note: The data recorded in this table have been calculated for allclasses including those who study no science.
was zero were_included in the calcUlation. The results have been shown in .
Table 6.13. Since this-measure combined the time allocation for science
with the proportion of students who studied that subject it provided an
indication of the demand made'per junior secondary school student-on science
facilities.,.. In two States that demand was notably low! Victoria and
Queensland. In the case of Victoria this was a result of a;s11411 time
allocation'to science while in Queensland it was a consequence of a
significant number of girls opting out of science. These data suggest an
explanation for some of the differences in the mean values of Q1
and Q2
for
Table 6.14 Mean Values of the Science Enrolment Index for SchoolSystems in Each State in 19-75-(Year 12T
Government Catholic Independent Total
ACT 125 107 148 124
New South Wales 116 119 120 116
Victoria 89 104 109 94
Queensland 127 118 138 127
South Australia 131 114 139 131
Western Australia - 147 124 167 147
Tasmania 113 105 153 119
Australia- 117 111 127.
117
-18

138.
the government.SchoolS in each Stdte. Queensland and Victoria appeared to.
be better provided because the demand of their lower secondary school.ScienCe---
classes was less.
Schools differed in the science orientation of senior studentscourses
:4S well as in the demands of their lower school students.' The 5cience
Enrolment Index provided an indication Of the propensity of Year 12. students
to pursue scientific studies. Mean values .of this index, for schools which
have year 12 students, for each State and school system are shown in Table
6.14., Clearly in States such as Western Australia and South Australia senior'
students placed greater demands on science facilitieS than in States such as. , .
Victoria. Interestingly, the difference between States was significant
at thee0.001 level, but the difference between school systems was not
significant at eVen the 0.05 level:
The data in Table 6.14 provided an explanation of one other division which
was made by the AID analysis. Schools which enrolled students up'to Y.ear 10
were better provided with science rooms than other schools. The results in
Table 6.14 show that in most'States the mean value of the Science Enrolment -
Index was greater than,100. It can be inferred frOm this that senior school'.
students generally placed more demand on science rooms than students in Year 10
and below. Students in the junior secondary school take the equivalent of one
science subject each. ThOse in Years 11 and 12 take an average of more than
one subject each.
Number of Scibnce Rooms per.1000 Students
The analysis of demands placed on science facilities revealed that there were
considerable differences, at both the lower, and upper secondary school levels,
between States. It was therefore considered desirable to examine the provision
of science rooms in schools with a measure which was independent of the amount
of science taught. In the discussion-Of the various indices of need, it was
obrved that those based on enrolments were highly correlated with each other
but.lessstrongly correlated with indices based on the number of science
periodS taught. The.most direct measures of.the,number of science rooms for
a given school population were. L1 and L,: the number of science rooms and dual
.
ptiroose'rooms respectively per 1000 students.. Hence LI and L2 were considered
suitable for making comparisons. For Q1
and Q2a logical basis had 'been
derived from the work of the Commonwealth Standards Committee. The only Clear
guidance for'a similar cutoff point for L 1 and L2 wds'the statement by the, .
New South,WaJts Education DepartMent (CDE File 68/2764(150)) that seven science
..,-. 19

139.
rooms were needed in a school of 1000 students. The South. Australian Education
Department considered eight science rooms, including three demonstration rooms,
appropriate for a schobl of that size. (CDE File68/27640:46)). Hence the indices
L1and L
2were used for comparative purposes rather, than for assessing standards.'
-Table 6.15 contains mean values of L1
and L2' for the school systems dn .
.
State. The differences, between government andnon-government schools
which had existed- on Q1
andA2.wefe also present in L
1and L
2'However L
1
showed a distinction between Catholic and Independent schools which had not
been apparent in Q1
and' Q This was presumably a result ef Catholic schools
having larger classes so that while they could accommodate science lessons in
science rooms, those rooms were rather more crowded than in Independent
schools.
Among government schools there were some interesting differences from
the pattern of1and Q
2values. South Atstralian and. Western Australian gOvern-
mentschoolS were among the lest provided in terms of science rooms per 1000.'
students. Schools in 't-hrose States made heavy demAmds on their rooms, henCe
they : had lower values of Q1 and Victoria, which.hadTelatively high'vadues of
Q1
and Q2, and New South Wales contain the government schools,least. well
provided with science rooms. In Victoria this is Compensated by a reduCed
science teaching program'and small senior enrolment in 'science subjects. One,
can only speculate why schools of the two largest educational systems were the .
Table 6.15 Science,Rooms (L11 and Dual Purpose Science'Rooms (L2
)
1000. Students by State and.4School System in 1975'
Government Catholic Independent ,Total
L1 L2
L11.
L2
L1
L... 2
L12
, ACT 7.9 7. 8.3 9;7 9.0 8,3 8.2
New South Wales 6.2 5.8 6.8. 6.5 10:7 10.0 6'.5 6.1.
L -Victoria 6.1 5:8 6.9 6.7 10.6 10:0- 6.6 6.3
Queensland 9.2 7.5 8.7 8.7 11:6 10.9 9.4 7.9
South Australia 7.9 7.3 - 7.7 7.4 13,3 12.6 8.3 7.6
Western Australia 8.3 7.3' 9.4 9.3 11.1! 11.1; '8.6 7.8
Tasmania E. 6.8:a 6.1 a 9.2 9.2 17:T9 17.1 1.0,3 .
(9.9);
. 7.2 6.5' 7'.5 7.2 11.2 10-7 7.5 6.9
Note: a The figure quoted is forIligh SehoolS and District Schools:The-figures 'in parentheses include the Matriculation Colleges.

140.
least w411 provided with science rooms.qt,possible6answer is.that these two
.government school. systems spent relatively more on apparatus than buildirig
in the early stages of the Science FacilitieS Program. This was discussed. .
in Chapter Fdur.
While the differences between girls, boys and coeducational schools were
not significant-there was an interesting difference between metropolitan and
non - metropolitan-schools. '.The data in Table 6.16 show this unexpected result.
Non-metropolitan schools had more sciencerooms per 1000 students than
metropolitan s'elloolSin the Government, Catholic, and Independent school
systems: spite of-this, it can be'recalled that nen-metropolitan
schools held no advantages in science'rooms for.science,legsons. In fact
among the government sclIols.of Victoria and'Queensland they were dt a
disadvantage.-::
obi
'It can be .seen that an examination,Of seien,Ctroom:provision using enrol-
i4v Tent-based indiCes yielded some'differenbes fromAatAisingindices based on
the number of science lessbnS:taught each week,,, While the overall correla-
tion between.the two types of index was moderalejy'higly sbmefspecifib
differences between the- iwo preaches exist. DifferenceS arise because of:
1 -different emphaseS do science between States,
2 variations in claSs size because of,the relative abundance
of.other resources,' .and
3. different locations which necessitate small senior classes.
As was discussed in Chapter Four, the ScienceFacilities Program was
administered separately in governMent and non-governmehi schools and
separately in each State. .The total alloCation was divided, between government....
Table 6.16 Science Rooms (L1). and Dual 1Purpose Room (L ) per 1000
Students by School Location in 1975
6606.0
Government: Catholic Independent Total
(Rooms/1000 students)
Metropolitan
Non-Metropolitan
(Labs/1060 'students)
Metropolitan 6
Non-Metropolitan
6.6 .
.
7.4
°
.8,6
6:7 $8.6
.10.8
13.2
10.2.
12.9
720
6.4-
7,7
'yr

:t
141.
.14
* 4 ,t, el . .
and.qpn,government schools on:the.basis'Of school AuLation and betweenfl -... k
, '..States on the:4 basis of gross popefation , Suclifadivisvn took account of
,neither initial condieiOns Por4diff ing emphases on Science. Witilln $ystemg
school needs And SchoolprioritieSWefe determiAd .by using- variety ol-..
..*A o
meang,someenrolvnt-bdsedandsomeppriod-based.;Itis.regrettable Oat a(4.
4'more Uni4orm poliiey was not.gllowed.
w-.7.0
41
y. _the Quality of Science, Rooms.11-1 I
.OheFOpctional AdequaCyjeof ReoMs 4-
..;14, A-4
TiOiypes of dataprovided information about thgli.qgalitY of:scienceieoms. . , .
in SChtOli and theli4actof the Science Fa6Ilities ProtraM. One was the
respOnse to a,checkiist'of essential features whichwas,devetoped to assess
functionalltdequncy: Its development was described in Chapter Three;'LThe. science co-ordinater was asked to rate each of the-scienceipems'in
'the school:1On each of fourteen,.iteMs,-;using a four Pointscaleranging.from
.'non ei4stent' to 'adequate'. Thus, the total score fOr each room ranged in,
principle from 0te.42 and in practice from .to 42. The. scbrerange-v-
,,...
:'described rooms which were 'cramped with miniMal or inaccessible services
'Of gaS, electricity and water,.and poor working and seating conditions' to
rooms which were !splicious and proVided with adeqbate accessible service.
points and in which conditions'were'cOndPcive to,easy variations in work
patterng'. A problem with ,interpreting results from such ,a scale is. that.:
different perseng were .used to rate rooms in different schbols. However,
within each school, the same-person rated that schools' roomsandcompari-
.
sons of different typeg of room '(by age or Arce of funds) 'are posSible.
Moreover an,analysis.of some of the questionnaire returns suggested that this
source of:unreliability was not very great.. Tfie ieturns from a group of
schools in the Melbour9g area with similar rooms were considered. Thege were
t schools of light timber construction. built in 'the late fifties and early
!\sixtieg to which two-room Commohwealth Science blockspid been added between
\1967 and 1970. The results shown-in Table 6.17 suggest that the Variation
a,s not great,
sale t?sing. this.sample was 0.68
\':-.
s
The'internal consistency
This 4as varied
.
(Cronbach's a) calculated for the
r.
after 19710s is describe* in Chapter Pbur.
4
1 5
6
7.

142.
Table 6.17 Different Ratings of Similar Rooms Melbourne Schools. -
Science Facilities Program Rooms
Original LTC Rooms
M eanStandardDeviation
N
37.4 2.05 16
29.8 3.07 24,
It was found that science teadhers rated the rooms they identified.as
coming from the Science Facilities'Program as more functional than other
rooms in which they taught science. This, applied in both government and
non- government schools. The mean ratings of rooms provided under the Science
0,'Facilities Program and other rooms, according to the scale previously described,.
are recorded:in Table 6.18. Rooms about'which there was. ncertainty as to the
source of funds were included with:''other rooms.' so that for some States an
estimation .of the rating of Science Facilities Program was not possible because
there. were too few identified.tases. The data in Table 6.18 were interpreted
as indicating that an improvement in the standards of science rooms resulted
from the Science Facilities Program. Such an improvement was an.intended
outcome of the Program. The activity of the:Commonwealth Standards Cenmiittee
was directed towardS this improvement 1300 through its publication, The Design
of. Science Rooms, (Commonwealth of Australia, 1973) which inclyded suggeStions
Table 6.18 Mean Ratings of Science Room Qualityby Science Teachers.
Government'Schools Non-Government Schools
Science , Signi- Science .Signi-
Facilities Other ficance 'Facilities Other ficance
Program Rooms of Program, Rooms of
Rooms .Difference Rooms Difference
k
New South WalCs. 38.5 33.7 . ** * 38.6. 30.:0 . **
VictOria. -'3.0' 30.7 -t* ''' '37.9 32,8. *
.Queensland .4 36.4 23.2. **. . 37.2. 29.9 *
South Australia a 30.9 36.4 , 27.8. *
0
West. Australia:. 31.2 31.5 ** 37.6 (27.5) .*
Tasmania 31.1 30.1 ns 37.3 (35.4) ns
Note:-.. Too few schools in this group were able twidentify TooMs.
'''.
\

143.
Table 6,19 Percentageof Schools Where_Rooms RaSed AsKSigni7ficant Impediment to Practical Work
Laboratory Facilities Lack of Storage
Govt. Cath. Indep. Total Govt. Cathy Indep. Total--
ACT , 8 - 5 25. 0 .0- '. 15
New South ,Wales 13 7 0 11 37. 0 33 30,
Victoria 19 14 0 17 22 14 14 20
Queensland 40' 14 7 33. 18 .7 14 16,'
SouthAustralia 13 -.15 0 12 37 23 0 33
West. Australia .10 6 . .8 9 7 13 8 8
Tasmanth .8 10 0 8 36 10 0 31'
Australia 18 .11 3 -16 27 8 19 22
about the design of, and possible plans for, sciepce'Toems and thrOugh its
Consultations with jpdiVidual non-govOirnMent schools,. As far as government', .
schoolswere concerned the additional funds pnab}ed State clucation,Depart-,c.
ments to reconsider and improve e*9.sinplans for'science rooms. Often this
involved.thd establishment of ad'i c comfilittee0 off senior science teachers to
advise on possible laboratory designs Suck committees considered general.
'questions of policy, developed sketch plans and-amended.draft Plans when these
had been prepared.
Aspects of Rooms Which,_Impede Practical Work
Schools from all .systems considered the new rooms provided under the Science
Facilities Program .tco'be more functionally adequate than the older rooms.
. Hence the overall adelacyOfthe science facilities in a school often reflected
the proportion of new rooms provided under the Program. In general during-19.75
government schools were using more old' roops which were considered less suitable..
for teaching science.
A similar pattern was apparent when teachers were asked_whether laboratoryi-.
facilities were an impediment to practical work. As seen in the data in Table
6.19 about one government school in five considered laboratdry facilities.a
'significant' problem. This applied to one in ten Catholic schools and only.
The rold of these committees was discussed Chapters Pour and Five.
CD.
15

144.
three percent of Independent schools. A surprising 40 percent Cf Queensland
government schools replied in these categories. It seemed that-whilnsome
Queensland schools had sufficient rooms the quality of the older science
rooms was not good:
The replies as to whether lack of storage space was.seen as an impediment
to practical work gave a leip clear picture. The results are also shown in
A
Table 6.19. It can be seen that lack of storage space was regarded as a
',significant' problem in a number of government and non-government schools.
Of course lack of storage space would be a problem which depended upon the
amount of apparatUs to be stored. In the next chapter it will be seen that
Catholic schools were not so well provided with apparatus as government or,
other non - government schools.Hence storage space was not a problem to them.
Access to Science Rooms
Classes Not held in Science Rooms
The proportion of science lessons which are not held in science rooms is ..
sometimes taken as a measure of the availability of science rooms. HOwever
theassociation between these two measures is not direct. In the. limiting
case insufficient science rooms (say Q1 less than -25) would. necessitate
science lessons'to be held in non-science rooms. Where there were sufficient
rooms available the scheduling of science les4bns for science rooms depended
on the skill of the timetable co-ordinator, the degree to which specialist
science accommodation was seen as a priority, the interests of the science
teachers, and the nature of the curriculum,as well.as upon the availability
of rooms. Schools were observed where.a bare minimum of rooms was fully
.utilizcd. For example, one Catholic school had a minimum of science rooms
but.ll were fully utilized. The timetable was staggered so that Years;7;
8, 9 and 10; and 11 and 12 took lunch and morning and afternoon breaks. at
different times. Consequently, science rooms were continuously occupied.
The result was'that nearly all science lessons were accommodated in specialist
rooms. By contrast some other schOols had a surfeit of science rooms which .
were often unused., In one particular government schoo4 science rooms'were
left vacant yhile science, classes were 'held in normal classrooms. This was
the result of two factors.: The teacher's did not aqtear to view piactical
experience as relevant to the syllabus they were teaching and a lack of
equipment and poor laboratory design limited the attractiveness of the science
rooms which were available.
1 to a

145.
Table 6.20. Percentage of Science Lessons held in Non-Science Rooms in 1975
Years -
Government; Catholic Independent Total
7-10 11-12 7-10 11-12 7-10 11-12 7-10 11-12
ACT 4 4 4 0 '1 0 3
New South Wales 8 5 16 2' 6 5 9
Victoria 7 4 15 0 5 1 8 3
Queensland 22 8 8 0 7 2 18 6.
SOuth Australia 24 13 21 3 16 , 14 23 12
West, Australia 9 8 23 7- 5' 2 11 8
Tasmania -7 0 10 1 0 0; 7 0
Australia 12 6 15 2 6 3 12
It should .not be assumed. that the holding of science lessons Out ofJ
.
science rooms only arises out of lack:OE facilities or difficulties of planning..
It can also be part of a planned program wiiicli,MakeS,use:.-of school resources
outside the science room. In some WestOrn'AUStralian gmierpment schools it is.
int6naed.that one sci'nce lesSon each week' for Yearsj,tb10 slicultake place
in the library. ;Thus science lessons are in a nons0.enee,.roOm not through a
restraint imposed by facilities but as part of the plann&ug'epf*hOol
resources..
The proportions of science lessons held in non-science rooms in variouse.
school systems are shown in Table 6.20. Throughout AuStralia little-more
than one lesson, in ten for Years 7to 10 was held in a non-science room.
The figure was a little higher (one in seven) for Catholic schools and rather
lower (one in 20) for Independent schools.' Queensland and South Australian
government schools held rather a lot of sciencgelessons in non-science rooms.
In Queensland this seemed to be a matter of choice influenced by the nature'
of the science curricula, the teachers' views of practical, work and the
unattractiveness of some old science rooms which were available. In South
Australia there.was considerable demand placed upon the.facilities because
a lot of time was allocated to science. In addition many of the 'open plan'
schools and teaching methods stress moving to facilities as needed rather
than.being continuously in a specialist room.
At senior level, in Years 11 and 12 only one in 20 science lessons were
held n non- science rooms; the proportion being a little larger for govern-
ment than.for non-government schools. In South Australia the figure rose to
.one in eight for government schools, in: due to the provision of science- ....

146.
courses for non-academically oriented students. In general it seems that
Years 41 and 12 were well accommodated in available science rooms..
Access to New Rooms.
Table 6.21 records the proportion of lesson's in various subjects held
rooms provided under the Australian.Science Facilities PrograM. Only -schoolsc:
which identified some rooms as coming from that source have been included in ;.. :**
the. calculations. so that the figures are an indication. of the.priority given
in using these facilities. In non-government schools where the provision has'..
been most abundant thepattern of use seems more uniform across the various:
subjects and age levels. However, in government schools, Where this source:of.
funds had provided a smaller.proportiOn of available science rooms, there*aS',''.. -
a different pattern of use:, in general senior_Physics and Chemistry enjOyid,
most use of these facilities whilejunior science classes and senior sci.60;,i
other than Physics and Chemistry had less opportunity to use the
In Queensland government schools the difference was, most marked between-*
Years 11 and 12 science classes and those for Years 7 to 10. 4ictoria*:and.
Western Australian government schools used the.Science Facilities Prograll.
rooms for senior Physics and Chemistry plus some junibr science.. Bip,lpgy
and .'othel" senior science had' less access to the,SCiencb FacilitaeSiPipgr4
rooms in those States.
Table 6.21 The Use of Rooms
, .
Years 11 and 12
Provided wider-the Screnc,P
Government . tNOU-Governmerit'-'''
.
Chem. Phys. Biol. Other Sci. Chem. Phys.:'BiolOther.:%Sc..
New Soutil Walesa
55 79 60 59 r ,50
VictOria 88 91 40.
Queensland 91 86 79 -54' -!18
South Australiab
-
West. Australia 87 87 31 '25 a .40.
Tasmania c -
2 .
. , _
Notes: a ThodistinctiOn betweepthese disciplines may.bejeS:sFpleariin.
7A, 4' 78
78' 916
_76 .., 72* 5:
85 8& '83.
63. 65 : '
schools which were operatlag Under*the. Wyndham sChbmcliitit
courses.b Tpo few schoolS identifiCd rooMs.:foM the:aqence
Program to enable calculations, to ,be;'m00.:c Because of the separatiAln of MO f.10001:5 and. Matriculation
. Colleges calculations were not-:thade:-TOrTasplapian::,govnillengbPols.

147.
The pattern in government schools throughout Australia suggests that junior
science only benefited' from the new rooms to the extent that they were able
to occupy those rooms which the senior studchts vacated. There appear to be-4!
many reasons why this occurred, including the fact that concern with labora-
tory work in junior science is amore recent development than concern with
practical work and experimentation in senior science subjects, In addition
it was sometimes tacitly assumed that.the Program was to be directed towards
senior rather. than junior science, reflecting the predominant concern at'the
time the Program began. These factors tended to reinforce the desire of
science co-ordinators to maintain new facilities in good condition, if necessary
by excluding less mgnageable classes.in.Years 7 to.10. This concern should
.not be lightly dismissed. In many schools damage to facilities.was a problem
which had to be considered by the science co-ordinator when planning the use
to which they would be put.
. ,
However it can be argued that a suitable science laboratory is even more
important forjunior than senior students. In keeping with, theories of
cognitive:develdpment junior science curricula, emphasize rather morethe.
concrete expetience of practical work and integrating prAC.ticai.With.t,heorY,',
If this is'accepted it is unfortunate that junior science in governMent
schools should have benefited least directly. from the provision of science
_rooms under the Science Facilities Program.
.,.-`Summary
'Mie'4ustralian Science Facilities ', Program contributed subStantially to the. .
rebuilding and. renovating'-of science rooms between 1963 and 1975: A large.
prdportipn of rooms now used for teaching science was built during.this
eriOd. <The,,money: made available under this Program enabled roams which
*ere ConsidTed4o he of better quality to9be provided. Non-governffient.;,
7§c.t1O0,1SThad:IMorkItaf their rooms replaced er renewed than did gOvernmeht
within schools senior Physics and Chemistry classes .
44.:',gOte4,a4:0:5Sto the better room.
ea'ms;::Of.`g§,Aiteria stated by the CommOnwealth Standards Committee
Orily:?40.4i,&46.Wiiii ten was 'seriously deficient' in science rooms when
e 1.coWM:-ctilltAPOWHottever if only rooms which were:eqUipped.for student
expOimpn4ri60:6hsidered, one in five schools were 'seriously defieient',
4:31:mere government schools. As a consequence of theSe
1:1Ven.,schools regarded its raboratory facilities as an_
kirk. One in ten science. essonS ri Years 7 to 10,
..and 1 ,i2O,..s-010tience.classes were held in non-science rooms. It should be

148.
remembered that this was sometimes the result of choice, or was due to
timetabling problems, rather than theark of available rooms.
It-4:2ems that the impact of the Science Facilities Program was to
provide rooms of better quality and to substantially improve the availa-
bility of science rooms. However it should be noted that the needs of schools
as they would have been assessed by .theCommonwealthStandards Committte have'
t been completely satisfied. Junior science classes in government schools
are rather too often held in- non - science rooms or poor quality science. rooms:

CHAPTER SEVEN
MAKING USE OF SCIENCE ROOMS
*. Facilitating Effective Use of Rooms
In Chapter Six iht*availability.and quality of rooms provided fox-science
teaching were:considered. For those rooms te_be used effectively they
would need to beyell equipped with :apparatus and serviced so. that teachers
might easily'expl;oit their potential.. The factor analyses suggested that1.
the abundance of apparatus and the provision of assistance in the laboratory
were separate considerations from room availability. and room quality. This
.chapter will consider the abundance of apparatus and the presence of lab-
oratory assistants in Australian schools.
Funds from the-Science. Facilities Program were used to. provide apparatus
as well us rooms. The money used for apparatus was rather less than for
buildings; and pdlicy was less uniform. Aspects of policy concerned with
spending on apparatus were discdssed in Chapter Four:. In generali\ when-ever0
a new laboratory-was built either money fo?.,apparatus, or apparatus itself,
was provided to dquip the laboratory. In government schools other apparatus
was provided while in some non-government school systems funds for apparatus
were made available to schools to equip existing,laboratories. The policy regard-
ing the provision of apparatus was rather more varied than:that regarding the pro-
vision of buildings. In the opinion of some members, df the CommOnwealth'. .
Standards Committee the Science Facilities Program had met most non-governMent
school building needs, but had not been quite so effective in supplying
apparatus.
Laboratory assistants did not come within the ambit of the Sckence
Facilities Program. Yet it was suggested in Chapter Four that the new
facilities were a stimulus to the provision of laboratory staff.. In some
cases2
an argument was advanced that dffective laboratory staff were an impoirtant
1 Interview with Dr J. DeLaeter,. West AuStralian Institute ofl'echnology,July 1976.
2 See page 97.
a.
149.

ISO.
Table 7.1 Percentage of Schools with Frequent .Deficiencies ii)Apparatus
Expendable
Type of Apparatus
Minor maid! 7.
Govt, Cath. Indep.-Govt.Cath. Indep. Govt. Cath. Indep.
ACT , 8 p .o 0 o 0 16 0
New South Wales 11 0 0 .15 0 0 32 7 15'
Victoria 0 0 0 0 0 0 22 14. 0
Queensland 3 7 O 5 7 0 21 43 7
South Australia 0 0 0 0 .8 0 13. 31
Western Australia 3 0: 8 3 12 8 3 29 17
.Tasmania 0 0 12 3 0 00
-. 8 0. 0
Australia 4 2 1 6 2 1 22 17
All Schools 4' S 2O
adjunct in gaining. maximum use from the new buildings. Since schoOls- were:
not given addiri,onal funds with which to employ., laboratory assistants thereAc..
were variations betWeen schools in -this matter: The employment of laboiatory
.staff depended upon the financial .resources available for recurrent spending:
'and the policy of the school system.
The Supply of Apparatus 7
School science co-ordinators were asked, when completing the questionnaire,
whether the supply of ' expendable', 'minor:, and 'major' apparatuS.w4'
3adequate. was given on-a.five-poini scale for each of-the
categories of apparatus The two.lowest, ratingS referred to ' deficiences
most'of the time'-and 'general deficiencies in many items frequently.'.
The percentages of schools from each-'School system in each State. which gave.
either of these responses are shown in Table 7.1..
Schools: throughout Australia apparently regarded the provision of.
'expendable! and '410or' apparatus as satisfactory. Only four, percent
reported frequent deficiencies in'expendable: and onlyfive percent in
'minor apparatus.- The leaSt satisfied were the government schOols in New
,South Wales where one in eight 'schools reported deficiencies... The supply .
of "majorapparatus''caused more disquiet. One fifth of schools reported :.
3 These categories were defined as in the ASTA survey of.1961 and are
described on page 14.

151.
..
. Correl4tidns 'between Narious Measures .6f the Adequacy'ofaratUs.
Basic Exp Min Maj
Aack 'of is ApparatusIMpe s,PractiCal Work (Basic)
Supplyof'ExPendable Apparatus (Exp) ,
Sopplyof Minor Apparatus (Min)
Supply of Major. Apparatus (Maj)
. -55 -56
50 42
48-
Note: Decimal prints have been. omitted.
frequented general deficiencies in this arca. Government and'Catholic
schools agrejeSS well-provided in general than Independent schools. However,
tho,gOvernmept schools of Western Australia were especially well-stocked, and in
South Aiistralia and TasMania also, relatively few government schools reported.
deficiencies, By contrast, a large proportion of Catholic Schools in Queens-
land, South Australia and Western Australia reported difficulties. withimajor
apparatus, 'Major' apparatus included very expe4ive of. which. few were
required (e.g. cathode ray oscilloscopes) as well as moderately expensive items
required in'greater numbers (e.g. microscopeS)This latter.category presented
schools with mostitoblems. and microscopes were frequently mentioned. These
. .instruments areused a lot in modern science courses in situations which
necessitate students having easy access to them. They, were often provided., .
under the Science Facilities Program, but apparently,were required in.gieater
number's.
Another measure related to the supply of apparatus was the indication
of whether lack of basi.c apparatus impeded practiCal work. --Of course answers
to a question of.this,nitUre would have depended not only on theavailability
of apparatus but also on its accessibility and the willingneSs of staff to.
improvise. Where.science teachers were able and willing to improvise a
shortage of apparatus would not.have seemed such an impediment to practical
work. Notwithstanding this caveat an indication that alack of basicapparatus:
impeded practical work correlated well with the more,direct answers. about
the supply of apparatus. Th1e correlation .coefficients have been .shown in Table.
Moreover the uniform pattern of the correlationocoefficients suggests,
that the responsesabout a lack of basic apparatus as an impediment to
practical work were related to the sufficiency. of .all three categories of
apparatus. No one category seemed to predominate.
Across. Australia afte eight percent of schools regarded a lack of
basic apparatus as a significant problem impeding practical work. There
were variations between.States and school systems in the extent to which
6-2

Table 7.3 Lack of-BasiC, Apparatus regarded as a.Significant Problem in
Practical Work:1Percentage of.SCROols).
ACT, .
New South Wales
ViCtoria
Queensland
South Australia
Western Australia.
Tasmania
Australia. .
this problem was reported-,..as_significani. TbeTertchfages.pf.schoOlsin. each
. ,
State and System', which regardeda.,JackOf..apparatds as a,probleM
work;. has been Shownjn,TabioThediffei7enOesreflect.net onlY..differences
in actual supOly butratherlOw wellthe S'upply'matches'.the demand:of the
cour;gs.which are conducted:: New S0uth Walos.Governtent schools andWestern
Australian CatholicschOols'morefrcquentlY reportedalack of,basiCapparatus
,
asan impediment to-practical work. jqost Independent -schools.'did.not regard:
this as asigniicant problem, :.:11eace,',While.Ohe fifth schools claimed
frequentdeficicriCics in major apparatus:onlYOne inYtwelVerearded their
deficiencies as a §ignificanti3roblem indrrang,ing:practiCalpne can
only assume that the difference was made up Of:SchOpISwhich.haddeveloped
improyised.means, of coping with :*hOrtageS.'
While the results in Table 7:3 suggest a generally satisfactory
situation, the schools which reported thatlack of'apparatus WaSSOmetiMe*"
a problem' should be mentioned. In.this category were'placed'OM0,3S percent
of Government schools, 44 percent of Catholic scbooiS'and 22-percent of
Independent,schools. .Thirty-five percent of all"schools
category. This represents a large proportion of schools fOrWhom Shortages
of apparatus impeded work on more than rare occasions.
The results of. this survey refer to apparatus generally &vailable_in
science subjects.. A more specific study (Lucas, 1975) of Physics apparatU`S,Y
has,bcen reported for New South malos, QUeensland and South AuStralia. Ofr.'
sixty items of apparatus studied, a nalbyr considered to be 'essential!
63

,_ ,i,
-were in relatively short supply in Queensland. It was argued that' this,
restricted Queenslarid -teachers to the PSSC course for which schools had
been equipped. The comparison made* Ucas (1975). of Queensland with /
.7 ..
',South Australia:was in general agregment with:the present' survey._ However,
...it Seemed,tht New South Wales teachers were more.critical ofAhe apparatus
available to them" than would have been expected from Lucasc'(1975) study.
The most plausible explanation of this" discrepancy seemed to be_that the
present survey was conducted at a time when New-SouthAalecschools were
adopting new curricula: Ahilmber of new ,seniorscience, courses were being.,
introduced, and changes had also been made in the junior science courses.
These curricula required new apparatus. Stocks of new: apparatus may not yet..,°
haye been built up. In'Queensland, schools were able to"continue to teach,
PSSC Physics while in New South Wales all schools were toadopt the new
senior,courses from 1976 onwards. Lucas.(1975) observed that-because Queens-:.
land Schoo4110..beenspecifically equipped. for P5SC-Phyiics.courses,:defi'
ienCits.became most notable when a different aPprOach waSYattelispied. In
".additionlucas (1975) claimed that tit poorer availability ofe:iperimental-
. "apparatus- lead to a diminished student interest.
'laboratory Assistants in Schools. .
Funds were-not'available under the Science Facilities Program for the
employment of ancillary stat.Z.H:Over the periOd in which money was available
for material facilities:morelabOratoryassigtants"Were emOloyedby school's..., ,
It was. suggested in Chapter'FOur"that the motivation for this inseveidi
instances came fromiadesire ta fully exploit and properly maintain the
new facilities.. The argument that labOratory assistants could assist in
fully exploiting material facilities became widely accepted: Per this,.
reasonan examinatiOn'of theproyision of laboratory assistants in Australian
school's was carried out t .:.°
Four pieces of informationrelated to the assistance proVided to. sciende
teacherSinstgoals': The most direCi'measures were the ratios Of'1.aoratory.
assistants per 1000 students (A ) and laboratory assistants per:10 science
teachers (AZ) Only data related to A1has.:been rep ted inthis.chapter. '
Tile 'two .Othermeasure. were 1:es ditect. These w answers to questions ofa
Whether llaCkOf.assIstanceor the !amount o preparatigntime.involvedi were
seen as impediments in,arranging practical work.. It was reported in Chapter ,
Slithat'in a 'factor anaikSis all:four:measUres loaded On: the same factor.
,The cOrrelutibbs:betw6en these measures are indicated bythe.Cdefficienis

, -
Table 7;4 Correlations between 'hleaSures related, to the .Provision: of
Ancillary Staff..
Lab. Assts/1000 students (
Lab.' Asst s/10 teachers (A2)
Lack of Assistance (A3)
Lack of Preparation Time (A4)
A3
-30 yq -47.
K 28 r-
64
Note:. Decimal points Ilave zbeen omitted.
reported. in Table 7.4. It can be seen that while lack of preparation7tiMe.wa:S0
negatiVely correlated with the number of lahordtory 'Wssistants, the association
was not !strong. Faetors other than lack of .laboratory asSis.tants must have
been associated. with a perceived. lack .of ptepaiation time.-171.early,4p4aChing-
loads, or a- poorly organized' store room would be two such possibilities.
The data recorded in Table 7.5 show the provision', of. laboratory,
assistants in various schools.. The provision of ,laboratory assistant's
in schools has improved dramatically since 1961: The results of the ASIA
survey (Keeiresii:1966) which were reported in Chapter One indicated that
very few 'schools ehen: had laboratory staff. Increased employment of lab-
` "'.oratory staff Was. coincident with the Science. FacilitieS.PtOgiam In Chap:
ter Five it was suggested that 'this may have been an important indirect. . .
effect of the .Program:.. South. Australian government school s in particular
:Table 7.5 Laboratory Assistants per 1000 Students in 1975'.
,
State .dovt-.
Cath. Indep.
ACT 2..1 1.4 1.5-
New South Wales 1.5' 0.8 I.2.
Victoria 1.0 . 0.3
Jil6Queensland 2.3* 0.2 l
-
South 'Australia :' 2.7' 0.2 1.8
Westetn Australia 1.5 0.1 ' 1.5 ,-. - ,'
Tasmania 1.6 40..3 .1.5
Australia 1.6.. ' 0.5' 1.8'
Tota

7.6 sPercentaimof Schools 'in which_Aspeets41f.Assistancd. rate&as a SignMican,t Impediment ,to Practicaf-Woiii.
. ,
. . -
.Ladk of Assistance.
Govt. atn.'
a ACT.
*- *--New. Sodth Walest.51-1 .
:Victoria.
Queenslapd
i tern Australia
4AUstralia'
All Schoolsyy
appear to have-employed laboratory assistants extensively:. gpnvally both
Government'SchotaS and'Independent schools.wete-wellIts-, _iced by anii.iJary.
Staff..J. Victoriavgovernment schools werea Iitt181es Well slaffed than
0 kg, 50 -0
53 .4.31
,57 27 -5
57 36
69 A57
80 .
18 57,4
24
24
27
8
0
50
'29
0
29 13
,27
8 29
38
3
14
19 *23
20
A$
. a.
'those of other - States. itiThiswat'largely a result of the sobrer prOVisiopWin that States4 techcitai school:5,
. It was Catholic school's Which languiShell'ke
:e most for .want of.laboratbrylrants. The remrrent cysts of employing.
:, such staff-are high so thatssc bis w4thout other financiAl resources could
not always afford such staff. Iii schools where laboratory Stafftvert notA.. 14!
employd it was-c likely4that tea ing staff had demanding teaching alloMents.. .
1
$uch circumstances wOul'd milTta.6 aiainsagainst' ining full bent froli..th'
Zia fi
. -0.facilitiep.
G.overninent':tcheolshith Were.Aelatively welj-provid0 with ..la ratbrY... . .4.:
assistants did not regard 'lack of assistance' or-.the-'amount of prepafetion
time' as-impedi ents to practioal work. Notably few ,governMentschoolsvitn
Queensland, South Australiaand Western Australia'repo%r40 dWidulty.from _ :--.6' #.
these sources:: More than half the 'Catholi.g'schools'in. each State regardedi-'. .
. .,- .
lack of assist nce as a significant'prablem'.-Consistent with this, more...
.-
.
.
Catholic schools regarded the abotintof preparation time involved'as:4. .
significant problem.' Among the government schools of New'South-WalesApd:_ Q.,
Victoria, lack of assistance,,,and the amount of.preparation time involved
were seen to impede practical work in one. quarter of the schools... Few
government.schools in other States considered 'these aspects, to be a problem

Facilities as an ImPdiment.tb Practlial Work
It was of interest to knoW whiCh aspeCts ofseieAde facilitieg were most
commonit.regarded as impeding the conduct_of practical.work. In Table 7.7.
the aspects'offacilities' which .were most
frequently reported as impeding
practicallwork are recorded,5,No entry,was made for those school systeMs
a
, in which fewer .than. tenpercent of schools considered any aspect of their
facilities tei!be a significant problem. On the basis of the data in
- A ,
Table 7.7 facilities do not!appear tobe:regarded as a significant problem
by Western.Australia.Governmentor Independent'schools, or Independent
schools in the' Australian Capital,Territory.
The most commonly reported problems for Catholic and Independent
schoOlsWere those deriving from Ikon-material resources:, lackof laboratory
assistants or the amount,of preparation timeinvolved. Any deficiencies
in phY4dcal provisionswere not seen to 6e serious.', Large mumbers of
)
Queensland Government.schools were critical of their laboratory facilities.
Some 40 percent of these "schools cop idered their inappropriate laboratory
facilities to, be a sitnificant prO em in practical work. In other GOvernment
Sphools'lack of suitable storage rather tWan general aspedtt,of-laboratory:
fadilities IjCe the most frequently mentioneddifficulty. This suggests
that attention. may need to be'given to.ancillary science areas ? storage,
and preparation.rooms in those schools.
Two. conclusions appeared'tb emerge frOM thesedata. .0newas that there
was a difference between those factorswhich government and non- government
schools' considered. to beimpediments to practical work. 'Non-go'vernment..
schools were.more4dence?neR with Support services, but government schools
We'more freqUently.critic4 of their liuifdings The evVease. presented
dinChapter Six. suggests that, rathet than rePreseaing dIfferent'attftudes,
probably.
,
this difference wasothe result 61f the levelsof assistance
received fm the Sciende Facilities' Program..
,li ' . , ,lhe second conclusion .con'derns thoSe44spects of Acilities-which were.", .
.,,1,I,
. .
not mentioned,dsproblemsv NO group of schools mentioned a shortage of-
,46Paratus as a signifLpant problem. Indeed. aabdrato6facilities were.
.mentioneddirectlyand frequentlyonlyby,Queensland go, nment schools,.
,,.
*
:4 while in other states it was storage spacewhich,drew unfavOUrOle comment.
regard a lack-
I..
*, :*
It can:be inferred froM this that school in general do not
of,plysAcalkesourcps as an impediment o practical work-.
I

157.
Table 7.7. Aspects of Facilities Least and Most Frequently Regarded asSignificant Impediments to Practical Work.
Least Frequent Impediment
Government ° Catholic- Independent
Aspect -Aspect %' ' Aspect %
ACT ' P,A 0 B 0 B 0
New South Wales L 13 S 0 :B,L 0
Victoria' B 3 B .0 B
Queensland ' P,A 8 -B,S 0 B 0
South'Australia B 0 !. B 8 B,S 0
Weste4ATIstralia P . 3 L. 6 P,A 0
Tasmania B- 6' B 10 L,S 0
Australia , B 9 B .6 B 1
Most Frequent Impediment's
Government Catholic Independent
Aspect' % Aspect' o Aspect
ACT
New South Wales
S 25
S 37
A
. A
50
53 S 33
Victoria,';
P,A ,27 A 57 A 27
Queensland L . 40 57 A 36
South Australia S 37 A 69 A 46
Western Australia 7 A 56 -
Tasthania. S 36 A 80 A SO
1: Australia S 27 A 57 A 29
!Yates: Code B = Lack of basic apparatusL = Inappropriate Laboratory facilitiesP.= Lack of preparation timeA = Insufficient Laboratory assistanceS = Lack of suitable storage space
The aspect of facilities most frequently cited as a significantproblem has been entered for each type of school. The number.is the percentage of that,group of schools reporting thatspeCtas a significant problem.
No -entiy has%een recorded where-no aspeCt was reportedsignificant problem by more than 10 percent of schools.
ti
1 68

158.
Table 7.8. Group Size for.Practical Work in Year 9
State
ACT '2.9 3.0
New South-Wales .... 3.4 3.1
Victoria . 2.4.. 2.8
Qimensland 3.5 3.6
South Austr ?lia . 2.5 3.1
Western Australia' . 3.1 3.2,
'Tasmania 2.9 2.9
,.
Australia
Government Independent
3.0 3.1,
2.5
2.7
2.2
2.8
2.6
3.0
Total
2.9
3.3
2.4
3.5'
2.5
3.1
2.9
2.6 3.0
Differences Between States in Teaching Science
Year 9 Science
Differences existed between the Various school systemS in Australia in aspects
of teaching science: Firstly there were differences in the aerage size of
groups.in'which Year 9 students did experimental work.' In general students
in Independent schools work in.:sMaller groups than their'peers in Catholic
and Government schools. The data recorded in Tale. 7.8 show that as well as
differences between school systems there Were differences between States.-
Victorian and South Australian Year 9 students from government schools worked
in.smarler groups than those in'other States. Presumably, as individuals,
those students have greater opportunity to use apparatus during science prac-
tical sessions: The size of groups for experimental work would depqpd upon
.the size of classes, and the policy of the teacher.,,intaddition to the
availability of apparatus and bench space.
There were also differences between States in the proportion of time
Year.9,students Spent doing experimental work. :Information on which-the
data in Table 7.9 were .based was obtained from science co-ordinators. It
therefore represents the-formal-allocation of time to this activity. Because
the question referred to a particOlar time quring the year, it was not pos-
S'ible to use the answers as an indication'of the priorities of an individuai.
school. Rather it was used:as' a measure of patterns between school systems,
Using school systems, in each State as the unit of analysis...apPeared that
working in smaller groups waS....associated with more experimental work. .
Based on the 21 school systeffis in the seven States'and one territory-The
co relation coefficient between' these two variables was .-0:67 Using
.:-°the States as units of analysis the rank order correlatidh ..Coefficint
6'9

159.
tTable 7.9 Percentage Experimental Work in Year 9.
,QState Government Catholic : Independent Total.
ACT 60 32 89 5-8
New South'Wa'les 46 44 52 46:
Victoria 57 5,0. 51 '56..
Queensland . 40 37 52 .4.1 .I.,-
South. Australia 49 44. 57 49
Western Australia *41 32 41 40
Tasthania '56 38. 47 54-
Australia 48 . 53 52 48
Was - 0.89. Victorian Year 9 students worked in small groups while doing ,
a lot of experimental work. Their counterparts. in South Australia worked
in equally'small groups but did a little less experimental work. Presumably
this was because a larger proportion of science classes were not held in
science rooms. Tasmanian and. Australian Capital Territory students did a
lot. of experimental work but in groups of moderate size. However, in
Queensland and'New South Wales claSses greps were larger and, in 1975, less
time, was spent doing experiments.
The fact 'that State differences in the amount of time alloCated to
experimental work were. more marked than differences between school systems,:
is 'interesting. In examining the amount of time allocated to'Science, in
Table 0.9, a similar result was obvious. It suggests that. there were
patterns of teaching science common to schools within each State regardless
of whether those schools were Government, chools(athoiic schools or
Independent schools.
Senior School Biology
Data were provided, by the Director of the Scheol Biology T.rejOCt;:about,
the number of laboratory exercises 'completed in schools Usiftthe.BSC$
ogy curriculum. That informatiorrWas:cojlected, as part of the :SChoel'Eib17.. -
ogy Project,from schools across Australia. In these data there.wiso:
difference§ between Stafesi For,Year9 Science ther cemmi6o:ctrric-
ulum across all. States this :Biology teaching s y re6r.rOto.,:the
same curriculum-materials.used.in all the States,.D.iffet 49. "4diffeient emphases in.teaChing patterns.: The Tesuks.,10r y: are tytabulated in' Table

160.
Table 7.10 Number of Laboratory Exercises in 43SCS'BiologyU
Number .of ExercisesSecond Year
New .South Wales.
. Vi.ctoria*12'111 udetland.
!'vSO6th Australia47vf iife'Sterri..Austrana'
amanja
78.572.772.1
68.875.9
76.1
74.6
ne` dnieresting in.ferenCe. wh.itit. could, be .drawn from these data was that
State; patterns', of:-teaCh"itig-juni.Or $Cience were not nedeisarily.. the .same -as
those for, seniot:!8iOlbgy., the norselations betweei-.1.ttaie values"` Ofn the. per
ethitage lezper3;mental:Wti:rk'in. Year :0 and number o'f-. BcS,,laboratctpy.
.
were',was cons-istat Wivth;casual o vation
.For exampie:fyy.'QUeensland SohOS,ol the resources for experiMentaa
weie di re4ted senior'. ether than junior-;;ttience s f) tts
ti South AuStrallaYtlie?-eitensive. support fez"..:4alof 'nerkA' may` -not'Alyave.
. .4
sY: 7-
.matched cbmi)Fet.ely13:ityregy . :theS6-!').;tqopOsi..tiliaWS..aie
specula -
tion but ,sUggestioW,Alia.t. there, Oki& iStlite tradif).ons:sp.ecif.ko to parL
ar. -subjects Is at l.e-4t;wert .,puTsepng IA. s seqt! nt t;stu ies..d*
Two ways. in. Which the effective. use ocid14. rcidrus may have been enhanced:
Y..,/ were' the prOvis ion of sufficient 4Tpaiatus:and,stle:"existene of ancPlary ,
. .
staff_ Itappearoci that fewrz-sdhb41.S;segai,,d th Ot.latugz as seriously,, :., ,
or that a. ef tba.s.i4 ,app4-41ig ....!oa:s, a '4"1.cant--itirpect* ent
to practical work. The only . area of -0Ticgtr? Na--?,'0!A-apparatus
the of which probably '',impeded."delnonstratiOSr4i, eir than ud
rilagnyal work. In general a:larger !proportion. Of GoNernment art Catholic
orted ciefiCiencies inalbi apparatus did Igbleperidant schools.
s.,;- .15r

LaborafOry assistants were more generously provided in Government
ankl,:Independent schools than in Catholic. schools. In fact for many Catholic
schools the lack of sufficient laboratory assistants appears to be a prob-
JOYhich.p.revents them making full use of the rooms and apparatus yhich are
:eolt)-4Vallable. However, in all schools lack of assistance and lack of time
:ts-prepare is the most generally reported impediment to praCtical work.
.4 1 1:There was evidence that different traditions of teaching science
ubjects in each State may have affected the degree to which facilities. -
were used. This remains an area to be investigated further.
161.

CHAPTER EIGHT
THEIMPACT OF FACILITIES ON SCIENCE TEACHING AND LEARNING
It has been argued in the earlier sections of thisrepott,that the provision
of good facilities was intended to have an impact on the form yf teaching
science. In thiS chapter use baS been made of the views expressed by
students in'responding to the questionnaire which was described in Chapter
Three. These students were all in Year 9 in 1976, but studied science,
under different circumstances., One, -other source.ofinformation has been
used in this chapter. The opinions of non-government school Principals were
obtained' by analysing.questionnaires which were returned to .the Commonwealth.
Department of Education in 1970. Opinions held by this .group of people
complemented the impression gained from analysis of. student views.
Interviews with teachers, and case study visits to schools; which provided
an additional perspective, have been reported in the next chapter.
The'Views of Non-Government'School'Principals
. The questionnaire, which:was sent. to all non7government schools in 1970 to
assess outstanding needs for science facilities, contained a.section seeking
'opinions about the. effects of the new facilities. The 'questions were.con-.
cerned with staff recruitment and retention as well aStathing practices.
A simple.!YeS' or answer was requested to most questions. Ihose questions
about staff retention allowed fOr.threepossible responses which would indicate
an 'increase', a 'decreaSe', or 'no change' in teacher retention. Abbreviated
_forms of the questions and the responses to themare:shown in'-Table 8.1.
,
-The results summarized in Table 8.1 suggested that these Principals
agreed about some of the possible effects of the new They were
nearly unanimous in the view that impleved facilities had affected the teach-%
ing and learning:of science. _More than .8.0 percent concurred that different
methods were now used to teach science, that more experimental work was done,
that teacher.satisfaction.wasihigher. and that the efficiency of teachingwaS1
greater. It was also considered that many timetabling problems had been
alleviated by the new rooms...
While views about .the effects of the new facilities on student outcomes
were not 'unanimous, there was some agreement. Increased student achievement
in science was seen by 84 percent of the group as being attributable to
better facilitie, 70 percent ascribed a quickened interest in.science to
163.1 73

o
Table 8.1 The Views of Non-Government School Principals about improved
Facilities for Sciencea (Percentages)
QuestionNon
Yes No - Response
1 (a) Inducement to potential staff:.
(i) Science teachers47 46. 7
(ii) Laboratory assistants.27 29 .44
Effect of New Facilities on Teaching
(a) Different science teaching methdds 84 10 6'
(b) Additional Staff49 44 7 _
(c) More experimental work93 2 5
Opinions about the Effects of Facilities
(a) Greater efficiency of teaching' '93 1 6
(b) ,Increased teacher satisfaction 90 4 . 6
(c) Attradted students . .
SS 34,_ 11
(d) Prevented student transfer .26 11
(e) Increased Student interesudiai 70 22'.. 8
(f) Increased student achievement 84 3 13
(g) Alleviated timetabling problems 83 7 , 10
-ScienceStaff Resignation Rate
(1) Teachers(2) Laboratory.Assistants
Increase Decrease No Change
0 17 83
0 '8 92
Notes:" a N.= 132 school returns representing all IEA.Population
Population IV sChoOls,.
These are abbreviated forms of the questions asked.
Three, rather than two apt-we-us were.possible to this-question
II and
their facilities, but only about 60 percent sawany effect in terms of
couraging-students transferring from the'school, and even fewer considered
at new students hadbeen'attracted by-the better facilities. As the
latter two issues would apply only to those-schools whichhad very poor
facilities.. before the Program the response to those items does not mean:a
great deal for some schools. It is interesting that a significant proportion
of Principals be'lieved that improved facilities had an impacOn students4
.achievement and interest in,science.v_
di
.,No such agreement existed on those - matters related to staffing.
Respondents were evenly divided when asked whether good facilities-were used
..as an inducement to potential staff and fewer than half .considered the im

165.-
proved..facilities attracted new staff. They were nearly unanimous that thete
had not been a noticeable change in the resighation rate of either science',
teachers:orlaboratory assistants.
The'pattern,which emerged'from'the opinions of this group'of Principals,
was'that improved facilities'had an effeCt'on the process of science teaching;
:14.y have had an effect on student outcomes, but4lad-little.; effect on staff
turn r or recruitment. One caveat needs to be stated. These opipions were
collected using a questionnaire which also sought infotmaiion about schOoI
-.,science needs. That information was intended to be used indetermining
future funding: As school staff knew that the questionnaie'Was being
returned to an agencY'which provided funds their answers may have'been affected.
Student Viewsabout Studying Science
Classes as the Unit of Analysis
The qUestionUaire which was used contained the three environment scales and
the three activity, scales-described in Chapter. Three.- rt was .answered by
. students during the'.course of the Project Officer'S visits to.sChools.- Foro .
.the.reasens discussed in Chapter Three the ciuestionnaire was developed for'.
use with.Year 9 claSses1
It was given to intact Year 9 classes chosen at,
.random'in'each school visited: .ChOosing classes was important because many
of theattribuies being studied were possibly more 'characteristic OfClassest --
than schools.
The class was considered to be the logical unit of analysis; 'and so the
ClasS mean seemed to be the. appropriate statistic. Gardner (1972) in his
study of attitudes to Physics', cited several studies which Supptted:the
proposition that class averages of students' ratings of TeacheTt'..behaviour
were congruent with those obtained from, external observers. It seemed. reasonable..
to expect that this would also be true' for,;tieasures of clasS environment.. and.
learning activities. However; it'alsowasconsidered iMpottant-to assess the
degree to which members of each...CIass held similar. views about.the environment
and activities which they experiehced Tri Science. Following the suggestion
of Lewis (1976) two approacheSfwereUSed. The first, was to- calculate an F0ratio to .determine whether class membership-WaS'a significant factoin
determining responses:.to the queStions comprising each'-scale. Secondly, ..a
ratio which indicated the proPOrtdon of the total variance'on each scale'% k
Which could'be'attributed to differences in.. clasS means waScalcul'ated:
4P.1 .See: page 55
. .

-Table8.2 Between and Within'Class Variation in Responses to the Student
Questionnairea
Significance
Scale F ratio Level .! Eta-Squared,.
Involvement, .7.5si.,: 0..001 0.18
.Organization. 12,2 0.001 .0.26
Stimulation 11.2, 0.001 '0.25
Exploration '12.2 0.001 0.27
TeXtual 20:3. 0.001 0.38
Rrctical ' 28.5" 0.001 .10.46
Notes: a The nalysis has been reported for schooPs from two states only:
New South Wales and Victoria..
''b The ratio is the sum of squared deviations of classmeanS from
the grand mean to,the total sum of squared deviations.'
The'F, ratio was calculated using a one -way analysis of variance
technique in which class was used.as the independent variable. As is evidot
from the results, shown in Table 8.2, the F ratio was significant at better,
than the 0,901 level for evorrscale tested. This was interpreted as ;
indication that class membership was a significant factor associated with
a-student's response to the questionnaire. -Therefore; it seemed legitimate
to use class means in subsequent analyses.
Table 8.2 also'contains values of the prOportions of the total Sums,Of
squared deviatiOns from the mean,which were, due to variation.between classeS.-'.
The ratio used to obtainthese Values, known .as eta-squared.CKerlifiger., 64 :.
203 ; Cohen,.1973:."197Lptjbiii-i:ded an indication of the 'unanimity among the:
members of each clas'-41:4a4be", seenthat between 18 -percent:and 46 percent
of the'total.variation s.--:64.10--variations.beteen'classes:..ThereSidual.:
proportionwas duei6VarTa.T.ion's:Within classes. Explaining similar resUits
obtained from-aseale,measuring.the.extentof teacher direction -in Physics;:
classes, Lewis (1976) distinguished between a opersonal' environmental press
and'a:!consensual'environmental press. Lewis assumed.that the 4latter.rep--
resenteod objective, reality. Whijethe former was a .result of each individual's.
perception of the'enyirOnMent. Siudentsin the same. environment'and''w.
11 76

vexperiencing. the,samesactiyitiesmaY either perteie, or report, differently:6. .
-e:. ,Alternitivelit is possible that Students Within each class actually 'ex,-
perience different 'environments, and do different things in science lessons.-
.. Tt.'--seems likely that both ofthese.factorS coliriute to the within-class.
vatiat%on..
t.
In 010. study the withiri,class variation was' examined further. -
Subsequent analyses were made using the 'class mean. as a Measureof the con-,
Sahsuai...envitonment While the. evidence justifies this approach it is import-
ant to remember that thera were also differences of opinion among, the students,ineaoh'clas.. '
Science Facilities and Science-Learning : Between-Class Analysis
Measures of the'AvailabIWY and Quality of Science Facilities
On the basis of.a previously reported factor analysis (Ainley, 1976)i it
had'been decided that school science facilities could be considered in four
.dimensions. Thes0were the,-availability of rooms, the 'quality of those
roomS,'the abundanceof apparatus, and the number of laboratory assistants%
facilities on the views students held of their
iables corresponding-to these dimensions were
, atudying tlie effect
science learni
,used: '': ,
.
Theooccupancy o science rooms was measured simply as the percentage of
. saience.lessens held in science rooms.
The,qualf ity of the science room_ most often used,,was assessed by the
;; school Stiendf,soltordiriator. The measure of 'qualify' was a, score
suMhing the school science 'cp-ordiniter's assessment of
accessibility of 14 key features. The scores
A:that:scare correlated well with an observer's rating (r = 0.83).6.-
1110 scale had' beenqppviausly shown todisCriMinate.beiween rooms. con-.
sidered to e of different quality, and to have a-satisfactory;,internal
consistency ..68),,9 4 ;
he dbund;nce'of,Dapparatus in each school was represented as a composite
score: ,Replies from4siience',to-ordinators about the a4equa0y pf7Ma*.,
minor and expeetdable,auaraatus did not as expected with the
cr erior) scores.-Two- possible explanatien8 existed for this. Firstly,, .
2. See page 484:,
.:3. SeeA:laW:14i

mostschoOls.'regaide&their apParap4s a1s iufficientand secondly,. the'
responses were the. opinion ;of the.. scie ce co -prdknator Censeqllent ly
those responses were'possibly related:to the program which the school
:cOnducted, .Ascience co- ordinator, whose AeprtMent; WascOndupting;a':
:liprogram'which'emphaSited exPfripental work, may hav4regard#1.as'in-0
'adequateYa,stock'Cif aPParatus. which would haVe satisfied a. peer at
1 anothei-,sthoed. The simple correlation coefficients suggested that
answers to the question about expel;dable apparatus.*re'mere'affected..";.
by this than those concernedmithMinorapparatus. :By.psing a procedure
.
described by Tukey (undated) an&hy..Peaker'(197S), aComposite scOre:base
on ihese raw data was formed. -. :A series of stepwise;regression analyses
oCeach'scale against the apparatusyaiableSjwascarried but It;
appeared that pyetaking the:TaiingAr.s%itior apparaiusless'the rating
for exPendableappara'tusa satisfactory predictor.could'be obtaned.
ThiS procedure was tantamount to using the expendable apparatus 7rating,,
as a means of controlling for the7bias,introdOced by the. oodittator who
gave ihe:ratirigs. It assumed that the availability of minor #paratus
was most important'forjunior scettce, and that ditferwt,4NROAses
the.. question about expendable apparatus reflected.tileattitudes of SCiqnce-
co-cirdinators4.,
The provision of laboratory .assistants-wasrepresentied'by the numSer.Of....
laboratory assiStafits per 1000 studentsin the school. This was:the.e
simplest; and most dirett, measure of the .assistany provided by ancillary
staff in. the school,
The,Re&essiOn Analyses -0.
, .
Each,of. the threesPeCtS ofthe..Science-learning,environMent anctoeach of the
actiVity:.dimensionS:WetO:used as criteria .in 8ixlsepOrate,regi.O'ssioh analyses.
In these,analyses. the four variables:.whiCh were'.u-sed.as%measuresof sc'hools''
'scienCe.facilitiesi'were-cObsideredto\be potential predictorsOfthe'enViron-:71
cement and activity".scoree:. .
They were entered: in the appropats regression
analysesip. a.predeained sequence.,
It
. .
*TIA`,.waS'postulateldthat-the-first:Consideration .oUghtto the proportion
a.
"of -science. lessons-held-in sciencerooms; because this seemed to be of paramount
importance in the Program.,:Thenhaving[controped.for7The perc4iitge of. time ,
in scienCerOemS',..the quality cf:hose-roeMs. was considered aS.a:potentia1"e.
influpnCe.on the gtudents';Views'oftfie.'environmensi and'Ativities. in Science%:
Having alloi,,ed for differenCes i,n..the'ciccupanty. and quail pfAivence-nooMS,-
Ian
1

t69.
. Table 8.3 The Impact of Science Facilities-on the Science LearningEnvitoriment : Between-Classes Regression-Analyses
Step " Variable InvolvementR r B
Organisation; Stimulationr, a
Occupancy L
Apparatus.
Lab: Assistants'
.52 ':-89
.45.. .26
.30 22' .30 .22
.16 03 19
.4.45
. .33 i:11
.53 .45 .34
.40 .31
-0.16 .00
105
the ''e ante apparatus was considered as a potential predictor. In the144 o
finat'_:Vpp,°.whettAle effect Ofthelirgt three variables hed been allowed for,--4 .1"ii
.:117 ::..'
' %the provision Or,enPillary staff was entered as a pi:edictof. ,Thls stepwise '4
'' .. ..
procedure, enableo each of the measures of the science,faclities available to*
a class to be entered nn a.lOgical sequence, so that associations between the:sf
criteria and the first, entered, predictors. were examineuThe order in whic10.. . 0 " , . 41,
ithe variables were entered correspond d td prioritis. fp/lowep P the1 .
.Science FacilitieS P4rogtdm.-
, ,:.-. .
Stience Facilities ',A end :8cienc learning Environments,
4
The results of theqegression analYses, which weie carried but .using4fhree. *,
."" 4Spects Of the learnirig environment (involvement, orgenigetion anotiMtla-4
:tion) have been.repoi;ted in Table ,yalues Of.the mt,iltiPf correlation.
coefficient(R), simple correlation coefficients (r)sand regesS'ien'coeffie-
ients,f(B) have:been.rmcorded. The Magnitude of multiplescorrelatipn
. coefficients (RI was used to indicate thc proportion of the variance :(13),'tpf..:. _ .
each environment indeX, which was asspcia d.with Variafionsin qe
facilL tieS avaliabl.6,..' .This protprf6n of e variance -pad:J2e calculated
froth : , ' el:..,,..
,,,...
0,
'
-.
...' P = 100 R2:4; , .
As-.a.ggneralization; it, can be inferied froM'these results that between
'and 35 perCen't'of tfte'.wariante ip.eaCb CriterionirasassoCiafed,wdth.
. -. ..
tions in the facili.#1es,evailable.. In brief those'classes Which enjoye
'be ence fe c ilip.ee'Teported more fa v; ourabLy on the environl
m ent'in
which' -thdy. leirned abolit,scienoe'.' ; .!:
_','4
.--,.
.
4

170.
An advantage of .analysing the results using,. this form of. regression
analytis can beObsetVedlk.onsidering the association between the provision
of laboratoty assistants"Od each environment index;. 'Though the number of.%
laboraitasSistants'per 1000 students was not significantly correlated with
any.index, after.the.effect of variatioAjn. room occupancy and .quality and
the availability of apparatus was controlled, it did contribute.tdche scores
elkoninvolvement'4u1..prganization.'
FrOm the relative size of the regression
to estimate the strength of the association between each facility. variable and.
*7.the environment indices.eNpeves (1972':122) proposed that a change in a
pw4W4
P"=crititrfor,s'efre,;(AZ) could be- elated. to a variation in a standardized pre-
di,ctor scot* '(AZ x) .-t ough iregession coefficient (,
AZ =
40"ary:: .
4 ,V
coefficients '(8) it was possible
Thus the reEtestion coefficient' (6) indidated the strength of the associationN .
between variations utthejredidtor (x) and the criterion' (Y). Where.more
so that it.
,16.b.,10 one predie0r4 as,.inyolved :the equation could be expandedv. 9
becaMe..:
C
a = Zy 1, xi
where,f3i = the regrestion coeffiLant of Y op.):
and'axi
--,'the change'inthe ttandardized'Score for
variable .x., .
was °deduced fio0 these data that,classes whose science lessons were..
held in goo& qtality science rooms, and.who had sufficientapparatus available,
reported that they'had a greatettOppottunity to be involved in purposeful:
activity. The provision. of labora4tyassistants was also a component con-
trihutini to'higher aegiee of involvement. The figuret'showedthat.room. r
quality was...the. most .powerful predictor of students. reporting a. well 44
organized' learning environment. Asgood.qualitYscience roomswere'defined
iiiterms-4f, Inter alia, readily accessible service such a result was . w
expecteth, Having suffidient apparatus, being frequently in science rooms1
and having enough :laboratory. assistants were also. conducive to a well
'sorganired learning environment: As might have been expected,,the availability
Of'app4atus was the most powerful:predicior..of classes' reporting a stimulating
envirdOtent In'which.a..vatiety. of methods and materials were used Such an
environment' *Wa alto supported ,by freqgtintlyheing in good quality science
rooms; lh liripf,loodquality_rooms were asso4lteewcth class reports of, .
good organ4ation, abundanttrapparatbs was associated with reports of a.
8 .
f;)

Table 8.4
171.
The Association between Facility Measures and EnvironmentIndiceS: (Coefficient of Contribution - C) '
Involvelnent Organization Stimulation
'Occupancy. 12 5Y
-Quality 9 .24 6
ApparatUs 6 6
Lab. Assistants 0 0
' 100 R2 427 35 23
.N = 105
..
.4',., ..-'' °"--;'--"e..
°stiMulating environment, and all four prediftdoMbined were correlated. .
.' twitji reports of an environment in which StudentS: involved in purposeful
activity.
An alternative way of presenting these datk,:Was to tattulat6:,the coefficient
of contribution (C) for each variable to each index, Keeves (1972 1221
argued that thiS coefficient provided an estimate of the contribution each
'Variable made to the total variance. This coefficient was calculated from
the regression coefficients,(8) and the simple correlation
C = r8x100.
Values of the coefficient of contributionhave been recorded in
The sum of the values of C is equal to the total varianCe. .li the
which can be accounted for by the four predictors. Thus the tota
to 100 R2.
coefficients
,
able 8.4
criterion
is esal
These lues of C indicate the association of good rooms with class0 .
repoits Of a well organized environment and sufficient uparatus for,an-11r
'environment which is stimulating through the 'Variety,offered. They also
,indicate the fact that three variables occuptancypq0a0Ay, and apparatus
have similar strength'of association, with rePortS40f;anilivolving:environMent...
Science'Facilities and 5cience Adtivities-
To examine'the combined impact of various. aspect
an hierarchiCal regression anal sis was again pe
framework, as for the environme t.scales, was u
f facilities on activities,
°ruled', The same conceptual.6
to determine"the sequence..
in which vaiiables Were to be entered inthe re sion analyses. The
results,-which are shOwn in Table 8:5 for these analySes were less conclusive

172.
Table 8.5 The Impact of Science Facilities on Activities in
Learhing Science : Between Classes RegreS-Sion Analyses.
Step Variable
Scale
a- Exploration J
RTextual Practical
R r 88 iRr
.31 .26.37
1 Occupancy .04 :-.18 -.25 -.22 .36' .23
2 Quality .17 .28 -.19° -.06 .21 .00
3' Apparatus ..16 .23 -.07 -.01,
.30 .22
4 Lab': Assistants .10 .23 -.02 - -..06 -.12 .02
105
4
than;-for the environment scales. ,However there'was an association between
the facilities used and the students' reported activities. The magnitude
of the multiple correlation coefficients (R) indicated that between seven and
foutteen percept of thevariation in scores on these activity scalds were
.associated withdifferences-in the facilities available.
Once again the relative site of the regression coefficients were used.,
to indicate the contribution of each.facilj.ty variable to tile total svocores.
Classes more frequently in science rooms and supported by abundant apparafUs
reported a greater emphasis on practical work. While good quality scieppe
rooms were positively correlatedwith.a large amount of practical. work, the
regression coefficient indicated that2this variable added nothinisto the-e
practisalstore if occupancy was allowed. for in a prior step. Classes which':%
reported a grdater emphasis on textuallearninlwere those classes whiCil
.were less'frequently in science rooms. Such classes were also ,hose who. $
I
occupied poorer quality science rooms. In brief .the relative use of Orac.:
tical work andtextU4,:materials in teaching .and learning science was
.associated with.the propoTtionof*JesSonS held ln science rooms. Abundance
of apparatus was also important for practical°work while better'quatity 41'
science rooms were associated with less textual learning.-G
4
For the scale which was d9siznated 'encouragement toexplore' the result$
o '
were more SUbtle: Only the quality of the room and theabundance of apparatus
were positively correlated with that scale. However, the regression .Coefficients
e\teveRled a:number oe'more A interestingnterestinassociation Firstly,when avr41ior,
allowance was-made for differences in rooms and apparatus, he provision oF
labOratory'assistants made a contribution tothe value of this index. .
Setendly, the regressioncoefficient for the variable occupancy was negative..
At first glance thisresultWas surpris ng as 't indicated
that when less time
8

173.
-
.
was spent in science rooms there was more encouragement to explore a range of.
AThenomena: ArleXplanation for this result would appear to be in the fact that
many of the activitirs listed on this scale involved going out.of the scien et
room to locations such as the library. Moreover it did seem to be an act of
choice on the. part of the science teacher, or science staff, to use facilities,
in this way. Encouragement to explore was positively correlated.With the total
number of Science rooms per 1000 students (r = 0,18) and the.averagOquality of
the. schools' science rooms (r 10.24).-. ApparentlY.the choice to teach iti,a way
which used esourCes outside the science 'room was made irt'the context of suffic-
I Tent good quality science rooms being available'iAn the'school.
tCorrelationsInvolVing School Facilities
.ta
In the regression analyses the. facilities. used by,classes were related to
-class reports of their environment and 4,tiVi.r,ies. For the abundance of
apparatus, and the provision of.labbratory assistants it was assumed that
that which was available to the class was also:thatmhich was available in
the school. In the case of.rooms,it was considered desirable ,to examine the
correlation between the data obtained from classes afid schooljacilities, To,
do this two facility measures were .used. :the availabilit' Of dual purpose
'rooms, (Q ), and the average quality of school science rooms.u,.,The index Q
it will be recelled, was the.percehtage of dual purpose science rooms in excess
of the assessed needs of the school :.'needs) being definR.in.terms of the
amount'of science taught. .
Correlation coefficients between class reports of learning and measures,
of general facilities in the school have been iecorded in.Table Of.all
the scales, only involvement was significantly correlated with the availagility
of dual purpose rooms(Q2). The average quality of the school%s science
rooms was significantly correlated with most of the aspects of science
learning about which students reported. It is worth noting that. there, was
no significant.assosiation betwOn the quality of scheol. science foots. nd
the emphasis on textual learniTg. 'Ap assocation had existedhetwee
activity and the quality of the class'.scienCe rooms. Conversely
obServed that encouragement to explore was more highly correlated
quality of school science rooms than of the class science rooms:

Tabie 8 6.
'ea Correlation Coefficients .BetweenFacility Measures.
=) v and Description ofj.earning.(5Choo4.-facilitiesI4.-. , .' , -
Involvement
OrganizationStimulationExplorationTextual.Pratt ipal;
ciittelaii on Coeffici entsAvailability (9 . Quality
.42
.26
24
.09 (ns)
Nrite-: a (ns) not signifi,eariv, at the OS qeVed
For N 1.05. classes r> .05'r. r> .23, A.'
, ... . ' $ Zi. ,:!" , .. a . .
ki', These results -Could 66 ineerpreteil.. an indi.a-tiOn'tthat'1'01'ai:j6e` (in-.
text-clad learning is something which i s"' atlas.f-4 rathert,-thanraSOidal.,, itcharcter.-hfcg, - tsic..! Pile could postulate tlfa't morel iel.'iaV waS Pl'aCed...P-ii .textual :,Materlials.
in teachilt a curric.ulumtf a partticylat; teacher ioa-:iii:: a .poo.f....qiih:lity.;rcIom:,On;the.illtiiel. hand it appeared, from the results that'''epeoutageriaeitt to explore .:
pay ha:Ye been .a more generalf,,prodp`ct,Of the science Ciir..ctiltnil of -the school ,
teaching practices. ..p suCli'it}}e genera bf :th.e.ichpdl,'sciende
appears to be a fofkiliati,V*.: ctor shaping the .ciii-ti:6Jliim; and practice
followed by science departm lt:,
One Cautioriary, note about arable used regression. analyses is
warranted at ihie stage. T Pettfontage of, science essons held; in; a, science
room was USed;asia measure? the: :opper.rtuni ty- which:a class ha to,:use science,..
. , .
facilities,: yet that variatrl May,have rbflected 'other faCets-. of school
t organization. It was rioted i tOPer .gj.x that the Proportikin. of 'science
lessorisheld in non-science rboms nut, significantly correlated with any
tifeLthe ciridices of toom availabilkty. disciiSsi,ori it has been observed.
that room ava.ilabilit was significantlAcorcelated.:witli only one of the
aSpects of science learning, reported. When condUcting the regression
. analyses it. was assumed th'at occupancy was a meaSiite-of 'the, extent to which
science facilities were available to the claSS,being- studied. The ai.terna-,-,'4, tiVe possibility is that a high value for occiiparfoy reflected good
°' husbanding of resouree's, and that that also wa,q,(1,deri. in-the curriculum
tulip/ed. Because such similar results were found for room- quality,about which
"leachers *did do 'little, finis alternative explanation has .not been pursued.e.
it-"AL However, is a competing h pothesis which shoUld be borne in mind.. :00 /
, ;0

Table 8:7:-The Association Between Reports of SC7 en e LearLng andthe LoCation of Scienc Roots. .
..InvelverientOrgani z'at ion
Stimulation
textual ,
Practical
.,.
thev Loc4tiOn , of : SC,1 enCe ofriS.. .
-...., arirOliy, 4., had ,not ':been ifiten:rel:,11to ex a e the locatiOn of science rooms
S
.. :. as a ,tompOnet of the, faciiittqs: ii'Oc ho , Yet, a -number of early visits(" ' .1''.. .c.. : 4'. " ''' -- . % '".:..:1:7 r..- i'',-, : ,to sched gaVb thes.'impi:e.s ..46 '01"iS:spect of science facilities was an
i mporAen
4A..,.,4ilO,uence
be,ih a V hapP siai'
sc)fotls. While the locatiOn of4, Ciene4- s1OMs.was not st V- cllY P a :6-i4ttir of the groups of variables
..4.'I concerned with: quality ckiv av4ilabiliy,pfof.,::',g',iende rooms, it was considered.. .. ..f,,,.
;to be worth se`pafte,, ex.4.M.Went'.. '-:'.ii':' -' 1'.-' ' f,- ikd , .. .
.: ! -fur h,e ,'Allobl. y'll'A,ts, the ,prolamitry of each of the Year 9 science,t r' ''^ F.".. ',i !'' g -,: .. :::: ,,...f
55 c'.14sro to "the;. stark 15'Mrd*.tipp,.4rdtrAvas noted, So also was the ,genefal*"-! lobatiOn of schoOT Scierice rooms in teriiis of whether the rooms were grouped
,clo 'SelyKogether :o ;Widely sontt,er. y Both of these measures were threepoint,. scal,e.S - o -*i. ;:::,::- 4 a.'
4..g.
'The:result:S. in T e 8.7 have been interpreted as indicating that it.,/ : ..,
tgas 'valuable- "ter 'Tear 9 science: -teaching to be in.-rooms lodated-near service`areas :` Alt the environment sefal'es were positively cOrrelated with this
riable as was thee amount 6re kaCtical work reported "by studentt. Apparentlycience. teaching less' vel,ving, stimulating and organized when a room was
far fro sul5p1 area. Certainly one imagines it would be difficulttq arra practical, work under those Circumstances.r
:p.;.7filar results' were found using the general location of rooms as a
edictor. ;ft thi,s4ca.se students in ,schools where science rooms were clus-tered to her ifepcirted greater' encouragement to explore a range of scientific
.ph-ehomen , and in'addition spored more highly on the environment and practical.A

work scales: This was .topsistent with ohserVations made during.visits to
schools that such an arrangement enabled greater cohesion, of the"department,
and planning of teaching strategies and use of'tesources.
Conclusions .
The main donclusion drawn from the results'presented here_was that the
quality of the AearningOnvironment reported by.students.studying science was
enhanced by good fabAlities. The proportion of time in science:rooms, the
quality of th6se rooms, the abundance olapparatus, the provision. of
oratory assistants, and even aspects of the location of science rooms were
associate with an enriched learning environment. In addition one-is drawn
to the conclusion that some activities used in teaching science.Were.
asSociatqd,with.the facilities available, Students from schools with.'
.suf ood rooms reported more encouragement to ekploie scientific
phe Classes which had easy access to science zooms relied less on
rials and, especially when aPparatus was abundant, did more
peared that-good facilities enabled a more diverse
activities in-science lessons.
An explanation for the reported association between student views of
learning science and the facilitiesavailable to thqm is:probably compleic..
Possibly, the' p'rovision of good facilities removed limitations .on certain
activities, perhaps good facilfties'enabled teachers to do- similar thingS
more efficiently, or conletivably'a more subtle explanation involving.student
reactions and perceptions would be appropriate. At is an issue which is beyond
the scope of this report.
When this stage of the Science Faci"lities Project was conducted in 1976,
the difference, it the standard of science facilities between the best equipped
and the worstequipped schools was. less than the general change in facilities
from .1964 to 1975. Necessity forced a cross sectional rather than a
longitudinal study and this has xesulted iwexamination of a smaller range:
of the 'independent" :variable:. Detecting the full impact of facilities. on
science teaching and learning was consequently more difficult. 'ox
The results obtained from student questionnaire's did confirm the opinions
of those non-gove.L.Aent school Principals who replied to the'CoMmonwealth
Thepartmeltiof Edudation survey in 1970 They attributed di'Eferent teaching 0
methocOore experimental work, greater efficiency of teaching and greater.
18.6

177.
teacher satisfaction, to the opportunibies offered by the new facilities.
While the effect of-good facilities.on these aspects of science learning was
not laige,,it was significani.fGood-facilitieS may not dramatically alter
science teaching praCtices, butthey,can.foster certain types Of Scienc0:-
teaching. Whftfield (1p71), has argued that the place of science in the school,
curisitulum was justified..;by4t*.providing- students with the experience of
empirical enquiry. beiikipiRiie* in Science,teachiag have assumed that this. -
was est t-achieved by ,a Varietrof activity and enquiry methods 46olving
.stu ents' in first han&ohservatien'of scientifiePhenomeria. Good facilities
ap areftly-assist'these apptoathes to teachingiscience.. . That consideration
ught.' O weigh heavily in judging the impacyof the:Science,Facilities Program.-
tl

A CLOSER .LOOK-AT SOME'SCHOOLS
Sackgroundto the Visits
7:;Theyisifs..t.dschools served tWO'purposes. One was to administer.a questionn-
aire sampling, 'stUdentliieWs'aboUt learning science. The other was to use
a'wide range .of techniques to fpid out the ways in which teachers considered"
tlieir'WorX was affected, By the'facilities available., This inVolVed inter-,
Viewing teachers, and other staff; as well as informally observing soMepf
the .activities in schools. The information gathered was used tO'identify some
of "the less quantifiable.educatiohal'oUtcoMes of having good facilities, as well
as to provide background information. which Would assist in interpreting. the
results obtained from the student questionnaira:-. In this'relatively unknown.. .
area' of researchArtWas considered important'tb.-use methods which allowed
unexpeCted;or idiosynciatic,,effects of faCilities to b,:lvdetectaci.
Oneexample of an issue notexplicitly'explored through the.student
questionnaire was that of the introduction otneW sciencecurricula In a
study of the adoption of an integrated science curriculuM in Scotland,
Brown, (1977) reported that teachers placed considerable importance `on resource
.constraints-when consideringwhether'to use such curricula. She noted
specifically that in. schools with limited apparatus and scatteredtlaboratOries,
the-integrated course was viewed With disfavour.' The integrated-COurse placed
greater demands On equipment' than did, separate science "Subjects Brown (1977:
48) expressed the opinion that while such 'concerns maybe less .important thafi
philosophical issues to those who develop curricula, they may assume paramount
importance for teachers.
ffamilton (1975) haS. described the way in which the Scottish Integrated,
Science,Scheme wasjmpleMented in.two schools. In both Cases-he .foulld.that
implementatiOn was accompanied by a series'of transformation's, of the intention
of the scheme. '''Oneschool had rather pootr+Aboratory accommodation, a'shortage
of apparatUs, and scattered science laboratories. In combination with ctW
problems.treiatingto ldck of communication between science staff, patterns.Of
school organization, and teacher' absence; these factors resulted in a-teaching
program at vaiianee'with the vision of the. Integrated Science Scheme,
179. 1 88

180.
Instead of support. materials the woricSheets had become the
syllabuSand. as teacher 'demonstrations were often Substituted_
for pupil practical work, class teaching had become the dominant
activity.. (Hamilton, 1975 : 187)
Both, these studies suggest that the.way in which schools and individual
teacherS implement new!curricula may be influenced by the resources available
:; .
to them. The observations made by Hamilton(1975) also are a reminder that
the form of theiiiplemehtation is often a produCt of's variety of inter--.
acting,factOrs.TherefOre in this study it was'deci to look at some
schools in detail to examine theway in ftich faciliti ere utiliied,in
.science. teaching
While Chapter Eight made use of comparisOns between classes on selected
dimensions this chapter is-concerned with detaIled consideration of:a small,
, number:of schools. The schools concerned werethe same 29 from which studht
data mere collected. In addition to these schools one matriculation college
#as visited, and a few less formal visitswere made to sch.00lS which were
notable for recently acquired, or very good, facilities.Clearly it?was not'
possible to report 'in detail all the school visits. Instead, a few schools
have been described with a view to illustrating some important issues. The
reports have been chospn for that purpose. Schools described are. not intended
to be representative of States or systems. They are examples in which Some
important issues are most ,clearly evident.1
The descriptionsof the schools, have been collated.frou0.nformation
Obtained through interviews with science teachers, science co-Ordinators,
laboratory staff and others, and by perSonal observa'fion.Use was madp'of
loosely structuredinterview and observation
sehedyles so that comparable
.information was 'obfained,from each'Schotil. Goodlad and Klien (1974) used a -.
sigafar general approach in a'study of primary schools. ParsonS (1976) has
recently urged the use of4theoreticallybased guides' to interviews and
4 7
,obServation in illuminative Studies.
1 ' The names of theschdolsdescribedin'this Repott, are fictItio0s.
8b

The ConteXt of-the Schools Visits-
MoSt teachers of junibr.science supported the conventional' wisdom Of Australian,
science teaching in.recent students should perSonally participate.in
scientific activities. Within that framework teachers differed in the'emphasis
they placed on pupils doing experiments tlipMselves and_upon. tbe !purpose' wRich'
that attivlfy served. As, a broad generalization manyeachers wished stndents'
experimental work to. be supported hysome direct teaching, and other activities
. Consider the view of one science coOrdinator.
I'place a high emphasis oractivities. I think the kids partici-pating in experimentatiOdyhether .they're lArning,Methods orhandling eqUIpment, or juiSt seeing how to do things.is veryimportant. They-gain confidencein their motor control, inaddition to learning work.. 'course it has all.gottO be followedup "I think the kids have'a tendency if there is'not some .
structuring tOjUstgo holus bolus and,not get as Miich out of it.'
.
Pupils. expdriMents were seen as serving a number of purposes. Some were .
extrinsic.in that they related to either reinforcement ofjtithelearning or
motivation for further learnin (either, of the particular topic or of.the
disCiplneover a.--longer term). Others were intrinsic in that they-involved,
pupil experimental .Work,aS the principal Vehicle'through.which to 'develop
.skills closely dependent, on -that work. .Such aspetts as ,'problem solving'
skills, hypothesis testing,..reasoning.froM empiriCal dat14, and manipulating
apparatus ere included ip this category. As Most science teachers indicatedA
a.desire to accommodate many of these elements, differenCeS in their
intentions arogefrom the relative emphasis placed on each
As an.indication 'ofthe sort of baphce which'might be -reached, and the
way in ,orhircH that may alter with tune, consider the case of Highland High
School. A-pregram which was previously directed exclusivgdyNowards providing
experience in scientific method.-has altered.so that greater emphasis is now
placdd on acquisition of knowledge. The twin reasons for this change were a.
reconsideTation, of t4k capabilisies.of most students.b'eleA:ear.10; and a.7.-
desire that,istUdents should acquire certain. knowledge of relevance to environ-
mental issues. A.statement prepared'by tffe'science-coordinatotindicgitedi
-182'.:
..The,'sdienCe.Stoffthis time lwhen4enei-al aims were. reviewed)
.ejectokl4he0.44 that me sheilld have asingle. majot aim. One'
such diM:QhiCh:had been' 'InSideted was to train'studentsin the
7Ppatterns and procees Of.cienceso:that they will be able to
use the "Scientific Method" to solve:newproblems:ft'...
Our experience was that the student'sability to,Use the "Scientific
Method" (formdlate hypotheses,design, experiments, etc.) was closely .
linked to their ttaggeof mental' developMent.. After extensive
training-,in the .."SciMfifid'Method" it-was founa. that less than half:-
.of Fort.four:ttudentg could apply itsuccessfollf to'the solution'
of real problem. jtmay be that the ability to formulate, hypotheses
and to design controlled experiments requires formal thinking which
has been shown to be, undeveloped in many students at form.
'.four levels., -
'Thus; while accepting that the "development-of mental skint in
students shOuld be one aim,-.we felt that. this.should7ndi. dominate
our teaching to the-extent where content off knowledge is considered
to be.of secondary'importance. .
-
At this time.,%there;was also an increasing community awareness .of
the consequences ofthe .ftowth pf science and technology and We,
felt that one of our. important aims should befto developthe
students understanding df,and concern for, the impact of hdman.
'activiOes on the environment.
..:
, -
It can be noted 'in pasSing. that Several, of the' schools visited were embarking, '-__
on similar changes,' -o
...
.It was clear that science departments were (1entinually choosing frdm a range
.
Of options the sort of science curricula which would be taught and the way
,. ...
in.which,it.woukd be taught', Within departments, :individual teachers had '
,.. .
continually to decide upon melhOds to be used,in'science teaching The,lere..
presence of good facilities, did not appear to,automatically result in a.
particutarfOrm of teaching. Nor7dipl the absence of good facilities pr eclude .,
...
.'.
student experimpptal work being'condqcted'n an improVized
c
setting. What watil.,
-N s-_.
visibly affected by the facilities available was the convenience and. .' .
'efficiency. with, which science could be taught. Many teadhers who rejected_L
the'prepostien that the fadilifies at. their litsposal deterMined the way they .
. .
.
, .
Itaukht mentibned that.
cpnvenierke and efficiency were influenced. Other .
teachers, especially thote insehdols:with,:pootscience rooms, - or those who
.couldremember.haVin0aught-invety-pdtr.science rooms, were more inclined
to attribute strong effects te_the, conditions under which they taught,' ,
There was,
also evidence that neW facilities Weretof greatest benefit
. .
., . ', :.'4.,.
when other circumstances faVoured their effective use Ruraton High School
: A...

.
..: ,was a school :where such circumstadceS*ere
favourable'; `staff .1.6f.&n00,0vas. high, suit abl e curriculum materials were . be i ng j nt rr(idnr ed, 'ind two. key
people had been .invalved in extended iri asery i ce 6 ducati on. 'New enee rooms
were provided at of fortuitous circumstance.
Background
Ruraton High 'School Fortititous Circumstance
Rurafon High. S hool .ya's-`12he" of two,: government acboAls in a country town ofabout 8000 .Peo le. It -enrolifed-:.7.00::,s tudept5, 'Eight of it'.- fifty -threeteachers to cienEe:
. -
-.. . , .:
..
. Ruraton High .was a -choo 1 in which .fhe: potential;of ita'cience facilities7- A'.. . ..was exproiter"mell:. T t-ience rooms now in use 447,e, EirSt
occupied in 969 Surrounding.. circt.imt ances seerrit.0,haVe:,priqtticedth.c.:impact Which ,tbey.madec 'Most importantly, the new facili,ille:S were butlt at.a .tiille wheO. there. was .,.interest In,. Some new currienlum,Raferi al's produced bythe Junior Secondary Science Project;. ,, The new facilities dramatically '':.contrasted with the oi0 and thereby. .ekaggerated. the possibilities witlivin
-.
'.them. In addition the scifool: rptaWed its. science staff 'e.fhat : there.w4s,continuity:, of aell,plopment.,and,0, aschcal,7i it was generaLly. 'favourably'disposed towards active 'forms .cf41earCpg
..-- : . %
..
-. Its fonr(rooms were part Ott 'ari'datractively designed building ''This ,'building also housed the administrat'iue: off i tes ,
.the geography delpartment ; ,a,matriculation centre ,',and some gene91 teaching roOms., .'4 private'-' architect"
.
specifically designed. the buildilfg' fo suit the site and it .Was set adjacentto an. attractiye galdeb of native. shrubs,. : Othef facilities :of the schoolwere in Stare 'contraSt,to this On"nilcifild still. being UseeWas:built fefthe original school, sixty. -.fiVe years :.Ato. - It waAnppl emented% by An annexe. -"'.
.:.which.' was formerly part of another school 'across: alroad, and several rows ofdOlountable c l assrooms- . Science l'u6:j Ca At we,re' prey ionsly tanght in onepobrly ecruipped science. room .in the Old ,.building.: Ao.adjacent room wasr..modified witlfa ',New extra' fittings ',Z2 that it also, Cpurd be ,ui;ed -:for science.
.In.ihe words of e science/CO=ordinatoi, 'this,iieanI that junior classes,,didtill gpt a .1o,pk- n' (arid]' senior cOsSe.' vete there just feiitheir prat.classes.' : :Teaching ofteriinvol,',Ved gbing. to a room 'With a..hOcket of" wSterAnd a portable burner and that was
. .
.
the new currieulnm . mate ria1:1!,',' :;htch. became avai l ab le . , fl. the :t ime/the
new building was being' erected wereWsigned for ! scienc CA, buswhich placed more, empbaSis. on' stidenf' Act ivity 'and WhiCh h. Akec.n intr9d4ccd
.
in thdSeate a few years. earl i Or. Seietice teachers at 'Rbra Ti- were i
apparentlY keen to use the new 'methods and the new 'hateria 1'. .,' ',T
m'
hus newprovidedlooms were rovded at, ,:.triost..opportune,i. . e. Perhaps with the wisdom' of. .
hindsight ; the S'cienceordinator reeled that ;, . , '
.....'! :: . -moving to the .ri'd building ,Ohere there are fowi. science',.
". rooms meant all ClaSses could ha e'01P of their science in a .
" '-ci..a5e, room,: and in 'A pa rt i cut a room.: Activity based.programs which we run now would not have been' Possibl e under
:,
s the old situation':. ;; J.

184,
, 3
',The new methods were notentirely.'based on new curriculum materials from
outside. Original material develdped'in the school was also used. ,The
science co-ordinator had been at the school since 1960 except for a few
xars.at other schools. He recalled that:
'Since (moving to) the.new. rooms we started/uriting our own programs.
Now some of these programs we-think are very good indeed.
And we may perhaps use them In preference to ASEPmaterialbecause they've been written bypeople here, suit our needs
and so on. But the kids haVe been doing ASEP -type activitiessince the first .full yeal- we moved into the new building.'
Q: Are you suggesting thatthe new rooms werea'stimulus towriti-flg,driginal material?.
',Certainly; there was no point,othetwise.'
The strong impression, gained fr.Om the science co-ordinator was:that the
provision of pew rooms4tad removed a barior to the teaching methodsthey
had wished to adopt, '1.twaS a view .shared by.the acting Principal, himself
a science teacher, who came to the school not long after the new block was
occdpied:7
Science teachers staye Ruraton longer than is usual in government
schools i,11 country towns. I 975'the science teachers had beemat the
'school for an average of six dirs.. This allowed teachers to follow ideas
'through their impementatiolv-period. It also alloWed a gpod informal
communication.network. to be established and for the teachers to.be'familiar
with all the resources in the department.' In 1976 there was a valuable
blend oryouth and experience on the staff.' An additional valuable aspect of
the staff was the period,which two key members .'spent on part-time study leave
in the early seventies'. This,involved moving to city schpOls temporary),
and studying'at a tertiary institution. On returning to Ruraton they.not
only bqught ,new ideas but. were sufficiently familiar with the schoolvto be
'.able t pleteht them.
Not 'only the 'Science department of the ?-school. was active. A range of
interesting evelopments reflected a generafjiveliness in the school. Macy
of these developments originated in the late sixties which suggested that
there waS:a genetal atmosphere conducive to the'sott of changes which
bccUrred:in science. Among the innovations which remained were:
(0.
c.c(b).
a series of short courses for Year 11 Students, which were intended to
further.hnd enrich their experience (e:g. pOttery, ethics, journalism,
ene,rgytesources),
atatticulation centre for senior students;
an
.
..
activity program which provided for diverse leisure activities
(canoeing, bushwalkingi photography) as well as tradit -ional sports, .
an improVized open plan Form 1 complermhich us English and.
SocialStudies, and 5.
a-contribution from staff and the .school
education program. 5,
4
resources to a community

1(85.
Science Facilities
The science rooms which' were in use in 1976 were modern and adapta hey. were arranged in two pairs:' one pqir on each level of thenew building.` I
three of the .rooms service's were provided on 'elongated' pillars' while thefoprth had all4its gas, electricity and water outlets at the perimeter ofthe room. 1n each r em the' tables could be easily rearranged. Provisionfor storage ih, -the r ms was good. Each was. set out identically so thatstudents could ubtai items of basic apparatus easily., .Between.rooms there.was;a spacious'preparation room on each level and associated with.each roomwas a storage room.. One fortuitousz-b.enelit arose from the arrangement ofthe rooms in pairs. Given the easy access from each room to 'the preparationroom, and the wide adjacent corridor, th.ere'.could be fluid movpteRt. betweenthe rooms. In 'fact tarp rooms could some-Edges function'as an almost unifiedlargex;---teaching space. =
Four science rooRs'were almost: precisely-the number.which would havebeen specifieby the CommonwealthStandards Committee for -the number ofscience period taught in'this school.. In 'practice however, the use o worooms by non-science clas'ses for 25% of the time meant that the rooms we evacantless often than'would be desirable. Notwithstanding this, the basicfacilities for teaching science in the school were good/' All science classeswere held in good qualityrooms.-.- Indeed, ea class had all its science clessdns in.theame room. Moreoever, the pres %)of a full-time -raboratory-assistant meantythat the strain of maiAtaining,and7.preparing-apparatus wasrelieved. The only'd:ficiencies were the ancildary provisions.' There wasno special.provision,for staff OffiCes = corners of preparation rooms 'were beingused the school lacked a Plant or animal'ropm, there was no science reading-room and there was no research laboratory: '
'Science Curricula and Science Teaching
tbas been mentioned that ASEP and JSSP 'units were. used extensively4andespecially ih Years 7 and 8. HoweVer, the sci co-ordinator pointed out:
'We try not to just run through a unit as is we Tunctuatethis with rather more formal demonstration les = , discussionlessohs if a unit is hot available tior an area of he coursewhich we think is important or more importantly b cause we feel'that every. now 'and again the kids respond better to A change intreatment .'
Two'younger teachers involved with Year 9 students voiced the same.
opinion. ComMenting on the need for .varied approaches one observed that'kids get tired of activity .lessons all the time'. The comment containedjust a trace of disappointment from a person who earlier had expressed aleaning towards the philosophy of Rousseau as presented ipl-Xmile Both wereaware of student boredom with activities, which interested thewas.teachers. .
'Similarly, while both enjoyed using ASEP 'in a free spirit' (allowingindividuat progression through units) they felt pressure from problems ofclassroom management of resources, and of giving sufficient attention tostudents. Even given good laboratories, .abundant apparatus andla lqbor tory.
k
aSsistant,. ba sic educational problems remained to be solved. ---,J
in close proXimity to each other.'-z
Stafi worked had been.mor
..
than one year at.the school. Therefore combunication t curriculummatters was assumed to occur informlly. Certainly ther was cb-oriiination
,
9,1

186.
of the curricula. At each year level a common 'cored of. units was studied ,
by allclasses. Detail was not specified other than through resource .-
materials,which,ware Indicated. %,thin the core' indiviauaNkteachers, decided the empliasion different aspects o the unit. In addition to the
.'core' there was an element of the years wo whiCh was enti,xely at the
discretion of'each teacher and which w* not common to every'.c,Jass. In this
way the. department believed: it could provide arplanned .5quehtiaI develogment
over 'the Years 7 to'10 and yq, allow each t.eacher a degree of autonomy.
Within such a small staff it seemed* tio-44Wrks. No one expressed dissatisfect-
ion: . <
.
.
---A similar approach applied-to assessment in Years ,7 to 10. ;Feacbers.were'
able to chOose their own methOds of assessing student Progres'but all arrived
at a five pi4nt letter Classification. In practice all teacherS used topic
tes's, projects, and judgments about classwork in similar proportions.' No
formal at empt at moderation w4 made'but close informal collalpration was -*-----.
hoped to r move major.dispreparities,b4etween classes.\
. .
'. In Year U and 12 s'cience subjects were a little more p pular than in other'.
.
sd)eo.1444 in the State and rather more popular than in other g crnment schools. It
had 1.03 science subject enrolments per,student while the State average wad'' ,
0.94.: Biology was especially popular accoun ing for 51 per cent of the Year 12
)1students'against the State average of 4] p 'cent. Only Physics, Chemistry and 4
'Biology' were offered in Year 11 and Year-12. Geology wag. once offered to'
Yeat -II students until the staff member whose interest this was left til'04-
.school_ T1 school- was considering makingP1D/SiCal Science available to
Year 12 students but it was limited, not by facilities, but by its size., :
It was'considered that such a subjlet may jeopardize the.viabpity,of. Physics
and chemis'try which are important **tool' subjects in tertiary studies.I-. .
.
.
As a rural high school Rtiraton had -the additional resource of the .
rrounding bush. Biology made use o1' this. In a city school, field studies
in olve time consuming and.administratively difficult excursions. Biology at'
l Ruraton often included cycling to a nearby location for field work in
addition_ to longer field study camps. Strangely, such informal'excursions ...
were less easily arranged for Years 7 to 10. More administrative requirements
needed to be.fulfilled. One of the younger Year 9 science' teachers comme4ed
tha3 while facilities in his previous school were poorer, the administrative
barriers, to Using the surroynding bush were fewer. This partly compensated
for poor facilities: .. :.
0.
°Teachers' Respolses to the Facilities .
Teachers in RuratAdiffergd. in their opinion of'the 'importance of the good. . , . .
-facilities.. -.The science co-ordibato whooremembered teaching-uhderthe old
conditiOns considered them useful..
g
'don't necessarily think, that to do worthwhile science, you. ...---!-,
have to have a great amount of material but I thinkAt nice
to be able to draw. on material' if need be. Jest to quote an
xamplc. Not being a physicist I don't know much about cathode
. 'ray oscilloscopes., But with the help Of.trie Physics .peop,le,
.
When I,was doing some work on licrves-wc set up a, good
demonstration. Ifeldt didn't exist I wouldn't _get ups'eti. 'I'd
survive. hut it's better to have it. And its better to.have a
room withapfew.taps in it, a spacious room, a quiet roem,..S
room here desks'oan be moved. .infO" any shape that's required.'
..
-
. r7N '
,...
-7-----5/ )
- 1.0
*,

187. ,. .
. .
-
Theyounger.tehChets who had not experienced the pporqr conmhich-preViously existed, were rhtherless eertain.of the. value ofacilitie "s.'. They weremoreAnCli/t1 to mention 'faults' such asunsuitability of perimeter Service's in one :room, a fack.lof.trollunnecessarily large-demonstration bench. The main value in theschool science department was not..rhe facilities but the staff atri&iIn their.view,...the physical Aleiant,:Of.ifile science, department would notmajor:factor in a decision tgistay "at,the'schoo1.1,,
f
Other Aspects
_There were interesting aspects of the ,s41'6 science.:teaching which hi-by. .
partly related so..the facilfvies available:1 OreviousjteritlIon was made o:the use.Of the Surrounding bushland. The sdiencebo-ordiriator's ominpnt
, was relevant as a contrast to the; view that :one problem,of good aboratOwas-.that they make science an indoor subjeetHe said tha;
- 0.
..Hit' mightn't be a direct- result but by/t1te a osphere createdby new courses and new rooms, more usq,IS:n d of the bushlandaround the school.' 0 .
This assertion need/to be tempered by cons dering the opinion of one of the.,
younger science teachers that arranging for Sucb excursions was rathefq _.4 difficult. Perhaps the slifference arose from the different age level-S--ztheI\ two teachers were dealintwith or perhaps it may have .resulted from the
different'ekperiences theyt had had..
/
School0.
sciencAfacili ies were used at odd times by photography and'film ,making-tvfOUp. Whit rooms-werekept locked, teachers. did arrangeto,b'e present when students wante to 88 extra work. The offer was more_than nominal. T4 science co-- inator claimed thht
111 Year 7. teachers often 1-iaVe lunch in the room so thatstudents can vork in the lab.. We make a-lot,Ofdeman8s Onstaff time here.'
A
Yet while.this era activity was real it t as also limited. The same spokesman.cpbceded.that 'per aps'we don't go.far enough'. JP.
. The circumstances in whiA'new rooms were poroVided athejped:eiksure the successful use of those rooms Comingln,the right circumstances they ave been used rather effin YearsF7 to Id experience a simulating a active proteaching, :
Ruraton High, havethe right timeively. Students /
of science
A contrast was provided at Riversdale High School Where Jimila
ambitions for the teaching of juni4r.science were not able to be 'impl mented.
"River4dhle had inadequate scienCtaccomRodatiom even that-available
the schdbl itqserved almost excluv*ely:fdr senior students. The conditions
udder which jUnior'scienclas taught at Riversdale wereAlimilar:to tho§e
which prevailedmoremidelyvbefore 1963, 70
. 1

Riyersdale High School : Enthusia m Trustrafel
Riversdale High School was located in an established Pn&affluent suburb.
Its students',tonstituted a slightly more heterogencous44164.ation than this
would suggest'as' there weraspockets of poorer. housing in surrounding areas'.'
The school's, grounds wereespacious and attractive: Its buildings were a
mixture of o/der main`Struetures supplemented by recent adit.ionS. Whileit lacked the modern!appearance. of newer 'S'chools it appeared:by conventional'standards, an attractive environment in which'to teach. This superficial
.judgment was confirmed by a reportedly low loss of staff each year..
..
Scie"nte aCcOmodatiOn was not good.. Too 4ew science'reoms were available
to house all science'lessons. In I976t,Jheschool had six science'Yots.
Ideally it needed eight torsatisfattolply,house its 180,- SO-minutel'ence'
lessons each.; Weeke A
When the quality of the six rooms was considered the situation appeared
to be ',el.ren'Worse Only three of the Ythe six rooms could be considered to be o
adequate quality.. One of, -the remaining three was a converted ,library used
mainly for teaching (edgy. It had only a ieacherS!,,demonstration b
way of sPecial'services. Two OtherrooMs were builtj.n the mid-fifties but
not as scinoe rooms. They were\locatrd p considerab e distance fiom the
main --s'cierre...blec they were teo\small 7(24 feet by feet).'for.d.Ilormal
class of 30 t .pils, and were in pocir rep4j.r. In each room only three,
sinkS werA, functio 1, gas leaks were a'problem'and many stools all of
which'appebred to be uncomfOrtableill'needed to be filced. Even hid-Ithe
. repairs been effected the tom design waS.cpoorl The problus of cramped
working conditions were cdqpounded by large fixed'iSland benches, too close
together,'and some hazardous plumbing arrangements. Water and gas pipes'
were laid just above floor level and, though protected by wooden Covers;
.presented .a real hazard to movement. -In addikion the chalk 6O-rd was
sma1,1,..,,and there was no teacher's' bench. The Fire,Department had declared
these tWerooms to be unsafe as only one ,exit oxisfe0i
' The three satisfactory science roomSwere designed for the spebial..6..
,--science sujects of- Physics; Chemistry adq'iliology, T14 were spbti,6s 7
and Well designed if somewhat inflexible as a result Of 1\ong fixeObtdbes.
They were lotated,with the previously' described seminar/O ology room, in the
speciil science -block where they were .close to the 'serviceand storage areas.
.In acalition to. the teaching rooms thi4 block hpused a.scien ,p Staff office,
a \subjectma tors office, and several preparation and storage areas: The
whole comp x was provkled.unOcr the Science Facilities Ptogr . A plaque
attached n kr the entrance testkias'to its opening` in 96.7. .
.
Only students in Yeats .11,and 12..iief thdbetter rooms. i'Ce;than., \
eight Science lessons for over secondary schdbl students were held there
each week. As a tonsequence most Year'll a d Year 12 science lessops-were
reasonably acammodated:but IV the two. ilapidate.d science rooms Were
available forthe 90., SO-mini c science periods in the lover seconplaty
'school each week. Mute, test ny to tlestateof these vOAS was pi-OV'ided by°
the fact the rooms were oferiqinused, ven.when they were availnbl'e.', '..l'eachprs' '-\ .
.fr
.cregarded them as unsafe for science-
-.
;.:";\. .
Apvatus was:plentiful. SeniorBioloa. was-especially well
with material. Even(ju io94'cience'hadaMple:stocksof apParatus, butit.'\ -
was located in the stpie c block..' flente it OPwas not .Feadily accessible to .
.
0 97'
0
the rooms in voilich junior science. Washeld. Lacl< of secure storage adjace4to those rooms precluded materiatbeing kept there. As the science co-ordinatdr noied; there was not much loss due to breakage. . Little wonder, as''the apAratus was rarely used. In addition to,the adequate stocks of .
apparatps,there were two laboratory assistants to help prepare material.They worked very. effectively inythe senior 'science subjects and could easilyhave managedodditional work in junior science if that had been required.:The laborato* assistants mahaged the records and maintenance of apparatus '.
,
supply. The school had effectiVe laboratory assistants so that this did.notlimit the use of experimental work.
Courses in.junior science were Formal, given to didactic teaching andsomewhat. T'eaetitil:te. 1116 science co-ordinator observed:
.We tea41,,aver$ theoretical type of course here. In fact they.(State.authorities) changed the science syllabus here about threeor four years ago. We should have implemented that, but becauseAg.,lack:bf facilities me virtually still use the old-syllabus.The.trend..these days is to a lot more activity in courses. We.wObjd dearly love to be on to that, but, because of the lack offacilities we follow a theoretical course They're lucky todo prac.. once a week ... We did try some ASEP courses in Year 8.for two years with one class which was lucky to be able to use
.tone of the senior' laboratories to do it. We did also try it withother Classes and try to run it in classrooms but it was just 'noteffettple; mainly because of equipmentAosses, panagement apdinterference froi.othet classes etc.
The.school 's stock of JSSP curriculum mat rials remained unused as witness tothe inhibition which facilities in the sell 1 pla;ed on teaching methods.Problems created by the poor facilities were more than self perpetuating:they were self exacerbating. The syllabus-had been devispd to suit the, poorfacillities and. was formal and content Specific. It was determinedunilaterally by, the science .co-ordinator. Assessment was. by a. commonexamination (80 percent), teacher tests (15 percent), and project work(5 percent). The result was that'teachers felt obliged to coverthe large
amount of content, With the effect that project and practical work wereaccorded lqw At class level the fact. that students were rarelyable to wor\ in a laboratory resulted in a lack of familiarity withproCedures. Class management was therefore a-problem, activities wareclosely directed, and time was wasted in housekeepingon those occalions.when laboratory work was held.
The teachers involvedin Year 9 science teaching agree about what they. ,would like to do: One said::
-'. 1011, we don't do enough prac. work. I'd like to see alaboratory based course, not wholly %perimental work, butat least that.type course.of courSe ASEP, actually thefinal year tbat was here, in mr,i'oom but it wasn't satisffttory.You don't have water. . Yob can't heat anything up. 10 did Miceand Men but there was nowhere to keep the mice. We had to run,and get the mice at the beginning of every lesson (sic).
f ,1
A calleague expressed a similar view assertig that if goad laboratories wereavailable:-..
like tip run a science woukse which was, praeticaliY based.
19.E
190.
A third teacher echoed these-views -seeing the course being taught as-less
student oriented and-less interesting than desirable. The-teaching .about
density, which was observed during the visit provides an illustration of
the general pattern.. Not once did students take measurements or make. 4
observatilms themselves. The concept .was taught using a formal' iwithematical
approach supplemented by computational exercises from a textbook.
When laboratory work was c6idocted it was 'done in isolation ^from theory.
The lbaratories were unsuitable for normal reachirng because of tl seating
arrangements. °LaboratorY work was formal and recorded in a separa - book
according to a standard format.. -One of the teachers described lessons held
in the. laboratories this wa,!:.
We can't have any individufal work at all. We haven't "got any'
spice to store any expQriments set up where we can say to the
students take this and-proceed: You have to do, it step
oy steo-with .them because .there's no chance to organize it that
(the fthmer) way. There's not,enougr'space so you have.to be
. very careful,.you can't have students- moving around fromplace to
',place.. They're fairly depressing'places to work in
Another.AInel that the only means of compensating was to conduct demonstra.-
tions'in th6 normal classroom. Outside this room was a drinking tap from
which buckets:of waterouldbe carried into, the room..
Teachers perceived that.:student enthusiasm was affected by the envdronmunt
in which they worked. All expressed the view that one aim in teaching
science, andespci,ally of the experimemJ1 work, was to gerierate interest
in scientific phenomena as well as fo help students acquire some basic
'cognitive skillS;I The,science co-ordinator wa,s.aware of the problem of
facilities in thiS.regard: .-
I. can remember.going.back to the 'Grade 8 in which we were running
ASLP, where they were actually doing experiments in'good conditions,.
and the,CnthUsiasurdf those Grade S. students for science was
amazing;. Whereas aur.present Grades 9 apc1.10'don't show
enthusiasm as one of'their finer points.
It was a view reiterated by. other teacherF.. Students, it was felt, lost
'ointera,stboth because of the conditions:and the course which had to he
taught, And, because tlley lost interest, tliev..did not wbrk as well.
'Teachers felt frustrated by ..theiT conditiOns. When asked. what effect.
.thc Door conditions had on t.ea:.:Jfer one:re4ied:
lsrwitrating! It 'tales,a lot of time to organize and carryequipment from one place to the other 'it's a'nuisance
I guess frustration is.the main thing .,, Int not 'being able
to teach the way that you'd jike..to.
The co-ordinator was aware of the effect .oil the Morale 'of staff:
The 'number of complaints I.get 'about those terrible junior.
"laboratories is large. Lots of'aspectsaffect teacher morale.
One aspect, in fact, was the preferential'use good facilities in senior
science. Teachers in junior, licienc.e felt envious and said that students .

191.
held similar views. The area of hope in the school science program was anew Year 8 program. A course basild on a more activity-directed hook(Concepts of Science) was being introduced. Some effort had been made to
.
have lahoratories available for this course with the result that an' estimated 60 percent of time was spent in the laboratory. A science levyof $1.per student per,Science subject generated about $1000 annually 'andthis was used to buy material for the course. The teacher responsible feltthat brighter students' might-miss some rigour but;
tile- slower kid's seem to benefit by doing more practical work andnot being told'things'but having to find out ... They enjoy it,they maintain their interest in-science, which is somethingusually they've begun to lose by this stage. I'd like to be ableto. say that they're better in the laboratory but this morning r hada disaster.
\The program was still troncaied by having to §fiecifieallyschedule laboratorysessions; rather than have mixed activities in any lesson. Its extensioninto-Year's 9 and 10 was - dependent on more laboratories.being available.
Teaching science at Riverside flighecmed C\. much an experience ofenthusiasm fru$trated,and 'opportunity curtailed by lack of suitable scienceiooms.
0
At Ruraton High School the science co-oreinator regarded the,new
facilities ag'having.had considerable.dmpact by removing an obstacle to the
sort of cOurse.Which they wanted to teach. '.Science teachers at Riverdale
High were-in a contrasting. situation. Especially those who taught junior
science felt that the lack of'good.facilitics,impcded-:their teaching
Teachers at Petrin High School didnot feel the privatiOns of theif poor
facilities to be quite so important. A11` -the teachers at Petrin were young.
As it was their first. school theylad no experice of condition's elsewhere:
in addition they were imbued with_an enthusiasm fonteachrig.which led them
to imprdvise in ordek to teach activity courses. This theydicl in the certain
. knowledge that they would occupy new science rooms the school was built.
At Petrin it was possible.to speak to science teachers both before an after
t1tcy had the benefit of new...fqc)lities.
'
Perrin High Stool 5ubtlq Changes4'
Petrin High School.was a new school. in an old suburb. Its cstabliAiment wasin response to a new wave of settlement in the area b .yourigerfamilies.These families were mainly migrant families. In economic terms it w uld bedescribed as working class for most employment was in a,nearby area .o.lienvyindustry. The most specific general prohlem for the school was that he .
students had reading difficulties. A. a result teachers of most subje ts,including 'Science, had to take greater cognizance of -the readability o thetextual materials Whichthey'uscd.
2 t)Q.
192.
The school began in makeshift accommodation. In-1975 most of the
.schoOl.had occupied new premises though considerable work on the schoolgrounds needed to be done. Science was; in that year; still taught inpoor conditions. .When. a first visit was made to Petrin,science accommodation
was one modestly equipped portable classroom, and two other portable class-rooms with no special equipment. The direct jmpatt of these privationswas:that some units were not able to be offered, some activities in otherunits were omitted and generally the; range of choice was restricted. One
teacher expressed the problem this way:
They (the poor facilities) don't affect the way you teach butrather the topics which you can teach. For example, I wantedto do Polymers but without a fume cupboard I felt it was 'toodangerous. When I first arrived I had to teach magnel!,sm becausemagnets were all we had.
When asked about anticipated.difference when a new suite of science rooms
was occupied,the same teacher suggested subtle rather than major differences..
.Firstly I'll have more contact with the other science teachers.At the moment we're isolated from each other. .1 think thingswill be more readily available and I'll spend leS's time sendingk,ids back and forth from one room to another. It will probably
be more efficient.
It was an interesting adaption to curtail content areas rather than'modify
methods. Activity methods were considered to be of central importance.Content was.included. if the school had the facilities to,teachit approp-riately. In most other schools it was content areas which were firstspecified and then methods were. used in accord with available facilities.
The youthfulness and enthusiasm of the.staff resulted in a perseverance
with the course which they wished to follow.
Wh6n a return visit to the school was made one year later staff wereable to reflect on the difference that occupying a new suite of four modern_
well-designed science rooms made to their teaching. The new rooms were not
only fine teaching rooms but they had the advantage of adjoining a spacious,
well-designed preparation area. Therewas no dramatics change reported. The
general approach' to teaching was as before and was described by one teacher
as:
To make students aware of the' use of science,the value'of science,the relevance of science withodt becoming too specific. try to
csteer.awayfrom very straight formal chemistry for example.-,We
nhave o prerequisite forlYear 11 studies except that they (the.
students) have an awareness about handling apparatus, they can use,.things, they can reason deductively but they need not know such
specifics as how many electr s are in'atoms of different elements.
The main reason being that.f. m 120 to 130 Year 10 students we.have
14 in Year JI Chetistry, I can't see that we could justify acurriculum suited only to those students when the rest should have
a much- more general approach.
adopting this framework did not mean neglecting factual knowledge. Consider'the same teacher's view of experimental work.
WW/
ilk
193.
We place a high emphasis on experiments because they learn.and it keeps). their interest going. With the ASEP units halfthe time thy enjoy it .but.they learn nothing. But' if you'reable to back up the experiment with some teaching that experiment.becomes quite meaningful.. Now I add a fair bit of explanation.
While the general approach to teaching had not dramatically changed somesubtle changes had taken place. One comment was that:
My ninth year units are either ASEP units or derived from ASEPUnits so the equipment is very simple. I haven't -,found myselfdoing anything different to'what I did in the units last year.
foundta-great time - saving though. It saved time because I'vegot things in the room. I don't have to carry them from room'to,room. I've got hot water on tap and ice here ... Last year for.hot.water I had to send a thermos to the-staff room to be filled.from an drn. Well that takes ld minutes or so. Now we just run.a tap.
The same teacher continued to comment on the siudents'.reactions in a:viewechoed -by cakleagues:-
ti
The kids are better in class because they feel they're in ascience room and having everything you need is important ...
They seem more responsive.° They Iook after equipment better..They're interested. You can get them into a pattern of knowingwhere to put things away and what, o do. They know wherethings are, whereas they don't .vihed:.You bring in five traysto the portable rooms. They forgetWhat came off which tray .
and'you have bedlam at the end.
There were also some changes in teaching methods reported. Two teachers,who had been at the school previously remarked upon the use of impromptudemonArations:
I would have done more demonstrations this year simply.becauseI want material I've got it handy.. ',Quite a few mere demonstrationsactually.
The demonstrations were not just of grand experiments ,but of simple gradedexperiments to introduce an investigation and to save time. Even audio -.visual aids such as the overhead projector and slide projectors were morereadily used in the new rooms:.
While this description of Petrin 1?igh School suggests relatively Smalleffects of the new facilities, three other factors need to be considered.One is that the science teachers who had been at Petrin in 1975 and 1976 hadnot taught at other schools. They had therefore developed appropriatestrategies to cope with poor facilities. A second is that during 1975,the
'effects of poor facilities were mitigated by.a very efficient laboratoryassistant who managed apparatuS very well. ;Thirdly, the interview questionsconcerned junior science. As one teacher remarked:
Your questions have been aimed at ninth Year. With 11th YearI can't compare but I can observe that with the exception ofabout two, I would have.beep:struggling to do any of theexperiments 've done this year. don't think I could have
202 .

194.
taught Year 11 Chemistry ... I could exist
Year '9 Science but I couldn't exist that wayChemistry.
-_J/
rg
portables forYear 11 "
This suggests.O.:It the strategof avoiding content areas requiring specialfacilities, could not be applied to Year 11 Chemistry. Content'in thatsubject was apparently much more immutable,
An additional point could-be'made concerning a prel,ifiously.quo,ted/.'comment about.contact with other science teachers. At Petrin as at manyschools there were conflicting views about the degree to which each classat a given Year level should follow a common course, and the extent towhich one Year should build on the previous Year. In short the conflictwas between school autonomy in curricula and teacher autonomy in curricula.It was an important issue if only because.students were not held in the sameclass within their Year, from each Year to the next. An extreme view ofteacher autonomy seemed likely to contain the seeds of a confused experience 4of science for many students.
It.would be naive to attribute this problem to the scattered facilitiesbefore 1976. The-debategoccurs in many schools. Yet it seemed possiblethat the lack of an identifable science area, with consequent lack of contact,between staff, contributed to a habit of separateness. The poor facilities -
didn't create the problem: they merely made it harder to'solve.
here ere schools which had an apparent abundance of science rooms
'.which were cot fully used and in which rather haphazard-and inactive science
courses- .were followed. The visit to one such school at Casterbridge
revealed that while it had ample rooms it had.little else. The science
department and its equipment had deteriorated so that it was no.longer as
useful as it ought to 'have'been.
Casterbridge High School : Rooms but, Little Else.
Cagterbridge High. School was located in a low socioeconomic area of a large
city: Gradual changes in the age distribution of the surrounding communityhave resulted in a decline in the school enrolment. Some.years ago the
school had nearly 1500 Students.on roll. Now a few more than 800 attend
ki-,
the school. Facilities, which were provided when the s ool was large, now'C'serve the smaller number of students. The surplus of falities was
accentuated in Science subjects by the surprisingly large. proportion (morethan one quarter) of studentS.in Years 9 and 10 whO did not study Science at
all. In addition the retention of students from Year 10.to Year11 was low.Fewer than 40 percent of the Year 10 studentsproceeded to Year 11. Thus
even though four of the 12 science rooms were equipped with nothing-more thana demonstratiOn benchthe school had an abundance of rooms. All scienceclasses could be held in laboratories. Surpr', .ugly few science classeswere actually held in laboratories. ,
While the school'had sufficient rooms many were of poor quality. In
fact -they could be.considered to form three- groups: six were built as part
of the school before 1964,'two were built outside the Science Facilitits': 'sz_

195.
?Program in the mid-siities and four were built in the early stages of the.Science Facilities Program The O rsix der rooms were particularly shabby.
RoomD-was' so small (24 ft x 24 ft) that it Couldtreally only accommodate20 students.- It was expected to hold 30. While it. was the smallest, allthe old rooms were cramped. Island benches were so crammed in the rooms.that movement in claSses was difficult,,even hazardous. Two of thesesix rooms weredemonstl.ation rooms and perefore had no services atstudent benches but two others intendedi4a.s. laboratories had no taps orsinks at those benches while the twid'properly serviced rooms had-manyinoperable and broken sinks. The benches were chipped and partly corrodedand in no room-was jlot'water availhble. The adjacent store - preparation
\rooms were useless because they were not stocked with basic apparatuS:This was especially a problem because th ooms were so ncatIered'around-the school that to provide apparatus From, he central-store was nearlyimpossible. None of these rooms, had any pr sion for Using visual aids,all lacked diSplay. board space and even the a ea of the'chalkboard wasmeagre. The'two more recent noncommonwealth roomswere similar. They onlydiffereein that,being of more recent construction, they were in slightly'better repair. :
, A special science block was providedunder fhe Sciente Facilfiies
Program-at the beginning ef that scheme. It contained rooms of infinitelybetter Quality, good storage provision and a science staff room. Yet ithad faults: The Chemistry room was a single purpose laboratory. The super- .structure, above the runnels was intended to store-regent bottles. If'theywere still used for that purpose they would be an even greater obstacle toteaching than at present The Biology room was of -fairly rigid design whilethe Geology room had no stUdent'work-benches and was therefore unsuited toanything but formal lessons. The Physics room was a well-equipped and welldesigned room. It was noted that this block was reserved eicluSively torsenior classes-.
The quality and-the design-of the science lab resulted in lack of.use. One teacher of considerable experience offered a reason for the lackof use bade of laboratory facilities. .
0
I would say the poor quality of the labs.4... .It looks good. .''Whenyou walk around the grounds yop see all the:labs. and everything:,It really doesn't lo4 too bad until you walk in theie-andyil
.start trying to'tea'ch in the situation ..- They look good andpeople who don't teach science think they.are good. Well, I'vetaught in lab. D and I'll tell you that un 'less,I really; had my-back to the wall I wouldn't go back in there'. I avoid D'lab.I.don't mind other .1-abs in terms-of size but I don't like the
k
arrangement of the seats, the lack of power points, the lac of ,sinks fof them (the students) to wash and cleap their equip ent,an inability to get to a sink and push theimunaer if thereosbeen an accident. There's no accident shower at ali.
i
..
.
The teachers of junior sciencesuggested.that the type df rooms ava
*il-able forced them to teach practical and theory in separate lessons, and hlnoto use less activity than desired. The generkl pattern was to take, a classto'the laboratory when necessary, otherwise science was taught in class-
Another teacher commented on thejaboratories he used.
There are clay six sinks and three.are-oleaking all the.tim. I've beenat the administration for two and a halfvars to. get them fixed up ...

196.
The"romiiis physically too small fOr thirty kids. The'amoorit
of equipment that is stored in it is inadequate, the glassware.
the general equipment that doesn't have to be moved from the
laboratory; or shouldn't be moved from the'-laboratory, is -
simply not there. The normal things that I don't think'shOuld
.be moved from a laboratory get moved from class to class
depending upon who°wants them ... If you're, setting up a prac
yotiliave to.specifically outline everything that'you might need.
Everything includes even bunsen'burners an matches.for example,'
'tapers everything. ".*
The science co-ordinatorwho was new to the school 4n 1976 ObServed that
the school administration di not organize the timetable'to enatift
labOratories'tO be fully use.
'
Actually'we're well off-here for lab, hours. Of course even. .
though we've gOt the lab. hour's to put them in all theytime,
because of the way the timetable is based'we can't do it
But then of course a ibt of teachers don't like to teach in
the laboratories because they are so. small.
Iffyou've.got 33, 34, or 35 students in these junior laboratories
thpn it is' very very difficult to do any work; .because: you've
got to spend a lot of your time disciplining so that they''.11 do
what you want them to do:when you want, them to do it.
The poor quality of the.science rooms and :school organization were two
reasons why the rooms were not fully utilized. Two other reasons were
management difficultie\ in the science department and the nature of the
s).r1labus"being followed' in the school.
Diffiebitids in the seience department seem to ha-ire resulted in
a poor stock of apparatus and lack of organization of laboratory staff.
The school was poorly provided with apparatus. Twenty-four bunsen burners
cannot be considered adeqUate: Only five of the'25 microscopes in the
school were in proper working order... A lack of pyrex test-tubes resulted
in the use of soda glass tubes for heating.':There was of course considerable
damage. The.sciehce co-ordinator mentioned the difficulties which this
situation presented, for the introduction of ASEP.units.
To do ASEP you need plenty of lab. hours but you also need plenty
of equipment. Now you don!t need very sophisticated equipment but
you do need a very very large number of beakers", test- tubes, and
all sorts of rubbisf,which'we don't possess - as I was:telring
you earlier about t e pyrex test- tubes. The fact that we don't
have any pyrex test-tubes means that when you.do.an experiment
which'involves the heating of some substance, you ruin your. test-
tube and you can't use it again. Our soda glass stocks are also
going down. Now there are two reasons for this. One is that we
only get a. small grant and the. other one is that the time span
between orderrhg'and deliyery is so"long.
The science co-ordinator was new to the school. He was attempting to
.
rectify the depletion of nonconsumable stock which iad oe,rurredover
previous years. There had been three science co-ordinator\in the three
previous years. Orders had not been diligently placed or followed up and
repairs had. not been made. Nor had rooms been renovated.
2 o

197.V
The stock of apparatus also affecte&Year 11 and 12 teaching inscience subjects. While schools had nominal autonomy in these areas theco-ordinator observed:
The equipment ;hat's put on. these books (lists of equipment) isreally say PSSC for Physics and Chem Study-for Chemistry. Now.if you want to change your course you've got to change yourequipment as well and you've got to make sure its available.
There are chits on which you 'can write in equipment youwould like but whether you'd get it is another matter. I'venever done that. I'll never be game to try that ... By thetime you 'get your equipment a year later and they say 'notobtainable' or 'refused' then, a year later, you've got tostart locking for alternative sources-..
sAll three laboratory assistants were young and inexperienced. They
would have been of greater value lo the science department had more directsupervision been provid94. Lack of. continuity of'leadetship.had resultedin.too little direction of their work. Often they seemed to have too littleto do' The widely scattered location of science rooms meant that their taskwould have been.diffitult anyway.'
The fairly formal and didactic pattern of science teaching in Year 10and below followed a syllabus developed in the school. Intheory'theschool science departMent was responsible for its development. However in .
.practice the document had been devised by the-previous science co-ordinatorIt was best characterized as a listing of chapter headings and sub - headingsfrom a single textbook (Science. for Secondary Schools): Even where thebook had been written for use in another State (Geology) no adaption hadbeen made. Moreover this text is generally regarded as better suited. orstudents with well developed reading skills. It therefore seemed aninappropriate choice for Casterbridge.
:
The resulting work program had the expedtation that all classes wouldcover a large amount of content. As aconsequence teachers felt that thepressure of time was on them and that they could not afford to allow students,to do many experiments. One teacher saw it desirable, especially inChemistry and -Biology topids, for students to gain understanding through.doing experiments which would be followed by a consolidating theory dis-cussion. However,
.there is just no time for this. Time is the major factor in ourscience course at thematerial.
The-new science co-ordinator was aware of the problems and could seevarious means to reform: He was supported by a recently appointed energeticPrincipal. It was intende0 to reconstruct the junior science syllabus in
.'consultation with the science teachers, to use some new curriculum materials,such as ASEP,and to iMprove contact between staff throtigh regular meetings..However for the new methods to be applied it Was recognized that the school'sstock of apparatus needed to improve dramatically and the old sciencerooms needed renovation.".
While Casterbridge High School had an adequate number of science rooms
but little else-same schools had made most concerted efforts to make
the maximum possible use of their facilities. One such was Western College.
moment. You are really pushing to cover
2 0
<

198,.
Howevr,ven the intended.efforts were curtailed.by some aspects of
the 'facilities available.
* --"'...".
'Western College : Making Do'
hot all non-governmeAstboods were completely adequately supplied with
room. Western College was a boys school in an industrial area of a mayor
city It enrollet1.900 students but its retention to Year 11 was 60 percent
toYgar 12,43 percent.,::
Four science rooms were provided at Western College under the Science
Facilities Prdtram; two were completed in 1967 and two more in 1971. .In
.addition some $8000 wis allocated from the Program for the purchase of b.
4 app4ratus". With 125 50-minutg periods to be accommodated the school jilst
did .not have sufficient science' rooms. Given a 30-period teaching weep the
.school Ought to ideally have s*, or at least five, rooms. It was not
recommen,led for additional science accommodation in 1971.; though it was
included on a list of schools likely to develop needs for additional .
accommodation.
The rooms werd7of good quality if of an older design, -All except the
'Physics' room had long fixed benches. across the room.. The Physics room
had fixed pillars, with movable benches thus allowing great flexibility of
arrangements. Since the'rooms were. all located close to each other it was
relatively easy for apparatus to be shifted between rooms wbeh necessary:
This was especially importantlts Western College had -no }aboratorS, assistant.
Every effort had been"made to ensure that classes were in science rooms as
much as possible. The school timetailed separately for Years.7.,'_8, 9, and
10 and Years 11 and 12. As 'a'result there were no lunch and recess breaks
-common to 'all classes. At almoSt every available time all science rooms
were used: there were but ,two-times each week when one science room was
not used. Even so two-thirds of the Year 7 science lessons were not able
to be held in science rooms.
The school made considerableefforts to engage its junior students
in active science learning. ASEP units were used extensively, though not .
exclusively, :in Years 7 to 10. A number of JSSP units were also available
but these were not used as much. Generally a good range. of basic equipMent
was available for this teaching though there word speCific shortages of
such instruments as microscopes.
'In spite of'the school's attempt to-fully.use the facilities available
to-it some problems existed. There were apparently difficulties which 'were
hard to overcome in'this situation.ForYear 7 students the lack of access
to science rooms affected the way science-was tifught to them. One teacher,
in response to a question of whether this made a difference to teaching.
science; expressed the View. that:
It does really., With Fotm One, I find it much harder to take a
period of all theory. I prefer' most less'ons.to be fairly
practical and'it is a bit difficult getting equipment from a
science room down to an ordinary ClassrOom. I do less practical if"\I
with them.

His colleague concurred. 'Teaching'Yei-7 Was very diffiCult but eventeachi/g Year 9 was difficult because the rooms were in such .constant use.'The excessivem:Of the rooms meant that it 'WAS hard to prepare. -A I.
,
FOrprepar. ion its difficult. 'We've also a brokentimetable:the junio school; 'intermediat'e school and-senior.schOol work..on diffetnt timetables' so that in my lunch time I can't..:get:-:into a science. room to prepare for my. less= coming iip. Howeverwe're well-equipped with trolleys. in the preparati-on rooms and 1
li put the equipriient on the-'trolleys.. .
.
.
.
.
.The trolleys were extensivQjx used Uut because no laboratory ass stant. was employed some stove rooms becam6ia. little disorganized. An arran, ment
,-......whicjythe schoolcalled'teamteaChingiwas7emploiedin Years 9 'and 10. Inpractice this meant that teachers specialized 'In-Biology, Physics, andChemistry.and classes rotated each term. It 411otjed rooms to bc,.set up forthose reSpective.subdiscinlines: Such an OTangement was convenient 'forteachers who had heavy teaching lOads. It also helped obviate some of the
)problems of.'havi too few.. science rooms and no laboratory' assistant. .-.Whether it was an i eal arrangement for students was arguable. The ,pattern.
-of organization ihlears 0 and.10 was consistent with the'observation madeby Brown (1977): wh n facilities. were scarce. At was easier to organize the -.teaching of separ, e scienceliubjects than.to teach science as an integratedstudy of:.a dist' .ine. This school appeared to regard it as a .2mpromise.At Year.,7 and Year 8 a general science teacher took classes through the.
whole yelirl
0..
The other problem Was that staff were often rushed. Lackof adequate.space in which to plepare 'exacerbated the difficulties created by heavy,teaching loads and Tack of laboratory assistance.'
/). -
Given a situation with insufficient science rooms it took considerable'effort to organize so that the m'axiMum use was gained from them. Itwas also indicative of a general purposefulness in the teaching program. thatthe school was attempt'ng.to teach the type of course that was considered-,appropriate. The enth 1 siasm of at least some staff was evident in the strong4electronics club at tl school. Physics-materials and the l'-' I.F.s.i c. laboratory!were used by this group which. had been organized by a-teacher who was anamateur radif-enthusiast. At the time of the visit.to.the schdol an attemptwas being .made to construct an electric car. The Priday evening meetings..of the electronics club eVenlinvofved many paents.
The program of science teachins( at Western Coile.ge was one i-n'whic-1 -coneefte3 attempts were made to teach active, involving. science. courses.'In teaching that program throughout the school were -hampered' bya shortage Of 'rooms and a lackof laboratory assistants.' Tbey were forcedto make do with. what. was.available. /V
2 ) 8

The Schools ; A Resume
- ,
,gam In the studies made ofathe.schoOlsdescribedin.this chapter, differ-
- .
erhees in the approach to teaching science- were observ .. Ian, f-thesc,.. ..,b. e
differences seemed to be best, nttribut d to differences in staff, the'. ...._ ,
r .
influence of State aUthoritiv,tpie nee to.takt account 2f.lecl conditions,.. - ._. .
.4
'
--
......
and skill of the seience co-ordinator.HolVer, the facilities available
i
facilities
for teaching science were-also UnuentimiLi. The standard of facilities '
affected the range of options available to science teacher,s when. Planning4
.ipouiNes. In addition, the Mprale of science. teachers,ail*dl.t4e.organizatiod,.%). ,,
d .
of science departmentsseemed to be .i.fluenced bY the facilities available
ew
I. s° T
The influence of the standard of science faciliudes on the rd'ne of
choices available te.teachers wasillustrAted by the antnst betweer,
Ruraton and Riyersdale High School#. Ruraton High Ss4rool had an .adequate
<
numbet of good science rooms. Teachers chose to promote Active forms of
learning:in sciencetifrough enquiry methods.
By contrast at River.sdale.High
this optitin was not available. Lack of appropriate accommodation .circum-
scribed 4-0.-Irhing methods. Didactic approathes to teaching science were
Unavoidable in these circumstances.Casterbridge High provide1l another
contrast to Ruraton. It had an abund'ance of science laboratories, though
many were of poor quality, but it had chosen not to use enquirybased teach-
. ing methods. Casterbridge differed from Ruraton inhaving both 41 high staff
turnover and a rather disorganized ,science department. It had received very
little encouragement to embark on more stimulatingcourses of science:
Western Collegepersitfted with modern science curricula in spite of
....
inadequate sciencoAeetommodation:HOwever,:the lack of sufficient accommo-
dation preventedadequate-prepariltionvf lessons and(?-esttitted opportunities
to maintain rooms.Petrih High was oh'served before and after it occupied new
science rooms. Even thougliTiCe courses it Offered did,not change drama'cal ,
and teachers maintained, similarintentions with regard to science teaching,
some subtle changes occurred. Teachers reported that they were better organ-,
ized, that they made more use of impromptu demonstrations,and that their
students were more responsive. In brief it semed thdt.
curriculum had.not altered,there appeared to have
:les4bns which students experienced.- .
It appeared that good science facilities
while the formal
been changes in the science
Were of definite assista to
'science teachers.'Teachers working under poor conditions expressed frustra-
t1.4n at the restrictionsthey faced. Where facilities were either insufficient
239

v.
P
or of poor,Pluality.teachets Were frustratedintheir-a tempts to implement
-the'coUrses they.thouge glesirble. Their Count arts in's5hdo 1 s 4 with
good facielVtieswere able to teach tore easily and waste less time on' ,
organizational aspects, of science tealing. Severs perie ced membersiv_ A ,
of Stitnce Teathers AsSociations txpressedtheview-that h important effeq:
'3OR the Seiencejacilities ProgramrwaS.:an increased sense of professionalism 'v
.. sr\... amongSt ;science teachefs. This view was illustiotted ddring,visits to-Valley'
.,,7 .and Orchard Schools.. Both had recently been provided-Withsnew scienceev 4, % 4
actlinmodatiAp.:-..the new acdgmmodation was of notabprbetttr,quality than
1
j ad been-.at the school preVibusly. It was inferestinOhat ai'these
schools older roomsL were cv ripOr . v
being ren ated tomake them aiiiie-7-co arable with
the new ones. New and better st
oFanization of sthodl resources.
materia&in junioriscience'had been
,tions were manifestations of some undefined change wit
-ment. Things which had not been of high priority now
age facilities hg.d enable
A more co-ordinated use
introduced, Pres
The visits te schools provide4 evidence that the
___,..- facilities did influence ilt teaching of science 0r70"1/ere not the only factor in shaping the science teat
But, they did set limits w'ithiri which 'choices could b.,..,
those limits were tdo narrow, choice was limited and fr
more effectPlve.
f new curriculum
ably tihese observa-.
in.tht science depart-
worth doing. }-
science
acilities
schools.
st dard
0
210
e good
ternspa
xerci ed. en
stration was apparent.

1
"OW
.4s
craud TEN, V
. .0TEACHER AETOTION AND STVDENT- NAOLINIENTs
.
.11IntruCECtion
t .
Two anticipated effects of Ae Science Facilities ProgtalkWhich have natjet,
Deen .discUSsed *oncern the 'retention of tfachers and the enrolment patterns. .
A A-of studehts.
It was noted.in Chapter Two that an enduring critigi.sth of the Science
Fatilities Program was that it lavished funds 'Upon material facilitIeslOithoue
devOting siigilar attention to1.4.4-ntion'of better qualified science'
teachers. However, it has also neen.obServed.that 4me people associated with
-the Program hoped it would break the self perpetuating cycle'in science teach -.-
ing : poor facilities, low. morale, high *staff.lAs and unsuitable curriculum
aterials. SpecificalTy'it was hoped that an-impro ement in facilities would'
lead to better qualified scientists' being attracted to teaching, and remaining
longer in schools.
When the Science Faci Xties Program legislation was feirst, introduced to
the Federal Parliament, mention was 'mge.of the need to attract greater.numbers-
of young people tascienAfic and technical careers. 'it was assumed that
V improved facilities would 'serve that end. fn fact in every State,the proportion
of senior student's enrolled in physical sciences has declined 'civerthe period. .
of ple Program. This in spite of the improved facilities. Yet, superimposed
-5p this genevOtrend,;there wereperturhati,9s: differences existed'between- a
States, schoOl systems and schools. It is possibleAhitthe proVision of good-,:T.''
rkdilities influenced such fluctuations.
r.
/N.
ScienceA
Teachers in Australian Schools
The Qualifications and.Sex of Science Teachers
The teachers about whom the information used in this section o0.the report was
Obtained Were all .teachefs of science in the sample schosils.during 1975. A \teacher of.science was defined as aperson whb taught a science subject on a
regular basis in that-year. The term sciencoubject included Science.
(multistrand, combined or general, any one or more of Physics, CheimItry,
Biology, Human-Bio.12gy, or Geology, Agricultural or ttral'Science, EnvirOn-,
mentaliScience, or science included in a GenernlStudies Program.- It did not
203. 4.? I

jot
\Ziii '',
/. .,
Table'cer.71.-:Rercentkage of N. ce.Teachers. with a'CompLeted TertiaryQualificationin. Science (Survey.Sample of ScnT1S, 197S)
,e,
qT.
Victoria y
tg:ensland
South AUstralia
. Western Australia.
Tasmania
*
Goveyhment Catholic
. 83
80 (61)
49.0 (62)
67 (53)'
81 (61)
66 (55)
86 (60)
'80 (58)
AIndependent
Notes :
-
:
70 (59)
66 (49) .
/-;;456)
61 (45)
64 631J
75 (61) .
-
44 (40)
67 (40)
*I
.1%100 WO)
'81 (73)
89 f68)'
7L (63)
74 (67)
80 (63)
,192 (80)
k3 (69).
82
77.
67
79
()
79
78
(74)
(59)
(61) t
(52)
(60) "
(56).
(57)
(59)
.
.
,,
of-,,.......-
The Figurds in parentheses are the percentages
who held Bachelor or/higher degrees.
Tifb number of teachers.involved was 3127.
include Domestic Science or. Geography.Defined in this way. the teachers
concerned .would have constituted those staff normally considered to form the
.
science department of a school.
-The sample used in the survey of sciencEacilities was a
schools, not teachers. However,
probabi3/4ity prOportional-to siie
-school as the unit of analysis.
school mics
and systems.
to size; this
with only a few teachers.
sample of
because the schools were selected wiih a
it was considered'appropriarte to use the
Data were aggregated by school and then the
were used to eitimate values of, the various parameters for Statds
Since the schools were selected with a'prybability proportional
method avoided anybias which would have emphasized schools
At the time the Science Facilities Program began.it was difficult to/ t.
.staff secondary schools with teachers qualified,in sjence. As noted in
Chapter One, more tha n one-teacher in,Ohree lacked any scientific qualification.
The data which are recorded in Table 10.1 indicate the percentage of science
teachers in,the group surveyed itho were ualified in science. Qualified in
science was taken to mean'a completed to tiiry science qualification. A
narrower view would include only those teachers holding a Bachelor or higher-
a related field. Because of the diversification of
tertiary education in recent years it was considered Ire appropriate to
encompass all tertiary science qualifications. 'However, th proportion of
degree in science or
teachers\ who held Bachelor or higher atgrees ha's been included in
2 i 9parentheses.

205.
Table 10.2 Percentage.of Science TeacherSiin ,1975 who were Female4 CSurvey Sample of Schools., 1975)
Government Catholic Independent Total
ACT 42 55 64. 49
New Spdth,Wales 29 f 42 .,..
58. 32
Victoria, ,29 45 33 . 32
Queensland-, .20 36. 33' 23
South Australia 26 45 39 '29
Western Australia 21 2 32 34 24
Ifasmania 22 33 32 33.
Australia 26 41 4D 30 ,.
I t
A one way analysis of variance. suggested that the difference between.
.
.
school systems was-significant .; Catholic schools had fewer qualified science
teachers than Go ernment or Independent schools. Also significant was the
difference betwe1n'States, with fewer science teachers,from.Queensland and
Western Australia having completed tertiary qualifications in Science.
it 'appears that the supply of qualified science teachers in
Australian 5 0015 is now much better than in the early sixties, it would be
naive to attrivute this to improved facilities. Far more likely contributor's;, /
to_this change ave been a decline in other employment opportunities for
scientists, in eased salaries for'teacherS and expanded teacher trainingQ.kgrams.
It'is.interesting to note, in passing, that the profession of scieit0'
teaching stiii:cont3ins a majority of males:. In 19612. when the Science
Teachers Association survey was conducted, 30 percent of science teachers were
female (Keeves, 1961). Data collected by Rosier (1973a) in 1970, suggested
that some 36 percent of science teachers were then femae. The information
collected in 1975 indicates a. national average of one third of.science
teachers were females. As the samples from which these data were derived.
were.not strictly c4arabie., he figures should not be taken to indicate
trends. Rather, 'they do suggest that the proporta of science teachers who
were female has remained relatively stable over the years. Table 10.2 records
the percentage of science teachers who were female, for each State and school
system. The differences between school systems were significant : there waS
a smaller percentage of female science teachers in government schools. It is
also interesting to.note Vle difference in the government school systems of
each State. A different balanbe of sexes in the Australian Capital.. Territory
is particularly noticeable.. 2 .1 3

Table: 10.3
.206.0
Number of Years=Taqhing'114)6Ance of Science Teachers
(SurveY4--Sample'ef. Sohools, 1975)
.
ii4P*-Government
ACT - 7.0 .- ..
New South.Wales 7.3
Victoria1
6.1_
Queensland 6.0,
South Autralia - -.5.7
WeStern Australia7 6:9
Tasmania 7.6 (6.7)b
Australia 6,6
-
Cath'oet,V Independent Total
69.,f X4.6 6.5
9.2 11.5' 7.9 (8.5)a
8%1 12.4 7:Q>(8.7)
11.7 11.2 :7.3 (8.8)
10.9 9':-i : 6.4 (7;0)
11.2 : 10.1 7.7 (8.6)
14.9 12.3- 8.4(10.:2);
9.6 % 11.2. . 7.4 ($.5).
Notes :Figures, in parentheses are for 1970 as reported by Rosier (1973a).
b This includes teachers in Matriculation Colleges. If they were
not included thevalue recorded would be 6:'7- This value agrees
with that reported by. Butler (1977).-- .
The Experience and Mobility of Science Teachers
Other characteristics of the science teaching profession about which data was
collected in 1975 were the. years of teaching experience and mobility of
teachers. The only data_from./he early sixties which was available was that
presented in the report of the Australian. Science Teachers Association survey
(Keeves, 1966). On the basis of information tabulated in that report it was
possible to estimate that teachers in the sample had been teaching for an
average of ten years. Further information, which referred to I97D, was'pubL
lished as a result of the TEA study of science achievement (Rosier, 1973a):
This. suggested an average teaching experience of'S'ome eight:-and-olte-half.years.
The results,of the survey conducted in 1975 have been recorded in Table 1.0.3:
On average science teachers in that year had been teaching for seven-and-one-
half years.
Butler (1977);. in an examination of the experience of. Tasmanian science
teachers between 1970 and 1975,found.result>which.paralleled this national
change.
In 1975, the differences between States-were not significant but those
between school systems were. Science teachers in Independent schools.were
more experienced than their counterparts in Catholic or Government schools.
2.14

207.
Table 10.4 Number of Years at Present School(Survey Sample of Schools, 1975)
ACT .
NewNew South Males
,ictoria
IQUeensland
South Australia
Western Australia
Tasmania
Australia
Government Catholic Independent Total
'2.2 3.0 3.1 2.6
. 3.2 3.3 7.213.3
.
3.2 3.1 ., 7.0 3.5
3.1 3.9' 6.5. 3.4
2.9 4.0 -, 5.0 3.1
2.6 2.9 . 4.7 2.8
,3.2 3.1 6.3. -3.3
3.1 3.3 3:3.
The mobility of science teachers is probably even more important than-.
the length of their teaching experience. Rosier and Williams (1973 :19)
noted that :
te. For a teacher of. science coming to a new school, timeis also needed to gain familiarity with the equipment.available in the school laboratories,. and with theecology of the local environment.
The problems associated wi1 th high mobility extend further. Rosier and
Williams (1973': 17) comMented on the difficulties cleated in relation'to
sChool-baSed assessment procedures. Even greater difficulties would be
created for school -based curricula. If innovations are to be soundly'im-,
plemented' they would need to be followed thrOugh and modified by those res
ponsible for their introduction.
Rosier and Williams (1973),made a longitudinal study of-the rEA sample
of teachers from 1970 to 1972. From those results. it was possible to estimate
that some 65 percent of the teachers sampled in 1970,were still at the same
school in 1971 and some'45 percent remained for at leaSt one further year.
This corresponded to an average time in a school of a little less than four
years (Rosier, 1973). Rosier and Williams (1973) also found that while
Government and Catholic schools had similar levels of staff stability, the
Independent schools had much more stable staffs. This was attributed to. their
greater autonomy in appointing staff.
The average number of years the science teachers sampled had been at
their present schools in 1975 can be seen in data which are recorded in Table
10,4. No suggestion of a greater stability could be inferred from that _data.

208..
.The patterntA' lower stability in Government and Cat'hol'ic schools and
greater stability in ild(perident Schools was,.repeated and the differences
between States were no* signifiCant. In.fact the data in Tlble 10.4 suggest
that the mobility of science teachers in 1975 was a little greater than it
had been in 1970. It ought to give cause for concern that this situation.k
prevailed at a time when there was.considerable'devolution of authority for
the science curriculum to schools.
Factors Associated with High Stability of Staff.
An AID analysis was used to,examine the differences between schools in the
nobility of science.staff. In particulai this analysis was used to test
whether better facilities were associated with greater, staffing stability.
The principles underlying the AID were discuss'ed in Chapter Six. In the.
present application thP criterion being analysed was staffing stability
measured as the mean number of years science staff had been at their present'''.
school. State, school system, location, coeducational status,and t e ofrl
school were entered as non-monotonic (nominal), variables. The availability
of science rooms (Q1), the afvailability.'of dual purpose rooms (02), average
room quality, the abundance of apparatus; the provision of laboratory
assistants, the proportion of rooms built under the Science Facilities Program;
the proportion of science lessons not in science roomsand the sex composition
of the school were entered as monotonic (ordinal or interval). variables. The
splitting pattern which resulted has been recorded, in Figure.10,1:
As expected the, first split, whiCh was that atcounting for most difference
between schools, was between Independent and either Government or Catholico
schbols, Consistent with Table 10.4, Independent schools had more stable
staffs. Among Independent schools the next division,was between boys schools
and those schools which were either coeducational or girls schools. Science
teachers at boyS schools had been at their present school for longer_ For
both bOys and other Independent schools the.f'nal split was made on the basis
of State': Victorian and Tasmanian schools oth categories had longer
retention of their staffs while Queensland I dependent schools of both groups--
had more mobile science staffs.
For Government and Catholic schools the pattern of splitting was more
complicated. This group of schools split initially between those with 75
percent or more of their science rooms having been provided since 1964 and
those with less than that proportion of new rooms. At first glance it

120
NSW, Vic., In;
Mean value of R
Group Number ./
R
Number in Splitting characteristic
Group :
Notes:
77 is the mean number of years science
teachers have been at schools
(2) Smallest group size =15
(3) N 319
l t -value of split
In
16
ALL, Vic,
WA1as.
17 High 01
NSW, Old,
'SA, WA
= 2.5 R 3,51=2."
21
27
High Room
Quality
3
305
Cath., Govt.
601 Staff
Oual.
figure 10.1 A10 Analysis of leacherMobility
7
103
> 7.51 New Ron,
11
154
MC;ed or Girls
16
AC1,
fas.
20
55
Mid, Low
Roos Inlay

1:4
21(), .:
appearpd Surprising .that:rhose with algrea.Mr number of new rooms had more
mobile staff.::However, it must be remembered that schools with more new rooms. .
were either poorer Catholic schools or new Government 'schools./ In.the case
of new Government schools staff would mot have had the opportunity to spend
much time at the schools.becauSe the schools had not been long established.- ..
N . -
Forthe,112 schools with fe.wer'new'srcience rooms -the next division was-
between States. Those schools were mainly Government schools together. with
a few long established. Catholic schoolS. Such schools in the Australian
Capital Territory and Western Australih'had a mote:rapid .Staff turnover tlian
those in other States. Among the 94 suctschools in other Statesrhe .
availability of dual-purpose rooms was t e variable on, which they.finally
split. Very well provided schools had a lower turnover-of staff than those..
with a barely adequate or inadequate number-of dual-purpose rooms.
The schools with.many new. rooms split again on sex ratio : boys schools
having a'higher retention than mixed or girls schools. Boys schools then
divided on the basis of State while mixed or.girls schools were partitioned
according to staff qualifictions. Where more than 80 percent of`staff had '
tertiary science qualifications the turnover was more rapid than-where fewer
staff were:well qualified. Two alternative interpretations were possible
for this. One was that the very newest schools had the greater number of
well qualified youngreachers,who had not been at the school for long. The
other explanation was that schools with more well qualified staff may have
lost those staff through promotion. The 82 relafiVel); new non-Independent,
mixed or girls schools with'some unqualified staff were divided according to
room quality. Those with better science. rooms retained staff ,for longer.
'Facilities and Teacher Mobility
It was not possible io'relate.changes in the qUalifications, experience and
mobility of Australian science teachers, over the period of the.Science
. Facilities Program, to changes in the standard of.facilitie. Apart from the
fact that no satisfactory initial data existed, ahy,thanges which had occurred
would have been influenced by a.range of other factors. Among those factors
which would need to beconsidered were changes in salary structures, other
vocational OppOi.tunities, and promotion policies.. In fact, the evidence
presented in this report suggests that while science teachers, in A975 were
better qualified than in the sixties, they were less experienced and remained
fora shorter time in each school. Indeed-it seemed that in-1975 science
teachers were less experienced and more mobile than in-1970:
2 L. 8

0211.
ti
The AID analysis of teacher mobility in a sample of schools in 1975
suggested that facilities were not a major factor associated with the
prOgensity of science teachers to move from one school to another. However,;
in two sets of circumstances aspects of facilities were associated with
teacher mobility: Firstly, among older non-Independent schoolsa few schools
very well provided with science rooms were distjUguiShed by having low
teacher mobility. Secondly, better quality science rooms were associated
'with less staff.mobility in the relatively new non - Independent schools which
were either coeducational-or for.girls. Even though the standard of science
facilities did not appear to be a major influence.On staff mobility, in.general
these cases are worth noting. in.interviews with science teachers differences)
of opinion emerged. The standard of facilities in a school were a factor
considered by some teachers when they contemplated changing schools; butfor
other teachers sucli'matters1were not,considered important.
4
Teachers Attitudes to Science Teaching
The possibility.existed that teachers in schools with good facilities had a
.different attitudeto science teaching than those who had poor facilities
available. Such a.proposition is akin-to that postulated,by Englehardt (1968);
facilities. influenCe teaching methOds,not just by limiting some activities7$7
but'by suggesting other possibilities. while no 4ata was collected as part,
Of the Science Facilities Project. about this aspect it was possible to use
some)of the data collected during the IEA study'of science achievement
(Comber .and Keeves, 1973) :
As part of the IEA'study science teachers completed an attitude-to-
science.-teaching scale. A-copy is included in Appendix I. This.10- tem
scale attempted to measure the'degree to.which teachers regarded enqUir
based learnin/g as important in science. Very little information abbut
facilities in-scliools.was obtained during the IEA study. 'However, it was
possible to use the variety of sources described in Chapter Three to find,
out the number and type of science,rooms in the schools at that time This
data was, "merged witbAheJEA.Population-IV (Year 12)" data and then aggregated
by school. The reliabilitY,of the scale, was calculated using the school means...
for each item.. A value, for the coefficient alpha of 0.78 was obtained.. This
seemed to indicate a s isfactoryinternal consistency.
It was'possible to obtain data from which to calculate room availability
for science periods taught, room abundance per 1000 students, and the pro
portion of new toMmonWealth rOoms.,,in.le school OsJa surrogate for room
quality). These were used in a correlation analysis,he results' of whicha219

212.
Table 10.5 Teachers Attitudes to Teaching Science - A Correlational
Analysis (IEA Population IV Sample, 1970)
Facilities Variable
Co relationCoefficientswith TeacherAttitudea
N.
(Schools)
Q1 - Science Rooms for Science Periods -12 161
Laboratories for`Stience Periods -09 161*
Science Rooms/1000 students -13 193*
L2 - Laboratories/1000 students-15
. 193
Proportion Commonwealth rooms-14 4 193.
Notes : 'a Decimalpoints have been omitted.
* p<.d5
are reported in Table 10.5, The correlation coefficients in that table are
either not significantly different from zero or barely.significant: This
suggests,that teachers attitudes to science teaching.were not strongly
associated with the facilities available. If anything it seems that teachers
"schools with fewer, and older, science rooms were more favourably disposed
to enquiry teaching which involved students actively. This may have been due
to the 'frustration of being restrictedincreasing.the desire to do what, was
not possible. The most plausible interpretation of these data was that the
- provision of new rooms probably enabled teachers to do what they felt'to be
-appFopriate,.rather thah changed their attitude to scienceteaching.
Student Enrolments in Science Subjects
'Changes Over Time
One early expectation concerning the Science Facilities Prpgrim was that
'improved facilities would attract an increased number of students to the
study of science. Since that Program began there has been a much publicized,.
decline in the proportion of Year 12 students choosing to study the physical
sciences (Fensham, 1970; Lee Dow, 1971; White, 1973). It would appear that
the changing subject choices of senior students in Australian sthools,reflects,
though in diminished intensity; tfie swing, from science which the Dainton Report
(1968) documented in Britain. However, the changed pattern of subject choice
should not be ,characterized as simply a swing from science; for Biology has
become an extremely popular subject. It is interesting to note that both
White(1973) and Lee DoW (1971) suggested that the swing in popularity was
not to the homanities, but to such social sciences as economics. The

213.
improvement of material facilities through the Science Facilities Program was
not.associated with an increase in the popularity of the physical sciences,
though Biology did become more popular over this time.
A recent British review (Entwist e and Duckworth, 1977)of students
choice of science subjects in senior secondary school concluded that the
swing from science was at least partly due to changes in the compbsition of
:the senior secondary school. This may also be the case in Australian schools.
It thus appears that at least part of the swingaway from science may be attributed to the chang-ing nature of the sixth form. More girls, morelfts-able pupils and;a greater variety of subjectsand subject-combinations will all reduce the pro-portion of scientists without any necessary changein pupils attitudes to science. (Entwistle and Duckworth, 1977:67).
The relative proportionS of Year 12 students studying'particular subjects
have often been taken as an indiCation of the popularity of those subjects.
Brenton (1976) argued that changes in the composition of the Year 12 population
need-to be considered when interpreting changes in such indices over time.
The retentivity of schools had increased since the sixties and many more
girls than previously ndw completed a full secondarY ethication (Rowlands, 1976).
Brenton was concerned with enrolment trends in Victoria and used both the
relative proportions of Year 12 in each subject and the absolute numbers en-
rolled in those subjects'. The combination gave a;clearer picture of trends
than either- by itself. These, data have been recorded in. Table While
the decline in the relative popularity of Physic's and Chemistry was apparent,,
so was.the fact that absolute enrolments had..!vit 'declined dramatically. A
decline in absolute enrolments wild represent a marked fall in popularity.
White (1973) argued that.an appropriate index of changes in subject
enrolments was the proportion of the relevant population who enrolled in that
_subject. The relevant population was the grade cohort which began secondary
school together. As there was not sufficient data available White (1973) used
- the Year 10 enrolments from two years earlier as an approximation to the size
of the grade cohert. Since losses from the school system had already occurred
before Year 10 that figure was not equal to the grade cohort.' An alternative
approach used in the present study was to estimate the proportion,of the grade.
cohort in each subject (G) by using the relative proportion of Year 12 (P) in
that subject and the retentivity of the system (R).
G = PR
22 j

214.
Table 10.6 Enrolments in Science Subjects from 1964 to 1975 in Victoria
-
Subject. 1964 1968 1932 .1975
N P. G N P. 'N P G N P
Biology 2100 20 4.0 3700 25 6.5 .7300 36' 11.9 9700 42 14.7
Chemistry 4100 38 7.6 5300 36 9.4 6000 30 9.9 6400 28 98
Physics 4100 40 8.0 5400 37 9.6 5800 29 9.6 5600 24 8.4
. Notes : N = Total number of students taking subject for Higher School
Certificate. 'R = Percentage of Higher School Certificate students taking
subject.1
G = Percentage of Grade Cohort from Year 7 taking subject in
Higher School Certificate.
Source : Brenton (1976)
The data presented by Brenton (1976) for Victoria was able to be
this-way and values of C, for four years between 1964 and 1975, have been
recorded in Table 10.6. Over this period of time Physic's and Chemistry
attracted a little less than 10 percent:of those who entered secondary
school. While 'in the case of Physics there wag a small decline between 1972
and 1975, the proportion Of the grade cohort enrolled in Chemistry has been
remarkably constant. Apparently these physical sciences have consistently
attracted a little less than one-tenth of the grade cohort. The.decline has
been relative enrolments in these subjects have not'fncreased as rapidly as
school retentivity: By contrast Biology has grown very rapidly. Over the
decade it .has enrolled an increasing proportion of the grade cohort. qtwas-
the most popular Year 12 subject in Victorian schools during 1976 (Brenton,
1976).
The data in Table 10.6 referred only to Victoria. Comparable data for
Western Australia have been recorded in Table 10.7. A similar pattern is.*
apparent. 'Biology had increasodits popillarity substantially in both a,
relative and absolute sense. Physics and Chemistry were maintaining an
enrolment of about one-eighth of the secondary school intake, though there
. was a slight decline between 1972 and 1975.
McKenzie (1976) has reported a decline. in the absolute number of
students enrolled in Physics and ChemiStry at Year 12 level in Queedsland.
Though data were not available from which to calculate the proportion of the
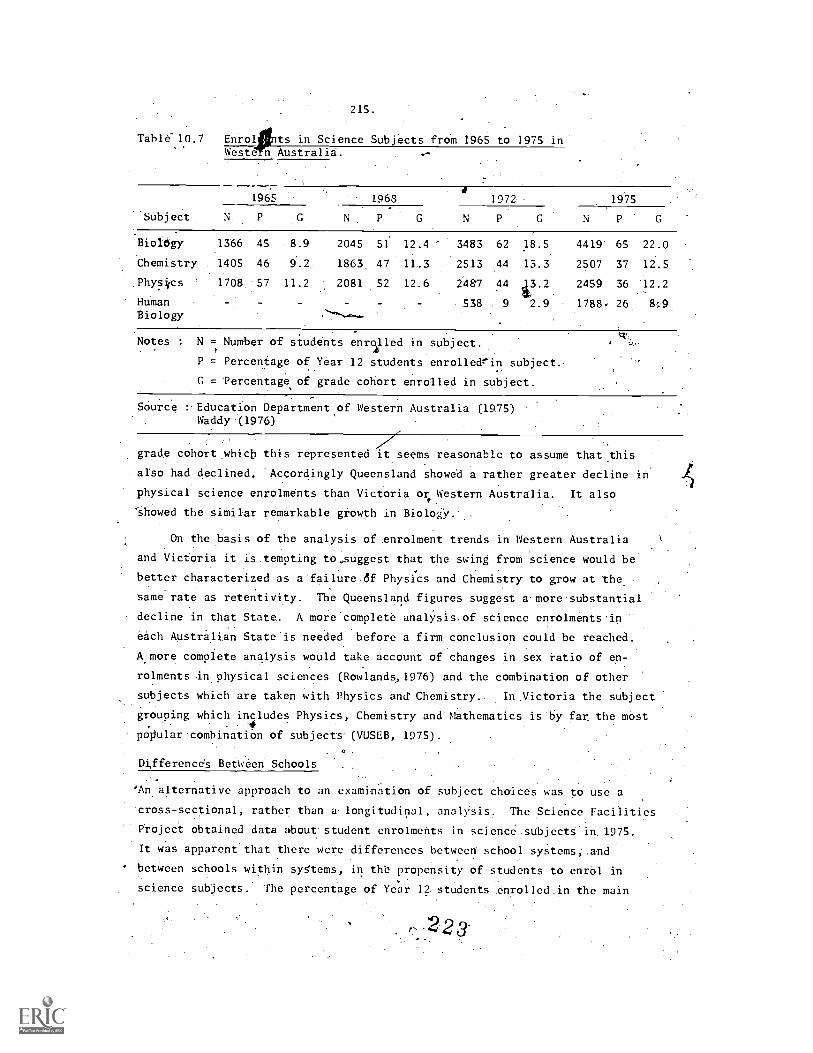
215.
Table'10.7 Enrol nts in Science Subjects froM 1965 to 1975 inWeste n Australia.
Subject
1965 19684
1972 1975
N P G N. P G N P N P
Bioitty 1366 45 8.9 2045 51 12.4 3483 62 18.5 4419 65 22.0
Chemistry 1405 46 9.2 1863.47 11.3 2513 44 13.3 2507 37 12.5
Physilcs , 1708 57 11.2 2081 52 12.6 2157 44 i3.2 2459 36 '12.2
Human 538 9 2.9 1788r 26. 80Biology -----,---
Notes : N = Number of students enriallled in subject.
P = Percentage of Year 12 students enrolledein subject.
G = Percentage of grade cohort enrolled in subject.
SOurce Education Department of Western Australia (1975)Waddy (1976)
grade cohort .whicti this represented it seems reasonable to assume that this
also had declined. Accordingly Queensland showed a rather greater decline in
physical science enrolments than Victoria or Western Australia. It also
showed the similar remarkable growth in Biology.
On the basis of the analysis of .enrolment trends in Western Australia
and Victoria it is tempting to,suggest that the swing from science would be
better characterized as a failure.6f Physics and Chemistry to grow at the
same rate as retentivity. The Queensland figures suggest a- more substantial
decline in that State.. A more complete analysis. of science enrolments'in
each Australian State is needed before a firm conclusion could be reached.
A more complete analysis would take account of changes in sex ratio of en-
rolments inphysical sciences (Rowlands, 1976) and the combination of other
subjects which are taken with Physics and Chemistry.. In,Victoria the subject
grouping which includes Physics, Chemistry and Mathematics is by far the most
poOular.combination of subjects (VUSEB, 1975).
Difference's BetWeen. Schools
'An alternative approach to an examination of subject choices was to use a
cross- sectional, rather than a longitudinal, analysis. The Science Facilities
Project obtained data about student enrolments in science subjects -in.1975.
It was apparent that there were differences between school sytems;.and
betWeen schools within syStemS, in the propensity of students to enrol in
science subjects. The percentage of Year 12 students .enrolled.in the main
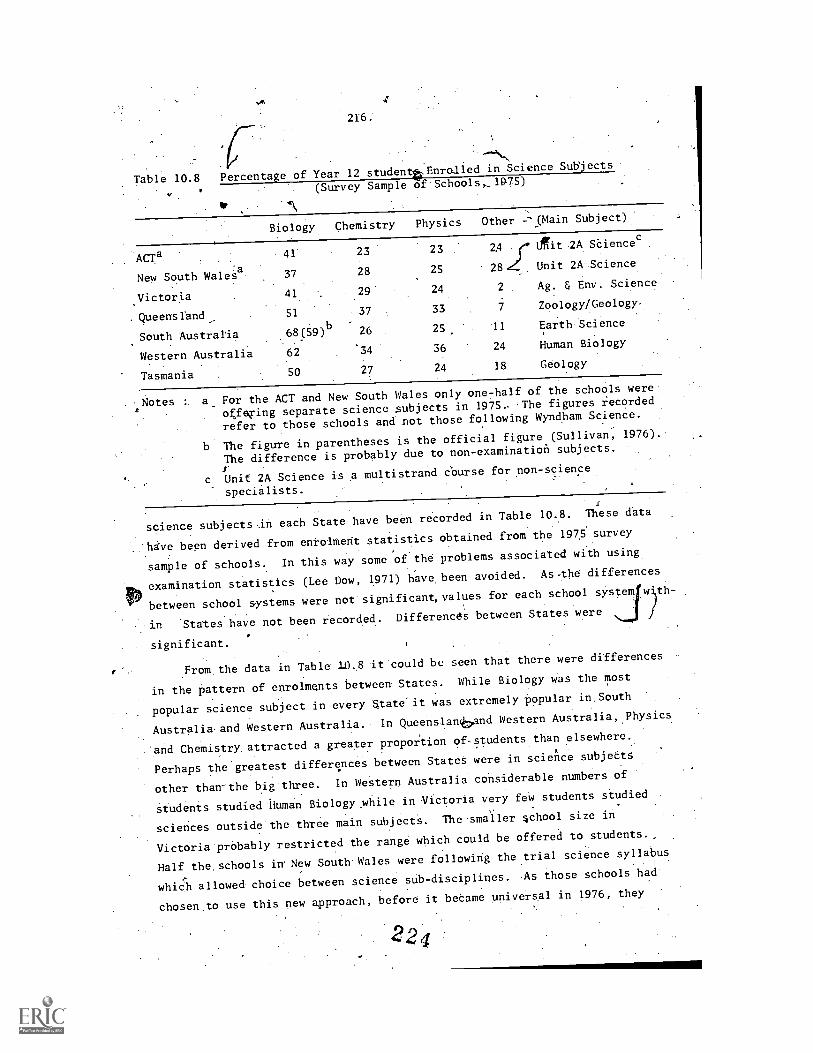
216.
Table 10.8 Percentage of Year 12student4pEnrolled in Science Subjects
(Survey Sample of Schools,_1975)
Biology Chemistry Physics Other --pain Subject)
ACTa 41 23 23 Z4 r drit 2A SCiencec
New South Wales 37 28 25 284. Unit 2A-cience.
Victoria 41 29 24 2 Ag. & Env. Science
. Queensland 51 37 33 7 Zoology/Geology.
South Australia 68(59)b 26 25 il Earth Science
Western Australia 62 34 36 24 Human Biology
Tasmania .50 27 24 18 Geology
Notes : a_ For the ACT and New South Wales only one7-half of the schools were
offering separate science subjects in 1975, -The figures recorded-
. refer to those schools and not those following Wyndham Science.
b The figure in parentheses is the official figure (Sullivan, 1976).
The difference is probably due to non-examination subjects.,
c Unit 2A Science is a multistrand course for non-science
specialists.
science subjects- in each State have been recorded in Table 10.8. These data
16:Ve begn derived from enrolment statisticsobtained from the 1975 survey
sample of schools. In this way some of the problems associated with using
tpx examination statistics (Lee Dow, 1971) have, been avoided. As-the differences
between school systems were not significant, values for each school system.w.th-
.
in States have not been recorded.Differences between States were
significant.
From the data in Table 1.0.8 it could be seen that there were differences
in the pattern of enrolmgnts between States.While Biology was the most
popular science subject in every State it was extremely popular in.South
Australia and Western Australia. In Queenslanband Western Australia, Physics
'and Chemistry. attracted a greater proportion of-students. than elsewhere.4
Perhaps the greatestdifferences between States were in science subjeCts
other than-the big three. In Western Australiaconsiderable numbers of
students studied lipman Biology, ybile in 'Victoria very feW students studied
sciences outside the three main subjects. The smaller 5chool size in
Victoria prObably restricted the range which could bp offered to students.,
Half the, schools in' New South Wales were following the trial science syllabus
whidi allowed- choice between science sUb-disciplines.As those schools had
chosen to use this new approach, before it beame universal in 1976, they
224

IEGENO
Group 'number Oean value 0 R
.W3/
Ntrateringroup Splitting characteristic
NEES:
(1) 5.2 the mean value of the Science Enrolment Index
(2) Smallest group'size: 15
(3) N :284
(4) 1= t-value of split
S.134
5..17
139
'51 ,Govt
'
31'4
44.9 S.139
1
All Schools
284
Rays Schools
I.2.8
ACI, Old, ti
SA,' fas,M22
13
33
kgh Retentivity
S.111
20
22
low Retentivity
12
63Low Retentivity
59NSW, Vic
17Co-td, Girls 4
Figure 10,2 AID Analysis ot Science Enrolments
14
23
few Assistants

218.
were probably not typical. It is interesting to note that the existence of
Unit 2A Science 'appears to be associated with lower Biology enrolments,
Since States differed'in the pattern of subjects available, and in the
extent to which students chose particular subjects, further analy were
conducted using the Science Enrolment Index. This index was defined in
Chapter Six. It was the weighted sum of all ttience subject enrolments
divided by the tetal Year 12 enrolment. Hence it was equal to the average
number of science subjects taken per Year 12 student. This index was used
as the criterion in an AID analysis. The predictors entered inclUded..soMe.
non monotonic (nominal) variables State, system, locationand coeducational
status - and some monotonic (ordinal or interval) variables - room availability,
laboratory availability, room quality, apparatus abundance,provision of
laboratory assistant, staff experience and qUalifiCations and the sex compositimn
and retentivity of the student body. C
The results of the AID analysis have-been represented in Figurb 10.2. (1
1.Most salient is.the observaton that facilities available did not account for
many.of the splits which were made. The variableS which did account for the mainv.
split were State, sek and school system. The first split was made on the
basis of State; VictoriaidndeNew South Wales haYing lower science enrolments
than other States. This lower group then split according to the sex composition
of the schOols with boys schools having higher science enrolments than other
schools. ,Finally, schools other than boys schcls differed between the two
.States. Those in-Victoria enrolled fewer students in science subjects than
their coun;terparts:in New South Wales.
In the other States, Government and Independent schools had significantly
higher science enrolments than Catholic schools. Subsequent splits were made
on the basis of the sex composition of the school, State and retentivity..e
Measures of facilities did not enter the analysis until the last split when,
for a small group of schools with low retehtivity, the proKision of laboratory
assistants was associated with higher science enrolments.
Since State differences in the Science Enrolment Index'were significant
and because State differences accounted for several splits made in the AID, a
further analysis was made. States, rather than schools, were.used as the unit
of analysis, and the amount of time allocated to science in the junior secondary
school was correlated with the values-of the ScienceEnrolment Index. As
Keeves (1976) points out by .using such a unit of analysis many confounding

219.
Table 10.9. A Between States Analysis of the Association.BetweerTime Allocation to Science and Science EnrolmentIndex. (Rank.Order Correlation Coefficients)
Time in'Year. 8
Time inYear 9 V.
Time in. Science EnrolmentYear 10 Index
Time in Year 8 °
Time in Year'9
Time in Year 10
.. 52 62 54.-
71 98
73
Note : Decimal points have been omitted.
influences can be controlled. For example differences in the retentivity to
-,Year 12, and the sex composition of Year 12, are much smaller-between States
than between schools. Under these conditions the association between the
amount of time allocated to junior science and the Science Enrolment Index
at Year 12 was quite strong.' Correlation' coefficients have been reported
in Table 10.9. The association with Year 9 science has been represented in
Figure 10:3
Correlations', no matter how large, do not, imply causality. It is
...possible that those States in which junior secondary science was emphasized4'.were also those which provided encouragement.for.senior students to enrol in
science subjects. However this result was consistent with some literature
concerned with science interest and choice of subject. Ormerod and Duckworth
(1975) cite evidence,of the early-age of arousal of interest in science and
particularly identified an age corresponding to early secondary. -The same
authors mention that the perceived difficulty of science subjects was a
deterrent to studying those subjects in senior secondary schools.' Given
Keeves (1976) conclusion that the amount of time Spent in learning science
was strongly correlated with science achievement, one is tempted to inter-
polate that students who spend little time in junior science do not acquire
.confidence in their ability to handle repitedly difficult science subjects.
Though this interpretation has been stated tentatively it does suggest
that patterns of senior enrolments.are as much influenced by sciebee teaching
in the junior school as by senior school curricula. It was shown in Chapter
,:drSix that the facilities provided under the Science Facilities Program.were
used more frequently by senior science subjects than junior science classes.
Perhaps, if the facilities had been more generally made available to clashes
in Years 7 to 10, an impact on science enrolments might have been more 'noticeable.
227

140
130
120
110
100
90
220.
Science enrolmentIndex
AWA
Year 9
2.5 3.0 3.5
Time in. Year 9
Science (Hours/Week)
4.0
.Figure 10.3. . The Association between Science Enrolments and
Time Allocated to Science
Summary
In brief there was only a little evidence found to support the proposition
that the provision'of facilitieshad diminished the mobility of science
teachers. Nor was there much evidence to support the view that better..
facilities increased the propensity of.students to study science subjects
in. the final year of secondary school.
Concerning the characteristics of the science teaching profe$sion it
was observed that though science teachers were now better qualified they
. were also less experienced than in the early sixties. The mobility of
teachers appeared to have increased between J970. and 1975. Considering
schools in 1975 there was little association between the standard of their
science facilities and the length of time which science staff had_been at
the school. Only in the case of a few schools was an association observed.
A between-schools analysis using the Science Enrolment Index as
criterion failed to find any evidence to suggest that high'science enrolments
were associated with good facilities. However; a between-States analysis led
to the suggestion that one reason for this may have been that new facilities
were generally used more frequently by senior rather than ,junior students.
' 2'8

CHAPTER 'ELEVEN
IN RETROSPECT _
It would be rather diffictilt, and probably lead to an oVersimplification, to
make a single unequivocal judgment about the Australian Science Facilities
Program. The.context in which it operated was so varied and its aims were
sufficiently broad to make. a cautious analysis necessary. Consider th0 e context
of the Program. It applied, in government and non-government schools in'each.
State. As the governments of the States had the constitutionar responsibility
for the provision ofeducation within each State there were differences in the
educational milieu in which the'Science Facilities Program was implemented.
In addition, over the 11 years of the Program's duration many other educational
and social changes occurred. A larger and more diverse range of students
remained at school until Year 12, there was more extensive devolutiOn of
authority for curricula and management of schools, and the Commonwealth govern-.
ment was making additional forms of assistance available to schools. 'These,
and many other changes,meant that the context in which the Science Facilities
Program operated. was pot only different in each State but also changed with
time.
The primary objective of the Science Facilities Program was clear. More,
and better quality science facilities were to be provided in schools. It was.
the secondary aims expected. to follow from the provision'of good faCilities,
which were more ambiguous. As was argued in the early chapters of this report°
it was necessary to examine the statements of those implementing the Program
to clarify what was meant by those who initiated the program. It was believed,
by the` Commonwealth governMent's consultants, that good science teaching should
be well organized, involve pupils actively in learning science and be
stimulating in the variety of experience it provided. Pupils' experimental
work Was regarded as an important aspect of science education which mould be ;
facilitated by making available good science rooms and sufficient apparatus.
Hence it did appear that science teaching was expected to improve as a result
of having better facilities. Furthermore. itwas believed that this would be
manifested in changes in-students'.interests and achievement. `
221,229

222.
This rpoi..t has attempted to exam e the extent to which science
facilities in schools were improyed un er this Program and some of the in-
fluen es of the Program upon science e ucation in'Australia.--
The Provision of. Science Facilities
Science Rooms
As abroad generalization science accommodation was sawstantially improved,
during the course of the Science Facilities Program, Schools were provided
with more science roomsnd better quality science rooms.
Considering:specifically those schools which already existed when the
Program began, some three fifths of their present science Ms were added,
after 1964. Moreover the rooms providOU under the Science Faciliti rogram
were considered by teachers to be of better quality than other rooms in which
science was taught. While.not all science rooms!built between 1964. na 1975
were provided under the Science Facilities Program a majority was so funded.
Certainly most new science rooms.in non-government schools were assisted,
while nearly two-thirds of those built in government schools were provided
under the Program. This included the new schoolS which were established
during the period. . .1
At the conclusionof the Science FacilitieslOrogram some .deficiencies
remained. Abut one school- in ten had a deficiency of science rooms.with an
additional' one in ten having a moderate deficiency.. A deficiency was defined
as.having too few science rooms to accommodate every science leSsoh.! N!oderate!
deficiencies were such as would have necessitated too much use of science rooms
if every science lesson was properly accommodated. ThuS,.most schools appeared!
to have adequate Science accommodation at the conclusion of the Program.
This'conclusion cannot be presented withoutlsome qualifying comments
Some of the rooms included as science rooms were:not fu4ly equippodfor
students to do experimental work: often they had only a teacher's demon-
tration bench. If such rooms were not counted as science rooms then one
in five schools would have to.be considered deficient. TheprOportion'woUld4
have been even larger ifsome of.the poor quality science rooms in Queensland
government schools were excluded. It would have been bigger still if Victorian
schools deU ted a similar amount of time to junior science as do other-States.
F. A cOnse uence of having sufficient science rooms available was that most
science lessons were able to be conducted in science rooms., Only one in eight

223.
junior science lessons and one'in twenty of the lessons in senior science
subjects were.not.actually held in science rooms during 1975. In a few cases
this was not se .much because rooms were not available bUt because a choice
had been made to use other school resources. However; not all of those rooms
Were necessarily of good qUality. Sixteen percent of science co-ordinators
regarded the laboratory i'acilities in their school as a significant impediment
topractical work.
On a number of indicators government Schools were Igss well provided with
science accommodation than non - government 'schools at the conclusion of the
Stience Facilities Program, 1More government schools had insufficient science
rooms for the lessons they taught, and-more of them used demonstration rooms
rather than fully equipped dual-purpose rooms. Inpadition science teachers
in the older government schools were still using more of the rooms whichhad
been presentin 1964, than their counterparts in the non-government system.
Specifically, while 90 percent and 73 percent of the science rooms in
Catholic and Independent schools Of this'vintage had, been added or renovated_
since.1964, the Corresponding figure for government schools was only 59 percent.
This condition was reflectedin the opinions of science co-ordinators. Only
thrge percent of those-in Independent schools regarded laboratory facilities
as a significant impediment 'to student experimental work. In Catholic schoolS
11 percent of the co-ordinators were of that opinion but 18,percent'of those
in government schools expressed that view.
It was difficult to use any objective measures to compare the conditions
between States because of differences in the amount of science tatiOit. States.
in which schOolswere among the best provided with laboratories appeared to.
have a shortage of laboratories for the amount. of science taught. Hence, in
South Australia a significant number of science lessons was not held in
science rooms, even though the schools'were well provided with rooms. By
contrast, .in Victorian schools few science lessons were held in non-science
rooms even theugha smaller number of science rooms was. available to the
school population. Different reasons appear to, be behind the large number of
soignee-lessens held outside science rooms in Queensland. Resources appeared
to be unevenly distributed, between schools and more Of the rooms available.
were of poor quality. It was the science co-ordinators of Queensland govern-
ment schools who Were most critical of .their laboratory facilities. 'In 40
percent ofthe .schools those facilities were regarded as an impediment to
practical work.
23i

: .224.
In conclusion it appeared that while the Science Facilities Program had
made a significant impact or the provision of-science'accommodation there
remained some areas-in which the task was not complete. The remaining problems
would appear to Ibebest solved by the expenditure of relatively small. Sums of
money on the upgrading of demonstration rooms at present used for science
teaching, and improving the ,quality of existing science rooms.
Ayparatus
Between eight and/44 percent, depending on the school system, of the total.
money available under the Science Facilities Program was spent on:the purchase
of apparatus. It"was even more difficult to iddntify what had come from the
Facilities Program in the case of apparatus than buildings! For this,reasbn
it was only possible to comment on theyrovision of 'apparatus at the time
the PrograM concluded.
Very few schools (five percent) 'reported-frequent deficiencies in the
s"upply'of either 'expendable' .or appallicatps. Raihermt)re schools; .
reported` deficienciesIn:'Major' apparatus. :Major. apparatus was noticeably -
'deficient in one fifth:of the schools. -However, lack of apparatus was not
often regarded as'a significant problem ini)raetical work. Only eighS. per-
.
cent-of schools regarded it as ,a problem.,.;
. .
jX / J ,
While t.his suggestA a rather satisfactory picture a'few reservation*
seem appropriate. The first is that the 'apparatus supply in schools was
sometimes very specifically geared to a particular syllabus,'thereby limiting
the.options available to the school. Sec9ndly, some (.1ficicfciesinIndf.ior
apparatus caused great 'difficulties in particularficldS ot' study- MIdrOscoPes
were.a notable'example of this, .for, the study of some aspects of Biology was
t
something made difficult' by a shortage of these instruments. Thirdly, ' the
apparatus stocks'of schools may deteriorate quickIy'if supplies of expendable
apparatus are not maintained 'and if other apparatus is not ab,1Cto.be main
tained.. While the Science Facilities.program enabled schools. to build up a
basic stockt'of non-consumableapparatus-, any decline in funding below levels
needed to maintain"stockwould be'likely to have a deleteribus effect.on
science teaching. Finally, while few Schools reported freqUent deficiencies-
a much larger number reported deficiencies some of the time A possible
method of handling such episodic deficiencies would be for schools inclose
.
proximity to eachOther to loan or share spme items,of.:equiPment. Such 6
syStem'has been suggested 12.), the State Education Wcpartincnt to schools in
South Australia.. 2a2

225.
One further need regarding science aPparatus'.in schools is that for special -
items which are not available commercially. The Science Equipment Centre in
Tasmania provides such a service for schools.in that State. It deyelops
apparatus for special purposes in schools, as well as for industry, and
simultaneouslyprovides training for'skilied precision engineers:. The
portable laboratory benches which it constructs could provide a possible :
solution for those schools with immediate and'pressing needs for bet/6 ience
rooms.*:,
tt seems that by 1975 most schools repOrted a good basic stock of minor
apparatus for which replenishment and maintenance, rather than large additions,
were needed.' Lack. of .basic apparatus was the least frequentlyinentioned
jmpediment'to practical work. However, the lack of major items of apparatus
continued to pres.ent a problem to a significant proportion of schools.r,
Other Aspects of Facilities
The Science Facilities Program was restricted to the provision 'of rooms and
apparatus, It was not...concerned with prove ng laboratory assistants who.
might have ensured that those facilities were fully utilized. Increasing
numbers of laboratory assistants have certainlYbeen employed by schools
oVer.the time .of theScience Facilities Program but were acquired through
other.sources of finance. Catholic schools were not able to dothis so ex-
tensively as GovernMent and Independent schools. More than half of the
Catholic'schools in Australia reported that lack of.asistance2was an impedi-
ment,to practicaliwork: By contrast this was true of only 18 percent of the. 5
GovernmentschooN.and 29 percent of Independent schools. The actual level
of 'provision of laboratory assistance was lower in Catholic schools than in
either Government or Independent schools.. Government and Independent SchjOls
had'approxAlately the-same level of provision.of laboratory qssi.stance,. .
Assistance witWthe'employment of ancillary staff would appear tobe an
iirriportant'way of ensuring that expensive facilities were .fully Such-:°. _
assistance seems particularly important in schools with..,lioited. financial.
resources._ From the impressions gained during visits to schools it would
appear that the mere employmcnt of laboratory staff is not enough by itself.
It needs to be ,stipported by .appropriate training programs, and by the develop-
ment of management,skills in science co-ordinators. The provision of laboratory
assistance should not be restricted-solely to the-employmentof'relatively
unskilled. people to assist with routine work. In addition,. there needs to be
233

226.
some staff with special technical skills, whO are able to perform more
difficult maintenance.,.repair 'and apparatus construction tasks, available to.':
grOups of:schools:. The type -of planned, structured team of 'ancillary staff
available to schools in Western Australia is one-means by which this might
be achieved.
It is interesting to note that lack of assistance was the most
frequently reported impediment to practical work in Catholic 'and Independent
schools. Lack of storage space and unsuitable laboratories were more
'.frequently ieported problemsby government schools;' though lack of assistance410'
was still a widespread problem.,
The Influence of the Science Facilities Program
The Influence on Educational Systems
Though the Australian Science FaCilities Program was largely intended to assist
the teaching of science in schools by providing better facilities in schoOls,
it'also influenced wider developments in science education. It was one'factor
influencing a number of changes which took place in educational systems over
this time.. -These changes can be classified as either management changes or
curriculum changes. Since the Program was applied in different educational
systems in each State it is hard'to. generalize about this influence. Clearly
other influehces were also important and.the degree to which the Science
,.:Facilities Program was important varied from one State to the other.. .
Ohe general change which occurred in, most government school systems was
to allow schools more choice in the appar ith which they were supplied.
While this was a necessary adjunct:to allowin hools more autonomy in
curricula it was probably assisted by the Science Facilities Program. By
making available more money, it enabled apparatus other than bare essentials
to be provided. Early experiences resulted in the realiiation that-schools
were in the best position to make decisions about.ptiorities in apparatus.
A variety of different appyoaches was used across State's but all had the
.common element of increasing the school's choice of apparatus. The Science
Facilities Program was the first area in which many of these schemes, were
tried, though.now they. are often. associated with general aspects of school
funding.
A great deal more attention has been paid' to. the design of science rooms,
since the Science.Facilities PrograM began. Not only have designs been improved,
butin most States science educators have been involved.in the planning proceSs:
231

227.
This probably has been the most widespread influence of the Program, even
though it.was the hardest to doCument.- By making available large sums of
money for science rooms, the Program enabled greater attention to be paid to
designing science-rooms which would suit modern science curricula.
The Science Facilities Program assisted the implementation of new science
curricula in two ways. The first was the most direct and obvious. In several.
States money was made available from this source to provide. schools with
apparatus to trial and implement new courses such as PSSC Physics, Harvard
Projectyhysics, Chem. Study Chemistry,. and BSC$ Biology. The assistance was
probably not crucial, but it was certainly helpful. The second was a less
direct influence. The'exiStence of better science rooms and ncore abundantA
basic -apparatus altered the context in which curriculum development could
*cur, Many curricula which were adopted in th9 late sixties and'early-
seventiftesexplicitly.assumed that schools had good science facilities.
While the. fact that funds were used to assist in the implementation:of'
new curricula was beneficial, it does-raise another issue.. Recognition of
the need to prOvide funds. for curriculum development and implementation had
come too late and provided too little. The ad hoc nse.of funds was welcome
but a more OrMal and co-ordinated allocation of resources would have been
better. The very-fact that the Facilities Program was used in this way was
an indication that insufficient attention had been paid to the total needs of
science education..
;The Influence on Science Teaching in Schools
From the study which waS.made of Year..9 science teaching in schoolS with
varying standards of science facilities it seemed that better facilities were
associated with an enriched learning.environment and more active forms of
science'learning. An enriched learning environment was one in which there
was greater involvement in purposeful activity, better organization and more
stimulation in the variety of methods and materials used. Good quality
rooms weremost strongly associated with. student reports of better
more abundant apparatus was associated` most strongly with students Per-'
ceiving a more stimulating environment.. Being frequently in science rooms,. .
usingroomsef good quality and having sufficient'apparatus were all
associated with a reported greater involvement of students in learning
activities. Student reports of active forms of learning, defined as more
''experithentai work, less textual learning, and greater encouragement to explore
were also associated with better science facilities.

228:
Observations made during visits to schools were consistent:with the
tesults of the statistical analysis or students' views. The standard of
science facilities did influence the Way in which science was taught. Even
though changes-were,not dramatic:they-mere observable. Science teachers
certainly found it more convenient and efficient toteach.actively when they
had good facilities. 'While good facilities were neither a determining nor
major factor shaping the science teaching patterns-in schools, they were 0
component which set limits within wh ice could he exercised. Schools
made different uses of the facilities available t41.them. RooMs and
apparatus were used most effectivly when supported, by Skilled laboratory
assistants, modern curriculum material and'energetic science teachers.
It is necessary to exercise caution when generalizing from ,a cross
sectional study to changes which octurreil over time. Howeverit did appear
that the provision of goodfacilities through the Science Facilities Program
-generally facilitated the development of enriched learning experienc'es in
science and nurtured more active forms of science learning,' The extent to
which such developments occurred-also depended on other factors : good '
.laboratony:staff, good teachers and suitable curricula.
Other Influences
Two other possible influenceS of the Science Facilities. Program-were studied, 0
in 'this Report. One was 'the potential- influence of Facilities on students'
propensity. to enrol in science subjects while the other was the influence of
facilities on the mobility. of science ':teachers.
FacOities available schools did not appear to he a major determinant
of school scienceenrolmentS in Year12. This result is not surprising as
thepropensity of students to enrol Tn science sui?jects is-more be
associated with other factors,-such as-the extent to which.stUdents acquire
the confidence. to study diffichlt sti6jocts. In so far as.such choices can
'be influenced by.SchoolS, it seems - likely that the amount, and quality, of
science teaching which occurs in .the lower secondary school is important:.
Teacher mobility was'not generally affected by the facilities available
in schools though a.few exceptions were noted. For some teachers it appeared
that the standard of science Aieilities was an influence upon their decisioh
to remain at .a particular school. However, because so' many other factors were
also important the association observed was neither general nor strong.

229.:
.In summary the Science Facilities Program appeared to influence some
concomitant 'developments in science education across school systems. Good
science faCilities in schools were found to be associated with an enriched
experience of science leafning for students. In that respect the Australian
.Science Facilities' Program enhanced the quality of science education in
.Australian schools.
The Origins of the Program
The Australian Science/FacilitieskProgram was,not based upon the `findings of
/a;eliert which had identified the needs of science education. Rather,it
arose as a response to a number of political developments. As Smart (1975)
. suggested, it was a response to three groups of demands, made in the context
of long term changes in constitutional interpretation and short term political'
circumstance. Only one of the three groups of demands was concerned with
SpeCial assistance for science teaching. The other two were more general
requests-for the Commonwealth to4become involved in secondary education and
for governments to assist non-government schools.
The 'absence of an initial investigation hindered the Program in several-
ways. The most fundamental was that insufficient analysis had been made of
the nature of. the plea for assistance to science teaching. Only a general
area of concern had been identified. The response of government may have.
been more effective had some prior investigation been conducted. It was
argued in Chapter One that improved facilities were but one aspect of the
needs of science education in the early sixties. 'Certainly it t be
recognized that, because the Program was, the first CommonwealthventUre into
non-tertiary education,7to provide facilities was polistically safer.. Yet,
had the complementary needS of Science-education, which the Australian Science
identified iTeachers Association dentified as involving curriculum development and
teacher training, been formally recognized subsequent developments may have
been better co-ordinated.
Even Within the context of proViding facilities some more detailed
initial plannini would have helped to guide priorities between different areas
of school science. For example, it was noted earlier that there-were two-
strands within the plea for special assistance to science teaching. One"was
uti1itarian and concentrated upon the supply of scientific and technical man-
power, while the other emphasized the role of science in'a modern liberal
eduCation. The extent to which these two strands possessed common elements
2.37

230.
and the degree to which they were opposed Were never explored, Furthermore,
.
the emphasis and priority which ought to be given to each was.not explicitly
examined. By default the early endeavours of the Science Facilities. Program
were largely devoted to providing facilities for PhySics and Chethistry classes
in Year 12:
.A more prosaic, deficiency can be seen in the fact that the Program
began without adequate information about the needs of schools for science
facilities. While:it was agreed that generally science was taught under
parlous conditions, n6ither the relative needs of-each schbol system in each
State, nor the needs of .individual schools were accurately known. Such
information ha'd to be accuMulated as the scheme progressed. There were
differences in the standard of science facilities between school systems in
each State when the Program began. For non-governmept schools thoSe
differences which remained in 1971 were taken into account when the ft mar.
quadrennium of the Program was being planned. The differences between
government school systems were never officially acknowledged..
Nbt only did too little initial planning occur,but the opportunity for
a formative evaluation wasneglected. Several suggestions for formative,
evaluation were made duringthe mid sixties. There was support for some
formative evaluation t m both the Commonwealth Standafrds Committee and from
.officerS in the DepartMen of.Education. It is'regrettable'that the Minister
'did not agree to ma e fu d available for this purpose.at a time when the
resultant information h.,10 have been valuable in guiding the.fipal.stages of
the scheme.
T Administration of the Program
Different administrative arrangements were made for government and non-
government schools. In the case of government schools, funds were provided
for.eachState Education Department who applied them to the secondary schools
in that State. Each State authority was responsible for.administeri'ngthe
scheme.in regard to its government schools, subject to a number of constrain-
ing conditions. For non-government. schools the general administration of
the Program was carried out by.Commonwealth government departments. The
Commonwealth governMent was'advised by two State Advisory Committees from
each State, which advised on priorities for the allocation of funds,and a
Commonwealth. Advisory Committee on Standards for Science Facilities in
Independent Secondary Schools. This latter committee advised the government

on appropriate standards and assisted schools in the development of 'plans.
This administrative structure was a consequence of the constitutional
provision that States were responsible for the provision of education. There-
fore money had to.be provided to schools through State governments. For non-.
goyernment scliOols the State authorities merely transmitted money from the
Commonwealth to schools; the effeCtiVe administrative agency was the . .)
Commonwealth. The- money. allocated for government schools was administered
by State Education Departments. As State governments jealously guarded their
authority in-this area, any attempt by the-Commonwealth to circumvent t4at
authority .4I!)4d have met opliosition. It would have been politically unrealistic
for the Commonwealth to act as on administrative agency for the Program with
respect to government schools.
This bifurcated administrative structure had wider ramifications. Common'
standards were not applied to all schools, detailed information about the
needs of government schools was not available to CommonWealth authorities,
and' the wisdom accumulated during the course of the Progloamwas not readily
shared. Relations between State and Commonwealth authorities with respect
to provision in government schools were not always smooth. At the beginning.
-of- the scheme States were not fully consulted, during the Pro ram'they were
obliged to operate within 'constraints determined by the Commonwealth, and
they had to provide great detail about how money had been tlint;--JEclually
State authorities were unnecessarily reticent about.providilig:*1 'Commonwealth
with information which wOuldbave helped in planning. In brief there was too
little communication between the 'various authorities.
_Government schools suffered as a result of these Fro:Meths. Tin pOrticular,
.the. effect of the lower level of funding to governtenVlchooTs. never made,
obviOuS. The need's of government schools were JAtasessed by. ,;same pro-,
ceddres as those. of non - government schools. , Tie kthoSv.tie14,
Wt,it.:ineverclearly apparent to the Commonwealth, Since Std6 EU* 4rttentS were
not asked to assess, needs according to common gIt'iA,e lb. .s1,A0:d6C&;i06tmkion
was not provided.t
In retrospect some administrative structim. T4ititaize4 .8.ql:Operation
between State' and CommonWealth authorities, and whFih iel ed the..gxcIlang&of
informationbetween 'government and non-government s.).?;-itCM'-i
alleviated some of these problems. Any alternative.. structur0 .WouW)14Ye'.to
have been compatible with constitutional :provi s ions 'Liriille-...eshbl.i.:41ed...atca
of responsibility, Within these limitations, a natiOnh- fiO4-icy-,
2 3 .9
232.
with a wider membership and, broader terms of reference than the Commonwealth
Standards 'Committee, would have been useful. -If such a group had its-members
drawn from State Education Departments, aswell as from non - government, schools
it could have. assisted the Program greatly. That group could. have recommended'
standards, monitored progress; and adVised on policy for all schools. It
could also have been responsible for conducting formative evaluations of the
Program. ExecutiVe bodies could have implemented the rogram in the light of
-.gnidejines suggested by the national adviSory group. It need not have usurped,
the authority of State Education Departments, yet it could have .provided'for
.a more co-ordinated implementation of the Program.
.At the State level two adminiStrative reforms can bt envisaged.. The first.
concerns the involvement of government schools in the planniq of science
accommodation. In non-government schools the involvement of science staff and
the PrinCipal in the planning of' new science facilities was a valuable. exercise.
It meant that those people were obliged to consider the ways that science sub-
jects ware being taught and also their planning of future developments. This
reassessment occurred in the context of the immediate'and practical'task of I
planning a science teaching faCility, and in consultation with an adviser who.
also-visited many other :schools. As a consequence the planning procedure
proved to be a. Valuablein-service education exercise. Many State Education.
Departments now also consult school staff in planning facilities. It is a
development which 'ought 'to he encouraged. The second administrative.reform
at State level concerns the degree to whi.ch co-operation might be-achieved'
between school systems. In each. State there were two State Advisory
:-C6Irimitqwhodetermined priorities for non-goVernment schools. It might
-have'-baen.-p6SsibIe for a single State Advisory Committee to involve represent-
nein-go4rnMenf schools and the Education Department. Recommendations
on pre. ties 061114411eW'have.been made to the State Minister for EdUcation
art the ca,e'f .':.7c;1%-. .
gov:et.#00:*hools and to the Commonwealth fornon-government
schoolS00004'40:WEI -;ilayrngement there would have been -an increased
probabf16tchMi oof information and the potential for some shared
use of k ;"ii-1 rural locations.
,_:.i..)151!,11*.radmiaistrativC arrangements for the Science Facilities
Ptografil'WCIPWif6f.be complete without mentioning the method of allecatilU
finance. Firstly, there.was nojustification in terms cif..the needs of schools
for providing money to non-government schools at double the per.ca ita rate as .
'to government school. Evidence presented in Chapter Four shbwed t at'State
2 .40

233.
governments were not able to tompehsate for the difference. Secondly, the
method of allocating funds between States and systems up to 1971 was inappropriate.
This method divided funds first between government and non-government schools,
on the basis of secondary enrolments; and then between States according to
greiks population. Such a method failed to take account of the differences
between States in the proportion of students in each school system, the
different-Years at which secondary school commenced, the different retentivity
and differences in the age structure of the population.. If ftInds are to be
divided between 'States and systems it shoUld either be according to enrolments
or the first division should be between States followedgoby division between
systems.
A Concluding Comment
The Science Facilities Program had a considerable impact upon the resources
available for teaching science. Within the limitations imposed upon the
Program, it improved the standard of accommodAtion for science teaching in
;-,1-S611601S, and the abundance of basic scientific apparatus. Criticisms of the
Pildgram in this respect are mainly restricted to the observations that it was
too narrowly limited to material facilities, and that less attention was givet1
to meeting the needs of government than non-goVernment sthoOls...
As the costof specialist facilities in school buildings continues to
increase it will be necessary to demonstrate that those facilities havebeen
well used. A recent report to the ComMonwealth,government stated its concern
in a more general context.
The relationship betwebn resource levels and thequality of schooling'as it is experienced bystudents and as.it is manifested'in measurableoutcomes among them is another essential concernof the Commission (Schools Commission, 1975 : 16).
The present study has been concerned with material facilities and science
education. On the basis of the evidence presented it is argued that mhile
the provision of good facilities is unlikely to. dramatically change school
practices, it can f6ster better quality science learning. Such effects may
sit
be subtle but they are not trivial. The place of science in the curri lum,
according to Whitfield (1971), is justified by its providing student with
the experience ofempirical enquiry. Developments in science teaching
assumed that this was best achieved in an enriched learning environment, one
which was well organized, involying and stimulating, with a variety of
2 I

234.
activities in which students participated,in the direct-observation of
scientific phenomena. Good facilities, apparently, assisted these approaches
to teaching science. 4.
A brief conclusion could well be expressed by., paraphrasing a statement
from a repent report to the Commonwealth government.(Schools Commission,,
1975 : .13). Additional resources alone do not make good science teaching
but adequate resources are a helpful condition for improvement. In so far
as it went., the Australian Science Facilities Program assisted the develop-
_ment of science education in Australia. It would have been more effective
had greater attention been given to other meedsy science education.1/4
2.12

References
235.
Ainley, J.G. 'The Australian Science Facilities Program : A Study of Its1976 Impact on Schools'. Bulletin of the Victorian Institute for
Educational Research, 36, 17-39 (June).
Anders, D.J. .'The Necessity for General.Science'. Australian Science1959 Teachers Journal, 5, 1, 63-66.'
Anderson, G.J. and Walberg, 'AssesSing Clnssroom LearningEnvironments',1974. in K. Marjoribanks, (ed). Environments for Learning.' Slough,
Britain National Foundation. for Educational Research.
Angus, M.J., Evans, K.W. and Parkin, B. An Observation. Study of Selected. 1975 Pupil and Teacher Behaviour in Open Plan and Conventional Design
Classrooms. The Australian Open Area Schools Project, TechnicalReport No.4,,,Perth : Education Department of Western Australia.
Anth9ny, B.C.M. The Identification and Measurement of Classroom Environment1967 Process Variables related to Academic Achievement. Unpublished
Dochkral Dissertation, University of Chicago.
IFArkansas State Department of Education. Science Guidelines for the Secondary1966 Schools of Arkansas. Little Rock, Arkansas. ED 023 276.
Australian 4cademy of Science. Scientific and Technological Manpower Supply1957 and nd Demand in Australia. Canberra : AAS.
Australian Science'Education Project (ASEP). Guide to ASEP : Unit 401.1974 Melbourne, Victoria : ASEP.
Australian Science Teachers Association: Australian Science Teachers Journal,1955 1,- 1.
f
Australian Science Teachers Association. Statement of Changes and Develop-1962 ments : The Effect of Our Teaching Upon Our Pupils. Melbourne:ASTA.
Avstralian Science Teachers Association. 'The Needs of Science Education in1964 Australian,Schools'. Australian Science Teachers Journal, 10, 1,
41 -42..
.:
Australian Science Teachers Association. Minutes of Federal Council Meeting;1967 Held by M.J. Rosier (Secr&tary) at ACER.
Australian Science Teachers Association. Summary of Correspondence RegardingUndated an Australian Science Education Foundation. Mimeo, Prepared by
J.P. Keeve's, circa: August 1964.
Baas, A.M. Science Facilities. Educational Facilities Review Series No.11,1973 ERIC. Clewing House on Educational Management, ED 071 144.
Barker, E. 'A New Science .Course in New South Wales'. Australian Science1963' Teachers Journal, 9, 1, 39-48.
Basset, G.W. ,'Towards a National System of Australian Education'.
1965 Australian Science Teachers Journal, 11,. 2, 9-15.

236.
'Bdrndt, K.L. 'The Relation between Business and Industries and Science
1957 Teachers'.. Australian ScienceTeachers Journal, 3, 2, 18-19.
Best., E:
1967
Betjeman, K.lR74
Betjeman, K.
1975
Bourke, J.E.1969
Bourke, J.E.
1974
'The Adiption of BSCS Biology in Australia'. South. Australian.
Science Teachers Association Journal; March', 29-30.
'Science Facilities in Western'Australian Secondary Schools'.
Australian Science'TeachersJournal, 20, 3, 2332.
.Design Brief.for Senior High Schools - Flexible Area'
Secondary Schools'for the 80's. Perth, Western Australia :
Education Department.
'Australian Catholic Schools into the Seventies'. Quarterly
Review. of Australian Education, 3, 2. Hawthorn, Victoria :
Australian Council for Educational Research....
'Roman Catholic Schools'. In D.A. Jecks (ed). Influences in
Australian Education. Perth : Car<11s Pty.Ltd.
'Senior. Secondary Science Courses: Itictoria'.. Australian
Science Teachers Journal, 22, 2, 102-106.
Council for Scientific Policy. Enquiry into the Flow of Candidates
in Science and Technology into Higher Education, (The Dainton
. Report). London : HMSO, Cmnd 3541.
'A Review of the Meanings of, and Arguments for, Integrated.
Science'. Studies in Science Education, 4 (1977), 31-62.
Centre for Studies in Science Education, Leeds.
Butler, J.N. 'A New Statisticature of Tasmanian Science TeaChers'.
1977 -Australian Science Teachers Journal, 23, 1, 43-49.
Brenton, A.M-1976
Btitain,1968
Brown, S.A.1977
California1964
Carter, D.P1965
Cohen, J.1973
State Department of Education. Science Curriculum Development in
the Secondary Schools. Report of the. Statewide Advisory
Committee on Science Instruction in the High'School.
California State Department of Education : Sacramento,
California.
.'The Teaching of Physical Sciences in Girls Schools'.
AustralianScience Teachers Journal, 11, 3, 66-68.
'Eta-Squaied and Partial Eta-Squared in Fixed Factor ANOVA
Designs'. 'Educational and Psychological Measurement, 33,r-107-112.
Coleman, J.S1966
Comber, L.C.19 73
Commonwealth1957
. et al. Equality of Educational Opportunity, Volumes I and II.
Washington, D.C. : U.S. Government Printing Office.
and Keeves, J.P. Science Education in Nineteen Countries. ,
Stockholm and New York : Almqvist and Wiksell and John Wiley
and Sons.
of Australia, Committee on Australian Universities (Chaiimdn :
K.M. Murray). Report. Canberra : Government Printer.
.2 .1 4
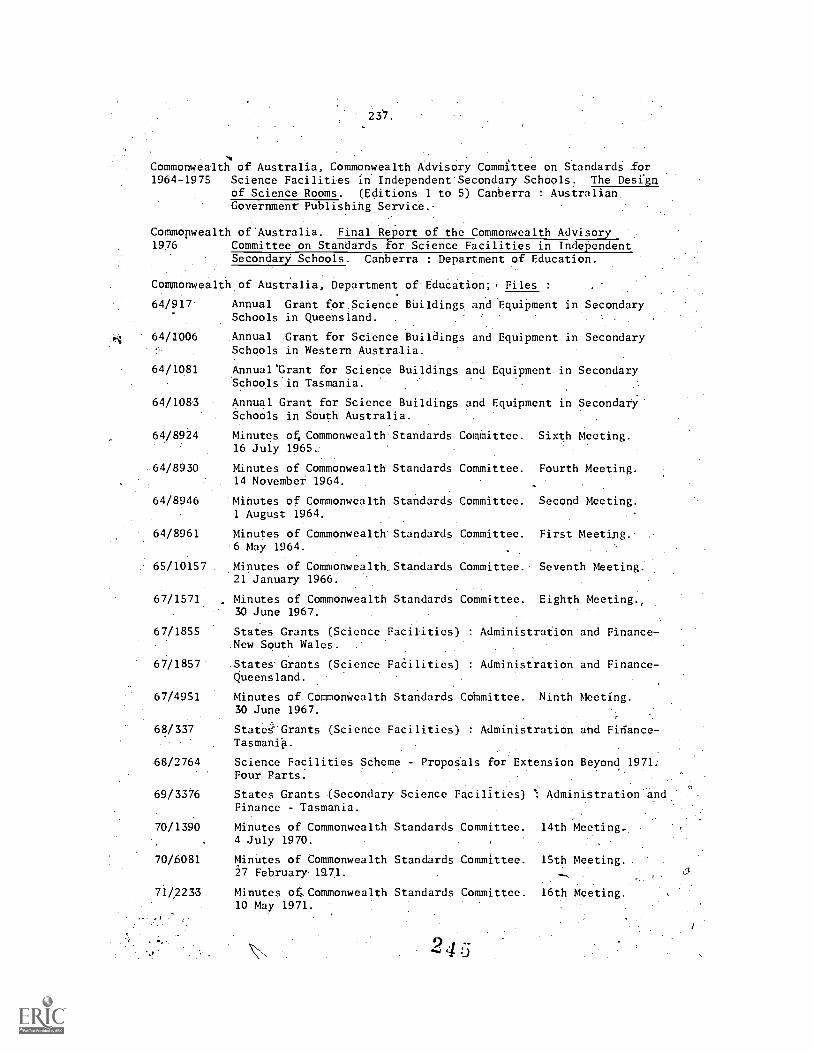
237.
Commonwealth of Australia, Commonwealth Advisory Committee on StandardS for1964-1975 Science Facilities in Independent Secondary Schools. The Design
of Science Rooms. (Editions 1 to 5) Canberra : Australian.Government Publishing Service.-
Commonwealth of'Australia. Final Report of the Commonwealth Advisory1976 Committee on Standards for Science Facilities in Independent
Secondary Schools. Canberra : Department of Education.
Commonwealth of Australia, Department of EduCation;, Files :
64/917. Annual Grant for. Science Buildings. and Equipment in SecondarySchools in Queensland.
64/1006 Annual Grant for Science Buildings and Equipment in SecondarySchools in Western Australia,
64/1081 Annual'Grant for Science Buildings and Equipment in SecondarySchools in Tasmania.
64/1083 Annual Grant for Science Buildings and Equipment in Secondaiy.Schools in South Australia.
64/8924 Minutes ot Commonwealth Standards ComMittee. Sixth Meeting.16 July 1965..
64/8930 Minutes of Commonwealth Standards Committee. Fourth Meeting.14 November 1964.
64/8946 Minutes of Commonwealth Standards Committee. Second Meeting.1 August 1964.
64/8961 Minutes of Commonwealth Standards Committee. First Meeting..6 May 1964.
65/10157 Minutes of Commonwealth_ Standards Committee. Seventh Meeting.21 January 1966.
67/1571 Minutes of Commonwealth Standards Committee. Eighth Meeting.e30 June 1967.
67/1855 States Grants (Science Facilities) : Administration and Finance-.New South Wales.
67/1857' .States Grants (Science FaCilities) : Administration and Finance-Queensland.
67/4951 Minutes of Commonwealth Standards Cofimittee. Ninth Meeting.30 June 1967.
68/337 States' Grants (Science Facilities) : Administration and Fidance-Tasmanfa.
.68/2764 Science Facilities Scheme- Propos.als for Extension Beyond 1971:Four Parts.
69/3376 States Grants (Secondary Science Facilities) Administration andFinance - Tasmania.
70/1390 Minutes of Commonwealth Standards Committee. 14th Meeting..4 July 1970.
70/6081 Minutes of Commonwealth Standards Committee. 15th Meeting.27 February 1971.
71/2233 Minutes ofCommonwealth Standards Committee. 16th Meeting.10 May 1971.

238.
72'/1296 Minutes of Commonwealth Standards Comniittee. 17th Meeting
24 June 1972.,
72/\1547 Science Fatilities Scheme Information Provided for the
Minister 1972-5.
74/1547 Minutes of Commonwealth Standards Committee. 21st Meeting.
July 1974.
. .
COmmOnwealth of Australia Parliamentary Debates : House of Representatives.
26 JUlly 1945 Menzies, R.'G. Vol. pp.4618-
7 May 1964 Menzies, R.G. Vol.44, pp'.1639-1641.
18 May 1965 Menzies, R.G. Vol.46; pp.1587-'1589.
20 May\1965 Calwell, A.A. Vol.46, pp.1732-1736.
27 Marth 1968 Fraser, J.M. Vol.58, ip.514-517 and pp.986-989.
1 MaY,1968 Cairns, J.F. Vol.58, pp.972-975.
-1 May 1968 . Cairns, K. Vol.58,
9 May 1968 Barnard, 1,7'. Vol.58, pp.1261,1266. "3.
29 May 1969 Fraser J.M. Vol.65, pp.2508 -2510.
5 May 1971 fairbairn, D. Vol. 72-, pp.2665 -2667.
5 May 1971 Beazleyi K. Vol.72, pp.281472817.
5 May 1971 Reynolds, L. Vo1.72, 'pp.875-7879
Commonwealth of Australia. ,Parliamentary Papers.
State Grants (Science Laboratories and Technical Training)
Act 1964, Act No.50 of 1964.
States Grants (Science Laboratories) Act 1965,,Act No.40'of 1965','
States Grants (Science Laboratories1Act 1967,.Act No.9of 1967,
States Grants (Science Laboratories) Art 1968, ActNo,12of 1968.
States Grants: (Sci,C.hce Laboratories) Act 1971, Act No:65of 1971.
Cooley, W.W. and Lohnes, P.R. Evaluation Research in Education.: Theory,1976 Principles, and PraCtice.: New York : John Wiley.
Coxhead; P. An Empirical Study of Some Aspects of Secondary School Science1974 involving 11 to 13 Year-old. Pupils. Unpublished Ph.D. Thesis,
Cambri.dgc. University..
Cpxhedd, P. and WhitfitldT,R.C. '.Some Problems of UcasureMent Concerned'
1975'.
,withScience-Ptacticdf Work-for:11. to 13 Y.car.Old.:Pupils':IL. PResearcn in Science Edhcation, 4,'N5-54 -Australian Science
Education Research .Association -.t
-
Practical. .
.
..
.
Cull, R.G. .'Report. Small c Classes'. Report present0'd to the1961 r,;.New Dear for'Schootience. Conference organized by :the New .
South Wales Teachtrs:,Ftderation,..mimeo. :' .

239.
Cull, R.G. 'The New Deal.for School Science Conference'. Australian Science.1964 -Teachers 'Journal, 8, 2, 59-62.
Dale, L.G. 'An Australian InnOvation in Curriculum Construction'.1966 Australian Science Teachers Journal, 12, 3, 43-48.
Dark, H.G.N. and'Squires, A. Survey of SCience Teaching in 9-131975 ,Middle Schools'. School Science Review, 56, 196, 464-4741.
Dawson, 4.R. 'The Impact of--N6W Curricula on Facilities for Biology'.1964 The American Biology Teacher,. (December).
. e
Department of Education and Science' (Britain). Designing -for Science.
19,07 Oxford School Development Project. London : HMSO.15,
-Dettrick, G.W. 1Impressions1if CHEM.STUDY', Australian Science Teachers1966 Journal, 12, 3, 88-94.
Drew, C.J. 'Research on the Psychological Behavioral Effects of the Phksical1971 Envirpnment'. Review of#Educational, Resqdrch, 41, 4477465..:p
Dyer, U.S. :SChool ,Factors and E ual Educational 04ortunity': Harvard .
1968 Educational Reviert, 3S7''1, 38-56.
;
-.Dyer, H.S:: 'Towards Objectil.Criteria of Professional Accountability in1970 the. Schools ofNeW'York City' Phi :Delta Kappan, 52,.4,' 206.7,211.
Engleha , D.F. Spice Requirements'f8r:Science Instruction in Grades 9212.-1966 Harvard University, Graduate School of Education. ED .022 353.
'. .
Englehardt, D.F. Aspects of Spatial Influence on Science Teaching Methods._1968 DoctoralTisseTtation, HarVard ynivexsiq, Graduate. School Of
Educdtion,044-D 024' 214.
Entwistd N.J. 'and buCkworth, D. Choice of Science Courses in Secondary1977 School, Studies in Science Education, 4, 63-82.-.
Fensham, P.J.- 'The Place of Science' in Australian Education'. Search,.1970 1, (1970) , 28-33.
- Field, T.W. 'Science Facilities in IndependentSchools A Decade of1974; Australian Government, Involvemjni'. Australian Science VdCilers
Journal:, 20, 3, 33-59."
'Fish, G) 7.'Secondary School Science Facilities .in New Schools'in Tasmania'.1974 Australian Science teachers -Journal, 20, 3, 41 -45.
Fitzgerald, R.T. The Sec-mid-at)/ School at Sixes and Sevens. 'Hawthorn,
1970 Victoria : Australian Couneilfor Educational -Research.
Fitzgerald, R.T. nrid Mathews, J.K.. 'EduCationalTolicy and Political1975. --)1dtfo'rm-: The Australqn: Labor Gove.rnment'. Australian Education
Review,7, 4. Hawthorifkifictoriii, Australian COuncil forEducation esearith.-:
'240.
V" . 0.4"
a 4 P.
.
."Fitzpatrick,,G.S. andAngus, M.J."' Though Teachers "Eyes : Teaching in a;
1974 ' oOpen Space Primary Schgol. The Australian Open Area Schools
, w Praiect,'TO'chnica4 Report No.l. eiPerfh..: Education Department
.; .
,-of Kettern Ausralia.. ,
4-
.
GaAner, P.L. -Attitudes to.PhygIc'S.Unpul2TishetPh.077Thesis, Monash
- .
1972 1' ,UniVer4ity, CpytOn, Vidtoripa. '.
.
Geizels,.-J.W. and Tholen, H.A4# 'The ClassrgpmFas a' Unique Social System'.
t9§0' :
National Society for the StudPof Education, Yearbook Part II,
'89,'-53- 462 Chicage, : dhiversity of Chicago.Press. .
.
. ., .
:,4kill, PN. 'The FegOal Science Grairt
.
1!;An Episode in -Church and State,
1965 Relation;` 1963719641,-in E.L..Frgnch (ed). Melbourne Studies
.iir.Educatiou,)964. Melbourne, Viteria :.Melbourne University
' Press.. o' -tt
Goodlad,1974
.Gordon,
1957
Gorton,
45 (CDE, File 64/8927).
',J.I. and,Klieni 4pokieg Behind the ClassOom Door.
Worthington, Ohio : Charles A..Joneeublishing Company.
C:E.S.L '.The:Independent-Schools of.Australia.Current' Affairs Bulletin.
(December), University of Sydney.w ".
J.G. Letter to Non-Government-School PriAcipals. January.
w- Gorton, J.G. 'ForewOrd', Comffionvealth of Australia, The Design'of
' .-1966 Science Rooms. op.cit.
Guthrie,,J.J1: 'A Survey of Sehool Effectiveness Studies', in J.W.
1970 (ed). Do Teachers Make'a Difference.. Washington,
-Government Printing Office.
Hall, I.M. 'Victoria :Science Labs in State PostPrimaryo&hools'..
.1974 Australian science Teachers Journal, 20, 3, J05 -106.
Hamilton, D. 'Handling Innovation in the Classroom : Two`Scottish
.1975 s.'ExamplesWin W.A. Rein{' and D.F. 'Walker (eds). Cae Studies
in Curticulum Change. London : Routledge and Kegan Paul.
Heffernan 14.L. et al. 'Matriculation Chemistry ; The New 1966 Course'.%'
1964 Lab Talk,.7 (Junb)1-5.' Science Teachers Association of
GuthrieU.S.
Victoria.
-Holt, H.H. FederalEleCtion; 1966 : Policypeech. Canberra, : Liberal
1966 Party of Australi
,.
Hudspeth., K. 'Changes in High School Design'. Tasmatidan!pqMation Gazette,
1973' .7, 7, 11 -1.3.
Hughes, P.W. ,'Mathematics and.Science in the. School
1963 ,Science Teachers Journal, 9, 2, 45-52.
Industilal Fund for the Advanc&menr of Scientific Education in Schools....
19S7a The-Planning- of Science Laboratories. London : Industrial 060.
.
Curriculum4,, Australian.
Industrial Fund for tht Advancement of Sc'ientifi'c Education
1957b .Apparatus Brochure.' London : Industrial Fund,
94.4 '
in Schools.

241.
.
Institute for Social Research. OSIRIS II MANUAL. Ann Arbor, Michigan :
1971 University of Michigan.
Johnson, P.G. Science Facilities for Secondary Schools. Office of1956 Edudation Misc. No.17. ,Washington : U.S. Government 'Printing
Office.
Keeves, J.P. 'The Case against General Science'. Australian Science.1959 Teachers Journal, 5, 2, 35-41.
Keeves, J.P. Seven Years - Lean or Bountiful. Report of the Survey1966 conducted by the Australian Science Teachers Association in
1961. Mimeo.
Keeves, J.P. The Home, the School, and Educational Achievement. Unpublished1971 Ph.D. Thesis, Australian National'University : Canberra.
Keeves, J.P. Educational Environment and Student Achievement. Stotkholm :
1972 Almqvist and Wiksell.
Keeves, J.P. Curricula Factors Influencing School Learning : Time and.1976 . Opportunity to Learn. IEA (Australia) Repdrt 1976:2. Hawthorn,
Victoria : Australian Council for Edueational Research.
Kelly, .A Scales of School Learning Conditions. IEA Data. Bank:
1975 ,Form.8-751117 (Noveffiber).
Kelly, P.J. 'Evaluation Studies of Nuffield A.Level Biology Trials :
1972 , Part 4.' Journal of Biological" Education, 6, 2, 197-205.
Kelly; P.J. and Monger, G. 'The Evaluation of the Nuffield 0-Level Biology1974a ,Course Materials and their Use - Part. I'. School Science
Review; 55, '192, 470 -482.'
Kelly, P.J.'and Monger, G. 'The Evaluation of the'Nuffield 0-Level Biology1974b Course Materials and their User Part II'. School Sq0ence
Review, 55, 193, 705-715.
Kelly, P.J. and Nitodemus, i'Early Stages in the Diffusion of the1973 Nuffield A Level Biological Science Project'. Journal of
Biological Education, 7, 6, 15-22:.
Kerlinger, F.N. Foundations of Behavioral Research. New York : Holt,
1964.r Rinehart and Winston.
Kerr, J.F. Practical Work in School Science. %Leicester, Britain1964 '. Leicestbr University Press. . .
KovinBr. 'Subject Matter and Teaching Methods'. Australian ScienceJ1956 Teachers Journal, 2, 2, 30-33. ,,-
1
Layard, R., King, J. and Moser, C. The Impact of 'Robins. London1969 Penguin. ::
Lee,Dow, Kwong. Teaching Science in Australian Schools. .Melbburne :
1971 . MelbournoHniversity Press.by l

242.
Lewis, R The Effect of Selected Teacher and Student Behaviour on the
1976 Cognitive and Affective Objectives of PSSC Physics. Unpublished
Ph.D. Thesis, Monash University,-Clayton, Victoria..
Lovegrove, E. Recent Trends in Secondary Schools with Particular Reference
1974 to the South Australian Open-Space High Schools. Adelaide :
ReSearch and Planning,Branch, Education Department of South
Australia.
Lovegrove, E. Secondary' Open 5pace Teachers Study 1975. Adelaide :.
1975 Research Branch, Education Departmentof South Austgalia.
Lucas, K. .'The.Supply of Physics Equipment in High Schools'in Three
1975 Australian States'.. Australian Science Teachers'Journ
. 21, 2:118-120.
MaIing-Keepes, J.M. Educational Evaluation : Key Characteristics.
1978 Hawthorn, Victoria :.Australian Council for Educational Research.
Martin, W E. 'Facilities, Equipment and Instructional Materials for the
1960 Science-Program', inN.B. Henry (ed). Rethinking Science
Education. The Fifty-ninth Yearbook of the National Society
for the Study of Education Part I. Chicago, Illinois.:,
University of Chicago Press.
9.
McKenzie, S: 'Senior Secondary Science CourSes : Queensland'. -Australian
1976 Science Teachers .Journal, 222.2., 97-98.
c'Tederal Election,1963. Policy Specch'of the Prime Minister
1963 (the Right Hon. Sir RobextMenzieS). ddlivered in Melbourne on
November 12, 1963, Canberra : Liberal Party of Australia.
Menzies, R.G. The Measure of the Years. Cassell Australia : Melbourne.
1970
Mcrrilees, D. 'Conference on Science in Schools'. Australian Science
41958 ' Teachers Journal, 4, 3, 52-54:
:Merrilees; D. 'The. Role of the Science. Teacher in'Expanding Scientific
1956 and. Technical Manpower', Australian Science Teachers Journal,
2, 2, 22-24... .
Messel, H. et al. Science.for High School Students. ..Nucldar Research
1964 Foundation, Sydney, University: .of Sydney.
. . .
.
. .
Messel, H. et al: Senior. Science, for High School Students: Nuclear ;,_
:1966 ReSearch Foundation.;Dhiversity of Sydney.
!: .
/
Mississipi State' Department. of Education.. 5cienco# Facilities for Mississipi
1962 .Schools. ,JackSon,Mississipi : Mississipi State -Department of
Education.
.
.
Ar .
.. . g,.
'Morgan, D.G. 'BSCS Biology'.. Lab Talk", 8- (November) '10 -11 Science
1964 Teachers Association of Victoria.

'243.
T -.
Morgan, D.G. (ed). Biological Science : The Web of Life, together with1967 . Students Manual : Laboratory and Field Investigations and
Teachers Guide. Canberra : Academy of Science.
Morgan, RfL.' 'Biological Education in Senior Secondary Schools in.Australia'.1970 Australian Science Teachers JOurnal, 16, 3; 79-84.
Moser, and Kalton, G. Survey Methods in Social Investigation. London1971. I Heinemann.
National Scienee Teachers Association. Conditions for Good Science Teaching1970 in Secondary Schools. RecomMendations of the Commission on
Professional Standards and Practices. of the NSTA. Washington,'D.C. NSTA.
New SoUth Wales, Education Department: 'Science Notes, 8. Sydney,. :
1972a' Education Department. Mimeo.
NewSeiith Wales'', Education Department. Science Notes, 9. Sydney :
1972b. Education Department. Mimeo.
New South Wales-, Education Department. Science Notes, 11: Sydney::.1973 Education Department.
New South Wales, Education Department: Public School Architecture in1975 New South Wales. Sydney : Education Department.
New South Wales, Education Department. Files :
70/4471 Commonwealth Science Grant.
71/25623 CommonWcalth Science Grant.
New South Wales Teachers Federation. New Deal for School'Science,1961a Conference Papers. Mimeo ,
New South Wales Teachers Federation., Letter to Conference Participants.1961b cr MiMco.
New Soulh Wales Teachers Federation. Space Age Problems Can't be Solved by1962 Horse and Buggy Methods., Sydney : New South Wales Teachers
Federation.
Nie, N.H. et al. Statistical Package for the Social Sciences. New York :
1975 McGraw Hill.
Northfield, J.R. Private Communication.1976
Npyak, J.D. 'Facilities for Secondary School Science Teaching : Evolving1972.° . Patterns in Facilities and Programs. Washington, D.C. :
National Science Teachers Association:
4.
Nunally, J.C. Psychometric Theory. New York : McGraw Hill.1967 '
2 0 1

244.
Olsen, F.J. "Practical Requirements of a Scientific World and Our Teaching
1955 Response'.. Australian Science Teachers Journal, 1, 2, 23.
Ontario Department of Education.. Science Laboratories for-Secondary Schools.
1968 Toronto, Canada : School Planning and. Building Research Section,
Ontario Department of Education. ED 085.905.
Oppenheim, A.N. Questionnaire Design. and Attitude Measurement. London,
1966 Britaih': Heinemann.
Ormerod, M.B. and Duckworth, D. _ Pupils Attitudes to Science. Slough,
1975 Britain : National Foundation for Educational Research.
Owen, J.M. The Effects of Schools on Achievement in Science. IEA (Australia)
1975 Report 1975:1, Hawthorn, Victoria : Australian Council for
Educational Research.
Owen, J.M. The. Impact of the Australian Science-Education Project on Schools.
1977 Hawthorn, Victoria : Australian Council for Educational Research.'
. ,Parlett, M. and Hamilton, D. Evaluation as Illumination : A Ney'Approach
1972 to the Study of Innovatory Programs. Occasional Paper'No 9.
Centre for Research in Educational Sciences :'.University of
Edinburgh
Parsons, C.A. .'"3.The7NeW EvaluatiOn,,:.A Cautionary Note'. Journal of 'r
1976 CUrriculUmStudieS, 8,;,2% 1286 -138.
Peaker, G.F. An EmpiricapSfudy o.f Educatdh n'Twenty One Countries :
1975 A Technical Report:". 6tpckholm and'New York : Almqvist and.
Wiksell and John
Pfitzner, E.N. '.Qualities of High IeVel Students Recognition arid
195& Encouragement'. Australian Science Teachers. Journal, 2, .2, 24.
Prosser, B. and Woolley, T. 'Open Plan Science in South Australia'.
1974 Australian Science Teachers Journal, 20, 3, 57-64.
Purves, A.C. and Levine, D.V. Educational Policy and International
1975 Assessment. Berkley, California : McCutchan Publishing.Corp:
Ramsey, G.A. 'Curriculum Development in Secondary School Science. Part l'.'
1972a .
Quarterly. Review of Australian Education, 5, I. Hawthorn,
Victoria : Australian Council for Educational Research.
Ramsey, G.A. 'Curriculum Development in Secondary School Science. Part
1972b Quarterly Review of Australian Education, 5, 2. Hawthorn, :
Victoria :Australian Council for Educational Research.
Ramsey, G.A. Some Reflections.on the Australian Science Education Project.
"1974 Transcripts of a talk given at the Regional Centre for Science
and Mathematjcs, Penang, Malaysia : Mimeo..
Ramsey, G:A. and Howe, R.W. Analysis' of Researdh on Instructional
1969 Procedures in Secondary School Science'. The Science Teacher, ".
36, 3, 62-70, and 36, 4, 721-81.

245.
Randhawa, B.S. and Fu, 'The Assessment and Effect- of.Some, CjassropmH:1973 Environment Variables'. Review of Educational Ree'ail)4'
3, 303-321.*
Richards, A.H. 'Assistance by Business and Industry to ASTA':: Wuttraliall?1957 Science Teachers Journal, 3, 2.
Richardson, H. 'Shortage of Trained Scientists in Australia :
1957 Science Teachers. Journal, 1, 2.
Robertson, W.W. A Critical Survey of Laboratory Work in. Scibie-ein.,.NS1962 Secondary Schools. Unpublished Master of Educatikm..Thesis;',.
University of Sydney.. 12/i,
Robins, G 'Science Facilities in Queensland State Secerfdary,Schticas-197.4 Australian Science Teachers 'Journal, 20, 3,
.. .....,.
Rosenshine,. B. Teaching. Behaviors and Student AchieveMOlit*S14gh.'1971 Britain : National .Foundation for EducatioWilResrea.101
Rosier, M.J. 'A Statistical Picture of Australian S6:eac3p:',TeptS)1973a Australian, Science Teachers Journal, 19, 4i7.,j1C.9:5, .:, r::::
. .
.: :,,',..::,....4.:;';','-'::/':'"...
Rosier, M.J.. Variation Between Australian states iniSein'c'e% Achi yemeritti. :.1973b IEA (Australia) Report 1973 :5. -flawthor,.:YftfOla-::.-'.. , ...
Australian Council for Educational Resear4-'". - .--: .-;.::!,.../... ^.' -...
. , .., . . .
Rosier, M.J. and Williams, W.H. The Mobility' of TeaCheSiof:Seiene- ii)1973- Australia 1970-1972., LEA (Auvradia) Repbr:t...1.97; 11.1a!A/thdtii,
Victoria : AUs tra 1 i at . edunci 1 'for; Educat:i6a11:ReSiar -.'
.....-
Ross, K .N . Searching for .Uncertainty1975 sampling errors in educational` survey
Paper No,9. Hawthorn, Vidtotria : Ausrra100X146ntlorEducational . Re-Searcir. .
v
ROwlands, 'Are Girls ',a.Disadvant.dged,
1976 - of Education;20, 1,, 21-37,
Ryans, p.G. CharacteristieS;.of:Teathers:...1960 Council on EclucatRin..,
4
Group4"
Savage, Sir-Graham.: planning of5chool -?Ats:tralian1958 Science Tea'clier, Journal, 4,`.2;
Schlessinger,' RR_ S6i&ice..FaLlifie- for Our:SCOol1963 Nntkonal Science .Teacher Assotiat,Von
.".
Schonnel, 'ScienEe Teaching-..and1956 Teachers Joarnal,:1,..2.-:
Schools Commissidni RePort for--the :Ttilenni41.076-J8::1975 Australian 'Government. PublishXng

246:
Schwab, J.J. 'The Teaching.Of Science as Enquiry', in J.J. Schwab and
1962 P.R. Brandwein (.ods). The Teaching of Science. Harvard,USA.
Shaycoft, M.F. The High School Years : Growth in Cogfiitive Skills.
1967. Pittsburgh, Pennsylvania :University of Pittsburgh, Project
TALENT Office.
.Sheldrake, P. and Berry, S. Looking at Innovation. Slough, Britain :
1975 National Foundation for Educational Research.
Shoperd, S.R. 'An Outline of Science Courses at Junior Secondary Level in
-1970 'thoAustralian.States'. Australian Science Teachers Journal,
16, 1, 83.
.Smart, D. The Industrial Fund for the Advancement of Scientific Education
1972 in Schools ; Precursor to the Menzies Government's SecondarySchools Science Laboratories Scheme. Paper given at the
Australian Association for Research in Education Conference,
Canberra. Mimeo.
Smart,1.974
'Origins,of'the' Secondary "Schools Libraries Scheme', in
Jeck (ed). Influences in Australian Education. Perth ;
.Carrolls Pty.Ltd.'
Smart, D.. Federal Aid to Australipn..Scbools :.Origins .and Aspects of the
1975 Implementation of the'/CoMMOnWeP.10:Science Laboratories and
Libraries Schemes. UnpdblihecPPRA. Thesis, AustralianNational University, Canberra.
-Smart, D. 'Federal Government Involvement in Australian Education 1964-197.
1976 .Journal of Educational Administration, 14, 2, 236-251. .
Smithl:R.A. 'The School _Laboratory - Its Function and Design'. South
196.7 .
.Australian'Science:.Teachers Association Journal-(May).
. _TriVate.Communication.:.: Smith,. RA.
197S.
Spaull; A.D. 'Educational-Policies of Australian ,Political Parties', in
1974 D.A. Jecks (ed). Influences in Australian'Education. Perth :
.Carrolls Pty.Ltd.
Sonquist,J.A. and Morgan, J.N. The Detection of Interaction Effects.
1.964 Monograph No.35, Survey Research Centre, Institute for Social
Research, University of Michigan:
oStake, R.E. 'The Countenance of Educational Evaluation'. Teachers College
1967 Record, 68. .-523-540: .
. .
Stanhope,'R.W.., 'Physical Science and -BiOlogy should TOO-lace other'Junior
r959' Secondary School Sci'enccs'. Australian. Science Teachers Journal,
5, 1, 47.
Stanhope, R.W. ''Science Courses.in. Australian Schools'.. Australian Science
1961 Teachers Journal 7, 3, 23:
5. I

247.
Stanhope; R.W. 'Report of Proceedings of the ANZAAS Council'. Australian1964 Science Teachers Journal, 10, 1, 43.
Stanhope, R.W. 'Developments.in Senior School. Science Curricula in Australia'.1967 , Australian Science Teachers Journal13, 1, 5.
Steele, J., House, E. and Kerins, T. 'An Intrument forAssessing Instructional1971 Climate through Low-Inference Student Judgements'. American
Educational Research Journal, 7, 447-466.
Stenhouse, L. An Introduction to Curriculum Research and Development.1975 London : Heinemann.
Stranks, D.R. 'Drifts from theScences'. Insertedin the South Australian1969 Science Teachers'-.Association Journalecember).
South Australia, Education Department. Secondary Science Curriculum Committee.1976 1576- Annual Report. Adelaide, South Australia : Government Printer.
.
.41'
Tannockf, P. !The Development of"the Federal Government's Rqle in Australia.1976 Education', in G.S. Harman and C. Selby Smith (eds). ReadingaAn
tlit'EcOnomics and Politics of Australian Education. Rushoutters,Bay, N South Wales : ?ergamOn.
Tasmania, Education Department. High School Buildings : Handbook of.General197$a Educational Specifications of Accommodation. Hobart, Tasmania :
Education Department.
Tasmania, Education. Department. Secondary. College Buildings Handbook of1975b General Educational.Specifications of Accommodation. Hobart,.
Tasmania : Education Department...
EdUCation Department. FiTE-85-47,. 'Commonwealth Secondary ScienceScheme'.
Taylor, P.H, Christie, T. and Platts, C.V. Factors Related to the Choice-1973 of Science amOn'g'Able Fourth Year Secondary School Pupils.
University ofBirmingham (Report available from the NationalLending Library for Science and Technologyl.tston Spa,. Yorkshire
_Tho Tour.AssoCiations.:., 'The Provision'andMaintegance of Laboratories in1960 Grammar SChools'. School Science'Review 41, 145.
G.
Tisher, R.P :Research in Science Education and the AUstralian Science1965 Education Foundation'. Australian Science Teachers Journal,
11. 1. 19.
Tomlinson, D. The Liberal Party in CommOnwealth. Initiatives for Education,1976 1949 to 1972. Unpublished M.Ed. Thesis, University of Western
Australia, Perth. .
Tukey, J.W. Rosettes as Carriers of Regression. An unpublished paper fromUndated Princeton University and Bell Telephone Laboratories.
Turn6r, J. 'The Planning of Science AccommOdation in High SchOOls'..1974 Australian Science Teachers Journal, 20,.3, 9-22:

248.
Victoria, Education Department. Board of Inspectors of Secondary Schools.
1966 Science Newsletter, 3. (A66/147).
Victoria, Education Department..Board of Inspetors of Secondary Schools.-
1967 Science Newsletter. .(September) '(A67/1248).
Victoria, Education Department. Board of Inspectors of Secondary Schools.
1969 Science'Newsletter, 3. (May) (A69/1015).
Victoria, Education Department.Board of Inspectors of Secondary Schools..
1972 'Science Newsletter, 9 (May).
Victorian Universities. andSchoolsExaminationsBoard (VUSEB). Papers
1963 relating to the School; Science Conference, October.
Victorian Universities and Schools Examinations Board (VUSEB). Handbook of
1966-1971 Prescriptions and Directions. Victoria : Government Printer.
Victorian Universities and Schools Examinations Board (VUSEB). Supplement
1975. 'to Circular to Schools No.72. (August). Melbourne : Victorian
Universities and Schools Examinations Board.
Waddy,. .'Senior Secondary. Science Courses : Western Australia'.
1976 .
Australian Science Teachers Journal, 22, 2, 99-102..
Wa1beig, H.J. 'Social Environment as.a Mediator in Classroom Learning"7:
1969 Journal of EducationalPsychology, 60, 6, 4.43-448.
Walberg, H.e?and Anderson, G.J. 'Classroom Climate and.Individuailearning'.
1968 ,Journal of Educational Psychology, 59, 6, 414-419.
Western Australia, Education Department. Science Report. Perth : Education
1969 Department.' Mimeo.'
Western Australia, Education Department. Science Report. Perth : Education'
1970 Department. Mimeo.
Western Australia, EduCation Department. Science. Perth Education
1972 Department.
Western Australia, Education Department. Science Report. Perth : Education
1974 Depirtment. Mimeo.'
Western'Australia,'Education Department.Survey of Upper Secondary Science
1975 EdUcationin Western Australia. Perth, Western Australia :
Education' Department.
Western Australia, Education Department.:Fiies :
1277/65 Commonwealth Grant for Secondary Science Equipment.
1968/73 Science Equipment.
White, R.T. 'From the Two Cultures to Money : Trends in Enrolment in HSC
19.73 'Subjects in Victoria'. Science Education Research 1973.
-Brisbane, Queensland ; Australian Science Education Research
Association.-
.
9ONI ; .41

249.
Whitfield, R.C. Disciplines of the Curriculum. London McGraw Hill.
1971. 7r(
Wilon, A.F. The Effectsof Schools in Victoria on the Science Achievement-,
1975 of Junior Secondary Students.. IEA (Australia) Report 1975:2.
Hawthorn, Victoria : Australian Council for Educational ResearChw .
.
Yaxley, M.- Case for an Australian Science Education Foundation'.
1964 Australian. Science Teachers. Journal, 10,. 2, 47.
257
IfQ

APPENDIX A
A SUMMARY OF QUESTIONS ABOUT THE,AUSTRALIAN
SCIENCE FACILITIES:PROGRAM
A. School Effects
LeVel 1 The Provision of Facilities-
1,1 To what extent were "the needs of schools, in each system,
for science rooms satisfied at the conclusion of the
Science Facilities Program?
1.2 TO what extent did schools in each system gain additional
accommodation as a result of the rebuilding program since
1963?
1.3 Which classes within schools had greatest access to the
new rooms?
1.4 Were,rooms provided under. the Science Facilities Program;.
considered to be more suitable for teaching 'science than
the'Iolder rooms?
1-5 What proportion of schools were adequately supplied with
apparatus for science teaching at the conclusion of
Science Facilities Program?
1.6 Did schools have laboratory staff to assist in fully
using 'facilities which were available?
1.7 Which aspects of facilities were seen as impeding the
conduct Of practical work,in schools?
Level 2 Facilities and Teaching
2":14-Were differences in the extent and siandardof facilities
'in schools associated with differences in the way science
was taught.
2.2 Didpatterns in the organization'and 'harming of science.
in schools alter as result of improved facilities?
2.3 Did schools with extensive and good facilities retain
science teachers for longer than other schools?'
2.4 Were the attitudes of science teachers toward practical
work related. to :differences infacilities available.to
them?
251.
9

(Contd)
Level 3 Facilities and Outcomes of Science'1eaChing,
:" 3..1 Are good facilitiesassociated with high:achievement
i*al?etter understanding of science%
Do'schools provided with good faCilities.have more of
. their,year,12 studentsenr011ed in science studies?
..
3.32. in.SChOols with good facilities for teaching science
did *tudentSexpreSS'...a.greaterinierest'in science
.enddi4gprent34ttitudeto sciencethan those in
7'schoOIS:,Withpoor,faCilities?,:
System Effects
4.1 :What developments in thedesign of science faCilities
occurred during the course of the Science FacilitieS
Program ?.
,2 Wasthe,:eMploymentof labotatory,assiStants
.bythe proviSion of improved facilities?
4.
stimulated
4,3 llere.fundS from'the'Science,Facilities'Programused to
assist:theAeVelOpMent orimpleMeniationof new cuiricnia?
.
4..4 Have systeMs.of,..supillyIng-soVernment schools with
apparatus altered 'AUring,thercourse oftheScience
FaCilities PrograMTO Wh4t:_eitentwere these
.changeS helped by theadditiOne.1 funds which became
available?

APPENDIX
THE SCHOOL 0*IpNNAIRE.;s
'AS

tit
J.
.
= AUSTRALIAN COUNCIL FOR-
EOUCATIONAL' 'RESEARcH .
SCIENCE - FACILITIES. I
AUSTRALIAN = SCHOOLS
-SCHOOL QUESTIONNAIRE.'
'(To be COmpleted by the TEACHER IN CHARGE OF SCIENCE)
7
lnformatiOn, given in response to this que4tionnaire is Confidential to ACER
and will be used only in making statistical calculations Orjor deriving
..general Statements.No ind school voll be idenO'ifiAfin'reportS.
of this study.'
Copyright ()..ACER
Rublished.by the .
Ausiralian'CounCil for Educational Rearch
Frederick Street. Hawthorn, Victoria, 5122.

ZED
q
.
NOTES FOR 'GUIDANCE,;,.
4'DANCE IN COMPLETING THIS UESTIONNA1
1.'. - Different designavfonsofgrade.d"year Are's' of sectOear school. used
in the4TrioUs States\and Terrieork4of AUsttaila.,
his na onalqu'estionnaire
it is necessary touse year
descriplonsllteugheIt. 'The cqu' alcnt Stamp or :4-
Tvitory designationUse is' shown in
wing table.
. , . .
Name used 14 ,w4'
e ltk
this study A.C.T. N.S.W. ,VIC. JAS. : . (M.D.
.w
WA.4
Year 7 -
Year 8
Year. 9 '
Year 10
Year 11 ,.'
Year 12 x.,.
Form) 4
Fotm 2:
Form 3
Form:4
Form/Form 6
;1.''
'Form i
Form 2
Form 3
Form 4
Form'5
Form 6
Form 1
Form 2'A
Form 3 ,
Form 4
41,rm 5
'Form 6
Witrstyr
Socond yr.
Third yr.
Fourth,
Fifth,yt
Six44,yr4
. -
GraehL8*i
'Grade 9
Grade10
Gradell
Grade 12
first yr
8eird yr
Third yr .Third
Fourth*yr
Fifth yr
11A
First yr
Second yr
.yr
Fourth sy r
Fifth yr.
;
2. Where reference. is'made to 'studAing a seiencest
depjeer' It incrusthe study :
of gcienee (multTstrar4,combinelf&;general), any one or, more
cri'Uy?Ics, ehemistrI,
Biology, frumml.Biol4y,oAcologY,,,,Agricultural%r Rural Science, Environmental
Science, orsea.el;ep taken as pat ofZnerh'Stdaiesprograne
It does not incIndet.
Domer stoof:,Scidnce o'Geography
. OE 1 41-
In 'answering somesections of the
leS"'"ftalnaire you may need tt.copsult
(i) enrOlment details, . ..40
(ii) the scho31 timetakle: . °
In'recording enrolmentdetailsffruse,ligUres as `1
August 1975 if they are
convenicAly available.
$
5 Space is available atthe end of many
questie to enableevu to commentif
u Space is also:availablcatthe end of the quOStionfiA-e'for,any
antralo,,
comments you willito make.
:s.
iC)5.Please return this
questionnaire to
Mr J. Ainley
Science Ilicilitces Frtject
Australian-oun41 for Educational Reseoch
PO Box. 210
HAWTHORN, VICTORIA, 3122.
.176;k4 . 4P'
G .
4.t
;71

yA
V.
257.
SECTION 1
;
1. Ni;e of the school A,
2. #, Name of person completing questionnaire:.
GENERAL INFORMATIONti
Was the school established since 1964? Yes /No-
4. Does'your school have a nearly uniform length teaching period
,`4' throughput the week? 'Yes/No
If YES
What it.the length of a teaching period (in minutes)?
tt,
How many such period make.up the teaching week?
(i.e. How many: such periods.cqMpriSe the timetable for the
week's activities?) .
If NO briefly. describe the'pattern of teaching periods which
operates throughout the week.
a.
a,
t
Office use only
1:1-4
1:5(
1:6
1:7
1:8
1:9
1:10
1:11
1:12
1:13
1:14
1:15,16
1:17,18
tV
. '
S
263.

El
SECTION 11
. '
2 5 8
FACILITIES FOR TEACHING SCIENCE
A SCIENCg ROOMS AND ACCOMMODATION
Items.7 td 11 refer to the roopsoquipped for. and principally used for science.
teaching. Other types or room are mentioned, in subsequent items. Include
temporary (portable) as well as permanent rooms only if they are equipped for
science teaching. .
0
In some of these items space has been allowed for a'1arge number of science rooms.
'Most schools will not need to use all of these spaces.
Please enter your answers to items 7 to 9 inclusive in the table provided below.
The space for room identification has been prdvided for your convenience only.
When was this room built or converted from an existing classroom?
Kcy: A. After 1970.
B. From 1964 to1970 inclusive.
C. Before 1964.
What was the source of finance for the building /refitting of.this room?
. Key: A. Built under the Commonwealth Science Sclicthe%
Refitted under the Commonwealth' Science Scheme.
Existed or built independently of the Commonwealth
Science Scheme.
D. Built since 1964 but source of finance is uncertain.
(This may apply to new go'vernmcnt schools):. .
9.4. Please indicate whether in each of these. rooms there is ,provision for:
Key: A. Pupil experimental (laboratory) work.
g. Teacher demonstrations only.
ROOM
Room Identity
Qn. 7 (Datej
Qn. 8 (Financ4
Qn. 9 (Purpose)
4 5
AP'
'8 10
1
Office use only
1:19,20
1:21
1:22
1:23
1:24"
1:25
1:26
1:27
1:28.
'35

10, For each of the following features of each room indicate by placing the appropriatefetterin the grid, whether it is:
A. Adequate. B. Barely adequate. C. Inadequate. . D. Non-existent.
1,
Note: 'Adequate' refers both to the quality and quantityof the services and where appropriate, to its accessibility for
student use Space'for comment is ava +'1& 1e on page 16.
ROOM
Area of the room
Provision of water taps and sinks
Provision of gas outlets
Provision oflower points
Provisid of fume cupboards
Provision of display boards
Storage space in loom
Adjoining-preparation and storage area
ti05eating accommodation'.
Working' space for pupils laboratory work
Y
Writing space for pupils
Demonstration bench
'Hot and cold, washing up facilities
ProjectiOn.facilities
1 2 3 4 .5 6..rtnmumol=0'in 11
9(if;,h.
0
1.0 -.17
A NCO to rd VD
A A LA 14 1.4
U 0 .4 A
0
M
0
0

260.
. . .
How many periods per week is each room used for the following types,of classes ?'
1 2 3 4 S 6 7 8 '9 15 11
Room Identity
Chemistry(Year 11 & 12)
Phys.ics
(Year 11 & 12)
Biology(Year 11 & 12)
Other science(Year 11 & 12)
Other scicncc(Year 7 to 10)
Non-scienceclasses
12, How many rooms other than those mentioned. in Items 7 to 11 are used
for science classes?
13. How many science periods are taken in rooms not equipped for science. .
teaching non - science rooms)?
6(a) In years 7; 8, 9, and 101
(b) In years 11 and 12.
B. SCIENCE APPARATUS
Items 14 to 19 refer to the soienceequipment availableai.your schp01,....
For items ix 'to 16, indicate yotir response by using tlie following key:..
,cs, bui,:min,.,rdeficiencies at certain :
No generally deficient in c items at some times. .
. . -No;-gencral deficiencies, in ny items occurlrequentIc
No. deficiencies occurM-eir heti
°
1:5-55 .
1:5678'
1:59.60
..

14. Has your school a. sufficient supply of "expendable" equipment(e.g. test tubes, beakers,' stock scagUnts)? ",
Optional Comment:. -
kias ybur 'school *a :sufficient _Supply, of minor science apparatus,
burlier: burne-rs, stands.; magnets)? .
Optional "Comment:
1:69"
schdO.1. a 'siiffiCient supPlic,of'essentialltidjor items of
: ,,eguipment A4;g,: bdiances, electrical .:rotCrS,; microscopes)? ,
17.
"..,'F.aCh of the following statemZrits;,r,,epresc!rtt4,:r peroSibA:.,s urce of;
di Efitity in arrangingstudentAeritocnta146rk, .;Place ?' ticktt the...,
aptrrop a di o'.'uOliiron to i ti c ate I he'ree i wh i ci"; each A.a.s 1?eni,
- ' ." ' 6.1 i i)--- ,.:, .' '....:",.. ',...,. r-1,1S?Urce of, diffiutkity yocho in, 1 k,c.r.,. - - ...4 4., -d-
,* .' '''.''''''' -;!", :. -1/4 l'')L'.';:..1 1 -;, ....k...'''r si,:iso., I c....
suprtfiof --t.sii,s'iCtepir tri,t us .
inaniridpnia.tb.labotatbiy-: fici4itie&
P.O:do much pitpa,rat
(d) .Tbo few,nsilsiants
. .
(o) IiifficI to StOrc;..,
Optional Comment. : ..
;;,
Not a'pr4afi
i.` -'.
Rarely ,afirioblcm
2 7.7
Sometimesd 'pisoblerts
3'.'
.A significant.problem,. .
...,,
:'; ' 1 '',ero '4i , s;',:y ; ,
: .- ck .;-,
, ..
f;
,-. `
,,--
.' . -, o *
P:72
1:7'.."g
,74:761:74 ,

262.,
18, Vor each of the following items of eqLiipment indicate:
'CO the approximate number possessed by the school.
(ii) the frequency of use of the item (if any are possessed),
Astronothical telescope
Chemical semi-micro analysis kits
Power operated vacuum pump
Cathode-Ray oscilloscope'
Linear air track apparatus
Substitution or top loading balances
Anatomical models and skeletons
Aquarium tanks with aerator and heater)
Micro projector
NUMBER USE
(tick the appropriate column)
Never RarelyOccasioally n Often
'44
19. ASEP Module Packs contain' 10.student hooks, 10 record hooks, and in some. cases,
other assorted items.
(4 How:Many ASEP. Module packs were purchased by the school'
up id 31' December 1974
(b) How many ASEP Module packs'were.purchased in-the period
1 January 1975 to 1 October 197S?
(c) How many-, Moduli packs do you estimatee will be, '
purchase betweenclbber 1975 and 1 l'ebruar'y 1976?'
O'
Office ust only
1:76-80
2:1-S
2:6,7
11:10:11
2:12;15
2:14,15
2:16,17-
2:28,19
2:20,21
2:22,23
;:24,25
2 :26,27,
2:28,29

a
SECTION III
(i) Years 7 to 10.
263..
SCIENCE TEACHING PROGRAM
20. How many separate groups (classes) are taken for science subjects each of
the following grade levels?
y.
(a) Year 7
(b) Year 8
(c) Year"b:
(d) Year 110
21. Tick the appropriate. column to indicate 'the way students are allocated to
classes in Science (or in separate science subjects) at the following year levels.
,
Year 7
Year 8
Year 9
Year 10
All classes are .
structured so that theycontain students witha wide range ofabilities.
Some classes containstudents with a widerange ofabilitiesothefclasses contain-studentsof more similar abilitieS.
Classes are structuredso that students of .
similar abilities arcgrouped together in .
any one class.
22. .For. each separate class group at the Year levels 7 to 10, how many Sciccrice
periods are taken each week? .
Note: (1) Iffyour'school does not plan its timetable'on a standard length teaching
period enter the replies as the amount of time each-week spent in science classes.'
(in 'minutes to the nearest 10 minutes).
(2) Include -any extra Cli:isses.of .science based elective studies held in .addition..
to the normal science prOh5M'.
'CLASS GROUP
Yeai 7
Year 8
Ytar 9
Year' 10 °
4 9
in5.
t
Office use only
2:30,31
2:32,33
2_:34,35-
2:38,37
2:38
2:39.
2:40
2:41
2:42,43
.2:44%4S
2:46,47
2:48,49
2:50,51
2:54455
f56,57

4
23. For this item refer to iTAR 9 sciencetcachingenly. Base yOur otimate.on
average forthe clali :iroups in Year :9 over
the last full teaching week. State
your estimate as a percentage of the totalscience teaching time for that. 'week.
(h) What percentdge of the science. teaching time involvedr..
teacher demonstratiOn?
(I:).-What percentageaf.tlie science teaching time :involved ,
experimental work Performed by'students.1
.Optional Comment:
When students in years 7 to 10 do experiments inthe'science laboratory in
what size grotips do they normally,wOrk?,.(Please-fickthe apprOkitc box)...
(a) ividually
(6) In pairs
(c) In groups of three
(d) La groups u: four or more
Optional Comment:
(ii) sica.rd 12.
.'In the tables on thefollowing pages specify for
eaCheien03%.suhj-cet taken at
-Grade 11 and 12 the number ofseparate class groups, and, the',ierage nUmber.of
pCribds taken by those Oass groups,ean week.
Notes: 1: Separate. tables. have. bi,enprovided for N.S.W, schools..
2: For licsiern Australcau schools record infOrmation:fOr"Web:of Life
Biology in (d) and for "Ullman 4iiolOgy" in .(h) in each case.
3.' For Queensland 'enter"Zoology" and "Biological ScienCe" information
in (h) in 'each case.
-10-
Office use on1K
2:58.59
2:60,61
62
Ee

26.1 Year 11.
(a) Science
(b) Physic .
(c) Chemistry.
(d) Biology2
Av. number ofperiods/week
(e). Geology /Earth SC,ience.
(f) Agriculturll /Rural Science
(0 Environmental Science
:(h) l'Other, siecify:
For NeU'SoUili.Nales Schools ONLY (Year 11)
(a) ,Multistranck Science (4 Unit)Enter only those classes7Whichare taken separately fromspecialist 2 unitcourSes.
(b) Physics (2 unit)
(c) Chemistry (2 unit)'
(d) Biology,(2 unit)
te) GeolOgy (2 unit)
(f) Agriculture (All size units)
(g) Engineering Sciencm(All sizeunits)
(h) ltuft1strand Science (2 Unit A)
sf,
Number ofcla_ss "groUps
Av. number ofperiods/week
o
Office use only
2:63,64
2:65,66
2:67,68
2:69,70
2:71,72
2:73,74
2:75,76
2:77,78
2:78-80

26.2 Year 12.
.
'(a) Science
(b) Physics
"V7S6
(c) Chemistry
(d) Biology 2,
(e) Geology/Earth Sciente .
(1) Agricultural/Rural* cience
(g) Environmental Science
(h) Other, 'specify:'.
266.
Number ofclqss groups
Av. number ofperiods/week
For New. South Wales Schools Only (Year 12)
Science'
(a)
(b)
(c)
(d)
SECTION IV .
'' Levet. _
.. s
Number of.class .groups
Av. number...of
periods/week
2F....
a
SCELNCE. STAFF
.
27. :(a) How many members of the. school's teaching staff ate.
teachers of- .science' (Note: A teacher of science is a person
who is taught a science subject on :I.:regular basis throughout
(b) How many teacher's arc there on the school .staff?
19'75)'
- -How many full-time equivAlent.non-tenchinga$Sisiants
q...slaboratry assistants) .irethere qnthe science -St-aff'.:
Off;,..c use only
3:1-5
3:8,9
3:10%11
3:12,13
3:44,15
3:16,17.
3:18,19
3:20,21
.3:24,25
5:26,27.
i:28,29.
3:36,3/
3:32,33,34
3:35

267.
. .^
Office uSebiili
For each teacher of_science please .supply the followlng..detai is by
Cntering the response in the grid provided.
.(a).§ex: M. Male. F. Female.
'(b) TThing Experience. to the:nearest year: (number of years)
00 Length of .teaching at the present .schob'l :.,(number of year's)
(d) Teacher training. A. 'Teacher training qualification.'
7 B.. No teachei.trzlining/
(e) Science qualifications
g
Post=graduate degree in science or in a.science related field,
B, Bachelor degree in science or in a :.cience related .field.
(including concurrent Science-Educa on degrees).
C. Other 'Compl eted 'tertiary science qualification,
7 - .
Incomplete tertiary. qualification in science orno post-secondary.
qua li fication;
TEACHER
. (a) Sex
3:38,39,40
.3:44,45
5:46,47
(b),Teachingexperience
(c) Years at pre-sent school
(d) Teachertraining
(el' Science" qualification
.
TEACHER (contd)
(a) Sex.
(b) Teachingekperience
(d.Years at pre-sent school
(d) Teacher;raining
r.
(6) Science.'qualification
4 5 7 10
5:50,51

Office use only
11,eige indiGate enrolments a'at'lAugust1975'if ti4is.inf#mation is coAveniently
,available. If precise informationishard to obtain:please give an apprOximate
How many :students are. enrolledin,each'of. the Year levels ,listed below?
0
Year..7
(b). year 8
(c) Year 9
(c1). 'Year, 10
cc) Year 11:
,(f) Year 12.
.How taany GIRLS are enrolled inelch of thefpllowing Year levels?
(4) Y4r 97
(b) Year 12
,
32:. 'How many students in caci)'Of thy yeaTOW-k.4liited below study a. science
siiiaject?If all stclent.s. at any'YCar level study
sci'snce subject write ALL:
Aa) Year 7,
Year 8
(c) Year
(d) Year
() Year 11
(f)' Year 12
t1RLS in!och of the follywing Yiar levels study a sd'icnce subjecLi.
(a) year 9.
.3:52154:r.
o 3:88-57
3:58-60
3161-63
3:64-66
3:)70.-72°
3:73;-78
3:7.6.80
4:1 -S 4.
4:6-8
4:9,ii
4.12,14
4:18.17
4:18, -20
4:2123
4:24 -26, .
d.:27-29
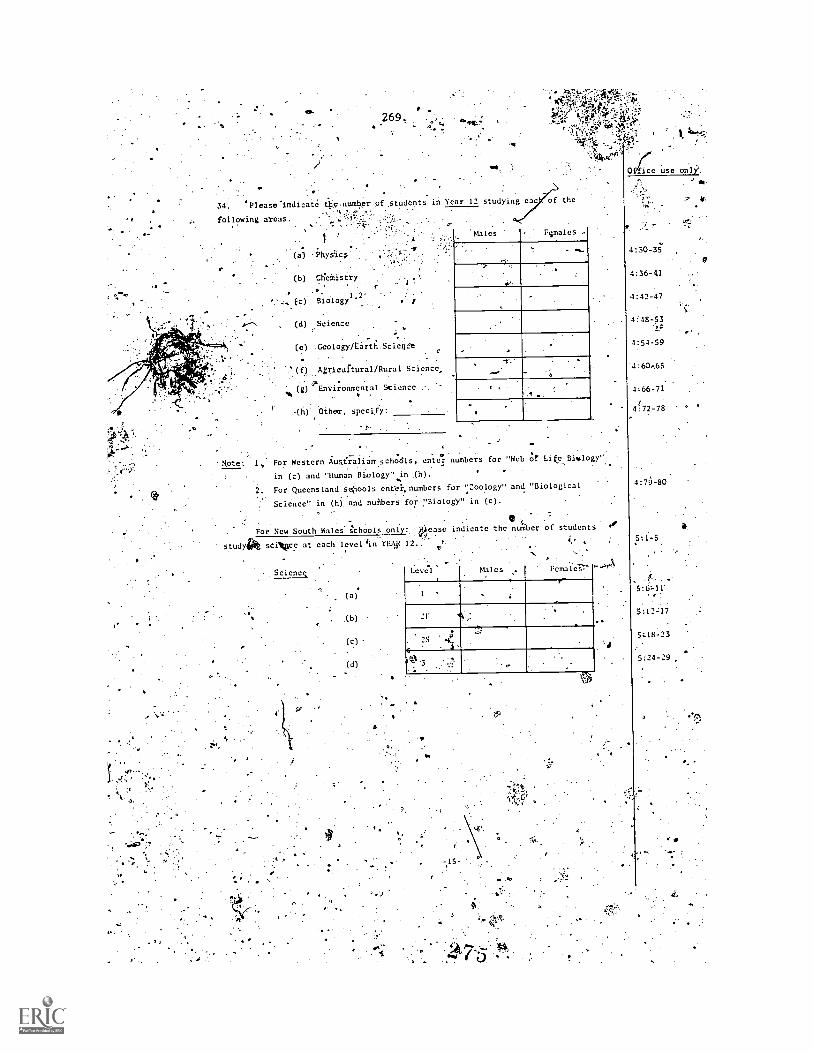
'
269.
.
..
34. 'Please-indicate o.numbor of ,students in Year 12 studying ca c of the
following areas.
..;
(a) Physics
(b) ClieMistry
(c) -Biology
(d) Science
(c) 'Geology /Earth. Science
(f) 4rieurtural/Rural Science_
ti (g)pEnvironmental Science .-.
Note: 1,
2.
.(h) Other, specify:
"Males
.4
F4 ;males
4:30 -35
4:36-41
4:42-47
4i48-53
4:54 -59
-4:60,65
For Western AusicalianschOdls, enter numbers for "Web of Li(oBiglogy".
in (c) and "Human Biology" in .(h). '
For Queensland schools entO%numbers for 7.00logy" and "Biological
Science" in (h) and numbers :%iolOgy" in (c).
For New South Wales. schools only: 'ease indicate the number of students 4#
study salloce at each level tin YEA r
LLT1i11.eve'l Males Female
(c)
(d)
2F5:4217
i:18723
S:24 -29

SECTION VI
270.
CONIMENTS
If yoil would like to male any additional comments about-any of the aspects coveied
by the Sections of this.quostiOnnaire, write rhese comments ill. the space below.' You
may wish to comment. on general facilities for science teaching, the design of.selence
ro6Ms,'or.on the influence of .science facilities on teaching methods.
. I
..Thank yoG.roi answering this goestionnaCre.
suon as pu::sibJe.

APPENDIX .0
DETAILS OF SAMPLING AND MEIGHTING.
The Samplirig Design for the Survey
Details of the Sampling design, which was deScribed in Chdpter
, t
Three, have
been included 'in Table Gl., -'Four.featuresu t is design may be recalled:
1 Schools were selected.,with a probability proportionalto size.
2 A. stratified sampling frame was u d.
3 The-selection of, schools wai random within' each. stratum.
oversample of4iongOvernment schools wer'll7Wp.
4: '
The t'ajt671ation of Weighting
Weighting was necessary when; stimating" State and national values of
parameters because' the'saMPlewasnot simple random sample.
tVariables
D
Three
various
features
?of the sample needed to be tonsidered.whenwerghting.." rstLY; the non-
\jesponse, though very small, was different in different strata'. Setondly, an:
oversample of non-government sehools had been delibe eljfchoeen to pievidp.,
a more-ieliable indication of the standard of science acilities in those
`schools. Finally, even though equal size s mples.were d awn,fromeac State,
the total numb r of schools in each, State wa- different.
.A. variable tate-weight) was calculate to allew for the betweenS
differences. It wa based on the enrolments of014Allear-old students in each
State (Table C2). A secondvaTiable (weight-factor) was,calculated all
for the differential non-respOnse and.oversampUng. It was calculat
the number of 14 -yeas -old students-17earolled.,dt schools in each stratum, and
. .
applied within States. These.'twpyariables werecombined:,to give a weighting
variable (totalweight) whi.PI04ed in tomputing national value's of various
Parameters. Va],ues of the va.tiC0,174yeight factor and total weight have been. I
recorded in Table C3. :...4tt

Table Cl.;,
272.
Science gaCilities in Australian Schools
Survey Sample Details'
. A .
Actual
SamplingNumber- of Theoretics Basic TotalIntegral:'
State .Fraction Stratum. 14-yr-olds . Sample Sample Sample :Multipliei
ACTGovt. 2329 13 13.--\, 1' 1
Cath 9205
1
Ind .
3 3 '1
Total 3249 21 21 21 .,e a
New South .0006023 Govt Met 37424 "22,5 23 2541410r 1
'l
WalesGovt .NM 27398 16.5 16 '4 16 .. 1
A'
Cath Met 9198 5.5 5 11 -- 2
,Cath NM 5438 .3.3 4 6,- ' 2
Ind Met 2861 1.7, 27
Ind' NM 691 0.4s ,0 .. 21;' 7
Total 83010 49...9 50 70 ...'..t r
-
.
Victoria .0007621 Govt Met 30970 23.5 24. 21' 7 i ,
Govt NM 18581 14,2 .14 14 t
1'
eath Met 7699 S. 6 ' 12- ;$'51.
1) ;,ili ...
2
Ind Met 4305
2-..4.5' - t
'Cath NM 1263 3 ? 13 4" 4
INInd NM J 940 0.7,' 1. A 3
4
Total' 65620. 50.0 50 . '71 AP"!
5 ,
Queensland.0013806 avt Met ,1 --0845 .' 15.0 15 15
Govt NMt
ii"
16964 o64 23.4,- 23 '',23
Cath Met 2765 3.8 .,. 4 s' 8 2 'tin
Cath. NM 3139 '4.5 d. 4 8 4 $ 2
9 Ind Met1.9
42. 8 ,
1356
tii.c.z
Ind NM 1152 1:66" 2 6'4r',
Total 32216 a 50.0 - 50 69
SouthGovt Met *137 5 28.4 25 . .,25 1
Australia .002074 Govt fkiV, 6$54 -,' 14k 14 1'14 4 a1
=1:1Met 1796 '3.7 3' 11
.1
1'
277.1 6
.crAo , .2
Ind Met 14714 -: 13
'''
,
1.1p4--
Ind NM 000 0.0 .0 0
.; Total .24113 .50.0 46 ,65
.,
Western .00lps :- Govt Met .4.4 11208 21.9 4 Ill 21
AustraliaGovt'NM 4991 '9:7 10 '10 1
Cath Met 2248 . 4.4$ 4 ' 13 3
Cath NM- A88 1:3' 1 4
1312Ind Met2:6 2 : 12 .1 '' '5
Ind NM . 70 '.0.1 0 1
Total 20517 40.0 "38-T ,6I
Tasmania .004902 Govt Met 2152 10.6 10 , 10
Govt NM 4672 22.1 21° -- 21 1
:Cath Met 414 2:0 2 7_ -.3±
Cath NM 428 2.1 2' .5....3
Ind Met 30G 1.5' 1 5"
9Ind NM 188 09--. 1 4
Total $i.160 39:2 37 52 q

Table-"k
State
2.73:
Calculation of State .weights
ThOretical No. No.- of . Proportionate State - weight
of Sample Schools 14 7yr-olds No. of-Schools (SI .
ACT 21
New South WaleS ;50
'4Victoria 50
Queensland
South Australia 50
Western Australia 40
Tasmania 40
q
,o
Total
Note' :
3249 4.0
83010"
65620 82.0
36216 45:3'
24113, 36.1
20517. 25.6
8160'. 0 10.2
0,193 :
301 o"' 240885 301 .0
The number of 14-year-ords enrolledhas been taken at June 1975.
at-schoor'i'n-each state
-r.

Y
Table. C3 Calculatiod of Weights Applied- to Each Stratum
Irlieor.cticl No: Attual -No.gfa,f;e:. ..Strattnii,; :'of:'-5d1lobls Of Schocits Weight Factor . Total Weight
(A) .) (T--.5)61)
V = A, .
GO-1.1-' 135
Inep 4 3
, ,,..*C a -"2 1A
8F8
,.. Iriclept -
Govt,.Cath .
!!,-.
:Jriclep ;Govt . X8.4.
Ca till "
325
757Go
lt4614'. ;
' 31
-
cicp
h.GOIt:'`.
clop
,QLD
SA
WA
V
1:08 .
1;67g
.:
"'0.rb
:0.58
.
i 2
0.24.1.02 '
0:83,
0.21
1.13
-0:41A
0.30
0.210.240..32
2.:114
1'.22
0,34
.1.67
0.90
0,470 .91
'.0.50
D. 68:'
' ;"0.20
D.,14
k 0.650.24k0.10,0.280:1,0
0.08 .


fammOmSA Brow MA WED EDO FACE IftwidoddW Wood MA BED FACE (ViaHrMidmOA 14 IMMMor BA BEC FACE (Vio4Nmidm-0
hoir"4=PRHSetrt.itt.'"atiEF.AcEOMmtorW C Aadlord MBE MA MED PHD Li.oison) FACENadas Mona" ,M L Clock BA BED FH D MAPSS MACE AIWAJ P K I S M E P H D F I L D ADIFED MACE
276..0
6Australian Council for Educational RalikarchPO Box 210 HawthornVictoria Australia 3122Telephone 81 1271Cables Aceres Melbourne
.Table Di 'The letter to School- Principal
Dear SidMadam,
The Australian Council for, Educatiohal Reserch is condiicting,:'
an evaluationof.theeducationalAfects.and impact-of the__
Australian Science Facilities Program. A grant to. support
the project has been made by the Australian Schools Commisicin,
Advice on the project. cones fror.: an Advisory Committee .chaired
by Professor R. Selby Smith (University of Tasmania).
In each State there Is a liaison officer for this project.
This persOn'willhelp maintain contact/with the schools:in that
State and advise on particular features of the provision of
science facilities. .
It has been -agreed that we should approaCh 'sctboIs'directly to'
seek their participation in the project, ,TheDirector General
of Education has given approval for this procedure in .this
project.,
Your Schodl has been selected by a random sampling techniqUe. to
.beone of those to ;be requested to participate in the first
phase of the project, in which all that is required is that the
teacher a, charge of science complete 4 questiohnaire and return
it to.ACSR. 1,4e..anticipate that trLs Would take abOut one hour
of that person's time. No other science staff would need to 15:e
involved. 'NO students 'will be eithertested or asked to complete,.
questionnaires.
In the questionnaire for the teacher in charge of science, j-
infOrmation is: 'Sought aboi.t science facilities in the tchool,. 0:
the adequacy of those facilities for the science teaqh,i5hg 1$program, the science teaching staff (qualifications Ond the
number.L.of years at.the schgN_)and student enrolMents, All the
information gathered will be confidential and no sphool Will
identified in any report of the stud., 7
. ,..
t 9-

Australian Council for Educational Research
277.
In a sabse4uerit phase, of the project,, to be conducted in 1976,we will approach a small number of schools selected as easestudies.:- In these Case studies we will seek; through int4Y'views,with'sciehae7teachers, More infGrmation concerning the,:adecidacy of Science 'facilities and the effAt of those fadilites on 6cdence teaching. A separate approach to this :small'nuOdr,01'. schools will be.made at a later date to xeques'ttheir.pariggOtion in the case study phase of ther.project.
We hoP's.that the. results o-f this.proySct will 'provide evidence-Upon which. udgmentS can,be maap about educational effectsarld impaCt of the Australian SOience Facilities' Program. Itmay.also-reveal the efieCtS,oT facilities-Upon science teachingand proVideguidaTice,7for the'futurs provision of science, teachingfacilitiesdnsecondd'xy sch ools. summary 'report of the 'resultsof the. su'rVey sent_ to alinarticipating schools.
It is appreciated that your school ma .have been1.4VaIvedinthe ASSP project conducted by ACEIL However it i.s':unlikely thatthat project Would heire involved Science -teachers.
May Z requeet the ',do-. operation and participation of your school.in this praject?.:Within the'next two weeks the Project Officer,Mr John. Ainley, Will write to-the teaCher in charge of science
.
enclosing the questionnaire. We would be grateful if this couldbe completed and returned as soon as - possible. If you areunable to participate could you letXrCAinley know as soon aspossible? Other arrangements will be made and this willreduce the accuracy of the carefully Chosen sample.
Thank you,
Yours sincerely,
/ A
Wm C. RadfordDirector
2

EnarUwS A Nwror 14.! XOD FACE (FluMwri)W Weed MA BED /VCIEtVies-PrwadwalA H 'Mtn.* BA OEC FACE (V ica-PraidenUProfwer Partridge MA FACE ,
P.O.... BMBY SPuth MA AM FACE
D irectorW-Cpwilord MBE MA MED PIO LLOINws) FACE
Cho* BA BED P140 MAP= MildE,AA. -
J Kan., BSC DIPED MED PHD FILDR MACE
278Australian Council for Educational ResearchPO Box 210 HawthornVictoria Australia 3122Telephone 81127'1Cables Aceres Melbourne
Table D2 Letter° to the School Science' Co-ordinator
The. Science Co- ordinator,
De:Sir/Madam,
TheAustraliar Council for :Educational Research is condnetintjan evaluation of the .educationareffecto.and impact of theAustralian ScienceFaciities'ProLram, The evaluation issupported by a:grant from the kistralian Schools, Commission.An" outline of the project is contained in the attached docuffiert.
,In this first phaSe of the project we are seeking, by means ofa-. questionnaire sent to-a sample of schools, ..infzrmation about-
the provision, adequacy and usocf science facilities. All theinformation gathered wil21 be confidential and .no school orindividual wIll .be idenified in any reportof the study.
-.
Your school has beer selected by a random' samplin6 technique to
.
form -part of the sarriple 'for the first phase of the prpj?ect. A
letter has been sent to the school Principal irforming,him/herof this and of the fact th,t we would be writing to you. T
would be grateful if you completequestionnaire anc? return it tc.ACER in the.November 14.
the enclosedenve]ope -provided by
.
We emphasise that no students need' to be tested and that noZther. science teachers reed 1:c be involved: ..The- questionnaire
. 7 h;,,s beer.: designed with the intention of its being completed in_
. ..less than- one' hour., .
446k_y
.Space is prov.-14-en tl,e Th,stiCnnair6,2 for eow:.erts, If. you,
i-fis1.1 to .make any ::.1. ditiomi.1 comenLs, pleL.se attach these.to
the questionnaire.. If you have any questions whilst completingp.e questionnaire please either cojtaet Nw..directly.o the
Tdaison Officer appointed for your state. A list Of-LiaisonOffiCerS is Hiclosed with this letter,.
As. part ol" a, subcqUeo,t4 the project, we will be mukint;viFdts-io-,a, much smalicumier ofschools in each state.' In
these case-study visits ....i.L1'sock room: detailed info.;.-mation
about.the:TrovisiOn and effets of scinte.fL4eilitics.' Inter-
views with-teacherS' will form part of the'case studies and in
these teachers clabwatc upon the qUestionsraised,. They be able to comment on the appropriateness Of-
- the design of the science rooms in which' thug work. An a;:Proch
to schools selected for case qtuhy.,w iiill be r'de in car] 1976.
It "is uz mentioedhere -only to indicate th.'t the surveyquestionnaireis but'one. aSpec't of tcr Study !
4
. . .

f
4ustralian Council for Educational Research.
The Science Coordinator
We hope that the project will'provide information upon whichjudgments can be made about the Science Facilities Program. Inaddition it is hoped that the reeulteof the stuqy will beusefUl in guiding future policy forp'roViding science facilitiesand:be of value to, science teachers when planning their laboratories.
Iri .conclueionccouid. I ask yod to please. return completed:queetiOnnaireby 14 November 1975?, This will greatly assist us.
Thank you,
YoUre,sincerely,
../4cJohn AinleyProject OfficerScience Facilities
Encl.
A.
Project
4

,Australian Council for Educational Research
The Science Coordinator'
Science Facilities EvaliiatloriProject.
1 LIST OF LIAISON OFFICERS
New Souti-T Wales x Mrs M.B.Roberts. .Science InsPeotor'2 OtMara StreetMayfield .NSW : 2304-'
Victoria Mr J.G.Ainley ACERPO Box.210.Rawthorn, Vic. 3122
Queensland Mr GA.Robins Staff InspectorCSecor.dary)
Education Departmentp0 Box 33North Quay Qld 4000
,
South.AuStralia Dr E.Best Senior Research OffiderResearch andPlanning Division
Edueation.Department-Box 1152. GPO'Adelaide SA 5001
Western Australia - Er K.B r2.,man Suberintendent ofBiological, Science
Eduation Departmeti;55 -37 Havelock StreetWest Perth MA 'L005
Taamania
C
ACT
Mr G:Fish Sup of.Science°Matfiematics/SpienceReqoUrce Centre2'EdwarVStreet,tp,b6 : Tas.' 7000'
.
.c/o 'ACT Schools4uthority4th Floor. ,
Wales Centr,e ;.
Lendoil CirCuidtACT' 2600 '41

AUSTRALIAN 'SCIENCE'TEACHERS ASSOCIATION
: .
281. Honorary Secretary, Malcolm J. RosierAustralianCouncil for Educational Research
P0 Box 210, Hawthorn, Victoria 3122,Telephone 811271 Cables ACE RES
16 October 1975
A LETTER OF ENDORSEMENT TO SChOOL.SCiENCE CO-ORDINATORS. r
The accompanying letter from Mr John Ainley of the Australian. Councilfor:Educational Research Sets out information. about a ProjeCt'curreritlye.beingcarried'out by ACER, which is conceinecwith aspects Of 'theprovisibn of science facilities in/schools. .
The results of the study, as well as being important for authorities.making decisions about factors related to'School science, should, bemost interesting nnd'informative for science teachers, school adm.tniS='tratorS.and others concernedwith.science teachingin schools:
The Australian Science Teachers Association.endorses this'investigation.and urges you to complete and retdrn,the enclosed questionnaire. whichshould take, no longer than one:hour of your time, anc1.44ili help Io.makethe study successful. .
.."°,
'GREGOR kAMSEY
-PRESIDENT *- ASTA

( meca.S A 11.A., MA ME D LOD FACE 1.1ociontlW Wood MA BED FACE pleci.IrommdanelA 14 Websew DA OM FACE,(Vica-Fresidekil'Prof... PM PanslOgo MA FACE' ,clamor SWOT So. MA AM FACE
W C Radloe, A01411E.MED..1401.1.0114onl FACEAatmma 0110C10,e
1. Kamm CSC OWED MED.1.113 FILDA MACE'
Our ref. JA/J10.
-282. '..'Australian CouncillorEducational.ResserchPO Box 210,Haw1horn;
,'Victoria Australia 3122,; Telephone 81 1271 . ,
Cables AceresJVIelbourrie
Table D3 Letter to.School Principals about Visits
.In October last, the AuElltralian Council for Educational Researrch 'wrote -Co :yda''about a project ,concerned with the evaluation ,o'f the's-. educati;onal effectS and impact. of the,rsAustr4ian. Science
PrOgram. Subbeciudntly, ',the teacht.r "in chargp, ofscience at .yo?si.r school 'cOmpleted a quaS-tiOnnalre-concerned withthe evvisaion-of science facilities at the, school and the scienceteabthingA(rograrn for which those facilities were used. °
s.
This year..we : are visiting .'a ,inuch ,smalle nUniber of sChool6 inord,er° torobtain more ,detailed inforMation .,about the `impact whichprovision of science fp,cilities have upon- a school.; The schdpols'have been: choclen to represent a range of ;School types and- leVel
, of faciaities throughout Austr4lia. We would be grateful if.yourschool. would be wiliIng to partIciipate in this program of follow-uR,
We mentioned -in the letter ,which !Was sent lait year that adv'iceon/the project is -ob,tine'd from. an advi.sOr3i-Committee -chaired: byProfessor R. Selby Smith (Universi.ty of Tasmania),. ; The 'former s.
../chalrman,; of :the CommOnwe.;,1th-Astivisory Committee on Standards for. Science -Facili-eies, in .the Indepandent Secondary Schbols E..D,,°Gardiner) is a membqr of :the coinMittee. ,:We repeat also ourassuft.ne ,thlt the inforikrigi.An zethered will be confidential irk',that no o`chool will be .i.crer-141ed re-pOrt of the study.
In each school visirt it is iaged the Project, Offcer'
(i) interview. the'teaci r in .4.rge of Science (appiiox.. ; 40 minutes) about the' eff-cts Of f.ncilitie s on the
of the 8cierce Department, : ,
,Interview each,teacher teashes.. Scienpe. inYear 9 .(apprOx. 3Q minu'tes) about the effectof facilities On Science teaching. '.
i ii)' ATalk tb the .1E..boratory staff.
;(i4,r) .Talk' to the Principal or .'Acting. ,
(v;), ~yLodk at the school's Science faciltiVes withthe tea,ctiei-., in- charge of SCieric5:. .;
88 c;

AUstralian Council for Educational Researcli.
-..
), Arrange'for-a quespionnaire. ',Views of Selene*.Classrooms' to be completedby-aPproxiMately1.00 stUdents'in Year 9 (i.e, three or four-intact. classe :from Yedr 9). This ques onnairehasbeen given a trial in about twelVe Vi torianSchooli and.t s. about twenty minutes to omplete.
The program for each school visit has,been so a ang d that eachactivity would fit ea0-1y: into the time normally, owed for oneleason. In this way we hope not to disrupt the- normal work ofthe school.
It is hoped that you9can-participate in this aSeof the project.The-information gained from talking.td this sc ool staff isTegarded'as most valuable in a project of this "De. If you agree-to take.parin this stage of t e project the Project Office16,Mr J.Ainley, pIanS to Visity ur school onIfwork remains to he done a er those days he. will be in thelodaky for one or. two we s and -could return. to your schoolto'u ertake any work w' h is outstanding.
.1
We have attached to this letter a form 'on which We.ask that youindicate whether or not you are willing.to participate in thisstage of the study. We would appreciate it if. you could .discusa
matterwith the teacherin charge inSeienCe and:return theform to'the Project.OfficerasSoOn'as-posSible.
/
_....__
,
.
If YouThave any comments on the.prOposed activity for the visit,-'.please feel free to addthem to the form. .-.
..
Thank you for-your help.- ,0,-.
Yours sincerely,
.0
89 it\i


AUSTRALIANCOUNCIL EOR EDUCATIONAL RESEARCH ,
';SCIENCE FACILITIES PROJECT'
VIEWS. OF SCIENCE CLASSROOMS
"!
'f
. :
.There are two sections to this questionnaire. Be ;pre to answer bothsection A and section B.
Sectiort A
Section A contains etatemen which Could possibly describe what.your,sciefice.classroomand science cldsses are like,.
6
0Think about how well each statement describes your science classroomsOr science.clisses. There is space alongside'e ch statement to.indicate your answer.
-4braw a circle around.
. SA if you) STRONGLY AGREE.With the statemen,'A if you AGREE with the statement.'
if yeti' QIAGREE.with the statement.SD if yol4ZNGLY DISAGIIE with the statement.N you NO OPINION about the statement.
Practice Statement
47. It ds'hard to write things in science%b Cause the hairs arenot comfortable.
Suppose you agree w this statement'. Then you wouldcircle the 'A .in. pace next to the statement li.e th
SA: (2) D SD : N
NoW continue with the tateMents in section.A.
l!L'In our Science ro m it : hard tp be. i olved .
in/class discussion unl ss you sTr r the front. SA',A 0 !:LstI,..,
«._
The SciebckStore contains many interesting charts , ...
/and models khich'we clan exami .. . SA A D SD N
cl3.' ,We can't do many-experimens with eldctricity. .
heCausse therearen't enough poWer'NpOints orbatteries. '.
,i
.,,The Science rood is well designed: we can. ch4ge . ...
.
from class 'lessons to experimental work withoutwasting time:
S I would learn more, lenge if'l could do some ofthe'experifients mysel , '
29
,:
D SD. N

4
6.' 1n-Scie-nce we ire somet'
And study how they' groW
gram things ;,
y *SA A b
, The seats and benches i ce r.qom are
° so arranged that'We c ussion groups,. .SA A p SD N
/
SD N
.
It is hard to fqrm disCtes n -our
Science room without makin poise. SA A D SD N.0
,. 1-9. Demonstration experiments' are of time
/' because some of the -cla'ss can',
at ishappening. 1
iSA A D SD
1-
10. Ili our Science room w sometime' i51,f:.
programs or video replays. , ;4. ) SA A.
.
11. The Science room is all right ractical work" .
but it is/not godd for ordin'a s lesson's. SA A D 'SD N
. 1 , ---12.. When everyone-is'doing experi ents the cience
room is very noisy. - , q SA A. D SD N. 1
13. In Science we have enough' spac and apparatus, ..,.. \for students, son, es to cgrr out experimentsor projects the se .tbems yes. SA' A d, SD. Ns
14. In 'S-ciencNevery gr up can ea y get to a tapwhen they need water foran exp ritnent... SA A D SD N
t,
15. III:the Science room it is,hard t find a clearspace in which to write, an"acco of an '..
. experimept. SA A. D SD N
(---16. In Science there is rust .not.endug kgi304....,
41 apphratus to around so some eop b. Cannot
take part in t e experimentS. 4'
4
D N
17-.)The Scienc4. iciqm always seems to have enough,;), Space for -everyonq to work effectively.
1
18.' The Scence room is too crowded when everyone.
ding experiments.
19. We rarely watcjt movie I ill6and slides 4n Science. SA
SA A SD N'
SA A' 6 ..SD .r,11;
SA A D.
20. Incienc-q' no matter where you sit you can see-everything clearlt. SA ,.A D N
A
),,
21. Experiments ,,in SCienteare diffiCult becauseapparatus is, often broken pr hard to find.
22. In Science we 8.ften work from S'nutither of books. avai table in the, science. r om or the library.'
.,
. --SA A' D ,,SD. ,N
SA -A D. SD 'N'
23. When 'we work in groupS in S ence thp grou _,
are too ;larger i '' ' l SA A .D SD N..
24. The. Science room IS ti ila'good place for watching
'films and slides.:
o -
SA A' 6 SD :N.
25.r
separatenIn ..Sc.ience we have to have egSonsfor theory and \practicar work each ;week. SA A D igif N
1 202.. ..

.Section B
.'"The statements n-this section are descriptions of4tbe sort ofScience lessons students e)obt yoUr age haVe at school'. Theycover :range of types of,science lessons. A
For. each statement indicate h'ow often the statement ,has been trueof the Science lessOns you have had this lean
Draw.a circle:around
A if"the\statement is ALWAYS true.'B if the 5tatement is OFTEN.true (about 3/4 Of. the time)C . if theistatement is 'SOMETIMES true (about 1/2 of the time)AA if'the statement is RARELY' true (alt 1/4 of the time)Cif iPthe stotement is NEVER true.
Now continue with the statements in section, ,
26., We learn most of our Science through practical'e work and experiments. , ,
i
.27. Our Science teachertests,US only" on Whatift in'
.. ,
the textbook. ,.
..
28. Students are encobraged to reaa,StienceMagaZ,inesand referenCb4grs to become famiLiarifith ali....,aspect's of.Scie e.- a.
1. e.
.
22 We have a textbook for .0ience. :.,,.
30. For Science homework we write,up Our laboratoryand practical work. ,.
----.-..
3f. OuiScienca eIasset contai more 'thedretical,work thanipractical work. . . ,
,.. . :.
32. The main,aim of our Science lessons is tounderstand our textbooks. -. i
4 r. ..
. , .
. '33. We are 'encouraged to. take part in fiejdi,ork .ina
t.. scientific reSeawch, outside scypol..
O cn.r+1 0 DD CDrt a <0 CD CD CD< a rt .1
aCD
tA B C, .D
B C D E
E.E.
A
B
-',.34, Our Science lessons iliclucke laboratory experiments'in which `we all take pfrt..
'.
-\ A B
SS:'.' Our Science hoMeWoeCrequires usieg a textbook. : A ,B 9. _ .., ,
7'
4;7

36. We make observations and do.experiments duringour Science'lessons;
37.. When we work in the:laboratory We are.givencomplete instructions from the teacher as to '
.
what to do: - .. ,, A
38. We use a book whi:tells us how to do Our
-. '....
, experiments in the laboratory, 2.
A B C D. E'.
.
39. We usually make up our own problems and then .
the teacher helps us to solve them experimentally. A B C D E.
.Y
40, In class we arer.encoura ed to devise our own ..100 \
projects and experiment , either individually.!.
, or in. groups. : . ". .A B C V.
41.w. Our Science teacher demonstrates. how to.carry.f
a.out- the experiments before we do'ttieM% . N' A
.,
, . .
42'. Iii our practical work our teathergivesuk tertaiproblemS to so ve and then leavesUs-to.-find dim,own methods a> solutions. -; A
.43: The Leather gives' us questions to answer while,we do our icperiments'.
.. .
44:.. We 4o.dur.practical work from labtnar'§o cards-- or instructions which tell us hovito carryout
the-experiment:._ .;
0pp,A0
0,0.9o H <0' 0fDto
r+
C E
EL) E
1, -.;. . , - .
forstatementhO.45.indicateyoUr answer by drawing,circle around the appropriate liter as'in .the listv .
. below the statement., '
. .'t.
...)4,5. Duringour Sciente levons the amoant,of timewe.spend readipg our rextboots-is:'
t.- r ..
.. AAA All the\time.. .
..B'' About on quarArAT the title.. 'C ArvOt, bne half of tlie time: .
.1. D , AboutthreeqUarterl of-the time.E:tiop-e of the time.'
''.'.f.4. . - '',
.', 1.. ..
.'. ..: r,, . .e
t */a .
* . *
.
-!cThankyou for tompleeing this(
.z...sti,onnair.
/.. . .6 .
t9
,
,.. 7.
.
'
.1.-i, ., .-3. ,. .'. ,..
Tubf4hcd by 4Ustralian Coup i#1,fot Educationa 12oear.Gt,
Frodctick St:111awthorn, Vitt t.,4 312.1 -.
9rt. ..
< 441air6 ."'",..191(Y., .. ... A :° .. .., -.,.
/
I
D E
B C
.
C D "E
I
.11iAfiCD/8'.65,4321IL

APPENDIX F0
ITEMS USED IN SCALES.FROM THE STUDENT QUEST ONNAIRE'
I - Involvement in purposeful activity in the science room
In out Sciente room it is bard to be involved in:class :discussion unlessyou. sit, near the 'front:-
5 I would learn'Mord Science if 1-could do. some of the .experiments mysell.
8 It is hard to form disCus'sion groups .in our Seience room without making.a lot of noise.
0 :Demonstration, experiments are a waste of time because some of the classcan't see what is' happening.:.
11 The SCience'roomis all right for practical work bUt it is' not good forordinary class lessons,
12 When everyone is doing\experiments the Science room is very noisy.
20 In Science no matter where you sit you can see'everything.clearly.
0 The brganizatioh of the roomlearning.
-We-can't do many experiment$ witheleciricity'becave there aren't enoughpower points. or batterieSL
and. materials is effective' and condUCiVe'to
4 The Science zoom is. well - designed
experimental work without wasting, . .40
.. 14 In Science 'every group caneas44y get, to a tap yhem they need. water for'',:4. ,..t an experiment.
It . 4. N
.. . .
15 "q' In the Science it is hara-d to find a clear space in which to write anaccount of. an experiment.
.: 0 o-:115, In SCience the
.1
there is just not enough good apparatus togo.arouna so some. people cannot. take part ,in the experiments.
17 The Science room alWays seems to haveenough'space for everyone to Workeffeqtively
. :.
18 The Science room is too'crowded when everyone is doing experiments.,
: we can change froig class lessons totime.
291.
rs,
295
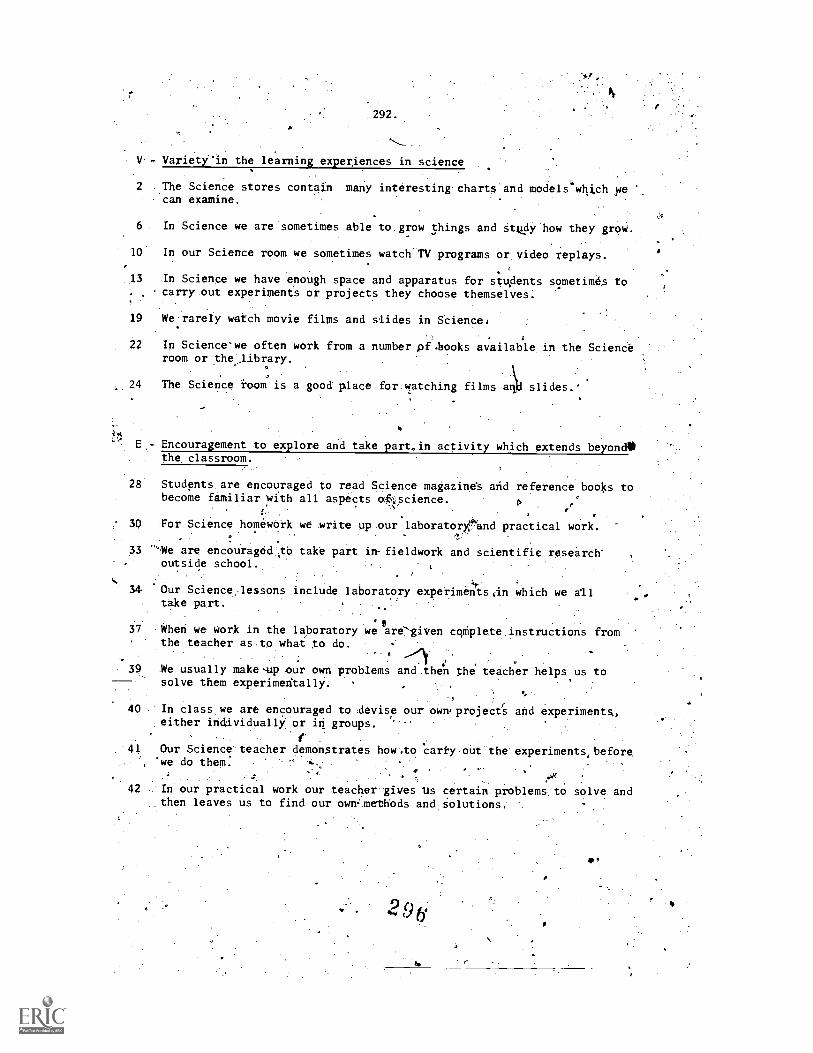
292.
V - Varietyin the learning experiences in science
2 The Science stores contain many interesting charts and models which wecan examine.
6 In Science we are sometimes able to.grow things and sturdy how they grow.
10 In our Science room we sometimes watch TV programs or video replays.
13 In Science we have enough space and apparatus for students sometimes tocarry out experiments or projects they choose themselves:
,
19 We rarely watch movie films and slides in SCience,
22 In Science-we often work from a number of .books available in the Scienceroom or the .library.
24 The Science room is a good place for watching films aii slides.'
a
- Encouragement to explore and take part,in activity which extends beyond,*the classroom.
28 Students are encouraged to read Science magazines and reference books tobecome familiar with all aspects oscience.
.
30 -For Science homewOrk we write up our laboratorand practical work..
33 We are encouraged.,tb take part in-fieldwork and scientific research'outside school.
' 34. Our Science:lesSons include laboratory experiments.in which we alltake part.
0
37. When we. work in the laboratory we are:liven complete instructions fromthe teacher as.to what to do.
39 We usually make --up our own problems and then the teacher helps us tosolve them experimedtallY:
40 In class we are encouraged to :devise our ow project` and experiments,either ihavidually or in groups.
41 Our Science-teacher demonstrates how carty.out the experiments, before.we do them: . .
42 In our practical work our teacher gives us certain problems, to solve andthen leaves us to find.our ownmethods and SOlutions.

T - Emphasis on learning Science .based upon textbooks
v Our Sckence teacher tests us only on what is in the_textbOOk.
29 ' We, have a textbook,for Science.
$2 The' main aim of our S.cience,lessonS is to understand our textboOks..
35 Our Science homework requires using. a textbobk..
38 We use a.book which tells'us. hoW to do our experiments in the laboratory.
45 .2During'our' Science lessons the amount of time we spend reading our
textbooks
r Emphasis placed upon structured practical work
26 We learn Mosi'uf our Science through practical' work and experimentS.
31 Our Science classes'Contain more4theoretical work than practical work.
34 Our Science lessons include laboratory experiments in which 'we all take.
part.
36 We make observations and do experiments during our Science lessons.
-.38 We use a book which tells'uS how to do livr expei:iments'in the laboratory.
.44 Allir'do our practicalwork fromAaboraf6ry cards or instructions which tell
us, how to carry -out. the experiMent;
r
't

APPENDIX
MEASURES. 01 SCIENCE' p01.4ITIEs
School Varianes:Obtainedirothe-Survey Data
Science Room. Availability (Q1)
2 Dual;-Purpose(Science Room Availability (92)'.
3 :SciehCe Room per 1000 Students
4 Dual43urpose,Science:11oOms per 1000. Students (L2)
54.
The 'average quality of school .'fence. rooms.6 The proportion of school science rooms built under the Science Facilities
Program.:
7 The adequacy of the supply of expendable apparatus.
8 . The adequacy of the''supply of minor apparatus.
'.9 The adequacy df the supplyof major apparatus.
10 The number of.laboratory4ssistants per 1000 students:
11 The number of laboratory assistants per 10 teachers.:
Schooj Variables obtained from Visits
, The; design of the schools science rooms.
.13' The location of science facilitieS relative
.4 the quality tof.school,scdence facilitiesas
to each other.
assessed by 'itie Project Officer.
Class ariables Obtaineefrom Visits
A
15 The proportion of time spent in science rooms.Y
16' The number'of different science roodt.used each week..
17 The quality of the science roommost.often used,..
.
(a.) as. assessed by the science co-ordinatOr,4and(b) as assessed by the Project Officer. - ,.1
#
18 The proximity of the sciehce'room to the's'tore room. . .,.
, q . .' . -..
..
19 The type of deSign of the science room most often Used.
. e
,.295.. 298

APPENDIX H\EXPENDITURE UNDER THE AUSTRALIAN SCIENCE FAC4LITIESPROGRAM
Table HI. Expenditure between 1 July. 1964 and SO June 1971--(Amounts iIi dollars).
. w'Government - 'Non - Government Total
State ("*). CathOlic Independent Total
New So6th Wales .18,892,000 8,350,500 2,579,900 10,930,400. 29,822',400
Victoria. 14,303,800 5,251,200. 3,032,900 8,284,100 22,487,900.
Queensland . 7,357,700 2,604,100 1,660,770 4,264,800 11,622,500.
South Australia '4,778,200 1,353,000 1,422,900 2,775,900 7,554,100
/
Western Australia 3,659,200 1,323,000 304,000 2,126,000 5,785,200
'Tasmania 1,673;700 552,500 414,300 966,800 2,640,500il bl
T9TAL, .., 50,664,600 19,433;300 .9,'914,700 29,348,000 80,012,600,-
. 1:41e,112 Expenditure between 1 July 1971'ark30 June 1975
t.c
Government .
State fr
Non-Government Total
'Catholic Independent Total
New.$outh Wales : 9,471,780. 4120,230 1,221,310 5,.341,540 14,813',320:'
'Victoria -' 8,035,62.0, 3,1384965 2,298,215. 5,437,180 - 13,422,800 ..
Queensland .3,072,7815 2,411,520 911;500 ''3,323,020 6,395800
&kith Australia 2,647,125 ' 408,527 c 254,998 663,525 3',310,t50
Western:Australia 1,870,035! 1,173,514 5991591 1,773,105 3,643,140.
Tasmania.
990,660 426,947 241,683. 668,630 1,659,290
A : -TOTAL 26,088,000 11,679,073 5,527,297 17,207,000 -43,295,000
4 !
..
. . '.s,-,
Source: Commonwealth Department of Education, 197.5.
1 .
gbo.
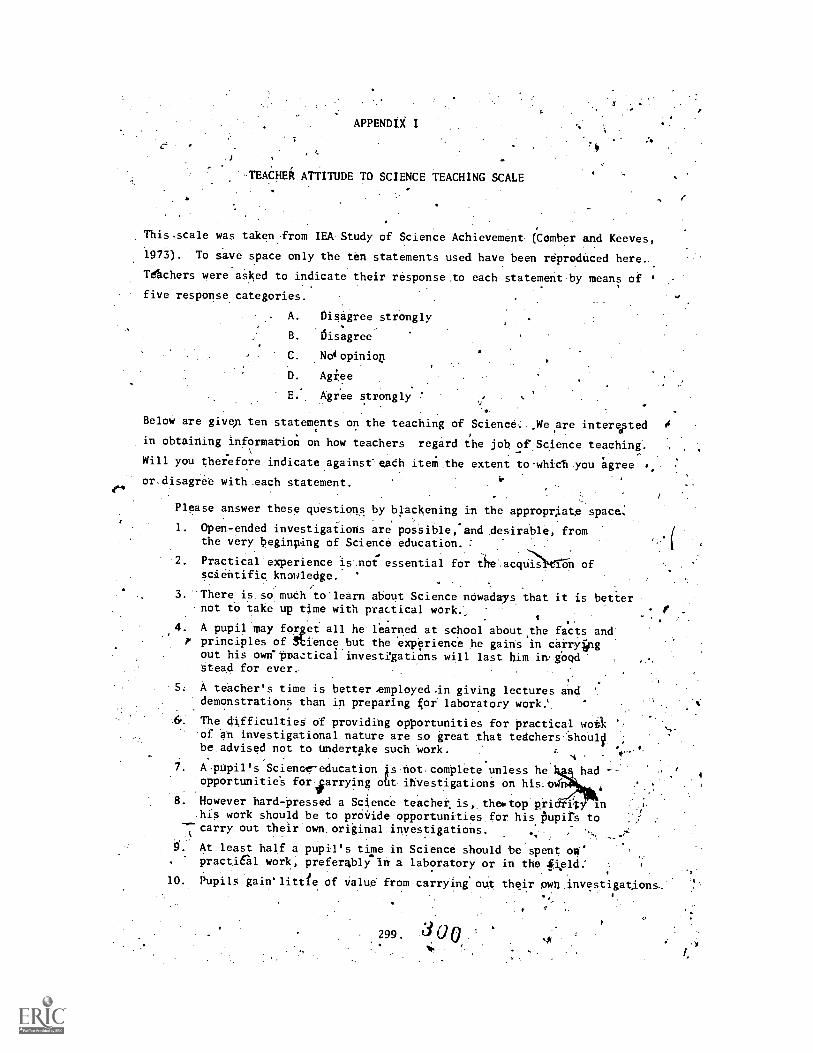
APPENDIX
TEACHER ATTITUDE TO SCIENCE TEACHING SCALE
This.scale was taken Irom IEA Study of Science Achievement. (Comber and Keeves,
1973). To save space only the ten statements used have been reprodUced here..
Tdhchers were asked to indicate their response to each statement by means of
five response categories.
A. Disagree strongly
B. Disagree
C. No` opinion
D. Agi-ee
E. Agree strongly
Below are giveA ten statements on the teaching of Science...Weare interested
in obtaining information on how teachers regard the job of Science teaching.
Will you therefore indicate against each item the extent towhith you agreek .or disagree with .each statement.
Please answer these questions by blackening in the approprate space.
1. Open-ended investigations are poSsible, and .desirable, fromthe very beginning of Science education.
2. Practical experience is.notessential for tite.acquiS)%tri6n ofscientific knowledge.
3. There is so much to'learn about Science nowadays that it is betternot to take up time with practical work:.
4. A pupil may forget all he learned at school about the facts andp principles of nience but the experience he gain's in carry41)1g
out his oweprazticaiinvestrgations will last him in. gbqdSteed for ever.
S. A teacher's time is better .employed dn giving lectures anddemonstrations than in preparing for laboratory work.'
The difficultieS of providing opportunities for practical workof an investigational nature are SD great that teachers.Shon10be advised not to Undertfike such work.
7. A.pUpil's Scienec-education is not,tomplete unless he hadopportunitieS forerrying obt.ihvestigations on his,ovf
4
8. However hard-pressed a Science teachet is,,theotop'pri. 3:s
his work should be to prOVide opportunities for his PupitS to-- carry out their own. original investigations.
At least half a pupil's time in Science should be spent op'practiral work, preferably in a laboratory or in the 4ipld:
10. Pupils gairClittie of Value from carrying out their own. Investigations.
. .
299. 300 N.A

APPENDI.X I
TEACHER ATTITUDE TO SCIENCE TEACHING SCALE
This.scale was taken Irom IEK Study of Science Achievement. (Comber and Keeves,
1973). To save space only the ten statements used have been reprodUced here..
Tdhchers were asked to indicate their response to each statement by means of '
five response categories.
A. Disagree strongly
B. Aisagree
C. Noiopiniop
D. Agiee
E.. Agree strongly
Below are giveA ten statements on the teaching of Science:.,Weare interested 0
in obtaining information on how teachers regard the job of Science teaching.
Will you therefore indicate against each item ,the extent towhith you agree
or,disagree with .each statement.4"
Please answer these questions by blackening in the approprate space..
1. Open -ended investigations are poSsible, and .desirable, fromthe very heginping of Science education. :
2. Practical experience is,not'essential for t#- e.acquis3 on ofscientific knowledge.
3 There is so much to'learn about Science nowadays that it is betternot to take up time with practical work:.
4. A pupil may forget all he learned at school about the facts andr principles of Sbience but the experience he gain's in carrylipg
out his own'pnaztical'investrgations will last him in. gbqdStead for ever.
A teacher's time is better .employed dn giving lectures anddemonstrations than in preparing for laboratory work.'
.6;. The difficulties of providing opportunities for practical workof at investigational nature are SD great that teachers..ShoU10be advised not to undertake such work.
7. A.pUpil's Science-eduCation is not,complete unless he hadopportunitieS for ikarrying obt.ihvestigations on his, o4(
4
8. However hard-pressed a Science teachet is,.theotop'pri . it inhis work should be to proride opportunities for his Plupirs to
-- carry out their own. original investigations.
P. At least half a pupil's time in Science should be spent oa-practiE'al work, preferably in a laboratory or in the #i,eld:
10. Pupils gairClittie of Value from carrying out their nwn.investigations,
. /
299. d 0 0

II
)
r

I.

,