august interdisciplinary journal f contemporary … 3-4 bertsch... · 2012-08-09 · ijcrb.webs.com...
TRANSCRIPT
ijcrb.webs.com INTERDISCIPLINARY JOURNAL OF CONTEMPORARY RESEARCH IN BUSINESS
COPY RIGHT © 2011 Institute of Interdisciplinary Business Research
1
AUGUST 2011 VOL 3, NO 4
7
Interdisciplinary Journal of Contemporary Research in Business
Double Blind Peer Reviewed Journal
Institute of Interdisciplinary Business Research~ IIBR INTERNATIONAL RESEARCH CENTRE
Monthly Edition Copyright © 2011 IJCRB
IJCRB ISSN 2073-7122
Vol .3, No. 4 August 2011
www.ijcrb.webs.com [email protected]
Listed in ULRICH’S
Indexed in CABELL’s-USA
Indexed in APA-PsycINFO
Indexing in ABI/INFORM
USA, Americian Business Information
Inclusion in
Included in GOOGLE SCHOLAR
Listed in Journal Seek
Indexing /Abstracting in
ijcrb.webs.com INTERDISCIPLINARY JOURNAL OF CONTEMPORARY RESEARCH IN BUSINESS
COPY RIGHT © 2011 Institute of Interdisciplinary Business Research
15
AUGUST 2011 VOL 3, NO 4
Cross-Cultural Differences in Social Knowledge Creation and Exchange: An examination of GLOBE's Dimensions
of Societal Culture
Andy Bertsch, (DBA, Corresponding Author) Minot State University
500 West University Avenue, Minot, ND 58707, USA
Dr. John Girard, PhD , Minot State University
500 West University Avenue, Minot, ND 58707, USA Abstract This paper continues to chronicle an exploratory, in-progress research project that compares the findings of existent cross-cultural research with those of Forrester’s Social Technographics research. The aim of the project is to determine if a relationship exists between cultural differences and social knowledge creation and exchange. This multiphase project has, thus far, included mapping Davenport and Prusak’s information and knowledge creation theories to the six components of Forrester’s Social Technographics study (creators, critics, collectors, joiners, spectators, and inactives) and comparing the resulting Social Technographics results from 13 nations to Hofstede’s four cultural dimensions (power distance, individualism, uncertainty avoidance, masculinity). The results of the comparison between Hofstede’s scores and the Social Technographics were inconclusive as there existed no reasonable relationships between Hofstede’s culture scores and a society’s placement along the Social Technographics (Girard & Bertsch, 2011). The current phase, as included in this paper, shifted the focus from Hofstede’s culture scores to the GLOBE Societal Values scores. The analysis included running correlation coefficients (Peasson’s r) for each relationship, testing for significance of each respective Pearson’s r, and conducting regression analyses on each relationship. The results were mixed. Although there were several statistically significant correlations between the GLOBE Societal Values scales and the Social Technographics scores, only one relationship passed the R-square test. It may be that other cross-cultural models such as GLOBE Practice scales, Schwartz, Triandis, or others may yield different results. In this regard, further research is necessary. The next phase of the project will compare Social Technographics with the GLOBE Practice scores. Keywords: Global Knowledge Sharing, Cross-Cultural Research, Social Technographics Introduction For more than 20 years, organizational leaders have strived to institutionalize effective ways to create and share organizational knowledge. A variety of concerns, including downsizing, baby boomers retirement, terrorism, the global economic crisis, and a host of other organizational challenges, have forced leaders to share knowledge with both internal and external stakeholders. Many leaders have relied on the on the solid foundation provided by several seminal works including Working Knowledge (Davenport & Prusak, 1998), If Only We Knew What We Know (O'Dell & Grayson, 1998), and The Knowledge Creating Company (Nonaka & Takeuchi, 1995).

ijcrb.webs.com INTERDISCIPLINARY JOURNAL OF CONTEMPORARY RESEARCH IN BUSINESS
COPY RIGHT © 2011 Institute of Interdisciplinary Business Research
16
AUGUST 2011 VOL 3, NO 4
Notwithstanding the best efforts of many pioneering leaders, few organizations have attained the desired level of knowledge creation and exchange. This is certainly not due to a lack of enthusiasm or commitment of resources on the part of executives, but rather the result of technology-focused, complicated, and expensive tools, techniques, and technologies. This technological focus was further hindered by an omnipresent culture of need-to-know rather than one based on need-to-share. Together, these factors prevented the transparency necessary to achieve organizational knowledge goals. The problem becomes even more complex for global organizations. This paper chronicles an exploratory, in-progress research project that draws together a series of recent projects with a view to understanding how global knowledge creation and exchange may be facilitated through social knowledge tools, techniques, and techniques. Literature Review Knowledge Management Generations In A Leader’s Guide to Knowledge Management, the authors suggested that many first-generation knowledge management projects were based on collecting and classifying information (Girard & Girard, 2009). The belief seemed to be that if we developed huge, centralized, IT-based repositories of artifacts, then stakeholders would serve themselves. Unfortunately, this approach never delivered the promised user-friendly access but rather resulted in many very expensive partial databases of little value. Second-generation knowledge management projects, they argued, shifted the focus to codifying tacit knowledge and combining explicit knowledge to create new knowledge. This approach seemed plausible in theory; however, quickly it became apparent that codifying tacit knowledge was difficult and very expensive, both in terms of time and money. Further exacerbating the challenge was the issue of information overload that resulted from the combination efforts. Finally, Girard and Girard (2009) suggested that today we are seeing some very promising results from third-generation knowledge projects, which focus on connecting people and facilitating collaboration. Their projects focus on the social side of knowledge creation and exchange, referred to as Social Knowledge. Some organizations are now reaping the benefits of using social media tools such as wikis for collaboration and knowledge-sharing and commercial social networking tools, such as Facebook, LinkedIn, or Twitter for connecting people. These emerging tools and techniques provide flexible, agile, and intuitive solutions for connecting people with people and facilitating coordination, communication, and collaboration. Social Technographics A characteristic of the first decade of the 21st century is the emerging power of everyday people. In their book Groundswell: Winning in a World Transformed by Social Technologies, Forrester analysts Charlene Li and Josh Bernoff (Li & Bernoff, 2008) describe part of this trend as a groundswell, which they define as “a social trend in which people use technologies to get the things they need from each other, rather than from traditional institutions like corporations” (p. 9). The groundswell may be useful in considering cross-cultural differences and the resultant impact on third generation knowledge projects.
ijcrb.webs.com INTERDISCIPLINARY JOURNAL OF CONTEMPORARY RESEARCH IN BUSINESS
COPY RIGHT © 2011 Institute of Interdisciplinary Business Research
17
AUGUST 2011 VOL 3, NO 4
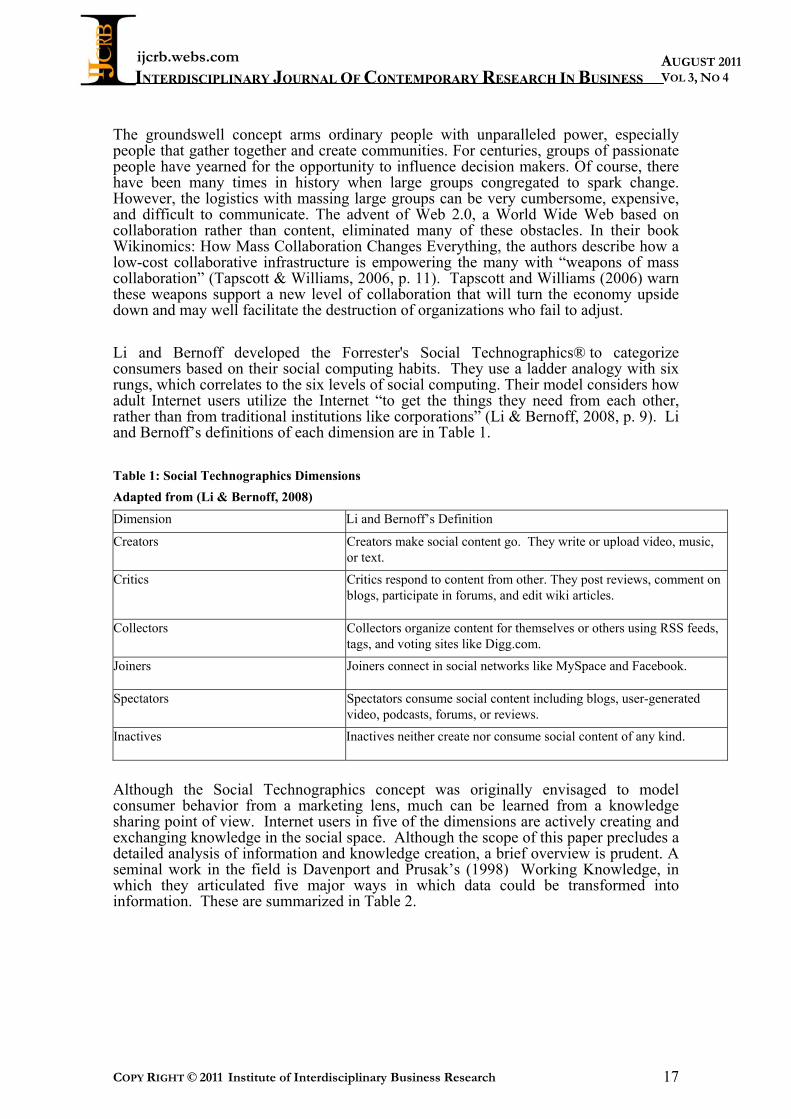
The groundswell concept arms ordinary people with unparalleled power, especially people that gather together and create communities. For centuries, groups of passionate people have yearned for the opportunity to influence decision makers. Of course, there have been many times in history when large groups congregated to spark change. However, the logistics with massing large groups can be very cumbersome, expensive, and difficult to communicate. The advent of Web 2.0, a World Wide Web based on collaboration rather than content, eliminated many of these obstacles. In their book Wikinomics: How Mass Collaboration Changes Everything, the authors describe how a low-cost collaborative infrastructure is empowering the many with “weapons of mass collaboration” (Tapscott & Williams, 2006, p. 11). Tapscott and Williams (2006) warn these weapons support a new level of collaboration that will turn the economy upside down and may well facilitate the destruction of organizations who fail to adjust. Li and Bernoff developed the Forrester's Social Technographics® to categorize consumers based on their social computing habits. They use a ladder analogy with six rungs, which correlates to the six levels of social computing. Their model considers how adult Internet users utilize the Internet “to get the things they need from each other, rather than from traditional institutions like corporations” (Li & Bernoff, 2008, p. 9). Li and Bernoff’s definitions of each dimension are in Table 1. Table 1: Social Technographics Dimensions Adapted from (Li & Bernoff, 2008)
Dimension Li and Bernoff’s Definition
Creators Creators make social content go. They write or upload video, music, or text.
Critics Critics respond to content from other. They post reviews, comment on blogs, participate in forums, and edit wiki articles.
Collectors Collectors organize content for themselves or others using RSS feeds, tags, and voting sites like Digg.com.
Joiners Joiners connect in social networks like MySpace and Facebook.
Spectators Spectators consume social content including blogs, user-generated video, podcasts, forums, or reviews.
Inactives Inactives neither create nor consume social content of any kind.
Although the Social Technographics concept was originally envisaged to model consumer behavior from a marketing lens, much can be learned from a knowledge sharing point of view. Internet users in five of the dimensions are actively creating and exchanging knowledge in the social space. Although the scope of this paper precludes a detailed analysis of information and knowledge creation, a brief overview is prudent. A seminal work in the field is Davenport and Prusak’s (1998) Working Knowledge, in which they articulated five major ways in which data could be transformed into information. These are summarized in Table 2.

ijcrb.webs.com INTERDISCIPLINARY JOURNAL OF CONTEMPORARY RESEARCH IN BUSINESS
COPY RIGHT © 2011 Institute of Interdisciplinary Business Research
18
AUGUST 2011 VOL 3, NO 4
Table 2: Data to Information Creation Tasks Adapted from Davenport and Prusak (1998)
Dimension Transformation Task
Context Put the data into context by communicating the reason for gathering the data
Categorize Categorize the data by describing the breakdown or the essential components of the data
Calculate Mathematically or statistically calculate the data
Correct Correct errors in previously reported data
Condense Condense the data by providing a summary instead of the entire collection of data
Similarly, Davenport and Prusak (1998) described how information may metamorphose into knowledge through a series of activities that increase its value as summarized in Table 3. Table 3: Information to Knowledge Creation Tasks Adapted from Davenport and Prusak (1998) Dimension Transformation Task
Compare Compare information with previous information, primarily to determine what has changed in a particular situation
Consequences Determine the consequences or repercussions of this information on decisions
Connects Consider how this information connects or correlates to other information
Conversation Through conversation one may conclude what people think about the information
By combing the work of Davenport and Prusak with that of Li and Bernoff, one may deduce that the Social Technographics components cater to knowledge creation and exchange in the social dimension. A brief summary is presented Table 4. Table 4: Social Technographics Dimensions Adapted from Li and Bernoff (2008) Dimension Knowledge Sharing Activity
Creators Creators produce and share information and knowledge that is freely available to other users, the quintessence of need-to-share.
Critics Critics add value to the data, information and knowledge shared by creators. Their feedback, comments, and corrections often facilitate the metamorphosis of data to information or information to knowledge thorough conversation, connections, and comparison.
Collectors Collectors provide access and provide the opportunity for other users to compare and connect information.
Joiners Online communities facilitate conversation.
Spectators Spectators consume the information and knowledge created by others.
Inactives Inactives do not create or exchange social knowledge

ijcrb.webs.com INTERDISCIPLINARY JOURNAL OF CONTEMPORARY RESEARCH IN BUSINESS
COPY RIGHT © 2011 Institute of Interdisciplinary Business Research
19
AUGUST 2011 VOL 3, NO 4
The clear connection between the Social Technographics and Davenport and Prusak’s knowledge creation processes provides a foundation from which we may explore the global environment. Of particular interest to this project are different levels of social computing by nation. For example, according to Li and Bernoff (2008), 34% of adult Japanese Internet users are classified as “creators” compared with only 9% of adult German Internet users. To date, Social Technographics data has been collected for 13 nations that will be considered later in the paper. The Cultural Component The first phase of this study (Girard & Bertsch, 2011) was based largely on the work of Geert Hofstede (1980), a pioneering researcher in the domain of cross-cultural research who argued there are four key dimensions of cultural differences: power distance, individualism, uncertainty avoidance, and masculinity. Hofstede’s original publication (1980) was based on 116,000 surveys from 88,000 employees of IBM subsidiaries from 72 societies. However, only 40 countries were included in his published work; due, in part, because he only included societies that had more than 50 respondents. Hofstede’s 1980 publication illustrating the concept of culture and its impact on management and business operations was significant. His work has become a heavily replicated and referenced cultural model. As of 2001, there had been 140 replications, and between January, 2000 and December, 2005, his work appeared as a reference in nearly 1,400 journal articles (Hofstede, 2001; Holt, 2007). Flaws in some of the replications have been identified by Hofstede himself as he is critical of replications that do not match the samples from each society, are small in size (small n from each society), or compare too few societies (Hofstede, 1996, 2001). Some are critical of Hofstede’s methodology and findings. Hofstede based his work on surveys of IBM managers in 40 different countries. This alone has spurred a plethora of outcries. To some, a study of only one organization cannot be generalized onto the entire population of a society. The debate of whether nations are the appropriate units of measurement directly challenges Hofstede’s practice of measuring the value systems of managers from a single organization and subsequent inference onto the national culture (e.g. ecological fallacy and reverse ecological fallacy). In addition, there are those who challenge the timeliness of Hofstede’s collection of data (1967-1969, and 1971-1973) and whether the data is obsolete. Others have been critical of any study that uses survey instruments to assess cultures. For a full discourse of the Hofstede-to-Forrester analysis, see Girard & Bertsch (2011). This phase of the project turns to the Global Leadership and Organizational Behavior Effectiveness (GLOBE) research project, which is a comprehensive study of 61 countries (House, Hanges, Javidan, Dorfman, Gupta, & GLOBE Associates, 2004). This extensive study includes more than 17,000 participating middle managers from 950 organizations, making it “perhaps the most large-scale international management research project that has ever been undertaken” (Leung, 2008, p. xiii). Although similar in some ways to Hofstede’s work, the GLOBE research project includes nine dimensions of societal culture as defined in Table 5.

ijcrb.webs.com INTERDISCIPLINARY JOURNAL OF CONTEMPORARY RESEARCH IN BUSINESS
COPY RIGHT © 2011 Institute of Interdisciplinary Business Research
20
AUGUST 2011 VOL 3, NO 4
Table 5: GLOBE's Dimensions of Societal Culture Definitions adopted by GLOBE (Chhokar, Brodbeck & House, 2008) Dimension Definition
Performance Orientation (PO) The extent to which high level members of organizations and societies, encourage and reward group members for performance improvement and excellence.
Future Orientation (FO) The degree to which individuals in organizations or societies engage in future-oriented behaviors such as planning, investing in the future, and delaying individual or collective gratification.
Gender Egalitarianism (GE) The extent to which an organization or a society minimizes gender role differences while promoting gender equity and equality of genders.
Assertiveness (A) The degree to which individuals in organizations or societies are assertive, confrontational, and aggressive in social relationships.
Institutional Collectivism (IC) The degree to which organizational and societal institutional practices encourage and reward collective distribution of resources and collective action.
In-Group Collectivism (GC) The degree to which individuals express pride, loyalty, and cohesiveness in their organizations, families, circle of close friends, or other such small groups.
Power Distance (PD) The degree to which members of an organization and society encourage and reward unequal distribution of power with greater power at higher levels.
Humane Orientation (HO) The degree to which individuals in organizations or societies encourage and reward individuals for being fair, altruistic, friendly, generous, caring, kind to others, and exhibiting and promoting altruistic ideals.
Uncertainty Avoidance (UA) The extent to which members of an organization or society strive to avoid uncertainty by relying on established social norms, rituals, and bureaucratic practices to decrease the probability of unpredictable future events that could adversely affect the operation of an organization or society, and also to remedy the potential adverse effects of such unpredictable future events.
Methodology The decision between exploratory and conclusive research design hinges on whether the research problem needs to be defined more precisely, whether theory exists concerning the research question and context, and whether relevant courses of actions have been previously well defined (Hair, Babin, Money, & Samouel, 2003; Malhotra, 2007; Zikmund & Babin, 2007). For the present study, the primary objective is to provide insight into the relationships between GLOBE’s Values scores and the Social Technographics scores. The authors admit that this is an ambiguous question heretofore unresolved and unexplored. As the authors seek to discover new information and new relationships (Zikmund & Babin, 2007) the sample is based on convenience – another aspect of exploratory research. Although the data can be qualitative during exploratory research, quantitative scores are also acceptable (J. F. Hair, Jr., et al., 2003; Malhotra, 2007; Zikmund & Babin, 2007).

ijcrb.webs.com INTERDISCIPLINARY JOURNAL OF CONTEMPORARY RESEARCH IN BUSINESS
COPY RIGHT © 2011 Institute of Interdisciplinary Business Research
21
AUGUST 2011 VOL 3, NO 4
Similar to the previous paper in this multiphase project, this study seeks to analyze the relationship between the GLOBE Societal Values scores and Forrester's Social Technographics® scales. The previous research effort relied on the Hofstede scales and scores. The current research now focuses on exploring relationships between the Social Technographics scales and the GLOBE Societal Values scores. This exploratory effort will attempt to ferret out the effects, if any, on predicting a country’s position along the various rungs of the Forrester ladder using a valid cross-cultural values scale. The statistical techniques which will be employed to measure the association and potential relationships between the GLOBE Societal Values scores and the Forrester scores will include correlation and regression analyses (Harnett & Horrell, 1998; Lind, Marchal, & Wathen, 2010). In this regard, this study is exploring the relationship between culture and placement on the Forrester scale. Culture will be treated as the independent variable used to determine a country’s placement on the Forrester ladder which will be considered the dependent variable. The steps that will be followed to explore these relationships follows herein (Harnett & Horrell, 1998; Lind, et al., 2010):
1. Pearson’s Coefficient of Correlation. Pearson’s r will be used to determine the strength of any existing relationship between the GLOBE Societal Values scores and the Forrester scores. Caution will be in order as correlation is not the same as causation (for an example of such discussion, see Lind (2010, p. 462)).
2. Test for significance of Pearson’s r. 3. Regression analysis in order to determine the reasonableness of predicting a
country’s placement along the Forrester scale. 4. An analysis of the R-squared statistic to illustrate the possible effect, if any, of
culture’s impact on the respective country’s placement on the Forrester ladder. This study will employ an exploratory research design aimed at exploring the relationships between cultural values dimension variables (independent variables) and a country’s placement on the Forrester scales (dependent variables). The authors have chosen correlation and regression techniques to explore these relationships. Analysis To date, there are thirteen (13) countries where data exists in the Forrester model. Using the GLOBE Societal Values scales of Performance Orientation (PO); Future Orientation (FO); Gender Egalitarianism (GE); Aggressiveness (A); Institutional Collectivism (IC); In-Group Collectivism (GC); Power Distance Index (PD); Humane Orientation (HO); and Uncertainty Avoidance Index (UA), was developed.

ijcrb.webs.com INTERDISCIPLINARY JOURNAL OF CONTEMPORARY RESEARCH IN BUSINESS
COPY RIGHT © 2011 Institute of Interdisciplinary Business Research
22
AUGUST 2011 VOL 3, NO 4
Table 6: Country Scores for Forrester and GLOBE Societal Values Scales
Country Creators Critics Collectors Joiners Spectator
s Inactive
s PO FO GE A IC GC PD HO UA
US 24 37 21 51 73 18 6.14 5.31 5.06 4.32 4.17 5.77 2.85 5.53 4.00
Canada 18 29 17 57 64 21 6.15 5.35 5.11 4.15 4.17 597 2.70 5.64 3.75
UK 15 21 6 38 50 37 5.90 5.06 5.17 3.70 4.32 5.55 2.80 5.43 4.11
France 12 19 6 24 51 40 5.65 4.96 4.40 3.38 4.86 5.42 2.76 5.67 4.26
Germany 9 12 4 21 38 52 6.01 4.85 4.89 3.09 4.82 5.18 2.54 5.46 3.94
Italy 29 25 7 33 52 36 6.07 5.91 4.88 3.82 5.13 5.72 2.47 5.58 4.47
Metro China 44 46 37 32 79 17 5.67 4.73 3.68 5.44 4.56 5.09 3.10 5.32 5.28
Japan 34 30 11 26 69 23 5.17 5.25 4.33 5.56 3.99 5.26 2.86 5.41 4.33
South Korea 49 46 19 48 76 9 5.25 5.69 4.22 3.75 3.9 5.41 2.55 5.60 4.67
Australia 23 31 14 50 64 22 5.89 5.15 5.02 3.81 4.40 5.76 2.78 5.58 3.98
Spain 15 21 8 24 56 38 5.80 5.63 4.82 4.00 5.20 5.79 2.26 5.69 4.76
Netherlands 20 20 8 38 64 27 5.49 5.07 4.99 3.02 4.55 5.17 2.45 5.20 3.24
Sweden 14 21 8 37 59 32 5.80 4.89 5.15 3.61 3.94 6.04 2.70 5.65 3.60
As explained earlier, the first step in exploring the relationships between the variables (columns) provided in Table 7 is to run correlation coefficients (Pearson’s r) for each relationship. Table 7 illustrates the Pearson’s r correlation coefficients for each pair of variables. Table 7: Correlation Coefficients
Creators Critics Collectors Joiners Spectators Inactives
PO - Values -0.5277 -0.2806 -0.0773 0.2639 -0.4051 0.3471
FO - Values 0.2923 0.1900 -0.1393 0.2245 0.0917 -0.2013
GE - Values -0.7141 -0.5901 -0.6075 0.3260 -0.4860 0.3553
A - Values 0.5934 0.6241 0.6587 -0.0009 0.6293 -0.5100
IC - Values -0.3435 -0.4565 -0.2978 -0.5763 -0.5538 0.6444
GC - Values -0.1353 0.0420 0.1398 0.5179 0.0729 -0.1939
PD - Values 0.3141 0.4878 0.6169 0.1931 0.4477 -0.3978
HO - Values -0.2380 -0.0796 -0.2249 0.1232 -0.2099 0.1194
UA - Values 0.6000 0.5473 0.5278 -0.2977 0.3008 -0.1963
Table 8 reveals many weakly correlated relationships between the GLOBE Societal Values scale scores and the Forrester scales. In order to determine any significant correlations, a test of significance for each relationship is in order. Table 8 illustrates the respective t-statistic for each correlation coefficient.

ijcrb.webs.com INTERDISCIPLINARY JOURNAL OF CONTEMPORARY RESEARCH IN BUSINESS
COPY RIGHT © 2011 Institute of Interdisciplinary Business Research
23
AUGUST 2011 VOL 3, NO 4
Table 8: Correlation Coefficients and Associated t-Scores
Creators Critics Collectors Joiners Spectators Inactives
PO - Values -0.5277 t=-2.0606
-0.2806t=-0.9696
-0.0773t=-0.2572
0.2639t=0.9074
-0.4051 t=-1.4697
0.3471t=1.2275
FO - Values 0.2923 t=1.0136
0.1900t=0.6419
-0.1393t=-0.4664
0.2245t=0.7641
0.0917 t=0.3056
-0.2013t=-0.6816
GE - Values -0.7141 t=-3.3830
-0.5901t=-2.4240
-0.6075t=-2.5367
0.3260t=1.1438
-0.4860 t=-1.8443
0.3553t=1.2605
A - Values 0.5934 t=2.4451
0.6241t=2.6495
0.6587t=2.9037
-0.0009t=-0.0029
0.6293 t=2.6858
-0.5100t=-1.9664
CI - Values -0.3435 t=-1.2132
-0.4565t=-1.7016
-0.2978t=-1.0345
-0.5763t=-2.3386
-0.5538 t=-2.2060
0.6444t=2.7951
GC - Values -0.1353 t=-0.4528
0.0420t=0.1395
0.1398t=0.4681
0.5179t=2.0082
0.0729 t=0.2423
-0.1939t=-0.6556
PD - Values 0.3141 t=1.0975
0.4878t=1.8533
0.6169t=2.6000
0.1931t=0.6526
0.4477 t=1.6605
-0.3978t=-1.4380
HO - Values -0.2380 t=-0.8129
-0.0796t=-0.2650
-0.2249t=-0.7656
0.1232t=0.4118
-0.2099 t=-0.7119
0.1194t=0.3989
UA - Values 0.6000 t=2.4873
0.5473t=2.1686
0.5278t=2.0611
-0.2977t=-1.0342
0.3008 t=1.0459
-0.1963t=-0.6639
Using a standard t-test with degrees of freedom of n-2 (Lind, et al., 2010), the critical t-value is ± 2.20 for p<0.05. As a result, none of the GLOBE Societal Values scales are solely and significantly correlated with a country’s placement on the Forrester ladder. Of all the correlations, only those in Table 4 had a t-value ± 2.20 and were deemed to be statistically significant. Table 9: Statistically Significant Correlation Coefficients and Associated t-Scores*
Creators Critics Collectors Joiners Spectators Inactives
GE - Values -0.7141
t=-3.3830-0.5901
t=-2.4240-0.6075
t=-2.5367
A - Values 0.5934
t=2.44510.6241
t=2.64950.6587
t=2.9037 0.6293
t=2.6858
CI - Values -0.5763
t=-2.3386-0.5538
t=-2.20600.6444
t=2.7951
PD - Values 0.6169
t=2.6000
UA - Values 0.6000
t=2.4873
*(p<0.05)

ijcrb.webs.com INTERDISCIPLINARY JOURNAL OF CONTEMPORARY RESEARCH IN BUSINESS
COPY RIGHT © 2011 Institute of Interdisciplinary Business Research
24
AUGUST 2011 VOL 3, NO 4
Of the statistically significant relationships illustrated in Table 9 above, regression analyses were ran and Table 10 was created to illustrate the R2 value and the standard error for each relationship. Table 10: Correlation Coefficients (r) with t-Scores, R2 values, and Standard Error
Creators Critics Collectors Joiners Spectators Inactives
GE - Values r =-0.7141t =-3.3830R2 = 0.51
SE = 9
r =-0.5901t =-2.4240R2 = 0.35
SE = 9
r =-0.6075t =-2.5367R2 = 0.37
SE = 8
A - Values r =0.5934t =2.4451R2 =0.35 SE = 10
r =0.6241t =2.6495R2 = 0.39
SE = 8
r =0.6587t =2.9037R2 = 0.43
SE = 7
r =0.6293t =2.6858R2 = 0.40
SE = 9
CI - Values r =-0.5763t =-2.3386R2 = 0.33
SE = 10
r =-0.5538t =-2.2060R2 = 0.31
SE = 10
r =0.6444t =2.7951R2 = 0.42
SE = 9
PD - Values r =0.6169t =2.6000R2 = 0.38
SE = 7
UA - Values r =0.6000t =2.4873R2 =0.36 SE = 10
Hair, et al. (2006) suggests that R2 values less than 0.50 result in less than acceptable models. When a model yields an R2 value that is less than 0.50, more than 0.50 of the variance in the dependent variable is attributed to spurious variables or error (Joseph F. Hair, Jr., et al., 2006). With this in mind, only the GLOBE Societal Values score for Gender Egalitarianism yielded meaningful results in predicting a country’s placement on the Creators rung of the Forrester ladder as illustrated in Table 5. None of the other relationships as illustrated in Table 5 above have R-squared values above the 0.50 threshold. As a result of the single significant correlation and appropriate R-square between GE-Values and placement on the Creator rung, below is the regression equation for predicting a society’s position on the Creator rung of the Forrester ladder:
Creator Score = -19.5*(GLOBE GE-Values score) +116 (Formula 1) As is the case with any independent/dependent relationship, a more appropriate ‘range’ of a society’s placement on the Creator rung should be developed. This could easily be accomplished using a typical confidence interval to create the upper and lower bounds:

ijcrb.webs.com INTERDISCIPLINARY JOURNAL OF CONTEMPORARY RESEARCH IN BUSINESS
COPY RIGHT © 2011 Institute of Interdisciplinary Business Research
25
AUGUST 2011 VOL 3, NO 4
Upper Bound Creator Score: (Formula 1) + (t-score)*SE (Formula 2) Lower Bound Creator Score: (Formula 1) – (t-score)*SE (Formula 3)
An appropriate t-score for Formulas 2 and 3 above would be 2.20 which is a typical t-score for degrees of freedom of n-2 at 95% confidence (alpha = 0.05). As stated earlier, the standard error (SE) for this particular data set is nine. To summarize the analysis of this study, several tables were developed to track the author’s adherence to the following steps as stated in the methodology section of this paper:
1. Creating Pearson’s Coefficient of Correlation. 2. Test for significance of Pearson’s r. 3. Regression analysis. 4. R-squared analysis.
The final result was one significant and possibly meaningful relationship between Gender Egalitarianism Values (independent variable) and a society’s placement on the Creator rung of the Forrester ladder. Conclusions Although the authors believe that culture influences behaviors, this study only revealed one significant relationship between GLOBE’s Value scores and placement along the Forrester ladder. However, as stated in the methodology section, this exploratory research effort should not be interpreted as conclusive. Further research is appropriate. To that end, the authors suggest that researchers consider further exploration of the culture’s effects on a society’s placement on the various rungs of the Forrester ladder. It may be that other cross-cultural models such as GLOBE Societal Practice scales, Schwartz, Triandis, or others may yield different results.

ijcrb.webs.com INTERDISCIPLINARY JOURNAL OF CONTEMPORARY RESEARCH IN BUSINESS
COPY RIGHT © 2011 Institute of Interdisciplinary Business Research
26
AUGUST 2011 VOL 3, NO 4
References Chhoka, J.S., Brodbeck, F.C., & House, R.J. (2008). Introduction to leadership across
the world: The GLOBE book of in-depth studies of 25 societies. Mahwah, NJ:Lawrence Erlbaum Associates.
Davenport, T. H., & Prusak, L. (1998). Working knowledge : how organizations manage what they know. Boston, Mass: Harvard Business School Press.
Girard, J.P., & Bertsch, A. (2011). Exploring Cross-Cultural Differences in Social Knowledge Creation and Exchange: A Preliminary Examination. International Journal of Management & Information Systems. 15(1).
Girard, J. P., & Girard, J. L. (2009). A Leader’s Guide to Knowledge Management: Drawing on the Past to Enhance Future Performance. New York: Business Expert Press.
Hair, J. F., Jr., Babin, B., Money, A. H., & Samouel, P. (2003). Essentials of Business Research Methods. New Jersey: Wiley.
Hair, J. F., Jr., Black, W. C., Babin, B. J., Anderson, R. E., & Tatham, R., L. (2006). Multivariate Data Analysis (6th ed.). Upper Saddle River, NJ: Pearson Prentice Hall.
Harnett, D. L., & Horrell, J. F. (1998). Data, Statistics, and Decision Models. New York: Wiley.
Hofstede, G. (1980a). Culture’s Consequences: International Differences in Work-Related Values. London: Sage.
Hofstede, G. (1996). Images of Europe: Past, Present, and Future. In M. Warner & P. Joynt (Eds.), Managing Across Cultures: Issues and Perspectives. Boston, MA: International Thomson Business Press.
Hofstede, G. (2001). Culture’s Consequences: Comparing Values, Behaviors, Institutions, and Organizations Across Nations. London: Sage Publications.
Holt, G. (2007). Organizational Culture and Performance: A Survey in Norway and Pakistan. Henley Management College, Henley-on-Thames.
House, J.H. (2008). Preface to leadership across the world: The GLOBE book of in-depth studies of 25 societies. Mahwah, NJ:Lawrence Erlbaum Associates.
Leung, K (2008). Foreword to leadership across the world: The GLOBE book of in-depth studies of 25 societies. Mahwah, NJ:Lawrence Erlbaum Associates.
Li, C., & Bernoff, J. (2008). Groundswell : winning in a world transformed by social technologies. Boston, Mass.: Harvard Business Press.
Lind, D. A., Marchal, W. G., & Wathen, S. A. (2010). Statistical Techniques in Business & Economics (14th ed.). New York: McGraw Hill Irwin.
Malhotra, N. K. (2007). Marketing Research: An Applied Orientation (5th ed. ed.). Upper Saddle River, NJ: Pearson Prentice Hall.
Nonaka, I., & Takeuchi, H. (1995). The knowledge-creating company : how Japanese companies create the dynamics of innovation. New York :: Oxford University Press.
O'Dell, C., & Grayson, C. J. (1998). If only we knew what we know: identification and transfer of internal best practices. California Management Review, 40(3), 154-174.
Tapscott, D., & Williams, A. D. (2006). Wikinomics : how mass collaboration changes everything. New York: Portfolio.
Zikmund, A. G., & Babin, B. J. (2007). Exploring Marketing Research (9th ed. ed.). Mason, OH: Thomson South-western.