august 2019 - ablamc.com · the outgoing month of august 2019 remained very volatile due to various...
TRANSCRIPT

FUND MANAGER'S REPORT, August 2019
This publication is for informational purposes only and nothing here in should be construed as a solicitation, recommendation or an offer to buy or sell any fund. All Investments in mutual funds are subject to market risks. The NAV based prices of units and any dividends /returns there on are dependent on forces and factors affecting the capital markets. These may go up or down based on market conditions. Past performance is not necessarily indicative of future results. Please read the offering document to understand the investment policies and the risk involved including risk disclosures for special features (MUFAP’S RECOMMENDED FORMAT)
August 2019

Last
Reported
Month
Current
Month
Previous
MonthYTD
PKRV Yields (%) 6 M 1 Yr 3 Yr 5 Yr 10 Yr
CPI Inflation August 10.50% 8.40% 9.44% August 31, 2019 13.94 14.11 13.85 13.17 12.80
Trade Deficit (USD mn) July (1,847) (2,197) (1,847) July 31, 2019 13.90 14.05 14.02 13.60 13.49
Remittances (USD mn) July 2,039 1,651 2,039 Change (bps) 4 6 -17 -43 -69
Current A/C (USD mn) July (579) (921) (579) Source : FMA
FDI (USD mn) July 73 130 73
Tax Collection ** (PKR bn) August 302 278 580
M2 Growth* August -1.83%
FX Reserves* (USD bn) August 15.6 Aug-19 Jul-19 M/M 1 Yr Low 1 Yr High
Source SBP, FBS KSE - 100 Index 29,672 31,938 -7.1% 28,765 42,004
* Latest monthly figures Avg. Daily Vol. (mn) 113 77 47% 39 461
** Provisional figures Avg. Daily Val. (USD mn) 26 18 48% 9 172
2020E PE(X) 5.6
2020E DY 11.9%
Source: PSX, Bloomberg
GOVERNMENT SECURITIES
EQUITY MARKET PERFORMANCE
ECONOMIC SUMMARY
Worst Performing Month of 2019
Inverted Yield Curve
INFOCUS FUND MANAGER'S REPORT, FEBRUARY 2014
ECONOMY AND CAPITAL MARKETS UPDATE
Improving Current Account The start of the FY20 has revealed the effects of the policy measures taken by the government. One of the major reliefs is witnessed on front of current account where CAD clocked in at USD 579mn during the July 2019, down 73%YoY, 37%MoM amid i) tremendous reduction in trade deficit of goods (47%YoY) on the back of massive PKR devaluation against greenback and lower imports owing to deferred oil facility and nonsignificant machinery imports and ii) increase in worker remittances (3%YoY). The reserves of the SBP have improved since entering into the IMF program standing at USD 8,271mn as at Aug 23, 2019 against USD 7,280mn, up 13.6%MoM. Total reserves of the country stand at USD 15,629mn. On the fiscal side, government has set a very optimistic tax collection target of PKR 5.5tr while FBR has implemented various reforms. As against the target of PKR 352bn projected for the month of Aug’19, the FBR has managed to collect provisionally PKR 302bn, which is much below the government expectation. This took the total shortfall in revenue collection to PKR 64bn in just two months of the current fiscal year. FBR will now have to collect PKR 492bn in next month in order to meet 1QFY20 tax collection target of PKR 1,072bn under IMF program. Going forward, the main focus of government will be controlling the twin deficit and increasing the forex reserves to stabilize the economy. PM Imran Khan is expected to visit United Nations (UN) in the last week of Sep’19 to attend the UN General Assembly session where he is expected to highlight Kashmir issue. PM visit will be very important before the FATF review due in Oct 2019.
The government has introduced the new CPI methodology where it segregated the national CPI into urban and rural sections while changing the CPI basket and weights. As per new methodology, the CPI clocked in at 10.49%YoY against 6.2%YoY in SPLY. The increase was on the back of i) higher non-perishable food prices and ii) enhanced electricity, transport and fuel prices. On the domestic monetary policy front, rates are near its peak in our view. The real interest rate stands at 2.76% and expected to rise in the light of fiscal measures and structural reforms taken by the Govt. to address economic challenges which will ultimately help in taming down the inflation. We expect the SBP to maintain a status quo in the upcoming monetary policy statement in Sep’19 while market may see a rate cut in Nov’19 MPS. Overall, money market remained fairly liquid. A tilt of market towards PIBs and 12 month T-Bills is witnessed indicating the peaked interest rates environment. T-Bills worth PKR 3,341bn matured during the month against the rollover and target of PKR 1,887bn and 3,100bn respectively. There were no PIBs maturity occurred during the month. Moreover, SBP continuously kept injecting liquidity through open market operations where SBP closed the position as a net lender of PKR 1,230bn in a single reverse repo arrangement at a cut off rate of 13.32% out of total 10 reverse repo arrangements. There was no repo arrangement during the month. In addition to this, secondary market PKRVs increased by 3bps to 9bps across different tenors. It is important to note that after the announcement of inflation reading as per new methodology, money market rates have been adjusted downwards in an anticipation of cut in interest rates going forward.
The outgoing month of August 2019 remained very volatile due to various reasons like 1) revocation of article 370 by India, 2) rumors of putting Pakistan on Blacklist by FATF Asia Pacific Group, 3) Uncertainty in international markets amid US-China trade war and 4) Govt. intentions to offload OGDC and PPL holdings. The benchmark KSE-100 index declined by 7.10% MoM or 2,266 points which resulted in 7th consecutive monthly decline of 2019. The month of August remained the worst performing month of 2019, despite a short spell in between when index rose by 11% from month’s low. Short-lived bull run during four trading sessions (Aug 19-22) was on the back of 1) extension in the tenure of existing COAS which signals civil-military harmony, 2) improvement in CAD and 3) news regarding clipping NAB’s authority to carry out investigations against business community. Resultantly, market activity improved significantly by 47.4% MoM to 112.8mn shares along with ~48% jump in average value traded to USD26.2mn. Foreigners remained net sellers amounting to USD3.52mn during the month. On the local front, Mutual Funds and Insurance companies remained the largest net-sellers with total outflow of USD34mn and USD10mn, respectively. However, Individuals, Banks and Companies accumulated USD28mn, USD8mn and USD6mn worth of shares, respectively. Currently, the market is trading at an attractive FY20 PE of 5.6x and offering a healthy dividend yield of 11.9%.
INFOCUS
FUND MANAGER'S REPORT, August 2019

FUND MANAGER'S REPORT, August 2019
This publication is for informational purposes only and nothing here in should be construed as a solicitation, recommendation or an offer to buy or sell any fund. All Investments in mutual funds are subject to market risks. The NAV based prices of units and any dividends /returns there on are dependent on forces and factors affecting the capital markets. These may go up or down based on market conditions. Past performance is not necessarily indicative of future results. Please read the offering document to understand the investment policies and the risk involved including risk disclosures for special features (MUFAP’S RECOMMENDED FORMAT)
PerformanceAugust 31,
2019YTD* St. Dev** Sharpe Rato*** Alpha
ABL-IIF 11.77% 11.48% 0.50% -10.50% 5.28%BenchMark 5.71% 5.57% 0.09% -21.24% N/A
*Funds returns computed on NAV to NAV with the dividend reinvestment (excluding sales load) ** 12M Trailing Data ***3MPKRV used as RFR
ASSET ALLOCATIONJuly 31, 2019 August 31, 2019
Cash 74.06 58.09Corporate Sukuk 23.94 24.75Others including Receivables 2.00 17.17Total 100% 100%Others Amount Invested by Fund of Funds is Rs. 1395.10 million.
_ 3 month 6 month 1 Year 3 Year 5 Year Since Inception
ABL-IIF 11.88% 10.83% 9.55% 6.94% 7.69% 11.27%
BenchMark 5.44% 5.08% 4.18% 3.12% 4.15% 5.64%*Funds returns computed on Simple annualized basis / Performance data does not include cost incurred by investor in the form of sales load
CREDIT QUALITY OF PORTFOLIO (% OF TOTAL ASSETS)
Investment Commitee Members
Alee Khalid Ghaznavi - CEOSaqib Matin, ACA - CFO & CSTanweer Haral - Head of Risk ManagementFahad Aziz, Head of Fixed IncomeAli Ahmed Tiwana - Head of EquityM. Tahir Saeed, CFA - Head of ResearchM. Abdul Hayee, CFA - Fund ManagerAbdul Rehman Tahir - Fund Manager
BASIC FUND INFORMATIONFund Type Open-endCategory Islamic Income SchemeLaunch Date July 31,2010Net Assets PKR mn as at 4414.73 August 31, 2019Net Assets (Excluding FoF Investments)
PKR mn as at 3019.63 August 31, 2019
NAV 10.3954 as at August 31, 2019
Benchmark**Average of 6 Month Deposit Rate of 3 A rated Islamic Banks
Dealing Days As Per Banking DaysCut-off time 4:00 PMPricing Mechanism ForwardManagement Fees 1 % p.aLoad upto 1.5% (Front-end), NIL (Back-end)Trustee Central Depository Company of Pakistan Ltd (CDC)Auditor Deloitte - Yousuf Adil. Chartered Accountants
Asset Manager RatingAM2 ++ (Stable Outlook) (JCR-VIS) December 31, 2018
Risk Profile of the Fund LowFund Stability Rating A(f) (JCR-VIS) January 16, 2018Fund Manager Abdul Rehman TahirListing Pakistan Stock Exchange
TECHNICAL INFORMATIONLeverage NILWeighted average time to maturity of net assets 636.9
TOP HOLDINGS (% OF TOTAL ASSETS) August 31, 2019
August:
DHCL SUKUK 16-NOV-17 9.95
DIB SUKUK (14-07-2017) 6.09
EPCL/SUK/110419 5.87
DHCL SUKUK II (01-03-2018) 2.57
IBL SUKUK (15-NOV-2017) 0.22
GOP IJARA SUKUK - 19 0.03
MEBL SUKUK II 0.02
Total 24.75
*DETAILS OF NON-COMPLIANT INVESTMENT WITH THE INVESTMENT CRITERIA OF ASSIGNED CATEGORY
Non-CompliantTypeof Investment
ExposureLimit % of NetAssets % of TotalAssetsExcess Exposure(% of Net Asset)
Exposure(% of Total Asset)
- - - - - - -*The scheme holds certain non-compliant investments. Before making any investment decision, investors should review this document and latest Financial Statements.
INVESTMENT OBJECTIVETo provide investors with an opportunity to earn higher income over the medium to long-term by investing in a diversified portfolio consisting of different money market and debt instruments permissible under the Shariah principles.
FUND MANAGER'S COMMENTSDuring the month of August’19, ABL Islamic Income Fund posted an annualized return of 11.77% against the benchmark return of 5.71%. On YTD basis the fund generated a return of 11.48% against the benchmark return of 5.57%, the fund therefore continued to significantly outperform the benchmark return on both monthly and YTD basis. On the asset allocation side, the fund had most of its exposure in Cash which closed at 58.09% at the end of August’19 whereas on the corporate debt side, exposure in Sukuks increased from 23.94% in July’19 to 24.75% in Aug’19. The Scheme has maintained the provision against Sindh Workers’ Welfare Fund’s Liability to the tune of Rs. 4.679 million, had the same not been made, the NAV per unit of the scheme would have been higher by Rs. 0.0110 per unit. The Scheme has also maintained Total expense ratio (TER) 0.24% (0.03% representing Government Levies and SECP Fee etc).

FUND MANAGER'S REPORT, August 2019
This publication is for informational purposes only and nothing here in should be construed as a solicitation, recommendation or an offer to buy or sell any fund. All Investments in mutual funds are subject to market risks. The NAV based prices of units and any dividends /returns there on are dependent on forces and factors affecting the capital markets. These may go up or down based on market conditions. Past performance is not necessarily indicative of future results. Please read the offering document to understand the investment policies and the risk involved including risk disclosures for special features (MUFAP’S RECOMMENDED FORMAT)
PerformanceAugust 31,
2019YTD* St. Dev** Sharpe Rato*** Alpha
ABL-IF 11.97% 11.19% 0.50% -10.50% -3.40%BenchMark 14.07% 10.84% 0.09% -21.24% N/A
*Funds returns computed on NAV to NAV with the dividend reinvestment (excluding sales load) ** 12M Trailing Data ***3MPKRV used as RFR
ASSET ALLOCATIONJuly 31, 2019 August 31, 2019
Cash 51.13 56.40TFCs 27.54 26.29Others including Receivables 2.74 14.54T-Bills 17.54 1.75PIBs 1.05 1.02Total 100% 100%Others Amount Invested by Fund of Funds is Rs. 450.81 million.
_ 3 month 6 month 1 Year 3 Year 5 Year Since Inception
ABL-IF 10.65% 9.75% 8.47% 6.61% 9.17% 15.57%
BenchMark 13.55% 12.47% 11.23% 8.32% 7.99% 10.10%*Funds returns computed on Simple annualized basis / Performance data does not include cost incurred by investor in the form of sales load
CREDIT QUALITY OF PORTFOLIO (% OF TOTAL ASSETS)
Investment Commitee Members
Alee Khalid Ghaznavi - CEOSaqib Matin, ACA - CFO & CSTanweer Haral - Head of Risk ManagementFahad Aziz, Head of Fixed IncomeAli Ahmed Tiwana - Head of EquityM. Tahir Saeed, CFA - Head of ResearchM. Abdul Hayee, CFA - Fund ManagerAbdul Rehman Tahir - Fund Manager
BASIC FUND INFORMATIONFund Type Open-endCategory Income SchemeLaunch Date September 20,2008Net Assets PKR mn as at 1855.4 August 31, 2019Net Assets (Excluding FoF Investments)
PKR mn as at 1404.59 August 31, 2019
NAV 10.2633 as at August 31, 2019Benchmark 6 Months KIBORDealing Days As Per Banking DaysCut-off time 4:00 PMPricing Mechanism ForwardManagement Fees 1.5% p.aLoad upto 1.5%(Front-end),NIL(Back-end)Trustee Central Depository Company of Pakistan Ltd (CDC)Auditor A.F. Ferguson - Chartered Accountants
Asset Manager RatingAM2++ (Stable Outlook) (JCR-VIS) 31 December, 2018
Risk Profile of the Fund LowFund Stability Rating A(f) (JCR-VIS) January 16, 2018Fund Manager Fahad AzizListing Pakistan Stock Exchange
TECHNICAL INFORMATIONLeverage NILWeighted average time to maturity of net assets 544
TOP HOLDINGS (% OF TOTAL ASSETS) August 31, 2019
JSBL TFC 14-12-2016 9.17
BOP-TFC-ABLIF 7.67
JSCL10 5.15
DHCL SUKUK 16-NOV-17 4.30
Total 26.29
*DETAILS OF NON-COMPLIANT INVESTMENT WITH THE INVESTMENT CRITERIA OF ASSIGNED CATEGORY
Non-CompliantTypeof Investment
ExposureLimit % of NetAssets % of TotalAssetsExcess Exposure(% of Net Asset)
Exposure(% of Total Asset)
JSBLPer Party Exposure
10% 10.77% 9.17% 0.77% 0%
*The scheme holds certain non-compliant investments. Before making any investment decision, investors should review this document and latest Financial Statements.
INVESTMENT OBJECTIVEThe objective is to earn competitive risk adjusted rate of return by investing in a blend of short, medium, and long-term fixed income and debt instruments, both within and outside Pakistan.
FUND MANAGER'S COMMENTSDuring the month of August’19, ABL Income Fund posted a return of 11.97% against the benchmark return of 14.07% thereby underperforming the benchmark by 210bps%. On the Asset Allocation side, fund’s exposure in cash increased to 56.40% in Aug’19 from 51.13% in July’19. Exposure in TFCs however reduced marginally from 27.54% in July’19 to 26.29% in Aug’19. Exposure in PIB remained unchanged to 1.02% in Aug’19 from 1.05% in July’19. The Scheme has maintained the provision against Sindh Workers’ Welfare Fund’s Liability to the tune of Rs 4.182 million, had the same not been made, the NAV per unit of the scheme would have been higher by Rs 0.0231 per unit. The Scheme has also maintained Total expense ratio (TER) 0.41% (0.05% representing Government Levies and SECP Fee etc).

FUND MANAGER'S REPORT, August 2019
This publication is for informational purposes only and nothing here in should be construed as a solicitation, recommendation or an offer to buy or sell any fund. All Investments in mutual funds are subject to market risks. The NAV based prices of units and any dividends /returns there on are dependent on forces and factors affecting the capital markets. These may go up or down based on market conditions. Past performance is not necessarily indicative of future results. Please read the offering document to understand the investment policies and the risk involved including risk disclosures for special features (MUFAP’S RECOMMENDED FORMAT)
PerformanceAugust 31,
2019YTD* St. Dev** Sharpe Rato*** Alpha
ABL-CF 12.65% 12.53% 0.93% -3.89% -0.10%BenchMark 12.77% 12.32% 0.09% -37.33% 0.00%
*Funds returns computed on NAV to NAV with the dividend reinvestment (excluding sales load) ** 12M Trailing Data ***3MPKRV used as RFR
ASSET ALLOCATIONJuly 31, 2019 August 31, 2019
Cash 66.25 83.43Investment in Money market 23.81 13.38Commercial Paper 0.00 2.07Others including Receivables 3.58 1.12T-Bills 6.36 0.00Total 100% 100%Others Amount Invested by Fund of Funds is Rs. 43.47 million.
_ 3 month 6 month 1 Year 3 Year 5 Year Since Inception
ABL-CF 12.39% 11.37% 10.12% 8.77% 9.09% 12.64%
BenchMark 12.11% 11.16% 9.73% 6.85% 5.97% 6.45%*Funds returns computed on Simple annualized basis / Performance data does not include cost incurred by investor in the form of sales load
CREDIT QUALITY OF PORTFOLIO (% OF TOTAL ASSETS)
Investment Commitee Members
Alee Khalid Ghaznavi - CEOSaqib Matin, ACA - CFO & CSTanweer Haral - Head of Risk ManagementFahad Aziz, Head of Fixed IncomeAli Ahmed Tiwana - Head of EquityM. Tahir Saeed, CFA - Head of ResearchM. Abdul Hayee, CFA - Fund ManagerAbdul Rehman Tahir - Fund Manager
BASIC FUND INFORMATIONFund Type Open-endCategory Money Market SchemeLaunch Date July 31,2010Net Assets PKR mn as at 22304.99 August 31, 2019Net Assets (Excluding FoF Investments)
PKR mn as at 22261.52 August 31, 2019
NAV 10.2621 as at August 31, 2019
Benchmark**70%-Avg of 3M PKRV rates + 30% 3M Avg Deposit Rate of 3 AA rated banks
Dealing Days As Per Banking DaysCut-off time 4:00 PMPricing Mechanism Backward
Management Fees10% of gross earnings subject to a minimum fee of 0.75% and a maximum fee of 1.00% of average daily net assets
Load NIL (Front-end),NIL (Back-end)Trustee Central Depository Company of Pakistan Ltd (CDC)Auditor A.F. Ferguson - Chartered Accountants
Asset Manager RatingAM2++ (Stable Outlook) (JCR-VIS)December 31,2018
Risk Profile of the Fund LowFund Stability Rating AA(f) (JCR-VIS) January 16,2018Fund Manager Fahad AzizListing Pakistan Stock Exchange
TECHNICAL INFORMATIONLeverage NILWeighted average time to maturity of net assets 9.33
*DETAILS OF NON-COMPLIANT INVESTMENT WITH THE INVESTMENT CRITERIA OF ASSIGNED CATEGORY
Non-CompliantTypeof Investment
ExposureLimit % of NetAssets % of TotalAssetsExcess Exposure(% of Net Asset)
Exposure(% of Total Asset)
- - - - - - -*The scheme holds certain non-compliant investments. Before making any investment decision, investors should review this document and latest Financial Statements.
INVESTMENT OBJECTIVEThe objective of ABL-CF is to provide investors, consistent returns with a high level of liquidity, through a blend of money market and sovereign debt instruments.
FUND MANAGER'S COMMENTSDuring the month of August’19, ABL Cash Fund posted an annualized return of 12.65% against the benchmark return of 12.77% thereby under-performing the benchmark by 12bps. On the Asset Allocation side the fund maintained majority of its exposure in Cash increasing the allocation from 66.25% in July’19 to 83.43% in August’19, Consequently the exposure in T-bills reduced to 0% in Aug’19 from 6.36% in July’19. The fund has investments in money market instruments with a total exposure of 13.38%. The Scheme has maintained the provision against Sindh Workers’ Welfare Fund’s Liability to the tune of Rs. 3.526 million, had the same not been made, the NAV per unit of the scheme would have been higher by Rs. 0.0016 per unit. The Scheme has also maintained Total expense ratio (TER) 0.21% (0.03% representing Government Levies and SECP Fee etc).

FUND MANAGER'S REPORT, August 2019
This publication is for informational purposes only and nothing here in should be construed as a solicitation, recommendation or an offer to buy or sell any fund. All Investments in mutual funds are subject to market risks. The NAV based prices of units and any dividends /returns there on are dependent on forces and factors affecting the capital markets. These may go up or down based on market conditions. Past performance is not necessarily indicative of future results. Please read the offering document to understand the investment policies and the risk involved including risk disclosures for special features (MUFAP’S RECOMMENDED FORMAT)
PerformanceAugust 31,
2019YTD* St. Dev** Sharpe Rato*** Alpha
ABL-GSF-B 12.77% 11.71% 0.52% -9.25% -2.73%BenchMark 13.93% 13.65% 0.09% -23.38% N/A
*Funds returns computed on NAV to NAV with the dividend reinvestment (excluding sales load) ** 12M Trailing Data ***3MPKRV used as RFR
ASSET ALLOCATIONJuly 31, 2019 August 31, 2019
Cash 31.67 45.37T-Bills 51.84 42.44TFCs 11.53 10.09PIBs 4.30 1.56Others including Receivables 0.66 0.54Total 100% 100%Others Amount Invested by Fund of Funds is Rs. 150.04 million.
_ 3 month 6 month 1 Year 3 Year 5 Year Since Inception
ABL-GSF-B 11.23% 9.64% 8.92% 7.39% 10.13% 12.70%
BenchMark 13.38% 12.31% 11.01% 7.82% 7.29% 7.97%*Funds returns computed on Simple annualized basis / Performance data does not include cost incurred by investor in the form of sales load
CREDIT QUALITY OF PORTFOLIO (% OF TOTAL ASSETS)
Investment Commitee Members
Alee Khalid Ghaznavi - CEOSaqib Matin, ACA - CFO & CSTanweer Haral - Head of Risk ManagementFahad Aziz, Head of Fixed IncomeAli Ahmed Tiwana - Head of EquityM. Tahir Saeed, CFA - Head of ResearchM. Abdul Hayee, CFA - Fund ManagerAbdul Rehman Tahir - Fund Manager
BASIC FUND INFORMATIONFund Type Open-endCategory Income SchemeLaunch Date November 28,2011Net Assets PKR mn as at 2527.92 August 31, 2019Net Assets (Excluding FoF Investments)
PKR mn as at 2377.88 August 31, 2019
NAV 10.0621 as at August 31, 2019Benchmark 6 Months PKRV ratesDealing Days As Per Banking DaysCut-off time 4:00 PMPricing Mechanism ForwardManagement Fees Class-B unit 1.25% p.a.Load Upto 1.5% (Front-end), Nil (Back-end)Trustee Central Depository Company of Pakistan Ltd (CDC)Auditor A.F. Ferguson - Chartered Accountants
Asset Manager RatingAM2 ++ (Stable Outlook) (JCR-VIS) December 31,2018
Risk Profile of the Fund LowFund Stability Rating A(f) (JCR-VIS) January 16, 2018Fund Manager Fahad AzizListing Pakistan Stock Exchange
TECHNICAL INFORMATIONLeverage NILWeighted average time to maturity of net assets 370.9
TOP HOLDINGS (% OF TOTAL ASSETS) August 31, 2019
BOP-TFC-GSF 3.86
DHCL SUKUK 16-NOV-17 2.68
JSCL10 1.85
DHCL SUKUK II (01-03-2018) 1.55
JSCL TFC (24-06-16) 0.16
Total 10.1
*DETAILS OF NON-COMPLIANT INVESTMENT WITH THE INVESTMENT CRITERIA OF ASSIGNED CATEGORY
Non-CompliantTypeof Investment
ExposureLimit % of NetAssets % of TotalAssetsExcess Exposure(% of Net Asset)
Exposure(% of Total Asset)
- - - - - - -*The scheme holds certain non-compliant investments. Before making any investment decision, investors should review this document and latest Financial Statements.
INVESTMENT OBJECTIVEThe objective of the scheme is to deliver optimal risk adjusted returns by investing mainly in mix of short to long term Government Securities and other debt Instruments.
FUND MANAGER'S COMMENTSDuring the month of August’19, ABL Government Securities Fund posted a return of 12.77% against the benchmark return of 13.93% thereby underperforming the benchmark by over 116 bps%. On the Asset Allocation side, the fund’s exposure in Cash increased from 31.67% in July’19 to 45.37% in Aug’19, exposure in T-bills reduced from 51.84% in July’19 to 42.44% in Aug’19 whereas exposure in PIBs reduced to 1.56% in August from 4.3% in July’19. Fund's exposure in TFCs also reduced to 10.09% in August’19 from 11.53% in July’19. The Scheme has maintained the provision against Sindh Workers’ Welfare Fund’s Liability to the tune of Rs. 10.609 million, had the same not been made, the NAV per unit of the scheme would have been higher by Rs 0.0431 per unit. The Scheme has also maintained Total expense ratio (TER) 0.36% (0.04% representing Government Levies and SECP Fee etc).

FUND MANAGER'S REPORT, August 2019
This publication is for informational purposes only and nothing here in should be construed as a solicitation, recommendation or an offer to buy or sell any fund. All Investments in mutual funds are subject to market risks. The NAV based prices of units and any dividends /returns there on are dependent on forces and factors affecting the capital markets. These may go up or down based on market conditions. Past performance is not necessarily indicative of future results. Please read the offering document to understand the investment policies and the risk involved including risk disclosures for special features (MUFAP’S RECOMMENDED FORMAT)
PerformanceAugust 31, 2019 YTD* St. Dev** Beta*** Alpha
ABL-IDSF -10.87% -16.26% 19.64% 0.80% 3.48%BenchMark -8.59% -14.58% 23.88% 1.00% N/A
*Funds returns computed on NAV to NAV with the dividend reinvestment (excluding sales load) ** 12M Trailing Data ***3MPKRV used as RFR
ASSET ALLOCATIONJuly 31, 2019 August 31, 2019
Stock/Equity 96.00% 91.62%Others 1.77% 6.42%Bank Balances 2.23% 1.97%Total 100% 100%Others Amount Invested by Fund of Funds is Rs. million.558.30
_ 3 month 6 month 1 Year 3 Year 5 Year Since Inception
ABL-IDSF -21.27% -28.04% -31.24% 0.00% 0.00% -40.19%
BenchMark -20.62% -29.44% -34.72% N/A N/A -42.73%*Funds returns computed on absolute annualized basis / Performance data does not include cost incurred by investor in the form of sales load
SECTOR ALLOCATION (% OF TOTAL ASSETS)
Investment Commitee Members
Alee Khalid Ghaznavi - CEOSaqib Matin, ACA - CFO & CSTanweer Haral - Head of Risk ManagementFahad Aziz, Head of Fixed IncomeAli Ahmed Tiwana - Head of EquityM. Tahir Saeed, CFA - Head of ResearchM. Abdul Hayee, CFA - Fund ManagerAbdul Rehman Tahir - Fund Manager
BASIC FUND INFORMATIONFund Type Open-endCategory Islamic Equity SchemeLaunch Date December 20,2016Net Assets PKR mn as at 558.25 August 31, 2019Net Assets (Excluding FoF Investments)
PKR mn as at -.05 August 31, 2019
NAV 5.8647 as at August 31, 2019Benchmark KMI-30 IndexDealing Days As Per Banking DaysCut-off time 4:00 PMPricing Mechanism ForwardManagement Fees 2% p.aLoad NIL (Front-end), NIL (Back-end)Trustee MCB Financial Services Limited(MCBFSL)Auditor M/S. A.F. Ferguson & Co, Chartered Accountants
Asset Manager RatingAM2++ (Stable outlook) (JCR-VIS) December 31, 2018
Risk Profile of the Fund HighPerformance Rating N/AFund Manager M. Abdul Hayee, CFAListing Pakistan Stock Exchange
TOP TEN HOLDINGS (% OF TOTAL ASSETS) July 31, 2019 August 31, 2019
ENGRO CORPORATION 8.55% 12.75%
Mari Gas Company Limited 14.45% 12.27%
Oil & Gas Dev.Co 14.35% 12.23%
Meezan Bank Ltd. 13.14% 10.77%
Pak Petroleum Ltd. 8.06% 7.86%
Fauji Fertilizer Company Limited. 5.15% 7.66%
Hub Power Company Limited 8.22% 7.61%
ENGRO FERTILIZERS LTD 6.33% 5.41%
Nishat Mills Ltd. 4.01% 4.33%
Pakistan State Oil Co. Ltd. 2.46% 2.38%
*DETAILS OF NON-COMPLIANT INVESTMENT WITH THE INVESTMENT CRITERIA OF ASSIGNED CATEGORYNon-Compliant
Typeof Investment
ExposureLimit% of NetAssets
% of TotalAssets
Excess Exposure(% of Net Asset)
Exposure(% of Total Asset)
- - - - - - -*The scheme holds certain non-compliant investments. Before making any investment decision, investors should review this document and latest Financial Statements.
INVESTMENT OBJECTIVETo provide capital appreciation to investors of ‘Fund of Funds’ schemes by investing in Shariah compliant equity securities.
FUND MANAGER'S COMMENTSABL-IDSF decreased by 10.87% in Aug’19 against 8.59% decrease of the benchmark, reflecting an underperformance of 228 basis points. As at Aug’31, 2019 ABL-IDSF was 91.62% invested in equities and remaining in bank deposits. Market remained negative majority of the trading sessions, due to cross border tensions between Pakistan and India and rumors of putting Pakistan on Blacklist by FATF Asia Pacific Group. Foreigners, Mutual Funds and Insurance companies were Net sellers while Individuals, Banks and Companies were net buyers. E&P, IPPs and Textile sectors are expected to outperform the index due to expected earnings growth post recent PKR depreciation, while 7.5% hike in interest rates (since Jan’18) is estimated to result in significant jump in the banking sector’s earnings. Market is currently trading at P/E multiple of 5.6x as compared to regional average of ~13.1x portraying a significant upside potential. The Scheme has maintained the provision against Sindh Workers’ Welfare Fund’s Liability to the tune of Rs. 1.553million, had the same not been made, the NAV per unit of the scheme would have been higher by Rs. 0.0163 per unit. The Scheme has total expense ratio (TER) of 0.68% (0.08% representing Government Levies and SECP Fee etc.). TER also includes the provision of sales & marketing expenses with 0.4% p.a. of Net Assets amounting to PKR 0.515 million.

FUND MANAGER'S REPORT, August 2019
This publication is for informational purposes only and nothing here in should be construed as a solicitation, recommendation or an offer to buy or sell any fund. All Investments in mutual funds are subject to market risks. The NAV based prices of units and any dividends /returns there on are dependent on forces and factors affecting the capital markets. These may go up or down based on market conditions. Past performance is not necessarily indicative of future results. Please read the offering document to understand the investment policies and the risk involved including risk disclosures for special features (MUFAP’S RECOMMENDED FORMAT)
PerformanceAugust 31,
2019YTD* St. Dev** Beta*** Alpha
AFF -8.58% -12.25% N/A N/A -0.74%BenchMark -7.85% -11.37% N/A N/A N/A
*Funds returns computed on NAV to NAV with the dividend reinvestment (excluding sales load) ** 12M Trailing Data ***3MPKRV used as RFR
ASSET ALLOCATIONJuly 31, 2019 August 31, 2019
Stock/Equity 72.07% 96.20%Bank Balances 25.74% 2.45%Others 2.19% 1.35%Total 100% 100%Others Amount Invested by Fund of Funds is Rs. million.0.00
_ 3 month 6 month 1 Year 3 Year 5 Year Since Inception
AFF -15.36% -16.11% N/A N/A N/A -14.12%
BenchMark -14.67% -18.59% N/A N/A N/A -18.31%*Funds returns computed on absolute annualized basis / Performance data does not include cost incurred by investor in the form of sales load
SECTOR ALLOCATION (% OF TOTAL ASSETS)
Investment Commitee Members
Alee Khalid Ghaznavi - CEOSaqib Matin, ACA - CFO & CSTanweer Haral - Head of Risk ManagementFahad Aziz, Head of Fixed IncomeAli Ahmed Tiwana - Head of EquityM. Tahir Saeed, CFA - Head of ResearchM. Abdul Hayee, CFA - Fund ManagerAbdul Rehman Tahir - Fund Manager
BASIC FUND INFORMATIONFund Type Open-endCategory Asset Allocation SchemeLaunch Date November 23,2018Net Assets PKR mn as at 422 August 31, 2019Net Assets (Excluding FoF Investments)
PKR mn as at 422 August 31, 2019
NAV 8.5892 as at August 31, 2019
Benchmark*
Weighted avg daily return of KSE 100 index, (70% 3M PKRV + 30% 3M avg deposit rate of 3 AA ratedscheduled banks as selected by MUFAP), based on the fund’s actual allocation in equity, fixed income &money market instruments
Dealing Days Monday to FridayCut-off time 4:00 PMPricing Mechanism ForwardManagement Fees 2% p.aLoad Upto 3% (Front-end), NIL (Back-end)Trustee Central Depository Company of Pakistan Ltd (CDC)Auditor M/S. A.F. Ferguson & Co, Chartered Accountants
Asset Manager RatingAM2++ (Stable outlook) (JCR-VIS) December 31, 2018
Risk Profile of the Fund Moderate to HighPerformance Rating N/AFund Manager Ali Ahmed TiwanaListing Pakistan Stock Exchange
TOP TEN HOLDINGS (% OF TOTAL ASSETS) July 31, 2019 August 31, 2019
Oil & Gas Dev.Co 11.63% 14.52%
Pak Petroleum Ltd. 5.24% 12.87%
Hub Power Company Limited 7.38% 11.47%
UNITED BANK LIMITED 2.79% 9.37%
HABIB BANK LIMITED 6.41% 9.03%
BANK ALFALAH LTD 6.35% 6.50%
Pakistan State Oil Co. Ltd. 4.06% 6.37%
Mari Gas Company Limited 4.69% 5.33%
Meezan Bank Ltd. 5.79% 4.73%
Pakistan Oilfields Ltd. 1.19% 3.58%
*DETAILS OF NON-COMPLIANT INVESTMENT WITH THE INVESTMENT CRITERIA OF ASSIGNED CATEGORY
Non-CompliantTypeof Investment
ExposureLimit% of NetAssets
% of TotalAssets
Excess Exposure(% of Net Asset)
Exposure(% of Total Asset)
Listed Equity SecuritiesAsset Allocation
90% 98.17% 96.2% 8.17% 6.2%
Cash & Near Cash Instruments
Asset Allocation
10% 2.51% 2.45% -7.49% -7.55%
OGDCPer Party Exposure
10% 14.81% 14.52% 4.81% 4.52%
PPLPer Party Exposure
10% 13.14% 12.87% 3.14% 2.87%
HUBCPer Party Exposure
10% 11.71% 11.47% 1.71% 1.47%
Commercial BanksSector Exposure
25% 40.05% 39.24% 15.05% 14.24%
Oil & Gas Exploration Companies
Sector Exposure
25% 37.05% 36.3% 12.05% 11.3%
Govt. of PakistanGroup Exposure
35% 36.28% 35.55% 1.28% 0.55%
*The scheme holds certain non-compliant investments. Before making any investment decision, investors should review this document and latest Financial Statements.
INVESTMENT OBJECTIVETo seek long term capital appreciation through investments in equity stocks, primarily from the financial and energy sector / segment / industry, fixed income Instruments, Money Market Instruments based on market outlook.
FUND MANAGER'S COMMENTSAFF decreased by 8.58% in Aug’19 against 7.85% decrease of the benchmark, reflecting an underperformance of 73 basis points. At month end, the total exposure in Equities and Cash stood at 96.20% and 2.45% respectively. The Scheme has not maintained the provision against Sindh Workers’ Welfare Fund’s Liability due to the fund registration in Punjab region where SWWF is not applicable. The Scheme has total expense ratio (TER) of 0.75% (0.08% representing Government Levies and SECP Fee etc.). TER also includes the provision of sales & marketing expenses with 0.4% p.a. of Net Assets amounting to PKR 0.435 million.

FUND MANAGER'S REPORT, August 2019
This publication is for informational purposes only and nothing here in should be construed as a solicitation, recommendation or an offer to buy or sell any fund. All Investments in mutual funds are subject to market risks. The NAV based prices of units and any dividends /returns there on are dependent on forces and factors affecting the capital markets. These may go up or down based on market conditions. Past performance is not necessarily indicative of future results. Please read the offering document to understand the investment policies and the risk involved including risk disclosures for special features (MUFAP’S RECOMMENDED FORMAT)
PerformanceAugust 31,
2019YTD* St. Dev** Beta*** Alpha
ABL-SF -8.53% -14.05% 19.38% 1.01% 0.50%BenchMark -7.1% -12.48% 18.76% 1.00% N/A
*Funds returns computed on NAV to NAV with the dividend reinvestment (excluding sales load) ** 12M Trailing Data ***3MPKRV used as RFR
ASSET ALLOCATIONJuly 31, 2019 August 31, 2019
Stock/Equity 91.23% 91.72%Bank Balances 7.52% 7.00%Others 1.25% 1.28%Total 100% 100%Others Amount Invested by Fund of Funds is Rs. million.338.37
_ 3 month 6 month 1 Year 3 Year 5 Year Since Inception
ABL-SF -19.37% -24.75% -28.42% -25.88% 15.61% 397.11%
BenchMark -17.52% -24.02% -28.92% -25.46% -14.85% 122.61%*Funds returns computed on absolute annualized basis / Performance data does not include cost incurred by investor in the form of sales load
SECTOR ALLOCATION (% OF TOTAL ASSETS)
Investment Commitee Members
Alee Khalid Ghaznavi - CEOSaqib Matin, ACA - CFO & CSTanweer Haral - Head of Risk ManagementFahad Aziz, Head of Fixed IncomeAli Ahmed Tiwana - Head of EquityM. Tahir Saeed, CFA - Head of ResearchM. Abdul Hayee, CFA - Fund ManagerAbdul Rehman Tahir - Fund Manager
BASIC FUND INFORMATIONFund Type Open-endCategory Equity SchemeLaunch Date June 27,2009Net Assets PKR mn as at 3298.36 August 31, 2019Net Assets (Excluding FoF Investments)
PKR mn as at 2959.99 August 31, 2019
NAV 10.0774 as at August 31, 2019Benchmark KSE-100 IndexDealing Days As Per Pakistan Stock Exchange (PSX)Cut-off time 4:00 PMPricing Mechanism ForwardManagement Fees 2% p.aLoad Upto 2% (Front-end), NIL (Back-end)
TrusteeCentral Depositary Company of Pakistan Limited(CDC)
Auditor M/S. A.F. Ferguson & Co, Chartered Accountants
Asset Manager RatingAM2++ (Stable Outlook) (JCR-VIS) 31 December, 2018
Risk Profile of the Fund HighPerformance Rating N/AFund Manager Ali Ahmed TiwanaListing Pakistan Stock Exchange
TOP TEN HOLDINGS (% OF TOTAL ASSETS) July 31, 2019 August 31, 2019
Oil & Gas Dev.Co 9.04% 8.38%
BANK ALFALAH LTD 7.26% 7.60%
Mari Gas Company Limited 7.75% 7.57%
ENGRO CORPORATION 5.87% 6.47%
Hub Power Company Limited 5.56% 5.85%
Fauji Fertilizer Company Limited. 3.94% 5.46%
UNITED BANK LIMITED 5.80% 5.07%
HABIB BANK LIMITED 4.74% 5.06%
BANK AL-HABIB 5.71% 4.81%
Pak Petroleum Ltd. 4.54% 4.39%
*DETAILS OF NON-COMPLIANT INVESTMENT WITH THE INVESTMENT CRITERIA OF ASSIGNED CATEGORYNon-Compliant
Typeof Investment
ExposureLimit% of NetAssets
% of TotalAssets
Excess Exposure(% of Net Asset)
Exposure(% of Total Asset)
- - - - - - -*The scheme holds certain non-compliant investments. Before making any investment decision, investors should review this document and latest Financial Statements.
INVESTMENT OBJECTIVETo provide higher risk adjusted returns over the long term by investing in a diversified portfolio of equity instruments offering capital gain and dividends.
FUND MANAGER'S COMMENTSABL-SF decreased by 8.53% in August’19 against 7.1% decrease of the benchmark, reflecting an underperformance of 143 basis points. As at Aug’31 , ABL-SF was 91.72% invested in equities and remaining in bank deposits. Market remained negative majority of the trading sessions, due to cross border tensions between Pakistan and India and rumors of putting Pakistan on Blacklist by FATF Asia Pacific Group. Foreigners, Mutual Funds and Insurance companies were Net sellers while Individuals, Banks and Companies were net buyers. E&P, IPPs and Textile sectors are expected to outperform the index due to expected earnings growth post recent PKR depreciation, while 7.5% hike in interest rates (since Jan’18) is estimated to result in significant jump in the banking sector’s earnings. Market is currently trading at P/E multiple of 5.6x as compared to regional average of ~13.1x portraying a significant upside potential. The Scheme has maintained the provision against Sindh Workers’ Welfare Fund’s Liability to the tune of Rs. 56.6million, had the same not been made, the NAV per unit of the scheme would have been higher by Rs. 0.1729 per unit. The Scheme has total expense ratio (TER) of 0.57% (0.06% representing Government Levies and SECP Fee etc.). TER also includes the provision of sales & marketing expenses with 0.4% p.a. of Net Assets amounting to PKR 3.373 million.

FUND MANAGER'S REPORT, August 2019
This publication is for informational purposes only and nothing here in should be construed as a solicitation, recommendation or an offer to buy or sell any fund. All Investments in mutual funds are subject to market risks. The NAV based prices of units and any dividends /returns there on are dependent on forces and factors affecting the capital markets. These may go up or down based on market conditions. Past performance is not necessarily indicative of future results. Please read the offering document to understand the investment policies and the risk involved including risk disclosures for special features (MUFAP’S RECOMMENDED FORMAT)
PerformanceAugust 31,
2019YTD* St. Dev** Beta*** Alpha
ABL-ISF -9.14% -14.08% 19.35% 0.80% 5.44%BenchMark -8.59% -14.58% 23.88% 1.00% N/A
*Funds returns computed on NAV to NAV with the dividend reinvestment (excluding sales load) ** 12M Trailing Data ***3MPKRV used as RFR
ASSET ALLOCATIONJuly 31, 2019 August 31, 2019
Stock/Equity 86.58% 93.29%Bank Balances 12.95% 6.24%Others 0.47% 0.47%Total 100% 100%Others Amount Invested by Fund of Funds is Rs. million.49.84
_ 3 month 6 month 1 Year 3 Year 5 Year Since Inception
ABL-ISF -19.02% -25.53% -29.28% -25.78% 11.47% 29.78%
BenchMark -20.62% -29.44% -34.72% -33.40% -0.58% 23.01%*Funds returns computed on absolute annualized basis / Performance data does not include cost incurred by investor in the form of sales load
SECTOR ALLOCATION (% OF TOTAL ASSETS)
Investment Commitee Members
Alee Khalid Ghaznavi - CEOSaqib Matin, ACA - CFO & CSTanweer Haral - Head of Risk ManagementFahad Aziz, Head of Fixed IncomeAli Ahmed Tiwana - Head of EquityM. Tahir Saeed, CFA - Head of ResearchM. Abdul Hayee, CFA - Fund ManagerAbdul Rehman Tahir - Fund Manager
BASIC FUND INFORMATIONFund Type Open-endCategory Islamic Equity SchemeLaunch Date June 12,2013Net Assets PKR mn as at 1547.79 August 31, 2019Net Assets (Excluding FoF Investments)
PKR mn as at 1497.95 August 31, 2019
NAV 10.4242 as at August 31, 2019Benchmark KMI-30 IndexDealing Days As Per Pakistan Stock Exchange (PSX)Cut-off time 4:00 PMPricing Mechanism ForwardManagement Fees 2% p.aLoad Upto 2% (Front-end), NIL (Back-end)Trustee MCB Financial Services Limited(MCBFSL)Auditor M/S. A.F. Ferguson & Co, Chartered Accountants
Asset Manager RatingAM2++ (Stable outlook) (JCR-VIS) December 31, 2018
Risk Profile of the Fund HighPerformance Rating N/AFund Manager M. Abdul Hayee, CFAListing Pakistan Stock Exchange
TOP TEN HOLDINGS (% OF TOTAL ASSETS) July 31, 2019 August 31, 2019
Oil & Gas Dev.Co 14.31% 12.90%
Meezan Bank Ltd. 9.42% 10.13%
ENGRO CORPORATION 8.62% 9.35%
Hub Power Company Limited 8.08% 9.02%
Pak Petroleum Ltd. 6.30% 8.03%
Mari Gas Company Limited 7.26% 7.75%
Fauji Fertilizer Company Limited. 5.07% 7.02%
ENGRO FERTILIZERS LTD 5.89% 6.67%
Nishat Mills Ltd. 3.34% 4.77%
Pakistan State Oil Co. Ltd. 3.17% 3.09%
*DETAILS OF NON-COMPLIANT INVESTMENT WITH THE INVESTMENT CRITERIA OF ASSIGNED CATEGORYNon-Compliant
Typeof Investment
ExposureLimit% of NetAssets
% of TotalAssets
Excess Exposure(% of Net Asset)
Exposure(% of Total Asset)
- - - - - - -*The scheme holds certain non-compliant investments. Before making any investment decision, investors should review this document and latest Financial Statements.
INVESTMENT OBJECTIVETo provide higher risk adjusted returns over the long term by investing in a diversified portfolio of equity instruments offering capital gain and dividends.
FUND MANAGER'S COMMENTSABL-ISF decreased by 9.14% in Aug’19 against 8.59% decrease of the benchmark, reflecting an underperformance of 55 basis points. As at Aug’31, ABL-ISF was 93.29% invested in equities and remaining in bank deposits. Market remained negative majority of the trading sessions, due to cross border tensions between Pakistan and India and rumors of putting Pakistan on Blacklist by FATF Asia Pacific Group. Foreigners, Mutual Funds and Insurance companies were Net sellers while Individuals, Banks and Companies were net buyers. E&P, IPPs and Textile sectors are expected to outperform the index due to expected earnings growth post recent PKR depreciation, while 7.5% hike in interest rates (since Jan’18) is estimated to result in significant jump in the banking sector’s earnings. Market is currently trading at P/E multiple of 5.6x as compared to regional average of ~13.1x portraying a significant upside potential. The Scheme has maintained the provision against Sindh Workers’ Welfare Fund’s Liability to the tune of Rs. 24.604million, had the same not been made, the NAV per unit of the scheme would have been higher by Rs. 0.1657 per unit. The Scheme has total expense ratio (TER) of 0.57% (0.07% representing Government Levies and SECP Fee etc.). TER also includes the provision of sales & marketing expenses with 0.4% p.a. of Net Assets amounting to PKR 1.687 million.

FUND MANAGER'S REPORT, August 2019
This publication is for informational purposes only and nothing here in should be construed as a solicitation, recommendation or an offer to buy or sell any fund. All Investments in mutual funds are subject to market risks. The NAV based prices of units and any dividends /returns there on are dependent on forces and factors affecting the capital markets. These may go up or down based on market conditions. Past performance is not necessarily indicative of future results. Please read the offering document to understand the investment policies and the risk involved including risk disclosures for special features (MUFAP’S RECOMMENDED FORMAT)
PerformanceAugust 31,
2019YTD* St. Dev** Beta*** Alpha
ABL-IAAF -2.22% -3.38% N/A N/A 0.29%BenchMark -2.5% -4.15% N/A N/A N/A
*Funds returns computed on NAV to NAV with the dividend reinvestment (excluding sales load) ** 12M Trailing Data ***3MPKRV used as RFR
ASSET ALLOCATIONJuly 31, 2019 August 31, 2019
Corporate Sukuk 36.50% 41.44%Stock/Equity 28.38% 29.57%Bank Balances 20.95% 24.51%Others 14.17% 4.48%Total 100% 100%Others Amount Invested by Fund of Funds is Rs. million.0.00
_ 3 month 6 month 1 Year 3 Year 5 Year Since Inception
ABL-IAAF -4.05% -5.58% -5.05% N/A N/A -4.37%
BenchMark -6.40% -9.02% -9.39% N/A N/A -8.97%*Funds returns computed on absolute annualized basis / Performance data does not include cost incurred by investor in the form of sales load
TOP TFCs / SUKUK HOLDING ( % OF TOTAL ASSETS) August 31, 2019
MEBL SUKUK II 14.50%
DHCL SUKUK 16-NOV-17 11.15%
FFCL SUKUK IIF 8.50%
EPCL/SUK/110419 7.29%
Total 41.44%
SECTOR ALLOCATION (% OF TOTAL ASSETS)
Investment Commitee Members
Alee Khalid Ghaznavi - CEOSaqib Matin, ACA - CFO & CSTanweer Haral - Head of Risk ManagementFahad Aziz, Head of Fixed IncomeAli Ahmed Tiwana - Head of EquityM. Tahir Saeed, CFA - Head of ResearchM. Abdul Hayee, CFA - Fund ManagerAbdul Rehman Tahir - Fund Manager
BASIC FUND INFORMATIONFund Type Open-endCategory Shariah Complaint Asset Allocation SchemeLaunch Date May 31,2018Net Assets PKR mn as at 201.5 August 31, 2019Net Assets (Excluding FoF Investments)
PKR mn as at 201.5 August 31, 2019
NAV 9.5543 as at August 31, 2019
Benchmark*
Weighted average daily return of KMI 30 Index and 6M avg Islamic Banks or Islamic Banking windows of scheduled commercial banks based on actual proportion of Investment in Equity & Fixed Income
Dealing Days Monday to FridayCut-off time 4:00 PMPricing Mechanism ForwardManagement Fees 2.00% of Net AssetsLoad Upto 3.00% (Front-end), NIL (Back-end)Trustee MCBFinancial Services Limited (MCBFSL)Auditor M/S. A.F. Ferguson & Co, Chartered Accountants
Asset Manager RatingAM2++ (Stable outlook) (JCR-VIS) December 31, 2018
Risk Profile of the Fund Low to ModeratePerformance Rating N/AFund Manager Abdul Rehman TahirListing Pakistan Stock Exchange
TOP TEN HOLDINGS (% OF TOTAL ASSETS) July 31, 2019 August 31, 2019
Meezan Bank Ltd. 5.71% 5.95%
Hub Power Company Limited 4.17% 4.43%
Mari Gas Company Limited 4.03% 4.10%
ENGRO FERTILIZERS LTD 2.78% 3.23%
ENGRO POLYMER 3.16% 2.99%
ENGRO CORPORATION 2.21% 2.49%
Oil & Gas Dev.Co 2.10% 1.97%
Fauji Fertilizer Company Limited. 1.46% 1.59%
LOTTE PAKISTAN PTA 0.70% 0.76%
Pak Petroleum Ltd. 0.77% 0.68%
*DETAILS OF NON-COMPLIANT INVESTMENT WITH THE INVESTMENT CRITERIA OF ASSIGNED CATEGORY
Non-CompliantTypeof Investment
ExposureLimit% of NetAssets
% of TotalAssets
Excess Exposure(% of Net Asset)
Exposure(% of Total Asset)
MEBLPer Party Exposure
15% 21% 20.45% 6% 5.45%
Shariah Compliant Listed Equity Securities
Asset Allocation
30% 30.36% 29.57% 0.36% 0%
*The scheme holds certain non-compliant investments. Before making any investment decision, investors should review this document and latest Financial Statements.
INVESTMENT OBJECTIVEThe investment objective of the Fund is to earn a potentially high return through asset allocation between Shariah Compliant Equity Instruments, Shariah Compliant Fixed Income Instruments, Shariah Compliant Money Market Instruments and any other Shariah Compliant instrument as permitted by the SECP and Shariah Advisor.
FUND MANAGER'S COMMENTSAIAAF decreased by 2.22% in Aug’19 against the decrease of 2.50% of the benchmark, reflecting an outperformance of 28 basis points. At month end, the total exposure in Equities, Corporate Sukuks and Cash stood at 29.57%, 41.44% and 24.51% respectively. The Scheme has maintained the provision against Sindh Workers’ Welfare Fund’s Liability to the tune of Rs. 0 million, had the same not been made, the NAV per unit of the scheme would have been higher by Rs. 0 per unit. The Scheme has total expense ratio (TER) of 0.61% (0.06% representing Government Levies and SECP Fee etc.). TER also includes the provision of sales & marketing expenses with 0.4% p.a. of Net Assets amounting to PKR 0.205 million.

FUND MANAGER'S REPORT, August 2019
This publication is for informational purposes only and nothing here in should be construed as a solicitation, recommendation or an offer to buy or sell any fund. All Investments in mutual funds are subject to market risks. The NAV based prices of units and any dividends /returns there on are dependent on forces and factors affecting the capital markets. These may go up or down based on market conditions. Past performance is not necessarily indicative of future results. Please read the offering document to understand the investment policies and the risk involved including risk disclosures for special features (MUFAP’S RECOMMENDED FORMAT)
PerformanceAugust 31,
2019YTD* St. Dev** Beta*** Alpha
ACPF 0.56% 1.16% N/A N/A -0.34%BenchMark 0.9% 1.76% N/A N/A N/A
*Funds returns computed on NAV to NAV with the dividend reinvestment (excluding sales load) ** 12M Trailing Data ***3MPKRV used as RFR
ASSET ALLOCATIONJuly 31, 2019 August 31, 2019
TDR 89.59% 89.79%Others 5.61% 6.45%Bank Balances 3.07% 2.17%Stock/Equity 1.73% 1.59%Total 100% 100%Others Amount Invested by Fund of Funds is Rs. million.0.00
_ 3 month 6 month 1 Year 3 Year 5 Year Since Inception
ACPF 1.77% 4.04% 6.59% N/A N/A 9.90%
BenchMark 2.50% 4.62% 6.78% N/A N/A 8.25%*Funds returns computed on absolute annualized basis / Performance data does not include cost incurred by investor in the form of sales load
SECTOR ALLOCATION (% OF TOTAL ASSETS)
Investment Commitee Members
Alee Khalid Ghaznavi - CEOSaqib Matin, ACA - CFO & CSTanweer Haral - Head of Risk ManagementFahad Aziz, Head of Fixed IncomeAli Ahmed Tiwana - Head of EquityM. Tahir Saeed, CFA - Head of ResearchM. Abdul Hayee, CFA - Fund ManagerAbdul Rehman Tahir - Fund Manager
BASIC FUND INFORMATIONFund Type Open-endCategory Capital Protected SchemeLaunch Date February 19,2018Net Assets PKR mn as at 356.79 August 31, 2019Net Assets (Excluding FoF Investments)
PKR mn as at 356.79 August 31, 2019
NAV 10.1339 as at August 31, 2019
BenchmarkKSE 100 Index & 3M Deposit (AA- or above Rated Banks/DFI on fund's actual proportion in the inv. segment & Capital protection segment
Dealing Days Monday to FridayCut-off time 4:00 PMPricing Mechanism ForwardManagement Fees 0.75% of Net Assets
LoadUpto 0.75% (Front-end), 2% for 1 Year and 1% thereon (Contingent)***
Trustee MCBFinancial Services Limited (MCBFSL)Auditor M/S. A.F. Ferguson & Co, Chartered Accountants
Asset Manager RatingAM2++ (Stable outlook) (JCR-VIS) December 31, 2018
Risk Profile of the Fund LowPerformance Rating N/AFund Manager Ali Ahmed TiwanaListing Pakistan Stock Exchange
TOP TEN HOLDINGS (% OF TOTAL ASSETS) July 31, 2019 August 31, 2019
BANK ALFALAH LTD 0.71% 0.70%
Oil & Gas Dev.Co 0.18% 0.15%
NETSOL TECNOLOGY LTD 0.16% 0.14%
HABIB BANK LIMITED 0.13% 0.12%
Mari Gas Company Limited 0.12% 0.11%
I.C.I Pakistan Ltd. 0.10% 0.10%
Pak Petroleum Ltd. 0.13% 0.10%
ALLIED BANK LIMITED 0.09% 0.09%
Adamjee Insurance Co. Ltd. 0.05% 0.05%
Pakistan Oilfields Ltd. 0.05% 0.04%
*DETAILS OF NON-COMPLIANT INVESTMENT WITH THE INVESTMENT CRITERIA OF ASSIGNED CATEGORYNon-Compliant
Typeof Investment
ExposureLimit% of NetAssets
% of TotalAssets
Excess Exposure(% of Net Asset)
Exposure(% of Total Asset)
- - - - - - -*The scheme holds certain non-compliant investments. Before making any investment decision, investors should review this document and latest Financial Statements.
INVESTMENT OBJECTIVETo protect the principal investment upon maturity by placing a significant portion of the Trust Property as TDR with Banks or DFIs, and remaining in equity market or any other SECP permitted investments to provide investors with better returns.
FUND MANAGER'S COMMENTSACPF increased by 0.56% in Aug’19 against 0.90% increase of the benchmark, thereby underperforming the benchmark by 34 basis points. At month end, the total exposure in Equities, TDRs and Cash stood at 1.59%, 89.79% and 2.17% respectively. The Scheme has not maintained the provision against Sindh Workers’ Welfare Fund’s Liability due to the fund registration in Punjab region where SWWF is not applicable. The Scheme has total expense ratio (TER) of 0.28% (0.03% representing Government Levies and SECP Fee etc.). TER also includes the provision of sales & marketing expenses with 0.4% p.a. of Net Assets amounting to PKR 0.242 million.

ABL Cash
ABL Cash Fund ABL Cash Fund1.48
2.34
INVESTMENT
Alee Khalid Ghaznavi, - CEO
Saqib Matin, ACA - CFO & CS
Tanweer Haral - Head of Risk Management
Fahad Aziz, Head of Fixed Income
Ali Ahmed Tiwana - Head of Equity
M. Tahir Saeed, CFA - Head of Research
M. Abdul Hayee, CFA - Fund Manager
Abdul Rehman Tahir - Fund Manager
Aug - 2019
YTD Dealing Days As Per Banking Days
Cut-off time 4.00 pm Date
Pricing Mechanism Forward C
Management Fees 1.5 % p.a. on average Net Assets of each Sub-Fund TDR
Front -end Load Maximum of 3 % on all Contributions, unless exempt under the MM
Offering Document RR
Trustee Central Depository Company of Pakistan Ltd (CDC) T-Bills
Auditor Deloitte – Yousuf Adil – Chartered Accountants Others
Total
Risk Profile of the Fund Investor dependent
Fund Manager Ali Ahmed Tiwana TECHNICAL INFORMATION PF-DSF PF-MMSF PF-ESF
Fund Size (PKR Millions) 77.7575 96.7937 69.4957
NAV 157.2895 129.2693 110.8369
EQUITY SUB-FUND (% OF TOTAL ASSETS)
Mari Petroleum Company Limited 8.34% 8.66% APF EQUITY SUB FUND
Oil and Gas Development Co. Ltd. 8.35% 8.02% Stock/Equities
Pakistan Petroleum Limited 7.16% 7.42% Bank Balances
Bank Al-Falah Limited 6.84% 7.02% T-Bills
Engro Corporation Limited 6.95% 7.00% Others
Hub Power Company Limited 6.80% 5.89% Leverage
Meezan Bank Limited 6.20% 5.80%
Fauji Fertilizer Company Limited 1.77% 5.30% 3 month 6 month 1 year 3 year 5 year Since Inception
United Bank Limited 4.86% 5.03% APF-DSF* 11.82% 9.71% 9.05% 6.07% - 11.38%
Habib Bank Limited 3.85% 4.08% APF- MMSF* 9.98% 9.30% 8.34% 5.72% - 5.82%
APF- ESF** -19.31% -25.34% -29.98% -27.79% - 9.09%
DISCLOSURE IN COMPLIENCE WITH SECP'S DIRCETION NO # 23 OF 2016 *Fund returns are computed on simple annualized basis. Performance data does not include cost incurred by investor in the form of sales load.
**Fund returns are computed on absolute basis. Performance data does not include cost incurred by investor in the form of sales load.
*DETAILS OF NON-COMPLIANT INVESTMENT WITH THE INVESTMENT CRITERIA OF ASSIGNED CATEGORY
Name of Fund Exposure Type Exposure Limit % of Net
Assets % of Total Assets
Excess exposure (% of net
assets)
Excess exposure (%
of total assets)
- - - - - - - -
- - - - - -
FUND MANAGER'S COMMENTS
OBJECTIVE
Investment Committee
Members:
To provide a secure source of
savings and regular income after
retirement to the Participants
Fund Type Open-end APF-DSF APF-MMSF APF-ESF
Category Voluntary Pension Scheme 15.90% 9.50% -9.07%
T-Bills 81.09% 57.19%
*Funds returns computed on NAV to NAV with the dividend reinvestment (excluding sales load)
APF DEBT SUB FUND July 31, 2019 August 31, 2019
Cash 5.57% 14.11%
Commercial Paper 0.00% 5.93%
Corporate TFC / Sukuk 12.84% 14.05%
Launch Date August 20th,2014 13.07% 9.87% -13.83%
Asset Manager Rating AM2++ (Stable Outlook) (JCR-VIS) Decenmber 31, 2018 100.00% 100.00%
Corporate Sukuk 0.00% 0.00%
PIBs 0.00% 0.00%
Others Including Receivables 0.51% 8.72%
APF MONEY MARKET SUB FUND July 31, 2019 August 31, 2019
Cash 20.65% 22.61%
2.54%
July 31, 2019
August 31, 2019 100.00%
T-Bills 76.81% 64.60%
12.78%
August 31, 2019
Fund Stability Rating NA
SECTOR ALLOCATION (% OF EQUITY SUB-FUND)
88.17%
5.26%
0.00%
6.57%
NIL
100.00%
1.07%
NIL
PIBs 0.00% 0.00%
Others Including Receivables
July 31, 2019
93.10%
5.83%
0.00%
*The scheme holds certain non-compliant investments. Before making any investment decision, investors should review this document and latest Financial Statements.
100.00% 100.00%
Total
Total
ABL Pension Fund - Debt Sub Fund posted an annualized yield of 15.90% during the month of Aug’19. At month end, cash at bank, investment in Corporate TFC / Sukuks and T-Bills stood at 14.11%, 14.05% and 57.19% respectively. Going forward, we intend to actively trade PIB’s and Corporate TFC's in order to improve fund's return while simultaneously maintain a low duration portfolio to avoid volatility. The Scheme has maintained the provision against Sindh Workers’ Welfare Fund’s Liability to the tune of Rs. 169,489, had the same not been made, the NAV per unit of the scheme would have been higher by Rs. 0.3426 per unit. ABL Pension Fund - Money Market Sub Fund generated an annualized return of 9.50% in Aug’19. At month end portfolio comprised of 64.60% in T-bills, while cash at bank stood at 22.61%. Going forward, we intend to actively trade in the money market in order to improve returns while maintain a low duration portfolio to avoid volatility.
The Scheme has maintained the provision against Sindh Workers’ Welfare Fund’s Liability to the tune of Rs. 88,030, had the same not been made, the NAV per unit of the scheme would have been higher by Rs. 0.1176 per unit. ABL Pension Fund - Equity Sub fund decreased by 9.07% in the month of Aug’19. The KSE-100 Index decreased by 13.83% in Aug’19. Market remained negative majority of the trading sessions, due to cross border tensions between Pakistan and India and rumors of putting Pakistan on Blacklist by FATF Asia Pacific Group. Foreigners, Mutual Funds and Insurance companies were Net sellers while Individuals, Banks and Companies were net buyers. E&P, IPPs and Textile sectors are expected to outperform the index due to expected earnings growth post recent PKR depreciation, while 7.5% hike in interest rates (since Jan’18) is estimated to result in significant jump in the banking sector’s earnings. Market is currently trading at P/E multiple of 5.6x as compared to regional average of ~13.1x portraying a significant upside potential.
The Scheme has maintained the provision against Sindh Workers’ Welfare Fund’s Liability to the tune of Rs. 629,693, had the same not been made, the NAV per unit of the scheme would have been higher by Rs. 0.9884 per unit.
INFOCUS ABL Pension Fund
FUND MANAGER'S REPORT, JUNE 2019
APF DEBT SUB FUND The Scheme has also mantained Total expense ratio (TER) 0.36% (0.05% representing Government Levies and SECP Fee etc.). APF MONEY MARKET SUB FUND Scheme has also mantained Total expense ratio (TER) 0.36% (0.05% representing Government Levies and SECP Fee etc). APF EQUITY SUB FUND The Scheme has also mantained Total expense ratio (TER) (0.45% (0.06% representing Government Levies and SECP Fee etc.).
0.00% 3.00% 6.00% 9.00% 12.00% 15.00% 18.00%
Pharmaceuticals
Cement
Technology & Communication
Oil & Gas Marketing Companies
Textile Composite
Chemical
Power Generation & Distribution
Bank Balance & Others
Fertilizer
Oil & Gas Exploration Companies
Commercial Banks
0.09% 0.32%
1.32% 4.34%
5.44%
5.50%
6.38%
6.90%
15.32%
26.27%
28.10%

ABL Cash Fund ABL Cash Fund1.48
2.34
INVESTMENT
Alee Khalid Ghaznavi, - CEO
Saqib Matin, ACA - CFO & CS
Tanweer Haral - Head of Risk Management
Fahad Aziz, Head of Fixed Income
Ali Ahmed Tiwana - Head of Equity
M. Tahir Saeed, CFA - Head of Research
M. Abdul Hayee, CFA - Fund Manager
Abdul Rehman Tahir - Fund Manager
Aug - 2019
YTD Dealing Days As Per Banking Days
Cut-off time 4.00 pm Date
Pricing Mechanism Forward C
Management Fees 1.5 % p.a. on average Net Assets of each Sub-Fund TDR
Front -end Load Maximum of 3 % on all Contributions, unless exempt under the MM
Offering Document RR
Trustee Central Depository Company of Pakistan Ltd (CDC) c
Auditor Deloitte – Yousuf Adil – Chartered Accountants
Cash
GoP Ijarah Sukuk
Risk Profile of the Fund Investor dependent Corporate Sukuk
Fund Manager M. Abdul Hayee, CFA Others Including Receivables
TECHNICAL INFORMATION IPF-DSF IPF-MMSF IPF-ESF ABL IPF EQUITY SUB FUND
Fund Size (PKR Millions) 54.2219 50.9239 49.9511
NAV 120.7167 118.0143 113.5986
EQUITY SUB-FUND (% OF TOTAL ASSETS)
Meezan Bank Limited 9.27%
Engro Corporation Limited 8.94%
Pakistan Petroleum Limited 9.29% APF-IDSF* 2.20% 2.94% 4.26% 3.23% - 4.12%
Mari Petroleum Company Limited 8.58% APF- IMMSF* 1.43% 2.88% 3.93% 2.97% - 3.58%
Fauji Fertilizer Company Limited 4.05% APF- IESF** -19.19% -26.98% -31.10% -26.24% - 13.60%
Hub Power Company Limited 7.50%
Oil and Gas Development Co. Ltd. 8.98%
Engro Fertilizers Limited 6.34% `
Nishat Mills Limited 2.92%
Lotte Chemical Pakistan Limited 4.05%
DISCLOSURE IN COMPLIENCE WITH SECP'S DIRCETION NO # 23 OF 2016
*DETAILS OF NON-COMPLIANT INVESTMENT WITH THE INVESTMENT CRITERIA OF ASSIGNED CATEGORY
Name of Fund % of Net Assets & % of
Total Assets Exposure Limit
Excess exposure (%
of net assets & % of
total assets)
- - -
- - - - - -
Commercial Paper N/A 6.80%
Fund Stability Rating NA
Asset Manager Rating AM2++ (Stable Outlook) (JCR-VIS) Decenmber 31, 2018 60.97%
38.05%
July 31, 2019ABL IPF MONEY MARKET SUB FUND
Leverage NIL NIL
July 31, 2019
86.40% 90.91%
**Fund returns are computed on Absolute Basis. Performance data does not include cost incurred by investor in the form of sales load.
Shariah Compliant Equities
*Fund returns are computed on simple annualized basis. Performance data does not include cost incurred by investor in the form of sales load.
Exposure Type
- -
9.64% 6.70%
Total 100.00%
July 31, 2019 August 31, 2019
SECTOR ALLOCATION (% OF EQUITY SUB-FUND)
100.00%
FUND MANAGER'S COMMENTS
OBJECTIVE
Investment Committee
Members:
To provide a secure source of
savings and regular income after
retirement to the Participants
9.27%
July 31, 2019 August 31, 2019
Cash 60.41% 43.61%
Category Voluntary Pension Scheme 9.89% 9.57% -8.63%
Launch Date August 20th,2014 4.75% 4.58% -13.74%*Funds returns computed on NAV to NAV with the dividend reinvestment (excluding sales load)
Fund Type Open-end APF-IDSF APF-IMMSF APF-IESF
GoP Ijarah Sukuk 29.53% 30.34%
ABL IPF DEBT SUB FUND
Corporate Sukuk 8.97%
Others
August 31, 2019
Total 100.0%
0.00% 0.00%
August 31, 2019
0.98% 13.70%
33.32%
Bank Balances
3.96% 2.39%
9.98%
52.98%
Others Including Receivables 1.09%
100.0%
100.00%Total 100.00%
7.73%
7.58%
7.16%
4.64%
4.02%
9.72%
9.06%
8.71%
8.48%
8.36%
ABL Islamic Pension Fund - Debt Sub Fund posted a return of 9.89% during the month of Aug’19. Other than 30.34% in GoP Ijarah Su kuk, portfolio had an exposure of 9.27% in Corporate Sukuks and 43.61% of the fund’s assets were placed as Cash at bank. Going forward, we intend to maintain the current portfolio alloc ations as we expect price appreciation in both Corporate and GOP Ijarah Sukuks in the near term owing to the lack of shariah complaint instruments in the market.
The Scheme has maintained the provision against Sindh Workers’ Welfare Fund’s Liability to the tune of Rs. 73,755, had the sa me not been made, the NAV per unit of the scheme would have been higher by Rs. 0.1642 per unit.
ABL Islamic Pension Fund - Money Market Sub Fund generated an annualized return of 9.57% during the month of Aug’19. During the month significant allocation was maintained as bank deposits (i.e. 52.98%) owing to better deposit rates offered by banks while 33.32% of the portfolio was placed in GoP Ijarah Sukuks. The Scheme has maintained the provision against Sindh Workers’ Welfare Fund’s Liability to the tune of Rs. 39,909, had the sa me not been made, the NAV per unit of the scheme would have been higher by Rs. 0.0925 per unit.
ABL Islamic Pension Fund - Equity Sub Fund decreased by 8.63% in the month of Aug’19. The KMI -30 Index decreased by 8.59% in Aug’2019. Market remained negative majority of the trading sessions, due to cross border tensions between Pakistan and India and rumors of putting Pakistan on Blacklist by FATF Asia Pa cific Group. Foreigners, Mutual Funds and Insurance companies were Net sellers while Individuals, Banks and Companies were net buyers. E&P, IPPs and Textile sectors are expected to outper form the index due to expected earnings growth post recent PKR depreciation, while 7.5% hike in interest rates (since Jan’18) is estimated to result in significant jump in the banking sect or’s earnings. Market is currently trading at P/E multiple of 5.6x as compared to regional average of ~13.1x portraying a significant upside potential. The Scheme has maintained the provision against Sindh Workers’ Welfare Fund’s Liability to the tune of Rs. 633,377, had the s ame not been made, the NAV per unit of the scheme would have been higher by Rs. 1.4404 per unit.
APF ISLAMIC DEBT SUB FUND The Scheme has also mantained Total expense ratio (TER) 0.38% (0.05% representing Government Levies and SECP Fee etc). APF ISLAMIC MONEY MARKET SUB FUND The Scheme has also mantained Total expense ratio (TER) 0.40% (0.05% representing Government Levies and SECP Fee etc). APF ISLAMIC EQUITY SUB FUND The Scheme has also mantained Total expense ratio (TER) 0.46% (0.06% representing Government Levies and SECP Fee etc).
0.00% 4.00% 8.00%12.00%16.00%20.00%24.00%28.00%32.00%
Automobile Parts & Accessories
Pharmaceuticals
Glass & Ceramics
Oil & Gas Marketing Companies
Textile Composite
Chemical
Power Generation & Distribution
Bank Balance & Others
Commercial Banks
Fertilizer
Oil & Gas Exploration Companies
0.01%
0.13%
0.60%
5.66%
6.06%
7.64%
8.43%
9.09%
9.72%
24.58%
28.08%

FUND MANAGER'S REPORT, August 2019
This publication is for informational purposes only and nothing here in should be construed as a solicitation, recommendation or an offer to buy or sell any fund. All Investments in mutual funds are subject to market risks. The NAV based prices of units and any dividends /returns there on are dependent on forces and factors affecting the capital markets. These may go up or down based on market conditions. Past performance is not necessarily indicative of future results. Please read the offering document to understand the investment policies and the risk involved including risk disclosures for special features (MUFAP’S RECOMMENDED FORMAT)
PerformanceConservative Allocation Active Allocation Strategic Allocation
Returns* Benchmark Returns* Benchmark Returns* BenchmarkAugust 2019 -0.49 0.03 -3.15 -2.24 -2.39 -1.43YTD -0.69 0.1 -5.29 -4.12 -3.98 -2.763 Months -1.16 0.03 -7.65 -6.12 -5.86 -4.246 Months -0.71 1.08 -10.15 -8.57 -7.7 -5.971 Year 0.83 4.07 -11.97 -10.56 -7.62 -5.36Since Inception 16.74 24.13 -1.78 2.14 -9.13 -4.08
ASSET ALLOCATIONCONSERVATIVE PLAN 31-Dec-15 July 31, 2019 August 31, 2019
Cash 1.41 1.10Equity Funds 14.90 13.72Govt. Securities Funds 12.23 12.47Income Funds 71.12 72.40Others 0.34 0.31Total 100% 100%ACTIVE ALLOCATION PLAN 31-Dec-15 July 31, 2019 August 31, 2019
Cash 1.16 1.13Equity Funds 42.96 40.44Govt. Securities Funds 36.93 39.25Income Funds 13.98 14.01Money Market Funds 4.90 5.12Others 0.07 0.05Total 100% 100%STRATEGIC ALLOCATION PLAN 30-Dec-16 July 31, 2019 August 31, 2019
Cash 0.46 0.81Equity Funds 35.09 37.64Income Funds 59.08 55.98Money Market Funds 5.37 5.56Others 0.00 0.01Total 100% 100%
Investment Commitee Members
Alee Khalid Ghaznavi - CEOSaqib Matin, ACA - CFO & CSTanweer Haral - Head of Risk ManagementFahad Aziz, Head of Fixed IncomeAli Ahmed Tiwana - Head of EquityM. Tahir Saeed, CFA - Head of ResearchM. Abdul Hayee, CFA - Fund ManagerAbdul Rehman Tahir - Fund Manager
BASIC FUND INFORMATIONFund Type Open-endCategory Fund of funds schemeLaunch Date** December 31st,2015
BenchmarkWeighted average return of KSE100 Index and average 6 month deposit rate of three Banks
Dealing Days Monday to FridayPricing Mechanism ForwardCut-off time 4.00 pm
Management FeesNIL (upto 1.50% p.a. on the value of underlying Funds not managed by ABLAMC)
LoadUp to 2% (Front-end), NIL (Backend - Contingent)
Trustee MCB Financial Services Limited (MCBFSL)Auditor Deloitte - Yousuf Adil . Chartered Accountants
Asset Manager RatingAM2++ (Stable Outlook) (JCR-VIS) December 31, 2018
Risk Profile of the Fund Low to HighFund Manager Ali Ahmed TiwanaListing Pakistan Stock Exchange
TERConv: 0.09% (0.01% including Gop Levy and SECP FEE etc)Active: 0.06% (0.01% including Gop Levy and SECP FEE etc)Strategic: 0.05% (0.01% including Gop Levy and SECP FEE etc)
COMMENTSConv: The Scheme has maintained the provision against Sindh Workers’ Welfare Fund’s Liability to the tune of Rs. 1.001 million, had the same not been made, the NAV per unit of the scheme would have been higher by Rs. 0.59 per unit.Active: The Scheme has maintained the provision against Sindh Workers’ Welfare Fund’s Liability to the tune of Rs. 3.529 million, had the same not been made, the NAV per unit of the scheme would have been higher by Rs. 0.94 per unit.Strategic: The Scheme has maintained the provision against Sindh Workers’ Welfare Fund’s Liability to the tune of Rs. 0.103 million, had the same not been made, the NAV per unit of the scheme would have been higher by Rs. 0.02 per unit.TECHNICAL INFORMATION Net Assets (PKR) NAV (PKR)
Conservative Allocation Plan 184456213 108.8732Active Allocation Plan 318796270 85.0433Strategic Allocation Plan 482562854 90.9742Leverage is NIL for all Plans
INVESTMENT OBJECTIVETo generate returns on investment as per the respective allocation plan by investing in mutual funds in line with the risk tolerance of the investor.
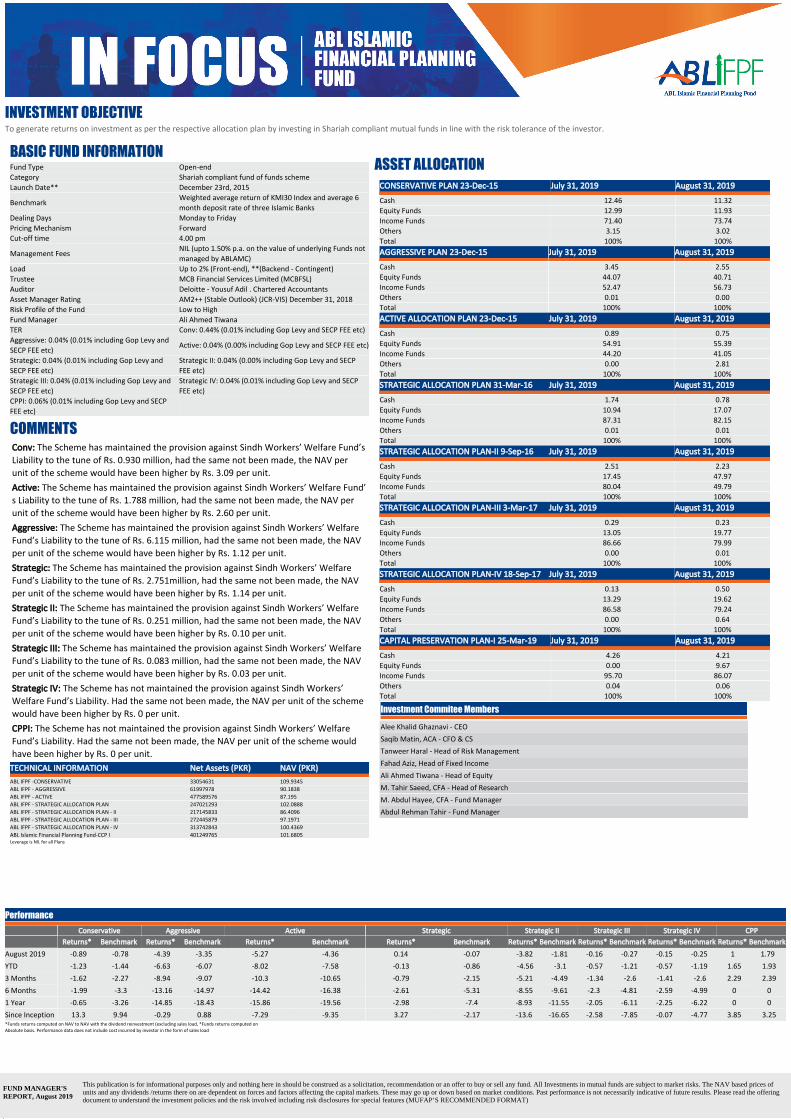
FUND MANAGER'S REPORT, August 2019
This publication is for informational purposes only and nothing here in should be construed as a solicitation, recommendation or an offer to buy or sell any fund. All Investments in mutual funds are subject to market risks. The NAV based prices of units and any dividends /returns there on are dependent on forces and factors affecting the capital markets. These may go up or down based on market conditions. Past performance is not necessarily indicative of future results. Please read the offering document to understand the investment policies and the risk involved including risk disclosures for special features (MUFAP’S RECOMMENDED FORMAT)
CONSERVATIVE PLAN 23-Dec-15 July 31, 2019 August 31, 2019
Cash 12.46 11.32Equity Funds 12.99 11.93Income Funds 71.40 73.74Others 3.15 3.02Total 100% 100%AGGRESSIVE PLAN 23-Dec-15 July 31, 2019 August 31, 2019
Cash 3.45 2.55Equity Funds 44.07 40.71Income Funds 52.47 56.73Others 0.01 0.00Total 100% 100%ACTIVE ALLOCATION PLAN 23-Dec-15 July 31, 2019 August 31, 2019
Cash 0.89 0.75Equity Funds 54.91 55.39Income Funds 44.20 41.05Others 0.00 2.81Total 100% 100%STRATEGIC ALLOCATION PLAN 31-Mar-16 July 31, 2019 August 31, 2019
Cash 1.74 0.78Equity Funds 10.94 17.07Income Funds 87.31 82.15Others 0.01 0.01Total 100% 100%STRATEGIC ALLOCATION PLAN-II 9-Sep-16 July 31, 2019 August 31, 2019
Cash 2.51 2.23Equity Funds 17.45 47.97Income Funds 80.04 49.79Total 100% 100%STRATEGIC ALLOCATION PLAN-III 3-Mar-17 July 31, 2019 August 31, 2019
Cash 0.29 0.23Equity Funds 13.05 19.77Income Funds 86.66 79.99Others 0.00 0.01Total 100% 100%STRATEGIC ALLOCATION PLAN-IV 18-Sep-17 July 31, 2019 August 31, 2019
Cash 0.13 0.50Equity Funds 13.29 19.62Income Funds 86.58 79.24Others 0.00 0.64Total 100% 100%CAPITAL PRESERVATION PLAN-I 25-Mar-19 July 31, 2019 August 31, 2019
Cash 4.26 4.21Equity Funds 0.00 9.67Income Funds 95.70 86.07Others 0.04 0.06Total 100% 100%
Investment Commitee Members
Alee Khalid Ghaznavi - CEOSaqib Matin, ACA - CFO & CSTanweer Haral - Head of Risk ManagementFahad Aziz, Head of Fixed IncomeAli Ahmed Tiwana - Head of EquityM. Tahir Saeed, CFA - Head of ResearchM. Abdul Hayee, CFA - Fund ManagerAbdul Rehman Tahir - Fund Manager
BASIC FUND INFORMATIONFund Type Open-endCategory Shariah compliant fund of funds schemeLaunch Date** December 23rd, 2015
BenchmarkWeighted average return of KMI30 Index and average 6 month deposit rate of three Islamic Banks
Dealing Days Monday to FridayPricing Mechanism ForwardCut-off time 4.00 pm
Management FeesNIL (upto 1.50% p.a. on the value of underlying Funds not managed by ABLAMC)
Load Up to 2% (Front-end), **(Backend - Contingent)Trustee MCB Financial Services Limited (MCBFSL)Auditor Deloitte - Yousuf Adil . Chartered AccountantsAsset Manager Rating AM2++ (Stable Outlook) (JCR-VIS) December 31, 2018Risk Profile of the Fund Low to HighFund Manager Ali Ahmed TiwanaTER Conv: 0.44% (0.01% including Gop Levy and SECP FEE etc)Aggressive: 0.04% (0.01% including Gop Levy and SECP FEE etc)
Active: 0.04% (0.00% including Gop Levy and SECP FEE etc)
Strategic: 0.04% (0.01% including Gop Levy and SECP FEE etc)
Strategic II: 0.04% (0.00% including Gop Levy and SECP FEE etc)
Strategic III: 0.04% (0.01% including Gop Levy and SECP FEE etc)
Strategic IV: 0.04% (0.01% including Gop Levy and SECP FEE etc)
CPPI: 0.06% (0.01% including Gop Levy and SECP FEE etc)
COMMENTSConv: The Scheme has maintained the provision against Sindh Workers’ Welfare Fund’s Liability to the tune of Rs. 0.930 million, had the same not been made, the NAV per unit of the scheme would have been higher by Rs. 3.09 per unit.Active: The Scheme has maintained the provision against Sindh Workers’ Welfare Fund’s Liability to the tune of Rs. 1.788 million, had the same not been made, the NAV per unit of the scheme would have been higher by Rs. 2.60 per unit.Aggressive: The Scheme has maintained the provision against Sindh Workers’ Welfare Fund’s Liability to the tune of Rs. 6.115 million, had the same not been made, the NAV per unit of the scheme would have been higher by Rs. 1.12 per unit.Strategic: The Scheme has maintained the provision against Sindh Workers’ Welfare Fund’s Liability to the tune of Rs. 2.751million, had the same not been made, the NAV per unit of the scheme would have been higher by Rs. 1.14 per unit.Strategic II: The Scheme has maintained the provision against Sindh Workers’ Welfare Fund’s Liability to the tune of Rs. 0.251 million, had the same not been made, the NAV per unit of the scheme would have been higher by Rs. 0.10 per unit.Strategic III: The Scheme has maintained the provision against Sindh Workers’ Welfare Fund’s Liability to the tune of Rs. 0.083 million, had the same not been made, the NAV per unit of the scheme would have been higher by Rs. 0.03 per unit.Strategic IV: The Scheme has not maintained the provision against Sindh Workers’ Welfare Fund’s Liability. Had the same not been made, the NAV per unit of the scheme would have been higher by Rs. 0 per unit.CPPI: The Scheme has not maintained the provision against Sindh Workers’ Welfare Fund’s Liability. Had the same not been made, the NAV per unit of the scheme would have been higher by Rs. 0 per unit.TECHNICAL INFORMATION Net Assets (PKR) NAV (PKR)ABL IFPF -CONSERVATIVE 33054631 109.9345ABL IFPF - AGGRESSIVE 61997978 90.1838ABL IFPF - ACTIVE 477589576 87.195ABL IFPF - STRATEGIC ALLOCATION PLAN 247021293 102.0888ABL IFPF - STRATEGIC ALLOCATION PLAN - II 217145833 86.4096ABL IFPF - STRATEGIC ALLOCATION PLAN - III 272445879 97.1971ABL IFPF - STRATEGIC ALLOCATION PLAN - IV 313742843 100.4369ABL Islamic Financial Planning Fund-CCP I 401249765 101.6805Leverage is NIL for all Plans
INVESTMENT OBJECTIVETo generate returns on investment as per the respective allocation plan by investing in Shariah compliant mutual funds in line with the risk tolerance of the investor.
ASSET ALLOCATION
PerformanceConservative Aggressive Active Strategic Strategic II Strategic III Strategic IV CPP
Returns* Benchmark Returns* Benchmark Returns* Benchmark Returns* Benchmark Returns* Benchmark Returns* Benchmark Returns* Benchmark Returns* BenchmarkAugust 2019 -0.89 -0.78 -4.39 -3.35 -5.27 -4.36 0.14 -0.07 -3.82 -1.81 -0.16 -0.27 -0.15 -0.25 1 1.79YTD -1.23 -1.44 -6.63 -6.07 -8.02 -7.58 -0.13 -0.86 -4.56 -3.1 -0.57 -1.21 -0.57 -1.19 1.65 1.933 Months -1.62 -2.27 -8.94 -9.07 -10.3 -10.65 -0.79 -2.15 -5.21 -4.49 -1.34 -2.6 -1.41 -2.6 2.29 2.396 Months -1.99 -3.3 -13.16 -14.97 -14.42 -16.38 -2.61 -5.31 -8.55 -9.61 -2.3 -4.81 -2.59 -4.99 0 01 Year -0.65 -3.26 -14.85 -18.43 -15.86 -19.56 -2.98 -7.4 -8.93 -11.55 -2.05 -6.11 -2.25 -6.22 0 0Since Inception 13.3 9.94 -0.29 0.88 -7.29 -9.35 3.27 -2.17 -13.6 -16.65 -2.58 -7.85 -0.07 -4.77 3.85 3.25*Funds returns computed on NAV to NAV with the dividend reinvestment (excluding sales load, *Funds returns computed on Absolute basis. Performance data does not include cost incurred by investor in the form of sales load

I
FY'15 FY'16 FY'17 FY'18 FY'19 FY'09 FY'10 FY'11 FY'12 FY'13 FY'14 FY'15 FY'16 FY'17 FY'18 FY'19
14.20% 7.19% 5.85% 4.67% 7.12% 14.34% 11.29% 12.26% 13.16% 13.50% 13.50% 15.24% 15.16% 15.60% 15.14% 15.35%
9.01% 6.54% 6.10% 6.35% 10.30% 13.48% 12.90% 13.05% 12.87% 12.26% 11.84% 11.42% 10.79% 10.48% 9.99% 10.02%
27.11% 9.91% 33.21% -16.84% -16.54% -0.17% 32.43% 71.06% 116.12% 236.86% 347.69% 469.07% 525.44% 733.15% 592.90% 478.28%
5.67% 0.37% 22.44% -10.00% -19.11% -0.42% 25.69% 52.39% 56.81% 113.18% 168.52% 183.75% 184.79% 248.70% 214.43% 154.34%
9.37% 5.78% 5.41% 5.41% 9.02% - - 11.88% 12.18% 11.87% 11.65% 12.06% 11.58% 12.01% 11.75% 12.38%
6.06% 3.81% 4.96% 5.35% 8.71% - - 7.49% 7.49% 7.19% 7.03% 6.83% 6.32% 6.13% 6.03% 6.33%
8.69% 5.82% 5.68% 4.37% 8.47% - - 10.16% 11.12% 11.15% 11.30% 11.56% 11.15% 10.90% 10.53% 11.05%
6.61% 5.10% 3.05% 2.46% 3.69% - - 9.30% 8.34% 7.75% 7.51% 7.32% 6.94% 6.38% 5.89% 5.64%
15.14% 8.03% 5.10% 5.09% 7.73% - - - 10.68% 11.85% 11.48% 13.75% 13.37% 12.88% 12.25% 12.48%
8.00% 5.67% 5.85% 6.20% 9.99% - - - 10.52% 9.46% 9.21% 8.87% 8.17% 7.76% 7.52% 7.85%
29.03% 5.58% 31.18% -15.93% -16.65% -3.24% 20.63% 55.64% 64.32% 115.56% 81.22% 51.05%
20.10% 15.53% 18.80% -9.59% -23.84% -2.30% 26.90% 52.40% 76.07% 109.16% 89.10% 44.01%
- - 2.86% -16.40% -16.93% - - - - - - - - 2.86% -14.01% -28.57%
- - -2.62% -9.59% -23.84% - - - - - - - - -2.62% -11.96% -32.92%
- - 2.83% 6.25% - - - - - - - - 2.83% 8.64%
- - 0.75% 5.59% - - - - - - - - 0.75% 6.39%
- - 0.07% -1.09% - - - - - - - - 0.07% -1.03%
- - -0.02% 5.01% - - - - - - - - -0.02% -5.02%
- - -2.12% - - - - - - - - -2.12%
- - -7.81% - - - - - - - - -7.81%
20.92% 12.14% 4.42% 3.72% 7.28% - - - - - - 20.92% 17.37% 13.35% 11.22% 11.06%
6.14% 4.15% 3.89% 3.85% 7.49% - - - - - - 6.14% 5.18% 4.86% 4.74% 5.59%
28.79% 10.56% 31.31% -16.26% -19.15% - - - - - - 28.79% 42.39% 86.97% 56.58% 26.59%
6.56% 3.52% 4.52% 1.26% 3.46% - - - - - - 6.56% 5.03% 5.00% 4.08% 4.06%
6.31% 2.24% 3.22% 1.68% 3.51% - - - - - - 6.31% 4.18% 3.93% 3.40% 3.52%
30.84% 11.31% 28.01% -11.98% -19.97% - - - - - - 30.84% 45.65% 86.96% 64.56% 31.69%
- 4.41% 10.35% 0.01% 2.02% - - - - - - 4.41% 15.22% 15.23% 17.55%
- 4.17% 9.44% 3.45% 5.08% - - - - - - - 4.17% 14.01% 18.02% 24.01%
- 5.29% 19.28% -11.47% -6.71% - - - - - - 5.29% 25.59% 11.18% 3.71%
- 6.99% 13.56% -5.21% -6.47% - - - - - - 6.99% 20.32% 14.21% 6.53%
- 0.57% -2.43% -3.44% - - - - - - 0.57% -1.88% 5.25%
- -0.25% 0.98% -1.97% - - - - - - -0.25% 0.67% -1.35%
- 1.69% 12.18% -7.64% -1.87% - - - - - - - 1.69% 14.08% 5.37% 3.41%
- 4.00% 5.73% -3.62% -6.41% - - - - - - - 4.00% 9.37% 5.43% -1.33%
- 3.52% 10.08% -0.67% 1.35% - - - - - - - 3.52% 13.96% 13.19% 14.71%
- 5.92% 6.51% 0.40% -1.53% - - - - - - - 5.92% 12.82% 13.27% 11.55%
- 6.46% 21.85% -10.64% -7.86% - - - - - - 6.46% 29.72% 15.93% 6.78%
- 14.58% 14.12% -5.46% -13.12% - - - - - - - 14.58% 30.77% 23.63% 7.40%
- 3.53% 18.26% -10.92% -7.58% - - - - - - - 3.53% 22.44% 9.07% 0.79%
- 10.27% 10.06% -6.14% -12.87% - - - - - - - 10.27% 19.88% 12.56% -1.91%
1.22% -7.18% -3.63% 1.22% -6.06% -9.48%
- -2.84% -4.22% -8.50% - - - - - - - -2.84% -6.95% -13.99%
0.34% -1.72% -0.57% 0.34% -1.38% -2.02%
- -0.95% -0.99% -4.73% - - - - - - - -0.95% -2.05% -6.73%
1.80% -0.77% 1.80% 0.51%
- 1.30% -4.84% - - - - - - - 1.30% -3.62%
- 2.17% 2.17%
- - 1.30% - - - - - - - 1.30%
Benchmark
Benchmark
Benchmark
SAP IV
CPP I
MMSF
ESF
ABL IPF
DSF
MMSF
ABL FPF
Conservative Plan
Benchmark
SAP
SAP III
ACPF
Benchmark
ABL IAAF
Benchmark
AFF
ABL
Governm
Last 5 Years Performance Since Inception Performance
Benchmark
ABL IF
Benchmark
ABL SF
Benchmark
ABL CF
ABL ISF
Benchmark
ABL IDSF
ABL IIFBenchmark
ABL GSF
Benchmark
Benchmark
ABL PF
DSF
ESF
SAP
Conservative Plan
Aggressive Fund
Active Plan
Benchmark
Benchmark
Benchmark
Benchmark
Benchmark
Benchmark
SAP II
ABL IFPF
Benchmark
Active Plan
Benchmark
INFOCUS Disclosure as per SECP's SCD Circular.16,2014 FUND MANAGER'S REPORT, JUNE 2019

2nd Floor, Main Khayaban-e-Ittehad DHA, Karachi.Tel: 0213-5311001Mobile: 0300-2441896,0332-3081021
KARACHIPlot # 24-B Mezznine Floor,Main Market Gulberg 111, Lahore.Tel: 0423-5750953Mobile: 0345-4268272,0335-4184426
LAHOREPlot # 171 A-1 Phase 1DHA, Rawalpindi.Tel: 051-5788728Fax: 051-5789382Mobile: 0333-8505435
RAWALPINDI
Plot No. 14. Sector MB, DHA, Phase 6, LahoreREGISTERED ADDRESS
15 Club Road, Main FaisalLane, Off Club Road, Cilvil.Lines, Faislabad.Tel: 041-2409413, 041-2409420Mobile: 0301-845066
FAISALABADPlot # 19, Pc-10918, Sector-08Phase VII Stage-1 OfficeEnclave, Hayatabad Peshawar.Mobile: 0335-5030136
PESHAWARAziz Shaheed Road,Cantt. Branch Sialkot.Mobile: 0321-6137898
SIALKOT

Rating as per JCR-VIS
SMSCallEmailWebsite
::::
‘INVEST’ to 82620800 ABL-AM (0800 225 26)[email protected]
ABLAssetManagement
ABLAssetManagement
ablamcl