august 2017 a half century of macro momentum - aqr · a half century of macro momentum 03 executive...
TRANSCRIPT

A Half Century of Macro Momentum
Jordan Brooks Managing Director
August 2017
02 A Half Century of Macro Momentum
ContentsContents 02
Executive Summary 03
Introduction 04
Building a Macro Momentum Portfolio 05
Performance of Macro Momentum Since 1970 07
Macro Momentum and Traditional Asset Classes 09
Macro Momentum and Trend-Following Strategies 11
Macro Momentum and Other Alternative Strategies 14
Summary and Discussion 16
References 17
Appendix A 18
Appendix B 19
Appendix C 20
Disclosures 21
I thank Ing-Chea Ang, Cliff Asness, Paolo Bertolotti, Jonathan Fader, Jeremy Getson, John Huss, Antti Ilmanen, Bradley Jones, Michael Katz, Ronen Israel, Bill Latimer, and Andrew Quinn for excellent comments. A special thanks to Paolo Bertolotti for outstanding research assistance.
Contents

A Half Century of Macro Momentum 03
Executive SummaryI outline a systematic and diversified approach to global macro investing grounded in economic theory,
and detail its performance over the last half century. The analysis shows that the strategy has the potential
to deliver strong positive returns, low correlation to traditional asset classes across various macroeconomic
environments, and to provide diversification in bear equity markets and rising real yield environments.
This systematic global macro strategy appears to be a complement to other alternative risk premia — such
as trend-following and long-short value, momentum, and carry strategies — and does not appear to be fully
exploited by existing global macro managers.
04 A Half Century of Macro Momentum
Introduction
1 Pederson, L. (2015). Efficiently Inefficient: How Smart Money Invests & Market Prices are Determined. New Jersey: Princeton University Press.
2 As of 2016.3 The Dow Jones Credit Suisse Global Macro Index has realized a Sharpe ratio of 0.8 since 1994.4 The Dow Jones Credit Suisse Global Macro Index had a positive return (3.3%) from May 2007 - Feb 2009, while the S&P 500 realized a
drawdown of 69%.5 For theories of why investors may systematically underreact to news, see Barberis, Shleifer, and Vishny (1998), Daniel, Hirshleifer, and
Subrahmanyam (1999), Hong and Stein (1999), and Frazzini (2006). The empirical literature primarily focuses on individual equities, as in Chan (2003), Frazzini (2006), and Sinha (2016). A notable exception is Bhojraj and Swaminathan (2006), who extend the empirical evidence to international equity indices. Although most of the relevant extant literature focuses on individual equities, the same idea of fundamental momentum — news that moves asset markets contemporaneously tends to predict future asset returns in the same direction — also applies to macro asset classes, my focus here. A forthcoming paper, Brooks, Katz, and Lustig (2017), documents persistent underreaction of bond markets to monetary policy surprises, extending the equity literature to additional markets.
6 Asset classes have varying start dates. See Appendix A for more information.7 See Moskowitz, Ooi, and Pedersen (2012).8 See Asness et al (2015).
“We tend to make money out of surprises… Most
surprises unfold gradually”— David Harding, CEO
and Founder of Winton Capital Management1
Macroeconomic forces affect the geopolitical
landscape and markets alike, and investors savvy
enough to take advantage of macroeconomic
developments have historically been able to
generate strong returns. Whether it is George
Soros betting big against the British pound in
1992, Paul Tudor Jones predicting Black Monday
in 1987, or John Paulson foreseeing the bursting
of the subprime mortgage bubble, successful
managers have been able to read and profit
from the underlying macroeconomic drivers
that move markets. Global macro strategies
currently command about 20% of total hedge fund
assets, alluring investors with strong historical
performance and their perceived ability to generate
returns across a variety of market environments.2,3
For example, global macro was one of the few
hedge fund strategies to perform positively during
the Global Financial Crisis.4 Yet, the global macro
investment landscape is extremely heterogeneous.
While some managers, like the aforementioned
Soros, Jones, and Paulson have employed “big
picture” forecasting to determine positions and
are willing to take large and unhedged bets, others
search for relative value opportunities across
markets using more technical themes like carry
and trend.
In this paper I present a systematic and diversified
approach to global macro investing grounded
in economic theory. In the spirit of Harding’s
quote, the strategy aims to capitalize on the
tendency of market participants to underreact to
news by positioning on the basis of fundamental
macroeconomic trends across currency, equity and
fixed income markets.5
Using historical data from a number of sources,
I build a simple systematic global macro strategy
back to 1970,6 a nearly half-century long sample
containing a wide variety of macroeconomic
and financial market environments. I examine
the strategy’s performance decade-by-decade, its
correlation to traditional asset classes, and its
returns in bull and bear equity and fixed income
environments. I also compare and contrast the
strategy to popular market-neutral alternative
investment strategies, including trend-following
and long-short style premia (value, momentum,
and carry).7,8 Finally, I examine the extent to which
existing global macro managers are pursuing a
similar investment philosophy, and conclude with
some thoughts on the role of global macro within an
investor’s portfolio.
A Half Century of Macro Momentum 05
Building a Macro Momentum Portfolio
9 Whether a trend is “improving” or “deteriorating” depends on the asset class in question. For example, increasing economic growth within a country is good for that country’s equity market and currency, but is bad for its fixed income assets. See Appendix B for a discussion on the asserted relationships between fundamental macroeconomic trends and asset class returns.
10 Appendix A details the exact markets I consider and the source and length of the historical return data used.11 One could, of course, use more sophisticated measures of each theme (and potentially include additional macro momentum themes). I
intentionally employ relatively simple measures because they afford long data availability and are less susceptible to concerns about data mining. The strategy is therefore intended as a proof of concept, and can potentially be enhanced by employing additional and improved measures of macro momentum.
Methodology
The systematic global macro strategy involves
going long assets for which fundamental
macroeconomic trends are improving and short
assets for which fundamental macroeconomic
trends are deteriorating — an investment style I
label macro momentum.9 I apply this strategy across
four major asset classes: global equity indices,
global currencies, global government bonds (ten-
year maturity), and global interest rates (three-
month maturity), focusing on four macroeconomic
state variables (or themes) that impact each of
the asset classes considered: 1) business cycle, 2)
international trade, 3) monetary policy and 4) risk
sentiment.10 Each theme is represented by relatively
general measures. For example, business cycle
trends are captured using a 50/50 combination of
one-year changes in real GDP growth forecasts and
one-year changes in CPI inflation forecasts, while
international trade trends are measured using one-
year changes in spot FX rates measured against an
export-weighted basket.11
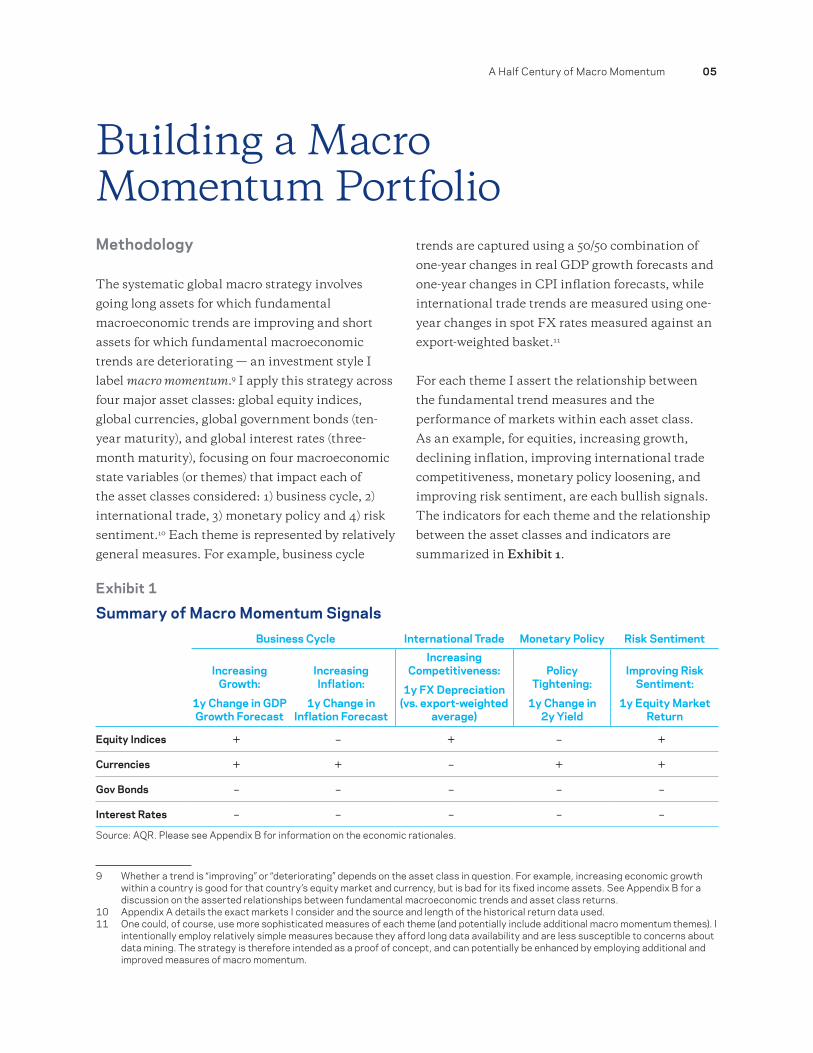
For each theme I assert the relationship between
the fundamental trend measures and the
performance of markets within each asset class.
As an example, for equities, increasing growth,
declining inflation, improving international trade
competitiveness, monetary policy loosening, and
improving risk sentiment, are each bullish signals.
The indicators for each theme and the relationship
between the asset classes and indicators are
summarized in Exhibit 1.
Exhibit 1
Summary of Macro Momentum Signals Business Cycle International Trade Monetary Policy Risk Sentiment
Increasing Growth:
1y Change in GDPGrowth Forecast
Increasing Inflation:
1y Change in Inflation Forecast
Increasing Competitiveness:
1y FX Depreciation(vs. export-weighted
average)
Policy Tightening:
1y Change in 2y Yield
Improving Risk Sentiment:
1y Equity MarketReturn
Equity Indices + – + – +
Currencies + + – + +
Gov Bonds – – – – –
Interest Rates – – – – –Source: AQR. Please see Appendix B for information on the economic rationales.
06 A Half Century of Macro Momentum
Portfolio Construction
For each theme within each asset class, I form
two types of portfolios: long-short and directional.
Long-short portfolios take long (or short)
positions in assets with favorable (or unfavorable)
macroeconomic trends relative to the cross-sectional
average, and are designed to be market neutral at all
points in time. Directional portfolios, on the other
hand, take long positions in assets with favorable
macroeconomic trends and short positions in
assets with unfavorable macroeconomic trends,
regardless of trends in other markets.12 While not
constrained to be market neutral at all points in
time, directional strategies are designed to be
market neutral on average.
12 For “Business Cycle” within each asset class, I average together the growth and inflation portfolios to form a single business cycle portfolio.
13 Each of the 32 asset class-theme portfolios, as well as the three composite portfolios, is scaled to 10% forecasted annual volatility at each point in time. Appendix C details the portfolio construction process.
Long-short and directional portfolios are
aggregated to form three composite portfolios.
‘Asset Class’ portfolios (‘Equity Indices’,
‘Currencies’, ‘Government Bonds’, ‘Interest
Rates’) are formed by taking an equal weighted
average of each of the eight thematic portfolios
(four long-short and four directional) within each
asset class. ‘Thematic’ portfolios (‘Business Cycle’,
‘International Trade’, ‘Monetary Policy’, ‘Risk
Sentiment’) are formed by taking an equal weighted
average of each of the eight asset class portfolios
within each theme. Finally, an ‘Aggregate Macro
Momentum’ portfolio is formed by taking an equal
weighted average across all 32 asset class-theme
portfolios.13
A Half Century of Macro Momentum 07
Performance of Macro Momentum Since 1970
14 All returns throughout the paper are hypothetical, gross of transaction costs and fees. Even after adjusting for transaction costs and fees, backtest returns (and Sharpe ratios) are likely overstated, despite best efforts to employ simple and transparent signals, due to unavoidable hindsight bias. Hypothetical data has inherent limitations, some of which are disclosed herein.
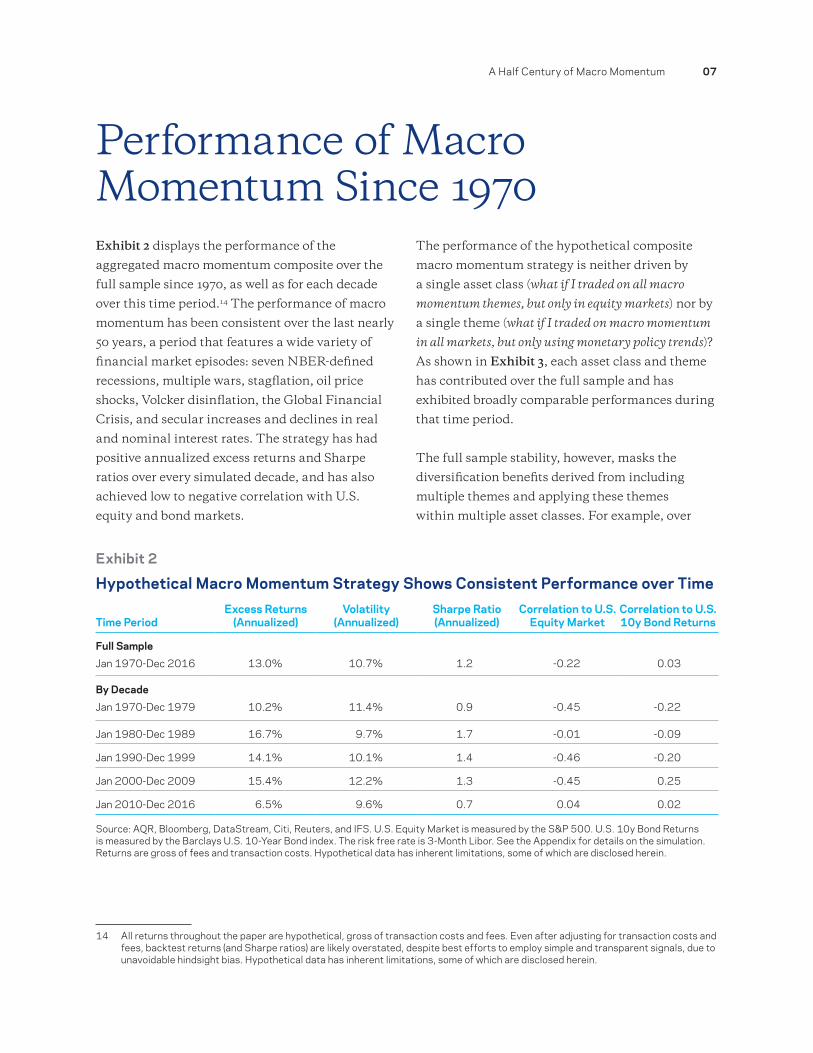
Exhibit 2 displays the performance of the
aggregated macro momentum composite over the
full sample since 1970, as well as for each decade
over this time period.14 The performance of macro
momentum has been consistent over the last nearly
50 years, a period that features a wide variety of
financial market episodes: seven NBER-defined
recessions, multiple wars, stagflation, oil price
shocks, Volcker disinflation, the Global Financial
Crisis, and secular increases and declines in real
and nominal interest rates. The strategy has had
positive annualized excess returns and Sharpe
ratios over every simulated decade, and has also
achieved low to negative correlation with U.S.
equity and bond markets.
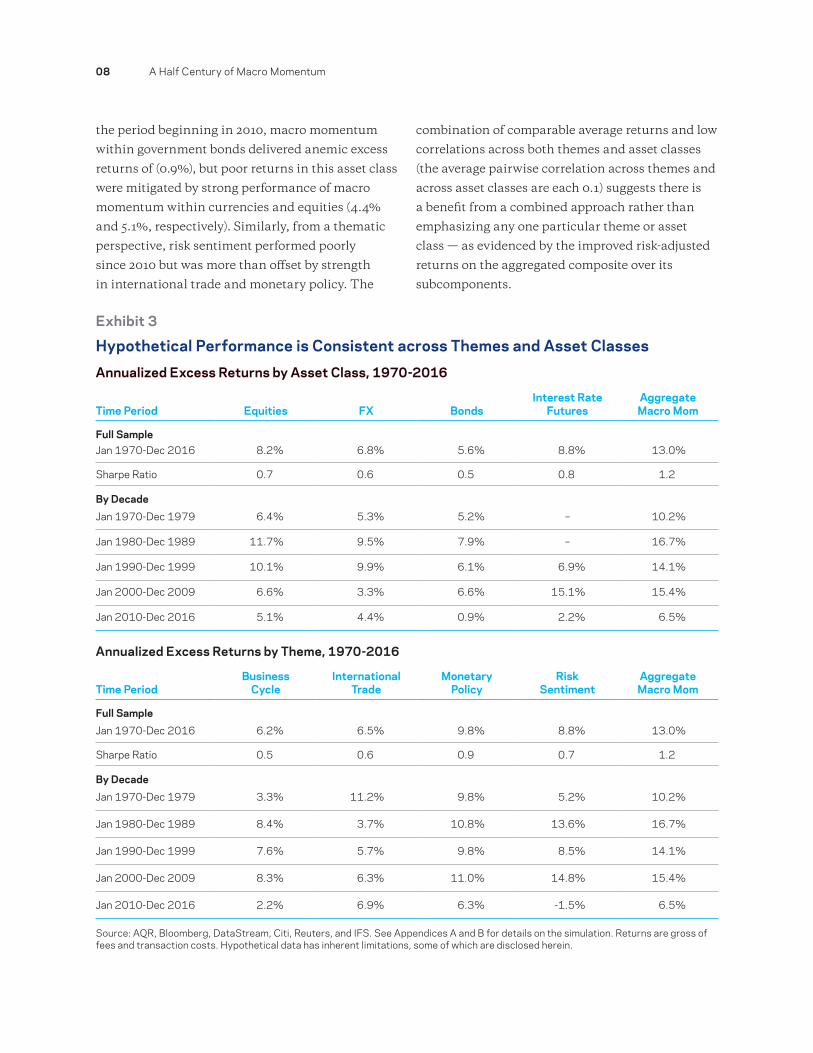
The performance of the hypothetical composite
macro momentum strategy is neither driven by
a single asset class (what if I traded on all macro
momentum themes, but only in equity markets) nor by
a single theme (what if I traded on macro momentum
in all markets, but only using monetary policy trends)?
As shown in Exhibit 3, each asset class and theme
has contributed over the full sample and has
exhibited broadly comparable performances during
that time period.
The full sample stability, however, masks the
diversification benefits derived from including
multiple themes and applying these themes
within multiple asset classes. For example, over
Exhibit 2
Hypothetical Macro Momentum Strategy Shows Consistent Performance over Time
Time PeriodExcess Returns
(Annualized)Volatility
(Annualized)Sharpe Ratio (Annualized)
Correlation to U.S. Equity Market
Correlation to U.S. 10y Bond Returns
Full Sample
Jan 1970-Dec 2016 13.0% 10.7% 1.2 -0.22 0.03
By Decade
Jan 1970-Dec 1979 10.2% 11.4% 0.9 -0.45 -0.22
Jan 1980-Dec 1989 16.7% 9.7% 1.7 -0.01 -0.09
Jan 1990-Dec 1999 14.1% 10.1% 1.4 -0.46 -0.20
Jan 2000-Dec 2009 15.4% 12.2% 1.3 -0.45 0.25
Jan 2010-Dec 2016 6.5% 9.6% 0.7 0.04 0.02
Source: AQR, Bloomberg, DataStream, Citi, Reuters, and IFS. U.S. Equity Market is measured by the S&P 500. U.S. 10y Bond Returns is measured by the Barclays U.S. 10-Year Bond index. The risk free rate is 3-Month Libor. See the Appendix for details on the simulation. Returns are gross of fees and transaction costs. Hypothetical data has inherent limitations, some of which are disclosed herein.
08 A Half Century of Macro Momentum
the period beginning in 2010, macro momentum
within government bonds delivered anemic excess
returns of (0.9%), but poor returns in this asset class
were mitigated by strong performance of macro
momentum within currencies and equities (4.4%
and 5.1%, respectively). Similarly, from a thematic
perspective, risk sentiment performed poorly
since 2010 but was more than offset by strength
in international trade and monetary policy. The
combination of comparable average returns and low
correlations across both themes and asset classes
(the average pairwise correlation across themes and
across asset classes are each 0.1) suggests there is
a benefit from a combined approach rather than
emphasizing any one particular theme or asset
class — as evidenced by the improved risk-adjusted
returns on the aggregated composite over its
subcomponents.
Exhibit 3
Hypothetical Performance is Consistent across Themes and Asset Classes
Annualized Excess Returns by Asset Class, 1970-2016
Time Period Equities FX BondsInterest Rate
FuturesAggregate Macro Mom
Full SampleJan 1970-Dec 2016 8.2% 6.8% 5.6% 8.8% 13.0%
Sharpe Ratio 0.7 0.6 0.5 0.8 1.2
By Decade
Jan 1970-Dec 1979 6.4% 5.3% 5.2% – 10.2%
Jan 1980-Dec 1989 11.7% 9.5% 7.9% – 16.7%
Jan 1990-Dec 1999 10.1% 9.9% 6.1% 6.9% 14.1%
Jan 2000-Dec 2009 6.6% 3.3% 6.6% 15.1% 15.4%
Jan 2010-Dec 2016 5.1% 4.4% 0.9% 2.2% 6.5%
Annualized Excess Returns by Theme, 1970-2016
Time PeriodBusiness
CycleInternational
TradeMonetary
PolicyRisk
SentimentAggregate Macro Mom
Full Sample
Jan 1970-Dec 2016 6.2% 6.5% 9.8% 8.8% 13.0%
Sharpe Ratio 0.5 0.6 0.9 0.7 1.2
By Decade
Jan 1970-Dec 1979 3.3% 11.2% 9.8% 5.2% 10.2%
Jan 1980-Dec 1989 8.4% 3.7% 10.8% 13.6% 16.7%
Jan 1990-Dec 1999 7.6% 5.7% 9.8% 8.5% 14.1%
Jan 2000-Dec 2009 8.3% 6.3% 11.0% 14.8% 15.4%
Jan 2010-Dec 2016 2.2% 6.9% 6.3% -1.5% 6.5%
Source: AQR, Bloomberg, DataStream, Citi, Reuters, and IFS. See Appendices A and B for details on the simulation. Returns are gross of fees and transaction costs. Hypothetical data has inherent limitations, some of which are disclosed herein.
A Half Century of Macro Momentum 09
Macro Momentum and Traditional Asset Classes
15 By way of concession, I don’t know of any investor that actually holds a pure 60/40 portfolio, but it is a reasonable benchmark proxy.
Macro momentum returns exhibit low, and
often negative, correlations to stocks and
bonds. However, correlations alone do not tell
the full story. Macro momentum has attractive
characteristics during periods of market stress,
such as equity market drawdowns and rising real
yield environments, which can provide particularly
beneficial diversification to a canonical 60% equity
and 40% bond portfolio.15
Equity Market Drawdowns
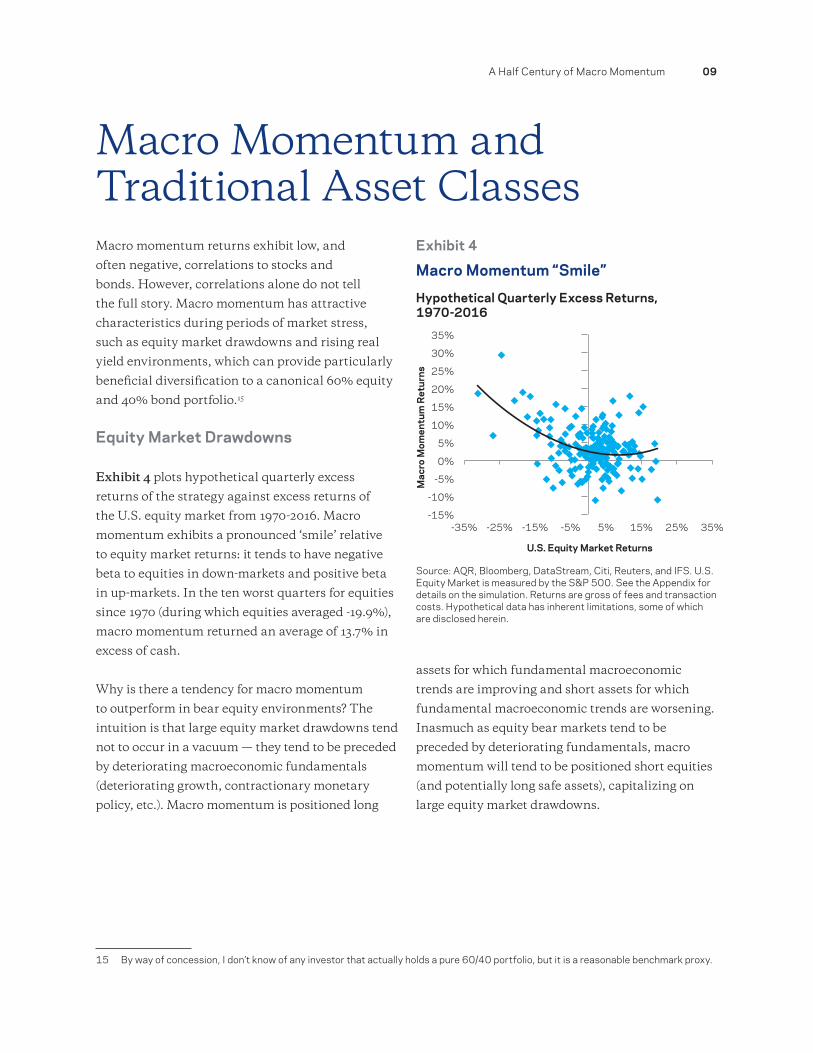
Exhibit 4 plots hypothetical quarterly excess
returns of the strategy against excess returns of
the U.S. equity market from 1970-2016. Macro
momentum exhibits a pronounced ‘smile’ relative
to equity market returns: it tends to have negative
beta to equities in down-markets and positive beta
in up-markets. In the ten worst quarters for equities
since 1970 (during which equities averaged -19.9%),
macro momentum returned an average of 13.7% in
excess of cash.
Why is there a tendency for macro momentum
to outperform in bear equity environments? The
intuition is that large equity market drawdowns tend
not to occur in a vacuum — they tend to be preceded
by deteriorating macroeconomic fundamentals
(deteriorating growth, contractionary monetary
policy, etc.). Macro momentum is positioned long
assets for which fundamental macroeconomic
trends are improving and short assets for which
fundamental macroeconomic trends are worsening.
Inasmuch as equity bear markets tend to be
preceded by deteriorating fundamentals, macro
momentum will tend to be positioned short equities
(and potentially long safe assets), capitalizing on
large equity market drawdowns.
Exhibit 4
Macro Momentum “Smile”
Hypothetical Quarterly Excess Returns, 1970-2016
Source: AQR, Bloomberg, DataStream, Citi, Reuters, and IFS. U.S. Equity Market is measured by the S&P 500. See the Appendix for details on the simulation. Returns are gross of fees and transaction costs. Hypothetical data has inherent limitations, some of which are disclosed herein.
-35% -25% -15% -5% 5% 15% 25% 35%-15%
-10%
-5%
0%
5%
10%
15%
20%
25%
30%
35%
Mac
ro M
omen
tum
Ret
urns
U.S. Equity Market Returns
10 A Half Century of Macro Momentum
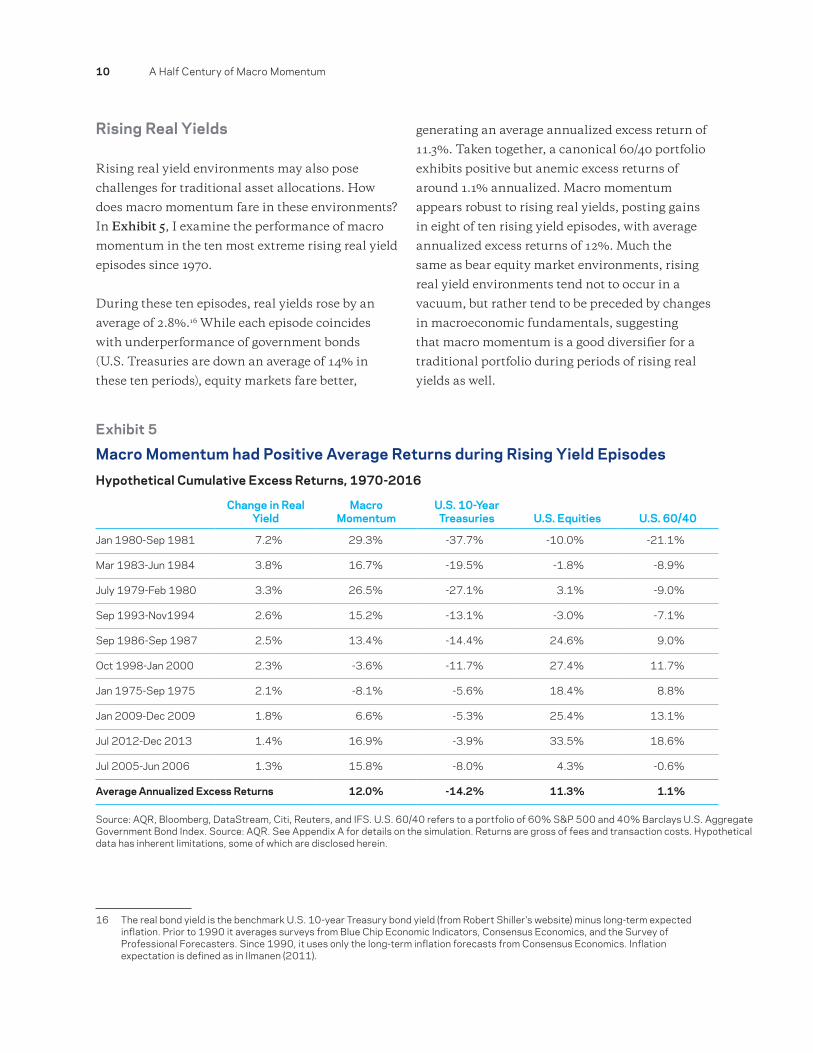
Rising Real Yields
Rising real yield environments may also pose
challenges for traditional asset allocations. How
does macro momentum fare in these environments?
In Exhibit 5, I examine the performance of macro
momentum in the ten most extreme rising real yield
episodes since 1970.
During these ten episodes, real yields rose by an
average of 2.8%.16 While each episode coincides
with underperformance of government bonds
(U.S. Treasuries are down an average of 14% in
these ten periods), equity markets fare better,
16 The real bond yield is the benchmark U.S. 10-year Treasury bond yield (from Robert Shiller's website) minus long-term expected inflation. Prior to 1990 it averages surveys from Blue Chip Economic Indicators, Consensus Economics, and the Survey of Professional Forecasters. Since 1990, it uses only the long-term inflation forecasts from Consensus Economics. Inflation expectation is defined as in Ilmanen (2011).
generating an average annualized excess return of
11.3%. Taken together, a canonical 60/40 portfolio
exhibits positive but anemic excess returns of
around 1.1% annualized. Macro momentum
appears robust to rising real yields, posting gains
in eight of ten rising yield episodes, with average
annualized excess returns of 12%. Much the
same as bear equity market environments, rising
real yield environments tend not to occur in a
vacuum, but rather tend to be preceded by changes
in macroeconomic fundamentals, suggesting
that macro momentum is a good diversifier for a
traditional portfolio during periods of rising real
yields as well.
Exhibit 5
Macro Momentum had Positive Average Returns during Rising Yield EpisodesHypothetical Cumulative Excess Returns, 1970-2016
Change in Real Yield
Macro Momentum
U.S. 10-Year Treasuries U.S. Equities U.S. 60/40
Jan 1980-Sep 1981 7.2% 29.3% -37.7% -10.0% -21.1%
Mar 1983-Jun 1984 3.8% 16.7% -19.5% -1.8% -8.9%
July 1979-Feb 1980 3.3% 26.5% -27.1% 3.1% -9.0%
Sep 1993-Nov1994 2.6% 15.2% -13.1% -3.0% -7.1%
Sep 1986-Sep 1987 2.5% 13.4% -14.4% 24.6% 9.0%
Oct 1998-Jan 2000 2.3% -3.6% -11.7% 27.4% 11.7%
Jan 1975-Sep 1975 2.1% -8.1% -5.6% 18.4% 8.8%
Jan 2009-Dec 2009 1.8% 6.6% -5.3% 25.4% 13.1%
Jul 2012-Dec 2013 1.4% 16.9% -3.9% 33.5% 18.6%
Jul 2005-Jun 2006 1.3% 15.8% -8.0% 4.3% -0.6%
Average Annualized Excess Returns 12.0% -14.2% 11.3% 1.1%
Source: AQR, Bloomberg, DataStream, Citi, Reuters, and IFS. U.S. 60/40 refers to a portfolio of 60% S&P 500 and 40% Barclays U.S. Aggregate Government Bond Index. Source: AQR. See Appendix A for details on the simulation. Returns are gross of fees and transaction costs. Hypothetical data has inherent limitations, some of which are disclosed herein.
A Half Century of Macro Momentum 11
Macro Momentum and Trend-Following Strategies
17 I use an equal weighted average of one-month, three-month, and twelve-month time series momentum strategies applied to the same set of assets as the macro momentum strategy, and scale the portfolio volatility to 10%, similar to our macro momentum strategy.
Having compared returns of macro momentum
to traditional assets, I now review macro
momentum performance relative to familiar
alternative strategies. As macro momentum and
trend-following strategies bear similarities to one
another, I provide a detailed comparison of the
two, with particular attention to the question of
their suitability as complements within investor
portfolios. I then compare macro momentum to
other alternative strategies — including global
macro — in the following section.
Similar yet Different
Trend-following (or time series momentum) and
macro momentum are related investment strategies.
Both begin with the premise that the tendency of
markets to underreact to news creates investment
opportunities that can be exploited by a systematic
and diversified investment process. Trend-following
exploits the tendency of markets to gradually
process new information by positioning on the basis
of price trends (taking long positions in assets that
have appreciated in value and short positions in
assets that have depreciated). Macro momentum,
on the other hand, begins with the same premise
that markets only gradually process news, but
aims to exploit this tendency by positioning on the
basis of fundamental news directly, as opposed to
the price trends such news engenders. Since price
trends and fundamental trends tend to align on
average, one would expect trend-following returns
and macro momentum returns to be
positively correlated.
There are, however, environments where the
performances of these strategies may be expected
to diverge. Market turning points are one example.
Trend-following, almost by construction, will not
immediately adapt to inflection points. Insofar
as turning points are preceded by changes in
macroeconomic fundamentals, however, macro
momentum may be positioned to profit on average.
In addition, macro momentum portfolios take
long-short relative value views within asset classes,
which can further improve its return profile and
reduce its correlation with pure trend-following.
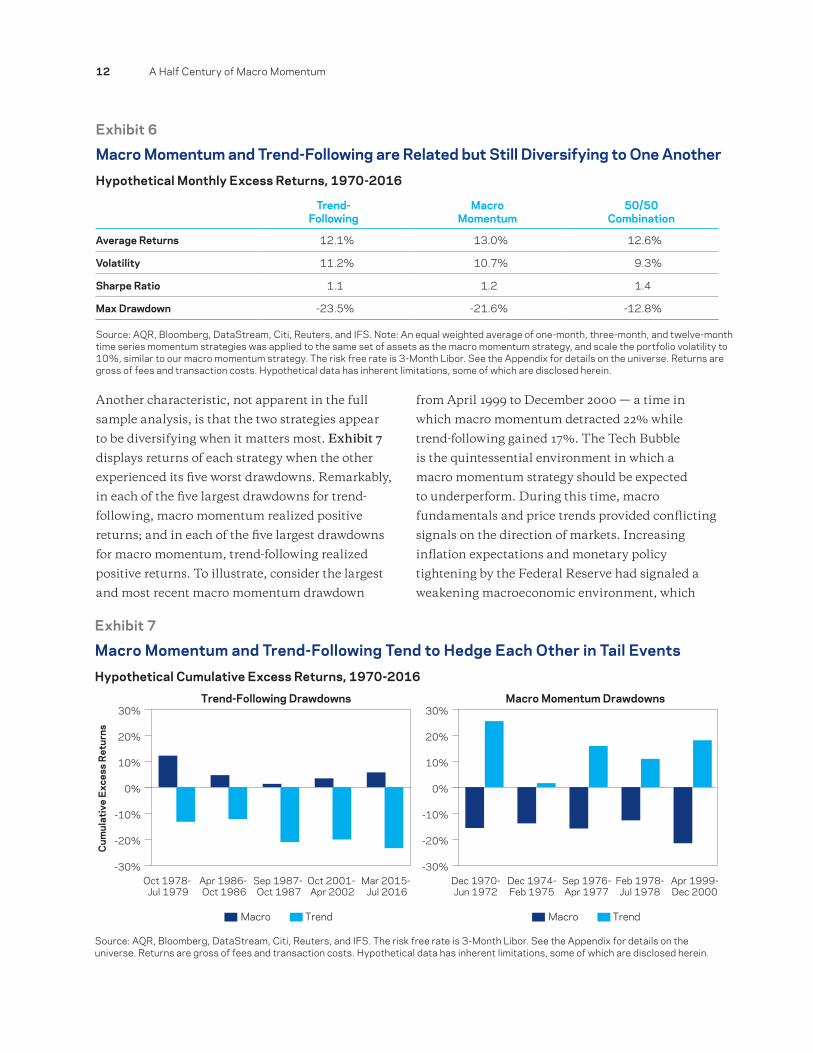
Returns Comparisons
Using the methodology detailed in Hurst,
Ooi, and Pedersen (2014)17, I simulate a simple
trend-following strategy across the exact same
markets already considered. Exhibit 6 provides a
comparison between macro momentum and trend-
following strategies. The two strategies realize a
correlation of 0.4, a magnitude high enough to
confirm the strategies are related, but low enough
to indicate they provide significant diversification.
The 50/50 combination of the two strategies yields
a non-trivial improvement in risk-adjusted returns,
as volatility and maximum drawdown declines
materially, leading to an improved Sharpe of 1.4
(compared to 1.1-1.2 for the individual strategies).
12 A Half Century of Macro Momentum
Another characteristic, not apparent in the full
sample analysis, is that the two strategies appear
to be diversifying when it matters most. Exhibit 7
displays returns of each strategy when the other
experienced its five worst drawdowns. Remarkably,
in each of the five largest drawdowns for trend-
following, macro momentum realized positive
returns; and in each of the five largest drawdowns
for macro momentum, trend-following realized
positive returns. To illustrate, consider the largest
and most recent macro momentum drawdown
from April 1999 to December 2000 — a time in
which macro momentum detracted 22% while
trend-following gained 17%. The Tech Bubble
is the quintessential environment in which a
macro momentum strategy should be expected
to underperform. During this time, macro
fundamentals and price trends provided conflicting
signals on the direction of markets. Increasing
inflation expectations and monetary policy
tightening by the Federal Reserve had signaled a
weakening macroeconomic environment, which
Exhibit 6
Macro Momentum and Trend-Following are Related but Still Diversifying to One AnotherHypothetical Monthly Excess Returns, 1970-2016
Trend- Following
Macro Momentum
50/50 Combination
Average Returns 12.1% 13.0% 12.6%
Volatility 11.2% 10.7% 9.3%
Sharpe Ratio 1.1 1.2 1.4
Max Drawdown -23.5% -21.6% -12.8%
Source: AQR, Bloomberg, DataStream, Citi, Reuters, and IFS. Note: An equal weighted average of one-month, three-month, and twelve-month time series momentum strategies was applied to the same set of assets as the macro momentum strategy, and scale the portfolio volatility to 10%, similar to our macro momentum strategy. The risk free rate is 3-Month Libor. See the Appendix for details on the universe. Returns are gross of fees and transaction costs. Hypothetical data has inherent limitations, some of which are disclosed herein.
Exhibit 7
Macro Momentum and Trend-Following Tend to Hedge Each Other in Tail EventsHypothetical Cumulative Excess Returns, 1970-2016
Source: AQR, Bloomberg, DataStream, Citi, Reuters, and IFS. The risk free rate is 3-Month Libor. See the Appendix for details on the universe. Returns are gross of fees and transaction costs. Hypothetical data has inherent limitations, some of which are disclosed herein.
-30%
-20%
-10%
0%
10%
20%
30%
Mar 2015- Jul 2016
Oct 2001- Apr 2002
Sep 1987- Oct 1987
Apr 1986- Oct 1986
Oct 1978- Jul 1979
-30%
-20%
-10%
0%
10%
20%
30%
Apr 1999-Dec 2000
Feb 1978-Jul 1978
Sep 1976-Apr 1977
Dec 1974-Feb 1975
Dec 1970-Jun 1972
Cum
ulat
ive
Exc
ess
Ret
urns
Macro Trend
Trend-Following Drawdowns Macro Momentum Drawdowns
Macro Trend
A Half Century of Macro Momentum 13
usually precedes falling equity markets, but
“irrational exuberance” among investors prodded
risk assets higher. As a result, macro momentum
suffered losses but trend-following rode price trends
to generate strong gains. Conversely, when the Tech
Bubble burst in 2001 and 2002, trend-following
failed to capture the inflection point and suffered a
roughly 20% drawdown. Macro momentum realized
gains driven partly by bearish equity positions and
bullish U.S. interest rate positions.
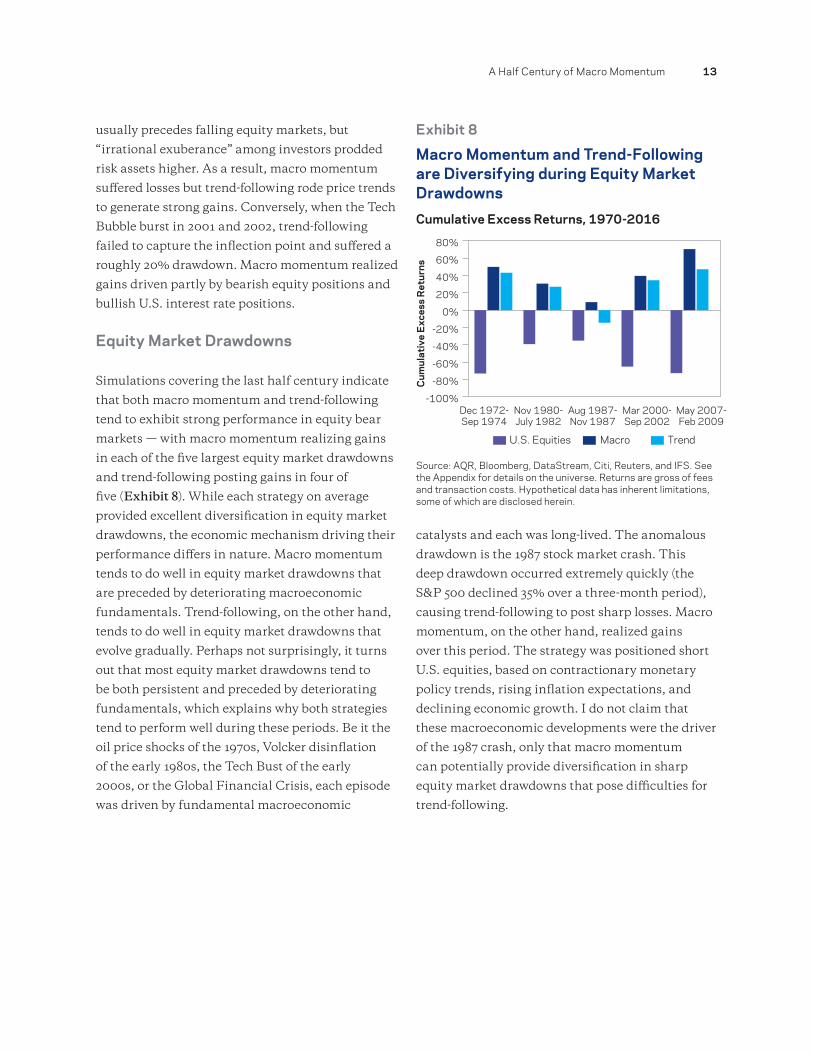
Equity Market Drawdowns
Simulations covering the last half century indicate
that both macro momentum and trend-following
tend to exhibit strong performance in equity bear
markets — with macro momentum realizing gains
in each of the five largest equity market drawdowns
and trend-following posting gains in four of
five (Exhibit 8). While each strategy on average
provided excellent diversification in equity market
drawdowns, the economic mechanism driving their
performance differs in nature. Macro momentum
tends to do well in equity market drawdowns that
are preceded by deteriorating macroeconomic
fundamentals. Trend-following, on the other hand,
tends to do well in equity market drawdowns that
evolve gradually. Perhaps not surprisingly, it turns
out that most equity market drawdowns tend to
be both persistent and preceded by deteriorating
fundamentals, which explains why both strategies
tend to perform well during these periods. Be it the
oil price shocks of the 1970s, Volcker disinflation
of the early 1980s, the Tech Bust of the early
2000s, or the Global Financial Crisis, each episode
was driven by fundamental macroeconomic
catalysts and each was long-lived. The anomalous
drawdown is the 1987 stock market crash. This
deep drawdown occurred extremely quickly (the
S&P 500 declined 35% over a three-month period),
causing trend-following to post sharp losses. Macro
momentum, on the other hand, realized gains
over this period. The strategy was positioned short
U.S. equities, based on contractionary monetary
policy trends, rising inflation expectations, and
declining economic growth. I do not claim that
these macroeconomic developments were the driver
of the 1987 crash, only that macro momentum
can potentially provide diversification in sharp
equity market drawdowns that pose difficulties for
trend-following.
Exhibit 8
Macro Momentum and Trend-Following are Diversifying during Equity Market DrawdownsCumulative Excess Returns, 1970-2016
Source: AQR, Bloomberg, DataStream, Citi, Reuters, and IFS. See the Appendix for details on the universe. Returns are gross of fees and transaction costs. Hypothetical data has inherent limitations, some of which are disclosed herein.
Cum
ulat
ive
Exc
ess
Ret
urns
-100%
-80%
-60%
-40%
-20%
0%
20%
40%
60%
80%
May 2007-Feb 2009
Mar 2000-Sep 2002
Aug 1987-Nov 1987
Nov 1980-July 1982
Dec 1972-Sep 1974
U.S. Equities Macro Trend
14 A Half Century of Macro Momentum
Macro Momentum and Other Alternative Strategies
18 I build long-short style portfolios for each style within each asset class following the long-short portfolio construction methodology outlined earlier. “Diversified Style Premia” takes an equal weighted average across style premia portfolios, rescaled to 10% forecasted volatility.
19 It may initially be surprising that the in-sample performance of macro momentum (1.2 Sharpe ratio) exceeds that of diversified style premia (1.0 Sharpe ratio), given that the latter is a more “diversified” strategy. Recall, however, that macro momentum includes both market-neutral long-short and directional portfolios, while diversified style premia is purely long-short. In addition, we do not include style premia within stock selection.
I also evaluate the performance of macro
momentum relative to other commonly held
alternative strategies such as diversified style
premia, as well as to global macro strategies
managed by a broad range of investment managers
(as defined by the Dow Jones Credit Suisse
(“DJCS”) Global Macro universe). The intention
is to highlight issues to consider when including
macro momentum as part of a broader hedge
fund portfolio.
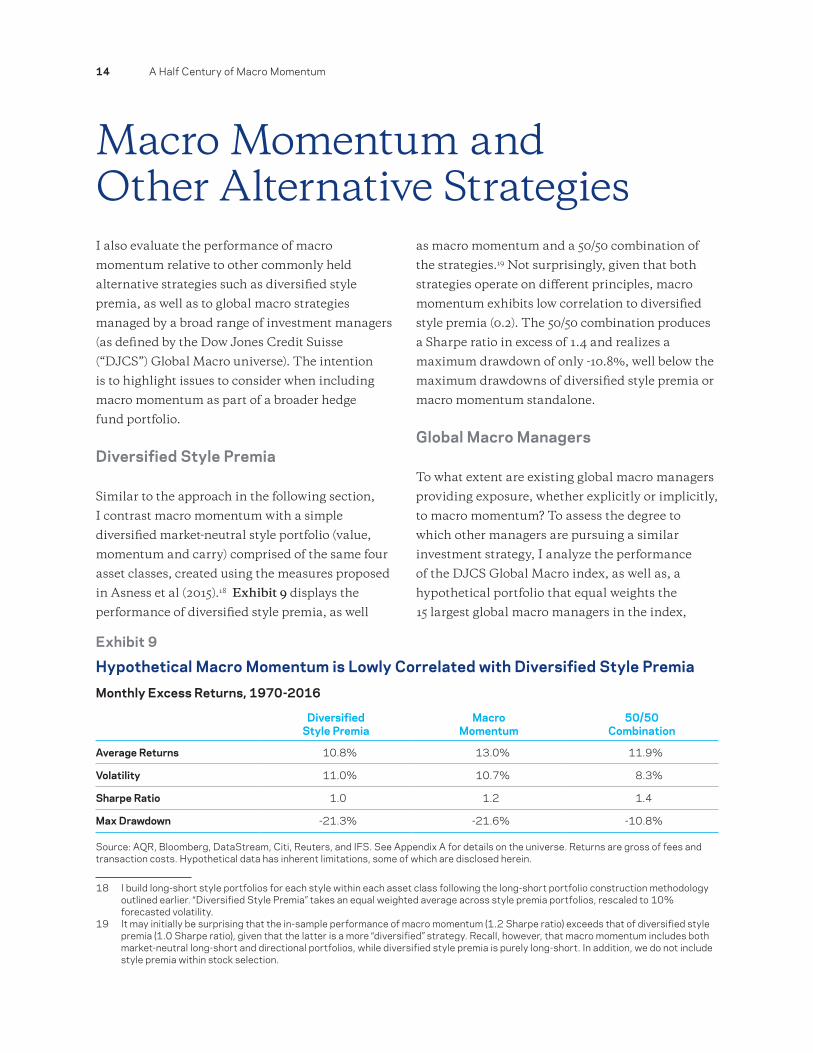
Diversified Style Premia
Similar to the approach in the following section,
I contrast macro momentum with a simple
diversified market-neutral style portfolio (value,
momentum and carry) comprised of the same four
asset classes, created using the measures proposed
in Asness et al (2015).18 Exhibit 9 displays the
performance of diversified style premia, as well
as macro momentum and a 50/50 combination of
the strategies.19 Not surprisingly, given that both
strategies operate on different principles, macro
momentum exhibits low correlation to diversified
style premia (0.2). The 50/50 combination produces
a Sharpe ratio in excess of 1.4 and realizes a
maximum drawdown of only -10.8%, well below the
maximum drawdowns of diversified style premia or
macro momentum standalone.
Global Macro Managers
To what extent are existing global macro managers
providing exposure, whether explicitly or implicitly,
to macro momentum? To assess the degree to
which other managers are pursuing a similar
investment strategy, I analyze the performance
of the DJCS Global Macro index, as well as, a
hypothetical portfolio that equal weights the
15 largest global macro managers in the index,
Exhibit 9
Hypothetical Macro Momentum is Lowly Correlated with Diversified Style PremiaMonthly Excess Returns, 1970-2016
Diversified Style Premia
Macro Momentum
50/50 Combination
Average Returns 10.8% 13.0% 11.9%
Volatility 11.0% 10.7% 8.3%
Sharpe Ratio 1.0 1.2 1.4
Max Drawdown -21.3% -21.6% -10.8%
Source: AQR, Bloomberg, DataStream, Citi, Reuters, and IFS. See Appendix A for details on the universe. Returns are gross of fees and transaction costs. Hypothetical data has inherent limitations, some of which are disclosed herein.
A Half Century of Macro Momentum 15
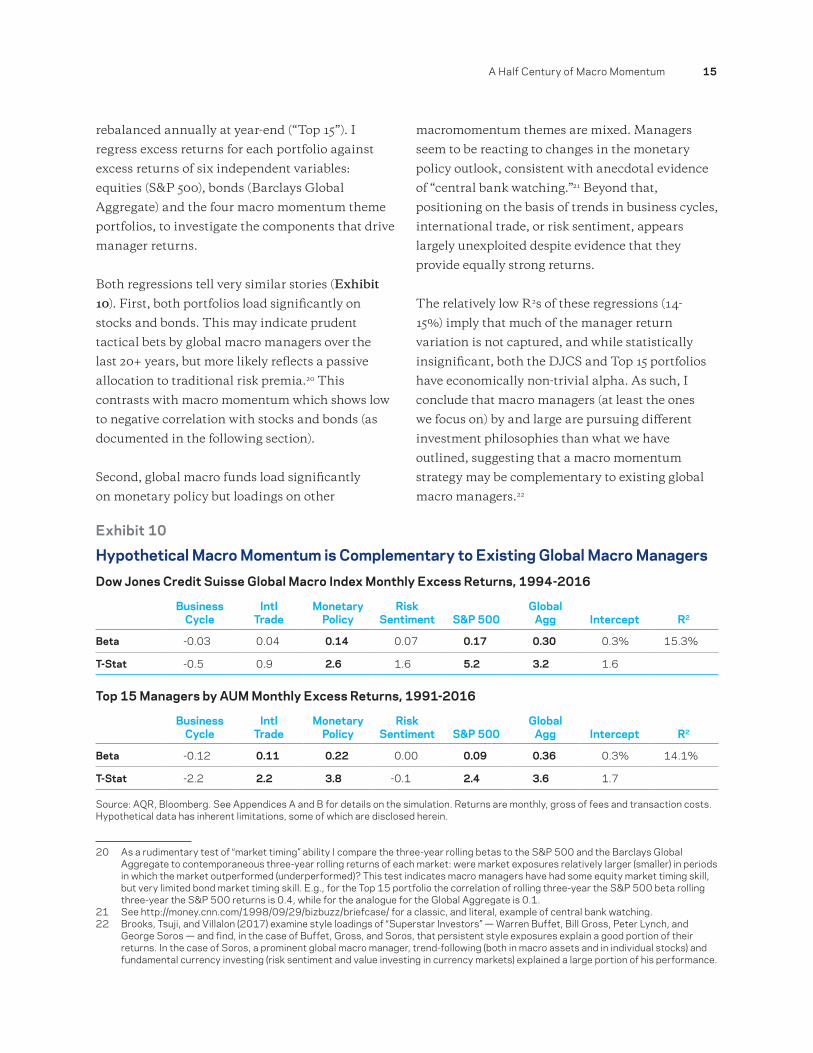
rebalanced annually at year-end (“Top 15”). I
regress excess returns for each portfolio against
excess returns of six independent variables:
equities (S&P 500), bonds (Barclays Global
Aggregate) and the four macro momentum theme
portfolios, to investigate the components that drive
manager returns.
Both regressions tell very similar stories (Exhibit
10). First, both portfolios load significantly on
stocks and bonds. This may indicate prudent
tactical bets by global macro managers over the
last 20+ years, but more likely reflects a passive
allocation to traditional risk premia.20 This
contrasts with macro momentum which shows low
to negative correlation with stocks and bonds (as
documented in the following section).
Second, global macro funds load significantly
on monetary policy but loadings on other
20 As a rudimentary test of “market timing” ability I compare the three-year rolling betas to the S&P 500 and the Barclays Global Aggregate to contemporaneous three-year rolling returns of each market: were market exposures relatively larger (smaller) in periods in which the market outperformed (underperformed)? This test indicates macro managers have had some equity market timing skill, but very limited bond market timing skill. E.g., for the Top 15 portfolio the correlation of rolling three-year the S&P 500 beta rolling three-year the S&P 500 returns is 0.4, while for the analogue for the Global Aggregate is 0.1.
21 See http://money.cnn.com/1998/09/29/bizbuzz/briefcase/ for a classic, and literal, example of central bank watching.22 Brooks, Tsuji, and Villalon (2017) examine style loadings of “Superstar Investors” — Warren Buffet, Bill Gross, Peter Lynch, and
George Soros — and find, in the case of Buffet, Gross, and Soros, that persistent style exposures explain a good portion of their returns. In the case of Soros, a prominent global macro manager, trend-following (both in macro assets and in individual stocks) and fundamental currency investing (risk sentiment and value investing in currency markets) explained a large portion of his performance.
macromomentum themes are mixed. Managers
seem to be reacting to changes in the monetary
policy outlook, consistent with anecdotal evidence
of “central bank watching.”21 Beyond that,
positioning on the basis of trends in business cycles,
international trade, or risk sentiment, appears
largely unexploited despite evidence that they
provide equally strong returns.
The relatively low R2s of these regressions (14-
15%) imply that much of the manager return
variation is not captured, and while statistically
insignificant, both the DJCS and Top 15 portfolios
have economically non-trivial alpha. As such, I
conclude that macro managers (at least the ones
we focus on) by and large are pursuing different
investment philosophies than what we have
outlined, suggesting that a macro momentum
strategy may be complementary to existing global
macro managers.22
Exhibit 10
Hypothetical Macro Momentum is Complementary to Existing Global Macro ManagersDow Jones Credit Suisse Global Macro Index Monthly Excess Returns, 1994-2016
Business Cycle
Intl Trade
Monetary Policy
Risk Sentiment S&P 500
Global Agg Intercept R2
Beta -0.03 0.04 0.14 0.07 0.17 0.30 0.3% 15.3%
T-Stat -0.5 0.9 2.6 1.6 5.2 3.2 1.6
Top 15 Managers by AUM Monthly Excess Returns, 1991-2016
Business Cycle
Intl Trade
Monetary Policy
Risk Sentiment S&P 500
Global Agg Intercept R2
Beta -0.12 0.11 0.22 0.00 0.09 0.36 0.3% 14.1%
T-Stat -2.2 2.2 3.8 -0.1 2.4 3.6 1.7
Source: AQR, Bloomberg. See Appendices A and B for details on the simulation. Returns are monthly, gross of fees and transaction costs. Hypothetical data has inherent limitations, some of which are disclosed herein.
16 A Half Century of Macro Momentum
Summary and Discussion
23 This might be akin to an investor making a core allocation to a diversified style premia portfolio, while also maintaining some exposure to more “traditional” concentrated fundamental managers.
Macro momentum, a systematic approach to global
macro investing that takes long positions in assets
with improving fundamental trends and short
positions in assets with deteriorating fundamental
trends, has performed consistently over nearly the
last half century. The strategy is highly diversifying
to traditional assets, tending to provide an excellent
hedge in both large equity market drawdowns and
rising real yield environments. Macro momentum
is related to trend-following — with the former
positioning on the basis of fundamental trends and
the latter positioning on the basis of price trends
— but the two strategies are complementary. Their
low average correlation, tendency to drawdown at
different times, and complementary equity tail-
hedging properties suggests that investors may
be well-served to have exposures to both of these
investment strategies within their portfolio.
The analysis of global macro hedge funds,
suggests that investors are not getting sufficient
macro momentum exposures from existing global
macro managers. Inasmuch as existing managers
implicitly or explicitly position on the basis of
fundamental macro trends, the evidence suggests
they are primarily focused on monetary policy,
which is but one of four profitable dimensions
I have identified. Given the systematic macro
momentum strategy outlined in this paper tends to
be more diversified across both assets and themes
than the global macro space in general, and given
its appealing tail performance, a diversified macro
momentum-based strategy is potentially suitable
to be a core global macro holding, and can be
accompanied by other, more concentrated, global
macro managers.23
This paper makes a strategic case for macro
momentum on the basis of its strong historical
performance over nearly 50 years, its tendency to
be diversifying to traditional assets, and its low
correlation to other alternative risk premia. Given
the current (as of July 2017) elevated level of equity
valuations and historically low real yields on bonds,
there are strong reasons to believe medium-term
performance for traditional assets will not be as
impressive as in the past. This strengthens the
tactical case for alternative strategies in general,
and macro momentum in particular, given its
propensity to perform well in bear stock and bond
market environments.
A Half Century of Macro Momentum 17
ReferencesAsness, C. S., Moskowitz, T. J. and Pedersen, L. H. (2013), “Value and Momentum Everywhere.”
Journal of Finance, 68: 929–985.
Barberis, N., Shleifer A., and Vishny, R. (1998), “A Model of Investor Sentiment.” Journal of Financial
Economics, 49 (3): 307-343.
Bernanke, B. S., and Kuttner, K. N., (2005), “What Explains the Stocks Market’s Reaction to Federal
Reserve Policy?” Journal of Finance, 60 (3): 1221–1257.
Brooks, J., Katz, M., and Lustig, H. N. (Forthcoming), “The Post-FOMC Announcement Drift.” AQR
Capital Management White Paper.
Chan, W. (2003), “Stock Price Reaction to News and No-News: Drift and Reversal after Headlines.”
Journal of Financial Economics, 70 (2): 223-260.
Clarida, R. H., and Waldman, D. (2008), “Is Bad News About Inflation Good News About the Exchange
Rate? And If So, Can That Tell Us Anything About the Conduct of Monetary Policy.” Chapter in Asset
Prices and Monetary Policy. Ed. John Y. Campbell. Chicago Undersity Press, 371-396.
Daniel, K., Hirshleifer, D. and Subrahmanyam, A. (1998), “Investor Psychology and Security Market
Under- and Overreactions.” Journal of Finance, 53 (6): 1839–1885.
Eichenbaum, M., and Evans, C. L. (1995), “Some Empirical Evidence on the Effects of Shocks to Monetary
Policy on Exchange Rates.” Quarterly Journal of Economics, 110 (4): 975-1009.
Frazzini, A. (2006), “The Disposition Effect and Underreaction to News.” Journal of Finance, 61 (4):
2017–2046.
Hong, H., and Stein, J. C. (1999), “A Unified Theory of Underreaction, Momentum Trading and
Overreaction in Asset Markets.” Journal of Finance, 54 (6): 2143-2184.
Hurst, B., Ooi, Y. H., and Pedersen, L. H. (2014), “Century of Evidence on Trend-Following Investing.”
AQR Capital Management White Paper.
Ilmanen, A. (2011). Expected Returns: An Investor’s Guide to Harvesting Market Rewards. Chichester,
West Sussex, U.K: Wiley.
Katz, M., Lustig, H. N., and Nielsen, L. (2016). “Are Stocks Real Assets? Sticky Discount Rates in Stocks
Markets.”. Review of Financial Studies, 30 (2): 539-587.
Moskowitz, T., Ooi, Y. H., and Pedersen, L. H. (2012). “Time Series Momentum.” Journal of Financial
Economics, 104 (2): 228-250.
Sinha, N. R. 2016. “Underreaction to News in the U.S. Stock Market.” Quarterly Journal of Finance
06 (2): 1-46.
Swaminathan, B. and Sanjeev, B. (2006), “Macromomentum: Returns Predictability in International
Equity Indices.” Journal of Business, 79 (1): 429-451.
18 A Half Century of Macro Momentum
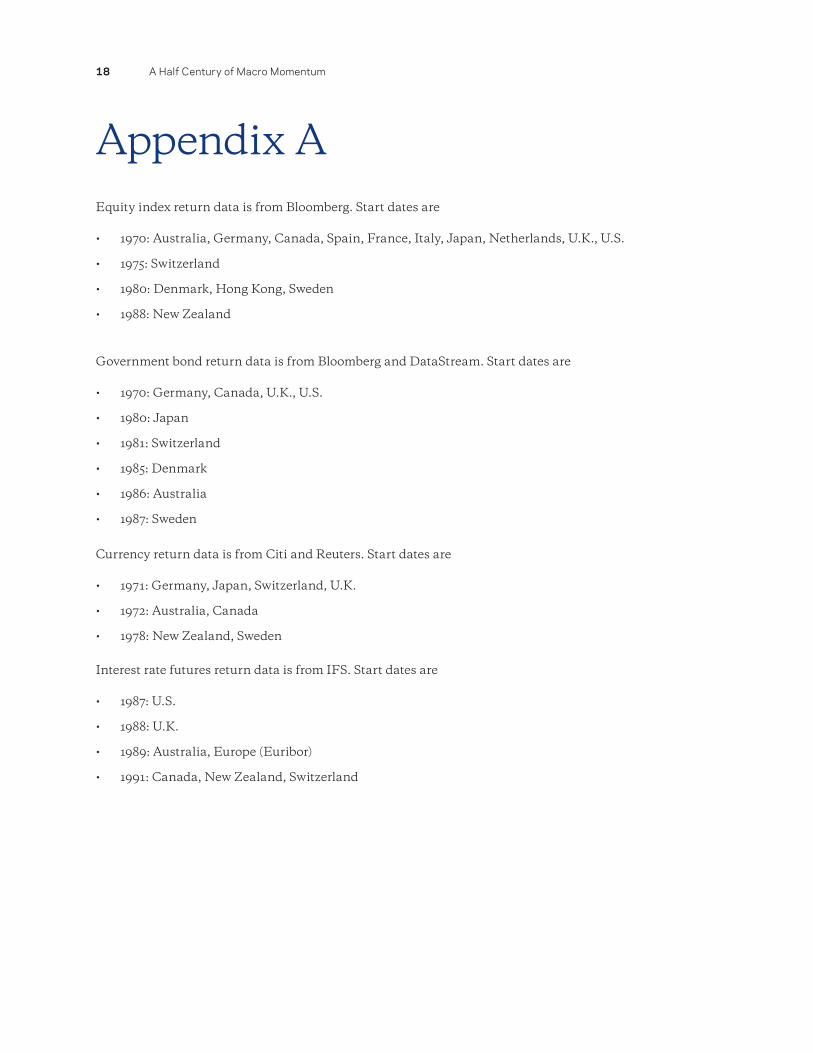
Appendix AEquity index return data is from Bloomberg. Start dates are
• 1970: Australia, Germany, Canada, Spain, France, Italy, Japan, Netherlands, U.K., U.S.
• 1975: Switzerland
• 1980: Denmark, Hong Kong, Sweden
• 1988: New Zealand
Government bond return data is from Bloomberg and DataStream. Start dates are
• 1970: Germany, Canada, U.K., U.S.
• 1980: Japan
• 1981: Switzerland
• 1985: Denmark
• 1986: Australia
• 1987: Sweden
Currency return data is from Citi and Reuters. Start dates are
• 1971: Germany, Japan, Switzerland, U.K.
• 1972: Australia, Canada
• 1978: New Zealand, Sweden
Interest rate futures return data is from IFS. Start dates are
• 1987: U.S.
• 1988: U.K.
• 1989: Australia, Europe (Euribor)
• 1991: Canada, New Zealand, Switzerland
A Half Century of Macro Momentum 19
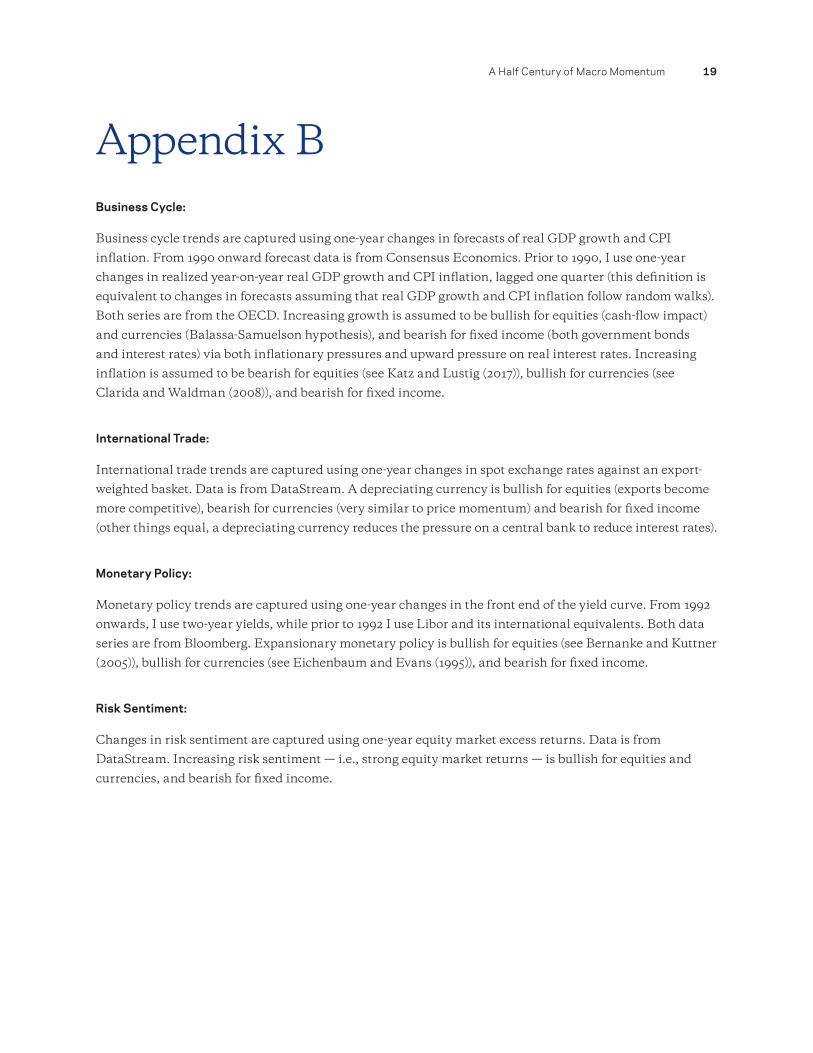
Appendix BBusiness Cycle:
Business cycle trends are captured using one-year changes in forecasts of real GDP growth and CPI
inflation. From 1990 onward forecast data is from Consensus Economics. Prior to 1990, I use one-year
changes in realized year-on-year real GDP growth and CPI inflation, lagged one quarter (this definition is
equivalent to changes in forecasts assuming that real GDP growth and CPI inflation follow random walks).
Both series are from the OECD. Increasing growth is assumed to be bullish for equities (cash-flow impact)
and currencies (Balassa-Samuelson hypothesis), and bearish for fixed income (both government bonds
and interest rates) via both inflationary pressures and upward pressure on real interest rates. Increasing
inflation is assumed to be bearish for equities (see Katz and Lustig (2017)), bullish for currencies (see
Clarida and Waldman (2008)), and bearish for fixed income.
International Trade:
International trade trends are captured using one-year changes in spot exchange rates against an export-
weighted basket. Data is from DataStream. A depreciating currency is bullish for equities (exports become
more competitive), bearish for currencies (very similar to price momentum) and bearish for fixed income
(other things equal, a depreciating currency reduces the pressure on a central bank to reduce interest rates).
Monetary Policy:
Monetary policy trends are captured using one-year changes in the front end of the yield curve. From 1992
onwards, I use two-year yields, while prior to 1992 I use Libor and its international equivalents. Both data
series are from Bloomberg. Expansionary monetary policy is bullish for equities (see Bernanke and Kuttner
(2005)), bullish for currencies (see Eichenbaum and Evans (1995)), and bearish for fixed income.
Risk Sentiment:
Changes in risk sentiment are captured using one-year equity market excess returns. Data is from
DataStream. Increasing risk sentiment — i.e., strong equity market returns — is bullish for equities and
currencies, and bearish for fixed income.
20 A Half Century of Macro Momentum
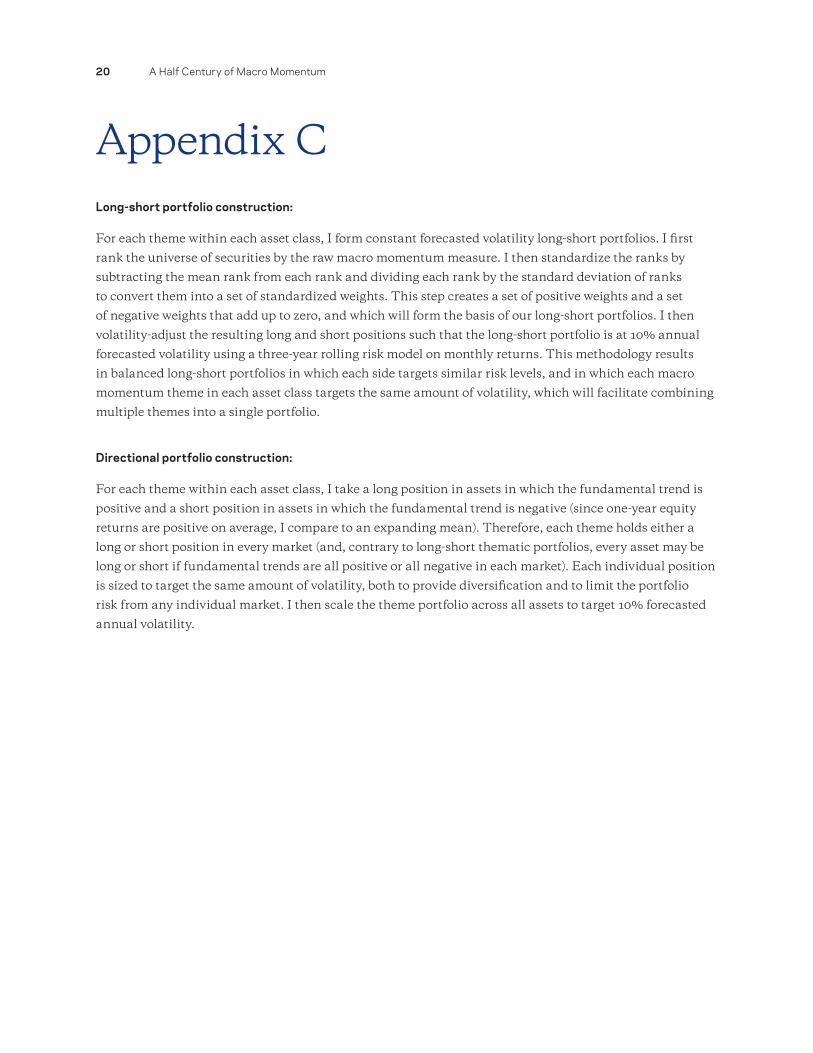
Appendix CLong-short portfolio construction:
For each theme within each asset class, I form constant forecasted volatility long-short portfolios. I first
rank the universe of securities by the raw macro momentum measure. I then standardize the ranks by
subtracting the mean rank from each rank and dividing each rank by the standard deviation of ranks
to convert them into a set of standardized weights. This step creates a set of positive weights and a set
of negative weights that add up to zero, and which will form the basis of our long-short portfolios. I then
volatility-adjust the resulting long and short positions such that the long-short portfolio is at 10% annual
forecasted volatility using a three-year rolling risk model on monthly returns. This methodology results
in balanced long-short portfolios in which each side targets similar risk levels, and in which each macro
momentum theme in each asset class targets the same amount of volatility, which will facilitate combining
multiple themes into a single portfolio.
Directional portfolio construction:
For each theme within each asset class, I take a long position in assets in which the fundamental trend is
positive and a short position in assets in which the fundamental trend is negative (since one-year equity
returns are positive on average, I compare to an expanding mean). Therefore, each theme holds either a
long or short position in every market (and, contrary to long-short thematic portfolios, every asset may be
long or short if fundamental trends are all positive or all negative in each market). Each individual position
is sized to target the same amount of volatility, both to provide diversification and to limit the portfolio
risk from any individual market. I then scale the theme portfolio across all assets to target 10% forecasted
annual volatility.

A Half Century of Macro Momentum 21
Notes
22 A Half Century of Macro Momentum
DisclosuresThis document has been provided to you solely for information purposes and does not constitute an offer or solicitation of an offer or any advice or recommendation to purchase any securities or other financial instruments and may not be construed as such. The factual information set forth herein has been obtained or derived from sources believed by the author and AQR Capital Management, LLC (“AQR”) to be reliable but it is not necessarily all-inclusive and is not guaranteed as to its accuracy and is not to be regarded as a representation or warranty, express or implied, as to the information’s accuracy or completeness, nor should the attached information serve as the basis of any investment decision. This document is intended exclusively for the use of the person to whom it has been delivered by AQR, and it is not to be reproduced or redistributed to any other person. The information set forth herein has been provided to you as secondary information and should not be the primary source for any investment or allocation decision.
Past performance is not a guarantee of future performance.
This presentation is not research and should not be treated as research. This presentation does not represent valuation judgments with respect to any financial instrument, issuer, security or sector that may be described or referenced herein and does not represent a formal or official view of AQR.
The views expressed reflect the current views as of the date hereof and neither the author nor AQR undertakes to advise you of any changes in the views expressed herein. It should not be assumed that the author or AQR will make investment recommendations in the future that are consistent with the views expressed herein, or use any or all of the techniques or methods of analysis described herein in managing client accounts. AQR and its affiliates may have positions (long or short) or engage in securities transactions that are not consistent with the information and views expressed in this presentation.
The information contained herein is only as current as of the date indicated, and may be superseded by subsequent market events or for other reasons. Charts and graphs provided herein are for illustrative purposes only. The information in this presentation has been developed internally and/or obtained from sources believed to be reliable; however, neither AQR nor the author guarantees the accuracy, adequacy or completeness of such information. Nothing contained herein constitutes investment, legal, tax or other advice nor is it to be relied on in making an investment or other decision.
There can be no assurance that an investment strategy will be successful. Historic market trends are not reliable indicators of actual future market behavior or future performance of any particular investment which may differ materially, and should not be relied upon as such. Target allocations contained herein are subject to change. There is no assurance that the target allocations will be achieved, and actual allocations may be significantly different than that shown here. This presentation should not be viewed as a current or past recommendation or a solicitation of an offer to buy or sell any securities or to adopt any investment strategy.
The information in this presentation may contain projections or other forward-looking statements regarding future events, targets, forecasts or expectations regarding the strategies described herein, and is only current as of the date indicated. There is no assurance that such events or targets will be achieved, and may be significantly different from that shown here. The information in this presentation, including statements concerning financial market trends, is based on current market conditions, which will fluctuate and may be superseded by subsequent market events or for other reasons. Performance of all cited indices is calculated on a total return basis with dividends reinvested.
Diversification does not eliminate the risk of experiencing investment losses. Broad-based securities indices are unmanaged and are not subject to fees and expenses typically associated with managed accounts or investment funds. Investments cannot be made directly in an index.
The investment strategy and themes discussed herein may be unsuitable for investors depending on their specific investment objectives and financial situation. Please note that changes in the rate of exchange of a currency may affect the value, price or income of an investment adversely.
Neither AQR nor the author assumes any duty to, nor undertakes to update forward looking statements. No representation or warranty, express or implied, is made or given by or on behalf of AQR, the author or any other person as to the accuracy and completeness or fairness of the information contained in this presentation, and no responsibility or liability is accepted for any such information. By accepting this presentation in its entirety, the recipient acknowledges its understanding and acceptance of the foregoing statement.
The data and analysis contained herein are based on theoretical and model portfolios and are not representative of the performance of funds or portfolios that AQR currently manages. Volatility targeted investing described herein will not always be successful at controlling a portfolio’s risk or limiting portfolio losses. This process may be subject to revision over time.
A Half Century of Macro Momentum 23
Hypothetical performance results (e.g., quantitative backtests) have many inherent limitations, some of which, but not all, are described herein. No representation is being made that any fund or account will or is likely to achieve profits or losses similar to those shown herein. In fact, there are frequently sharp differences between hypothetical performance results and the actual results subsequently realized by any particular trading program. One of the limitations of hypothetical performance results is that they are generally prepared with the benefit of hindsight. In addition, hypothetical trading does not involve financial risk, and no hypothetical trading record can completely account for the impact of financial risk in actual trading. For example, the ability to withstand losses or adhere to a particular trading program in spite of trading losses are material points which can adversely affect actual trading results. The hypothetical performance results contained herein represent the application of the quantitative models as currently in effect on the date first written above and there can be no assurance that the models will remain the same in the future or that an application of the current models in the future will produce similar results because the relevant market and economic conditions that prevailed during the hypothetical performance period will not necessarily recur. There are numerous other factors related to the markets in general or to the implementation of any specific trading program which cannot be fully accounted for in the preparation of hypothetical performance results, all of which can adversely affect actual trading results. Discounting factors may be applied to reduce suspected anomalies. This backtest’s return, for this period, may vary depending on the date it is run. Hypothetical performance results are presented for illustrative purposes only. In addition, our transaction cost assumptions utilized in backtests, where noted, are based on AQR’s historical realized transaction costs and market data. Certain of the assumptions have been made for modeling purposes and are unlikely to be realized. No representation or warranty is made as to the reasonableness of the assumptions made or that all assumptions used in achieving the returns have been stated or fully considered. Changes in the assumptions may have a material impact on the hypothetical returns presented. Hypothetical performance is gross of advisory fees, net of transaction costs, and includes the reinvestment of dividends. If the expenses were reflected, the performance shown would be lower.
There is a risk of substantial loss associated with trading commodities, futures, options, derivatives and other financial instruments. Before trading, investors should carefully consider their financial position and risk tolerance to determine if the proposed trading style is appropriate. Investors should realize that when trading futures, commodities, options, derivatives and other financial instruments one could lose the full balance of their account. It is also possible to lose more than the initial deposit when trading derivatives or using leverage. All funds committed to such a trading strategy should be purely risk capital.

www.aqr.com
AQR Capital Management, LLC Two Greenwich Plaza, Greenwich, CT 06830 P +1.203.742.3600 F +1.203.742.3100