august 2013 - labex refi … · august 2013 christophe moussu1 escp europe, labex refi arthur...
TRANSCRIPT

1
ROE in Banks : Myth and Reality
August 2013
Christophe Moussu1
ESCP Europe, Labex Refi
Arthur Petit-Romec2
ESCP Europe
JEL Classification: G01, G21, G28, G32
Keywords: Return on equity, risk-taking, financial crisis, bank performance
1Corresponding author: ESCP Europe, 79 avenue de la République 75543 Paris Cedex 11, France. Tel:
+33 1 49 23 22 69; Fax: +33 1 49 23 20 80; E-mail: [email protected]
2 ESCP Europe, 79 avenue de la République 75543 Paris Cedex 11, France. Tel: +33 1 49 23 20 33;
Fax: +33 1 49 23 20 80; E-mail: [email protected]

2
Abstract:
Return on Equity (RoE) is a central measure of performance in the banking industry,
which is used to allocate capital inside and across divisions. The reliance on this metric
emerged from the risk management approach to banking which underlies bank capital
regulation. Using the financial crisis, we reveal that the pre-crisis RoE has a strong impact on
the destruction of value for shareholders for a sample of large banks in 28 countries. This
impact is very robust to the introduction of numerous observable risk variables, the restriction
of the sample to deposit-taking banks and alternative definitions of RoE. We document a
sensitivity of bank CEO compensation to RoE. Our results strongly suggest that the reliance
on RoE as a performance measure is a key incentive to excessive risk-taking in banks.
JEL Classification: G01, G21, G28, G32
Keywords: Return on equity; risk-taking; financial crisis; bank performance

3
1. Introduction
A great deal of anecdotal evidence suggests that the return on equity (RoE) was a central
measure of performance used in banks before the crisis. According to Jenkins3, “Still today,
most banks around the world use return on equity – RoE – as their main metric of
profitability. Despite the carnage of the crisis, and the lessons of excessive risk-taking it
conveyed, some banks are even targeting higher RoEs than they achieved in the boom years.”
As such, the reliance on RoE has obviously survived the financial crisis. Target RoEs are not
only set at the bank level but are used to drive resource allocation across and even inside
divisions.
This reliance on RoE has emerged through the regulation of bank capital and the belief that
equity is costly and should be minimised. As Admati et al. (2011) argue, this belief is a
fallacy, and the sole rationality for economising equity is related to the fact that deposits and
debt are subsidised, given the existence of deposit insurance and bailout provisions.
According to Admati et al. (2012), the strong resistance of banks to deleveraging reveals a
real “addiction” of banks to leverage, which they attribute to a debt overhang effect.
In this paper we follow a different approach and choose to focus on the incentives
conveyed by performance measurement in banks. Our main hypothesis is that, despite its
legitimacy from a risk management and regulatory perspective, reliance on RoE as a central
measure of performance is responsible for strategies of excessive risk-taking. If regulation
was perfect or risk management strategies efficient, the level of equity should perfectly be
adjusted upward to any incremental risk taken by the banks. If the risks are assessed correctly
and if the capital constraint is binding, Kim and Santomero (1988) show that RoE should not
increase as a result of a riskier portfolio of assets. Consequently, higher RoE would signal
3 Financial Times, 7
th November 2011

4
higher rents or more value creation, but it should not be associated statistically with higher
risk. This is the rationale for using RoE to assess bank performance and allocate capital across
and inside divisions.
Nevertheless, as Rajan (2005) argues, evaluating the true nature of bank performance is a
very complicated task, since it requires disentangling the part of the performance which is the
result of a genuine value creation from the part which is the result of higher (and not easily
observable) risks. Indeed, higher returns can always be obtained by taking more risks, and if
risks are hidden or underestimated, risk-taking may seem value-enhancing as long as risks
have not materialised. However, the financial crisis revealed the real risks taken by the banks
through the huge losses borne by their shareholders. In order to test our main hypothesis, we
examine whether the pre-crisis RoE of banks has an impact on the losses suffered by
shareholders in the crisis. If RoE is a relevant performance measure, this association should
be rejected.
Our results reveal that RoE has a strong and economically significant impact on the
destruction of value for shareholders during the crisis, based on a sample of 273 large banks
from 28 countries. In all our specifications we use country-variables to control for the
differences in the intensity of financial regulation across countries. This result, which rejects
the null hypothesis that RoE should not be associated with higher risk, casts serious doubt on
the relevance of RoE as a performance measure to drive capital allocation inside banks and to
assess bank performance. Our results are very robust to the introduction of numerous
variables, controlling for risks, both on the asset and the liability side of bank balance sheets,
and market measures of risk. Many of our risk variables have a significant impact on
shareholder losses, which confirms that they definitively capture elements of risk that
materialised during the crisis. However, the fact that a residual effect of RoE remains after the
introduction of these variables strongly suggests that, on top of being a poor performance

5
measure, it was responsible for risk-taking in banks. RoE as a performance measure may also
be responsible for risks captured by our control variables, biasing its impact downwards.
We conduct robustness tests and reveal that our results remain robust when we restrict the
sample to deposit-taking banks. Results are also robust in regard to alternative measures of
short-term performance, notably alternative definitions of RoE and the use of return on assets
RoA. The results on RoA support the idea that excessive risk-taking flowed not only from the
funding strategy of banks but also from tradeoffs on the asset side, thus favouring excessive
risks.
In order to test the interest of managers in RoE maximisation, we investigate the impact of
RoE on total CEO compensation for a reduced sample of 64 banks for which data on
compensation are available. We find that total CEO compensation is sensitive to RoE, which
suggests that monetary incentives to maximise RoE existed before the crisis. Our paper is
related to the findings of Bhattacharyya and Purnanandam (2012) that the involvement of US
commercial banks in mortgage-backed securities was negatively associated with stock
performance but increased the earnings per share, with a higher sensitivity of their
compensation to the latter than the former.
The rest of the paper is organised as follows. The next section describes the sample, the
empirical methodology and the variables. In section 3, we present and interpret the empirical
results. In section 4, we provide additional results on a sample restricted to deposit-taking
banks and using alternative RoE measures. In section 5, we focus on CEO compensation and
we conclude in section 6.

6
2. Sample construction, description of variables and summary statistics
2.1 Sample construction
The starting point for the construction of the sample is every financial institution
available on the Bankscope database for the year 2006. First, we exclude from the sample the
banks which are not listed, because our main dependent variable is the buy-and-hold stock
return of banks during the crisis. However, we keep in our sample those banks which delisted
after the crisis. Second, we only keep banks from those countries for which Djankov, La
Porta, Lopez-de-Silanes and Shleifer (2008) provided revised data on anti-director rights and
for which the regulation indices based on Barth, Caprio and Levine (2008) are available.
Third, we focus our analysis on the largest banks, with assets over $10 billion just before the
crisis at the end of 2006. These large banks are likely to have more opaque assets and balance
sheets and skirt capital regulation through regulatory arbitrage (Demirguc-Kunt, Detragiache
and Merrouche 2010).
We collect market data from Datastream, and we drop any observation with a missing
key variable (RoE, bank capital, etc) and exclude banks reporting losses for 2006. We end up
with a sample of 273 banks from 28 countries (see Appendix A). In the empirical analysis, we
also focus on a subsample including only deposit-taking institutions. Following Beltratti and
Stulz (2012), we impose a customer-deposits to total assets ratio over 20%. To be consistent
with the size criterion, the restriction on the level of deposits is imposed for the end of 2006.
This subsample is composed of 245 banks.
3.2 Empirical Methodology

7
The main model we test is a simple OLS model, where the dependent variable is the
buy-and-hold return in the crisis and the main independent variable is the RoE of the banks
before the crisis. We control for various elements of risk-taking at the bank level, the size and
the beta of the stock, which are all measured before the crisis. We also control for several
country-level variables.
- Dependent variable:
To compute our buy-and-hold returns, we use weekly stock returns over a period of 18
months from July 2007 to the end of 2008, which corresponds to the crisis period. Of course,
bank stocks continued to suffer in 2009 as a result of the crisis, however, consistent with
numerous empirical studies (Aebi, Sabato, Schmid 2012, Beltratti and Stulz 2012, Erkens,
Hung and Matos 2012, Fahlenbrach and Stulz 2011), we restrict the period to 2007-2008
because of the government interventions after this period, which would otherwise bias our
return measure.
- Main independent variable:
The main independent variable in the analysis is RoE, defined as the ratio of pre-tax
profit to equity. We choose to focus on a pre-tax RoE in order to smooth tax differences
across countries and because banks often define their targets in terms of pre-tax RoE. To
check the importance of RoE, we use the alternative return on assets (RoA), defined as the
ratio of pre-tax profit to total assets4. We also use alternative measures of RoE in our
complementary tests.
- Control variables at the bank level:
4 Demirguc-Kunt and Huizinga (2012) use the same definitions of RoE and RoA.
8
We focus on control variables at the bank level which have been highlighted
previously in the literature as important determinants of stock returns during the crisis. We
have three main categories of control variables: bank capital measures, additional funding
structure variables and the share of non-interest income activities in the banks’ operating
income. We also use the ratio of risk-weighted assets to total assets or density, and the size of
the banks, as risk control variables. To control for the risk of the stock, we use the beta, the
volatility of stock returns and the stock return of the year prior the crisis.
We have two measures of leverage. The first measure is Tier 1, which corresponds to
the main regulatory capital ratio and is defined as the ratio of Tier 1 capital5 to total risk-
weighted assets. The measure depends both on the structure of risks of banks’ assets and on
the level of leverage. Our second measure is the ratio of tangible common equity to tangible
assets, which removes intangibles from both the equity and total assets and preferred shares
from the equity6, thus offering a more conservative approach to the banks’ capital than the
standard ratio of equity to assets7.
We use two other measures related to the capital structure of banks. The first measure
is the ratio of total customer deposits to total assets. Contrary to funding received from
financial markets or intermediaries, which can rapidly become expensive or unavailable,
deposits are less subject to runs because they are insured and therefore represent a stable
source of funding. Empirically, Beltratti and Stulz (2012) and Demirguc-Kunt, Detragiache
and Merrouche (2010) confirm the positive impact of deposits on bank performance during
5 Tier 1 capital includes common equity and perpetual, non-cumulative preference shares.
6 More precisely, non-tangible common equity comprises tax-deferred assets, mortgage-servicing rights,
minority interests in financial intermediaries and other items.
7 In unreported tests, we find that our results are unchanged if we consider the equity ratio.

9
the crisis. Our second measure is the funding fragility ratio proposed by Demirguc-Kunt and
Huizinga (2010), which is defined as the ratio of the sum of deposits and short-term
borrowing excluding customer deposits, to total deposits and short-term borrowing8.
Concerning the nature of activities, we focus on the importance of non-traditional
activities using the ratio of non-interest income to total operating income. Non-interest
income includes net fee income, net commission income and net trading income. The nature
of the activities has been proven to have a significant impact on bank risk, notably by Baele,
De Jonghe and Vander Vennet (2007) for the beta of the stock and Stiroh (2004) for the Z-
score9.
We also control for the stock return of 2006 before the crisis. The stock performance
of the bank before the crisis is not a standard measure of risk per se but it can be considered as
a proxy for certain risks rewarded by the market prior to the crisis but which eventually turned
out badly during the crisis. Alternatively, following Rajan (2005), if we consider that stock
returns prior to the crisis were inflated artificially by some hidden risks, stock performance
before the crisis is likely to be associated with elements of risk-taking. Empirically, Beltratti
and Stulz (2012) and Fahlenbrach et al. (2012) find that banks that performed well in 2006
suffered poor returns in the crisis.
We also control for the ratio of risk-weighted assets to total assets. The density can be
seen as a measure of the risk on the assets. Ceteris paribus, a higher density would indicate
8 It is therefore inversely related to the importance of customer deposits in the short-term funding of
banks, which is the most stable source of short-term funding.
9 Demirguc-Kunt and Huizinga (2010) show that expanding the share of non-interest activities can offer
some risk diversification at very low levels but it quickly becomes very risky.
10
that the bank invests in riskier classes of assets. Alternatively, the density can be
comprehended as a proxy for the regulatory arbitrage strategies pursued by banks in order to
economise equity (Beltratti and Paladino 2013). In this case a lower density would reveal a
more aggressive optimisation of risk weights in order to save capital.
Finally, we control throughout our analysis for the size and the beta. Size is defined as
the natural logarithm of total assets and we compute the beta by estimating a market model on
weekly returns from 2004 to 2006. We use the MSCI World Index as the market portfolio and
the three-month T-bill as the risk-free rate.
- Control variables at the country level:
On top of our previous control variables, we also control for six institutional variables at
the country level which may influence risk-taking behaviour and stock performance in the
crisis. Two variables are general governance variables and four variables are variables
specific to the banking industry. The two governance variables are the updated anti-director
rights index (ADRI), compiled by Djankov, La Porta, Lopez-de-Silanes and Shleifer (2008),
and a second variable which measures the quality of legal institutions (Kaufmann, Kraay and
Mastruzzi 2008). Our four regulation variables are indices from Caprio, Leaven and Levine
(2007), using revised data from Barth, Caprio and Levine (2008). Appendix B provides a
precise description of these variables. All variables are included at the same time in the
regressions and the main results are unchanged when entering country variables separately.
3.3. Summary statistics
Table 1 reports descriptive statistics for the main variables described previously.
Except for buy-and-hold returns, variables apply to the year 2006, just before the beginning of
the crisis. As expected, performance during the crisis was extremely poor with a median buy-
and-hold stock return for the period of 0.59 (0.63 on average), which signifies that 1 dollar

11
invested at the beginning of July 2007 was worth 0.59 dollar at the end of 2008. In other
words, in our sample, bank shares lost around 40% of their value within 18 months. However,
the standard deviation of the buy-and-hold stock returns during the crisis is rather high
(around 32.3%) indicating strong heterogeneity in bank performance, in line with the figures
of Aebi, Sabato and Schmid (2012) and Beltratti and Stulz (2012). Interestingly, the important
dispersion of the returns is not a particular feature of the crisis period, since the standard
deviation of the buy-and-hold for the year 2006 is also large (34%). However, stock
performance in 2006 is good and differs significantly from the buy-and-hold during the crisis,
with an average buy-and-hold return for the year 2006 of 1.18.
The RoE is high at an average 20.12%. As for buy-and-hold stock return, some
heterogeneity exists across banks since the standard deviation of the RoEs is 11% and the
highest RoEs reach more than 50%. These high levels of returns on equity contrast with the
level of returns on assets. The average RoA is barely higher than 1.5%, with a standard
deviation of 1%. This discrepancy in the levels of RoE and RoA is related to the leverage of
banks.
The average Tier 1 ratio is 9.08% and is higher than the regulatory minimum of 4%.
All the banks are compliant with the regulation in terms of Tier 1, since the minimum Tier 1
ratio is 4.82%. In contrast, the tangible equity ratio is much lower at an average of 6.25%.
The portion of deposits in the financial structure is important, with an average deposit
ratio of 57.2%. However, the standard deviation is high (27%), as our sample includes both
commercial banks and investment banks10
. Similarly, the average funding fragility ratio is
24.4%, with a standard deviation of almost 13%. The analysis of these two variables confirms
10
Heterogeneity in the share of deposits remains quite high when we restrict the sample to deposit-taking banks.

12
the existence of important differences in the funding strategies of banks, which have to be
controlled for in the crisis.
The statistics for the non-interest income are comparable to those for deposits. The
average share of non-interest income is around 38.7% but the standard deviation is rather high
(22.7%), revealing again substantial heterogeneity in the nature of activities across banks11
.
The average ratio of risk-weighted assets to total assets is 0.6. This level of density is
equivalent to that reported by Beltratti and Paladino (2013). Even if the analysis focuses on
large banks (with more than $10 billion assets), there are important size disparities in the
sample as the largest banks in the sample are more than 100 times larger than the smallest
ones. The average bank has $186 billion assets before the crisis.
The examination of the correlation coefficients between our different variables reveals
some interesting facts which we have to take into account when designing our tests. First, as
expected, funding fragility and deposits are highly correlated and should not be entered at the
same time in the regressions. They are also highly correlated with non-interest income. This is
consistent with the analysis by Kashyap, Rajan and Stein (2002), predicting that interest
income generation and deposit funding are complementary, as well as with Demirguc-Kunt
and Huizinga (2010), who provide empirical evidence on the links between fee income and
non-deposit funding shares. As a result, we enter these three variables separately into our
regressions. Second, RoE is correlated weakly with the ratio of tangible equity and
uncorrelated with the Tier 1 capital ratio, which may appear surprising, as one component of
11
Heterogeneity in the share of non-interest income remains quite high when we restrict the sample to deposit-
taking banks.

13
the RoE is the level of leverage. On the contrary, RoA and RoE appear highly correlated12
.
The weak or null correlation between bank capital measures and RoE makes it possible to
enter into our regressions bank capital and RoE at the same time. Finally, the ratio of risk-
weighted assets correlates highly with our two bank capital measures, which makes it
impossible to enter them simultaneously. Interestingly, it is positively correlated with the
tangible equity ratio and respectively negatively related with the Tier 1 ratio. In a risk
management and regulation perspectives, higher risks should lead to higher density and higher
equity requirements, explaining the positive correlation between equity ratio and density.
However, the negative relation between density and the Tier 1 ratio suggests that banks that
were taking more risks on the asset side were also the more aggressive in terms of regulatory
capital optimization.
3. Presentation and interpretation of the results
In Table 2 we present the results of nine regressions in which buy-and-hold return
(BHR) is regressed separately on RoE and each control variables. We control for size, the beta
of the stock (except for the first regression) and country-level variables in all the
specifications. Most of our control variables have a significant impact on bank performance
during the crisis, which confirms that they are capturing elements of risk-taking that
materialised during the crisis. Consistent with Beltratti and Stulz (2012), BHR is positively
affected by Tier1 and deposits and negatively by funding fragility and stock performance
before the crisis. We also document negative effects of size, non-interest income and density.
12
Of course, the huge discrepancy between the average levels of RoE and RoA are clearly achieved thanks to
leverage, and the rise in RoE over time for banks is attributed to leverage (Haldane et al. 2010).

14
The result on size is in line with the hypothesis that larger banks had more opaque asset and
funding structures, which were uncovered during the crisis. It also adds to the evidence of
Fahlenbrach, Prilmeier and Stulz (2012) documenting that US banks that performed poorly,
both in the 1998 crisis and the recent crisis, experienced a higher growth in size in the years
preceding each crisis. The negative impact of non-interest income is consistent with Stiroh
(2004) and Demirguc-Kunt and Huizinga (2010), showing that the share of non-interest
income-generating activities is associated with higher risk. Tangible equity has a negative
impact on BHR but this effect may result from the fact that banks with higher equity also had
higher risks on the assets side, as the positive correlation between the tangible equity and the
density suggests. In any case, the effect of tangible equity disappears totally in more complete
models.
Our results reveal a negative impact of the level of RoE on BHR in the crisis. The
economic significance of this relation is very strong, as a one-standard-deviation increase in
RoE is associated with an 8.35% decline in BHR, which corresponds to 26% of its standard
deviation. This finding is clearly inconsistent with the null hypothesis that RoE should not be
associated with higher risk, and conversely it indicates that regulation and risk management
strategies are not sufficiently efficient for the RoE per se to be an appropriate risk-adjusted
measure of performance. Since RoE does not incorporate risks, we obviously have to control
for elements or measures of risk-taking at the bank level, in order to assess specifically
whether the reliance on RoE induced excessive risk-taking. It is worth remarking that, if the
addiction to RoE did indeed induce the risk-taking strategies taken into account in our
empirical design, the true impact of the reliance on RoE on risk-taking is likely to be biased
downwards.
Table 3 presents the results of 10 models explaining BHR, in which we always include
our main independent variable RoE, as well as size, the beta and our six country-level

15
variables13
. We alternate deposits, funding fragility and non-interest income, which are highly
correlated. We also alternate the two measures of bank capital as well as density, which are
significantly correlated. In the last regressions of Table 3, we also control for the stock
performance of 2006. All the previous results hold concerning the control variables, except
for the tangible equity, which is significant in none of our specifications, and for BHR 2006,
which is no longer significant when we enter it at the same time as RoE. One possible reason
why tangible equity has no impact on BHR is that the levels of tangible equity were so small
that differences in terms of equity did not make a great deal of difference in protecting
shareholders in the crisis. Another reason is that banks’ assets are so diverse that this ratio is
not particularly informative, while the Tier 1 ratio, taking into account risk-weighted assets,
tends to provide a more accurate picture of bank capital.
The striking result is that RoE remains highly significant in all models, with a rather
strong stability in its coefficients, which are even increased in the specifications using Tier 1
as a measure of bank capital. The economic significance remains very high as a one-standard-
deviation increase in RoE is associated with a 5.7% to 9.2% decline in BHR depending on the
specifications, which corresponds to between 18 % and 29 % of the BHR standard deviation.
All the control variables besides the RoE take into account several aspects of the banks’ risk,
but the effect of the RoE clearly remains in place. RoE can thus be considered as a proxy for
additional risk-taking on top of the risk-taking captured by our various control variables.
Therefore, our results strongly suggest that on top of being an inadequate measure of
performance, RoE is responsible for excessive risk-taking. The excessive reliance on RoE as a
central performance measure in the banking industry is thus likely to have been a contributing
factor in the crisis.
13
Our results are unchanged if we take the volatility of the stock return instead of the beta.

16
4. Complementary tests
In order to assess the robustness of our results, we run the regressions in Table 3 on a
subsample restricted to deposit-taking banks (into which the customer deposits amounts of at
least 20% of total assets) in Table 4. The very interesting fact is that our results are globally
unchanged. In all the specifications, the results on RoE hold at the 1% or 5% levels and its
economic significance is roughly unchanged. At the level of the control variables, the deposits
and Tier 1 still have a positive impact on BHR , respectively negative for the size.
In Table 5, we provide additional robustness checks by considering alternative RoE and the
RoA definitions. All the specifications are based on our main sample.
In regressions 1 and 2, we use an alternative measure of RoE defined as the ratio of Net
Income to Equity. In regressions 3 and 4, we use a third measure of RoE defined as the ratio
of pre-tax-profit to average equity for the years 2005 and 200614
. In all specifications, RoE
holds at the 1% or 5% levels and its economic significance is roughly unchanged compared to
our main measure of RoE. The results on the control variables are similar to those of previous
regressions.
In regressions 5 and 6, we replace RoE with RoA (defined as the ratio of pre-tax profit to
total assets) as our main independent variable. The two regressions include the Tier 1 ratio as
a measure of bank capital, because RoA is highly correlated with tangible equity. This strong
correlation is consistent with results from Haldane, Brennan and Madouros (2010) showing
that RoA and leverage are negatively related. Interestingly, RoA has a strong negative impact
14
We only present two main specifications of our model for each alternative performance measure but the results
remain unchanged when using alternative control variables.

17
on BHR, significant at the 1% level. Its economic significance is also very strong and is
roughly the same as for RoE. This result confirms that risk-taking strategies were not limited
purely to funding strategies but also flowed from tradeoffs on the asset side in favour of
excessive risks. However, it does not necessarily imply that RoA would have induced the
same incentives as RoE, if it were the main metric followed in banks.
5. Bank managers’ compensation and RoE
So far, our results strongly suggest that RoE captures risk-taking on top of various
other risk measures and that reliance on this metric is likely to have induced risk-taking which
materialised during the crisis. However, they do not reveal whether the incentives to
maximise RoE resulted from direct monetary incentives or from the fact that RoE is prevalent
everywhere, in and across banks.
A prolific body of literature has investigated the links between compensation and risk-
taking at banks. Previous studies have documented that risk-taking decreases with the horizon
of compensation (Bolton, Mehran and Shapiro 2011) and increases with the portion of
compensation not explained by size (Cheng, Hong and Scheinkman 2011), the vega or pay-
for-risk sensitivity of compensation (Chesney, Stromberg and Wagner 2010, DeYoung, Peng
and Yan 2012), or the emphasis placed on equity-based compensation (Mehran and
Rosenberg 2007, Balachandran, Kogut and Harnal 2010). More closely related to our study,
Bhattacharyya and Purnanandam (2012) show that the compensation of US commercial
banks’ executives was more sensitive to the earnings per share (EPS) than to the stock return,
which led them to become more involved in mortgage activities that were destroying value for
shareholders.
18
In this section, we investigate the link between CEO compensation and RoE for a
small subsample of 64 banks for which CEO compensation information is available on
BoardEx for the year 2006. Anecdotal evidence suggests that the RoE is related to the level of
bonus but that its level also has a role in the amount of equity-based compensation allocated
to bank managers. Consequently, in all specifications, our dependent variable is total CEO
compensation which is the sum of direct compensation and equity-linked compensation.
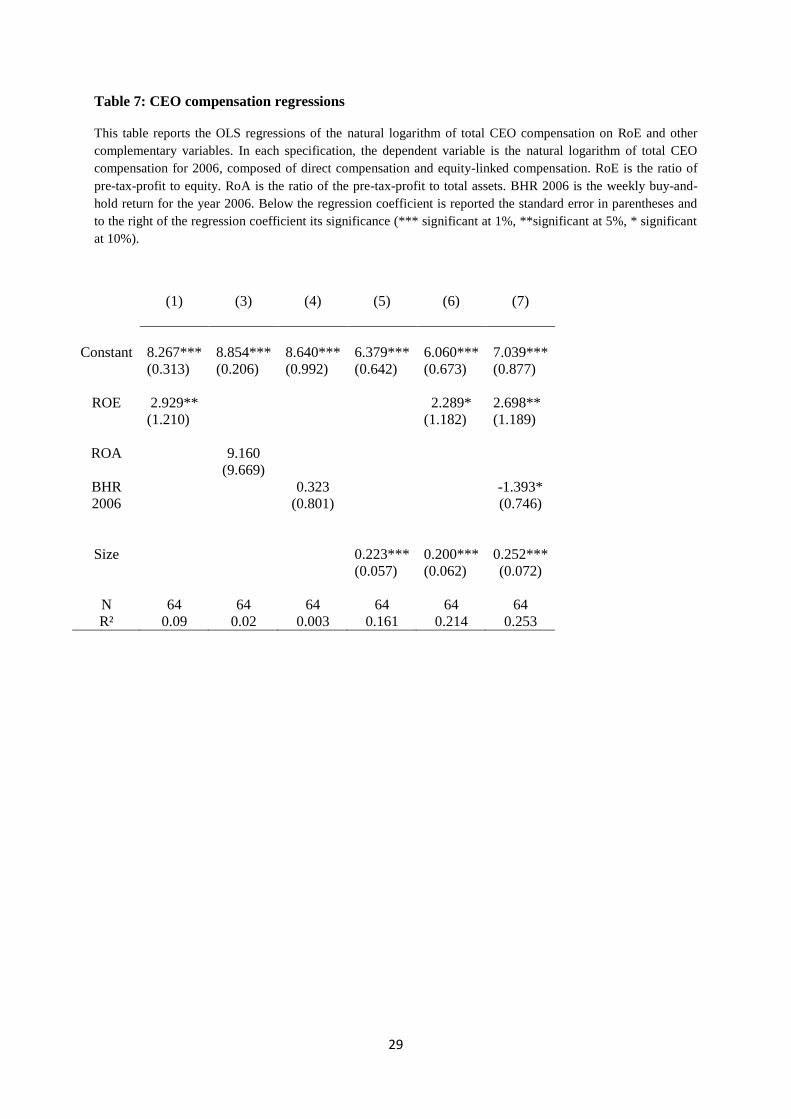
The results are provided in Table 6 and reveal that RoE has a strong positive impact on
CEO compensation significant at the 5% level. Economic significance is strong, since a one-
standard-deviation increase in RoE is associated with an increase of 0.3 in the log of total
compensation, which corresponds to almost 30% of its standard deviation. The impact of RoE
remains significant, both statistically (at the 5% or 10% levels) and economically, when we
control for the size of banks and the BHR of 2006. In line with Bhattacharyya and
Purnanandam (2012), our results suggest that the structure of CEO compensation may have
prompted them to maximise RoE by taking excessive risks. Moreover, the absence of any
impact of RoA and BHR 2006 on CEO compensation further supports the idea that the
objective was specifically to inflate the RoE and not another metric.
However, the scope of the results is limited due to the small number of banks for
which CEO compensation data are available. Furthermore, aside from monetary incentives
associated with RoE, the belief that it was a good measure of performance could have given
rise to excessive risk-taking. In line with this argument, a recent paper by Cheng, Raina and
Xiong (2013) documents the role of beliefs, using the private decisions of securitisation
agents in the subprime crisis.
6. Conclusion
19
The bank business model which emerged more than four decades ago, following risk
management and regulatory approaches to bank capital, crystallised RoE as the main
performance metric in the banking sector. RoE is not only the main measure of bank
performance but it also drives the allocation of resources across and inside bank divisions.
Given the very strong dependence of the asset and liability sides of banks resulting from the
bank business model, it also clearly affects its funding strategies. In theory, from a risk
management perspective, RoE could be a good performance measure if the measurement and
disclosure of risks led to a perfect adjustment of the level of bank equity.
However, the extreme focalisation on RoE may drive managers to take higher risks, in an
industry where complexity and opacity considerably alter the ability of outsiders to observe
them accordingly. Numerous experts have raised their voice to criticise the use of RoE.
Jenkins15
begs the questions: “But what if more fundamental change is needed to the way
everyone thinks about bank profitability? What if RoE is the wrong measure entirely?”
Admati16
goes even further, writing “RoE is a flawed and misleading measure that should not
be used to measure value creation and profitability, or to determine managerial compensation
[…]The fixation on RoE in the banking sector reflects and breeds a love of leverage and risk
that is dangerous for society as a whole.”
Using the financial crisis as a risk revelation event, we document a very strong negative
effect of pre-crisis RoE of banks on the shareholders’ returns, controlling for numerous bank
characteristics associated with the risk of shareholders. Our results indicate that RoE was a
15
Financial Times, 7th
of November 2011
16 See the article “Rethinking how banks create value” available at:
http://www.gsb.stanford.edu/news/packages/PDF/%20AdmatiFocusJune.pdf

20
clear aggravating factor in the financial crisis, as it provided incentives for managers to
develop excessive risk-taking strategies. Tests performed on a subsample of banks reveal that
incentive compensation is highly related to the level of RoE, which tends to prove that
monetary incentives were directly associated with the maximisation of this metric. The
incentives to maximise RoE could also have resulted from the fact that references to ROE are
prevalent everywhere, in and across banks. Further research is definitively called upon to
better disentangle these two sources of incentives.
The low return environment and the reinforcement of bank capital requirements seem to
have strengthened the risk management approach of banks, from a perspective of
“economising” equity. Given this evolution, the role of RoE is even more important as a
performance measure in banks. From a policy perspective, the response of the regulator may
prove to be counterproductive unless it is accompanied by a radical change in the way
performance is assessed in the banking sector.
21
References
Admati A.R., Demarzo P.R., Hellwig M.F. and Pfleiderer P.C., 2011. Fallacies, Irrelevant
Facts, and Myths in the Discussion of Capital Regulation: Why Bank Equity is not Expensive.
Working Paper 86. Rock Center for Corporate Governance at Stanford University, and
Research Paper 2065. Stanford Graduate School of Business, , Stanford, CA; Preprint
2010/42, Max Planck Institute for Research on Collective Goods, Bonn, Germany.
Admati A.R., Demarzo P.R., Hellwig M.F. and Pfleiderer P.C., 2012. Debt Overhang and
Capital Regulation. Working Paper, Rock Center for Corporate Governance at Stanford
University; and research paper, Stanford Graduate School of Business, Stanford, CA; Preprint
2012/05, Max Planck Institute for Research on Collective Goods, Bonn, Germany.
Aebi V., Sabato G., Schmid M., 2012. Risk management, corporate governance, and bank
performance in the financial crisis. Journal of Banking & Finance Vol. 36, Issue 12, p. 3213-
3226.
Baele L., De Jonghe O. and Vander Vennet R., 2007. Does the stock market value bank
diversification?. Journal of Banking & Finance Vol. 31, Issue 7, p. 1999-2023.
Balachandran S., Kogut B. and Harnal H., 2010. The Probability of Default, Excessive Risk,
and Executive Compensation: A Study of Financial Services Firms from 1995 to 2008,
Working paper, Columbia Business School.
Barth, J.R., Caprio Jr., G., Levine, R., 2008. Banking regulations are changing: for better or
worse? Comparative Economic Studies 50, 537–563.
Beltratti A. and Paladino G., (2013). Why do banks optimize risk weights? The relevance of
the cost of equity capital. Working paper.
Beltratti A. and Stulz, R., 2012. The credit crisis around the globe: Why did some banks
perform better?, Journal of Financial Economics. Vol. 105, Issue 1, p. 1-17.
Bhattacharyya S. and Purnanandam A., 2012. Risk-taking by banks: What did we know and
when did we know it? Working paper, University of Michigan.
Bolton P., Mehran H. and Shapiro J., 2011. Executive Compensation and Risk-Taking,
Mimeo, Federal Reserve of New York.
Caprio, G., Laeven, L., Levine, R., 2007. Governance and bank valuation. Journal of
Financial Intermediation 16, 584–617.
Cheng IH., Hong H. and Scheinkman J., 2009.Yesterday’s heROEs: compensation and
creative risk-taking, Working paper, Princeton University, Princeton, NJ.
Cheng IH., Raina S. and Xiong W., 2013. Wall Street and the Housing Bubble, Working
Paper, University of Michigan.

22
Chesney M., Stromberg J. and Wagner A., 2010. Risk-Taking Incentives, Governance, and
Losses in the Financial Crisis, Research Paper 10-18, Swiss Finance Institute, Zurich.
Demirguc-Kunt A., Detragiache E. and Merrouche O., 2010. Bank capital: Lessons from
the Financial Crisis. World Bank Working Paper 5473, The World Bank.
Demirguc-Kunt A. and Huizinga H., 2010. Bank activity and funding strategies: The impact
on risk and returns. Journal of Financial Economics Vol. 98, Issue 3, p. 626-650.
Demirguc-Kunt A. and Huizinga H., 2012. Do we need big banks? Evidence on
performance, strategy and market discipline. European Banking Center Discussion Paper
no. 2011-005.
De Young R., Peng E. and Yan M., Forthcoming. Executive compensation and business
policy choices at U.S. commercial banks, Journal of Financial and Quantitative Analysis.
Djankov, S., La Porta, R., Lopez-de-Silanes, F., Shleifer, A.,2008. The law and economics of
self-dealing. Journal of Financial Economics Vol 88, Issue 3, p. 430–465.
Erkens D.H., Hung M. and Matos P., 2012. Corporate Governance in the Recent Financial
Crisis: Evidence from Financial Institutions Worldwide. Journal of Corporate Finance 18:
389-411.
Fahlenbrach, R., Prilmeier, R. and Stulz, R., 2012. This time is the same: using bank
performance in 1998 to explain bank performance during the recent financial crisis. Journal
of Finance, Vol 67., Issue 6, 2139-2185.
Fahlenbrach R. and Stulz R., 2011. Bank CEO incentives and the credit crisis. Journal of
Financial Economics, Vol. 99, Issue 1, p. 11-26.
Gropp, R. and Köhler, M., 2010. Bank Owners or Bank Managers: Who is Keen on Risk?
Evidence from the Financial Crisis. ZEW Discussion paper 10-013. University of Mannheim,
Mannheim.
Haldane A., Brennan S. and Madouros V., 2010. What is the Contribution of the Financial
Sector: Miracle or Mirage? The Future of Finance, Chapter 2, 87-121, LSE.
John, K., Litov, L., Yeung, B., 2008.Corporate governance and risk-taking. Journal of
Finance 63, 1679–1728.
Kashyap, A.K., Rajan, R., Stein, J.C., 2002. Banks as liquidity providers: an explanation for
the coexistence of lending and deposit-taking. Journal of Finance 57, 33–73.
Kaufmann, D., Kraay, A., Mastruzzi, M., 2008. Governance Matters VII: Aggregate and
Individual Governance Indicators, 1996–2007. Unpublished working paper. World Bank,
Washington, DC.

23
Kim D. and Santomero A.M., 1988. Risk in Banking and Capital Regulation. The Journal of
Finance vol.43 No.05,1219-1233.
Mehran H. and Rosenberg J., 2007.The effect of employee stock options on bank investment
choice, borrowing and capital. Staff report 305, Federal Reserve Bank of New York, New
York.
Rajan, R., 2005. Has financial development made the world riskier? Paper presented at the
Federal Reserve Bank of Kansas City Economic Symposium at Jackson Hole.
Stiroh, K.J., 2004. Diversification in banking: is noninterest income the answer? Journal of
Money, Credit and Banking 36, 853-882.

24
Table 1: Summary statistics
This table reports statistics for the whole sample of 273 banks. All variables (except BHR) are computed for 2006, prior to
the beginning of the crisis. BHR is the weekly buy-and-hold return from July 2007 to the end of 2008. BHR 2006 is the
weekly buy-and-hold return for the year 2006. RoE is the ratio of pre-tax-profit to equity. RoA is the ratio of the pre-tax-
profit to total assets. Tangible equity is the ratio of equity minus intangible assets divided by total assets. Tier 1 is the ratio of
Tier 1 capital to risk-weighted assets. Deposits is the ratio of customer deposits to total assets. Funding fragility is the ratio
between the sum of deposits from banks, other deposits and short-term borrowing to total deposits and short-term borrowing.
Non-interest income is the ratio of non-interest income to total operating income. Density is the ratio of risk-weighted assets
to total assets. Size refers to the natural logarithm of total assets. Beta is the slope of the regression of weekly excess stock
returns on the MSCI World excess return from 2004 to 2006. ADRI is the anti-director index, as revised in Djankov et al.
(2008). Institution is the average of the six following indicators provided by Kaufmann et al. (2008): voice and
accountability, political stability and absence of violence, government effectiveness, regulatory quality, rule of law, and
control of corruption. Official is an index of the power of supervisory authorities. Private monitoring is an index of the
intensity of monitoring by the private sector. Capital is an index of regulatory oversight of bank capital. Restrict is an index
of regulatory restrictions on the activities of banks. The regulation variables are from Caprio et al. (2007).
Number of
observations
Mean Median Std. dev Min Max
BHR
273 0.636 0.593 0.323 0.012 1.411
BHR 2006 273 1.185 1.19 0.341 0.343 2.747
RoE (%)
273 20.12 18.49 11.06 0.57 52.39
RoA (%)
273 1.41 1.24 1.08 0.04 9.89
Tangible equity
(%)
273 6.25 5.76 4.01 -0.34 41.65
Tier 1 (%)
212 9.08 8.57 2.39 4.82 22.9
Deposits (%)
273 57.18 61.57 27.11 0.00 93.40
Funding Fragility
(%)
273 24.40 12.83 26.66 0.00 100.00
Non-interest
income (%)
273 38.71 35.60 22.66 0.76 109.80
Density
190 0.60 0.59 0.17 0.15 1.21
Size
273 10.92 10.54 1.40 9.21 14.49
Beta
273 1.02 0.98 0.42 0.23 2.39
ADRI
273 3.82 4 0.94 1 5
Institution
273 1.13 1.24 0.50 -0.76 1.83
Official
273 11.07 12 2.15 5 14
Private monitoring
273 7.12 7 0.80 4 8
Capital
273 6.11 6 1.35 2 9
Restrict 273 9.91 11 2.11 4 15

25
Table 2: OLS regressions of BHR on RoE and each control variables
This table reports the OLS regressions of the buy-and-hold return to the RoE and our different control variables introduced separately. In each specification, the dependent variable is the weekly buy-and-hold
return from July 2007 to the end of 2008 and we control for the size and the beta. RoE is the ratio of pre-tax-profit to equity. Tangible equity is the ratio of equity minus intangible assets divided by total assets. Tier
1 is the ratio of Tier 1 capital to risk-weighted assets. Deposits is the ratio of customer deposits to total assets. Funding fragility is the ratio between the sum of deposits from banks, other deposits and short-term
borrowing to total deposits and short-term borrowing. Non-interest income is the ratio of non-interest income to total operating income. Density is the ratio of risk-weighted assets to total assets. BHR 2006 is the
weekly buy-and-hold return for the year 2006. Size refers to the natural logarithm of total assets. Beta is the slope of the regression of weekly excess stock returns on the MSCI World excess return from 2004 to
2006. Country variables include ADRI, Institution, Official, Private monitoring, Capital and Restrict. Below the regression coefficient is reported the standard error in parentheses and to the right of the regression
coefficient its significance (*** significant at 1%, **significant at 5%, * significant at 10%).
(1) (2) (3) (4) (5) (6) (7) (8) (9) Constant
0.877***
(0.262)
0.875***
(0.261)
0.829***
(0.313)
0.070
(0.316)
0.289
(0.244)
0.540**
(0.244)
0.640***
(0.237)
1.014**
(0.404)
1.401***
RoE
-0.764***
(0.182)
-0.755***
(0.181)
Tangible equity
-0.012**
(0.005)
Tier 1 0.016*
(0.010)
Deposits 0.496***
(0.089)
Funding fragility
-0.338***
(0.076)
Non-interest
income
-0.514***
(0.104)
Density
-0.479***
(0.124)
BHR2006
-0.282***
(0.072)
Size -0.067***
(0.012)
-0.066***
(0.013)
-0.095***
(0.014)
-0.073***
(0.014)
-0.057***
(0.020)
-0.068***
(0.011)
-0.061***
(0.013)
-0.090***
(0.015)
-0.071***
(0.012)
Beta -0.015
(0.049)
-0.056
(0.049)
-0.076
(0.057)
0.006
(0.045)
-0.013
(0.048)
0.030
(0.050)
-0.133**
(0.062)
-0.063
(0.047)
Country variables Yes Yes Yes Yes Yes Yes Yes Yes Yes Observations 273 273 273 212 273 273 273 190 273
R² 0.337 0.338 0.306 0.387 0.388 0.351 0.380 0.424 0.335

26
Table 3: OLS regressions of BHR on RoE and control variables
This table reports the OLS regressions of the buy-and-hold return to the RoE and our different control variables. In each specification, the dependent variable is the weekly buy-and-hold return from July 2007 to the end of
2008 and we control for the size and the beta. RoE is the ratio of pre-tax-profit to equity. Tangible equity is the ratio of equity minus intangible assets divided by total assets. Tier 1 is the ratio of Tier 1 capital to risk-weighted
assets. Deposits is the ratio of customer deposits to total assets. Funding fragility is the ratio between the sum of deposits from banks, other deposits and short-term borrowing to total deposits and short-term borrowing. Non-
interest income is the ratio of non-interest income to total operating income. Density is the ratio of risk-weighted assets to total assets. BHR 2006 is the weekly buy-and-hold return for the year 2006. Size refers to the
natural logarithm of total assets. Beta is the slope of the regression of weekly excess stock returns on the MSCI World excess return from 2004 to 2006. Country variables include ADRI, Institution, Official, Private monitoring,
Capital and Restrict. Below the regression coefficient is reported the standard error in parentheses and to the right of the regression coefficient its significance (*** significant at 1%, **significant at 5%, * significant at 10%).
(1) (2) (3) (4) (5) (6) (7) (8) (9) (10)
Constant
0.706**
(0.302)
1.006***
(0.275)
0.953***
(0.278)
0.275
(0.355)
0.648*
(0.351)
0.511
(0.348)
1.073***
(0.358)
1.270**
(0.376)
1.019***
(0.370)
0.544
(0.449)
RoE -0.690***
(0.184)
-0.752***
(0.178)
-0.518***
(0.196)
-0.761***
(0.213)
-0.864***
(0.214)
-0.622***
(0.238)
-0.616***
(0.234)
-0.552**
(0.279)
-0.586***
(0.183)
-0.665***
(0.225)
Tangible
equity
-0.004
(0.005)
-0.006
(0.005)
-0.005
(0.005)
-0.003
(0.005)
Tier1 ratio 0.016**
(0.008)
0.013
(0.008)
0.019**
(0.008)
0.017**
(0.008)
Deposits 0.444***
(0.101)
0.559***
(0.159)
0.557***
(0.167)
0.422***
(0.099)
0.497***
(0.168)
Funding
fragility
-0.295***
(0.081)
-0.226
(0.152)
Non-interest
income
-0.398***
(0.108)
-0.361**
(0.158)
-0.254
(0.172)
Density -0.351***
(0.133)
-0.348***
(0.131)
BHR 2006 -0.123*
(0.069)
-0.095
(0.083)
Size -0.051***
(0.015)
-0.063***
(0.013)
-0.062***
(0.015)
-0.031**
(0.015)
-0.052***
(0.014)
-0.047***
(0.015)
-0.050**
(0.017)
-0.069***
(0.015)
-0.049***
(0.014)
-0.033**
(0.015)
Beta
0.025
(0.046)
0.008
(0.048)
0.030
(0.052)
-0.028
(0.055)
-0.037
(0.057)
-0.041
(0.058)
-0.062
(0.063)
-0.083
(0.069)
0.012
(0.047)
-0.044
(0.059)
Country
variables
Yes Yes Yes Yes Yes Yes Yes Yes Yes Yes
Observations 273 273 273 212 212 212 190 190 273 212
R² 0.428 0.401 0.399 0.494 0.449 0.464 0.514 0.471 0.435 0.498

27
Table 4: OLS regressions of BHR on RoE and control variables for deposit-taking banks
This table reports the OLS regressions of the buy-and-hold return to the RoE and our different control variables. In each specification, the dependent variable is the weekly buy-and-hold return from July 2007 to the end of 2008 and we
control for the size and the beta. RoE is the ratio of pre-tax-profit to equity. Tangible equity is the ratio of equity minus intangible assets divided by total assets. Tier 1 is the ratio of Tier 1 capital to risk-weighted assets. Deposits is the ratio
of customer deposits to total assets. Funding fragility is the ratio between the sum of deposits from banks, other deposits and short-term borrowing to total deposits and short-term borrowing. Non-interest income is the ratio of non-interest
income to total operating income. Density is the ratio of risk-weighted assets to total assets. BHR 2006 is the weekly buy-and-hold return for the year 2006. Size refers to the natural logarithm of total assets. Beta is the slope of the
regression of weekly excess stock returns on the MSCI World excess return from 2004 to 2006. Country variables include ADRI, Institution, Official, Private monitoring, Capital and Restrict. Below the regression coefficient is reported the
standard error in parentheses and to the right of the regression coefficient its significance (*** significant at 1%, **significant at 5%, * significant at 10%).
(1) (2) (3) (4) (5) (6) (7) (8) (9) (10)
Constant
0.684*
(0.366)
1.112***
(0.325)
0.956***
(0.339)
0.178
(0.402)
0.578
(0.397)
0.511
(0.378)
1.053***
(0.429)
1.270**
(0.376)
0.810*
(0.441)
0.385
(0.518)
RoE
-0.804***
(0.197)
-0.855***
(0.195)
-0.658***
(0.218)
-0.705***
(0.226)
-0.838***
(0.226)
-0.635***
(0.243)
-0.596**
(0.258)
-0.587**
(0.283)
-0.765***
(0.209)
-0.648***
(0.235)
Tangible
equity
-0.002
(0.007)
-0.005
(0.006)
-0.002
(0.008)
-0.002
(0.007)
Tier1 ratio 0.019**
(0.09)
0.017**
(0.008)
0.021***
(0.008)
0.020**
(0.009)
Deposits 0.621***
(0.138)
0.541***
(0.164)
0.529***
(0.174)
0.596***
(0.146)
0.492***
(0.175)
Funding
fragility
-0.441***
(0.115)
-0.179
(0.151)
Non-interest
income
-0.438***
(0.122)
-0.375**
(0.146)
-0.270*
(0.158)
Density -0.349***
(0.135)
-0.372***
(0.132)
BHR 2006 -0.045
(0.069)
-0.066
(0.085)
Size -0.039**
(0.016)
-0.057***
(0.014)
-0.052***
(0.016)
-0.035**
(0.016)
-0.057***
(0.014)
-0.049***
(0.015)
-0.054***
(0.017)
-0.071***
(0.016)
-0.039**
(0.016)
-0.037**
(0.016)
Beta
0.011
(0.049)
0.009
(0.051)
0.030
(0.054)
-0.002
(0.055)
-0.009
(0.057)
-0.008
(0.056)
-0.033
(0.063)
-0.048
(0.066)
0.005
(0.051)
-0.013
(0.059)
Country
variables
Yes Yes Yes Yes Yes Yes Yes Yes Yes Yes
Observations 245 245 245 206 206 206 184 184 245 206
R² 0.442 0.411 0.415 0.497 0.456 0.476 0.513 0.471 0.443 0.499

28
Table 5: OLS regressions of BHR on alternative measures of RoE, RoA and control variables
This table reports the OLS regressions of the buy-and-hold return to the RoE and our different control variables. In
each specification, the dependent variable is the weekly buy-and-hold return from July 2007 to the end of 2008 and we
control for the size and the beta. RoE is the ratio of pre-tax-profit to equity. RoA is the ratio of the pre-tax-profit to
total assets. Tangible equity is the ratio of equity minus intangible assets divided by total assets. Tier 1 is the ratio of
Tier 1 capital to risk-weighted assets. Deposits is the ratio of customer deposits to total assets. Non-interest income is
the ratio of non-interest income to total operating income. Size refers to the natural logarithm of total assets. Beta is the
slope of the regression of weekly excess stock returns on the MSCI World excess return from 2004 to 2006. Country
variables include ADRI, Institution, Official, Private monitoring, Capital and Restrict. Below the regression coefficient
is reported the standard error in parentheses and to the right of the regression coefficient its significance (***
significant at 1%, **significant at 5%, * significant at 10%).
RoE=Net
income/equity
(1)
RoE=Net
income/equity
(2)
Pretax
RoAE
(3)
Pretax
RoAE
(4)
RoA
(5)
RoA
(6)
Constant
0.678**
(0.301)
0.109
(0.380)
0.613***
(0.245)
0.162
(0.352)
0.179
(0.343)
0.420
(0.347)
RoE
-0.897***
(0.259)
-0.686**
(0.221)
-0.675***
(0.206)
-0.759***
(0.249)
RoA
-9.052***
(2.449)
-6.967***
(2.612)
Tangible equity
-0.003
(0.005)
-0.004
(0.005)
Tier 1 0.018**
(0.009)
0.017**
(0.008)
0.026**
(0.008)
0.026***
(0.008)
Deposits
0.474***
(0.087)
0.565***
(0.167)
0.446***
(0.101)
0.556***
(0.158)
0.569***
(0.152)
Non-interest
income
-0.363**
(0.153)
Size -0.046***
(0.014)
-0.032**
(0.015)
-0.052***
(0.015)
-0.032**
(0.015)
-0.039**
(0.015)
-0.054***
(0.015)
Beta
0.031
(0.047)
-0.024
(0.054)
0.017
(0.046)
-0.038
(0.058)
-0.057
(0.055)
-0.065
(0.058)
Country
variables
Yes Yes Yes Yes Yes Yes
Observations 273 212 273 212 212 212
R² 0.432 0.474 0.418 0.484 0.492 0.460
29
Table 7: CEO compensation regressions
This table reports the OLS regressions of the natural logarithm of total CEO compensation on RoE and other
complementary variables. In each specification, the dependent variable is the natural logarithm of total CEO
compensation for 2006, composed of direct compensation and equity-linked compensation. RoE is the ratio of
pre-tax-profit to equity. RoA is the ratio of the pre-tax-profit to total assets. BHR 2006 is the weekly buy-and-
hold return for the year 2006. Below the regression coefficient is reported the standard error in parentheses and
to the right of the regression coefficient its significance (*** significant at 1%, **significant at 5%, * significant
at 10%).
(1)
(3) (4) (5) (6) (7)
Constant
8.267***
(0.313)
8.854***
(0.206)
8.640***
(0.992)
6.379***
(0.642)
6.060***
(0.673)
7.039***
(0.877)
ROE
2.929**
(1.210)
2.289*
(1.182)
2.698**
(1.189)
ROA 9.160
(9.669)
BHR
2006
0.323
(0.801)
-1.393*
(0.746)
Size 0.223***
(0.057)
0.200***
(0.062)
0.252***
(0.072)
N 64 64 64 64 64 64
R² 0.09 0.02 0.003 0.161 0.214 0.253

30
Appendix A: Distribution of banks by countries
Countries Number of banks
(Main sample)
Australia
3
Austria 5
Belgium 2
Brazil 2
China 1
Denmark 4
France 14
Germany 11
Great Britain 9
Greece 5
Hong Kong 7
India 15
Ireland 3
Israel 5
Italy 12
Japan 75
Malaysia 1
Netherlands 2
Norway 4
Portugal 3
Russia 2
Singapore 3
South Africa 5
Spain 7
Sweden 4
Switzerland 13
United States 46
Taiwan
10
TOTAL 273
31
Appendix B: presentation of country-level variables
Our first country-level governance variable is the updated anti-director rights index
(ADRI), compiled by Djankov, La Porta, Lopez-de-Silanes and Shleifer (2008) and measures
shareholder protection.
Our second variable measures the quality of legal institutions, based on the six country-
level indicators posited by Kaufmann, Kraay and Mastruzzi (2008). These indicators are voice
and accountability, political stability and absence of violence, government effectiveness,
regulatory quality, rule of law and control of corruption. The ADRI is an important control
variable which can be related both to stock performance and to RoE. For example, John, Litov
and Yeung (2008) provide empirical evidence that risk-taking is affected by shareholders
protection. On the other hand, Gropp and Khöler (2010) document that ADRI has a positive
impact on the average RoE of banks in the years preceding the crisis.
Our four country variables specific to the banking industry are indices provided by
Caprio, Leaven and Levine (2007) using revised data from Barth, Caprio and Levine (2008).
Capital is an index of the regulatory oversight of bank capital. It is based on indicators
capturing information such as whether the sources of funds considered as regulatory capital
can include assets other than cash and government securities, whether the sources of funds to
be used as capital are verified by the regulatory and supervisory authorities or whether the
minimum risk-weighted capital-asset ratio requirement is in line with the Basel guidelines.
Restrict is an index of the regulatory restrictions on bank activities. It is based on
indicators capturing the ability of banks to engage in securities market activities, insurance
activities and real estate activities or to own nonfinancial firms.

32
Official is an index of official supervisory power. It measures the power of the
supervisory authorities to take specific actions to prevent or correct problems, such as the
right of the supervisory authorities to demand information from auditors or to force the bank
to change its internal organisational structure.
Private monitoring is an index of the private sector monitoring of banks. It measures the
extent to which monitoring by the private sector is promoted and facilitated by the regulation.