august 2012 super newsletter
TRANSCRIPT

The SUPER project is now up to full speed as we near the end of our first year. As can be seen
from the list of publications in this newsletter and the research highlights on the SUPER web-
site, we have made substantial progress already. Our four main focus areas – performance, en-
ergy, resilience, and overall optimization – have formed strong teams who collaborate closely.
This quarter’s newsletter features the performance area, which has a broad focus including auto-
tuning, performance modeling, end-to-end performance measure-
ment, and tool integration. We aim to extend and integrate mature,
robust performance measurement technologies and develop a com-
prehensive performance data management framework that can be
used by other areas of the SUPER project. End-to-end performance
measurement will correlate application-specific measurements with
system-wide conditions at the time of execution. Performance
measurements will feed into an integrated auto-tuning framework
that encompasses identification and outlining of performance-
critical kernels, compiler-based code transformations, and empirical
optimization of runtime parameters.
Now that DOE is in the process of awarding the last of the SciDAC-3 Application Partnerships,
we congratulate those of our SUPER researchers who are included in these recently awarded
projects. We look forward to working closely with our new SciDAC colleagues when it is mu-
tually beneficial. Our mature performance measurement and analysis tools are freely available,
and installed on the large system at Argonne, NERSC, and Oak Ridge where they can be used
by all DOE application projects. The SUPER auto-tuning framework as a whole is still under
development and will be made available for experimental use by SciDAC applications as it ma-
tures, along with our more speculative work on energy, resilience, and optimization.
- Bob Lucas
August 2012
NEWSLETTER
From the Director
Upcoming Events:
• SciDAC-3 PI meeting September 10-12, 2012 Rockville, MD Invited SciDAC PIs
• SUPER All-hands meeting September 26-27, 2012 Argonne National Laboratory http://www.mcs.anl.gov/~wild/meetings/super12.html All SUPER participants and invit-ed guests
• SC’12 http://sc12.supercomputing.org/ November 10-16, 2012 Salt Lake City, Utah • SUPER Meeting at SC’12 in Salt Lake City, Utah Monday November 12, 2012 9am-11:30am
• PPoPP 2013 February 23-27, 2013 Shenzhen, China (collocated with PPoPP 2013 and CGO 2013) http://ppopp2013.ics.uci.edu/ Abstracts due August 10, 2012 Full papers due August 17, 2012
• HPCA 2013 February 23-27, 2013 Shenzhen, China (collocated with PPoPP 2013 and CGO 2013) http://www.hpcaconf.org/hpca19 Abstracts due August 30, 2012 Full papers, workshop and tutorial proposals due Septem-ber 7, 2012
Performance Counter Monitoring for the Blue Gene/Q Architecture written by Heike McCraw, Shirley Moore and Dan Terpstra
The Blue Gene/Q (BG/Q) system is the third generation in the IBM Blue Gene line of massively
parallel, energy efficient supercomputers. BG/Q will be capable of scaling to over a million proces-
sor cores while making the trade-off of lower power consumption over raw processor speed. Perfor-
mance analysis tools for parallel applications running on large scale computing systems typically
rely on hardware performance counters to gather performance relevant data from the system. The
Performance API (PAPI) has provided consistent platform and operating system independent access
to CPU hardware performance counters for more than a decade [1]. PAPI has recently been extend-
ed to provide hardware performance data from other parts of the system, including the network, I/O
devices, temperature sensors, power meters, and GPUs, while continuing to provide a uniform port-
able interface [2,3]. In order to provide this consistency for BG/Q to the HPC community, and
thanks to a close collaboration with IBM’s Performance Analysis team and careful planning long
before the BG/Q release, an extensive effort has been made to extend the Performance API (PAPI)
to support hardware performance monitoring for the BG/Q platform. This customization of PAPI to
support BG/Q includes several PAPI components to provide valuable performance data that origi-
nates not only from the processing cores but also from compute nodes, the network, and the system
as a whole. More precisely, the additional components allow hardware performance counter moni-
toring of the 5D Torus network, the I/O system and the Compute Node Kernel in addition to the
CPU component. Details about the PAPI BG/Q components can be found in [4].
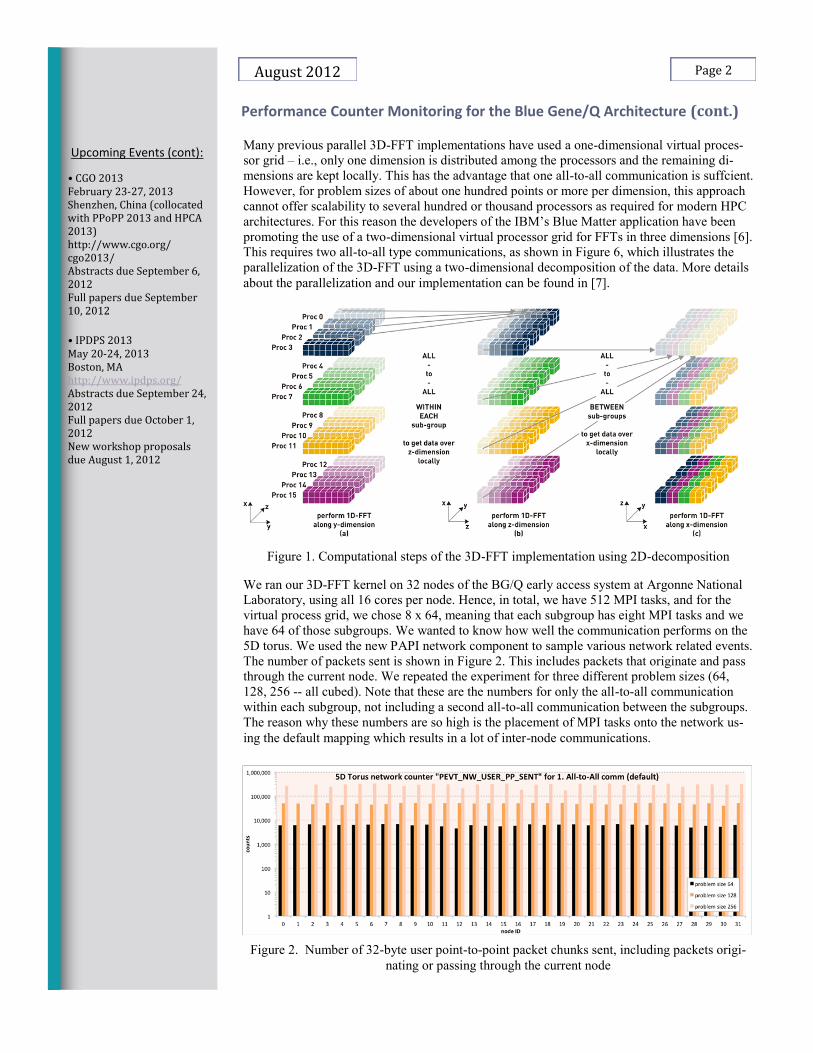
Many previous parallel 3D-FFT implementations have used a one-dimensional virtual proces-
sor grid – i.e., only one dimension is distributed among the processors and the remaining di-
mensions are kept locally. This has the advantage that one all-to-all communication is suffcient.
However, for problem sizes of about one hundred points or more per dimension, this approach
cannot offer scalability to several hundred or thousand processors as required for modern HPC
architectures. For this reason the developers of the IBM’s Blue Matter application have been
promoting the use of a two-dimensional virtual processor grid for FFTs in three dimensions [6].
This requires two all-to-all type communications, as shown in Figure 6, which illustrates the
parallelization of the 3D-FFT using a two-dimensional decomposition of the data. More details
about the parallelization and our implementation can be found in [7].
Figure 1. Computational steps of the 3D-FFT implementation using 2D-decomposition
We ran our 3D-FFT kernel on 32 nodes of the BG/Q early access system at Argonne National
Laboratory, using all 16 cores per node. Hence, in total, we have 512 MPI tasks, and for the
virtual process grid, we chose 8 x 64, meaning that each subgroup has eight MPI tasks and we
have 64 of those subgroups. We wanted to know how well the communication performs on the
5D torus. We used the new PAPI network component to sample various network related events.
The number of packets sent is shown in Figure 2. This includes packets that originate and pass
through the current node. We repeated the experiment for three different problem sizes (64,
128, 256 -- all cubed). Note that these are the numbers for only the all-to-all communication
within each subgroup, not including a second all-to-all communication between the subgroups.
The reason why these numbers are so high is the placement of MPI tasks onto the network us-
ing the default mapping which results in a lot of inter-node communications.
Figure 2. Number of 32-byte user point-to-point packet chunks sent, including packets origi-
nating or passing through the current node
Performance Counter Monitoring for the Blue Gene/Q Architecture (cont.)
Page 2 August 2012
Upcoming Events (cont):
• CGO 2013 February 23-27, 2013 Shenzhen, China (collocated with PPoPP 2013 and HPCA 2013) http://www.cgo.org/cgo2013/ Abstracts due September 6, 2012 Full papers due September 10, 2012
• IPDPS 2013 May 20-24, 2013 Boston, MA http://www.ipdps.org/ Abstracts due September 24, 2012 Full papers due October 1, 2012 New workshop proposals due August 1, 2012

The default mapping places each task of a subgroup on a different node. To reduce the amount of
communication, we tried a customized mapping that placed all the tasks from one subgroup onto
the same node. Since each subgroup has 8 MPI tasks, and since we have 16 cores per node, we
can place two subgroups on each node. By doing so, all the high numbers reported for the net-
work counter were reduced to zeroes, resulting in no inter-node communication at all. As can be
seen from Figure 3, this gives us a performance improvement of up to a factor of 8.4 (depending
on the problem size) for the first all-to-all. There was no degradation in performance for the se-
cond all-to-all with the customized mapping. For the entire 3D FFT kernel we see an improve-
ment of up to 22%, which is a decent improvement if we consider that we are running on a very
small partition using only 32 nodes.
Figure 3. Performance comparison of first All-to-All communication using default
and customized mappings
Acknowledgments This material is based upon work supported by the U.S. Department of Energy Office of Science under contract DE- FC02
-06ER25761. Access to the early access BG/Q system at Argonne National Laboratory was provided through the ALCF
Early Science Program. We would like to thank the IBM Performance Team for collaborating with us on the implementa-
tion of PAPI for BG/Q.
References [1] S. Browne, J. Dongarra, N. Garner, G. Ho, and P. Mucci, “A portable programming interface for performance evalu-
ation on modern processors,” International Journal of High Performance Computing Applications, vol. 14, no. 3,
pp. 189–204, 2000.
[2] D. Terpstra, H. Jagode, H. You, and J. Dongarra, “Collecting performance data with PAPI-C,” in 3rd Parallel Tools
Workshop, Dresden, Germany, 2009, pp. 157–173.
[3] A. Malony, S. Biersdorff, S. Shende, H. Jagode, S. Tomov, G. Juckeland, R. Dietrich, D. Poole, C. Lamb, "Parallel performance measurement of heterogeneous parallel systems with GPUs," International Conference on Parallel
Processing (ICPP'11), Taipei, Taiwan, September 13-16, 2011.
[4] H. Jagode, S. Moore, and D. Terpstra. “Hardware performance monitoring for the Blue Gene/Q architecture,”
ScicomP 2012, Toronto, Ontario, Canada, May 2012.
[5] M. Gilge, “IBM system Blue Gene solution: Blue Gene/Q application development”, IBM Redbook Draft SG24-7948-
00, March 2012.
[6] M. Eleftheriou, et al., “A volumetric FFT for Blue-Gene/L”, in G. Goos, J. Hartmanis, J. van Leeuwen, editors, vol-
ume 2913 of Lecture Notes in Computer Science, page 194, Springer-Verlag, 2003.
[7] H. Jagode and J. Hein, "Custom assignment of MPI ranks for parallel multi-dimensional FFTs: Evaluation of
BG/P versus BG/L," Proceedings of the 2008 IEEE International Symposium on Parallel and Distributed
Processing with Applications (ISPA-08), IEEE Computer Society, Sydney, Australia, pp.271-283, 2008.
Performance Counter Monitoring for the Blue Gene/Q Architecture (cont.)
Page 3 August 2012
Recent Software Release:
New TAU, PDT,
KTAU releases
www.super-scidac.org/
tau-2.21.3
See the SUPER website
for more software re-
leases
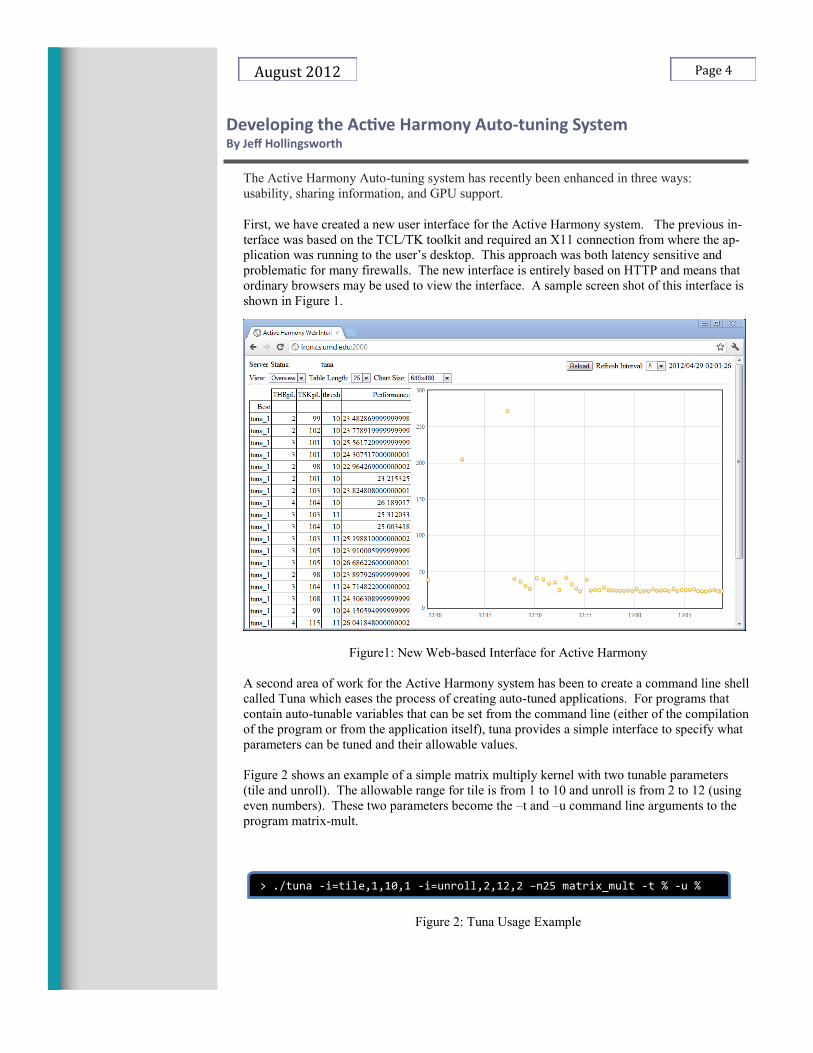
The Active Harmony Auto-tuning system has recently been enhanced in three ways:
usability, sharing information, and GPU support.
First, we have created a new user interface for the Active Harmony system. The previous in-
terface was based on the TCL/TK toolkit and required an X11 connection from where the ap-
plication was running to the user’s desktop. This approach was both latency sensitive and
problematic for many firewalls. The new interface is entirely based on HTTP and means that
ordinary browsers may be used to view the interface. A sample screen shot of this interface is
shown in Figure 1.
Figure1: New Web-based Interface for Active Harmony
A second area of work for the Active Harmony system has been to create a command line shell
called Tuna which eases the process of creating auto-tuned applications. For programs that
contain auto-tunable variables that can be set from the command line (either of the compilation
of the program or from the application itself), tuna provides a simple interface to specify what
parameters can be tuned and their allowable values.
Figure 2 shows an example of a simple matrix multiply kernel with two tunable parameters
(tile and unroll). The allowable range for tile is from 1 to 10 and unroll is from 2 to 12 (using
even numbers). These two parameters become the –t and –u command line arguments to the
program matrix-mult.
Figure 2: Tuna Usage Example
Developing the Active Harmony Auto-tuning System By Jeff Hollingsworth
Page 4 August 2012
> ./tuna -i=tile,1,10,1 -i=unroll,2,12,2 –n25 matrix_mult -t % -u %

The addition of tuna makes is much easier for users to try out autotuning their programs. What
previously required some expertise to configure and write tuning scripts and driver programs is
now a matter of reading a short man page and trying out the autotuner.
The second area we have worked on in the past year is sharing of information between autotuing
programs. In particular, we have been working to develop a data exchange format between auto-
tuning systems. The idea is to develop a library of real-world objective functions with parameters
from actual applications. The idea is that such a collection will both promote head to head compar-
ison between auto-tuning systems and to allow optimizations researchers to quantitatively evaluate
new optimization algorithms. So far, we have worked with Argonne National Lab to develop a file
format for sharing autotuing data. We have also instrumented Active Harmony so that it will rec-
ord data from each execution in the proposed file format. We have started to collect an initial cor-
pus of auto-tuning runs.
The third area we have started to work on is the topic of applying the Active Harmony auto-tuning
system to GPU systems. Initial work has concentrated on developing techniques that allow auto-
tuned code to be dynamically loaded into a running GPU program. This is a critical infrastructure
step required to allow program to be modified during runtime without have to re-run each applica-
tion from the start for each configuration. In addition, we have been working with the Utah group
to ensure that the combined Chill and Active Harmony system are able to work in a GPU environ-
ment.
Developing the Active Harmony Auto-tuning System (cont.)
Page 5 August 2012
TAU Enhancements for SUPER By Allen Malony and Sameer Shende
1 Introduction
The University of Oregon is contributing to the SUPER project in the use of the TAU
Performance System to understand end-to-end performance, to discover the interaction of
performance factors, and to integrate performance characterization, analysis, and modeling in
intelligent optimization, including autotuning. There are new developments being made to TAU in
four areas. The first involves extensions to TAU's measurement infrastructure to provide event-
based sampling (Section 2). We are adding this support to provide a broader scope of measurement
mechanism that can be used in SUPER performance evaluation and autotuning experiments. Second,
new instrumentation capabilities have ben added to TAU for source and binary code (Section 3). The
third and largest development activity in SUPER involving TAU is the building of a next-generation
performance database called TAUdb (Section 4). In this interim report, we highlight the progress
made in all areas. Finally, TAU is being integrated into the SUPER autotuning framework (Section
5).
2 Integrated Hybrid Parallel Performance Measurement
The SUPER project has broad requirements for measurement support that motivated new work
on an integrated measurement framework in TAU where data from statistical sampling through
interrupt handlers are organized alongside traditional probed measurements. The statistical
samples are collected via one of two mechanisms. Traditional timer-based interrupts generate
a sample point at regular intervals of time specified by the analyst. They allow us to use the
collected samples to estimate the time spent executing specific lines of code simply by counting the
number of samples for each line.

Recorded samples are organized with respect to their enclosing TAU probed-event contexts. For
example, all samples encountered while within the execution of the a loop body probed and meas-
ured by TAU are associated with the TAU event that represents the said loop body. Samples are
recorded and stored in the form of the encountered program counter address at runtime. The rela-
tively expensive task of converting this address into the application source code’s symbol name,
file name and line number is performed at the end of application execution by using the GNU binu-
tils [15] toolsuites Binary File Descriptor (BFD) library interface. In addition to recording flat pro-
file samples with respect to each TAU event context, we have also implemented the ability to cap-
ture the function call context leading to each sample. This is achieved through callstack unwinding
from the samples context. Our framework uses the libunwind [16] library package for this purpose.
In addition, we can also determine the runtime callsite to a TAU probe event, allowing us to differ-
entiate the time spent by callsite. For example, where we would previously have measurements for
time spent over all MPI Send invocations in an application, we will now have the information dif-
ferentiated by their exact callsites in the source code. The integrated hybrid measurement frame-
work has been implemented and ported to pertinent platforms. Our goal is to enable robust feature
support for C/C++ and Fortran codes employing all the major compilers on the BlueGene/P, Blue-
Gene/Q, Cray XT5, XE6, XK6 systems and generic x86 64 clusters.
3 Instrumentation
We have improved support for both source and binary instrumentation in TAU. For source
instrumentation, we have integrated a new ROSE based parser in the Program Database Toolkit
(PDT), TAU's static analysis component. This improves support for parsing C, C++, and UPC
programs under Linux x86 64 using static binaries bundled in PDT. Two new tools (roseparse,
and upcparse) were introduced in PDT v3.17 released in November 2011. These tools, based on
ROSE, emit PDB files that can be parsed by the tau_instrumentor tool. This work on ROSE was
done in collaboration with the LLNL team and features a robust solution for parsing C, C++, and
UPC programs.
TAU supported DyninstAPI (from U. Wisconsin and U. Maryland) for rewriting binary _les.
Worked with the team at U. Wisconsin to improve the support for rewriting multi-threaded
applications and updated support for DWARF in DyninstAPI v7.0.1. Besides DyninstAPI,
TAU has introduced support for Intel Exascale Lab's MAQAO [17] toolkit. A new tool tau
rewrite was introduced and PDT bundles MAQAO in a binary release. An auto-update tool was
also introduced in PDT and to easily pull new MAQAO updates in a PDT installation. This
improves the usability of the binary rewriter and we have successfully introduced 8 updates to
MAQAO through this tool. MAQAO supports single and multi-threaded applications written in
C and Fortran using GNU and Intel compilers for the Linux x86 64 platform. We are working
with the MAQAO group to support C++ and improved demangling of C++ names. We have
also begun integration work with PEBIL tool (from the PMaC group at SDSC). PEBIL is a
lightweight instrumentor that now supports binary rewriting for TAU at routine boundaries.
While DyninstAPI has mature support for selective instrumentation using exclude and include
list of modules and _les as well as support for outer-loop level instrumentation, MAQAO and
PEBIL do not support these features at present. We hope to introduce these features at a later
date. While MAQAO has been released with PDT, TAU's support for PEBIL is at a prototype
stage at present. We hope to release these tools in a future TAU release.
TAU has been extended to support a POSIX I/O interposition library based on linker-level
instrumentation. The extensions allow us to observe parameters that flow through the I/O calls
[1].
TAU Enhancements for SUPER (cont.)
Page 6 August 2012
4 TAUdb
Seven years ago, the TAU research group designed a performance database schema and
associated data management framework for archiving parallel performance profiles. PerfDMF
(Performance Data Management Framework) [5] was the result, and while it has been
successfully integrated into the TAU analysis tools ParaProf [3] and PerfExplorer [6], there has
been limited uptake of the framework by the performance tools community. After polling the
community and from our own experience, we have targeted areas for redesigning the framework.
The desired changes are now happening as part of the SUPER project plan.
The PerfDMF database schema was successful at storing general parallel profile results, but there
were some notable problems with the design. There were not explicit relationships in some parts
of the schema, the organizational hierarchy was too rigid, and the performance metadata were
not stored in a form that made it easy to query against. The redesigned schema, TAUdb, is an
incremental modication that preserves backwards compatibility with existing PerfDMF databases.
TAUdb schemas have been written for PostgreSQL [13] and H2 [10] DBMS (DataBase
Management System). TAUdb will eventually also support Oracle [12], MySQL [11],
DB2 [8], and Derby [9] - the DBMSs supported by PerfDMF. The design for storing performance
profiles and associated metadata is complete, as is a rough draft of how Views, which replace
the rigid data organization hierarchy, will be stored and queried in the database. We are working
to update our existing Java tools, PerfDMF (command line tools and data API), ParaProf, and
PerfExplorer to work with the new schema.
A machine has been configured to be the database server for user collaboration and to also act
as the web server. It has been named taudb.nic.uoregon.edu and the DBMS is PostgreSQL.
Each project will have its own database on this server; scripts for generating user accounts and
databases have been written to facilitate this. Profiles can be uploaded using either the existing
PerfDMF tools or can be copied to the server using a restricted login. Once a profile has been
copied to the server, it is automatically loaded into the correct database according to supplied
metadata. The TAU nightly regression tests that generate performance data are loaded to the new
infrastructure, and further testing of the infrastructure is ongoing.
5 Autotuning and TAU
We have implemented an autotuning and specialization framework combining instrumentation
with TAU and the TAUdb performance database with several other software tools developed by
SUPER participants. In addition, we are applying TAU's unique approach to event creation to
define events based on code location and some context or state of the execution meaningful to the
analysis of interest. This framework is being used in multi-parameter profiling and in capturing
user metadata during execution.
The autotuning framework has the following basic structure as illustrated in Figure 1 (below): a
region of code to be tuned is extracted into a separate function (\outlined") using the ROSE
outliner (LLNL). The outlined function is instrumented using TAU and is run on representative
datasets to collect baseline performance data, which are stored in TAUdb. Captured along with
the performance data are metadata about the dataset being processed and the computational
environment in which the program is running. For example, parameters to the outlined kernel are
captured, along with information about the CPU architecture, cache sizes, GPUs present, and so
on.
TAU Enhancements for SUPER (cont.)
Page 7 August 2012

Figure 1
Code variants are then generated using CHiLL (Utah), a source-to-source loop transformation
framework, based upon a set of scripts describing the loop transformations to be made. Scripts
expose tunable parameters that are modified to generate different code variants. Active Harmony
(Maryland) is used to search the parameter space in parallel. With each variant tested by Active
Harmony, performance data are captured in TAUdb, with all the metadata described earlier, along
with the CHiLL script used and its parameters. This workflow is captured in Figure 2 (next page)
TAU Enhancements for SUPER (cont.)
Page 8 August 2012

Figure 2
TAU Enhancements for SUPER (cont.)
Page 9 August 2012

Since the best code variant to use in a given situation may be determined by an interaction
between properties of the dataset being processed and the execution environment, this process is
repeated on multiple computers and over multiple datasets. We then run a decision-tree learning
algorithm (currently ID3 or C4.5 as implemented in Weka) over the data stored in TAUdb to
generate a classifier that will selects the best-performing code variant for a given dataset and
execution environment. Finally, a ROSE-based code generator converts the decision tree into a
wrapper function that evaluates the data available at runtime and executes the desired variant.
We have tested a proof-of-concept implementation of the above over matrix multiply kernels
using both CHiLL and CUDA-CHiLL (Utah), which automatically generates a CUDA kernel
from sequential C code for execution on a GPU. These tests indicate that even on relatively
simple code, different code variants will perform best on different GPU architectures, and that
this system allows for the development of software that can adapt to its environment. We are
currently working on applying this workflow to the optimization of sparse matrix multiplication
in PFLOTRAN.
To apply TAU to multi-parameter studies with the autotuning framework, we use a scheme to
capture at runtime parameters associated with an executing kernel and capture the name and
values for each parameter. A performance mapping is created between the string where multi-
parameter values are encoded and the performance data associated with the pair of interval event.
The data are stored in the performance database and are used for further analysis to evaluate the
impact of a given parameter on the performance of a kernel.
References
[1] S. Shende, A. D. Malony, W. Spear, and K. Schuchardt, \Characterizing I/O Performance
Using the TAU Performance System," in Proc. Exascale Symposium, ParCO 2011 Conference,
Springer, September 2011.
[2] D. H. Bailey, E. Barszcz, J. T. Barton, D. S. Browning, R. L. Carter, R. A. Fatoohi, P. O.
Frederickson, T. A. Lasinski, H. D. Simon, V. Venkatakrishnan and S. K. Weeratunga. The
NAS Parallel Benchmarks, The International Journal of Supercomputer Applications, 1991.
[3] R. Bell, A. D. Malony, and S. Shende, A Portable, Extensible, and Scalable Tool for Parallel
Performance Pro_le Analysis, Proceedings of EUROPAR 2003, LNCS 2790, Springer, Berlin,
pp. 17-26, 2003.
[4] Browne, S., Dongarra, J., Garner, N., Ho, G., Mucci, P. A Portable Programming Interface for
Performance Evaluation on Modern Processors The International Journal of High Performance
Computing Applications, Volume 14, number 3, pp. 189-204, Fall 2000.
[5] K. Huck, A. D. Malony, R. Bell and A. Morris. Design and Implementation of a Parallel
Performance Data Management Framework, Proceedings of the 2005 International Conference
on Parallel Processing. June 14-17, 2005. Oslo, Norway.
[6] K. Huck, A. Malony, S. Shende and A. Morris. Knowledge Support and Automation for Per-
formance Analysis with PerfExplorer 2.0. Large-Scale Programming Tools and Environments,
special issue of Scienti_c Programming, vol. 16, no. 2-3, pp. 123-134, 2008.
[7] A. Morris, A. Malony, and S. Shende. Design and Implementation of a Hybrid Parallel Perfor-
mance Measurement System. International Conference on Parallel Processing (ICPP), Septem-
ber 2010.
[8] IBM, DB2 Database Software, http://www-01.ibm.com/software/data/db2/, 2012.
[9] Apache Software Foundation, Apache Derby, http://db.apache.org/derby/, 2012.
[10] HSQLDB Group, H2 Database Engine, http://www.h2database.com/html/main.html, 2012.
[11] Oracle Corporation, MySQL, http://www.mysql.com/, 2012.
[12] Oracle Corporation, Oracle Database, http://www.oracle.com/us/products/database/
index.html, 2012.
[13] PostgreSQL Global Development Group, PostgreSQL, http://www.postgresql.org/, 2012.
[14] Json.org, JavaScript Object Notation, http://www.json.org/, 2012.
[15] Gnu Project, binutils, http://www.gnu.org/software/binutils/, 2012.
[16] David Mosberger, libunwind, http://www.nongnu.org/libunwind/, 2012.
[17] Intel Exascale Labs, UVSQ, http://www.maqao.org, 2012.
[18] Dyninst Project, StackwalkerAPI, http://www.dyninst.org/downloads/stackwalkerAPI,
2011.
TAU Enhancements for SUPER (cont.)
Page 10 August 2012

Where do you work and how are you involved with SUPER?
I am a research scientist in Erich Strohmaier's Fu-ture Technologies Group (FTG) at the Lawrence Berkeley National Laboratory. As part of SUPER, I work in the performance research thrust focusing on developing and deploying our auto-tuning technologies into SciDAC applications.
Can you briefly summarize your educational and work background?
I performed my graduate work in computer sci-ence at the University of California at Berkeley where I received my PhD in 2008 under the guid-ance of David Patterson. Initially, I worked on verification, floor planning, and place-and-route for the IRAM embedded-DRAM vector proces-sor. My focus shifted to high-performance compu-ting and I received an appointment as a graduate student research assistant at LBL in 2005. My work there drove the research for my thesis. I received bachelors degrees in Electrical Engineering, Applied Mathematics, and Physics from Southern Methodist University in 1999. While an undergraduate, I spent 5 semester interning at Cyrix corporation where my duties included RTL verification, place-and-route, and post-silicon debug.
Where are your from originally?
Dallas, Texas
What are your research areas of interest?
My current research focuses on performance optimization, performance modeling, and hardware-software co-design. To maximize performance researchers leverage a tech-nique called automatic performance tuning (or "auto-tuning") that automates the tradi-tional benchmark-analyze-modify tuning loop. My current vein of research attempts to embed the high-level knowledge of the underlying numerical method into auto-tuners. Orthogonally, I developed a bound-and-bottleneck based performance model called the Roofline performance model that allows programmers to quickly calculate and visualize performance impediments. This can be used to limit tuning, qualify results, or in the case of HW/SW co-design determine the relationships between a processor's on-chip memory, bandwidth, and compute capabilities.
What do you see yourself doing five years from now?
Today, we are beginning to see the specialization and diversification of architectures to suit the varying needs of the wide-range of HPC applications and users. Decade-old gen-eralizations on parallelism, memory architecture, consistency, and coherency embedded into existing implementations will not be applicable to every machine. Thus, in 5 years, I see our auto-tuning work expanding to compensate for the diversity of architectures and systems whilst simultaneously encompassing high-level domain-specific knowledge via DSLs. I expect this will result in me working closely with domain scientists and applied mathematicians.
What are some things you enjoy doing that don’t involve computers?
In enjoy playing various board games and watching classic movies.
Featured SUPER Researcher: Samuel Williams
Page 11 August 2012

Integration with Active Harmony and TAU We have worked extensively with the Active Harmony group at University of Maryland, and with the TAU group at University of Oregon to integrate our tools and develop a novel per-formance-tuning layer. With regard to Active Harmony, we have integrated a recent “friendly release” of Active Harmony with our CUDA-CHiLL compiler to perform autotuning of parallel codes targeting Nvidia GPUs. Previously, we had performed an integration for sequential node code only. The integration with TAU is new to SUPER. Utah hosted Oregon graduate student Nick Chaimov in December to develop requirements to replicate applica-tion tuning in our prior work, but with full automation of performance data gathering using TAU. In prior work, this was done with significant user intervention. Nick has since devel-oped extensions to TAU to support these experiments automatically. In addition, as a team we have integrated TAU’s performance database with CHiLL and CUDA-CHiLL and Active Harmony, so that the results of autotuning are collected in a tree-structured performance database that can be queried to capitalize on prior experiments. Application tuning for SciDAC-e We chose to focus our application tuning in the first year on the SciDAC-e applications. Utah is involved in the SciDAC-e project entitled, “Performance Engineering Research Institute SciDAC-e Augmentation: Performance Enhancement of Simulating the Dynamics of Photoex-citation for Solar Energy Conversion”. We have worked extensively to optimize the applica-tion of interest, called MGDC. This work was reported at the March SUPER meeting. The optimizations we have performed employ the CHiLL autotuning framework, but in some cas-es require source modifications to simplify the code. The table below shows a number of optimized versions we compared in this work, measured on the Hopper system at NERSC. Overall, these optimizations yield a 1.07X speedup. We see additional optimization opportu-nities which require program modifications that we will explore until the end of the year.
Autotuning Work at University of Utah
By Mary Hall
Page 12 August 2012

Performance variability is a common occurrence on many HPC platforms. When significant, it can represent performance degradation in a number of different ways. For example, per-formance variability indicates that jobs are not performing optimally (as measured by the best observed execution rate). Also, if a job runs much slower than expected, the job may exceed the requested time and be aborted before finishing. This will waste some of the pro-ject allocation time, depending on the frequency of checkpoints. Any resubmitted jobs to continue where the aborted job left off goes back into the batch queue, and is subject to the typical queue delay, slowing project productivity. The first step in addressing this issue is systematic and adequate performance measurement of production runs, to identify if performance variability is a problem and to diagnose why it is occurring. Without this, we cannot identify mitigation strategies, nor convince those who might be able to address the issues directly that there is in fact a problem worth addressing. We are currently looking at four different aspects of performance variability. (1) We want to identify significant differences in execution rate between similar jobs on the same platform when using the same resource requests (e.g. processor count) and in the same computing environment (system software versions, etc.). (2) We want to identify significant differences in execution rate during the execution of a single job (not related to changes in the job's exe-cution characteristics). This type of performance variability can be identified without refer-ence to the execution rate of other similar jobs, but does require a different type of perfor-mance instrumentation. (3) We want to track the time that a job spends in the batch queue. This variability, which is typically much larger than that in the execution rate, exacerbates the impact of execution rate variability when aborted jobs must be resubmitted. (4) We want to identify significant differences in execution rate between similar jobs on the same plat-form when using the same resource requests (e.g. processor count) over a period of time during which things have changed: application code version, compiler version, communica-tion library version, etc. While some change is expected, we do not want a degradation in performance to pass unnoticed, as this may reflect a correctable performance bug or require regression to earlier versions of the code or of the system software stack. We are still in the process of developing approaches to measurement, archive, and analysis. However, we have started working with some climate science researchers to instrument and collect data from their production Community Earth System Model (CESM) runs on the Cray XK6 system at the Oak Ridge Leadership Computing Facility (OLCF). The current per-formance instrumentation is a modest augmentation to what is already used in practice and introduces no measurable instrumentation overhead, and so is suitable for "always on" in-strumentation in the production runs. Figures 1-4 describe performance for one of the ongoing suites of experiments. They contain performance data from 21 jobs, each computing 150 simulation days, collected over a period of 24 (calendar) days. Each job ran on 4096 processor cores (512 processes, 8 OpenMP threads per process). Two of the jobs exceeded the requested 6 hour wallclock limit, one between simulation days 140 and 145 days, and one between 145 and 150. Based on previ-ous benchmark runs, the expectation was that 180 simulation days could be completed in 6 hours. Figure 1 is a plot of the total runtime for each experiment, where execution time for the failed jobs is estimated based on the execution rate exhibited during the last 5 or 10 com-pleted simulation days. Figures 2 and 3 are estimates of the run time without I/O and for I/O only, respectively. Note that both I/O and non-I/O demonstrated performance variability.
Capturing Computer Performance Variability in Production Jobs
By Pat Worley
Page 13 August 2012

Figure 4 is a plot of runtime for the 5 previous simulation days at intervals of 5 simulation days. Plotted are data for the two failed jobs, for the slowest successful job, and for the fast-est successful job. The failed experiments exhibit high internal performance variability. The successful runs have primarily different "base" (or static) performance levels. This was just happenstance - neither of these are necessary characteristics of failed or successful runs. We are still in the process of analyzing these data. However, one interesting result is already ap-parent from comparing the processors subsets allocated for the fast and slow successful jobs. The Gemini interconnect on both the Cray XK6 at the OLCF and the XE6 at NERSC is imple-mented as a 3D torus topology. Two compute nodes share the same (X,Y,Z) coordinates and are connected via a single Gemini switch. Messages between nodes differing by one in either X, Y, or Z coordinates go through two Gemini switches. For communication between nodes that are neighbors in the Y direction, performance differs depending on whether the smaller Y-coordinate is even ("faster") or is odd ("slower"). For communication between nodes that are neighbors in the Z direction, every eighth link is "slower". The fastest successful job was allocated an "optimal" set of processors, comprising a contigu-ous 4x2x16 allocation with both compute nodes with the same (X,Y,Z) coordinates assigned to this job. In contrast, for the slowest successful job 53\% of the processes (272) were as-signed to compute nodes in which the other compute node with the same (X,Y,Z) coordinates was assigned to a different job. The 256 allocated nodes also were scattered within an 8x16x24 partition of the interconnect with many compute nodes assigned to other concur-rently running jobs. As such, the slow job was potentially exposed to more contention with other jobs, and also required communication over more, and possibly slower, links than was the fastest job. We are continuing to measure and diagnose the performance variability in this suite of ex-periments, as well as in a number of other experiments. Data will be archived in the TAU per-formance database and used to track long term trends in variability, in end-to-end metrics such as time spent in the queue, and in base performance as the transition is made to new versions of the code and in the compiler. We are also using these results to examine mitiga-tion strategies, in order to avoid compute node allocations that lead to poor performance.
Figure 1
Capturing Computer Performance Variability in Production Jobs (cont.)
Page 14 August 2012
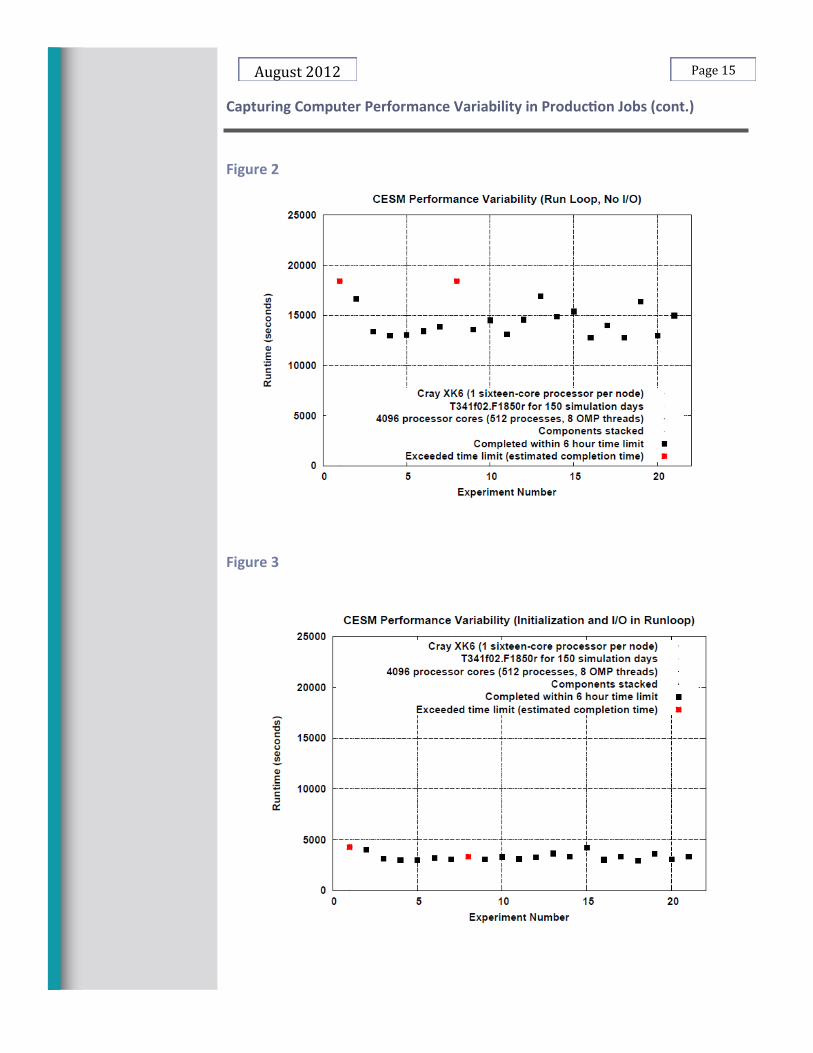
Figure 2
Figure 3
Capturing Computer Performance Variability in Production Jobs (cont.)
Page 15 August 2012

Figure 4
Capturing Computer Performance Variability in Production Jobs (cont.)
Page 16 August 2012

Saurabh Hukerikar, Pedro C. Diniz, and Robert F. Lucas. A programming model for resilience in ex-treme scale computing. Workshop on Fault Tolerance for HPC at eXtreme Scale (FTXS 2012), Boston, MA, June 25-28, 2012.
Jacob Lidman, Daniel Quinlan, Chunhua Liao, and Sally McKee. ROSE::FTTRANSFORM – a source-to-source transformation framework for exascale fault-tolerance research. Workshop on Fault Tolerance for HPC at eXtreme Scale (FTXS 2012), Boston MA, June 25-28, 2012. pluto
Kathryn Mohror, Adam Moody, and Bronis de Supinski. Asynchronous checkpoint migration with MRNET in the scalable checkpoint/restart library. Workshop on Fault Tolerance for HPC at eXtreme Scale (FTXS 2012), Boston, MA, June 25-28, 2012.
Shah Mohammad Faizur Rahman, Jichi Guo, Akshatha Bhat, Carlos Garcia, Majedul Haque Sujon, Qingy Yi, Chunhua Liao, Daniel J. Quinlan, "Studying The Impact Of Application-level Optimizations On The Power Consumption Of Multi-Core Architectures", ACM International Conference on Computing Fron-tiers 2012 (CF'12), May 15th-17th, 2012, Cagliari, Italy.
Kiran Kasichayanula, Daniel Terpstra, Piotr Luszczek, Stan Tomov, Shirley Moore, and Greg Peterson. Power aware computing on GPUs. Symposium on Application Accelerators in High Performance Compu-ting (SAAHPC 2012), Argonne National Laboratory, July 10-11, 2012.
Vince Weaver, Matthew Johnson, Kiran Kasichayanula, James Ralph, Piotr Luszczek, Daniel Terpstra, and Shirley Moore. Measuring energy and power with PAPI. International Workshop on Power-Aware Systems and Architectures (PASA 2012), Pittsburgh, PA, September 10, 2012.
Heike Jagode, Shirley Moore, and Daniel Terpstra. Performance counter monitoring for the Blue Gene/Q architecture. ScicomP 2012, Toronto, Ontario, Canada, May 2012.
Bland, W., Bouteiller, A., Herault, T., Hursey, J., Bosilca, G., Dongarra, J. "An Evaluation of User-Level Failure Mitigation Support in MPI," Proceedings of Recent Advances in Message Passing Interface - 19th European MPI Users' Group Meeting, EuroMPI 2012, Springer, Vienna, Austria, September 23 - 26, 2012.
Marc Cases Guix, Bronis R. de Supinski, Greg Bronevetsky and Martin Schulz. Fault resilience of the algebraic multi-grid solver. International Conference on Supercomputing, Venice, Italy, June 25-29, 2012.
Jeff R. Hammond, Sriram Krishnamoorthy, Sameer Shende, Nichols A. Romero, Allen D. Malony: Perfor-mance characterization of global address space applications: a case study with NWChem. Concurrency and Computation: Practice and Experience 24(2): 135-154 (2012).
Barry Rountree, Dong Ahn, Bronis R. de Supinski, David K. Lowenthal, and Martin Schulz. Beyond DVFS: A first look at performance under a hardware-enforced power bound. In 8th Workshop on High-Performance, Power-Aware Computing (HPPAC), May 2012.
Chen-Han Ho, Marc de Kruijf, Karu Sankaralingam, Barry Rountree, Martin Schulz, and Bronis de Supinski. Mechanisms and evaluation of cross-layer fault-tolerance for supercomputing. In the 41st International Conference on Parallel Processing (ICPP), Sep 2012 (to appear).
See the SUPER website for additional recent publications
Selected Recent Publications
Page 17 August 2012
SUPER website: http://www.super-scidac.org/
Contact: Bob Lucas, [email protected]
Newsletter editor: Bonnie Browne, [email protected]