august 2012 - mississippi department of transportationmdot.ms.gov/documents/planning/programs/ms...
TRANSCRIPT
August 2012
Mississippi Goods Movement and Trade Study Final Report Page-i
Mississippi Goods Movement and Trade Study FINAL REPORT
Mississippi Goods Movement and Trade Study Final Report
Table of Contents
Background ......................................................................................................................................................... 1
Study Process ................................................................................................................................................................ 2
Introduction ........................................................................................................................................................ 3
The Impact of Supply Chain Logistics on the Economy ............................................................................... 3
Logistics Revolution............................................................................................................................................ 4
Intermodal Freight Changes ............................................................................................................................ 4
Linking Freight and the Economy ................................................................................................................. 5
Mississippi’s transconomy .............................................................................................................................. 8
Economic Base Analysis .......................................................................................................................................... 10
Employment Forecasts .................................................................................................................................... 12
Freight Industrial Intensive Sectors........................................................................................................... 12
Commodity Flows – Demands on Mississippi’s Modal Networks ......................................................... 14
Freight Corridor Profiles ........................................................................................................................................ 17
Primary Highway Connections ..................................................................................................................... 18
Primary Rail Connections ............................................................................................................................... 19
Primary Port Connections .............................................................................................................................. 21
Primary Aviation Connections ..................................................................................................................... 23
Profile of the Primary Multimodal Corridors ......................................................................................... 23
Gulf Coast (I-10) Corridor Performance Summary .............................................................................. 25
Vicksburg – Meridian (I-20) Performance Summary ......................................................................... 26
Southaven – McComb (I-55) Corridor Performance Summary ...................................................... 27
Picayune – Meridian (I-59) Corridor Performance Summary ........................................................ 28
Jackson – Hattiesburg – Gulfport (US 49) Corridor Performance Summary............................. 29
Olive Branch – Tupelo – Fulton (US 78) Corridor Performance Summary ................................ 30
Mississippi’s Key Marine Corridors ................................................................................................................... 31
The Importance of Key Commerce Corridors to Mississippi ................................................................... 34
Forecasts of Significant Logistics and Global Trends .......................................................................... 36
Summary of Strategic Corridor Trends ............................................................................................................ 38
Identified Freight Infrastructure Needs .................................................................................................. 40
Highway Infrastructure Needs ............................................................................................................................. 40
Mississippi Goods Movement and Trade Study Final Report Page-ii
Mississippi Goods Movement and Trade Study FINAL REPORT
Freight Performance Measures (FPM) Analysis ................................................................................... 40
Motor Carrier Surveys ..................................................................................................................................... 41
District Engineer Survey ................................................................................................................................. 41
Freight Rail Needs ..................................................................................................................................................... 46
Port and Waterway Needs ..................................................................................................................................... 47
Additional Corridor Improvement Strategies ................................................................................................ 48
Performance Measures ................................................................................................................................. 53
Cost Effective Transport = Economic Development ............................................................................ 55
A Freight and Economic Development Action Plan ..................................................................................... 55
1. Develop an Integrated Freight and Economic Development Vision and Action Plan ....... 55
2. Integrate Freight Considerations into Industrial Land Planning .............................................. 57
3. Logistics Development Strategies .......................................................................................................... 59
4. Increase Public Understanding of Economic Development and Freight Issues .................. 61
Funding Impacts of Recommended Strategies .............................................................................................. 61
Conclusions .................................................................................................................................................................. 62
Mississippi Goods Movement and Trade Study Final Report Page-iii
Mississippi Goods Movement and Trade Study FINAL REPORT
Table of Exhibits
Exhibit 1: Supply Chain, Fundamental Construct ................................................................................................... 3 Exhibit 2: Mississippi’s Multimodal Freight Transportation Networks........................................................ 7 Exhibit 3: Mississippi Population Change, 2000-2008 ........................................................................................ 9 Exhibit 4: Business Clusters; Firms with 50+ Employees ................................................................................. 11 Exhibit 5: Manufacturing Business Clusters ........................................................................................................... 13 Exhibit 6: Basic Data Types for Freight Planning and Their Uses ................................................................. 14 Exhibit 7: Counties with Highest Production / Attraction Tonnage (2006 & 2020) ............................. 15 Exhibit 8: Counties with Highest Through Movement by Truck (Tonnage, 2006) ................................ 16 Exhibit 9: Counties with Highest Through Movement by Rail (Tonnage 2006)...................................... 16 Exhibit 10: Water Transportation of Freight in Mississippi (Tonnage, 2006) ......................................... 17 Exhibit 11: Corridors with Heavy Truck Volumes ............................................................................................... 18 Exhibit 12: Identified Trade Corridors in the State of Mississippi ................................................................ 19 Exhibit 13: Primary Mississippi Rail Connections ............................................................................................... 20 Exhibit 14: Strategic Airport/Port Connections ................................................................................................... 21 Exhibit 15: Primary Mississippi Port Connections .............................................................................................. 22 Exhibit 16: Mississippi Multimodal Commerce Corridors ................................................................................ 24 Exhibit 17: Gulf Coast (I-10) Corridor ....................................................................................................................... 25 Exhibit 18: Vicksburg – Meridian (I-20) Corridor................................................................................................ 26 Exhibit 19: Southaven – McComb (I-55) Corridor ............................................................................................... 27
Exhibit 20: Picayune – Meridian (I-59) Corridor ................................................................................................. 28 Exhibit 21: Jackson – Hattiesburg – Gulfport Corridor ...................................................................................... 29 Exhibit 22: Olive Branch – Tupelo – Fulton Corridor ........................................................................................ 30 Exhibit 23: Key Marine Corridors in Mississippi .................................................................................................. 31 Exhibit 24: Key Mississippi Ports on the Mississippi River - 2008 .............................................................. 32 Exhibit 25: Tennessee-Tombigbee Waterway Commerce - 2008 ................................................................ 33
Exhibit 26: Gulf Intracoastal Waterway Corridor Commerce - 2008 ......................................................... 34 Exhibit 27: Total Freight Tons by Multimodal Corridor with Forecast....................................................... 34 Exhibit 28: Multimodal Corridor Traffic by Direction with Forecast (millions of tons) ...................... 35 Exhibit 29: Top Ten Commodity Groups for Mississippi (millions of tons) .............................................. 36 Exhibit 30: Mode Split of Total Mississippi and Corridor Traffic (thousands of tons) ......................... 36 Exhibit 31: Summary of Selected Trade Trends on Mississippi ..................................................................... 37 Exhibit 32: Truck Bottlenecks Identified by MDOT District Engineers....................................................... 42 Exhibit 33: Recommended Improvement for Identified Truck Bottlenecks ............................................. 43 Exhibit 34: Mississippi Freight Rail Needs .............................................................................................................. 46 Exhibit 35: Mississippi Ports Needs ........................................................................................................................... 47 Exhibit 36: Southaven-McComb Corridor Key Freight-Related Short Term Projects ........................... 49 Exhibit 37: Gulf Coast Corridor Key Freight-Related Short Term Projects ............................................... 50 Exhibit 38: Jackson-Hattiesburg-Gulfport Corridor Freight-Related Short Term Projects ............... 51 Exhibit 39: Vicksburg-Meridian Corridor Key Freight-Related Short Term Projects ........................... 51 Exhibit 40: Picayune-Meridian Corridor Freight-Related Short Term Project ........................................ 52 Exhibit 41: Olive Branch-Tupelo-Fulton Corridor Freight-Related Short Term Project .................... 52
Mississippi Goods Movement and Trade Study Final Report Page-1
Mississippi Goods Movement and Trade Study FINAL REPORT
BACKGROUND With the “Interstate Era” for highway construction concluded, transportation planners today increasingly face the question of how to maximize the future investment in, not only the roadway system, but the overall transportation network. With the passage of the Safe, Accountable, Flexible, Efficient Transportation Equity Act–A Legacy for Users (SAFETEA-LU) in 2005, and most recently Moving Ahead for Progress in the 21st Century (MAP-21) greater emphasis is being placed on freight transportation and the need to support trade in a new economic environment. Historically, the basic approach to freight planning on a statewide basis to date has used a four step planning process focused on supply and demand analysis:
1) Inventories of existing freight infrastructure across all major modes are documented.
2) The demand of freight flows across modal networks is summarized in the current year and for future demand years.
3) The supply of existing infrastructure is compared to current and future freight demands, and a gap analysis is performed.
4) Based on existing investment plans and future freight mobility needs, project and policy recommendations are established that seek to accommodate freight mobility in the absence of dedicated freight funding programs.
In undertaking the Mississippi Goods Movement and Trade Study (MGM&TS), the Mississippi Department of Transportation sought to advance the state-of-the-practice for statewide freight planning by introducing the following goals to the study effort:
A Multimodal Plan – Corridor-based freight improvement strategies to enhance mobility of the inbound or outbound goods that are vital to the success of the businesses located along the corridors.
A Framework for the Future – Provide a plan that gives guidance for multimodal performance, including: identify policies, programs, and future research to guide MDOT's continued leadership in advancing freight, economic and trade issues in the State of Mississippi.
o Corridor based improvement strategies.
o Corridor based performance metrics.
Identify the Ties between Freight and Economic Development – Examine policies, programs and research that provides leadership in advancing trade and economic development at the state level, with a focus on specific improvement strategies within the state’s key commerce corridors.
Mississippi Goods Movement and Trade Study Final Report Page-2
Mississippi Goods Movement and Trade Study FINAL REPORT
Study Process A two-phased approach was undertaken in conducting the MGM&TS. The overarching purpose in Phase 1 of the study effort was to describe Mississippi’s freight transportation networks from a trade and economic development perspective. The Phase 1 analysis also identified current and future freight transportation needs based on stakeholder input and data analysis. However, this gap analysis once again focused on specific improvements within key commerce corridors identified through economic and commodity data analysis. The following products resulted from the Phase 1 project scope:
Technical Memorandum A – Demographic and Economic Profile of Mississippi Technical Memorandum B - Review of Relevant Freight Initiatives and Studies Technical Memorandum C – Mississippi Multimodal Trade Corridor Assessment Technical Memorandum D - Market Areas and Primary Infrastructure Connections Technical Memorandum E – Commodity Flows Technical Memorandum F – Driving Forces; Key Issues and Trends Affecting Freight
Phase 2 of the MGM&TS built upon the data and analysis platform established in Phase 1 to develop modeling tools and forecasts, and multimodal performance metrics, freight and economic development policy, and freight mobility project recommendations. The key products resulting from Phase 2 of the project scope include:
The integration of commodity flow data into the statewide travel demand model through the Commodity Information Management tool (CIMS)
Technical Memorandum G1 - Identification of Major Bottlenecks and Chokepoints Using Capacity Analysis
Technical Memorandum G2 – Performance Measures
Technical Memorandum H - Forecasts of Significant Global Trade Trends and Their Impact on Mississippi
Technical Memorandum I - Freight Analysis and Forecasts of Key Mississippi Multimodal Corridors
Technical Memorandum J – Freight Performance Measures Analysis
Technical Memorandum K - Economic Development, Freight and Goods Movement Technical Memorandum L - Identified Improvements Technical Memorandum M – Statewide Modeling of Potential Passenger and Freight
Conflicts
This final report presents the key findings and outputs from the task activities and tools developed throughout the course of study. Copies of these technical reports are available upon request.
Mississippi Goods Movement and Trade Study Final Report Page-3
Mississippi Goods Movement and Trade Study FINAL REPORT
INTRODUCTION Freight activity is a derived demand function of economic activity (production) and population (consumption). As economic factors drive the characteristics and responses of the freight transportation system, the population and labor pool influence the composition of industry sectors present in a state or region. How the transportation system functions reflects the economic environment and trade activities of a state or region. In the 1980s, the United States’ economy continued to be dominated by the manufacturing sector. By 2005, this had shifted significantly to a service-oriented environment, providing 68 percent of the country’s gross domestic product (GDP). As the manufacturing sector moves from the industrialized nations to emerging and developing countries such as Russia, China, and India, globalization has required a change in the U.S. transportation system. Growth in trade, its significance in the economy, and the changing characteristics of trade partnerships can be traced to a number of factors, including:
Liberalization of world trade policies Growth of multinational trade blocks and multinational corporations Accelerated adoption of advanced information technologies
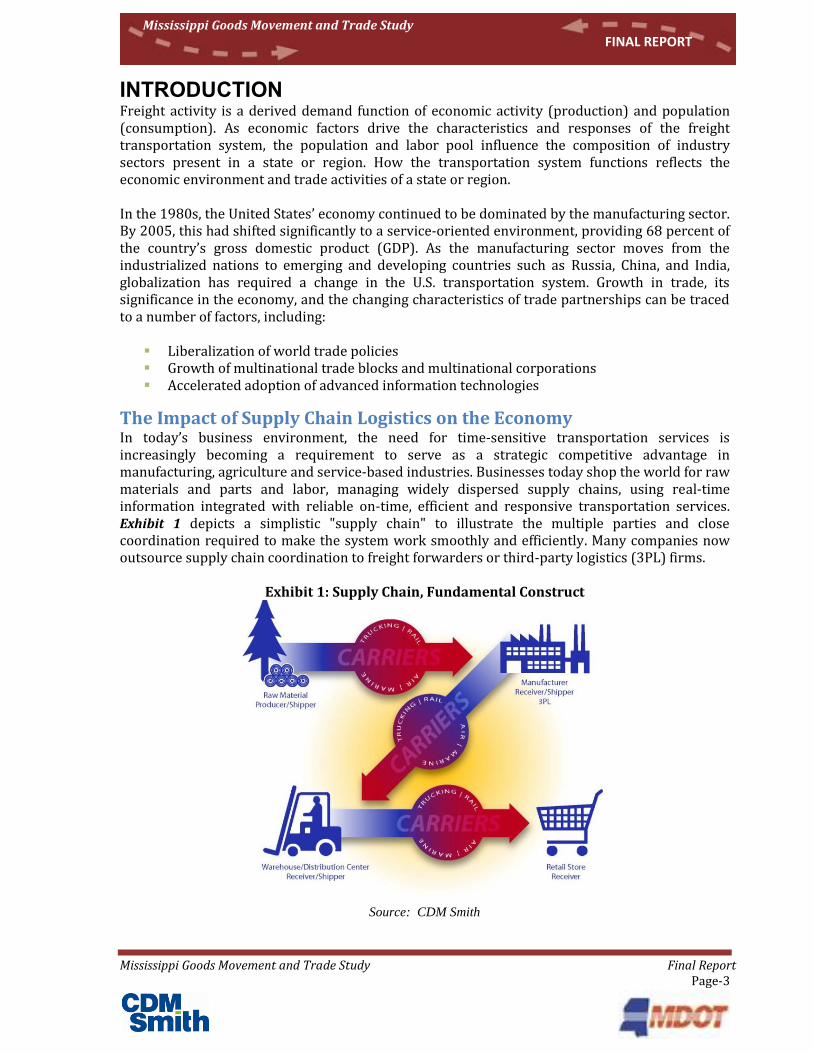
The Impact of Supply Chain Logistics on the Economy In today’s business environment, the need for time-sensitive transportation services is increasingly becoming a requirement to serve as a strategic competitive advantage in manufacturing, agriculture and service-based industries. Businesses today shop the world for raw materials and parts and labor, managing widely dispersed supply chains, using real-time information integrated with reliable on-time, efficient and responsive transportation services. Exhibit 1 depicts a simplistic "supply chain" to illustrate the multiple parties and close coordination required to make the system work smoothly and efficiently. Many companies now outsource supply chain coordination to freight forwarders or third-party logistics (3PL) firms.
Exhibit 1: Supply Chain, Fundamental Construct
Source: CDM Smith
Mississippi Goods Movement and Trade Study Final Report Page-4
Mississippi Goods Movement and Trade Study FINAL REPORT
Logistics Revolution The integration of information and transportation to accommodate global supply chains has given rise to a logistics revolution in private sector business practices. Just-in-time (JIT) inventory practices, electronic shipment tracking, the use of multiple transportation modes, the optimization of distribution facilities, and e-commerce are just some of the changes that have occurred and are constantly evolving in the economy. As the United States economy becomes more service oriented and U.S. producers focus on more high-value or value-added products that are expensive to inventory, companies are adopting modern supply chain management techniques with the following attributes:
Demand Pull Supply Chains: The movement of product triggered only after consumer places an order as opposed to the production of goods in advance (supply-push).
Customer-Focused Logistics: Tailoring logistics networks to respond to the unique needs and profitability requirements of specific customers.
Transportation Effectiveness: Leveraging the ability of integrated transportation to differentiate customer service and improve total supply chain cost performance.
The logistics revolution for Mississippi likely has several implications:
Growing population centers will drive increasingly higher levels of freight activity and truck traffic, as product movements are triggered by consumer consumption.
As highway congestion continues to grow in key freight corridors, alternative goods movement strategies like transloading will impact regional land use planning.
To remain competitive in the new global economy, businesses will seek environments where transportation systems allow integrated supply chain strategies to succeed - namely transportation networks must support reliability, agility, dependability, and to some extent redundancy, to meet the JIT expectations in the commercial, industrial and retail sectors of the economy.
Intermodal Freight Changes Since 1980, successful partnerships fostering intermodal transportation have emerged between railroads, intermodal marketing companies (IMCs), steamship lines, and motor carriers. Transporting truck trailers on flat car (TOFC) or piggy-back service was the first application of intermodal technology. This was seen as an opportunity by the railroads to provide a competitive option to the growing motor carrier market. TOFC provided the railroads with a platform to compete economically with truck transport; however, trucks had more flexible routes as the TOFC service was only offered on major rail lanes and the truck trailers were limited to use in domestic markets only. The introduction of container on flat car (COFC) technology improved the cost effectiveness of intermodal transportation, eliminating the highway chassis and wheels and reducing weight on the railcar. Containers also opened international markets to intermodal transportation, as containers can be readily exchanged between rail and water modes. In order for intermodal rail services to produce a rate advantage, shipments typically must move a sufficient distance (500 miles or more) to allow rail line-haul economies to outweigh higher terminal and transaction costs. Other requirements usually include sufficient volume to operate full or nearly full daily trains and to have on-time reliability competitive with trucking.

Mississippi Goods Movement and Trade Study Final Report Page-5
Mississippi Goods Movement and Trade Study FINAL REPORT
North American International Containerized Freight Patterns Currently about 60 percent of containerized freight that originates in Asia bound for U.S. East Coast markets enters via the West Coast ports of Los Angeles/Long Beach (LA/LB), referred to as San Pedro Bay Ports. About 38 percent of containerized freight from Asia (mostly northern Asia) uses the Panama Canal to reach ports along the U.S. East Coast ports.
Inland Point Intermodal
Inland Point Intermodal (IPI) is the mode employed from the West Coast ports to service non-coastal areas. This transports containers from the West Coast ports to an inland distribution point (or hub) and on to the final destinations.
Shipping and Port Changes The tremendous growth in trade, combined with the increasing service demands of shippers and receivers, has led to a capacity deficiency in many of North America’s key gateway ports. Prior to the “Great Recession” which began in the last quarter of 2007, many published reports and forecasts were suggesting that the majority of U.S. container ports will experience capacity shortfalls by the year 2020. This capacity deficit in the LA/LB port facility, and the subsequent inability to handle increased volumes in other West Coast ports, may be influenced by three international facility and port developments.
The expansion of the Panama Canal will allow more rapid movement from Far East Asian ports to the East Coast. This expansion, due to be completed in 2014, will allow for the passing of the larger 14,000-plus twenty-foot equivalent unit (TEU) rated vessels, currently required to either utilize the West Coast or transit around the horn of South America.
The Suez Canal’s ability to provide an all water route for middle and near East Asian ports can drive volumes directly to the East Coast of the U.S.
Finally, the further expansion and development of the transportation route, inclusive of the Port of Prince Rupert location in western Canada allows for an intermodal rail route directly to the U.S. Midwest.
Linking Freight and the Economy America is increasingly becoming a trading nation and a majority of U.S. exports are related to goods production industries. Over 60 percent of all U.S. exports in 2009 were manufactured goods. This includes advance technology products such as semiconductors, instruments, and aerospace equipment; which accounted for 23 percent of the total goods exported from the U.S.1 America remains the world’s leading manufacturer, producing manufactured goods valued at more than $3.9 trillion in 2008 and nearly doubling the record production of a decade earlier. Manufacturing industries ranked first in total export value for all U.S. industry sectors in 2008 and are projected to increase from $3.9 trillion to $4.9 trillion by 2018; reflecting a 24 percent increase in output.2 The evolving economy has made U.S. businesses more dependent upon an integrated, agile, and efficient transportation and goods movement system. To compete successfully, businesses must optimize all of their strategic economic assets including their location and access to a skilled workforce. In addition to economic assets, there are several transportation factors that heavily influence the competitiveness of U.S. businesses in the global marketplace. Transportation costs, reliability, and speed to markets are a few of the most influential factors. In a recent study of
1 U.S. Bureau of Census, 2008 2 Bureau of Labor Statistics Employment Projections, January 2010
Mississippi Goods Movement and Trade Study Final Report Page-6
Mississippi Goods Movement and Trade Study FINAL REPORT
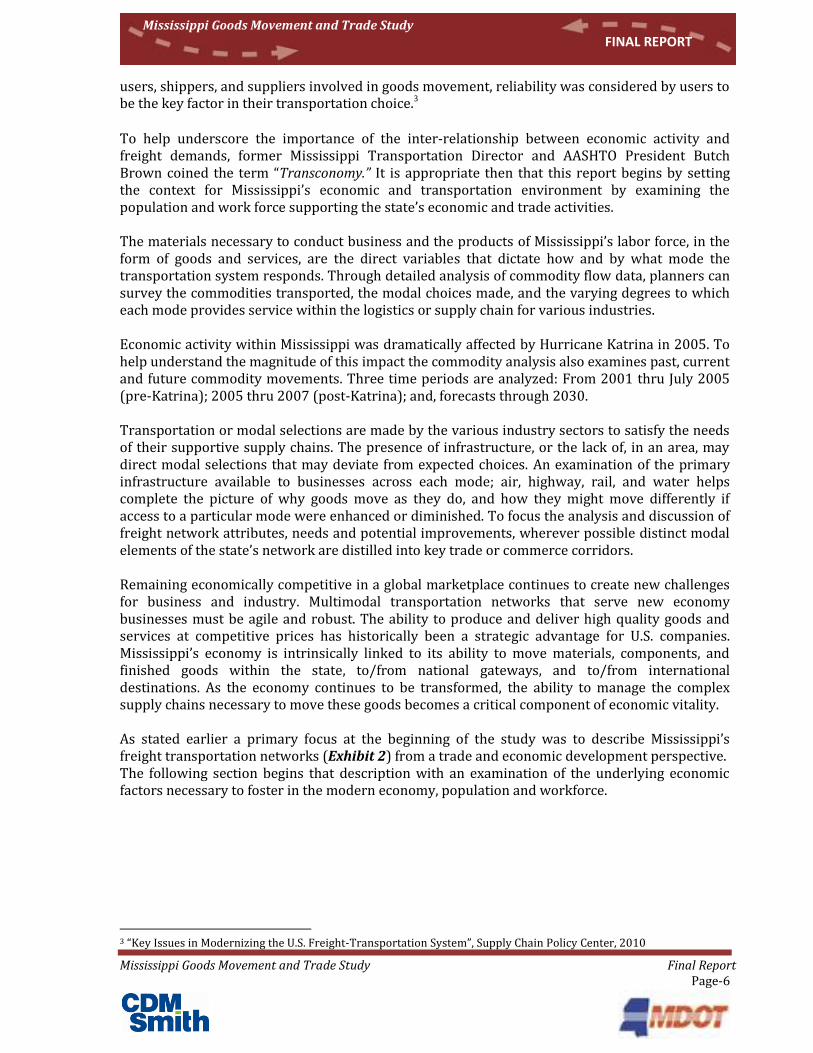
users, shippers, and suppliers involved in goods movement, reliability was considered by users to be the key factor in their transportation choice.3 To help underscore the importance of the inter-relationship between economic activity and freight demands, former Mississippi Transportation Director and AASHTO President Butch Brown coined the term “Transconomy.” It is appropriate then that this report begins by setting the context for Mississippi’s economic and transportation environment by examining the population and work force supporting the state’s economic and trade activities. The materials necessary to conduct business and the products of Mississippi’s labor force, in the form of goods and services, are the direct variables that dictate how and by what mode the transportation system responds. Through detailed analysis of commodity flow data, planners can survey the commodities transported, the modal choices made, and the varying degrees to which each mode provides service within the logistics or supply chain for various industries. Economic activity within Mississippi was dramatically affected by Hurricane Katrina in 2005. To help understand the magnitude of this impact the commodity analysis also examines past, current and future commodity movements. Three time periods are analyzed: From 2001 thru July 2005 (pre-Katrina); 2005 thru 2007 (post-Katrina); and, forecasts through 2030. Transportation or modal selections are made by the various industry sectors to satisfy the needs of their supportive supply chains. The presence of infrastructure, or the lack of, in an area, may direct modal selections that may deviate from expected choices. An examination of the primary infrastructure available to businesses across each mode; air, highway, rail, and water helps complete the picture of why goods move as they do, and how they might move differently if access to a particular mode were enhanced or diminished. To focus the analysis and discussion of freight network attributes, needs and potential improvements, wherever possible distinct modal elements of the state’s network are distilled into key trade or commerce corridors. Remaining economically competitive in a global marketplace continues to create new challenges for business and industry. Multimodal transportation networks that serve new economy businesses must be agile and robust. The ability to produce and deliver high quality goods and services at competitive prices has historically been a strategic advantage for U.S. companies. Mississippi’s economy is intrinsically linked to its ability to move materials, components, and finished goods within the state, to/from national gateways, and to/from international destinations. As the economy continues to be transformed, the ability to manage the complex supply chains necessary to move these goods becomes a critical component of economic vitality. As stated earlier a primary focus at the beginning of the study was to describe Mississippi’s freight transportation networks (Exhibit 2) from a trade and economic development perspective. The following section begins that description with an examination of the underlying economic factors necessary to foster in the modern economy, population and workforce.
3 “Key Issues in Modernizing the U.S. Freight-Transportation System”, Supply Chain Policy Center, 2010
Mississippi Goods Movement and Trade Study Final Report Page-7
Mississippi Goods Movement and Trade Study FINAL REPORT
Exhibit 2: Mississippi’s Multimodal Freight Transportation Networks
NTZR
Mississippi Goods Movement and Trade Study Final Report Page-8
Mississippi Goods Movement and Trade Study FINAL REPORT
MISSISSIPPI’S TRANSCONOMY
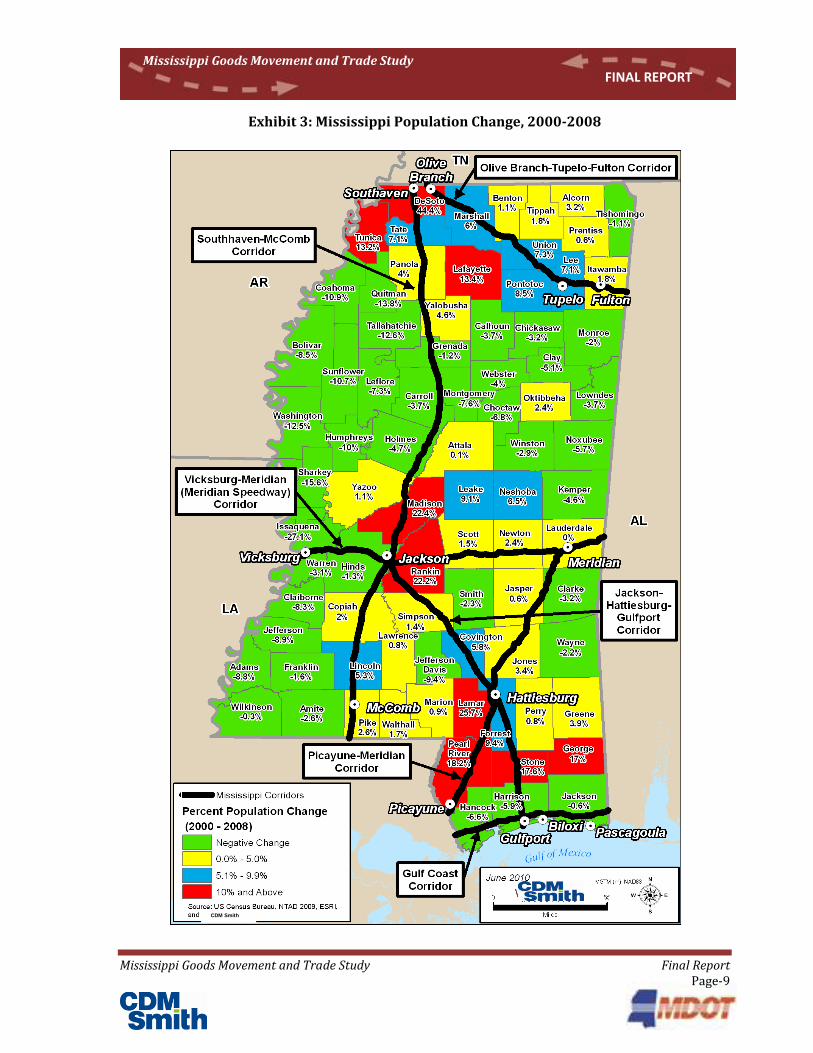
Population + Workforce Availability = Economic Opportunity The U.S. economy has been in transition for several decades, migrating from a manufacturing-based to a service-based economy. Mississippi’s industries too are likely in the future; experience growth rates that differ from those of the past. Therefore, it is important to determine the industries that will remain an integral part of Mississippi’s economy going forward. Population growth is an important indicator of economic and social well-being. During the past decade, population in the U.S. has continued to shift from rural to urban areas as the 100 largest metropolitan areas grew by 10.5 percent compared to a 5.8 percent population growth in other areas of the country.4 The suburban regions around many of the metropolitan areas expanded at a much faster rate than core cities. Many of these suburban “cities” have developed employment and commercial centers that promote live-work environments which have changed commuting and delivery patterns. Over a 35 year period between 1970 and 2005, the state of Mississippi has added nearly 700,000 people - growing the population by 31.5 percent. Population in the Southeastern Region grew 55.3 percent, nearly double the growth rate experienced in Mississippi. U.S. Census projections suggest Mississippi’s population will grow by 6.1 percent between 2005 and 2030. Population growth is generally considered a primary indicator of workforce availability, a critical factor for economic development and growth. Mississippi’s statewide population increased almost four percent from April 2000 to April 2009 compared to nine percent population growth nationally.5 According to 2010 Woods and Poole Economics data, the state’s population is projected to increase twenty-two percent by 2040 to nearly four million. During the same period, the Jackson metropolitan statistical area (MSA) population is projected to grow by 27 percent, reaching almost 750,000.6 The projected population growth in Mississippi will drive the demand for regional products and services particularly in more urbanized areas, creating a need for additional freight transportation capacity. Exhibit 3 shows that between 2000 and 2008, 51 percent of Mississippi’s 82 counties experienced negative population growth. However, of the 45 counties adjacent to the strategic freight corridors, only 10 counties (including three counties whose population was dramatically affected by Hurricane Katrina) experienced population loss during this same period. The map shows the relationship of these freight corridors to county population growth. While the presence of these freight corridors did not directly induce population growth in these counties, the economic development and employment that these freight corridors helped to foster likely contributed to that population growth.
4 State of Metropolitan America, Metropolitan Policy Program, Brookings Institute, 2010 5 U.S. Census Bureau 6 Woods and Poole Economics, Inc., 2010 data
The Southeastern Region States
Alabama
Arkansas
Louisiana
Mississippi
North Carolina
South Carolina
Tennessee
Mississippi Goods Movement and Trade Study Final Report Page-9
Mississippi Goods Movement and Trade Study FINAL REPORT
Exhibit 3: Mississippi Population Change, 2000-2008
CDM Smith
Mississippi Goods Movement and Trade Study Final Report Page-10
Mississippi Goods Movement and Trade Study FINAL REPORT
Economic Base Analysis7 Employment and economic growth are intrinsically connected to markets and transportation networks, representing the connection between the workforce, suppliers, business operations and markets.
Employment, and Income Indicators The median age in Mississippi is 33.8 years, more than a year younger than the median age of the entire Southeastern Region. In the region, only Georgia, at 33.4 years, has a population with a median age younger than Mississippi. Of all states in the Southeastern Region, Mississippi and Louisiana have the highest percentage of total population below 18 years of age: 27.3 percent. In the Southeastern Region 81.3 percent of all residents over the age of 25 had graduated from high school (2007). The comparison graduation rate for Mississippi was 78.5 percent. From 1995 to 2004, Mississippi’s rate of real income growth outpaced the Southeastern Region, averaging 22.2 percent in the state compared to 18.4 percent across the region. Between 2001 and 2007, total non-agricultural employment in Mississippi grew 4.2 percent, an average annual growth rate of approximately 0.7 percent. Total U.S. nonagricultural employment grew 10.3 percent, or an average of 2.5 percent annually. Hurricane Katrina hit the Gulf Coast at the end of August 2005; during the two years after the hurricane total nonagricultural employment declined by 4.6 percent or 2.3 percent annually.
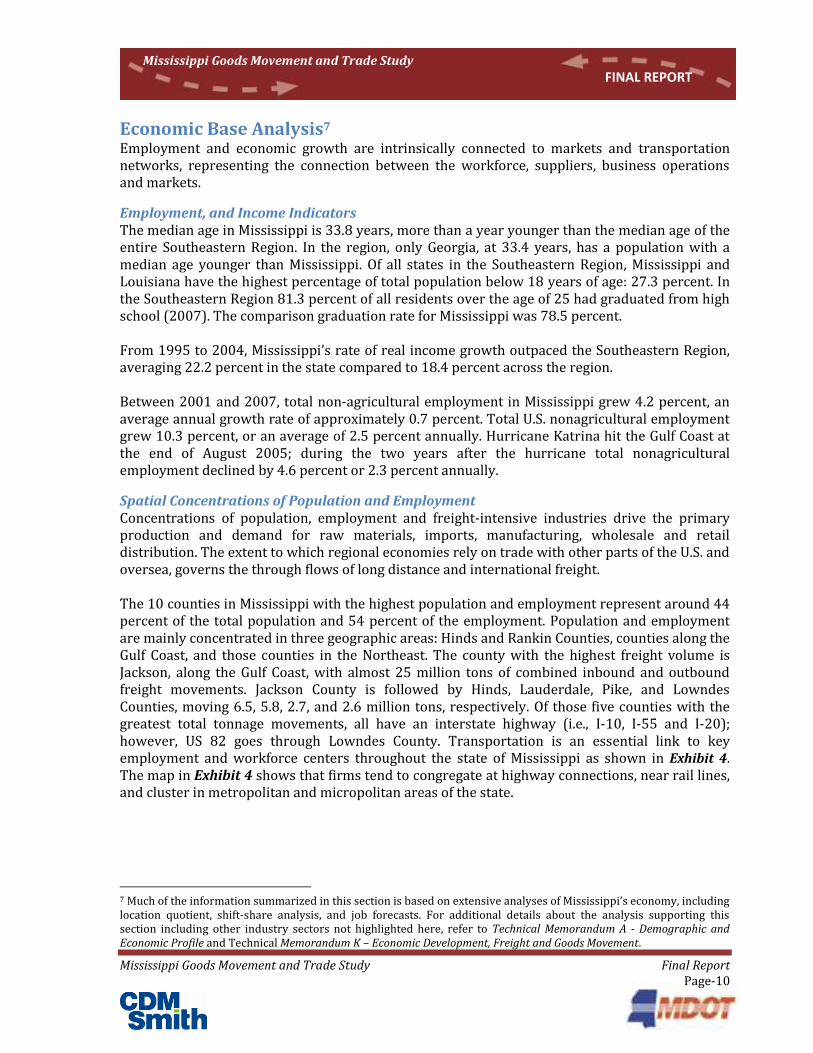
Spatial Concentrations of Population and Employment Concentrations of population, employment and freight-intensive industries drive the primary production and demand for raw materials, imports, manufacturing, wholesale and retail distribution. The extent to which regional economies rely on trade with other parts of the U.S. and oversea, governs the through flows of long distance and international freight. The 10 counties in Mississippi with the highest population and employment represent around 44 percent of the total population and 54 percent of the employment. Population and employment are mainly concentrated in three geographic areas: Hinds and Rankin Counties, counties along the Gulf Coast, and those counties in the Northeast. The county with the highest freight volume is Jackson, along the Gulf Coast, with almost 25 million tons of combined inbound and outbound freight movements. Jackson County is followed by Hinds, Lauderdale, Pike, and Lowndes Counties, moving 6.5, 5.8, 2.7, and 2.6 million tons, respectively. Of those five counties with the greatest total tonnage movements, all have an interstate highway (i.e., I-10, I-55 and I-20); however, US 82 goes through Lowndes County. Transportation is an essential link to key employment and workforce centers throughout the state of Mississippi as shown in Exhibit 4. The map in Exhibit 4 shows that firms tend to congregate at highway connections, near rail lines, and cluster in metropolitan and micropolitan areas of the state.
7 Much of the information summarized in this section is based on extensive analyses of Mississippi’s economy, including location quotient, shift-share analysis, and job forecasts. For additional details about the analysis supporting this section including other industry sectors not highlighted here, refer to Technical Memorandum A - Demographic and Economic Profile and Technical Memorandum K – Economic Development, Freight and Goods Movement.
Mississippi Goods Movement and Trade Study Final Report Page-11
Mississippi Goods Movement and Trade Study FINAL REPORT
Exhibit 4: Business Clusters; Firms with 50+ Employees
Columbus
Pascagoula
Mississippi Goods Movement and Trade Study Final Report Page-12
Mississippi Goods Movement and Trade Study FINAL REPORT
Employment Forecasts Regional Economic Models, Inc. (REMI) provides employment projections through the year 2050 for the state of Mississippi as a whole and 36 geographic regions, which are comprised of either one county or the aggregation of two to six counties, at a two and three digit NAICS industry breakdown. Mississippi industries projected to significantly increase in employment by 2030 include:
Education Services Health Care and Social Assistance Arts, Entertainment, and Recreation Accommodations and Food Services Professional, Technical, and Scientific Services industries
With service industries projected to dominate the economy in Mississippi, in terms of employment growth, the following industries are projected to decrease in employment through 2030:
Farming Wholesale Trade Management of Companies and Enterprises Information Services Retail Trade
Industry employments projections indicate those industries that are historically dominant in the state’s economy, will remain dominant in the future, in terms of major employers in the economy. Public Administration, Manufacturing, Retail Trade, Accommodation and Food Service, and Health Care and Social Assistance industries are predicted to remain the top five job sectors in Mississippi through 2030.
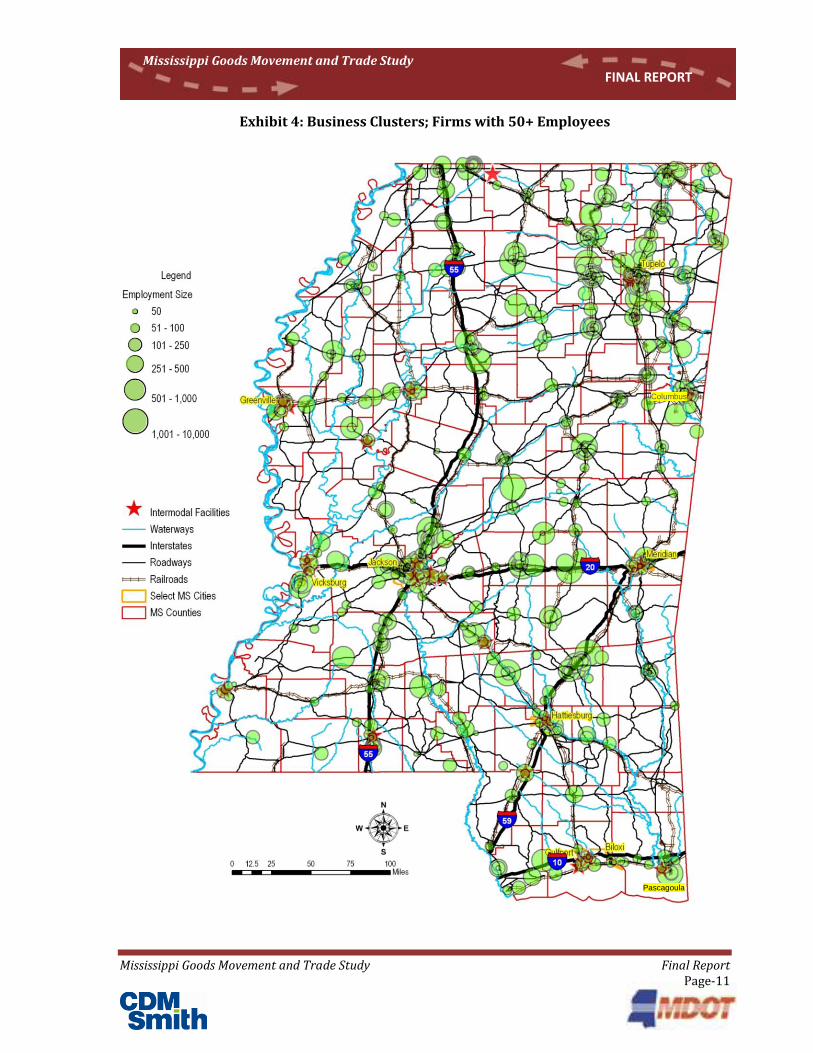
Freight Industrial Intensive Sectors The freight-intensive sectors in Mississippi include Construction, Manufacturing, Wholesale and Retail Trade, and Transportation and Warehousing. These sectors either need to ship more materials and finished products than other sectors because of the nature of their business, or provide key linkages between different parts of the economy. Manufacturing businesses make up 73 percent of those businesses identified within this group. Furniture manufacturing is densely clustered in the northeast portion of the state around Tupelo; textile manufacturing businesses are almost entirely north of the I-20 (Vicksburg-Meridian) Corridor; food processing is located around Laurel in Jones County; and, petrochemical manufacturing is mostly located either in the greater Jackson metropolitan area, along the Gulf Coast, or in the Northeast (Exhibit 5). Only two transportation and warehousing businesses with greater than 50 employees were identified within the database query, one located in Franklin County and the other in Jackson County.
Mississippi Goods Movement and Trade Study Final Report Page-13
Mississippi Goods Movement and Trade Study FINAL REPORT
Exhibit 5: Manufacturing Business Clusters
Source: Prepared by CDM Smith
Columbus
Pascagoula
Mississippi Goods Movement and Trade Study Final Report Page-14
Mississippi Goods Movement and Trade Study FINAL REPORT
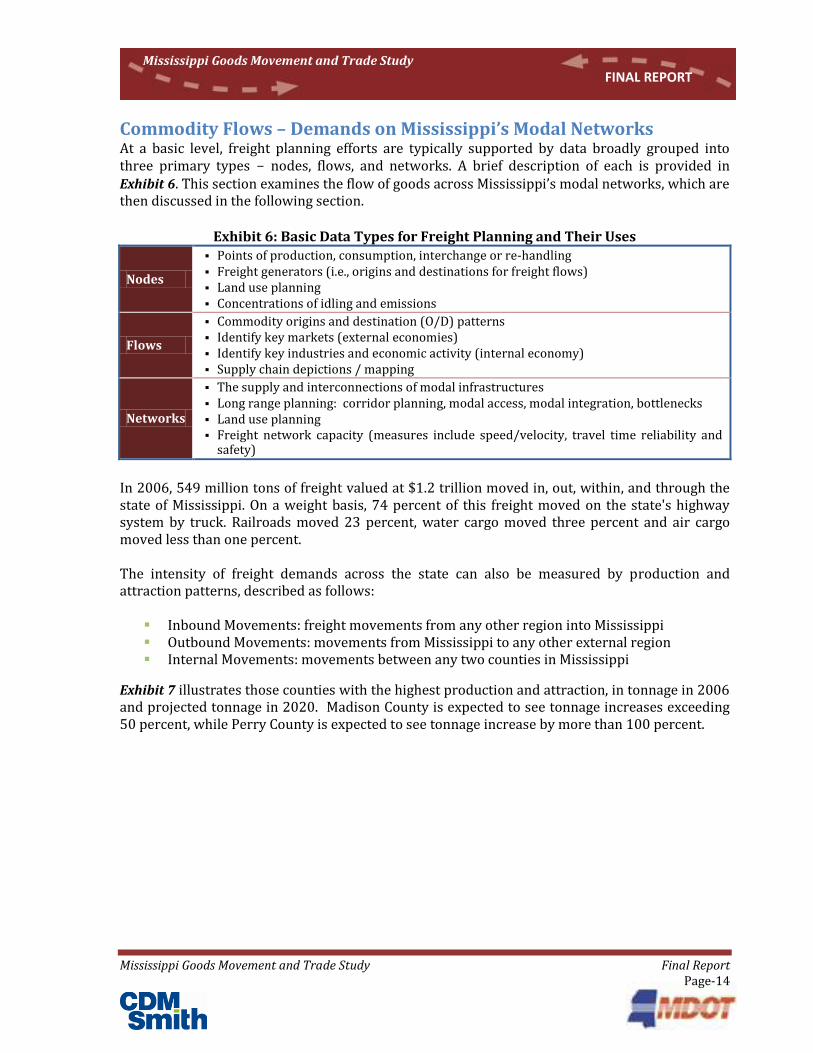
Commodity Flows – Demands on Mississippi’s Modal Networks At a basic level, freight planning efforts are typically supported by data broadly grouped into three primary types - nodes, flows, and networks. A brief description of each is provided in Exhibit 6. This section examines the flow of goods across Mississippi’s modal networks, which are then discussed in the following section.
Exhibit 6: Basic Data Types for Freight Planning and Their Uses
Nodes
Points of production, consumption, interchange or re-handling Freight generators (i.e., origins and destinations for freight flows) Land use planning Concentrations of idling and emissions
Flows
Commodity origins and destination (O/D) patterns Identify key markets (external economies) Identify key industries and economic activity (internal economy) Supply chain depictions / mapping
Networks
The supply and interconnections of modal infrastructures Long range planning: corridor planning, modal access, modal integration, bottlenecks Land use planning Freight network capacity (measures include speed/velocity, travel time reliability and
safety)
In 2006, 549 million tons of freight valued at $1.2 trillion moved in, out, within, and through the state of Mississippi. On a weight basis, 74 percent of this freight moved on the state's highway system by truck. Railroads moved 23 percent, water cargo moved three percent and air cargo moved less than one percent. The intensity of freight demands across the state can also be measured by production and attraction patterns, described as follows:
Inbound Movements: freight movements from any other region into Mississippi Outbound Movements: movements from Mississippi to any other external region Internal Movements: movements between any two counties in Mississippi
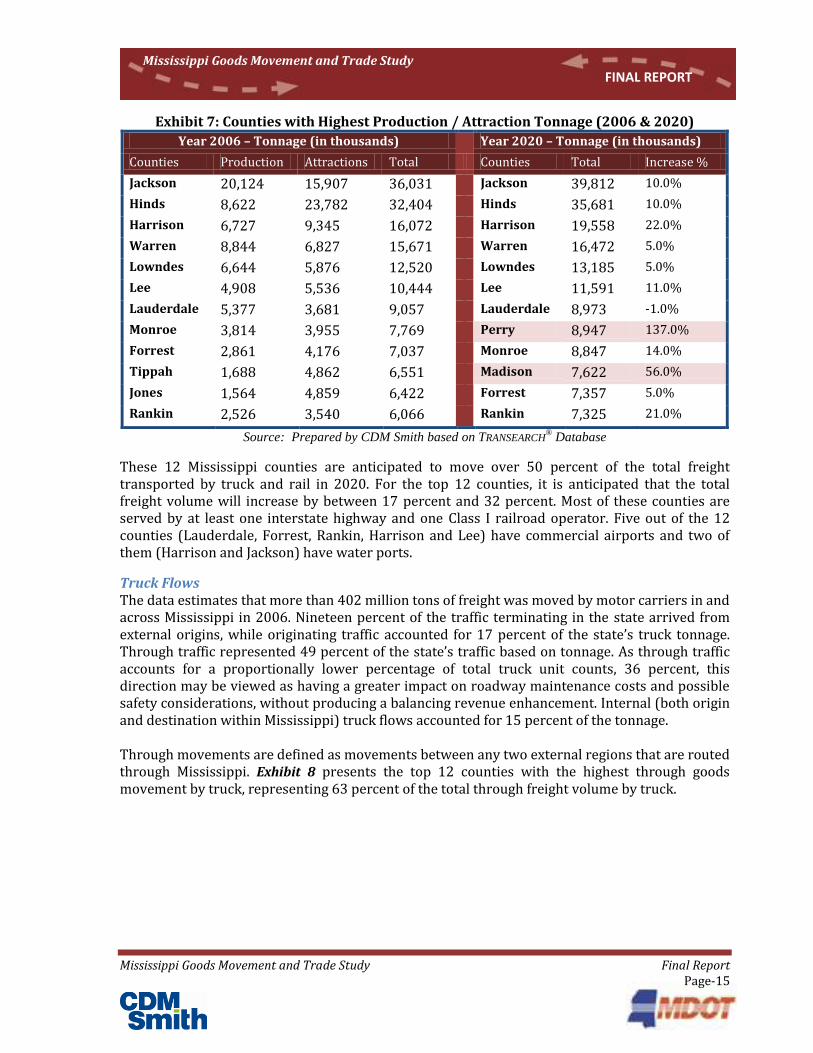
Exhibit 7 illustrates those counties with the highest production and attraction, in tonnage in 2006 and projected tonnage in 2020. Madison County is expected to see tonnage increases exceeding 50 percent, while Perry County is expected to see tonnage increase by more than 100 percent.
Mississippi Goods Movement and Trade Study Final Report Page-15
Mississippi Goods Movement and Trade Study FINAL REPORT
Exhibit 7: Counties with Highest Production / Attraction Tonnage (2006 & 2020)
Year 2006 – Tonnage (in thousands) Year 2020 – Tonnage (in thousands)
Counties Production Attractions Total Counties Total Increase %
Jackson 20,124 15,907 36,031 Jackson 39,812 10.0%
Hinds 8,622 23,782 32,404 Hinds 35,681 10.0%
Harrison 6,727 9,345 16,072 Harrison 19,558 22.0%
Warren 8,844 6,827 15,671 Warren 16,472 5.0%
Lowndes 6,644 5,876 12,520 Lowndes 13,185 5.0%
Lee 4,908 5,536 10,444 Lee 11,591 11.0%
Lauderdale 5,377 3,681 9,057 Lauderdale 8,973 -1.0%
Monroe 3,814 3,955 7,769 Perry 8,947 137.0%
Forrest 2,861 4,176 7,037 Monroe 8,847 14.0%
Tippah 1,688 4,862 6,551 Madison 7,622 56.0%
Jones 1,564 4,859 6,422 Forrest 7,357 5.0%
Rankin 2,526 3,540 6,066 Rankin 7,325 21.0%
Source: Prepared by CDM Smith based on TRANSEARCH®
Database
These 12 Mississippi counties are anticipated to move over 50 percent of the total freight transported by truck and rail in 2020. For the top 12 counties, it is anticipated that the total freight volume will increase by between 17 percent and 32 percent. Most of these counties are served by at least one interstate highway and one Class I railroad operator. Five out of the 12 counties (Lauderdale, Forrest, Rankin, Harrison and Lee) have commercial airports and two of them (Harrison and Jackson) have water ports.
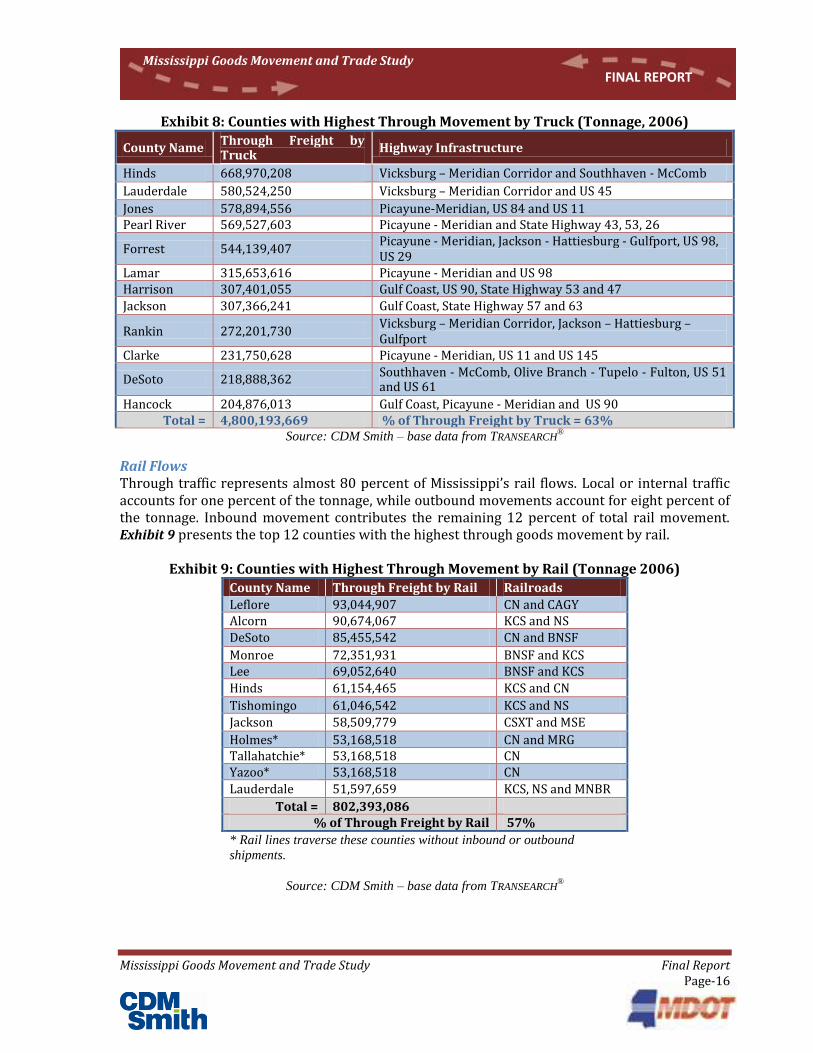
Truck Flows The data estimates that more than 402 million tons of freight was moved by motor carriers in and across Mississippi in 2006. Nineteen percent of the traffic terminating in the state arrived from external origins, while originating traffic accounted for 17 percent of the state’s truck tonnage. Through traffic represented 49 percent of the state’s traffic based on tonnage. As through traffic accounts for a proportionally lower percentage of total truck unit counts, 36 percent, this direction may be viewed as having a greater impact on roadway maintenance costs and possible safety considerations, without producing a balancing revenue enhancement. Internal (both origin and destination within Mississippi) truck flows accounted for 15 percent of the tonnage. Through movements are defined as movements between any two external regions that are routed through Mississippi. Exhibit 8 presents the top 12 counties with the highest through goods movement by truck, representing 63 percent of the total through freight volume by truck.
Mississippi Goods Movement and Trade Study Final Report Page-16
Mississippi Goods Movement and Trade Study FINAL REPORT
Exhibit 8: Counties with Highest Through Movement by Truck (Tonnage, 2006)
County Name Through Freight by Truck
Highway Infrastructure
Hinds 668,970,208 Vicksburg – Meridian Corridor and Southhaven - McComb
Lauderdale 580,524,250 Vicksburg – Meridian Corridor and US 45
Jones 578,894,556 Picayune-Meridian, US 84 and US 11 Pearl River 569,527,603 Picayune - Meridian and State Highway 43, 53, 26
Forrest 544,139,407 Picayune - Meridian, Jackson - Hattiesburg - Gulfport, US 98, US 29
Lamar 315,653,616 Picayune - Meridian and US 98 Harrison 307,401,055 Gulf Coast, US 90, State Highway 53 and 47
Jackson 307,366,241 Gulf Coast, State Highway 57 and 63
Rankin 272,201,730 Vicksburg – Meridian Corridor, Jackson – Hattiesburg – Gulfport
Clarke 231,750,628 Picayune - Meridian, US 11 and US 145
DeSoto 218,888,362 Southhaven - McComb, Olive Branch - Tupelo - Fulton, US 51 and US 61
Hancock 204,876,013 Gulf Coast, Picayune - Meridian and US 90 Total = 4,800,193,669 % of Through Freight by Truck = 63%
Source: CDM Smith – base data from TRANSEARCH®
Rail Flows Through traffic represents almost 80 percent of Mississippi’s rail flows. Local or internal traffic accounts for one percent of the tonnage, while outbound movements account for eight percent of the tonnage. Inbound movement contributes the remaining 12 percent of total rail movement. Exhibit 9 presents the top 12 counties with the highest through goods movement by rail.
Exhibit 9: Counties with Highest Through Movement by Rail (Tonnage 2006)
County Name Through Freight by Rail Railroads
Leflore 93,044,907 CN and CAGY Alcorn 90,674,067 KCS and NS
DeSoto 85,455,542 CN and BNSF
Monroe 72,351,931 BNSF and KCS Lee 69,052,640 BNSF and KCS
Hinds 61,154,465 KCS and CN
Tishomingo 61,046,542 KCS and NS
Jackson 58,509,779 CSXT and MSE
Holmes* 53,168,518 CN and MRG Tallahatchie* 53,168,518 CN Yazoo* 53,168,518 CN
Lauderdale 51,597,659 KCS, NS and MNBR
Total = 802,393,086 % of Through Freight by Rail 57%
* Rail lines traverse these counties without inbound or outbound
shipments.
Source: CDM Smith – base data from TRANSEARCH®
Mississippi Goods Movement and Trade Study Final Report Page-17
Mississippi Goods Movement and Trade Study FINAL REPORT
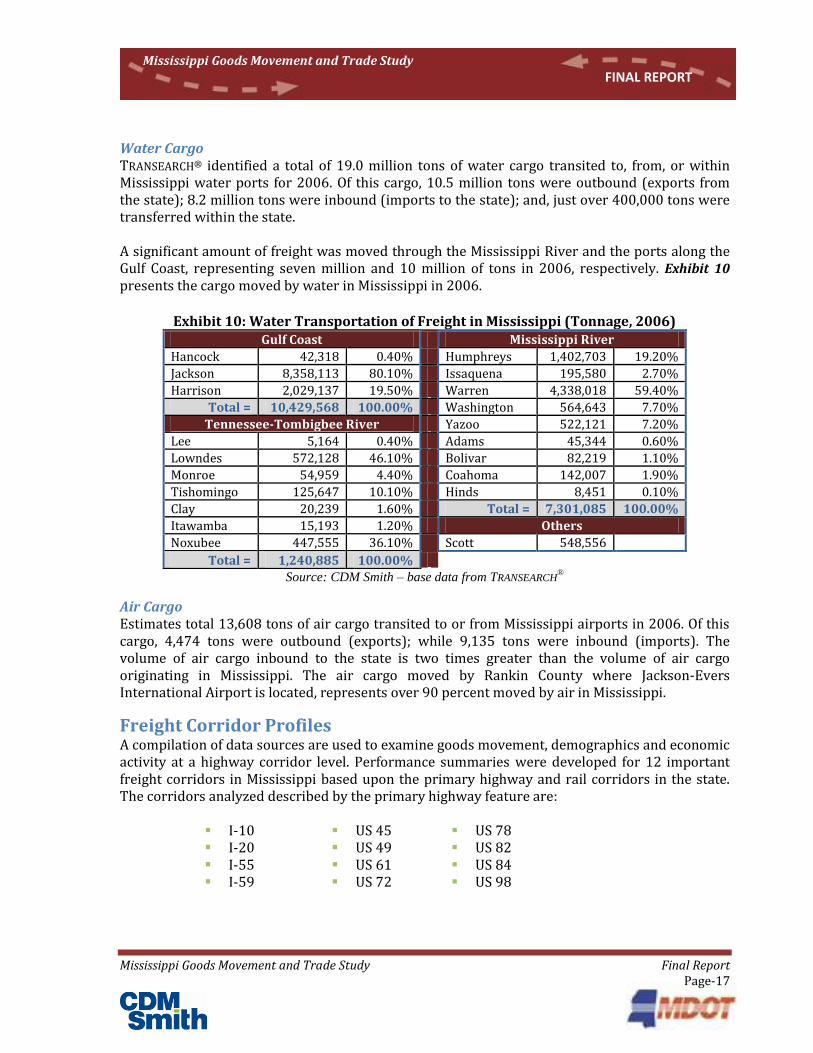
Water Cargo TRANSEARCH® identified a total of 19.0 million tons of water cargo transited to, from, or within Mississippi water ports for 2006. Of this cargo, 10.5 million tons were outbound (exports from the state); 8.2 million tons were inbound (imports to the state); and, just over 400,000 tons were transferred within the state. A significant amount of freight was moved through the Mississippi River and the ports along the Gulf Coast, representing seven million and 10 million of tons in 2006, respectively. Exhibit 10 presents the cargo moved by water in Mississippi in 2006.
Exhibit 10: Water Transportation of Freight in Mississippi (Tonnage, 2006) Gulf Coast Mississippi River
Hancock 42,318 0.40% Humphreys 1,402,703 19.20%
Jackson 8,358,113 80.10% Issaquena 195,580 2.70%
Harrison 2,029,137 19.50% Warren 4,338,018 59.40%
Total = 10,429,568 100.00% Washington 564,643 7.70%
Tennessee-Tombigbee River Yazoo 522,121 7.20%
Lee 5,164 0.40% Adams 45,344 0.60%
Lowndes 572,128 46.10% Bolivar 82,219 1.10%
Monroe 54,959 4.40% Coahoma 142,007 1.90%
Tishomingo 125,647 10.10% Hinds 8,451 0.10%
Clay 20,239 1.60% Total = 7,301,085 100.00%
Itawamba 15,193 1.20% Others
Noxubee 447,555 36.10%
Scott 548,556
Total = 1,240,885 100.00%
Source: CDM Smith – base data from TRANSEARCH®
Air Cargo Estimates total 13,608 tons of air cargo transited to or from Mississippi airports in 2006. Of this cargo, 4,474 tons were outbound (exports); while 9,135 tons were inbound (imports). The volume of air cargo inbound to the state is two times greater than the volume of air cargo originating in Mississippi. The air cargo moved by Rankin County where Jackson-Evers International Airport is located, represents over 90 percent moved by air in Mississippi.
Freight Corridor Profiles A compilation of data sources are used to examine goods movement, demographics and economic activity at a highway corridor level. Performance summaries were developed for 12 important freight corridors in Mississippi based upon the primary highway and rail corridors in the state. The corridors analyzed described by the primary highway feature are:
I-10 US 45 US 78 I-20 US 49 US 82 I-55 US 61 US 84 I-59 US 72 US 98
Mississippi Goods Movement and Trade Study Final Report Page-18
Mississippi Goods Movement and Trade Study FINAL REPORT
For each, freight traffic flows, corridor characteristics, freight performance metrics, and primary freight generators were described. The Surface Transportation Board's (STB) Private Rail Waybill data for Mississippi and Global Insight's TRANSEARCH® data are used to profile traffic on these corridors. Motor carrier traffic volumes are routed to the major highway segments using the Oak Ridge National Laboratory’s highway routing model. The application of this data provides a portrayal of regional freight flows in a national context, shows both the national range of truck traffic flows by inbound, outbound, and through categories, and provides a more detailed regional display of these volumes. Of the twelve initial corridors analyzed, six stood out as primary corridors of commerce, and it is those six Commerce Corridors that are the focus of discussion in the following section. For additional details and information on all twelve corridors see Technical Memorandum C – Mississippi Corridor Assessment, Technical Memorandum D – Market Areas and Primary Infrastructure Connections, Technical Memorandum E – Commodity Flows, and Technical Memorandum J – Freight Performance Measures Analysis.
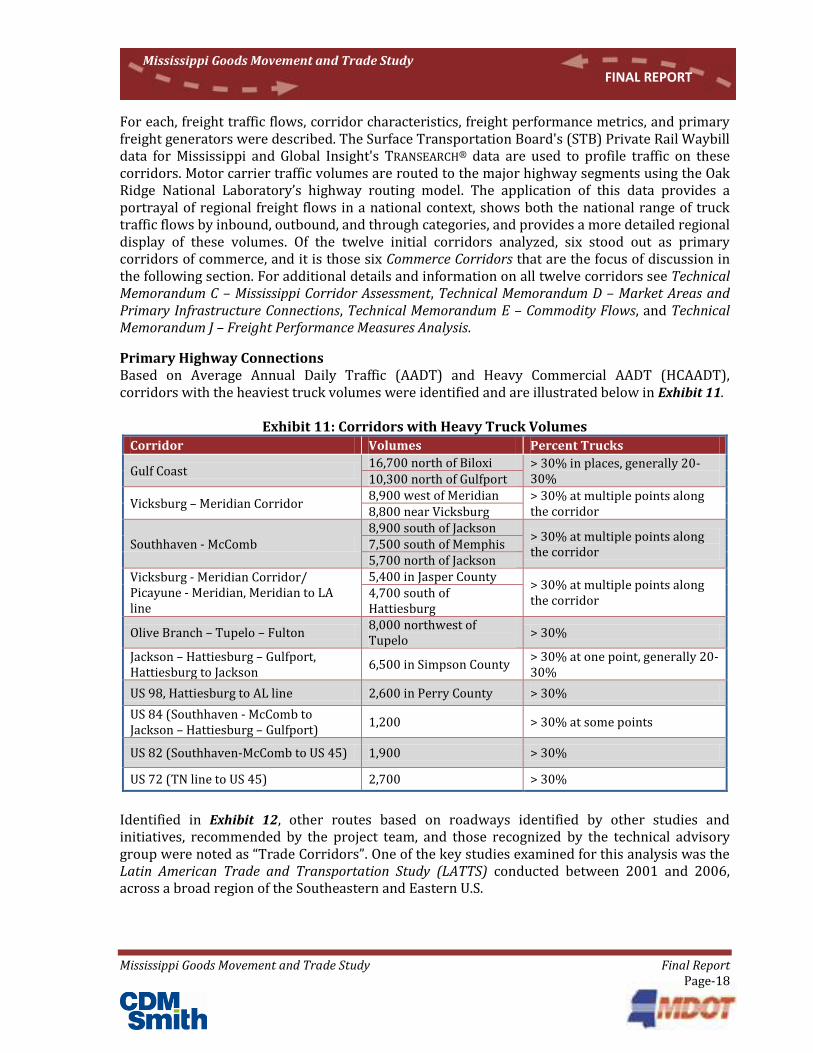
Primary Highway Connections Based on Average Annual Daily Traffic (AADT) and Heavy Commercial AADT (HCAADT), corridors with the heaviest truck volumes were identified and are illustrated below in Exhibit 11.
Exhibit 11: Corridors with Heavy Truck Volumes
Corridor Volumes Percent Trucks
Gulf Coast 16,700 north of Biloxi > 30% in places, generally 20-
30% 10,300 north of Gulfport
Vicksburg – Meridian Corridor 8,900 west of Meridian > 30% at multiple points along
the corridor 8,800 near Vicksburg
Southhaven - McComb 8,900 south of Jackson
> 30% at multiple points along the corridor
7,500 south of Memphis 5,700 north of Jackson
Vicksburg - Meridian Corridor/ Picayune - Meridian, Meridian to LA line
5,400 in Jasper County > 30% at multiple points along the corridor
4,700 south of Hattiesburg
Olive Branch – Tupelo – Fulton 8,000 northwest of Tupelo
> 30%
Jackson – Hattiesburg – Gulfport, Hattiesburg to Jackson
6,500 in Simpson County > 30% at one point, generally 20-30%
US 98, Hattiesburg to AL line 2,600 in Perry County > 30%
US 84 (Southhaven - McComb to Jackson – Hattiesburg – Gulfport)
1,200 > 30% at some points
US 82 (Southhaven-McComb to US 45) 1,900 > 30%
US 72 (TN line to US 45) 2,700 > 30%
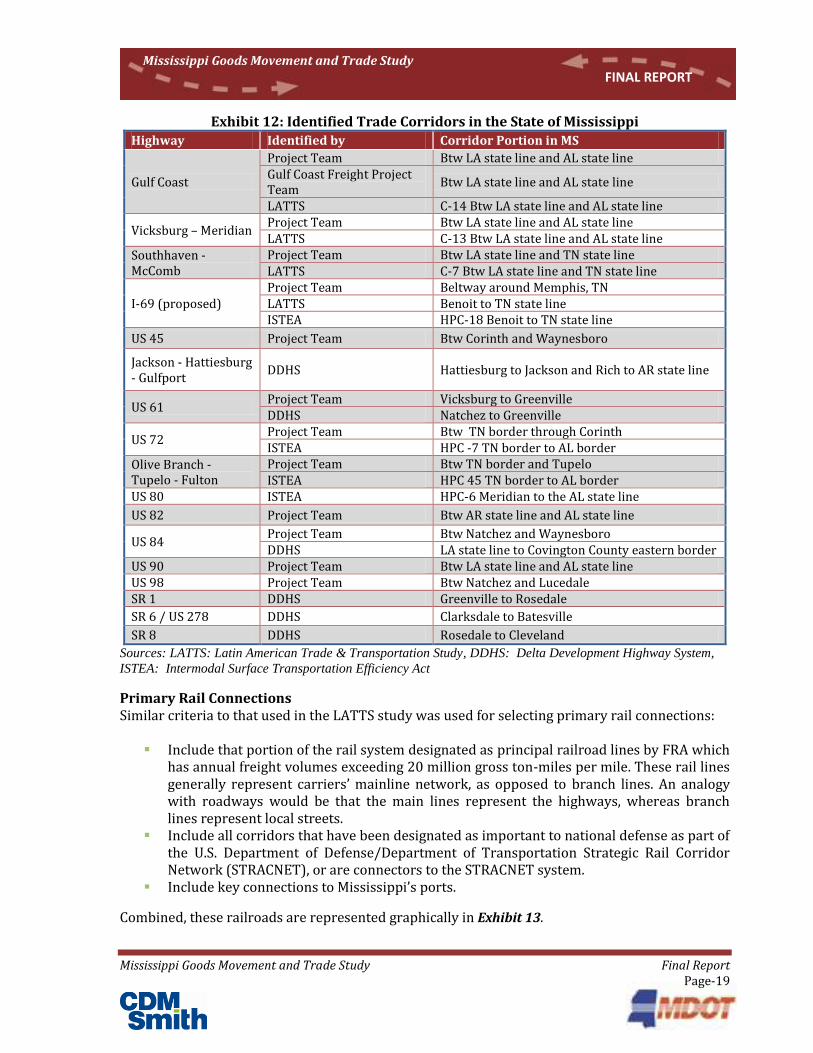
Identified in Exhibit 12, other routes based on roadways identified by other studies and initiatives, recommended by the project team, and those recognized by the technical advisory group were noted as “Trade Corridors”. One of the key studies examined for this analysis was the Latin American Trade and Transportation Study (LATTS) conducted between 2001 and 2006, across a broad region of the Southeastern and Eastern U.S.
Mississippi Goods Movement and Trade Study Final Report Page-19
Mississippi Goods Movement and Trade Study FINAL REPORT
Exhibit 12: Identified Trade Corridors in the State of Mississippi Highway Identified by Corridor Portion in MS
Gulf Coast
Project Team Btw LA state line and AL state line Gulf Coast Freight Project Team
Btw LA state line and AL state line
LATTS C-14 Btw LA state line and AL state line
Vicksburg – Meridian Project Team Btw LA state line and AL state line LATTS C-13 Btw LA state line and AL state line
Southhaven - McComb
Project Team Btw LA state line and TN state line LATTS C-7 Btw LA state line and TN state line
I-69 (proposed) Project Team Beltway around Memphis, TN LATTS Benoit to TN state line ISTEA HPC-18 Benoit to TN state line
US 45 Project Team Btw Corinth and Waynesboro
Jackson - Hattiesburg - Gulfport
DDHS Hattiesburg to Jackson and Rich to AR state line
US 61 Project Team Vicksburg to Greenville DDHS Natchez to Greenville
US 72 Project Team Btw TN border through Corinth ISTEA HPC -7 TN border to AL border
Olive Branch - Tupelo - Fulton
Project Team Btw TN border and Tupelo ISTEA HPC 45 TN border to AL border
US 80 ISTEA HPC-6 Meridian to the AL state line
US 82 Project Team Btw AR state line and AL state line
US 84 Project Team Btw Natchez and Waynesboro DDHS LA state line to Covington County eastern border
US 90 Project Team Btw LA state line and AL state line US 98 Project Team Btw Natchez and Lucedale SR 1 DDHS Greenville to Rosedale
SR 6 / US 278 DDHS Clarksdale to Batesville
SR 8 DDHS Rosedale to Cleveland
Sources: LATTS: Latin American Trade & Transportation Study, DDHS: Delta Development Highway System,
ISTEA: Intermodal Surface Transportation Efficiency Act
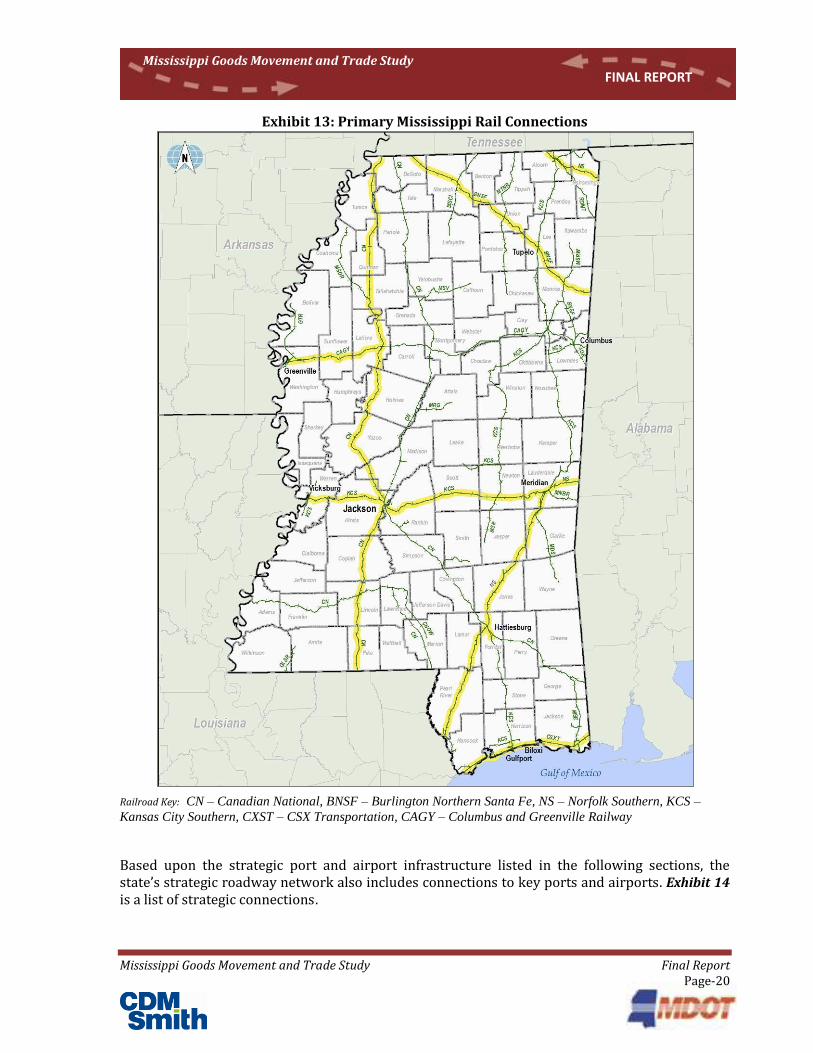
Primary Rail Connections Similar criteria to that used in the LATTS study was used for selecting primary rail connections:
Include that portion of the rail system designated as principal railroad lines by FRA which has annual freight volumes exceeding 20 million gross ton-miles per mile. These rail lines generally represent carriers’ mainline network, as opposed to branch lines. An analogy with roadways would be that the main lines represent the highways, whereas branch lines represent local streets.
Include all corridors that have been designated as important to national defense as part of the U.S. Department of Defense/Department of Transportation Strategic Rail Corridor Network (STRACNET), or are connectors to the STRACNET system.
Include key connections to Mississippi’s ports.
Combined, these railroads are represented graphically in Exhibit 13.
Mississippi Goods Movement and Trade Study Final Report Page-20
Mississippi Goods Movement and Trade Study FINAL REPORT
Exhibit 13: Primary Mississippi Rail Connections
Railroad Key: CN – Canadian National, BNSF – Burlington Northern Santa Fe, NS – Norfolk Southern, KCS –
Kansas City Southern, CXST – CSX Transportation, CAGY – Columbus and Greenville Railway
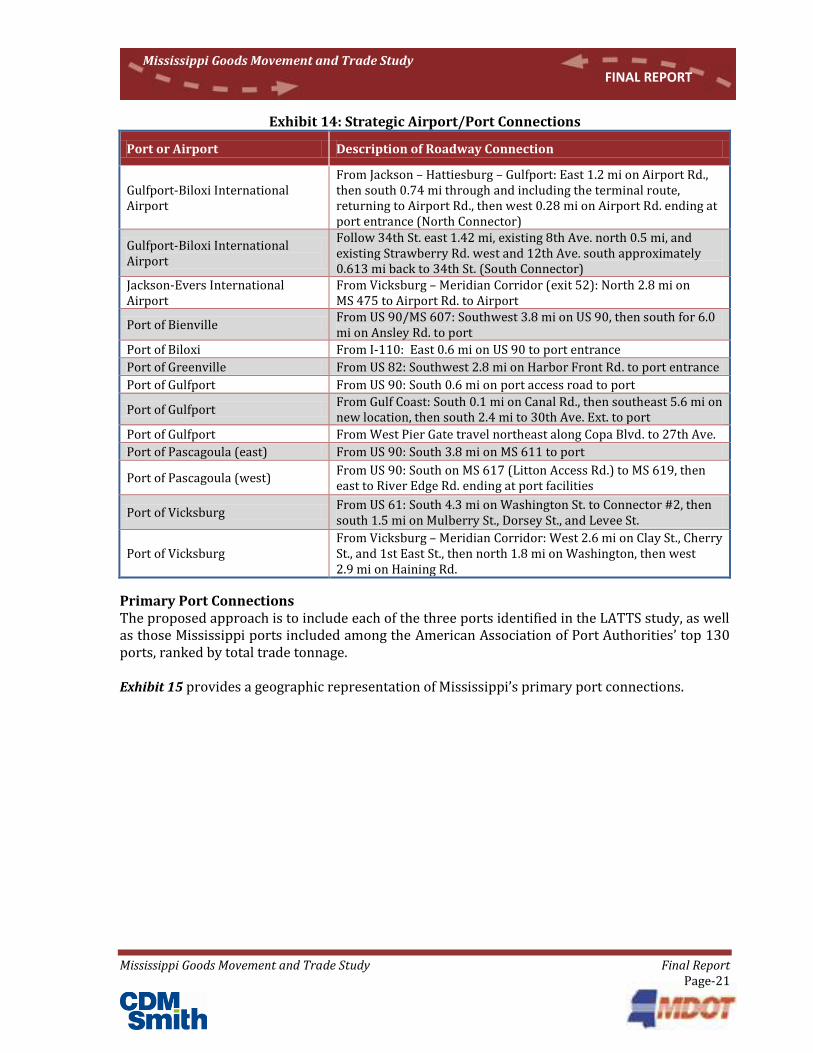
Based upon the strategic port and airport infrastructure listed in the following sections, the state’s strategic roadway network also includes connections to key ports and airports. Exhibit 14 is a list of strategic connections.
Mississippi Goods Movement and Trade Study Final Report Page-21
Mississippi Goods Movement and Trade Study FINAL REPORT
Exhibit 14: Strategic Airport/Port Connections
Port or Airport Description of Roadway Connection
Gulfport-Biloxi International Airport
From Jackson – Hattiesburg – Gulfport: East 1.2 mi on Airport Rd., then south 0.74 mi through and including the terminal route, returning to Airport Rd., then west 0.28 mi on Airport Rd. ending at port entrance (North Connector)
Gulfport-Biloxi International Airport
Follow 34th St. east 1.42 mi, existing 8th Ave. north 0.5 mi, and existing Strawberry Rd. west and 12th Ave. south approximately 0.613 mi back to 34th St. (South Connector)
Jackson-Evers International Airport
From Vicksburg – Meridian Corridor (exit 52): North 2.8 mi on MS 475 to Airport Rd. to Airport
Port of Bienville From US 90/MS 607: Southwest 3.8 mi on US 90, then south for 6.0 mi on Ansley Rd. to port
Port of Biloxi From I-110: East 0.6 mi on US 90 to port entrance
Port of Greenville From US 82: Southwest 2.8 mi on Harbor Front Rd. to port entrance
Port of Gulfport From US 90: South 0.6 mi on port access road to port
Port of Gulfport From Gulf Coast: South 0.1 mi on Canal Rd., then southeast 5.6 mi on new location, then south 2.4 mi to 30th Ave. Ext. to port
Port of Gulfport From West Pier Gate travel northeast along Copa Blvd. to 27th Ave.
Port of Pascagoula (east) From US 90: South 3.8 mi on MS 611 to port
Port of Pascagoula (west) From US 90: South on MS 617 (Litton Access Rd.) to MS 619, then east to River Edge Rd. ending at port facilities
Port of Vicksburg From US 61: South 4.3 mi on Washington St. to Connector #2, then south 1.5 mi on Mulberry St., Dorsey St., and Levee St.
Port of Vicksburg From Vicksburg – Meridian Corridor: West 2.6 mi on Clay St., Cherry St., and 1st East St., then north 1.8 mi on Washington, then west 2.9 mi on Haining Rd.
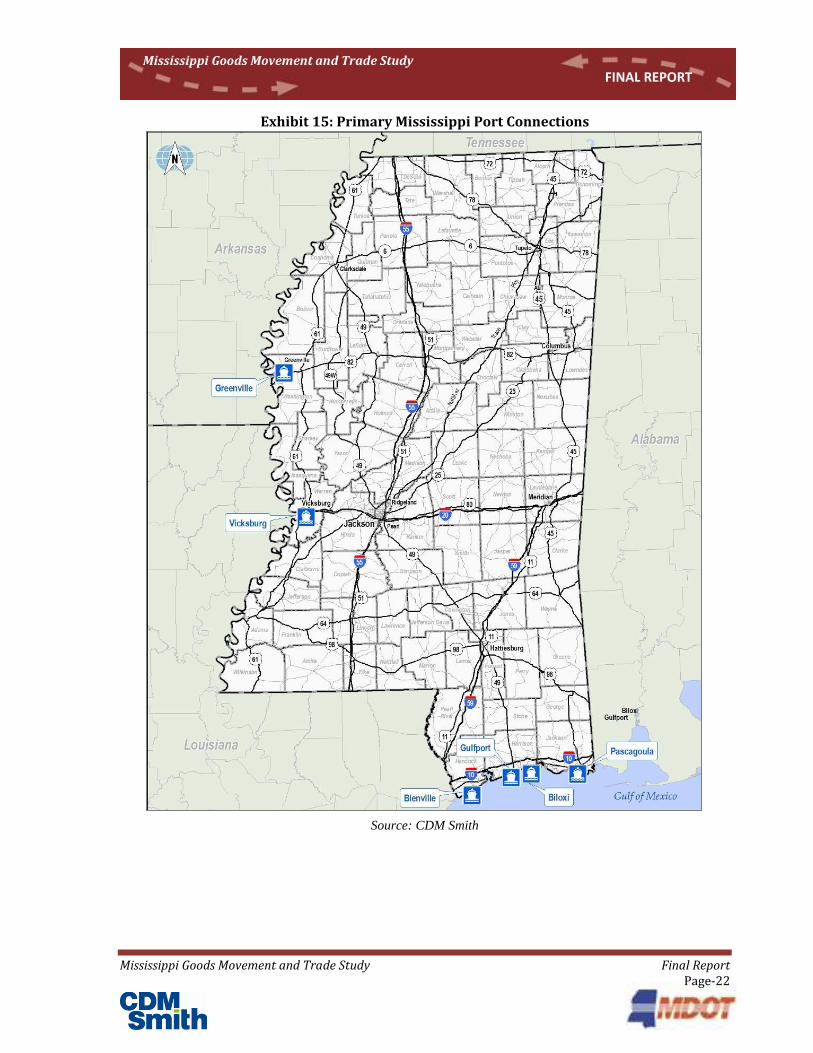
Primary Port Connections The proposed approach is to include each of the three ports identified in the LATTS study, as well as those Mississippi ports included among the American Association of Port Authorities’ top 130 ports, ranked by total trade tonnage. Exhibit 15 provides a geographic representation of Mississippi’s primary port connections.
Mississippi Goods Movement and Trade Study Final Report Page-22
Mississippi Goods Movement and Trade Study FINAL REPORT
Exhibit 15: Primary Mississippi Port Connections
Source: CDM Smith

Mississippi Goods Movement and Trade Study Final Report Page-23
Mississippi Goods Movement and Trade Study FINAL REPORT
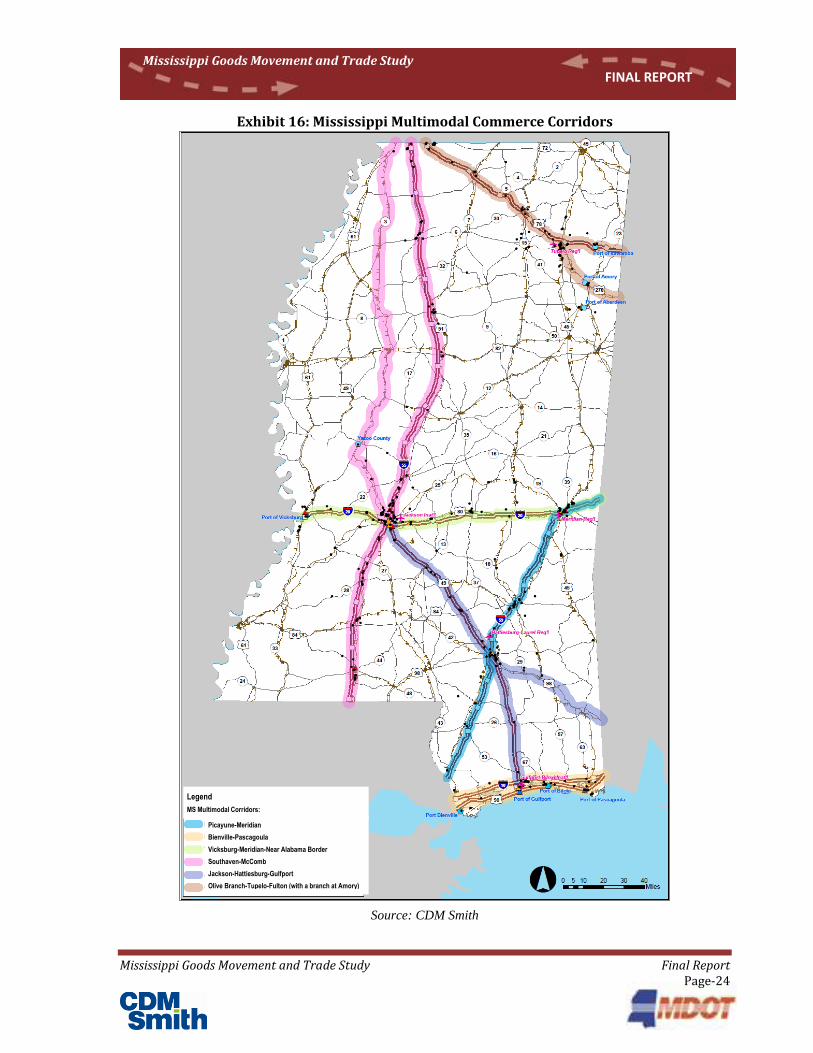
Primary Aviation Connections Jackson-Evers International Airport and Gulfport-Biloxi International Airport are the state’s primary air cargo infrastructure. Profile of the Primary Multimodal Corridors The key Mississippi multimodal corridors serve the regions (group of counties) within Mississippi that produce and attract a significant amount of freight tonnage (compared to other regions within Mississippi) and facilitate Mississippi trade with the national and international markets. With 97 percent of the recorded tonnage in 2006 transiting on truck or rail conveyance, the importance of these two modes on the economic development of Mississippi is significant. Based on the historical and forecasted cargo moved by truck and rail, in conjunction with the water and air cargo movements, six key Mississippi corridors, Exhibit 16, were identified and analyzed in the memorandum:
Southaven - McComb Corridor (I-55) Gulf Coast Corridor (I-10) Jackson – Hattiesburg - Gulfport Corridor (US 49) Vicksburg – Meridian Corridor (I-20) Picayune – Meridian Corridor (I-59) Olive Branch - Tupelo - Fulton Corridor (US 78)
The six key corridors identified as the focal point of this planning effort traverse 46 of 82 counties in Mississippi, and represent over 81 percent of the state’s population, and 73 percent of the state’s employment. Excluding through-traffic freight movements (those that transit across Mississippi with no origin or destination points within the state), these 46 counties account for nearly 70 percent of freight that originates or terminates in Mississippi.
Mississippi Goods Movement and Trade Study Final Report Page-24
Mississippi Goods Movement and Trade Study FINAL REPORT
Exhibit 16: Mississippi Multimodal Commerce Corridors
Source: CDM Smith
Legend
MS Multimodal Corridors:
Picayune-Meridian
Bienville-Pascagoula
Vicksburg-Meridian-Near Alabama Border
Southaven-McComb
Jackson-Hattiesburg-Gulfport
Olive Branch-Tupelo-Fulton (with a branch at Amory)
Mississippi Goods Movement and Trade Study Final Report Page-25
Mississippi Goods Movement and Trade Study FINAL REPORT
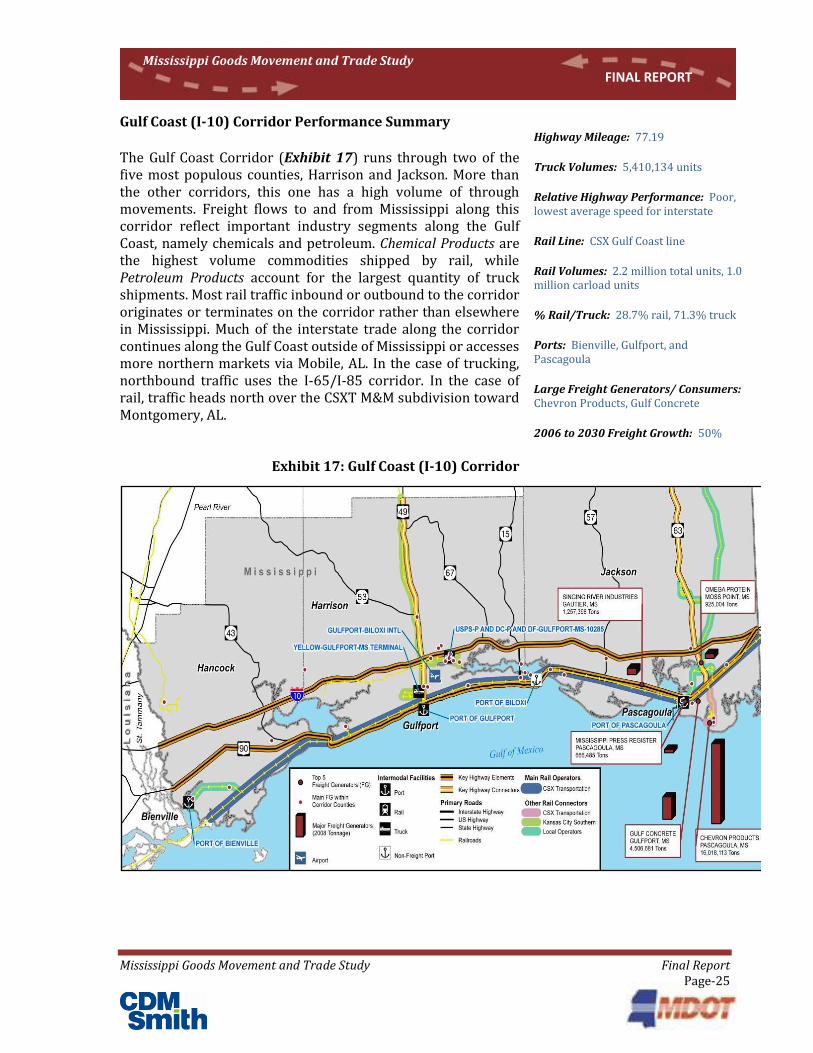
Gulf Coast (I-10) Corridor Performance Summary The Gulf Coast Corridor (Exhibit 17) runs through two of the five most populous counties, Harrison and Jackson. More than the other corridors, this one has a high volume of through movements. Freight flows to and from Mississippi along this corridor reflect important industry segments along the Gulf Coast, namely chemicals and petroleum. Chemical Products are the highest volume commodities shipped by rail, while Petroleum Products account for the largest quantity of truck shipments. Most rail traffic inbound or outbound to the corridor originates or terminates on the corridor rather than elsewhere in Mississippi. Much of the interstate trade along the corridor continues along the Gulf Coast outside of Mississippi or accesses more northern markets via Mobile, AL. In the case of trucking, northbound traffic uses the I-65/I-85 corridor. In the case of rail, traffic heads north over the CSXT M&M subdivision toward Montgomery, AL.
Exhibit 17: Gulf Coast (I-10) Corridor
Highway Mileage: 77.19
Truck Volumes: 5,410,134 units
Relative Highway Performance: Poor, lowest average speed for interstate
Rail Line: CSX Gulf Coast line
Rail Volumes: 2.2 million total units, 1.0 million carload units
% Rail/Truck: 28.7% rail, 71.3% truck
Ports: Bienville, Gulfport, and Pascagoula
Large Freight Generators/ Consumers: Chevron Products, Gulf Concrete
2006 to 2030 Freight Growth: 50%
Mississippi Goods Movement and Trade Study Final Report Page-26
Mississippi Goods Movement and Trade Study FINAL REPORT
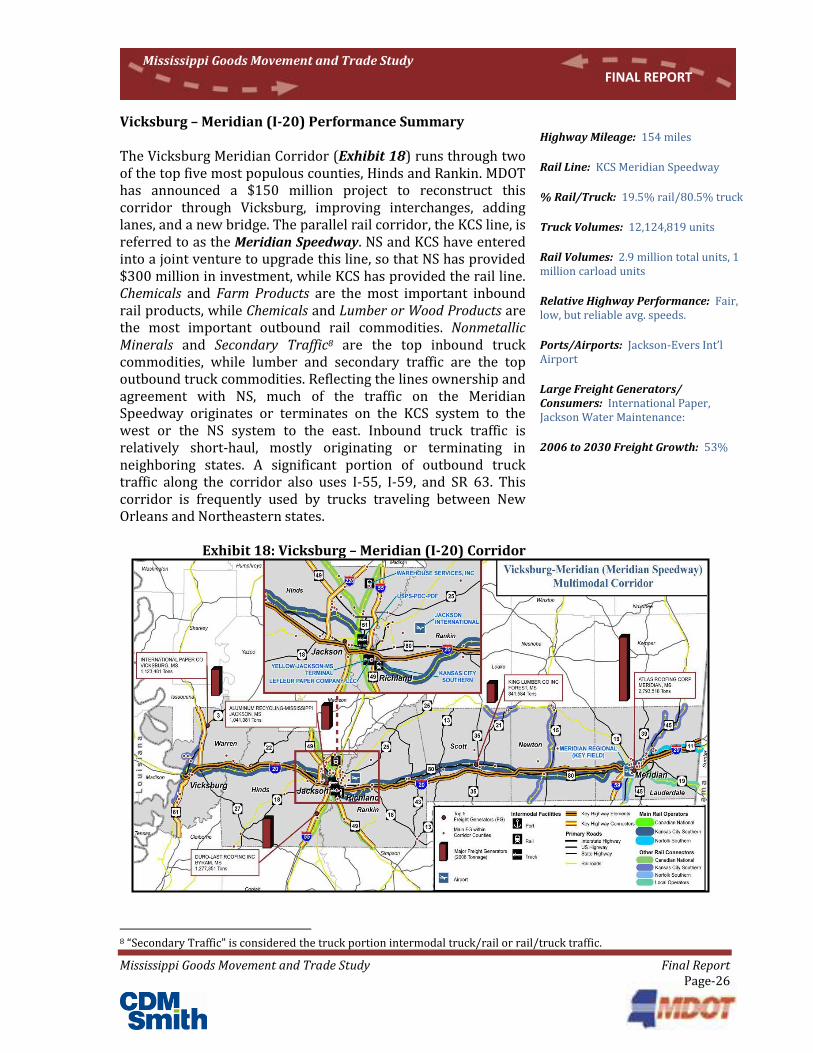
Vicksburg – Meridian (I-20) Performance Summary The Vicksburg Meridian Corridor (Exhibit 18) runs through two of the top five most populous counties, Hinds and Rankin. MDOT has announced a $150 million project to reconstruct this corridor through Vicksburg, improving interchanges, adding lanes, and a new bridge. The parallel rail corridor, the KCS line, is referred to as the Meridian Speedway. NS and KCS have entered into a joint venture to upgrade this line, so that NS has provided $300 million in investment, while KCS has provided the rail line. Chemicals and Farm Products are the most important inbound rail products, while Chemicals and Lumber or Wood Products are the most important outbound rail commodities. Nonmetallic Minerals and Secondary Traffic8 are the top inbound truck commodities, while lumber and secondary traffic are the top outbound truck commodities. Reflecting the lines ownership and agreement with NS, much of the traffic on the Meridian Speedway originates or terminates on the KCS system to the west or the NS system to the east. Inbound truck traffic is relatively short-haul, mostly originating or terminating in neighboring states. A significant portion of outbound truck traffic along the corridor also uses I-55, I-59, and SR 63. This corridor is frequently used by trucks traveling between New Orleans and Northeastern states.
Exhibit 18: Vicksburg – Meridian (I-20) Corridor
Highway Mileage: 154 miles
Rail Line: KCS Meridian Speedway
% Rail/Truck: 19.5% rail/80.5% truck
Truck Volumes: 12,124,819 units
Rail Volumes: 2.9 million total units, 1 million carload units
Relative Highway Performance: Fair, low, but reliable avg. speeds.
Ports/Airports: Jackson-Evers Int’l Airport
Large Freight Generators/ Consumers: International Paper, Jackson Water Maintenance:
2006 to 2030 Freight Growth: 53%
8 “Secondary Traffic” is considered the truck portion intermodal truck/rail or rail/truck traffic.
Mississippi Goods Movement and Trade Study Final Report Page-27
Mississippi Goods Movement and Trade Study FINAL REPORT
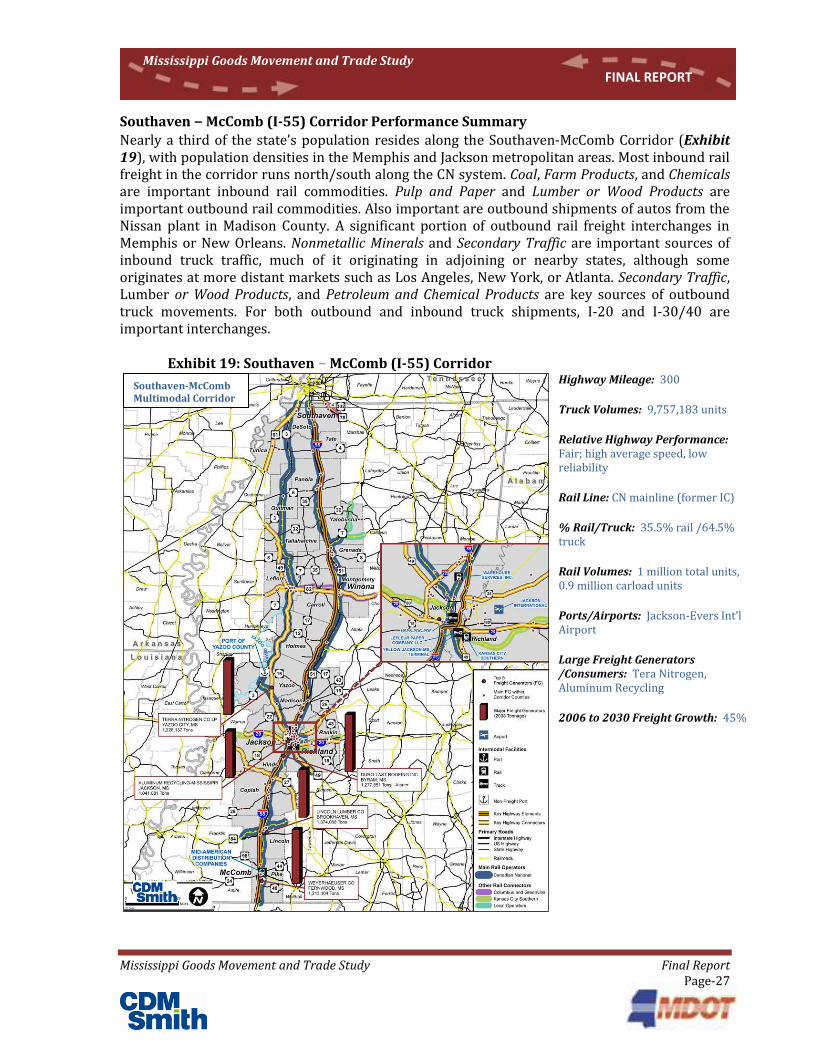
Southaven – McComb (I-55) Corridor Performance Summary
Nearly a third of the state’s population resides along the Southaven-McComb Corridor (Exhibit 19), with population densities in the Memphis and Jackson metropolitan areas. Most inbound rail freight in the corridor runs north/south along the CN system. Coal, Farm Products, and Chemicals are important inbound rail commodities. Pulp and Paper and Lumber or Wood Products are important outbound rail commodities. Also important are outbound shipments of autos from the Nissan plant in Madison County. A significant portion of outbound rail freight interchanges in Memphis or New Orleans. Nonmetallic Minerals and Secondary Traffic are important sources of inbound truck traffic, much of it originating in adjoining or nearby states, although some originates at more distant markets such as Los Angeles, New York, or Atlanta. Secondary Traffic, Lumber or Wood Products, and Petroleum and Chemical Products are key sources of outbound truck movements. For both outbound and inbound truck shipments, I-20 and I-30/40 are important interchanges.
Exhibit 19: Southaven – McComb (I-55) Corridor
Highway Mileage: 300
Truck Volumes: 9,757,183 units
Relative Highway Performance: Fair; high average speed, low reliability
Rail Line: CN mainline (former IC)
% Rail/Truck: 35.5% rail /64.5% truck
Rail Volumes: 1 million total units, 0.9 million carload units
Ports/Airports: Jackson-Evers Int’l Airport
Large Freight Generators /Consumers: Tera Nitrogen, Aluminum Recycling
2006 to 2030 Freight Growth: 45%
Southaven-McComb Multimodal Corridor
Mississippi Goods Movement and Trade Study Final Report Page-28
Mississippi Goods Movement and Trade Study FINAL REPORT
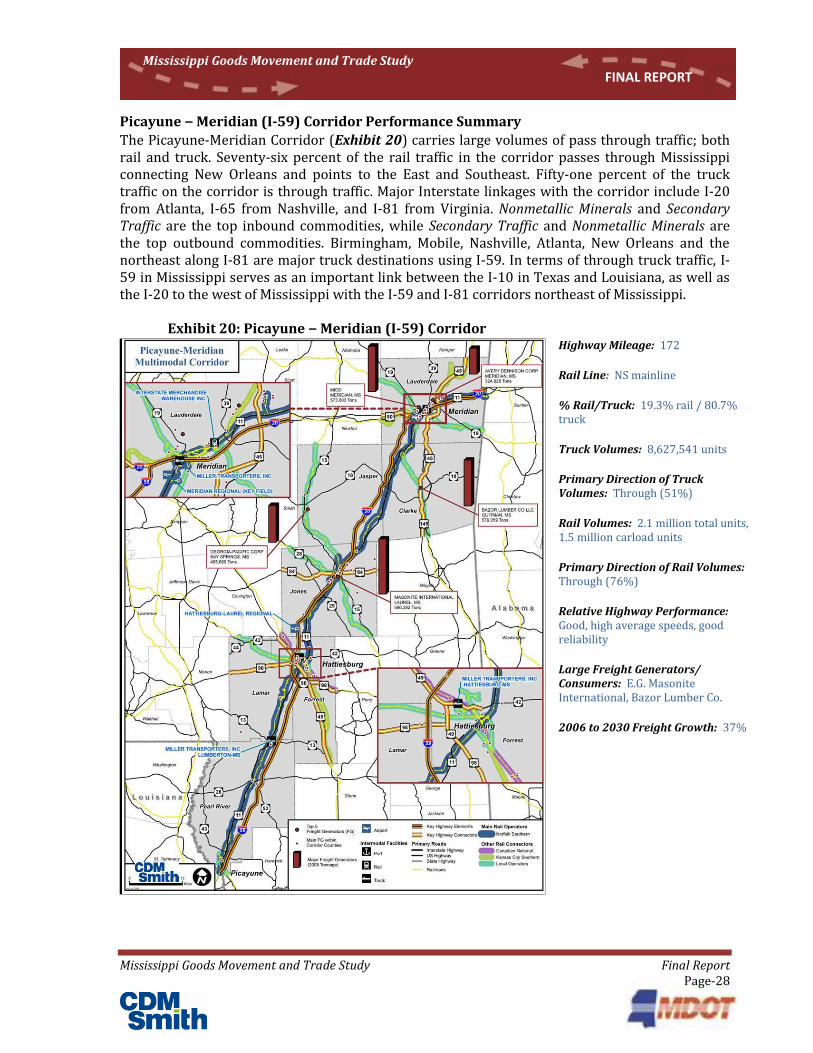
Picayune – Meridian (I-59) Corridor Performance Summary
The Picayune-Meridian Corridor (Exhibit 20) carries large volumes of pass through traffic; both rail and truck. Seventy-six percent of the rail traffic in the corridor passes through Mississippi connecting New Orleans and points to the East and Southeast. Fifty-one percent of the truck traffic on the corridor is through traffic. Major Interstate linkages with the corridor include I-20 from Atlanta, I-65 from Nashville, and I-81 from Virginia. Nonmetallic Minerals and Secondary Traffic are the top inbound commodities, while Secondary Traffic and Nonmetallic Minerals are the top outbound commodities. Birmingham, Mobile, Nashville, Atlanta, New Orleans and the northeast along I-81 are major truck destinations using I-59. In terms of through truck traffic, I-59 in Mississippi serves as an important link between the I-10 in Texas and Louisiana, as well as the I-20 to the west of Mississippi with the I-59 and I-81 corridors northeast of Mississippi.
Exhibit 20: Picayune – Meridian (I-59) Corridor
Highway Mileage: 172
Rail Line: NS mainline
% Rail/Truck: 19.3% rail / 80.7% truck
Truck Volumes: 8,627,541 units
Primary Direction of Truck Volumes: Through (51%)
Rail Volumes: 2.1 million total units, 1.5 million carload units
Primary Direction of Rail Volumes: Through (76%)
Relative Highway Performance: Good, high average speeds, good reliability
Large Freight Generators/ Consumers: E.G. Masonite International, Bazor Lumber Co.
2006 to 2030 Freight Growth: 37%

Mississippi Goods Movement and Trade Study Final Report Page-29
Mississippi Goods Movement and Trade Study FINAL REPORT
Jackson – Hattiesburg – Gulfport (US 49) Corridor Performance Summary The Jackson – Hattiesburg – Gulfport Corridor (Exhibit 21) has the heaviest truck volumes of any non-interstate corridor, likely contributing to the relatively poor performance of the highway portion of the corridor, with almost of a quarter of the road’s segments experiencing average truck speeds less than 50 mph. Rail traffic along the corridor includes a high proportion of inbound freight (54 percent) and low pass through (14 percent). The inbound freight is dominated by Coal into Jackson County. Pulp, Paper, and Allied Products and Chemical Products are the most significant outbound rail commodities. Much of the rail traffic travels along the CN line between Baton Rouge and Chicago. The majority of this traffic either travels north to the Great Lakes region or south along the Gulf Coast. Truck traffic on the corridor is roughly evenly split between inbound, outbound, and local, though. Secondary Traffic accounts for the highest commodity volume of both inbound and outbound traffic.
Exhibit 21: Jackson – Hattiesburg – Gulfport Corridor
Highway Mileage: 158
Truck Volumes: 7,259,049
Relative Highway Performance: Poor, highest portion of segments with average speed < 50 mph
Rail Line: CN mainline (Jackson – Hattiesburg), KCS branch line (Hattiesburg – Gulfport)
Rail Volumes: 0.6 million total, carload units
% Rail/Truck: 7.6% rail, 92.4% truck
Ports/Airports: Port of Gulfport / Jackson-Evers Int’l Airport
Large Freight Generators/ Consumers: Hood Industries (Wood Products), Hydro Carbide
2006 to 2030 Freight Growth: 44%
Mississippi Goods Movement and Trade Study Final Report Page-30
Mississippi Goods Movement and Trade Study FINAL REPORT
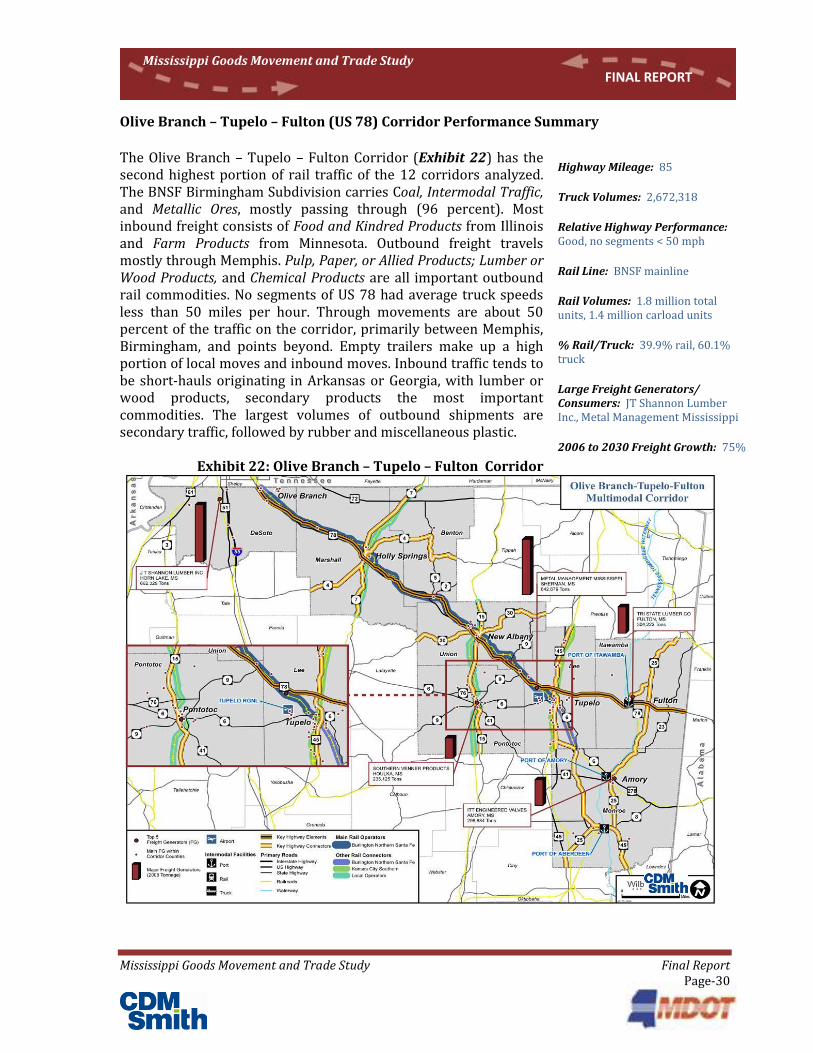
Olive Branch – Tupelo – Fulton (US 78) Corridor Performance Summary The Olive Branch – Tupelo – Fulton Corridor (Exhibit 22) has the second highest portion of rail traffic of the 12 corridors analyzed. The BNSF Birmingham Subdivision carries Coal, Intermodal Traffic, and Metallic Ores, mostly passing through (96 percent). Most inbound freight consists of Food and Kindred Products from Illinois and Farm Products from Minnesota. Outbound freight travels mostly through Memphis. Pulp, Paper, or Allied Products; Lumber or Wood Products, and Chemical Products are all important outbound rail commodities. No segments of US 78 had average truck speeds less than 50 miles per hour. Through movements are about 50 percent of the traffic on the corridor, primarily between Memphis, Birmingham, and points beyond. Empty trailers make up a high portion of local moves and inbound moves. Inbound traffic tends to be short-hauls originating in Arkansas or Georgia, with lumber or wood products, secondary products the most important commodities. The largest volumes of outbound shipments are secondary traffic, followed by rubber and miscellaneous plastic.
Exhibit 22: Olive Branch – Tupelo – Fulton Corridor
Highway Mileage: 85
Truck Volumes: 2,672,318
Relative Highway Performance: Good, no segments < 50 mph
Rail Line: BNSF mainline
Rail Volumes: 1.8 million total units, 1.4 million carload units
% Rail/Truck: 39.9% rail, 60.1% truck
Large Freight Generators/ Consumers: JT Shannon Lumber Inc., Metal Management Mississippi
2006 to 2030 Freight Growth: 75%
Mississippi Goods Movement and Trade Study Final Report Page-31
Mississippi Goods Movement and Trade Study FINAL REPORT
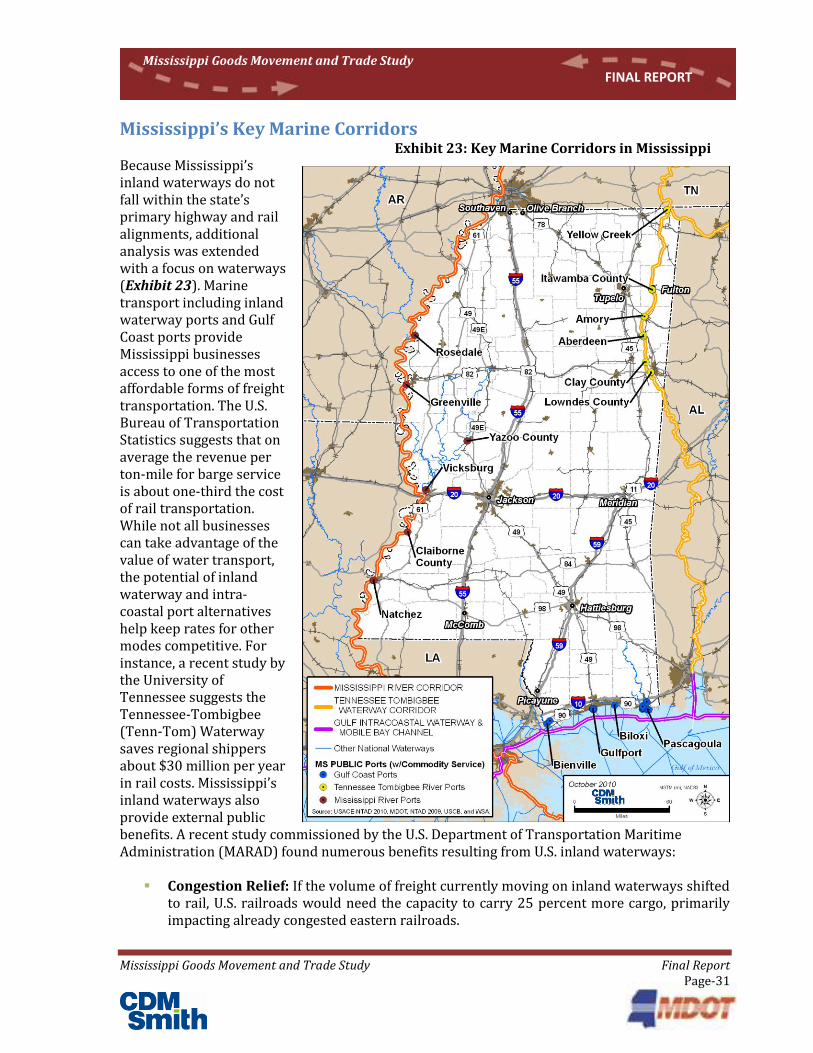
Mississippi’s Key Marine Corridors Exhibit 23: Key Marine Corridors in Mississippi
Because Mississippi’s inland waterways do not fall within the state’s primary highway and rail alignments, additional analysis was extended with a focus on waterways (Exhibit 23). Marine transport including inland waterway ports and Gulf Coast ports provide Mississippi businesses access to one of the most affordable forms of freight transportation. The U.S. Bureau of Transportation Statistics suggests that on average the revenue per ton-mile for barge service is about one-third the cost of rail transportation. While not all businesses can take advantage of the value of water transport, the potential of inland waterway and intra-coastal port alternatives help keep rates for other modes competitive. For instance, a recent study by the University of Tennessee suggests the Tennessee-Tombigbee (Tenn-Tom) Waterway saves regional shippers about $30 million per year in rail costs. Mississippi’s inland waterways also provide external public benefits. A recent study commissioned by the U.S. Department of Transportation Maritime Administration (MARAD) found numerous benefits resulting from U.S. inland waterways:
Congestion Relief: If the volume of freight currently moving on inland waterways shifted to rail, U.S. railroads would need the capacity to carry 25 percent more cargo, primarily impacting already congested eastern railroads.
Mississippi Goods Movement and Trade Study Final Report Page-32
Mississippi Goods Movement and Trade Study FINAL REPORT
Energy Efficiency: An inland barge-tow hauls a single ton of cargo 576 miles on a single gallon of fuel. Equivalent ton per gallon comparisons for other modes is 413 miles per gallon for railroads, and 155 for a standard semi-trailer truck configuration.9
Safety: Inland marine operations result in a fatality and an injury per billion ton-miles of goods transported. In comparison, railroad operations result in 23 fatalities and 125 injuries per billion ton-miles; and, truck transport operations result in 155 fatalities and 2,172 injuries per billion ton-miles.
Environmental Impact: Inland marine operations have a record equating to a spill rate of 3.60 gallons per million ton-miles of goods transport. The equivalent spill rate for railroad transport is 3.86, and for truck the rate is 6.06 gallons per million ton-miles.
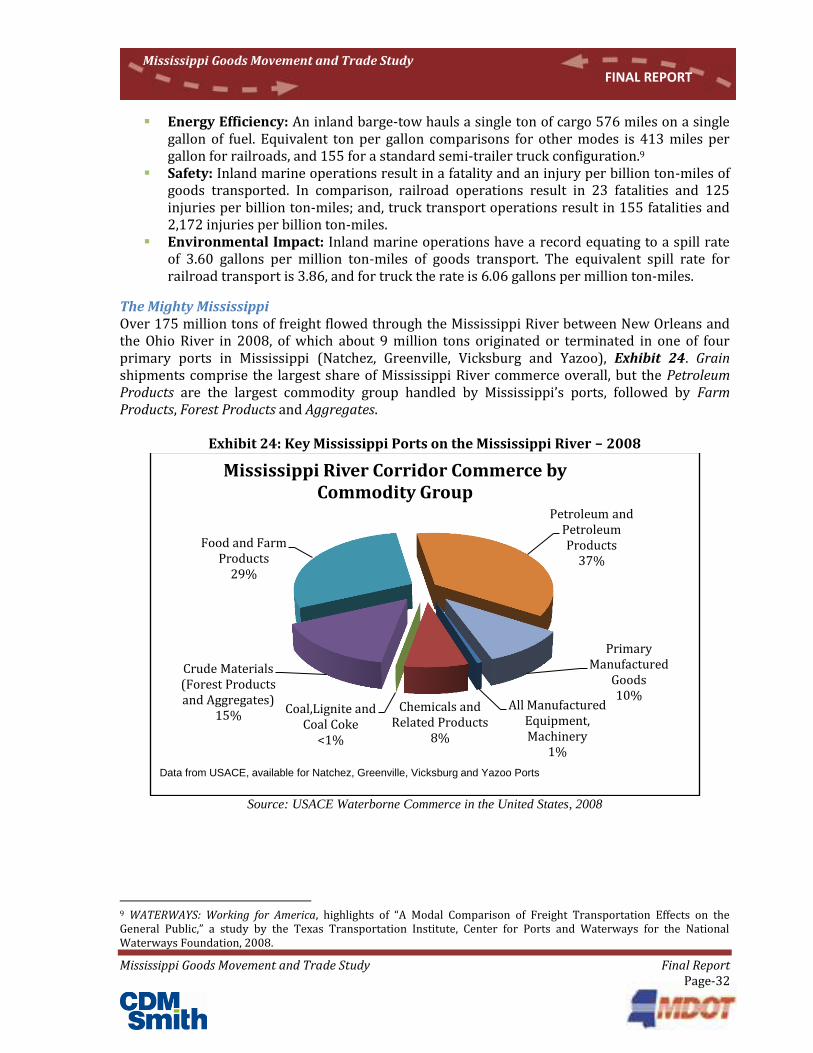
The Mighty Mississippi Over 175 million tons of freight flowed through the Mississippi River between New Orleans and the Ohio River in 2008, of which about 9 million tons originated or terminated in one of four primary ports in Mississippi (Natchez, Greenville, Vicksburg and Yazoo), Exhibit 24. Grain shipments comprise the largest share of Mississippi River commerce overall, but the Petroleum Products are the largest commodity group handled by Mississippi’s ports, followed by Farm Products, Forest Products and Aggregates.
Exhibit 24: Key Mississippi Ports on the Mississippi River - 2008
Source: USACE Waterborne Commerce in the United States, 2008
9 WATERWAYS: Working for America, highlights of “A Modal Comparison of Freight Transportation Effects on the General Public,” a study by the Texas Transportation Institute, Center for Ports and Waterways for the National Waterways Foundation, 2008.
All Manufactured Equipment, Machinery
1%
Chemicals and Related Products
8%
Coal,Lignite and Coal Coke
<1%
Crude Materials (Forest Products and Aggregates)
15%
Food and Farm Products
29%
Petroleum and Petroleum Products
37%
Primary Manufactured
Goods 10%
Mississippi River Corridor Commerce by Commodity Group
Data from USACE, available for Natchez, Greenville, Vicksburg and Yazoo Ports

Mississippi Goods Movement and Trade Study Final Report Page-33
Mississippi Goods Movement and Trade Study FINAL REPORT
The Tennessee-Tombigbee Waterway Corridor The Tenn-Tom Waterway is an additional gateway for cargo traveling to and from the Midwest and Gulf of Mexico. In 2008, the Tenn-Tom carried nearly 6.5 million tons of goods including Coal, Wood Products, Crude Materials, and Petroleum. Forest Products are the primary commodity carried on the Mississippi portion of the Tenn-Tom, and these products are mainly destined to Europe. The data shows that of all the cargo on the Tenn-Tom Waterway in 2008, over 50 percent was handled by 23 terminals located in Mississippi’s ports on the river.
Exhibit 25: Tennessee-Tombigbee Waterway Commerce - 2008
Source: USACE Waterborne Commerce in the United States. 2008
The Gulf Intracoastal Waterway Corridor The Gulf Intracoastal Waterway stretches approximately 1,050 miles from Carrabelle, Florida to Brownsville, Texas. The Gulf Intracoastal Waterway crosses or meets, and in some cases is confluent with, numerous other navigable rivers and waterways, including both the Mississippi and Tenn-Tom Rivers. The Mississippi portion of the Intracoastal Corridor includes the Ports of Gulfport, Pascagoula, Biloxi and Bienville. The major commodity moving in the Mississippi portion of the corridor is Petroleum Products. Exhibit 26 displays the composition of other commodity groups also handled by ports in the Gulf Intracoastal Waterway Corridor.
All Manufactured Equipment, Machinery
<1%
Chemicals and Related Products
11% Coal,Lignite and
Coal Coke 15%
Crude Materials (Forest products
& Aggregates) 53%
Food and Farm Products
1%
Petroleum and Petroleum Products
8%
Primary Manufactured
Goods 12%
Tenn-Tom Waterway Commerce by Commodity Group

Mississippi Goods Movement and Trade Study Final Report Page-34
Mississippi Goods Movement and Trade Study FINAL REPORT
Exhibit 26: Gulf Intracoastal Waterway Corridor Commerce - 2008
Source: USACE Waterborne Commerce in the United States. 2008
The Importance of Key Commerce Corridors to Mississippi In addition to the static examination of key multimodal Commerce Corridors, study team partner IHS Global Insight also developed forecasts for each of the six Commerce Corridors. Currently TRANSEARCH® data suggests that 91 percent of all freight that travels in Mississippi uses one or more of the six identified Commerce Corridors. Each corridor has unique freight characteristics that will impact its future freight demands that are important to understand when making freight infrastructure planning decisions (Exhibit 27).
Exhibit 27: Total Freight Tons by Multimodal Corridor with Forecast
Corridor Annual Tons (Millions) Avg. Annual
Growth Rate 2008 2010 2020 2030
Southaven – McComb 169.7 153.0 196.7 232.6 1.44%
Gulf Coast 151.9 136.3 173.1 199.8 1.25%
Jackson – Hattiesburg – Gulfport 136.6 124.3 156.9 185.2 1.39%
Vicksburg – Meridian 211.3 191.0 240.0 278.2 1.26%
Picayune – Meridian 156.9 142.0 179.5 210.8 1.35%
Olive Branch – Tupelo – Fulton 74.8 66.3 84.4 98.0 1.25%
Non-Corridor Traffic 50.8 44.6 54.2 61.5 0.88%
Total Mississippi Traffic 595.9 534.2 670.2 769.5 1.17%
Source: IHS Global Insight TRANSEARCH®
, 2008
Each corridor was examined in three ways, and the details from this analysis can be found in Technical Memorandum I – Freight Analysis and Forecasts of Key Mississippi Multimodal Corridors. The following section presents highlights from the analysis, which in summary entailed:
All Manufactured Equipment, Machinery
1%
Chemicals and Related Products
5%
Coal,Lignite and Coal Coke
7%
Crude Materials (Forest Products and Aggregates)
7%
Food and Farm Products
3%
Petroleum and Petroleum Products
76%
Primary Manufactured
Goods 1%
Unknown or Not Elsewhere Classified
<1%
Mississippi Gulf Coast Commerce by Commodity Group
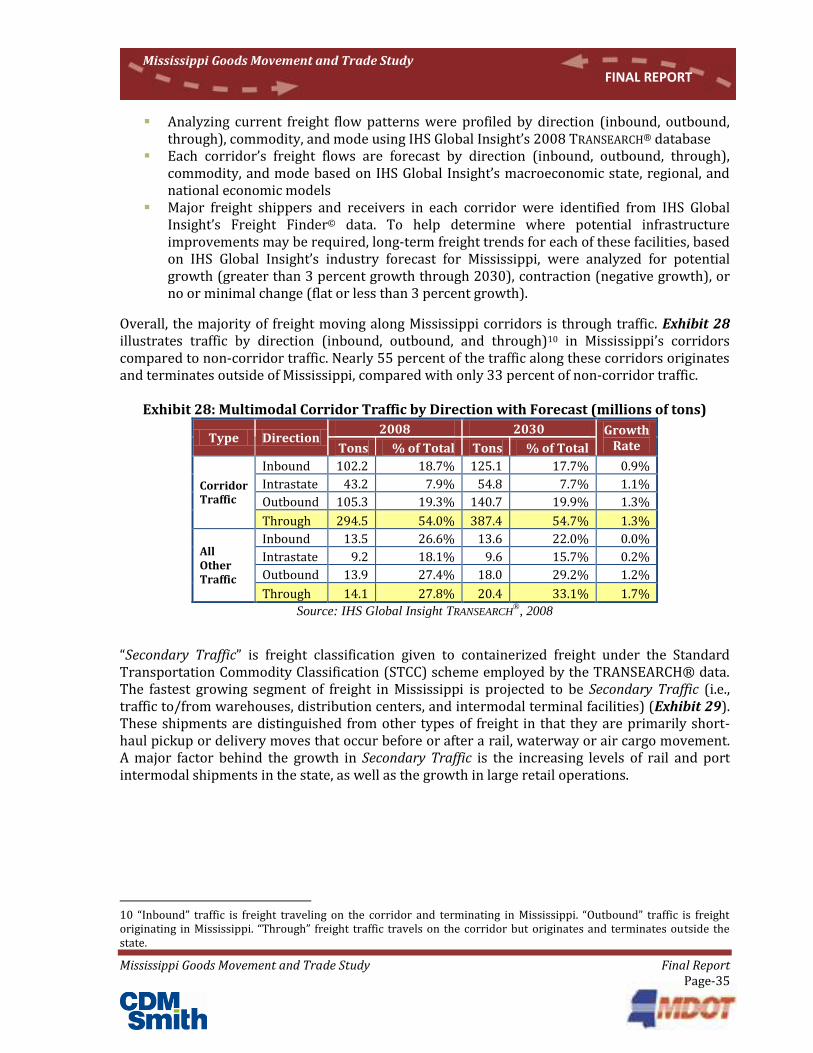
Mississippi Goods Movement and Trade Study Final Report Page-35
Mississippi Goods Movement and Trade Study FINAL REPORT
Analyzing current freight flow patterns were profiled by direction (inbound, outbound, through), commodity, and mode using IHS Global Insight’s 2008 TRANSEARCH® database
Each corridor’s freight flows are forecast by direction (inbound, outbound, through), commodity, and mode based on IHS Global Insight’s macroeconomic state, regional, and national economic models
Major freight shippers and receivers in each corridor were identified from IHS Global Insight’s Freight Finder© data. To help determine where potential infrastructure improvements may be required, long-term freight trends for each of these facilities, based on IHS Global Insight’s industry forecast for Mississippi, were analyzed for potential growth (greater than 3 percent growth through 2030), contraction (negative growth), or no or minimal change (flat or less than 3 percent growth).
Overall, the majority of freight moving along Mississippi corridors is through traffic. Exhibit 28 illustrates traffic by direction (inbound, outbound, and through)10 in Mississippi’s corridors compared to non-corridor traffic. Nearly 55 percent of the traffic along these corridors originates and terminates outside of Mississippi, compared with only 33 percent of non-corridor traffic.
Exhibit 28: Multimodal Corridor Traffic by Direction with Forecast (millions of tons)
Type Direction 2008 2030 Growth
Rate Tons % of Total Tons % of Total
Corridor Traffic
Inbound 102.2 18.7% 125.1 17.7% 0.9%
Intrastate 43.2 7.9% 54.8 7.7% 1.1%
Outbound 105.3 19.3% 140.7 19.9% 1.3%
Through 294.5 54.0% 387.4 54.7% 1.3%
All Other Traffic
Inbound 13.5 26.6% 13.6 22.0% 0.0%
Intrastate 9.2 18.1% 9.6 15.7% 0.2%
Outbound 13.9 27.4% 18.0 29.2% 1.2%
Through 14.1 27.8% 20.4 33.1% 1.7%
Source: IHS Global Insight TRANSEARCH®
, 2008
“Secondary Traffic” is freight classification given to containerized freight under the Standard Transportation Commodity Classification (STCC) scheme employed by the TRANSEARCH® data. The fastest growing segment of freight in Mississippi is projected to be Secondary Traffic (i.e., traffic to/from warehouses, distribution centers, and intermodal terminal facilities) (Exhibit 29). These shipments are distinguished from other types of freight in that they are primarily short-haul pickup or delivery moves that occur before or after a rail, waterway or air cargo movement. A major factor behind the growth in Secondary Traffic is the increasing levels of rail and port intermodal shipments in the state, as well as the growth in large retail operations.
10 “Inbound” traffic is freight traveling on the corridor and terminating in Mississippi. “Outbound” traffic is freight originating in Mississippi. “Through” freight traffic travels on the corridor but originates and terminates outside the state.
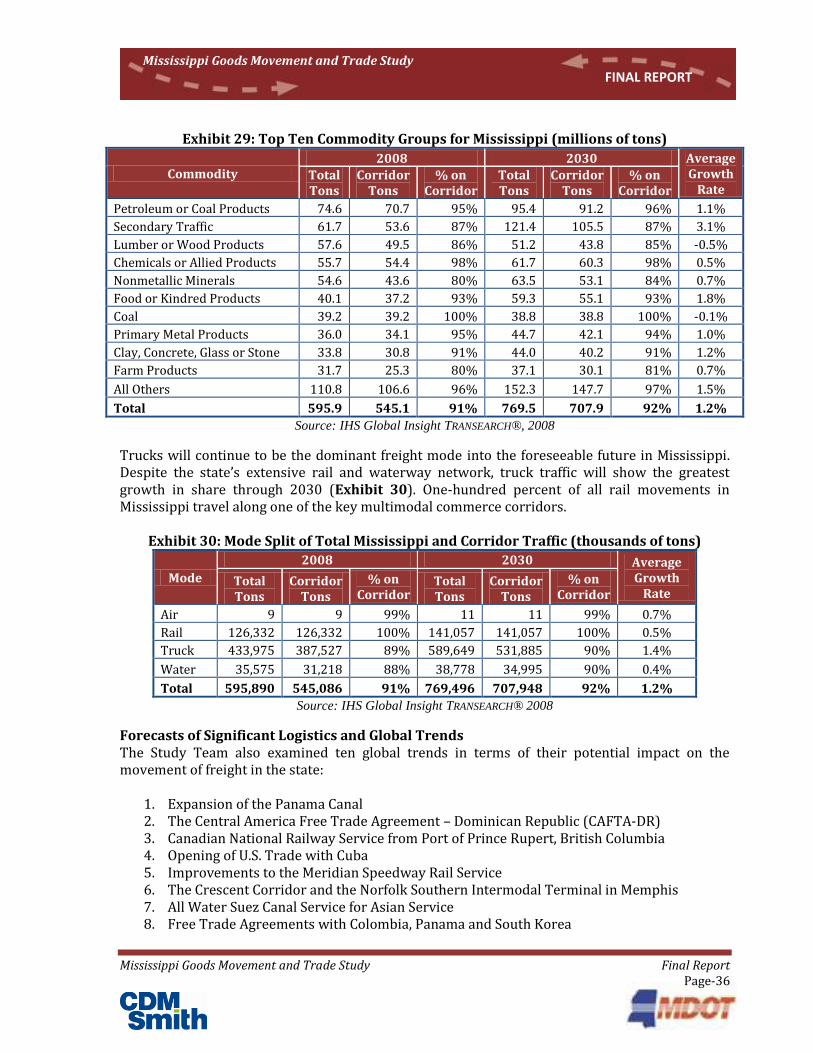
Mississippi Goods Movement and Trade Study Final Report Page-36
Mississippi Goods Movement and Trade Study FINAL REPORT
Exhibit 29: Top Ten Commodity Groups for Mississippi (millions of tons)
Commodity 2008 2030 Average
Growth Rate
Total Tons
Corridor Tons
% on Corridor
Total Tons
Corridor Tons
% on Corridor
Petroleum or Coal Products 74.6 70.7 95% 95.4 91.2 96% 1.1%
Secondary Traffic 61.7 53.6 87% 121.4 105.5 87% 3.1%
Lumber or Wood Products 57.6 49.5 86% 51.2 43.8 85% -0.5%
Chemicals or Allied Products 55.7 54.4 98% 61.7 60.3 98% 0.5%
Nonmetallic Minerals 54.6 43.6 80% 63.5 53.1 84% 0.7%
Food or Kindred Products 40.1 37.2 93% 59.3 55.1 93% 1.8%
Coal 39.2 39.2 100% 38.8 38.8 100% -0.1%
Primary Metal Products 36.0 34.1 95% 44.7 42.1 94% 1.0%
Clay, Concrete, Glass or Stone 33.8 30.8 91% 44.0 40.2 91% 1.2%
Farm Products 31.7 25.3 80% 37.1 30.1 81% 0.7%
All Others 110.8 106.6 96% 152.3 147.7 97% 1.5%
Total 595.9 545.1 91% 769.5 707.9 92% 1.2%
Source: IHS Global Insight TRANSEARCH®, 2008
Trucks will continue to be the dominant freight mode into the foreseeable future in Mississippi. Despite the state’s extensive rail and waterway network, truck traffic will show the greatest growth in share through 2030 (Exhibit 30). One-hundred percent of all rail movements in Mississippi travel along one of the key multimodal commerce corridors.
Exhibit 30: Mode Split of Total Mississippi and Corridor Traffic (thousands of tons)
Mode
2008 2030 Average Growth
Rate Total Tons
Corridor Tons
% on Corridor
Total Tons
Corridor Tons
% on Corridor
Air 9 9 99% 11 11 99% 0.7%
Rail 126,332 126,332 100% 141,057 141,057 100% 0.5%
Truck 433,975 387,527 89% 589,649 531,885 90% 1.4%
Water 35,575 31,218 88% 38,778 34,995 90% 0.4%
Total 595,890 545,086 91% 769,496 707,948 92% 1.2%
Source: IHS Global Insight TRANSEARCH® 2008
Forecasts of Significant Logistics and Global Trends The Study Team also examined ten global trends in terms of their potential impact on the movement of freight in the state:
1. Expansion of the Panama Canal 2. The Central America Free Trade Agreement – Dominican Republic (CAFTA-DR) 3. Canadian National Railway Service from Port of Prince Rupert, British Columbia 4. Opening of U.S. Trade with Cuba 5. Improvements to the Meridian Speedway Rail Service 6. The Crescent Corridor and the Norfolk Southern Intermodal Terminal in Memphis 7. All Water Suez Canal Service for Asian Service 8. Free Trade Agreements with Colombia, Panama and South Korea

Mississippi Goods Movement and Trade Study Final Report Page-37
Mississippi Goods Movement and Trade Study FINAL REPORT
9. Expansion of the Port of Lazaro Cardenas, Mexico and Associated KCS Rail Service 10. Changes to National Freight Investment Funding and Finance Mechanisms
Of the above trends, the first three, Panama Canal Expansion, CAFTA-DR, and CN Prince Rupert Rail Service, were selected for additional analysis using IHS Global Insight’s World Trade Service, TRANSEARCH® freight database, and Global Trade Navigator. The remaining scenarios were expected to have a more limited impact on the State and reviewed in less detail. Exhibit 31 summarizes the results of IHS Global Insight’s analysis of the identified global trends on Mississippi.
Exhibit 31: Summary of Selected Trade Trends on Mississippi
Global Trend MS
Impact Comment
Expansion of the Panama Canal
Moderate
Increases in Gulf trade from expansion expected primarily in Houston, New Orleans and Mobile. Some of the increased volume at these Ports will travel inland through Mississippi.
Central America Free Trade Agreement
High
Potential for significant increases at Gulfport, especially imported fruits, apparel, and vegetables and export meat, cotton, and fabrics. Potential for greater usage of Pascagoula's refrigerated facilities for frozen poultry exports
CN Rail Service from Port of Prince Rupert
Moderate
Could increase Mississippi drayage to/from Memphis by over 325,000 trips in 2025. May be mitigated if new traffic at Port is simply being diverted from the West Coast and already moves inland to Memphis.
Opening of U.S. Trade with Cuba
Low Expected to be export traffic from U.S. with little potential for handling by Mississippi ports.
Meridian Speedway Rail Service
Low Increases in rail traffic from Speedway improvements will primarily be through rail traffic with little impact on state's infrastructure.
The Norfolk Southern Crescent Corridor
High
Together with CN Prince Rupert rail service, increased intermodal traffic through Memphis will put pressure on northwestern Mississippi's highway network. Improved access to East Coast could boost distribution and logistics activity in the state.
All Water Suez Canal Service Low Will primarily impact East Coast with possible shifts of inland distribution centers from northwestern Mississippi eastward to Allentown or Columbus.
Free Trade Agreements with Colombia, Panama and South Korea
High
Trade agreement with Panama and Colombia has promise for Mississippi ports, especially exports of meat, poultry, fruits, nuts, vegetables, and cotton fiber. Refrigerated facilities at Gulfport and Pascagoula will be advantageous.
Expansion of the Port of Lazaro Cardenas, Mexico
Low Transpacific shipping advantages at Lazaro Cardenas not significant enough to extend to Mississippi.
Proposed Freight Investment Funding/Finance Mechanisms
Low Level and type of mechanism are uncertain but will have greatest impact on long-haul trucking shipments. Impact on Mississippi unclear.
Mississippi Goods Movement and Trade Study Final Report Page-38
Mississippi Goods Movement and Trade Study FINAL REPORT
Summary of Strategic Corridor Trends The analysis of Mississippi’s multimodal corridors uncovered some trends in the state’s freight system, as well as international trade trends are likely to increase future demand for freight on Mississippi’s Commerce Corridors that should be helpful for freight infrastructure planning:
Increasing Truck Share: Seventy-three percent of the freight moving in Mississippi by weight moves by truck. In some corridors (i.e., Jackson-Hattiesburg-Gulfport), the share is over 90 percent. Moreover, truck tonnage in Mississippi is projected to grow faster (at an average of 1.4 percent) than other freight modes, especially within its key corridors. High growth and dependence on truck traffic has implications regarding highway maintenance, congestion, environmental quality, and highway financing.
Through Freight As a key link in the national freight system, especially between Atlanta, Houston, New Orleans, Memphis and Birmingham, a significant amount of Mississippi’s freight tonnage (54 percent) is “through”. Generally, this traffic provides minimal economic benefits to the state apart from roadside services for drivers.
Growth in Intermodal and Secondary Traffic In many of Mississippi’s corridors (particularly Southaven-McComb, Vicksburg-Meridian, and Jackson-Hattiesburg-Gulfport), secondary traffic (i.e., traffic to/from warehouses, distribution centers, and intermodal terminal facilities) will become the largest share of freight by 2030. This shift from longer haul line-haul to short haul localized freight in the state has implications for greater congestions, especially around the urban areas of Jackson, Meridian, and Hattiesburg. Contributing to this trend will be greater use of intermodal in Mississippi. IHS Global Insight expects over 2.5 percent annual growth in the number of rail intermodal units at the Jackson intermodal terminal compared with a one percent annual growth in rail carload traffic.
High Impact Freight Locations An analysis provided in Technical Memorandum I: Freight Analysis and Forecasts of Key Mississippi Multimodal Corridors maps the locations from the top 200 freight generating facilities in Mississippi by size as well as IHS Global Insight’s long term trend in freight activity based on IHS Global Insight industry and state forecasts. Firms poised for long term growth are primarily in Jackson, Pascagoula, Laurel, and Brookhaven.
The above factors will put additional pressure on Mississippi’s highway system that is already burdened. In 2010, the National Transportation Research Group TRIP11 reported that 40 percent of Mississippi’s major roads were in poor or mediocre condition. In addition, 25 percent of Mississippi’s bridges were structurally deficient or functionally obsolete and 28 percent of Mississippi’s major urban highways were congested. MULTIPLAN 2035, the state’s Long Range Transportation Plan, projected that by 2035, 53 percent of state maintained roads would have poor or worse pavement conditions based on conservative funding projections and funds allocated primarily to preservation and modernization needs with expansion only on selected highways. While pavement conditions on
11 TRIP, a National Transportation Research Group, “Mississippi Road And Bridge Conditions Threatened By $6 Billion Transportation Funding Backlog”, Press Release, February 10, 2010.
Mississippi Goods Movement and Trade Study Final Report Page-39
Mississippi Goods Movement and Trade Study FINAL REPORT
corridors of statewide significance would be fair or better, pavement conditions on 40 percent of non-corridor principal and minor arterials were projected to be poor or worse, as well as 80 percent of non-corridor collectors.
Expansion of the Panama Canal Larger locks in the Panama Canal are planned for completion by 2014, enabling larger ships to transit the canal. Larger container ships will lower the costs for both containerized and bulk cargo for marine transport between Asia and the Gulf Coast or East Coast ports. Forecasts by IHS Global Insight suggest that the Panama Canal expansion could divert nearly two million metric tons of export cargo per year from West Coast ports to the Port of New Orleans by 2025; about one-half of that cargo is expected to move on the Mississippi River.
Central America Free Trade Agreement – Dominican Republic (CAFTA-DR) This agreement will phase out duties on 50 percent of all U.S. agricultural products to Costa Rica, the Dominican Republic, El Salvador, Guatemala, Honduras, and Nicaragua. This is expected to increase shipments of grain from the Port of New Orleans and Mobile. These trade agreements could boost traffic on the Mississippi River and Tenn–Tom Waterway Corridors.
Opening U.S. Trade with Cuba Diplomatic relations between the U.S. and Cuba have been improving which could lead to the lifting of trade embargoes. Cuba has also been suggested as a low cost shipping transshipment hub for feeder service in the Gulf Coast.
Free Trade Agreements with Colombia, Panama and South Korea The Colombia Free Trade Agreement went into force on May 15, 2012 and, the U.S.-Korea trade agreement went into force on March 15, 2012. The Panama free trade agreement has been approved by Congress and signed by President Obama but further regulatory formalities will need to be completed before the agreement is completely in place.
Canadian National Rail Service at the Port of Prince Rupert It appears the impact of additional trade with Prince Rupert on Mississippi will not follow the same drayage patterns as overall intermodal drayage in the state. Whereas counties in Mississippi currently send more freight to Memphis for export than they receive as imports, with Prince Rupert the reverse will be true. More freight at that port will enter Mississippi than backhaul freight destined for the port. While it appears that this increased level of truck traffic in Mississippi can be supported by its existing highway network, more research needs to be conducted on the effect of this increased drayage on specific Mississippi corridors.
Mississippi Goods Movement and Trade Study Final Report Page-40
Mississippi Goods Movement and Trade Study FINAL REPORT
IDENTIFIED FREIGHT INFRASTRUCTURE NEEDS
Highway Infrastructure Needs The analysis and identification of highway bottlenecks and related issues was conducted using several approaches: 1) Using existing traffic data several highway corridors were identified for additional analysis using truck GPS data from the American Transportation Research Institute (ATRI); 2) Truck traffic modeling using a statewide travel demand model; 3) surveys with Mississippi’s motor carriers; 4) surveys with MDOT District Engineers.
Freight Performance Measures (FPM) Analysis12 Since 2003, the Federal Highway Administration (FHWA), through its Office of Freight Management and Operations, entered into partnership with ATRI (a study team partner) to identify freight significant corridors in the country and to review technologies that could be used to collect positioning data on trucks. The FHWA-FPM initiative, an extensive and continuously updated database of operating information from 500,000 commercial trucks, is derived from wireless onboard communications systems that are utilized by the trucking industry.
In summary, of the highways selected for additional analysis, US 49 had the highest percentage of segments (24 percent) with average truck speeds less than 50 mph. Of the 54 three-mile segments analyzed, 13 had average truck speeds that were less than 50 mph. Truck travel experience on these segments with diminished travel speeds is typically urban transit where congestion or reduced posted speeds are present:
Gulfport-Biloxi- segments 1-3: This section of US 49 has signalized intersections and urban automobile/truck traffic.
Hattiesburg- segments 22-26: US 49 in Hattiesburg is not a limited access highway and has many intersections that are signalized and/or have stop signs. Use of US 98 and Interstate 59 is an option to bypass Hattiesburg, but requires an extra 2+ miles of travel.
Richland-Jackson segments 51, 53 and 54: Average speeds in this location may be reduced due to the large number of origins and destinations in the area (i.e., trucks starting and stopping to leave the highway). Traffic signals at a few major crossings, as well as large volumes during peak hours, contribute to this delay.
US 84 had the second highest percentage of segments with speeds less than 50 mph (18 percent). Similar to US 82, this route has a greater dispersal of segments with slower speeds even though the route runs through significantly fewer urban areas. Urban areas containing segments with low average speeds include:
Laurel - two segments (segments 14 and 15) Brookhaven - two segments (segments 47 and 48 ) Natchez - four segments (segments 68, 69, 70 and 71)
US 82 had the third highest percentage of segments (15 percent) with speeds averaging less than 50 mph likely due to adjacent locations with dense populations and signalized/signed intersections. Additionally, US 82 had three segments with average speeds less than 30 mph,
12 For more details about this analysis see Technical Memorandum J: Truck Mobility and Bottleneck Analysis. Information about the statewide truck travel demand model are presented in Technical Memorandum M: Statewide Modeling of Potential Passenger and Freight Conflicts
Mississippi Goods Movement and Trade Study Final Report Page-41
Mississippi Goods Movement and Trade Study FINAL REPORT
which is the highest instance of very low average speeds. The urban areas with very low average speeds include:
Winona - one segment (segment 33) Greenwood - three segments (segments 42, 43 and 44) Indianola - one segment (segment 54) Greenville - three segments (segments 63, 64 and 65)
Of the five study routes, US 72 had the lowest percentage (11 percent) of segments with average truck speeds less than 50 mph. Of the three segments with average speeds less than 50 mph, the first was in Corinth (segment 1) while the remaining two were located in the Memphis, TN region (segments 26 and 27). The low speeds within these three segments are likely attributable to urban congestion and a large number of origins/destinations locations.
Though US 78 begins and terminates in larger urban areas and travels through two smaller urban areas, New Albany and Holly Springs, there were no roadway segments with average truck speeds less than 50 mph. US 78 was the only roadway in the study with all segments averaging speeds of 50 mph or greater.
Motor Carrier Surveys A survey was also conducted with 52 motor carriers in Mississippi. The survey, which included for-hire and private carriers, (81 percent and 19 percent of the total, respectively), was intended to portray a balanced view of issues within the motor carrier industry as well as help in the identification of metrics to address these issues. The trucking industry was queried regarding major issues (within the area of influence of the MDOT) they face when traveling in Mississippi as well as areas for improvements in the Mississippi routes they use. Though nearly all of the carrier responses fell in the midrange, the top three problems identified by respondents were (1) inadequate highway capacity, (2) inadequate roadway turning radius and (3) highway congestion. Access to intermodal facilities, distribution centers and origins received the lowest scores.
Responding to inquiries of specific needs, carriers suggested that the top three greatest improvements are needed in (1) truck parking facilities, (2) highway road capacity and (3) secondary road capacity. Highway ramps and intermodal facilities received the highest “no improvement needed” scores.
District Engineer Survey To ensure a comprehensive picture of past, current and future freight planning efforts to remedy prominent freight and goods movement issues in the state, including existing bottlenecks affecting commercial vehicle mobility, MDOT district engineers were also engaged. In June, 2009, interviewees were asked to respond to seven questions about district planning with regard to freight issues, current and future planned or programmed freight related projects and reactions to bottlenecks in their districts developed from the FPM analysis and motor carrier surveys. Exhibit 32 lists the truck bottlenecks identified by the district engineers. It should be noted that several interviewees identified bottlenecks that were not part of the initial bottleneck list developed by ATRI. Exhibit 33 provides recommended improvements on these routes.
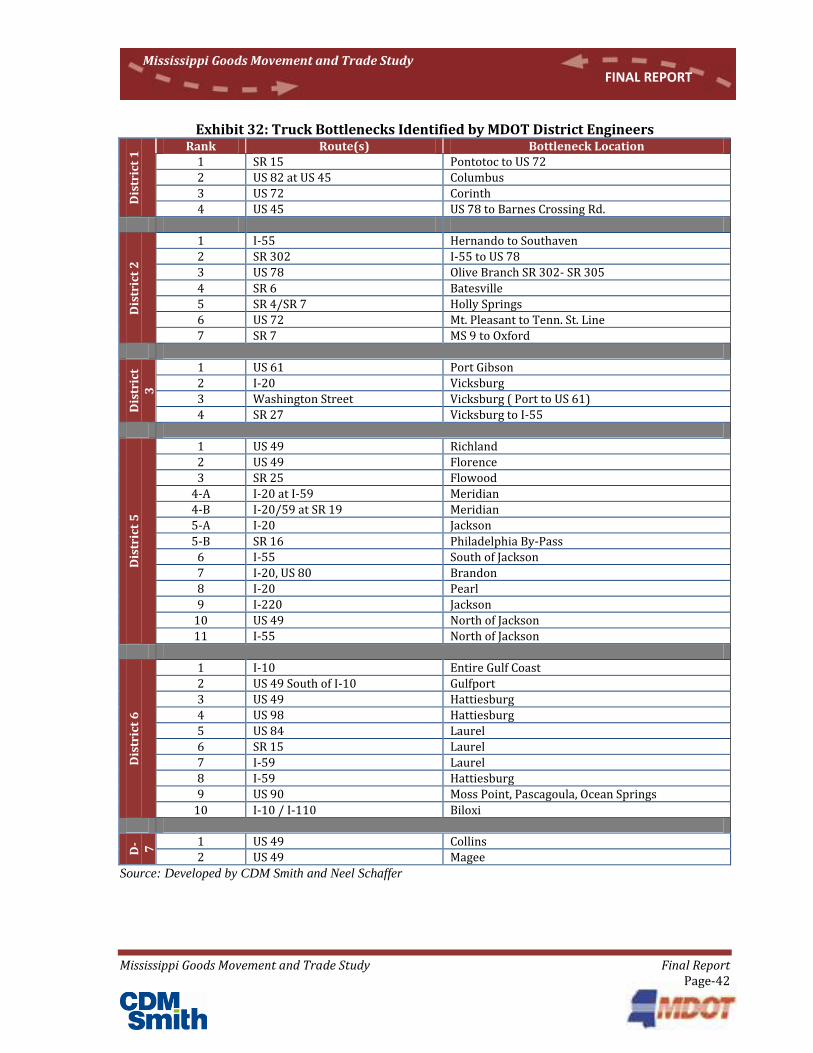
Mississippi Goods Movement and Trade Study Final Report Page-42
Mississippi Goods Movement and Trade Study FINAL REPORT
Exhibit 32: Truck Bottlenecks Identified by MDOT District Engineers D
istr
ict
1 Rank Route(s) Bottleneck Location
1 SR 15 Pontotoc to US 72
2 US 82 at US 45 Columbus
3 US 72 Corinth
4 US 45 US 78 to Barnes Crossing Rd.
Dis
tric
t 2
1 I-55 Hernando to Southaven
2 SR 302 I-55 to US 78
3 US 78 Olive Branch SR 302- SR 305
4 SR 6 Batesville
5 SR 4/SR 7 Holly Springs
6 US 72 Mt. Pleasant to Tenn. St. Line
7 SR 7 MS 9 to Oxford
Dis
tric
t 3
1 US 61 Port Gibson
2 I-20 Vicksburg
3 Washington Street Vicksburg ( Port to US 61)
4 SR 27 Vicksburg to I-55
Dis
tric
t 5
1 US 49 Richland
2 US 49 Florence
3 SR 25 Flowood
4-A I-20 at I-59 Meridian
4-B I-20/59 at SR 19 Meridian
5-A I-20 Jackson
5-B SR 16 Philadelphia By-Pass
6 I-55 South of Jackson
7 I-20, US 80 Brandon
8 I-20 Pearl
9 I-220 Jackson
10 US 49 North of Jackson
11 I-55 North of Jackson
Dis
tric
t 6
1 I-10 Entire Gulf Coast
2 US 49 South of I-10 Gulfport
3 US 49 Hattiesburg
4 US 98 Hattiesburg
5 US 84 Laurel
6 SR 15 Laurel
7 I-59 Laurel
8 I-59 Hattiesburg
9 US 90 Moss Point, Pascagoula, Ocean Springs
10 I-10 / I-110 Biloxi
D- 7 1 US 49 Collins
2 US 49 Magee
Source: Developed by CDM Smith and Neel Schaffer
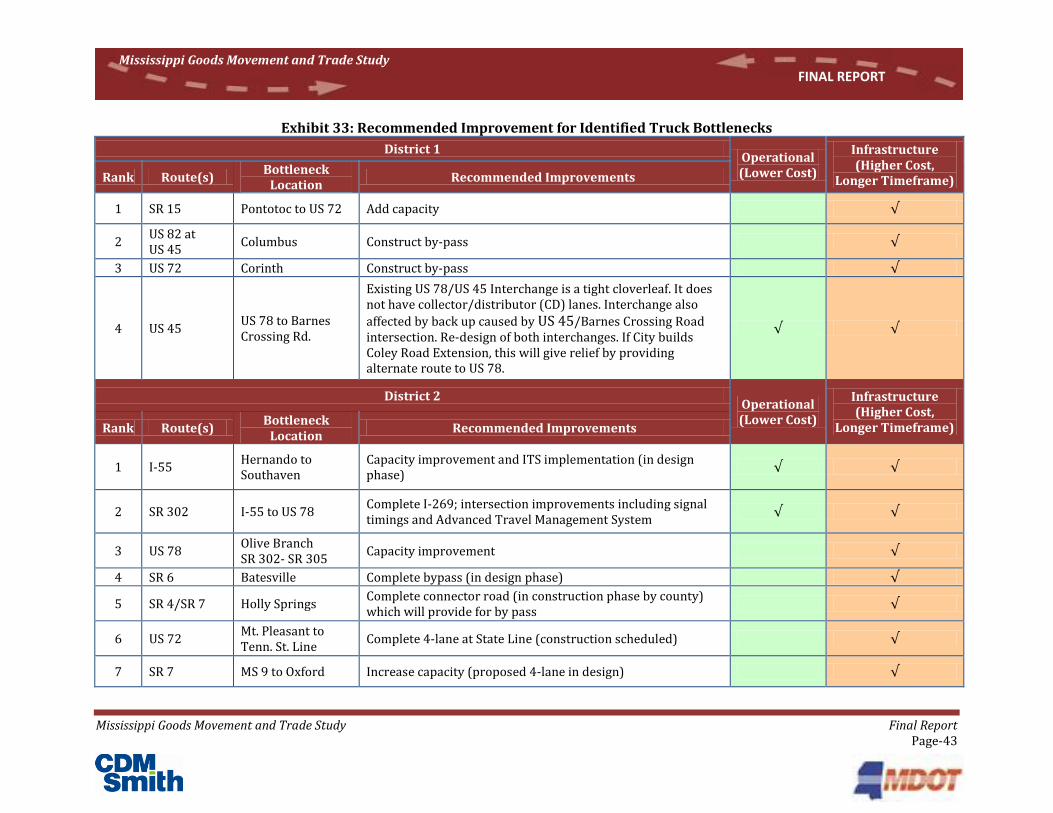
Mississippi Goods Movement and Trade Study Final Report Page-43
Mississippi Goods Movement and Trade Study FINAL REPORT
Exhibit 33: Recommended Improvement for Identified Truck Bottlenecks
District 1 Operational (Lower Cost)
Infrastructure (Higher Cost,
Longer Timeframe) Rank Route(s) Bottleneck
Location Recommended Improvements
1 SR 15 Pontotoc to US 72 Add capacity √
2 US 82 at US 45
Columbus Construct by-pass √
3 US 72 Corinth Construct by-pass √
4 US 45 US 78 to Barnes Crossing Rd.
Existing US 78/US 45 Interchange is a tight cloverleaf. It does not have collector/distributor (CD) lanes. Interchange also
affected by back up caused by US 45/Barnes Crossing Road intersection. Re-design of both interchanges. If City builds Coley Road Extension, this will give relief by providing alternate route to US 78.
√ √
District 2 Operational (Lower Cost)
Infrastructure (Higher Cost,
Longer Timeframe) Rank Route(s) Bottleneck
Location Recommended Improvements
1 I-55 Hernando to Southaven
Capacity improvement and ITS implementation (in design phase)
√ √
2 SR 302 I-55 to US 78 Complete I-269; intersection improvements including signal timings and Advanced Travel Management System
√ √
3 US 78 Olive Branch SR 302- SR 305
Capacity improvement √
4 SR 6 Batesville Complete bypass (in design phase) √
5 SR 4/SR 7 Holly Springs Complete connector road (in construction phase by county) which will provide for by pass
√
6 US 72 Mt. Pleasant to Tenn. St. Line
Complete 4-lane at State Line (construction scheduled) √
7 SR 7 MS 9 to Oxford Increase capacity (proposed 4-lane in design) √
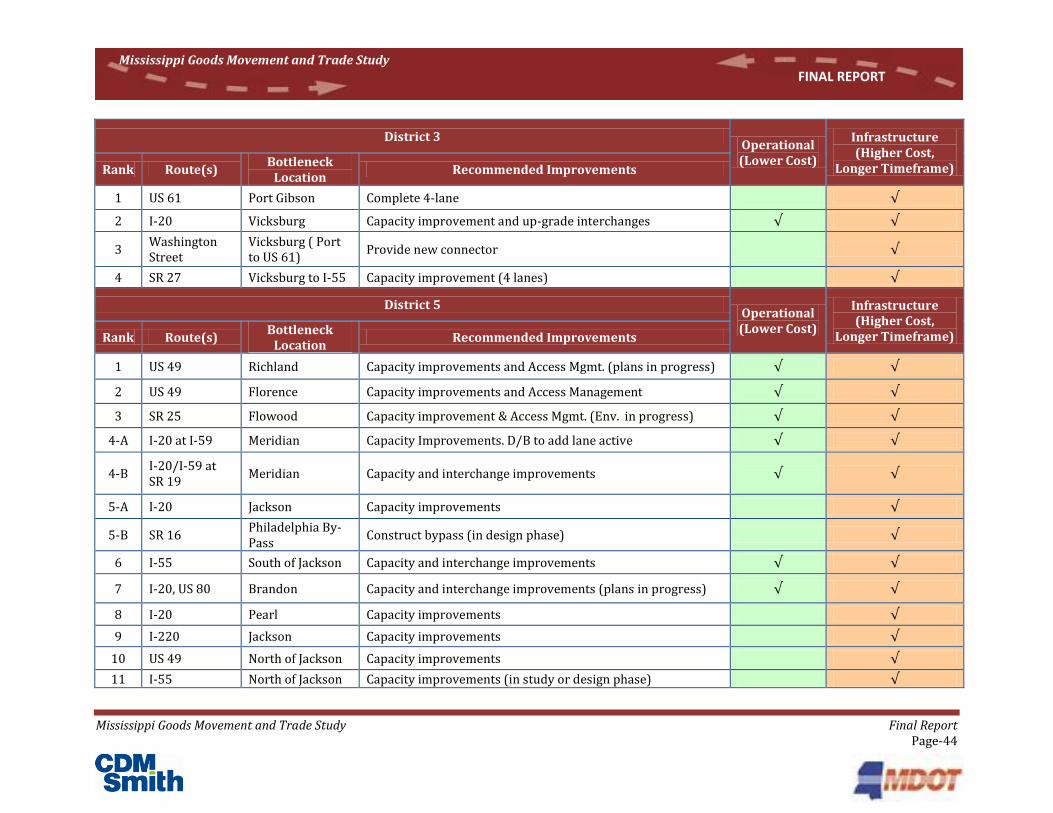
Mississippi Goods Movement and Trade Study Final Report Page-44
Mississippi Goods Movement and Trade Study FINAL REPORT
District 3 Operational (Lower Cost)
Infrastructure (Higher Cost,
Longer Timeframe) Rank Route(s) Bottleneck
Location Recommended Improvements
1 US 61 Port Gibson Complete 4-lane √
2 I-20 Vicksburg Capacity improvement and up-grade interchanges √ √
3 Washington Street
Vicksburg ( Port to US 61)
Provide new connector √
4 SR 27 Vicksburg to I-55 Capacity improvement (4 lanes) √
District 5 Operational (Lower Cost)
Infrastructure (Higher Cost,
Longer Timeframe) Rank Route(s) Bottleneck
Location Recommended Improvements
1 US 49 Richland Capacity improvements and Access Mgmt. (plans in progress) √ √
2 US 49 Florence Capacity improvements and Access Management √ √
3 SR 25 Flowood Capacity improvement & Access Mgmt. (Env. in progress) √ √
4-A I-20 at I-59 Meridian Capacity Improvements. D/B to add lane active √ √
4-B I-20/I-59 at SR 19
Meridian Capacity and interchange improvements √ √
5-A I-20 Jackson Capacity improvements √
5-B SR 16 Philadelphia By-Pass
Construct bypass (in design phase) √
6 I-55 South of Jackson Capacity and interchange improvements √ √
7 I-20, US 80 Brandon Capacity and interchange improvements (plans in progress) √ √
8 I-20 Pearl Capacity improvements √
9 I-220 Jackson Capacity improvements √
10 US 49 North of Jackson Capacity improvements √
11 I-55 North of Jackson Capacity improvements (in study or design phase) √
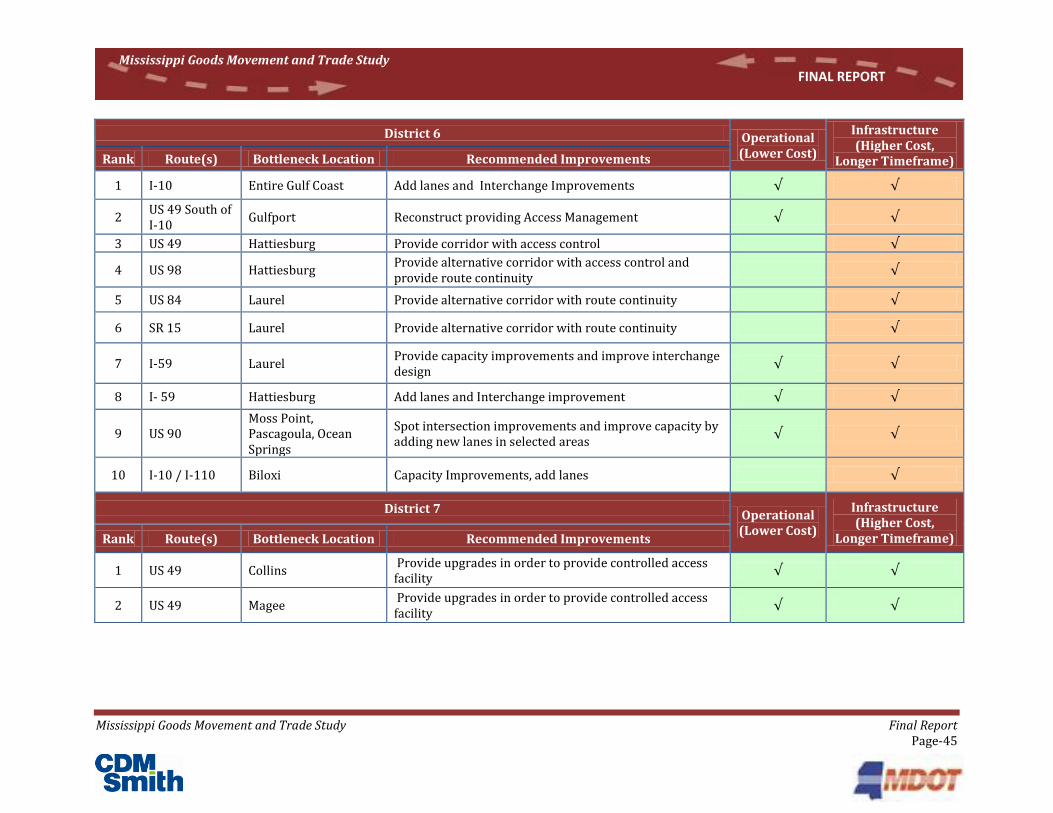
Mississippi Goods Movement and Trade Study Final Report Page-45
Mississippi Goods Movement and Trade Study FINAL REPORT
District 6 Operational (Lower Cost)
Infrastructure (Higher Cost,
Longer Timeframe) Rank Route(s) Bottleneck Location Recommended Improvements
1 I-10 Entire Gulf Coast Add lanes and Interchange Improvements √ √
2 US 49 South of I-10
Gulfport Reconstruct providing Access Management √ √
3 US 49 Hattiesburg Provide corridor with access control √
4 US 98 Hattiesburg Provide alternative corridor with access control and provide route continuity
√
5 US 84 Laurel Provide alternative corridor with route continuity √
6 SR 15 Laurel Provide alternative corridor with route continuity √
7 I-59 Laurel Provide capacity improvements and improve interchange design
√ √
8 I- 59 Hattiesburg Add lanes and Interchange improvement √ √
9 US 90 Moss Point, Pascagoula, Ocean Springs
Spot intersection improvements and improve capacity by adding new lanes in selected areas
√ √
10 I-10 / I-110 Biloxi Capacity Improvements, add lanes √
District 7 Operational (Lower Cost)
Infrastructure (Higher Cost,
Longer Timeframe) Rank Route(s) Bottleneck Location Recommended Improvements
1 US 49 Collins Provide upgrades in order to provide controlled access facility
√ √
2 US 49 Magee Provide upgrades in order to provide controlled access facility
√ √
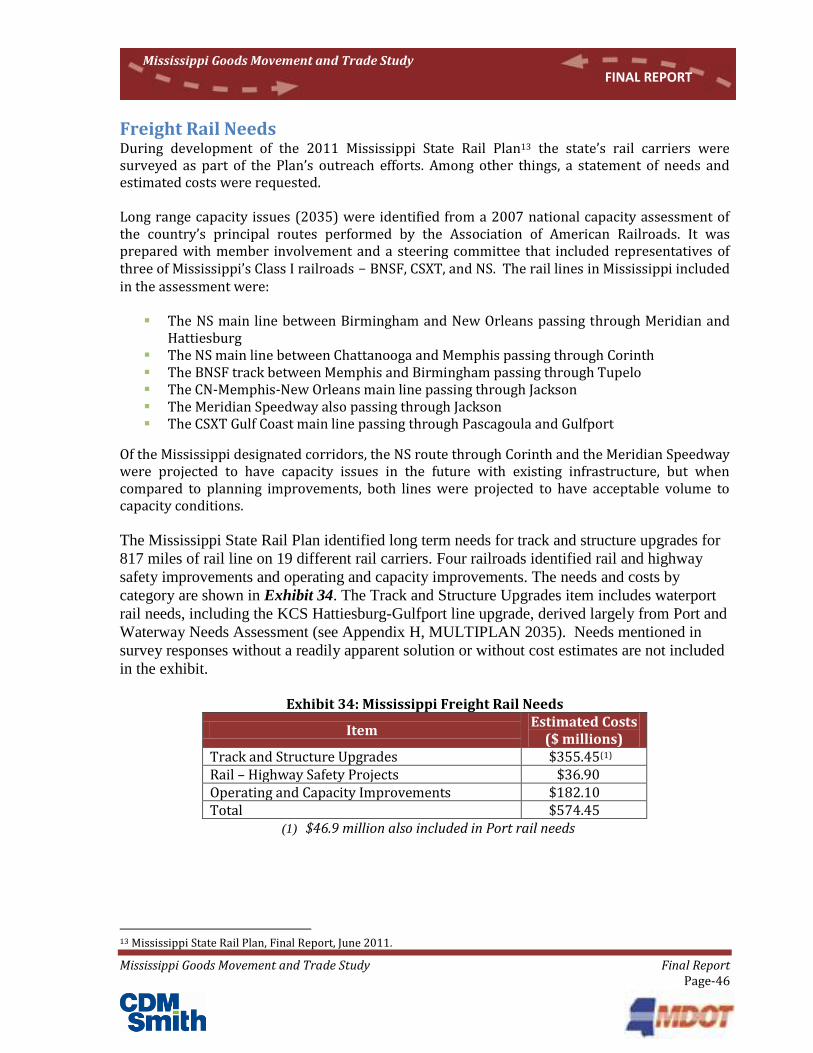
Mississippi Goods Movement and Trade Study Final Report Page-46
Mississippi Goods Movement and Trade Study FINAL REPORT
Freight Rail Needs During development of the 2011 Mississippi State Rail Plan13 the state’s rail carriers were surveyed as part of the Plan’s outreach efforts. Among other things, a statement of needs and estimated costs were requested. Long range capacity issues (2035) were identified from a 2007 national capacity assessment of the country’s principal routes performed by the Association of American Railroads. It was prepared with member involvement and a steering committee that included representatives of three of Mississippi’s Class I railroads - BNSF, CSXT, and NS. The rail lines in Mississippi included in the assessment were:
The NS main line between Birmingham and New Orleans passing through Meridian and Hattiesburg
The NS main line between Chattanooga and Memphis passing through Corinth The BNSF track between Memphis and Birmingham passing through Tupelo The CN-Memphis-New Orleans main line passing through Jackson The Meridian Speedway also passing through Jackson The CSXT Gulf Coast main line passing through Pascagoula and Gulfport
Of the Mississippi designated corridors, the NS route through Corinth and the Meridian Speedway were projected to have capacity issues in the future with existing infrastructure, but when compared to planning improvements, both lines were projected to have acceptable volume to capacity conditions. The Mississippi State Rail Plan identified long term needs for track and structure upgrades for
817 miles of rail line on 19 different rail carriers. Four railroads identified rail and highway
safety improvements and operating and capacity improvements. The needs and costs by
category are shown in Exhibit 34. The Track and Structure Upgrades item includes waterport
rail needs, including the KCS Hattiesburg-Gulfport line upgrade, derived largely from Port and
Waterway Needs Assessment (see Appendix H, MULTIPLAN 2035). Needs mentioned in
survey responses without a readily apparent solution or without cost estimates are not included
in the exhibit.
Exhibit 34: Mississippi Freight Rail Needs
Item Estimated Costs
($ millions) Track and Structure Upgrades $355.45(1) Rail – Highway Safety Projects $36.90 Operating and Capacity Improvements $182.10 Total $574.45
(1) $46.9 million also included in Port rail needs
13 Mississippi State Rail Plan, Final Report, June 2011.
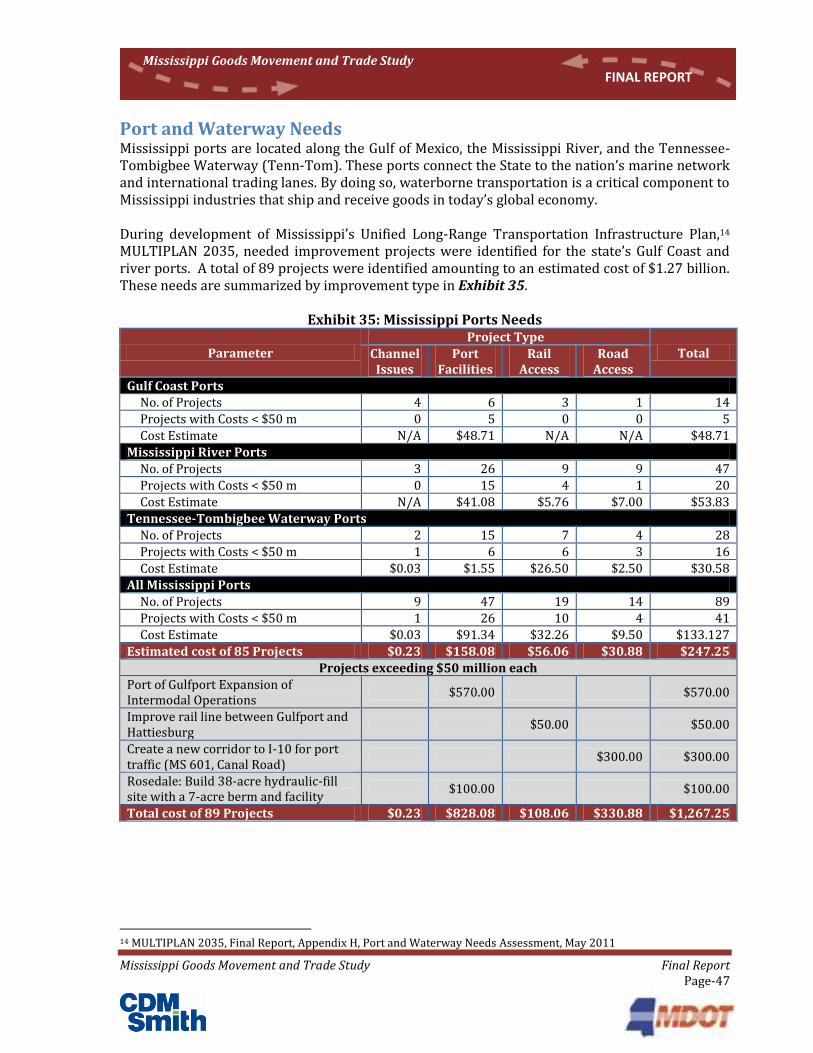
Mississippi Goods Movement and Trade Study Final Report Page-47
Mississippi Goods Movement and Trade Study FINAL REPORT
Port and Waterway Needs Mississippi ports are located along the Gulf of Mexico, the Mississippi River, and the Tennessee-Tombigbee Waterway (Tenn-Tom). These ports connect the State to the nation’s marine network and international trading lanes. By doing so, waterborne transportation is a critical component to Mississippi industries that ship and receive goods in today’s global economy. During development of Mississippi’s Unified Long-Range Transportation Infrastructure Plan,14 MULTIPLAN 2035, needed improvement projects were identified for the state’s Gulf Coast and river ports. A total of 89 projects were identified amounting to an estimated cost of $1.27 billion. These needs are summarized by improvement type in Exhibit 35.
Exhibit 35: Mississippi Ports Needs
Parameter Project Type
Total Channel Issues
Port Facilities
Rail Access
Road Access
Gulf Coast Ports No. of Projects 4 6 3 1 14
Projects with Costs < $50 m 0 5 0 0 5
Cost Estimate N/A $48.71 N/A N/A $48.71
Mississippi River Ports
No. of Projects 3 26 9 9 47
Projects with Costs < $50 m 0 15 4 1 20
Cost Estimate N/A $41.08 $5.76 $7.00 $53.83
Tennessee-Tombigbee Waterway Ports
No. of Projects 2 15 7 4 28
Projects with Costs < $50 m 1 6 6 3 16
Cost Estimate $0.03 $1.55 $26.50 $2.50 $30.58
All Mississippi Ports
No. of Projects 9 47 19 14 89
Projects with Costs < $50 m 1 26 10 4 41
Cost Estimate $0.03 $91.34 $32.26 $9.50 $133.127
Estimated cost of 85 Projects $0.23 $158.08 $56.06 $30.88 $247.25
Projects exceeding $50 million each
Port of Gulfport Expansion of Intermodal Operations
$570.00 $570.00
Improve rail line between Gulfport and Hattiesburg
$50.00 $50.00
Create a new corridor to I-10 for port traffic (MS 601, Canal Road)
$300.00 $300.00
Rosedale: Build 38-acre hydraulic-fill site with a 7-acre berm and facility
$100.00 $100.00
Total cost of 89 Projects $0.23 $828.08 $108.06 $330.88 $1,267.25
14 MULTIPLAN 2035, Final Report, Appendix H, Port and Waterway Needs Assessment, May 2011
Mississippi Goods Movement and Trade Study Final Report Page-48
Mississippi Goods Movement and Trade Study FINAL REPORT
Additional Corridor Improvement Strategies Corridor strategies and key short-term projects were identified for corridors of statewide significance during development of MULTIPLAN 203515, the state’s long-range, multimodal transportation plan. These corridors included all six of the key multimodal freight corridors identified in this study. This section summarized strategies and short-term projects identified in MULTIPLAN 2035 for the six freight corridors. The summary focuses on strategies and projects most related to freight issues. There are several overreaching strategies applicable to all corridors, including:
Integrate bicycle, pedestrian and transit modes into the corridor transportation planning process. Integrate bicycle/pedestrian movement into the areas of highway/bridge design and facility standards, transit access, and policy planning.
Continue to improve work zone and workplace safety along the corridor and other corridor roads.
Complete rehabilitation of any deficient segments of the corridor over time. Prioritize mileage along the corridor with pavement condition categorized as non-acceptable.
Partner with Federal and State Resource Agencies and conservation organizations to further promote mutual understanding of their and MDOT’s goals.
Promote context sensitive solutions/design including implementing flexibility in highway design criteria in the corridor to gain better acceptance of projects by communities and resource agencies.
Continue development and implementation of highway improvements in the corridor in a coordinated manner with economic development efforts.
Promote a balanced freight transportation system in the corridor that takes advantage of the inherent efficiencies of each mode.
Elevate public involvement in transportation plans for the corridor by identifying transportation customers and facilitate improved/formalized methods for communication between them. Implement proactive public involvement programs for corridor projects and consider all public comments.
Southaven - McComb Corridor
Corridor specific strategies include:
Promote increased use of the state’s freight and passenger rail system: Address potential for passenger rail and freight rail improvements in the I-55 corridor. Current passenger rail is along the I-55 corridor from Jackson south. Northern passenger rail is along the CN line parallel to and west of I-55 through the Mississippi Delta.
Complete safety studies in key locations along I-55 as it has the highest crash rates of any of the interstate corridors.
Support corridor improvements to rail crossings and along corridor.
Key short-term projects along the corridor are listed in Exhibit 36.
15 MULTIPLAN 2035, Final Report, Appendix O, Corridors of Statewide Significance, May 2011
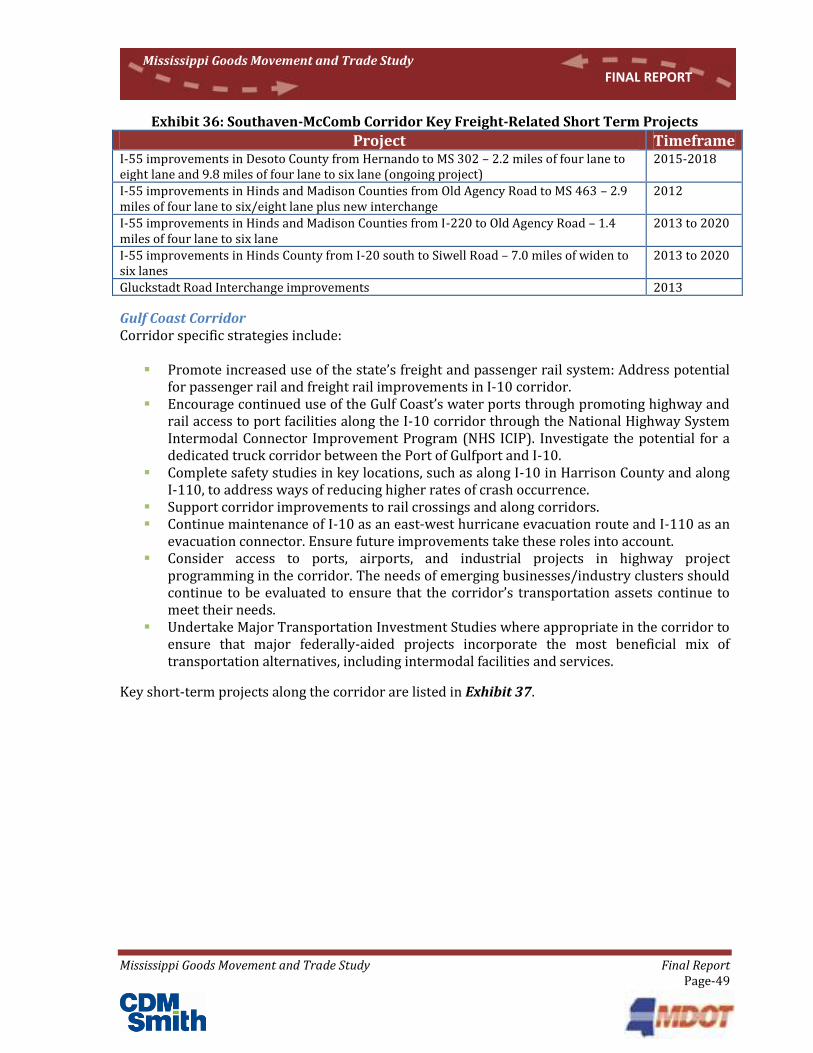
Mississippi Goods Movement and Trade Study Final Report Page-49
Mississippi Goods Movement and Trade Study FINAL REPORT
Exhibit 36: Southaven-McComb Corridor Key Freight-Related Short Term Projects
Project Timeframe I-55 improvements in Desoto County from Hernando to MS 302 – 2.2 miles of four lane to eight lane and 9.8 miles of four lane to six lane (ongoing project)
2015-2018
I-55 improvements in Hinds and Madison Counties from Old Agency Road to MS 463 – 2.9 miles of four lane to six/eight lane plus new interchange
2012
I-55 improvements in Hinds and Madison Counties from I-220 to Old Agency Road – 1.4 miles of four lane to six lane
2013 to 2020
I-55 improvements in Hinds County from I-20 south to Siwell Road – 7.0 miles of widen to six lanes
2013 to 2020
Gluckstadt Road Interchange improvements 2013
Gulf Coast Corridor Corridor specific strategies include:
Promote increased use of the state’s freight and passenger rail system: Address potential for passenger rail and freight rail improvements in I-10 corridor.
Encourage continued use of the Gulf Coast’s water ports through promoting highway and rail access to port facilities along the I-10 corridor through the National Highway System Intermodal Connector Improvement Program (NHS ICIP). Investigate the potential for a dedicated truck corridor between the Port of Gulfport and I-10.
Complete safety studies in key locations, such as along I-10 in Harrison County and along I-110, to address ways of reducing higher rates of crash occurrence.
Support corridor improvements to rail crossings and along corridors. Continue maintenance of I-10 as an east-west hurricane evacuation route and I-110 as an
evacuation connector. Ensure future improvements take these roles into account. Consider access to ports, airports, and industrial projects in highway project
programming in the corridor. The needs of emerging businesses/industry clusters should continue to be evaluated to ensure that the corridor’s transportation assets continue to meet their needs.
Undertake Major Transportation Investment Studies where appropriate in the corridor to ensure that major federally-aided projects incorporate the most beneficial mix of transportation alternatives, including intermodal facilities and services.
Key short-term projects along the corridor are listed in Exhibit 37.
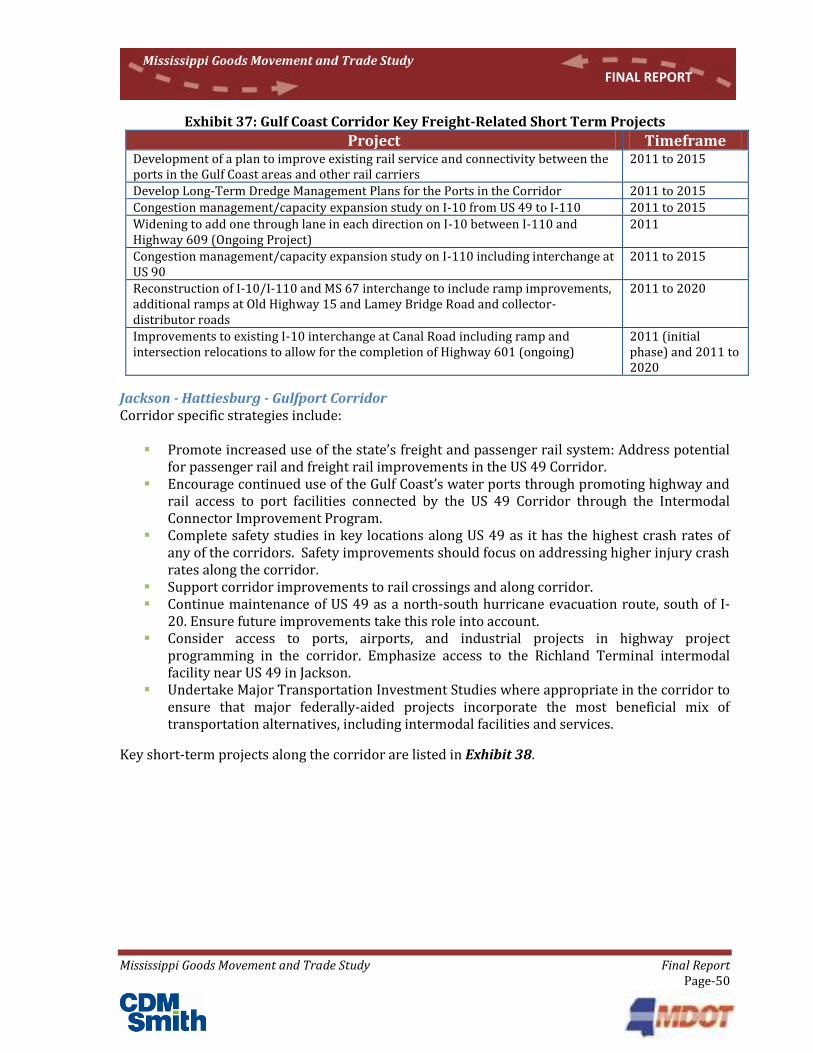
Mississippi Goods Movement and Trade Study Final Report Page-50
Mississippi Goods Movement and Trade Study FINAL REPORT
Exhibit 37: Gulf Coast Corridor Key Freight-Related Short Term Projects
Project Timeframe Development of a plan to improve existing rail service and connectivity between the ports in the Gulf Coast areas and other rail carriers
2011 to 2015
Develop Long-Term Dredge Management Plans for the Ports in the Corridor 2011 to 2015
Congestion management/capacity expansion study on I-10 from US 49 to I-110 2011 to 2015
Widening to add one through lane in each direction on I-10 between I-110 and Highway 609 (Ongoing Project)
2011
Congestion management/capacity expansion study on I-110 including interchange at US 90
2011 to 2015
Reconstruction of I-10/I-110 and MS 67 interchange to include ramp improvements, additional ramps at Old Highway 15 and Lamey Bridge Road and collector-distributor roads
2011 to 2020
Improvements to existing I-10 interchange at Canal Road including ramp and intersection relocations to allow for the completion of Highway 601 (ongoing)
2011 (initial phase) and 2011 to 2020
Jackson - Hattiesburg - Gulfport Corridor Corridor specific strategies include:
Promote increased use of the state’s freight and passenger rail system: Address potential for passenger rail and freight rail improvements in the US 49 Corridor.
Encourage continued use of the Gulf Coast’s water ports through promoting highway and rail access to port facilities connected by the US 49 Corridor through the Intermodal Connector Improvement Program.
Complete safety studies in key locations along US 49 as it has the highest crash rates of any of the corridors. Safety improvements should focus on addressing higher injury crash rates along the corridor.
Support corridor improvements to rail crossings and along corridor. Continue maintenance of US 49 as a north-south hurricane evacuation route, south of I-
20. Ensure future improvements take this role into account. Consider access to ports, airports, and industrial projects in highway project
programming in the corridor. Emphasize access to the Richland Terminal intermodal facility near US 49 in Jackson.
Undertake Major Transportation Investment Studies where appropriate in the corridor to ensure that major federally-aided projects incorporate the most beneficial mix of transportation alternatives, including intermodal facilities and services.
Key short-term projects along the corridor are listed in Exhibit 38.
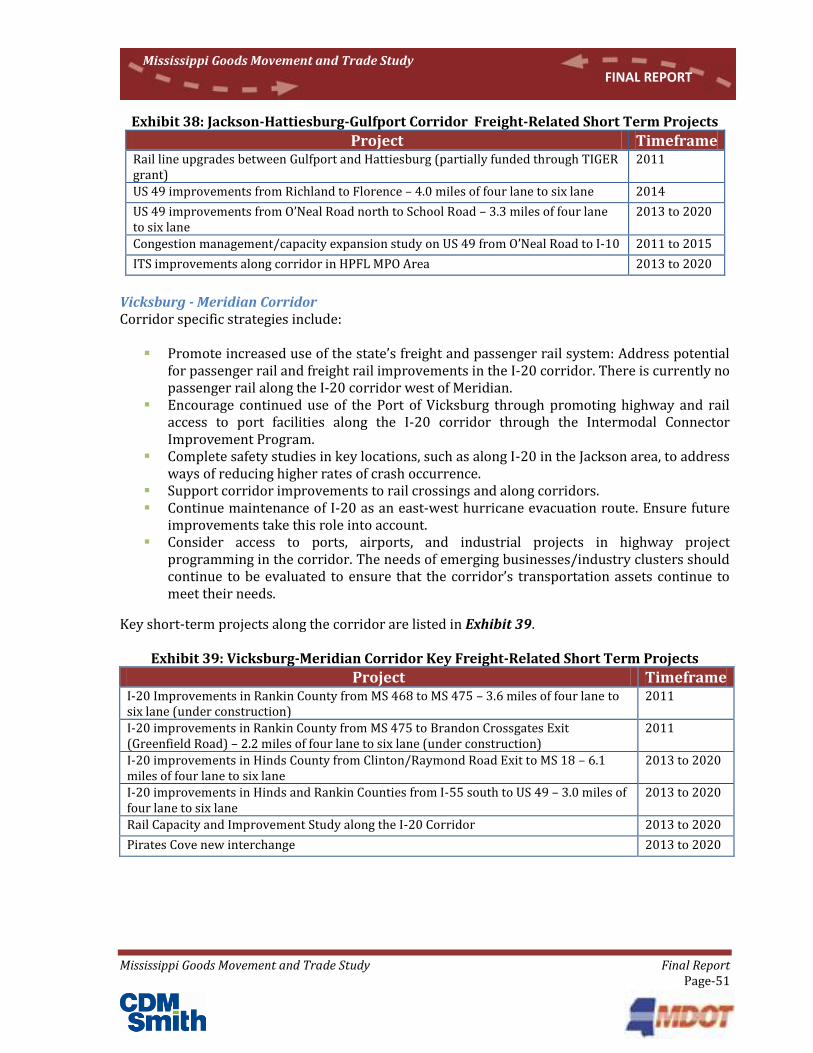
Mississippi Goods Movement and Trade Study Final Report Page-51
Mississippi Goods Movement and Trade Study FINAL REPORT
Exhibit 38: Jackson-Hattiesburg-Gulfport Corridor Freight-Related Short Term Projects
Project Timeframe Rail line upgrades between Gulfport and Hattiesburg (partially funded through TIGER grant)
2011
US 49 improvements from Richland to Florence – 4.0 miles of four lane to six lane 2014
US 49 improvements from O’Neal Road north to School Road – 3.3 miles of four lane to six lane
2013 to 2020
Congestion management/capacity expansion study on US 49 from O’Neal Road to I-10 2011 to 2015
ITS improvements along corridor in HPFL MPO Area 2013 to 2020
Vicksburg - Meridian Corridor Corridor specific strategies include:
Promote increased use of the state’s freight and passenger rail system: Address potential for passenger rail and freight rail improvements in the I-20 corridor. There is currently no passenger rail along the I-20 corridor west of Meridian.
Encourage continued use of the Port of Vicksburg through promoting highway and rail access to port facilities along the I-20 corridor through the Intermodal Connector Improvement Program.
Complete safety studies in key locations, such as along I-20 in the Jackson area, to address ways of reducing higher rates of crash occurrence.
Support corridor improvements to rail crossings and along corridors. Continue maintenance of I-20 as an east-west hurricane evacuation route. Ensure future
improvements take this role into account. Consider access to ports, airports, and industrial projects in highway project
programming in the corridor. The needs of emerging businesses/industry clusters should continue to be evaluated to ensure that the corridor’s transportation assets continue to meet their needs.
Key short-term projects along the corridor are listed in Exhibit 39.
Exhibit 39: Vicksburg-Meridian Corridor Key Freight-Related Short Term Projects
Project Timeframe I-20 Improvements in Rankin County from MS 468 to MS 475 – 3.6 miles of four lane to six lane (under construction)
2011
I-20 improvements in Rankin County from MS 475 to Brandon Crossgates Exit (Greenfield Road) – 2.2 miles of four lane to six lane (under construction)
2011
I-20 improvements in Hinds County from Clinton/Raymond Road Exit to MS 18 – 6.1 miles of four lane to six lane
2013 to 2020
I-20 improvements in Hinds and Rankin Counties from I-55 south to US 49 – 3.0 miles of four lane to six lane
2013 to 2020
Rail Capacity and Improvement Study along the I-20 Corridor 2013 to 2020
Pirates Cove new interchange 2013 to 2020

Mississippi Goods Movement and Trade Study Final Report Page-52
Mississippi Goods Movement and Trade Study FINAL REPORT
Picayune-Meridian Corridor Corridor specific strategies include:
Promote increased use of the state’s freight and passenger rail system: Address potential for passenger rail service enhancements and freight rail improvements in the I-59 corridor.
Support corridor improvements to rail crossings and along corridor. Continue maintenance of I-59 as a north-south hurricane evacuation route. Ensure future
improvements take this role into account. Undertake Major Transportation Investment Studies where appropriate in the corridor to
ensure that major federally-aided projects incorporate the most beneficial mix of transportation alternatives, including intermodal facilities and services.
Key short-term projects along the corridor are listed in Exhibit 40.
Exhibit 40: Picayune-Meridian Corridor Freight-Related Short Term Project
Project Timeframe SR 42 Interchange redesign/replacement 2012
Olive Branch - Tupelo - Fulton Corridor Corridor specific strategies include:
Continue to work with partners in Alabama and Tennessee to complete the conversion of US 78 to I-22 as a priority.
Consider access to ports, airports, and industrial projects in highway project programming in the corridor. The needs of emerging businesses/industry clusters should continue to be evaluated to ensure that the corridor’s transportation assets continue to meet their needs.
Undertake Major Transportation Investment Studies where appropriate in the corridor to ensure that major federally-aided projects incorporate the most beneficial mix of transportation alternatives, including intermodal facilities and services.
Key short-term projects along the corridor are listed in Exhibit 41.
Exhibit 41: Olive Branch-Tupelo-Fulton Corridor Freight-Related Short Term Project
Project Timeframe Congestion management/ capacity expansion study on US 78 from Musgray Road to SR 178
N/A
Mississippi Goods Movement and Trade Study Final Report Page-53
Mississippi Goods Movement and Trade Study FINAL REPORT
PERFORMANCE MEASURES Transportation is a vital engine, which drives every economy. Transportation systems link key regional economic centers with national and international markets, which, in turn, improve regional economic competitiveness, especially as transportation system efficiencies continuously improve. The more an investment in a transportation system leads to efficiency improvements in the movements of people, goods, and services, the greater the economic impact. Efficiency improvements are facilitated by increasing travel speed, reducing travel times, increasing the travel predictability of people to jobs and public services, opening up new sites for commercial and industrial development, providing increased consumer access to markets, which stimulate retail development, and enhancing the flow of goods and services within a region. The importance of freight corridors in trade is explicitly recognized by the Mississippi Department of Transportation (MDOT). Maintaining efficiency and effectiveness of the trade transportation in MS will help support that part of the Mississippi economy which is dependent on national and international markets. A vibrant economy requires on-time and cost-competitive delivery of freight, access to jobs, schools, medical care, shopping and recreational opportunities. The transportation system affects how quickly goods get to market and how attractive an area is for a particular business. As part of the study process the consultant team was asked to develop a set of freight performance measures (or indicators) that would provide MDOT with the capability to monitor performance of the multimodal corridors in Mississippi. As the flow of freight becomes more efficient and safe, business and communities will share the economic benefits. These indicators measure performance in the following areas or categories:
Physical Condition Mobility Reliability Safety Accessibility Productivity
Technical Memorandum G - Performance Measures contains the background data and analysis conducted in reviewing appropriate performance metrics on Mississippi’s Commerce Corridors. For each of the proposed categories, the Technical Memorandum presents a series of performance criteria including:
Strategy Goal Performance Goal/Target Performance Measures Data Source Data Collection Plan/Implementation Plan

Mississippi Goods Movement and Trade Study Final Report Page-54
Mississippi Goods Movement and Trade Study FINAL REPORT
Subsequent to the performance measures research conducted for the MGM&TS, MDOT undertook the development of MULTIPLAN 203516, the state’s long-range, multimodal transportation plan. During work on MULTIPLAN 2035 the research conducted for the MGM&TS was used in identifying a well-defined set of goals that embodies MDOT’s vision for Mississippi’s future transportation system and provides a meaningful framework for the plan measures. The goal areas resulting from MULTIPLAN 2035 are:
Accessibility and Mobility Safety and Security Maintenance and Preservation Environmental Stewardship Economic Development Awareness, education and Cooperative Processes Finance
For each goal area, except the last two (numbers 6 and 7) for which planning-level performance measures are not really applicable, MULTIPLAN 2035 simplified the performance measures framework and the identified performance metrics are shown in Exhibit 42.
Exhibit 42: MULTIPLAN 2035 Performance Measures
Goal Area Recommended Measures Accessibility and Mobility Number of rural state highway miles improved
Percentage of roadway miles or amount of VMT at “tolerable” congestion levels
Percent of system airports meeting runway length objective for the primary runway
Safety Illustrative benefits
Maintenance and Preservation
Percent of lane miles in “fair” condition or better Level of unmet bridge improvement needs Percent of system airports with “good” pavement condition
on their primary runways Environmental Stewardship
VMT growth
Economic Development Same as mobility and accessibility measures for roads Percent of system airports meeting business user needs
Awareness, Education and Cooperative Processes
N/A
Finance N/A
16 MULTIPLAN 2035, Final Report, Appendix B, Framework to Support Performance-based Planning, May 2011
Mississippi Goods Movement and Trade Study Final Report Page-55
Mississippi Goods Movement and Trade Study FINAL REPORT
COST EFFECTIVE TRANSPORT = ECONOMIC DEVELOPMENT Remaining economically competitive in a global marketplace that continues to create new challenges for business and industry and the multimodal transportation networks that serve them requires agility and perseverance. Historically, the ability to produce and deliver high quality goods and services at competitive prices was a strategic advantage for the U.S. Mississippi’s economy is intrinsically linked to its ability to move materials, components, and finished goods within the state and to national and international destinations. As the economy continues to be transformed our ability to manage the complex supply chains necessary to move these goods remains critical to our economic future.
A Freight and Economic Development Action Plan Most economic development strategies focus on the development, retention, or attraction of business activity that brings a flow of revenue into the community that in turn generates income and other jobs through the multiplier effect. To strengthen and grow Mississippi’s economy, it is important to continue to enhance an environment that supports traded-sector businesses and enables them to continue to be competitive. Transportation and freight are crucial components of sustaining and enhancing the competitiveness of the state’s business environment. Ultimately economic development is about jobs. Given the jobs lost during the recession and continued population growth requiring the creation of additional jobs, job growth is paramount for Mississippi. As the global economic transformation continues, Mississippi must make full use of its unique attributes and strengths including freight and transportation infrastructure to keep traded sector businesses competitive and foster the strongest economy possible. Today economic development and freight issues must be considered within the context of concern about environmental quality and sustaining the quality of the “Place” in which we live and work. By pursuing an integrated approach to freight and goods movement, economic development, and related transportation issues, Mississippi has initiated a process that defines goals, strategies, and action to support a sustainable economy, maintain and enhance environmental quality, and preserve and improve the freight-industrial land base in order to support a sustainable and prosperous economic future for the state. The following text presents several cost effective transportation actions that will support economic development initiatives in Mississippi.
1. Develop an Integrated Freight and Economic Development Vision and Action Plan The MGM&TS provides a detailed analysis of the infrastructure, commodities, freight generators, and bottlenecks affecting the state’s freight networks. This study provides the foundation for developing a shared vision for the future for the Mississippi Strategic Freight Corridors that would balance the needs of traditional industries, existing and emerging businesses, and the safety and mobility of the people of Mississippi with the demands of national and international goods movement.
The economy in Mississippi is being transformed as traditional industries employ fewer people, new businesses continue to emerge, and the transportation needs of these businesses will continue to change. The need to understand these changes and the role transportation and freight will play in the state economic development going forward has never been more important.

Mississippi Goods Movement and Trade Study Final Report Page-56
Mississippi Goods Movement and Trade Study FINAL REPORT
Mississippi’s Strategic Freight Corridors help to support the economic goals of local communities as well as the state and national economy. In other words, the right investments in freight and transportation and thoughtful planning to meet economic development and freight needs can help to foster job creation, private investment, and an expanded tax base. The movement of people and goods is fundamental to all business. In today’s economic climate, the private sector makes business location decisions based upon their ability to compete and achieve strategic business goals. Increasingly multimodal transportation assets and services are key factors in that evaluation process. An integrated Freight and Economic Development Vision and Action Plan would clearly define the actions and investments needed to make Mississippi’s multimodal freight network a distinguishing feature in sustaining and growing the state’s economy and continuing to foster sustainable communities. The plan would also engage transportation officials, freight stakeholders, business leaders, economic development officials, and community leaders in an important discussion about the future of freight on economic development in Mississippi and help to define the benefits of the state’s freight and transportation networks in a way that allows the state’s taxpayers to clearly understand how economic development and freight benefits their job, their family, and their community.
Developing a freight and economic development vision is challenging because freight facilities are planned, owned, and operated by a range of organizations including:
Mississippi Department of Transportation Cities and Counties Port Authorities Airport Authorities The private sector including Class I railroads, shippers, businesses MPOs and RPOs
A Freight and Economic Development Vision and Action Plan would bring together these multimodal freight stakeholders along with MDOT, MDA, business and industry leaders, economic development professionals, and other leaders to develop a statewide freight and economic development action strategy that would respond to the evolving needs of business and industry, environmental considerations, the mobility issues of communities, and other key factors.
The vision and action plan process would develop a framework for an ongoing evaluation of the freight/transportation network in Mississippi evaluating changing trends, issues, challenges, and opportunities in the economy, global and national trade and logistics, transportation infrastructure, commodity flows, and the regulatory environment. This framework would also simultaneously evaluate the state’s evolving business and industrial sectors based upon trends, issues, challenges, and opportunities affecting their operation to better understand how those changes are affecting the state’s freight and transportation system. This Freight and Economic Development assessment framework would provide a dynamic evaluation matrix to continue to monitor and prioritize the changing freight infrastructure needs in Mississippi based upon the changes in the economy and the needs of the state’s businesses. By developing a statewide, regionally-linked action plan, priorities for freight infrastructure development linked to economic development and other public benefits could be developed. This process would engage the private sector early to facilitate the creation of public-private
Mississippi Goods Movement and Trade Study Final Report Page-57
Mississippi Goods Movement and Trade Study FINAL REPORT
partnerships that will likely be part of the funding strategy in the future. The Freight and Economic Development Vision and Action Plan would also develop equitable and sustainable financing and funding strategies to support prioritized freight and economic development programs, new technologies, and projects.
A Freight and Economic Development Vision and Action Plan would define regional and state goals for the freight network and freight supported industries and engage the public and private sector in a process to determine critical investments and priorities for future funding. The strategic action framework would provide a process to allow MDOT to continue to evaluate the changing freight needs of Mississippi business and industry and the relationship of these changes along with the changing dynamics affecting the state’s freight and transportation system to refine the Action Plan.
2. Integrate Freight Considerations into Industrial Land Planning Although there is a significant inventory of available industrial land within reasonable proximity of major roadways in each of the strategic freight corridors, there are a number of challenges facing many Mississippi communities and businesses trying to align their freight assets and industrial land inventory. For example, in many areas the land along rail lines and major truck corridors has been developed or planned without integrating the needs or operational requirements of these freight systems and their customers. There are incompatible land uses along rail lines and designated truck routes. Buffers and other land uses that could provide more compatible development adjacent to rail lines and truck corridors have not been utilized creating ongoing conflicts between uses. Often the road infrastructure serving industrial or commercial areas often lacks adequate turning radii and other design and operational elements to accommodate truck deliveries creating ongoing maintenance and congestion problems.
Perhaps one of the most critical challenges relating to industrial land and freight services is the lack of an adequate supply of industrial land that can be readily and efficiently served by transportation systems, particularly multimodal transportation services. This is further complicated by the competition for non-industrial uses of industrially zoned sites, which depletes the industrial land inventory. Railroads have pursued a business model that focuses more of their services on longer hauls with fewer impediments. Today, while the rail line may be adjacent to or within sight of the property, rail service on the site may not be available. Because efficient freight and transportation services are so important to today’s existing and emerging businesses, developing a concise understanding of freight services and cost of infrastructure relative to the industrial land inventory is vital. Retaining industrial land that could provide unique freight services is an important goal for Mississippi. The action strategies below can enhance the existing industrial land inventory and foster the preservation of other important industrial sites.
1. Develop a detailed matrix of the current condition of the state’s rail, port, and
multimodal served industrial lands to determine:
a. The quality of these industrial sites in terms of its ability to meet the needs of
existing and emerging businesses in Mississippi
Mississippi Goods Movement and Trade Study Final Report Page-58
Mississippi Goods Movement and Trade Study FINAL REPORT
b. The utility and transportation infrastructure currently serving the site
including treatment capacity and distribution or collection systems or the
estimated cost and time required to extend these services to the site
c. The environmental conditions on the site including evidence of wetlands,
historic properties, endangered species, etc.
d. Rail services currently available at the site including frequency and type of
service or the estimated cost and time required to extend rail services to the
site
e. Access to port facilities currently available at the site or the estimated cost and
time required to provide access to port facilities
f. Workforce availability within a 30-minute drive of the site
g. Property ownership or property control
h. Site acre, topography, zoning, and other property regulations
i. Soils and geotechnical features
j. Educational and Training resources within a 30-minute drive of the site
This matrix will help the state to better understand the existing supply of industrial land throughout the state that has unique freight infrastructure access and whether or not the existing inventory truly meets the needs of existing and emerging businesses that may seek to expand or locate in the state in the future.
2. There is an increased need for industrial land to support the growth in maritime
trade particularly as the Panama Canal improvements are completed. An analysis of industrial land with proximity to existing ports should be conducted. Steps should be taken to preserve industrial sites that are accessible to port facilities where reasonable access to road and utility infrastructure is available. Preservation of industrial land near ports and waterways may be in conflict with residential, recreational, or environmental uses. Care must be taken to develop plans that protect adjacent land uses and the environment.
3. Evaluate options to provide “extra points” for state grant programs to those
communities that coordinate land use planning efforts to ensure that current and future freight and industrial land needs are evaluated and actions taken to identify challenges and opportunities and specific improvement strategies are developed and incorporated into state and federal funding requests.
4. Evaluate development of a new grant program to leverage the preservation and
development of significant multimodal freight-served industrial sites. Detailed evaluation criteria would be developed to ensure that sites competing for these funds truly meet definitive site and multimodal freight requirements as well as other critical factors. This program should be designed to invest in industrial sites that would become economic drivers for businesses and communities throughout the state.
5. Develop a statewide “Economic Development and Freight Council” with
representation from economic development professionals, transportation officials, freight generation businesses, rail and trucking services, and other related
Mississippi Goods Movement and Trade Study Final Report Page-59
Mississippi Goods Movement and Trade Study FINAL REPORT
stakeholders to meet on a biannual basis to discuss issues, opportunities, and strategies to continue to enhance the linkages between economic development and freight in Mississippi
6. Develop a model “Freight and Industrial Facilities Planning Guide” (“good neighbor”
guidelines) to assist planning organizations, municipalities, developers, elected officials, and others by identifying tools and strategies that could be used to address some of the challenges that can be associated with freight and industrial facilities and adjoining land uses. Freight operators, businesses, and local planning organization should be involved in developing this guide. Options to consider include requirements for buffers or transitional zones between freight facilities and sensitive land uses like hospitals and residential development, access and delivery needs should be incorporated into site design standards, strategies to protect undeveloped land adjacent to freight and industrial facilities to provide for future expansion and encroachment of incompatible land uses.
3. Logistics Development Strategies Dramatic changes in global trading have created significant growth in the logistics and distribution sector in recent years. The price of fuel, consumer demands, and other factors has influenced the location of new logistics hubs in Chicago, Dallas, Memphis, Kansas City, and Indianapolis. These major centers are highly dependent upon proximity to approximately 50 million in population within a one-day truck drive, Class I rail facilities, major highways, and intermodal infrastructure. Successful logistics development depends on several key factors:
Population within a one-day truck drive, approximately 275 miles Access to Interstate highways, within 5 miles of interchange Locations where the railroads WANT to stop Proximity to port and rail intermodal facilities Available workforce in materials handling, forklift drivers, truck drivers with reasonable
labor costs Large acreage property with integral access to highways and rail and reasonable site
development costs Incentives for infrastructure and training Positive labor-management relations Proximity to other logistics and distribution hubs Capital resources to acquire, develop, and hold a major property, often requiring in excess
of $150 million
The costs associated with freight and goods movement is often the second highest cost behind labor costs in a logistics and distribution center project. Proximity to customers and markets is critical in the siting of logistics and distribution facilities.
Proximity to a significant regional population base, the Memphis International Airport and the regional rail, highway, and riverports has attracted significant logistics and distribution facilities to DeSoto County. Jackson, Meridian, and Gulfport have also been successful in attracting multi-state and regional logistics and distribution centers in the past few years. As a part of this freight and economic development analysis, the consultant team talked with economic development
Mississippi Goods Movement and Trade Study Final Report Page-60
Mississippi Goods Movement and Trade Study FINAL REPORT
agencies in Jackson, Meridian, DeSoto County, and Gulfport to evaluate options for attracting additional logistics and distribution businesses to the state. Mississippi has an attractive package of incentives that are available to warehouse and distribution centers that locate in the state. These incentives include various tax credits, franchise tax incentives, sales and property tax incentives, a jobs incentive program, and a specialized Growth and Prosperity Program available for specific counties. Outlined below are additional options to enhance logistics and distribution business locations in Mississippi.
1. Develop a “Freight and Goods Movement” training series to help economic
development professionals, local planning agencies, transportation planners, highway
officials, and regional development organizations better understand the requirements
of logistics and distribution businesses and the freight needs and issues of other
businesses as well.
2. Develop and fund a Logistics-Distribution Development Assistance program to
provide specialized funding to assist in the development of strategic regional logistics
parks that can provide the infrastructure, site, and workforce assets to address the ten
key site selection factors identified previously.
3. Form regional Logistics Innovation Councils for each of the six strategic freight
corridors to enhance the growth of existing logistics and distribution businesses
within the region and the state and promote the development of future business
development opportunities. The Councils could facilitate communication and planning
activities between freight, logistics, and distribution businesses; freight providers;
transportation officials; economic development professionals; and freight facilities.
The Councils could identify technologies that could be deployed to improve freight
and goods movements in the state and identify important workforce training needs to
support these industries.
4. Logistics and Distribution Marketing Assistance Program – Identify potential funding
resources to develop new trade show materials, programs to help Mississippi
businesses expand to new markets, support trade missions to key trading nations, and
acquire logistics modeling software.
5. Develop a new program to leverage the deployment of world-class logistics
technologies in the strategic freight corridors to enhance freight and goods movement
and logistics and distribution facilities.
6. Safety and Security Incentives – From fire protection facilities, dual electrical power
systems, lighting and other protection and security systems are increasing concerns
for distribution and warehousing centers. Evaluate the expansion of tax incentives to
cover these systems and inclusion of these systems in grant and loan programs.
Mississippi Goods Movement and Trade Study Final Report Page-61
Mississippi Goods Movement and Trade Study FINAL REPORT
4. Increase Public Understanding of Economic Development and Freight Issues The public does not understand the important role that freight plays in their jobs, the economic well-being of their community, and in many aspects of everyday life. In order for elected officials to support increased investments in freight infrastructure, it will be increasingly important for the taxpayers to understand why these investments are important to them and the real and tangible benefits that result from these investments in performance measures they can relate to.
Education is a key factor in future freight infrastructure funding to clearly establish the link between Mississippi’s freight system, the state’s economy, and community sustainability. Integrating green initiatives and environmental quality into this discussion will help to address social equity and quality community concerns as well.
1. Use the Freight and Economic Development Vision and Strategic Plan as a platform for
discussing economic changes and the evolving needs of the state’s businesses
including freight and transportation needs.
2. Engage the Mississippi Manufacturers Association, the Regional Logistics Innovation
Councils, and other related organizations to develop a public information exchange
with MPOs, RPOs, Planning Organizations, Economic Development Agencies, and
other state, regional, and local groups about the role of freight transportation in the
state and regional economy.
3. Promote the use of clean, green, and smart technologies with freight operators
throughout the state. Create a “Green Goods Movement” award program to recognize
operators who aggressively implement these technologies.
4. Host an annual Freight and Economic Development Stakeholders Roundtable to
improve information exchange and communication about current freight and
economic development issues and opportunities
5. Develop proactive public communication opportunities to “tell the story about
economic development and freight”
6. Monitor the performance of freight service providers to protect the public and the
environment, and increase public awareness of these activities
Funding Impacts of Recommended Strategies If the freight network fails, the economy will fail, it is just that simple. According to a recently released study entitled Unlocking Freight from the American Association of State Highways and Transportation Officials, eight-four percent of the U.S. economy is intrinsically linked to transportation.17 Funding for transportation and freight infrastructure today is a serious problem. Financial resources come from a multiplicity of sources: the private sector, federal, state, local, and regional entities. Projects often take many years to plan, design, and secure the public’s
17 Unlocking Freight, AASHTO, July 2010
Mississippi Goods Movement and Trade Study Final Report Page-62
Mississippi Goods Movement and Trade Study FINAL REPORT
support, complete environmental documentation, fund, and build. Today’s taxpayers want to understand the real benefits of transportation and freight investments, in terms they can relate to and they want to consider options to sustain the environment and address social equity at the same time.
National funding for transportation and freight projects has become very competitive and increasingly scarce. While the recession slowed the dramatic growth for a time the volume of freight is projected to double in the next forty years.18 Output from goods production is projected to continue to increase, the population is anticipated to reach 400 million by 2050, and the volume of freight moved across U.S. borders, currently more than $3.1 trillion per year, will grow as well.
New funding to support investment in Mississippi’s strategic freight corridors is needed to support existing jobs and attract new jobs in emerging industries to the state in the future. A Freight and Economic Development Vision and Action Plan could help to prioritize projects and programs, but ultimately the financial resources must be available to fund needed investments.
1. Evaluate the creation of Transportation Development Districts in Mississippi, a
specialized Tax Increment Financing District where revenues are dedicated to transportation improvements that enhance development and tax base within the district.
2. Evaluate existing enabling legislation that provides the ability for MDOT to facilitate joint financing of freight infrastructure projects through multi-county freight infrastructure authorities or partnerships where these projects could be demonstrated to generate regional economic development benefits.
3. Evaluate public-private partnerships to fund key freight infrastructure improvements including strategies to allow public sector investments in private operations under certain conditions where clear public benefits are generated.
4. Identify high-priority freight infrastructure projects and begin preparing in advance
to develop competitive applications for future rounds of TIGER grant funding for key
Mississippi freight projects.
Conclusions Transportation is the foundation of success for goods movement and trade and thus is critical to jobs and economic development not only in those goods producing industries but also to the growing service sector that helps to support goods production and relies on delivery services, business travel, and employee access to manage their operations. While goods production and trade is important to economic development in the U.S., the movement of goods into the U.S. is important as well. By April of 2010 the U.S. had exported $149 billion in goods and services to other nations and imported $189 billion in foreign goods primarily industrial supplies and materials, capital goods excluding automobiles, and consumer goods.19 Unfortunately, many
18 “Fast Forward: Key Issues in Modernizing the U.S. Freight-Transportation System for Future Economic Growth, Rand Corporation Supply Chain Center, 2009 19 U.S. Department of Commerce, International Trade Statistics 2009
Mississippi Goods Movement and Trade Study Final Report Page-63
Mississippi Goods Movement and Trade Study FINAL REPORT
Americans do not understand this critical link between freight transportation and economic development and thus do not recognize the importance of freight infrastructure relative to their jobs and local economy. The disconnection between the movement of goods and its relationship to jobs and economic development is more than just problematic. To grow our economy and foster the jobs and investment needed for the future, taxpayers must begin to understand the direct linkage between an efficient and reliable freight transportation network and the economic prosperity of their own families, community, and their state. As the domestic economy recovers, Mississippi’s existing freight networks will need to meet new demands; and the transportation needs of Mississippi businesses will change as well. The purpose of the Mississippi Goods Movement and Trade Study is to advance an integrated freight and economic development strategy that carefully considers the transportation and freight infrastructure needs of existing and emerging businesses. This section examines strategies that can enhance economic competitiveness by:
Addressing freight infrastructure needs within regional freight corridors to support regional economic development
Identifying and preserving industrial land with appropriate transportation assets that support existing and emerging businesses
Fostering economic development strategies that enhance the competitiveness of existing and emerging businesses utilizing the freight and transportation infrastructure to their best advantage
Making strategic investments that support and foster a multimodal freight network that will allow Mississippi businesses to compete and prosper in this ever changing economic environment
The MGM&TS analysis clearly demonstrates that economic prosperity in Mississippi is directly linked to the state’s freight infrastructure and transportation services. Businesses today depend upon transportation networks to move goods and people around the world as never before. The freight transportation networks enable Mississippi businesses to efficiently reach new markets and generate quality jobs in the process. Mississippi’s strategic freight corridors include a variety of freight infrastructure serving the needs of the state’s existing industries. The multimodal freight system serving Mississippi includes Gulf Coast and river ports, interstates and highways, Class I and short-line railroads, airports, intermodal facilities, and pipelines. In the future it will be essential for the state’s transportation planners to balance the transportation needs of those existing businesses with the needs of new emerging businesses that will help to generate new jobs and investment for Mississippi’s citizens. Preserving the land needed to support economic development is becoming increasingly challenging. Balancing the needs and demands for competing land uses with the importance of protecting and redeveloping industrial areas for future industrial development is crucial to the
Mississippi Goods Movement and Trade Study Final Report Page-64
Mississippi Goods Movement and Trade Study FINAL REPORT
long term economic success of Mississippi. Maintaining and enhancing reliable multimodal freight transportation options for industrial areas is equally important to economic development.
As communities along the strategic freight corridors continue to grow and develop, land with access to rail and other multimodal freight infrastructure will diminish. Often, un-regulated development patterns in these communities can result in deteriorating performance on the multimodal freight network as well. Therefore, as the availability of land that can be directly linked to freight infrastructure declines, it becomes even more important to identify and preserve remaining sites and to identify opportunities to redevelop existing industrial sites that no longer serve their highest and best use.
Preserving and developing freight intensive industrial sites within developing communities can be a challenge. Community concerns about the adverse impacts from freight facilities and industrial operations include noise, emissions, light leakage, traffic congestion, perceived reduction in property values, and poor quality development. These impacts can be reduced or avoided with appropriate freight planning and design standards. And the industries that require access to freight infrastructure are changing. Today, many of these industries are characterized as light industrial or distribution operations rather than the heavy industrial users that often located along rail lines or near ports in the past. It is possible with appropriate planning, education, and development standards to develop business parks with freight infrastructure and protect the surrounding land uses. The economic prosperity of Mississippi depends upon the business and industry within the state and their requirements for labor, land, transportation, utilities, and other services. Understanding the critical factors that influence a company’s decision in selecting a location for a new facility or business expansion is a quintessential economic development activity. Many unique factors influence a business’s decision to locate or expand a facility in one state over another. Over the years industrial site evaluation factors have evolved to reflect the ever changing demands of businesses and the increasingly global marketplace. To help business leaders, economic developers, real estate investors, and governments better understand site location trends; a corporate site location survey has been conducted annually for the past 24 years by the Area Development Site and Facility Planning Journal.20 This study of the key factors that are currently driving business location decisions evaluates operational factors, financial considerations, and site issues to identify the primary considerations of private companies engaged in the site selection decision making process.
The Corporate Site Survey covers companies in a broad range of sectors including transportation equipment, medical and scientific instruments, electrical equipment and components, food, warehouse and distribution, and pharmaceuticals. A significant percentage of the 2010 survey respondents represented manufacturing and distribution operations. Historically, two factors have ranked at the very top of this survey, labor costs and highway accessibility. Labor costs were the number one factor impacting site selection decisions in the Corporate Site Survey this year followed by highway accessibility which ranked number one in the prior year’s survey. Sites that lack good transportation accessibility for customers, suppliers, and employees are frequently eliminated from consideration by many companies. The efficient movement of freight is a major influencing factor to site selection. Ten of the twenty-six site
20
“24th Annual Corporate Survey” Area Development Journal Site and Facilities Planning, January, 2010
Mississippi Goods Movement and Trade Study Final Report Page-65
Mississippi Goods Movement and Trade Study FINAL REPORT
selection factors ranked as the most important factors to today’s businesses relate to the movement of goods and people. The freight and transportation factors considered most important in the 2010 Corporate Site Selection survey include:
Highway Accessibility Availability (accessibility) of skilled labor Inbound/outbound shipping costs Proximity (accessibility) to major markets Proximity (accessibility) to suppliers Availability (accessibility) of unskilled labor Accessibility to major airports Railroad service Waterway or ocean port accessibility
These freight and transportation factors, along with other competitive conditions, will influence the site decisions that businesses make in the future when locating new business operations, expanding existing facilities, or consolidating operations. While freight transportation alone will not foster economic growth, improved freight services and connectivity, multimodal transportation services, and competitive costs can significantly differentiate the state’s economic environment by creating new opportunities to attract and retain businesses and jobs in the future. There are many emerging industry sectors that have been identified for the purpose of this study. The following text will evaluate emerging and targeted business sectors. One of the quickest growth industry sectors is technological manufacturing. Governor Haley Barbour recently announced the location of a new solar panel manufacturing facility in Senatobia, Mississippi on the Southaven-McComb Corridor. Twin Creeks Technologies will create 512 new jobs and invest more than $175 million in Tate County over the next five years. The company, headquartered in San Jose, CA, has over 50 patents and their innovative manufacturing processes are revolutionizing the production of crystalline silicon photovoltaic solar panels.
Mississippi also has become a growth center for geospatial technology industries. In 2008 Mississippi geospatial companies employed 742 people growing by over eight percent over the previous year. Revenues for this emerging cluster grew to over $102 million with average annual salaries over $56,000.21 Growth in this emerging sector in Mississippi is attributed to the state programs that support geospatial research and entrepreneurship, the presence of Stennis Space Center, the multidisciplinary facility at the Space Center including NASA and other federal agencies that are engaged in space and environmental programs, and a business climate that fosters and supports geospatial technology and innovation.
New technology and new industry clusters such as biotechnology, optoelectronics, flexible manufacturing, advanced materials, aerospace, and computer software continue to be important to trade and employment nationally and in Mississippi. The site selection criteria for these emerging industries must support their specialized needs and provide access to the end users of products and services. The transportation needs of these emerging businesses must continue to
21 Enterprise for Innovative Geospatial Solutions
Mississippi Goods Movement and Trade Study Final Report Page-66
Mississippi Goods Movement and Trade Study FINAL REPORT
be evaluated to ensure that Mississippi’s transportation assets can continue to meet the needs of the emerging business and industry in the state.
Targeted emerging industry sectors in Mississippi include biotechnology, health and medical services and devices, advanced manufacturing, energy and alternative fuels, and transportation. The Mississippi Development Authority has identified fourteen targeted emerging growth sectors that build on the state’s strengths. Ten of those fourteen targeted sectors are highly dependent on competitive goods movement. Those targeted sectors are:
Aerospace/Aviation Automotive Assembly and Supply Defense and Homeland Security Food Processing Chemicals/Polymers/Plastics Shipbuilding Timber and Wood Products Warehouse and Distribution Metal Fabrication and Steel Communication and Information, and Technology
All of the existing and emerging industry sectors identified in this report depend on a multimodal transportation system. Trucking constitutes the most significant transportation expenditure for all industries, indicating that efficient highway linkages are essential for meeting the freight needs of all industries. The transportation networks that serve the Mississippi study area today were initially developed to service those businesses that were the early foundation of the area’s economy, natural resource industries and manufacturing. These and other freight-intensive industries in the region move significant volumes of goods and materials. However, the value of outbound commodity flows suggest that the freight-intensive sectors that play an important role in the economic vitality of the Mississippi study area are Chemicals, Nonmetallic Minerals, Wood Products, Petroleum or Coal Products, and Secondary Traffic. These commodities are expected to both dominate future freight movement in the corridors and be more reliant on road transport as compared to other transportation modes. Analysis indicates that the Mississippi study area provides unique competitive advantages that support the continued expansion and growth of a number of other strategic business sectors including: Aerospace and Aviation, Automotive Assembly and Supply, Food Processing, Metal Fabrication, and Chemical/Plastics Manufacturing. The transportation needs for these types of businesses differ from the more traditional industries in the region. Although transportation costs are always a factor, the transportation demands for these businesses are often driven by delivery schedules, reliability, and protecting the integrity of the products (product damage). The emphasis on reliability and supply chain management is a crucial business strategy for companies who seek to extract value and thus competitive advantage through distribution.
Mississippi Goods Movement and Trade Study Final Report Page-67
Mississippi Goods Movement and Trade Study FINAL REPORT
Therefore, future investments in freight transportation infrastructure in Mississippi must balance the needs of more traditional industries with the transportation requirements of emerging economic growth sectors in the region. The concept of corridor trade development really centers on taking the best of what exists and using it to expand state and regional opportunities. The expanded economic development is what will lead to the higher volume of freight and goods movement in more concentrated lanes helping to foster a more cost effective and robust environment for business.