august 10, 2017 toshiba corporation for …...during fy2016(april 2016-march 2017, the) us economy...
TRANSCRIPT

August 10, 2017 Toshiba Corporation
FOR IMMEDIATE RELEASE
Toshiba Announces Consolidated Results for Fiscal Year 2016, to March 31, 2017
TOKYO--Toshiba Corporation (TOKYO: 6502) (the “Company”) today announced its consolidated results for fiscal year (FY) 2016, to March 31, 2017. All comparisons in the following are based on the same period a year earlier, unless otherwise stated.
1. Overview of Consolidated Results for FY2016(April 2016 – March 2017)
(Yen in billions) FY2016 Change from FY2015
Net sales 4,870.8 -284.0 Operating income (loss) 270.8 753.8 Income (loss) from continuing operations, before income taxes and noncontrolling interests
225.5 624.9
Net income (loss) attributable to shareholders of the Company
-965.7 -505.7
During FY2016 (April 2016-March 2017), the US economy generally saw solid growth and the Eurozone economy saw moderate growth, primarily in Germany. The Chinese economy slowed slightly, reflecting adjustments to production and investment in the coal and steel industries, though consumer consumption saw firm growth. In international financial markets, there was a sharp decline in the UK pound, the result of the Brexit referendum in June, while the US saw a stronger dollar and a rise in stocks prices following Donald Trump’s election to the presidency in November.
The Japanese economy saw firm growth in overall consumer spending, due to an improved employment and income environment. It also saw recoveries in capital investments and in previously flat export levels.
In FY2017 (April 2017-March 2018), the overall global economy is expected to see accelerated growth, as the US economy is expected to continue to expand, the Eurozone economy is expected to see moderate growth, and China’s economy is expected to see a higher growth rate. The forecast for the Japanese economy indicates a growth rate of 1 to 2%.

2
In these circumstances, Toshiba Group, working toward regaining stakeholder trust, has dedicated itself to “eliminating risk related to the overseas nuclear power business,” “swiftly recovering and strengthening the financial base,” and “strengthening the Group’s organizational management.” In “eliminating risk related to the overseas nuclear power business,” Westinghouse Electric Company (Westinghouse), its U.S. subsidiaries and Toshiba Nuclear Energy Holdings (UK) Limited, a holding company for Westinghouse group operating companies outside the U.S., all filed for Chapter 11 proceedings under the U.S. Bankruptcy Code on March 29, 2017 (in the U.S.). These filings deconsolidated Westinghouse Group from Toshiba Group, starting from FY2016 full-year business results, and the financial results of Westinghouse Group are now classified as discontinued operations in Toshiba’s consolidated profit and loss statement. Reflecting Westinghouse Group deconsolidation, Toshiba Group’s net sales decreased by 284.0 billion yen to 4,870.8 billion yen (US$43,489.0 million). Although the Company recorded higher sales in Memories and HDDs, there were also impacts from yen appreciation and the shrinking scale of the PC and TV businesses due to restructuring. As a result of the impact of one-time expenses recorded in the previous fiscal year, such as asset write-downs, restructuring costs and provision for unprofitable projects, plus the effect of continued emergency measures, including bonus reductions, all business segments except Nuclear Power System recorded improvement, and the Group recorded consolidated operating income of 270.8 billion yen (US$2,417.8 million), an increase of 753.8 billion yen. Income (loss) from continuing operations, before income taxes and noncontrolling interests, increased by 624.9 billion yen to 225.5 billion yen (US$2,013.7 million). Net income (loss) attributable to shareholders of the Company decreased by 505.7 billion yen to -965.7 billion yen (-US$8,622.0 million), due to recording the loss related to Westinghouse Group’s Chapter 11 filings in the loss from discontinued operations

3
Consolidated Results for FY2016, by Segment (Yen in billions)
Net sales Operating income
(loss) Change* Change* Energy Systems & Solutions 974.9 -86.4 -8% -41.7 +79.1 Infrastructure Systems & Solutions 1,262.4 -90.5 -7% 58.4 +65.8 Retail & Printing Solutions 507.7 -37.2 -7% 16.3 +101.0 Storage & Electronic Devices Solutions
1,700.2 +124.3 +8% 247.0 +347.0
Industrial ICT Solutions 238.4 -18.4 -7% 11.6 +2.9 Others 530.1 -265.9 -33% -21.7 +160.3 Eliminations -342.9 +90.1 - 0.9 -2.3 Total 4,870.8 -284.0 -6% 270.8 +753.8
(*Change from the year-earlier period) Energy Systems & Solutions: Lower Sales and Improved Operating Income (Loss) The Energy Systems & Solutions segment saw lower sales. Although Thermal & Hydro Power Systems recorded higher sales, Nuclear Power Systems, Transmission & Distribution Systems and Landis+Gyr, recorded lower sales. The segment as a whole saw significantly improved operating income. Although Nuclear Power Systems recorded deteriorated operating income, Thermal & Hydro Power Systems, Transmission & Distribution Systems and Landis+Gyr recorded significant operating income. Infrastructure Systems & Solutions: Lower Sales and Higher Operating Income The Infrastructure Systems & Solutions segment saw lower sales as sales decreased in all businesses. The segment as a whole saw notably higher operating income, as all businesses recorded significantly higher operating income. Retail & Printing Solutions: Lower Sales and Higher Operating Income The Retail & Printing Solutions segment saw lower sales on the impact of the currency exchange rate, although the Retail business itself performed well. The segment as a whole saw a major increase in operating income, as the Retail business improved profitability and moved into the black. The previous term included asset impairment in the overseas business, which resulted in negative operating income. Storage & Electronic Devices Solutions: Higher Sales and Higher Operating Income
4
The Storage & Electronic Devices Solutions segment saw higher sales. HDDs recorded notably higher sales and Memories also recorded higher sales. The segment as a whole saw a significant rise in operating income, as all businesses recorded significantly higher sales. Industrial ICT Solutions: Lower Sales and Higher Operating Income The Industrial ICT Solutions segment saw lower sales, as system sales to manufacturers declined. Operating income for the segment as a whole was higher due to the implementation of emergency measures and actions to improve profitability. Others: Lower Sales and Improved Operating Income Notes: Toshiba Group’s Consolidated Financial Statements are based on U.S. generally accepted accounting principles (“GAAP”). Operating income (loss) is derived by deducting the cost of sales and selling, general and administrative expenses and any losses on impairment of goodwill from net sales. This result is regularly reviewed to support decision-making in allocations of resources and to assess performance. Certain operating expenses, such as restructuring charges, litigation settlement and other costs, are not included in it. The Healthcare Systems & Services segment, Home Appliances business and Westinghouse’s Nuclear Power business are classified as discontinued operations in accordance with Accounting Standards Codification 205-20 "Presentation of Financial Statements – Discontinued Operations" The results of these businesses have been excluded from net sales, operating income (loss), and income (loss) from continuing operations, before income taxes and noncontrolling interests. Net income of Toshiba Group is calculated by reflecting results of these businesses to income (loss) from continuing operations, before income taxes and noncontrolling interests. In addition, these businesses are also classified as discontinued operations for the Group’s consolidated balance sheets and are indicated separately. Results of the previous fiscal year have been revised to reflect these changes. The data relating to consolidated segment information is presented in conformity with the current organizational classification.
From this fiscal year, expenses such as basic R&D expenses previously allocated to “Corporate and Eliminations,” and partial profit and loss previously allocated to each segment, are now included in the “Others” segment. The Westinghouse group which are deconsolidated from Toshiba Group are described as "Westinghouse Group". Qualitative data herein are compared with the same period of the previous year, unless otherwise noted.

5
Performance Forecast for FY2017 and Explanation on Future Estimate Information The consolidated forecast for FY2017 is shown below.
(Yen in billions)
FY2017 Forecast
Net sales 4,970.0 Operating income (loss) 430.0 Income (Loss) from continuing operations, before income taxes and noncontrolling interests
400.0
Net income (loss) attributable to shareholders of the Company
230.0
2. Financial Position of FY2016
i. Assets, Liabilities and Net Assets Total assets decreased by 1,163.8 billion yen from the end of March 2016, to 4,269.5
billion yen (US$38,120.7 million). As a result of a significant decrease in retained earnings due to the impact of
Westinghouse Group’s Chapter 11 filings, shareholders’ equity, or equity attributable to the shareholders of the Company, was -552.9 billion yen (-US$4,937.0 million), a decrease of 881.8 billion yen from the end of March 2016. Total interest-bearing debt decreased by 237.7 billion yen from the end of March
2016 to 1,203.8 billion yen (US$10,748.2 million). As a result of the foregoing, the shareholders’ equity ratio at the end of March 2017
was -13.0%, a 19.1-point decrease from the end of March 2016. Free cash flow decreased by 697.0 billion yen to -44.8 billion yen (-US$399.7
million).
ii. Trend in main indices Mar. End
2013 Mar. End
2014 Mar. End
2015 Mar. End
2016 Shareholders’ equity ratio (%) 16.6 17.1 6.1 -13.0
Equity ratio based on market value (%)
30.0 33.7 17.1 23.9
Cash flow to interest-bearing debt ratio (multiples)
5.0 4.1 - 9.9
Interest coverage ratio (multiples) 8.4 11.7 - 6.3

6
Notes: Shareholders’ equity ratio: Shareholders’ equity divided by total assets Equity ratio based on market value: Market capitalization divided by total assets Market capitalization is calculated by multiplying the closing stock price at the end of the relevant period by the number of shares issued, excluding shares owned by the Company. Cash flow to interest-bearing debt ratio: Debt (average of the beginning and end of the term) divided by net cash provided by operating activities Interest coverage ratio: Cash flow from operating activities divided by interest payments
3. Basic dividend policy, dividend for FY2016 and outlook for FY2017
Toshiba, while giving full consideration to such factors as the strategic investments necessary to secure medium- to long-term growth, seeks to achieve continuous increases in its actual dividend payments, in line with a payout ratio in the region of 30%, on a consolidated basis.
In light of the Group’s current management environment, financial position and other factors, Toshiba has decided, with regret, not to pay interim or full-year dividends for FY2016. The Company will announce the dividend for FY2017 as soon as it is determined.
4. Important Factors as a Going Concern Toshiba Group recorded a net loss attributable to shareholders of the Company of 965.7
billion yen (US$8,622.0 million), due to loss of 1,242.8 billion yen (US$11,096.3 million) generated in Westinghouse, its U.S. subsidiaries and affiliates, and Toshiba Nuclear Energy Holdings(UK) Limited (TNEH(UK)), a holding company for Westinghouse Group operating companies outside the U.S. (collectively, the “Filing Companies”). A net loss attributable to shareholders of the Company of 460.0 billion yen was recorded in FY2015. As a result, consolidated equity attributable to shareholders of the Company decreased to -552.9 billion yen (-US$4,937.0 million), with consolidated net assets of -275.7 billion yen (-US$2,461.6 million) as of March 31, 2017.
In connection with this, on December 28, 2016, the rating agencies downgraded Toshiba(the Company)’s credit rating causing a breach of financial covenants in outstanding syndicated loans of 257.7 billion yen (US$2,300.5 million) arranged by the Company’s main financial institutions (include in “the Short-term borrowings and current portion of long-term debt” in the consolidated balance sheet). The total syndicated loans is recorded as a part of Toshiba Group’s total short-term and long-term borrowings of 1,203.8 billion yen (US$10,748.2 million) in consolidated balance sheet

7
as of March 31, 2017. These loans are callable at any dates by the financial institutions as of the filing date. If these loans are called in, other bonds and certain borrowings would become callable.
Taking into consideration of the expenditures which the Company may pay related to nuclear power construction by Westinghouse, its U.S. subsidiaries and affiliates, the Company’s liquidity will be significantly impacted.
In addition to the foregoing, the Company operates the business that require a Special Construction Business License from the Japanese government. The Company is required to meet a certain financial criteria in order to renew this license. The Company’s current Special Construction Business License expires in December 2017. If the Company does not take any counter action to improve financial condition, and if the Company is unable to meet the criteria and to renew the license, there will be extremely negative impact on business execution.
For the reasons stated above, there are material events and conditions that raise the substantial doubt about the Company’s ability to continue as a going concern.
For measures Toshiba proposes to implement toward resolving this situation, please
refer to “Notes Relating to Assumptions for the Going Concern.” Basic Policy for the Selection of an Accounting Standard Toshiba Group began preparing consolidated financial statements based on US GAAP before the consolidated financial statement system was introduced into Japan, and has continued to use US GAAP for its financial statements. Toshiba Group plans to voluntarily implement International Financial Reporting Standards (IFRS) for the purpose of strengthening financial governance, however, the timing of implementation is under consideration. Disclaimer: This report of business results contains forward-looking statements concerning future plans, strategies and performance of Toshiba Group. These statements are based on management’s assumptions and beliefs in light of the economic, financial and other data currently available. Since Toshiba Group is promoting business under various market environments in many countries and regions, they are subject to a number of their risks and uncertainties. Toshiba therefore wishes to caution readers that actual results might differ materially from expectations. Major risk factors that may have a material influence on results are indicated below, though this list is not necessarily exhaustive. Major disasters, including earthquakes and typhoons; Disputes, including lawsuits, in Japan and other countries; Success or failure of alliances or joint ventures promoted in collaboration with other

8
companies; Success or failure of new businesses or R&D investment; Changes in political and economic conditions in Japan and abroad; unexpected
regulatory changes; Rapid changes in the supply and demand situation in major markets and intensified
price competition; Significant capital expenditure for production facilities and rapid changes in the
market; Changes in financial markets, including fluctuations in interest rates and exchange
rates. Note: For convenience only, all dollar figures used in reporting fiscal year 2016 results are valued at 112 yen to the dollar.
# # #

Consolidated
9
Toshiba Group
Consolidated Financial StatementsFor Fiscal Year 2016 (April 1, 2016 to March 31, 2017)
Outline(\ in billions, US$ in millions, except for earnings per share)
Years ended March 31
2017(A) 2016(B) (A)-(B) (A)/(B) 2017
Net sales ¥4,870.8 ¥5,154.8 ¥(284.0) 94% $43,489.0
Operating income (loss) 270.8 (483.0) 753.8 - 2,417.8
Income (Loss) from continuing operations, before income taxes and noncontrolling interests
225.5 (399.4) 624.9 - 2,013.7
Net loss attributable to shareholders of the Company (965.7) (460.0) (505.7) - (8,622.0)
Basic losses per share attributable to shareholders of the Company
¥(228.08) ¥(108.64) ¥(119.44) $(2.04)
Notes: 1) Consolidated Financial Statements are based on generally accepted accounting principles in the U.S.2) The U.S. dollar is valued at ¥112 throughout this statement for convenience only.

Consolidated
10
Comparative Consolidated Balance Sheets
(\ in millions, US$ in thousands)
2017(A) 2016(B) (A)-(B) 2017AssetsCurrent assets ¥2,736,293 ¥3,828,558 ¥(1,092,265) $24,431,188
Cash and cash equivalents 707,693 945,109 (237,416) 6,318,688
1,122,236 1,080,465 41,771 10,019,964
Inventories 624,321 662,913 (38,592) 5,574,295
Prepaid expenses and other current assets 282,043 325,563 (43,520) 2,518,241
- 814,508 (814,508) -
Long-term receivables 15,272 10,039 5,233 136,357
386,401 413,570 (27,169) 3,450,009
Property, plant and equipment 657,876 680,496 (22,620) 5,873,893
Other assets 473,671 500,678 (27,007) 4,229,205
Total assets ¥4,269,513 ¥5,433,341 ¥(1,163,828) $38,120,652
Current liabilities ¥2,718,403 ¥3,225,012 ¥(506,609) $24,271,455
685,625 619,414 66,211 6,121,652
730,900 808,940 (78,040) 6,525,893
1,301,878 1,206,954 94,924 11,623,910
Liabilities of discontinued operations - current - 589,704 (589,704) -
Accrued pension and severance costs 531,164 559,256 (28,092) 4,742,536
Long-term debt and other liabilities 1,295,650 976,815 318,835 11,568,304
(275,704) 672,258 (947,962) (2,461,643)
Equity attributable to shareholders of the Company (552,947) 328,874 (881,821) (4,937,027)
Common stock 200,000 439,901 (239,901) 1,785,714
Additional paid-in capital 140,144 399,470 (259,326) 1,251,286
Retained earnings (580,396) (76,782) (503,614) (5,182,107)
Accumulated other comprehensive loss (310,750) (431,828) 121,078 (2,774,554)
Treasury stock (1,945) (1,887) (58) (17,366)
Equity attributable to noncontrolling interests 277,243 343,384 (66,141) 2,475,384
¥4,269,513 ¥5,433,341 ¥(1,163,828) $38,120,652
Breakdown of accumulated other comprehensive lossUnrealized gains on securities ¥24,537 ¥23,655 ¥882 $219,080 Foreign currency translation adjustments (55,468) (91,906) 36,438 (495,250)Pension liability adjustments (277,002) (357,962) 80,960 (2,473,232)Unrealized losses on derivative instruments (2,817) (5,615) 2,798 (25,152)
Total interest-bearing debt ¥1,203,796 ¥1,441,534 ¥(237,738) $10,748,179
Total liabilities and equity
Equity
Short-term borrowings and current portion of long-term debt
Years ended March 31
Liabilities and equity
Investments
Notes and accounts receivable, trade
Notes and accounts payable, trade
Assets of discontinued operations - current
Other current liabilities
Consolidated
11
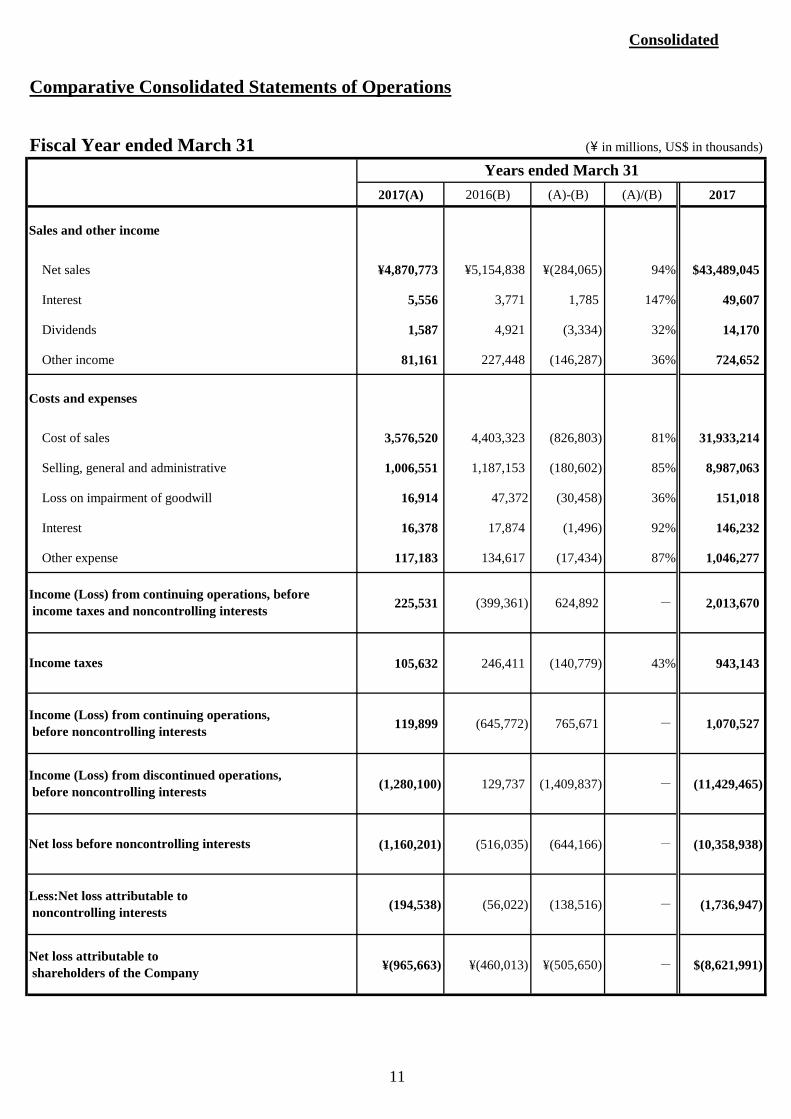
Comparative Consolidated Statements of Operations
Fiscal Year ended March 31 (\ in millions, US$ in thousands)
2017(A) 2016(B) (A)-(B) (A)/(B) 2017
Net sales ¥4,870,773 ¥5,154,838 ¥(284,065) 94% $43,489,045
Interest 5,556 3,771 1,785 147% 49,607
Dividends 1,587 4,921 (3,334) 32% 14,170
Other income 81,161 227,448 (146,287) 36% 724,652
Cost of sales 3,576,520 4,403,323 (826,803) 81% 31,933,214
Selling, general and administrative 1,006,551 1,187,153 (180,602) 85% 8,987,063
Loss on impairment of goodwill 16,914 47,372 (30,458) 36% 151,018
Interest 16,378 17,874 (1,496) 92% 146,232
Other expense 117,183 134,617 (17,434) 87% 1,046,277
225,531 (399,361) 624,892 - 2,013,670
105,632 246,411 (140,779) 43% 943,143
119,899 (645,772) 765,671 - 1,070,527
(1,280,100) 129,737 (1,409,837) - (11,429,465)
(1,160,201) (516,035) (644,166) - (10,358,938)
(194,538) (56,022) (138,516) - (1,736,947)
¥(965,663) ¥(460,013) ¥(505,650) - $(8,621,991)
Income (Loss) from discontinued operations, before noncontrolling interests
Net loss before noncontrolling interests
Less:Net loss attributable to noncontrolling interests
Net loss attributable to shareholders of the Company
Years ended March 31
Sales and other income
Costs and expenses
Income (Loss) from continuing operations, before income taxes and noncontrolling interests
Income taxes
Income (Loss) from continuing operations, before noncontrolling interests

Consolidated
12
Comparative Consolidated Statements of Comprehensive Income
112
Fiscal Year ended March 31 (\ in millions, US$ in thousands)
2017(A) 2016(B) (A)-(B) (A)/(B) 2017
Net loss before noncontrolling interests ¥(1,160,201) ¥(516,035) ¥(644,166) - $(10,358,938)
Unrealized gains (losses) on securities 974 (106,947) 107,921 - 8,696
Foreign currency translation adjustments 43,010 (101,585) 144,595 - 384,018
Pension liability adjustments 84,116 (118,908) 203,024 - 751,036
Unrealized gains (losses) on derivative instruments 2,727 (7,973) 10,700 - 24,348
Total other comprehensive income (loss) 130,827 (335,413) 466,240 - 1,168,098
(1,029,374) (851,448) (177,926) - (9,190,840)
(184,789) (98,930) (85,859) - (1,649,902)
¥(844,585) ¥(752,518) ¥(92,067) - $(7,540,938)
Years ended March 31
Other comprehensive income (loss), net of tax
Comprehensive loss
Less:Comprehensive loss attributable to noncontrolling interests
Comprehensive loss attributable to shareholders of the Company

Consolidated
13
Comparative Consolidated Statements of Cash Flows
(\ in millions, US$ in thousands)
Cash flows from operating activities
¥(1,160,201) ¥(516,035) ¥(644,166) $(10,358,938)
Depreciation and amortization 162,975 213,869 (50,894) 1,455,134
Equity in losses of affiliates, net of dividends 2,963 33,778 (30,815) 26,455
Decrease in notes and accounts receivable, trade 17,419 157,576 (140,157) 155,527
Decrease in inventories 31,563 167,432 (135,869) 281,813
Decrease in notes and accounts payable, trade (26,594) (271,785) 245,191 (237,446)
Others 1,106,038 213,935 892,103 9,875,339
1,294,364 514,805 779,559 11,556,822
134,163 (1,230) 135,393 1,197,884
Cash flows from investing activities
52,089 206,606 (154,517) 465,080
Acquisition of property, plant and equipment (158,756) (242,019) 83,263 (1,417,464)
Acquisition of intangible assets (21,979) (49,446) 27,467 (196,241)
Purchase of securities (1,265) (1,410) 145 (11,294)
(Increase) decrease in investments in affiliates (27,753) 104,493 (132,246) (247,795)
Others (21,265) 635,218 (656,483) (189,866)
Net cash provided by (used in) investing activities (178,929) 653,442 (832,371) (1,597,580)
Cash flows from financing activities
Proceeds from long-term debt 45,870 3,106 42,764 409,553
Repayment of long-term debt (218,366) (215,076) (3,290) (1,949,696)
Increase (decrease) in short-term borrowings, net (37,421) 391,363 (428,784) (334,116)
Dividends paid (12,754) (31,848) 19,094 (113,875)
Others 2,913 (11,798) 14,711 26,009
Net cash provided by (used in) financing activities (219,758) 135,747 (355,505) (1,962,125)
(3,312) (11,796) 8,484 (29,571)
Net increase (decrease) in cash and cash equivalents (267,836) 776,163 (1,043,999) (2,391,392)
Cash and cash equivalents at beginning of the year 975,529 199,366 776,163 8,710,080
Cash and cash equivalents at end of the year 707,693 975,529 (267,836) 6,318,688
Less: Cash and cash equivalents of discontinued operations at end of the year - 30,420 (30,420) -
Cash and cash equivalents of continuing operations at end of the year ¥707,693 ¥945,109 ¥(237,416) $6,318,688
Net cash provided by (used in) operating activities
Effect of exchange rate changes on cash and cash equivalents
2017(A)
Years ended March 3120172016(B) (A)-(B)
Adjustments to reconcile net loss before noncontrolling interests to net cash provided by (used in) operating activities
Net loss before noncontrolling interests
Proceeds from sale of property, plant and equipment, intangible assets and securities

14
Notes Relating to Assumptions for the Going Concern Toshiba Group recorded a net loss attributable to shareholders of the Company of 965,663million yen (US$8,622.0 million), due to loss of 1,242,789 million yen (US$11,096.3 million) generated in Westinghouse Electric Company (WEC), WEC’s U.S. subsidiaries and affiliates, and Toshiba Nuclear Energy Holdings(UK) Limited (TNEH(UK)), a holding company for Westinghouse Group operating companies outside the U.S. (collectively, the “Filing Companies”). A net loss attributable to shareholders of the Company of 460,013 million yen was recorded in FY2015. As a result, consolidated equity attributable to shareholders of the Company decreased to -552,947 million yen (-US$4,937.0 million), with consolidated net assets of -275,704 million yen (-US$2,461.6 million) as of March 31, 2017. In connection with this, on December 28, 2016, the rating agencies downgraded Toshiba(the Company)’s credit rating causing a breach of financial covenants in outstanding syndicated loans of 257,661 million yen (US$2,300.5 million) arranged by the Company’s main financial institutions (include in “the Short-term borrowings and current portion of long-term debt” in the consolidated balance sheet). The total syndicated loans is recorded as a part of Toshiba Group’s total short-term and long-term borrowings of 1,203,796 million yen (US$10,748.2 million) in consolidated balance sheet as of March 31, 2017. These loans are callable at any dates by the financial institutions as of the filing date. If these loans are called in, other bonds and certain borrowings would become callable. Taking into consideration of the expenditures which the Company may pay related to nuclear power construction by WEC, WEC’s U.S. subsidiaries and affiliates, the Company’s liquidity will be significantly impacted. In addition to the foregoing, the Company operates the business that require a Special Construction Business License from the Japanese government. The Company is required to meet a certain financial criteria in order to renew this license. The Company’s current Special Construction Business License expires in December 2017. If the Company does not take any counter action to improve financial condition, and if the Company is unable to meet the criteria and to renew the license, there will be extremely negative impact on business execution. For the reasons stated above, there are material events and conditions that raise the substantial doubt about the Company’s ability to continue as a going concern.

15
As part of the Company’s plan to offset the negative impact of the ongoing situation, the Company has been reviewing a restructuring plan of Westinghouse Group including deconsolidation by a potential sale of a majority stake in order to eliminate risk in the overseas nuclear power business. Then, the Filing Companies have filed for a voluntary petition under Chapter 11 of the U.S. Bankruptcy Code on March 29, 2017(U.S. time) with the U.S. Bankruptcy Court of New York. In order to rebuild Westinghouse Group, the Company recognizes that it is essential that the Filing Companies and its customers, including the power utility companies, should be provided with appropriate coordination, under the guidance of the court. In addition, deconsolidation of Westinghouse Group (WEC Group) as a result of the Chapter 11 filing on March 29, 2017 would meet Toshiba Group’s objective to eliminate risks in the overseas nuclear power business. Relating to the above, the Company and the owners of a project in Georgia, U.S.A., for the construction of two nuclear power plants with Westinghouse AP1000 reactors reached an agreement that sets the limit of Toshiba’ parent company guarantee obligation at US$3.68 billion(412.9 billion yen) (“maximum limit”), and that specifies that payments to Southern Company(the parent company of Georgia Power Company) are to be made in installments during the period from October 2017 to January 2021. This agreement was signed in the United States on June 9, 2017. The Company and the owners of a project in South Carolina, U.S.A., for the construction of two nuclear power plants with Westinghouse AP1000 reactors reached an agreement that sets the limit of Toshiba’ parent company guarantee obligation at US$2.168 billion(243.2 billion yen) (“maximum limit”). The agreement, which was signed in the U.S. on July 27, 2017, also specifies that payments to SCANA Corporation (the parent company of South Carolina Electric & Gas Company) are to be made in installments during the period from October 2017 to September 2022. The maximum limit of Toshiba’s guarantees for all four nuclear power reactors of the U.S. nuclear power construction projects have been definitively determined, and Toshiba has now eliminated the risk of additional payment related to its parent company guarantee. These agreements specify that the agreed maximum limit shall not be subject to any subsequent increase or to any further claims against Toshiba, even in the event of future increases in construction costs. Moreover, the Company is contemplating actions that include, but are not limited to, a potential sale of all or a majority stake in the Memory Business (the Transferred business). The Company was in the progress of transferring the assets and liabilities of this business into a newly formed company to create a more agile structure, that will allow for speedy management decisions in the Transferred business. It is anticipated that the result of this transaction will allow the Company to secure repayment of borrowing to the financial

16
institutions, rebuild capital and recover consolidated equity attributable to shareholders of the Company. To implement the sale smoothly, the Company received approval of the absorption-type company split agreement relating to the Company split between the Company and Toshiba Memory Corporation, which took over the Transferred business, on the effective date of April 1, 2017 in extraordinary shareholder’s meeting held on March 30, 2017. The Company decided to give a preferred negotiation right to Innovation Network Corporation of Japan, Bain Capital Private Equity LP, and Development Bank of Japan(“the Consortium”) in board of director’s meeting held on June 21, 2017. The Company is aiming to sell the stake by the end of March, 2018, after necessary procedures like final agreement with potential candidate and screening based on competition law. Additionally, while reviewing significance of the assets without exceptions, Toshiba Group will attempt to improve the Company’s financial condition by steadily executing a business plan that mainly focus on the social infrastructure business. The Company will also provide explanations to the financial institutions faithfully and will ask sincerely for them to forfeit profits at due date and a renewal or enlarged access of the commitment line agreement (680 billion yen). In addition, the Company will take every measures such as absorption-type company split which the licensed companies take over the business to renew the Special Construction Business License from the Japanese government in conjunction with the countermeasure mentioned above. Although Toshiba Group is examining the details of the aforementioned countermeasures at the present time, substantial doubt about the Company’s ability to continue as a going concern exists as of the filing date. The consolidated financial statements are prepared with an assumption of a going concern and do not reflect the impact of material uncertainty concerning the assumption of a going concern in the consolidated financial statements.

Consolidated
17
Industry Segment Information112
Fiscal Year ended March 31 (\ in millions, US$ in thousands)
2017(A) 2016(B) (A)-(B) (A)/(B) 2017
¥974,913 ¥1,061,345 ¥(86,432) 92% $8,704,580 (19%) (19%) (-)
1,262,412 1,352,855 (90,443) 93% 11,271,536 (24%) (24%) (-)
507,694 544,891 (37,197) 93% 4,532,982 (10%) (10%) (-)
1,700,220 1,575,876 124,344 108% 15,180,536 (33%) (28%) (5%)
238,413 256,778 (18,365) 93% 2,128,688 (5%) (5%) (-)
530,063 796,097 (266,034) 67% 4,732,705 (9%) (14%) (-5%)
5,213,715 5,587,842 (374,127) 93% 46,551,027 (100%) (100%)
Energy Systems & Solutions ¥(41,689) ¥(120,753) ¥79,064 - $(372,223)
Infrastructure Systems & Solutions 58,372 (7,406) 65,778 - 521,179
Retail & Printing Solutions 16,321 (84,694) 101,015 - 145,723
Storage & Electronic Devices Solutions 246,967 (100,021) 346,988 - 2,205,063
Industrial ICT Solutions 11,637 8,682 2,955 134% 103,902
Others (21,706) (182,055) 160,349 - (193,804)
Total 269,902 (486,247) 756,149 - 2,409,840
Eliminations 886 3,237 (2,351) - 7,910
Consolidated ¥270,788 ¥(483,010) ¥753,798 - $2,417,750
Notes:1) Segment sales total includes intersegment transactions.2) Segment operating income (loss) is derived by deducting the segment's cost of sales, selling, general and administrative expenses and loss on impairment of goodwill from net sales. This result is regularly reviewed to support decision-making in allocations of resources and to assess performance. Certain operating expenses such as restructuring charges and legal settlement costs have been excluded from segment operating income (loss) presentation herein.3) Prior-period data relating to the discontinued operation has been deducted.4) Prior-period data relating to the consolidated segment information has been reclassified to conform with the current classification.5) From this fiscal year, expenses such as basic R&D expenses previously allocated to "Corporate and Eliminations," and partial profit and loss previously allocated to each segment, are now included in the "Others" segment.
Storage & Electronic Devices Solutions
Total
Segmentoperatingincome(loss)
Consolidated ¥4,870,773 ¥5,154,838 ¥(284,065)
(3,061,982)- Eliminations (342,942) (433,004)
Years ended March 31
Net sales(Share of
total sales)
Energy Systems & Solutions
Infrastructure Systems & Solutions
Retail & Printing Solutions
Industrial ICT Solutions
94% $43,489,045
Others
90,062

Consolidated
18
Net Sales by Region112
Fiscal Year ended March 31 (\ in millions, US$ in thousands)
2017(A) 2016(B) (A)-(B) (A)/(B) 2017¥2,262,225 ¥2,292,366 ¥(30,141) 99% $20,198,438
(46%) (44%) (2%) 2,608,548 2,862,472 (253,924) 91% 23,290,607
(54%) (56%) (-2%) 1,503,235 1,467,137 36,098 102% 13,421,741
(31%) (28%) (3%) 564,163 714,661 (150,498) 79% 5,037,170
(12%) (14%) (-2%) 351,352 438,995 (87,643) 80% 3,137,071
(7%) (9%) (-2%) 189,798 241,679 (51,881) 79% 1,694,625
(4%) (5%) (-1%) ¥4,870,773 ¥5,154,838 ¥(284,065) 94% $43,489,045
(100%) (100%)
Notes: 1) Net sales by region is determined based upon the locations of the customers. 2) Prior-period data relating to the discontinued operation has been deducted.
Others
Net Sales
Years ended March 31
Japan
Overseas
Asia
North America
Europe
Non-consolidated
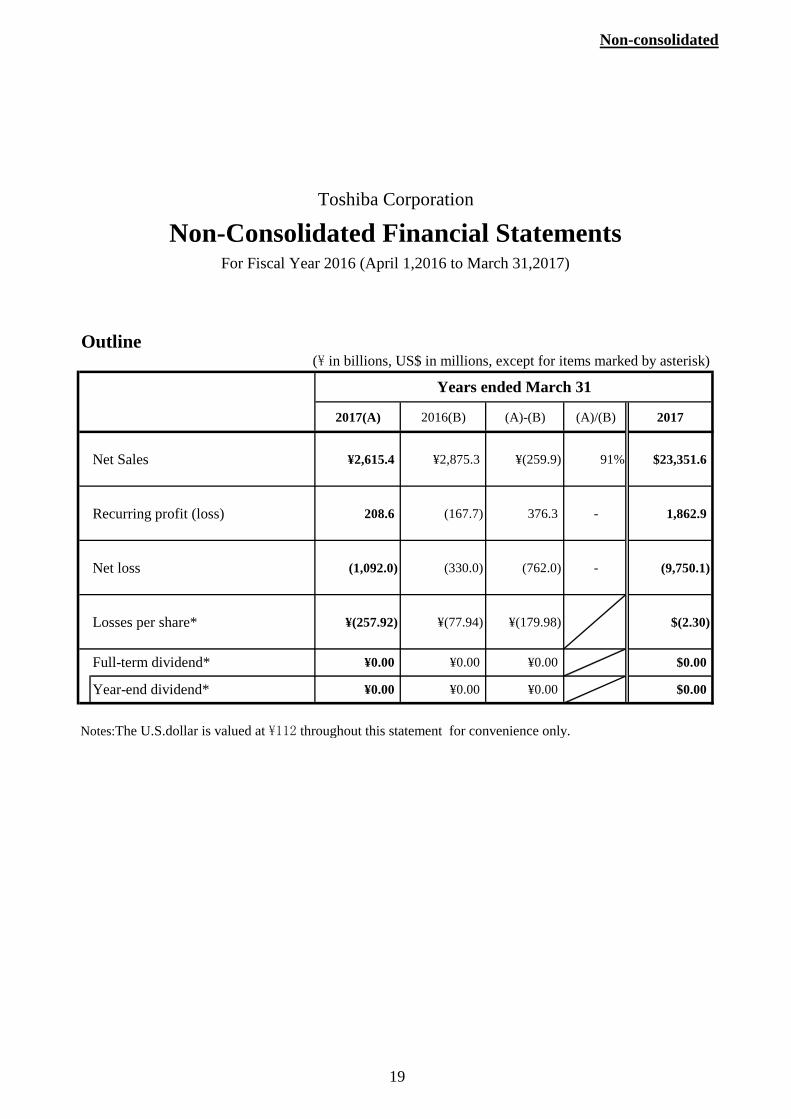
19
Outline(\ in billions, US$ in millions, except for items marked by asterisk)
2017(A) 2016(B) (A)-(B) (A)/(B) 2017
Net Sales ¥2,615.4 ¥2,875.3 ¥(259.9) 91% $23,351.6
Recurring profit (loss) 208.6 (167.7) 376.3 - 1,862.9
Net loss (1,092.0) (330.0) (762.0) - (9,750.1)
Losses per share* ¥(257.92) ¥(77.94) ¥(179.98) $(2.30)
Notes:The U.S.dollar is valued at \112 throughout this statement for convenience only.
¥0.00 ¥0.00
Non-Consolidated Financial StatementsToshiba Corporation
For Fiscal Year 2016 (April 1,2016 to March 31,2017)
Years ended March 31
Year-end dividend* ¥0.00
¥0.00 $0.00
¥0.00 ¥0.00 $0.00
Full-term dividend*