audited annual report december 31, 2020
TRANSCRIPT

Global Evolution Funds Société d’Investissement à Capital VariableVertigo Building - Polaris, 2 - 4, rue Eugène Ruppert, L - 2453 Luxembourg, Grand Duchy of Luxembourg R.C.S. Luxembourg B 157.442
December 31, 2020
Audited Annual Report

This page has been intentionally left blank.
Global Evolution Funds - ANNUAL REPORT 2020
Table of contents
3
General Information ........................................................................................................................................... 4
Local Market Disclaimers................................................................................................................................... 6
Independent auditor’s report ............................................................................................................................ 10
Report of the Investment Manager .................................................................................................................. 13
Statement of Net Assets .................................................................................................................................. 20
Statement of Operations and Changes in Net Assets ..................................................................................... 24
Statistical information ....................................................................................................................................... 28
Schedule of Investments and Other Net Assets .............................................................................................. 30
Frontier Markets* .......................................................................................................................................... 30
EM Absolute Debt ........................................................................................................................................ 38
EM Debt ....................................................................................................................................................... 41
EM Blended Debt ......................................................................................................................................... 49
Emerging Frontier ........................................................................................................................................ 54
Emerging Markets Local Debt ...................................................................................................................... 61
Frontier Opportunities .................................................................................................................................. 65
Conning Global High Dividend Equity .......................................................................................................... 72
Notes to the Financial Statements ................................................................................................................... 74
Unaudited Appendix ........................................................................................................................................ 91
*On January 17, 2020, the reference currency for Sub Fund Frontier Markets changed from EUR to USD (refer to Note 1 of the Notes to the Financial Statements).
Only the English version of the present Financial Statements has been reviewed by the independent auditors. Consequently, the independent auditor’s report only refers to the English version of the financial statements. Other versions result from a conscientious translation made under the responsibility of the Board of Directors of the SICAV.
Global Evolution Funds - ANNUAL REPORT 2020
General Information
No subscription may be accepted on the basis of the financial reports. Subscriptions are accepted only on the basis of the current prospectus accompanied by the Key Investor Information Document, the latest annual report and the latest semi-annual report if available.
4
Registered Office
Global Evolution Funds Vertigo Building - Polaris, 2 - 4, rue Eugène Ruppert, L - 2453 Luxembourg, Grand Duchy of Luxembourg R.C.S. Luxembourg B 157.442
Board of Directors
Chairman Mr. Eric Chinchon Founding Partner of ME Business Solutions S.à r.l. 16, rue Jean-Pierre Brasseur, L - 1258 Luxembourg, Grand Duchy of Luxembourg
Directors Ms. Priscilla Hardison Managing Director, Global Evolution Manco 15, rue d’ Epernay, 2nd Floor, L-1490 Luxembourg, Grand Duchy of Luxembourg
Mr. Søren Rump (until January 2, 2020) CEO Global Evolution Fondsmæglerselskab A/S Kokholm 3A, DK - 6000 Kolding, Denmark
Mr. Torben Schytt (since January 2, 2020) COO Global Evolution Fondsmæglerselskab A/S Kokholm 3A, DK - 6000 Kolding, Denmark
Management Company
Global Evolution Manco S.A. 6B, route de Trèves, 6th floor, L - 2633 Senningerberg, Grand Duchy of Luxembourg (until February 2020)
15, rue d’ Epernay, 2nd Floor, L-1490 Luxembourg, Grand Duchy of Luxembourg (since February 2020)
Depositary Bank The Bank of New York Mellon S.A./N.V., Luxembourg Branch Vertigo Building - Polaris, 2 - 4, rue Eugène Ruppert, L - 2453 Luxembourg, Grand Duchy of Luxembourg
Administration Agent The Bank of New York Mellon S.A./N.V., Luxembourg Branch Vertigo Building - Polaris, 2 - 4, rue Eugène Ruppert, L - 2453 Luxembourg, Grand Duchy of Luxembourg
Domiciliary, Paying, Registrar and Transfer Agent
The Bank of New York Mellon S.A./N.V., Luxembourg Branch Vertigo Building - Polaris, 2 - 4, rue Eugène Ruppert, L - 2453 Luxembourg, Grand Duchy of Luxembourg

Global Evolution Funds – ANNUAL REPORT 2020
No subscription may be accepted on the basis of the financial reports. Subscriptions are accepted only on the basis of the current prospectus accompanied by the Key Investor Information Document, the latest annual report and the latest semi-annual report if available.
5
Investment Manager Global Evolution Fondsmæglerselskab A/S Kokholm 3A, DK - 6000 Kolding, Denmark
Investment Manager (Conning Global High Dividend Equity)
Conning Inc. One Financial Plaza, Hartford, CT 06103, USA
Legal Advisor Elvinger, Hoss & Prussen 2, place Winston Churchill, L-1340 Luxembourg, Grand Duchy of Luxembourg
Auditor Ernst & Young, Société Anonyme Cabinet de révision agréé 35E, avenue John F. Kennedy, L-1855 Luxembourg, Grand Duchy of Luxembourg

GLOBAL EVOLUTION FUNDS - ANNUAL REPORT 2020
Local Market Disclaimers
6
Additional Information for Investors in the Federal Republic of Germany
For the following sub-funds, no notification for distribution in the Federal Republic of Germany was submitted and Shares in these sub-funds may NOT be offered to investors within the scope of the German Investment Code. As a consequence, the following sub-funds are NOT available to investors in Germany:
• Emerging Frontier
• Frontier Opportunities
• Conning Global High Dividend Equity
Paying and information agent for Germany:
Marcard, Stein & Co AG Ballindamm 36 20095 Hamburg, Germany, has been appointed as paying and information agent in the Federal Republic of Germany (the ’’German Paying and Information Agent’’).
The Articles of Incorporation, the Prospectus and Key Investor Information Document, semi-annual and annual reports, the Net Asset Value per share, and the subscription and redemption prices are available free of charge from the Management Company and the German Paying and Information Agent during usual business hours. In addition, this information is available electronically on http://www.globalevolutionfunds.com.
An investor is allowed to convert shares from one Share Class to another Share Class (please refer to the Prospectus for more information); the conversion price(s) correspond to the redemption and subscription prices or the Net Asset Value per share. Requests for redemption and conversion may be submitted to the German Paying and Information Agent.
All payments (redemption proceeds, any distributions, and other payments) may be paid by the German Paying and Information Agent to the Shareholders. Any notices to shareholders shall be published on the website www.globalevolutionfunds.com.
The statement of changes in the composition of the investment portfolio is also available free of charge upon request at the office of the German Paying and Information Agent.
GLOBAL EVOLUTION FUNDS - ANNUAL REPORT 2020
7
Additional Information for Investors in Austria
The following sub-funds are available to investors in Austria:
• EM Blended Debt
• EM Debt
• EM Absolute Debt
• Emerging Markets Local Debt
• Frontier Markets
Paying and Information Agent for the shares of the Fund authorized for public distribution in Austria:
ERSTE BANK der oesterreichischen Sparkassen AG Am Belvedere 1 1100 Wien, Austria.
Applications for the redemption, subscriptions and conversion of shares may be sent to the Austrian Paying Agent. All payments to investors, including redemption proceeds, potential distributions and other payments, may, upon request, be paid through the Austrian Paying and Information Agent.
The following documents and information may be obtained in hard copy and free of charge at the registered office of the Management Company (Global Evolution Manco) and at the Austrian Paying and Information Agent and can be inspected at the offices of the Austrian Paying Agent during normal business hours:
- The prospectus and the articles of incorporation; - Key Investor Information Documents (KIIDs); - The annual report and semi-annual report; - Redemption or Subscription prices; - Any investor notices.

GLOBAL EVOLUTION FUNDS - ANNUAL REPORT 2020
8
Additional Information for Investors in Switzerland
Legal form and country of origin of the investment fund
The collective investment fund Global Evolution Funds, a UCITS, is an investment fund under Luxembourg law.
Only the following sub-funds are authorized by FINMA for distribution in or from Switzerland and are represented by ACOLIN Fund Services AG:
• Frontier Markets
• EM Absolute Debt
• EM Debt
• EM Blended Debt
• Emerging Markets Local Debts
This document shall not be distributed in or from Switzerland.
Representative and paying agent
Representative agent: ACOLIN Fund Services AG, Leutschenbachstrasse 50, CH-8050 Zürich, Switzerland Paying agent: NPB Neue Privat Bank AG, Limmatquai 1 / am Bellevue, P.O. Box, CH-8024 Zürich, Switzerland
Address for the delivery of relevant documents
The detailed prospectus, including the general terms and conditions, the special conditions, the key investor information document (KIID), the annual and semi-annual reports, and the presentation of purchases/sales are available free of charge from the representative in Switzerland.
Publications
Notifications of the Fund are published in Switzerland on the electronic platform www.fundinfo.com. This platform contains, in particular, important information for shareholders, such as changes in the prospectus or the management regulations and the liquidation of the Fund. The prospectus, including the management regulations, the key investor information document and the annual and semi-annual reports are available at no charge from the representative in Switzerland.
The issue and redemption prices and/or the net asset value with the notice "excluding commissions" are published daily on the electronic platform fundinfo (http://www.fundinfo.com).
Please note that the total expense ratio (TER) was calculated based on the "Guidelines on the calculation and disclosure of the Total Expense Ratio (TER) of collective investment schemes" of the Swiss Funds Asset Management Association (SFAMA) based on Version of April 20, 2015. The total expense ratios are as of December 31, 2020.

GLOBAL EVOLUTION FUNDS - ANNUAL REPORT 2020
9
Local Centralizing, Paying, Facilities, Information or Representative Agents
The articles of incorporation, the prospectus, the Key Investor Information Document, periodic financial reports (semi-annual and annual reports), and the subscription and redemption prices are available free of charge at the local agent address listed below:
Country Agent address details
Austria ERSTE BANK der oesterreichischen Sparkassen AG Am Belvedere 1 - 1100 Wien, Austria
Belgium ABN AMRO Bank N.V., Belgian Branch Roderveldlaan 5 bus 4, 2600 Berchem, Belgium
Denmark SEB GTS Custody Services SEB Merchant Banking Bernstorffsgade 50 - 1577 Copenhagen V, Denmark
France Société Générale Securities Services 29, boulevard Haussmann - 75009 Paris, France
Germany Marcard, Stein & Co AG Ballindamm 36 - 20095 Hamburg, Germany
Ireland Société Générales S.A. (acting through its Dublin Branch) 3rd Floor IFSC House - Dublin 1, Ireland
Italy Société Générale Securities Services S.p.A. Maciachini Center, MAC 2, Via Benigno Crespi - 19/A, 20159 Milan, Italy Allfunds Bank, S.A.U., Succursale di Milano*,
Via Bocchetto, 6, 20123 Milano, Italy
Spain FinancialReg360, S. L. c/ Alcalá, 85, 28009, Madrid, Spain
Sweden Skandinaviska Enskilda Banken AB (publ) Investor Services - Paying Agent/AS Råsta Strandväg 5 - 169 79 Solna, Sweden
Switzerland Representative agent: ACOLIN Fund Services AG, Leutschenbachstrasse 50, CH-8050 Zürich, Switzerland Paying agent: NPB Neue Privat Bank AG, Limmatquai 1 / am Bellevue, P.O. Box, CH-8024 Zürich, Switzerland
United Kingdom FE FUNDINFO (UK) LIMITED FE / 2nd Floor / Golden House / 30 Great Pulteney Street / London / W1F 9NN / United Kingdom
*The Fund has been informed that on 2nd October 2020, Allfunds Bank S.A. and BNP Paribas completed a closing of strategic transaction in Italy, Allfunds Bank S.A. acquired Banca Corrispondente from BNP Paribas Securities Services which main focus is on local paying agency activities and transfer agency services.
EYErnst & YoungSociete anonyme
35E, Avenue john F. KennedyL-1855 Luxembourg
Tel: +352 421241
B.P.780L-2017 Luxembourg
R.C.S. Luxembourg B 47 771TVA LU 16063074
Building a betterworking world www.ey.com/en_lu
Independent auditor's report
To the Shareholders ofGlobal Evolution FundsVertigo Building - Polaris2-4, rue Eugene RuppertL-2453 Luxembourg
Opinion
We have audited the financial statements of Global Evolution Funds (the "Fund), and of each of its sub-funds, which comprise the statement of net assets and the schedule of investments and other net assetsas at December 31, 2020, and the statement of operations and changes in net assets for the year thenended, and the notes to the financial statements, including a summary of significant accounting policies.
In our opinion, the accompanying financial statements give a true and fair view of the financial position ofthe Fund, and of each of its sub-funds, as at December 31, 2020, and of the results of their operationsand changes in their net assets for the year then ended in accordance with Luxembourg legal andregulatory requirements relating to the preparation and presentation of the financial statements.
Basis for Opinion
We conducted our audit in accordance with the Law of July 23, 2016 on the audit profession (the "Law ofJuly 23, 2016") and with International Standards on Auditing ("ISAs") as adopted for Luxembourg by the"Commission de Surveillance du Secteur Financier" ("CSSF"). Our responsibilities under the Law ofJuly 23, 2016 and ISAs are further described in the "responsibilities of the "reviseur d'entreprises agree"for the audit of the financial statements" section of our report. We are also independent of the Fund inaccordance with the International Ethics Standards Board for Accountants' Code of Ethics forProfessional Accountants ("IESBA Code") as adopted for Luxembourg by the CSSF together with theethical requirements that are relevant to our audit of the financial statements, and have fulfilled our otherethical responsibilities under those ethical requirements. We believe that the audit evidence we haveobtained is sufficient and appropriate to provide a basis for our opinion.
Other information
The Board of Directors of the Fund is responsible for the other information. The other informationcomprises the information included in the annual report but does not include the financial statements andour report of the "reviseur d'entreprises agree" thereon.
Our opinion on the financial statements does not cover the other information and we do not express anyform of assurance conclusion thereon.
- 10-
A member firm of Ernst & Young Global Limited

EYBuilding a betterworking world
In connection with our audit of the financial statements, our responsibility is to read the other informationand, in doing so, consider whether the other information is materially inconsistent with the financialstatements or our knowledge obtained in the audit or otherwise appears to be materially misstated. If,based on the work we have performed, we conclude that there is a material misstatement of this otherinformation, we are required to report this fact. We have nothing to report in this regard.
Responsibilities of the Board of Directors of the Fund and those charged with governance for thefinancial statements
The Board of Directors of the Fund is responsible for the preparation and fair presentation of thesefinancial statements in accordance with Luxembourg legal and regulatory requirements relating to thepreparation and presentation of the financial statements, and for such internal control as the Board ofDirectors of the Fund determines is necessary to enable the preparation of financial statements that arefree from material misstatement, whether due to fraud or error.In preparing the financial statements, the Board of Directors of the Fund is responsible for assessing theFund's and each of its sub-funds' ability to continue as a going concern, disclosing, as applicable,matters related to going concern and using the going concern basis of accounting unless the Board ofDirectors of the Fund either intends to liquidate the Fund or any of its sub-funds or to cease operations,or has no realistic alternative but to do so.
Responsibilities of the "reviseur d'entreprises agree" for the audit of the financial statements
Our objectives are to obtain reasonable assurance about whether the financial statements as a wholeare free from material misstatement, whether due to fraud or error, and to issue a report of the "reviseurd'entreprises agree" that includes our opinion. Reasonable assurance is a high level of assurance, but isnot a guarantee that an audit conducted in accordance with the Law of July 23,2016 and with ISAs asadopted for Luxembourg by the CSSF will always detect a material misstatement when it exists.Misstatements can arise from fraud or error and are considered material if, individually or in theaggregate, they could reasonably be expected to influence the economic decisions of users taken on thebasis of these financial statements.
As part of an audit in accordance with the Law of July 23,2016 and with ISAs as adopted forLuxembourg by the CSSF, we exercise professional judgment and maintain professional skepticismthroughout the audit. We also:
• Identify and assess the risks of material misstatement of the financial statements, whether due tofraud or error, design and perform audit procedures responsive to those risks, and obtain auditevidence that is sufficient and appropriate to provide a basis for our opinion. The risk of not detectinga material misstatement resulting from fraud is higher than for one resulting from error, as fraud mayinvolve collusion, forgery, intentional omissions, misrepresentations, or the override of internalcontrol.
• Obtain an understanding of internal control relevant to the audit in order to design audit proceduresthat are appropriate in the circumstances, but not for the purpose of expressing an opinion on theeffectiveness of the Fund's internal control.
- 11 -
A member firm of Ernst & Young Global Limited

EYBuilding a betterworking world
• Evaluate the appropriateness of accounting policies used and the reasonableness of accountingestimates and related disclosures made by the Board of Directors of the Fund.
• Conclude on the appropriateness of Board of Directors of the Fund use of the going concern basis ofaccounting and, based on the audit evidence obtained, whether a material uncertainty exists relatedto events or conditions that may cast significant doubt on the Fund's or any of its sub-funds' ability tocontinue as a going concern. If we conclude that a material uncertainty exists, we are required todraw attention in our report of the "reviseur d'entreprises agree" to the related disclosures in thefinancial statements or, if such disclosures are inadequate, to modify our opinion. Our conclusionsare based on the audit evidence obtained up to the date of our report of the "reviseur d'entreprisesagree". However, future events or conditions may cause the Fund or any of its sub-funds to cease tocontinue as a going concern.
• Evaluate the overall presentation, structure and content of the financial statements, including thedisclosures, and whether the financial statements represent the underlying transactions and events ina manner that achieves fair presentation.
We communicate with those charged with governance regarding, among other matters, the plannedscope and timing of the audit and significant audit findings, including any significant deficiencies ininternal control that we identify during our audit.
Ernst & YoungSociete anonyme
Cabinet de revision agree
Luxembourg, 24 March 2021
- 12 -
A member firm of Ernst & Young Global Limited

GLOBAL EVOLUTION FUNDS - ANNUAL REPORT 2020
Report of the Investment Manager
*Disclaimer:
Information has been obtained from sources believed to be reliable, but J.P. Morgan does not warrant its completeness or accuracy. The Index is
used with permission. The Index may not be copied, used, or distributed without J.P. Morgan’s prior written approval. Copyright 2021, J.P. Morgan
Chase & Co. All rights reserved.
13
Frontier and Emerging Bond Markets: 2020 in hindsight
The COVID-19 pandemic was a sea-change that left all forecasts and investment strategies for 2020 in disarray. Global growth, fiscals and financial markets were left in uncharted territory following a dramatic sell-off in risk assets in March 2020 and a collapse in oil prices in April, risk sentiment rebounded nicely in Q2 assisted by unprecedented fiscal and monetary support. In the US, the Federal Reserve Bank (Fed) lowered its policy rate by 150bps to 0.25%.
Following the dramatic sell-off in risk assets in Q1, 2020 and a significant reversal of risk sentiment in the 2nd quarter, the 3rd quarter seemed more like smooth sailing. Having rallied by around 130bps to around 0.60% in the 1st quarter, 10yr US Treasury yields did nothing to upset the market. However, July saw a notable depreciation of the US dollar but unlike previous episodes of dollar weakness, emerging markets (EM) currencies failed to capitalize.
After the summer lull, global risk markets were in flux in October 2020 amid increasing US elections jitters and resurgent COVID-19 cases resulting in stricter containment measures. Market sentiment improved markedly from November onwards on news that the leading COVID-19 vaccine candidates prevented more than 90% of infections in studies of tens of thousands of volunteers. Also, as the US presidential election saw the Biden/Harris ticket victorious market sentiment got a boost on expectations of increased fiscal relief spending and a more predictable foreign policy. Arguable, Biden in The White House and increased visibility on forthcoming vaccine roll-out could be seen as triggers for local EM currencies to finally start performing, and November and December actually saw solid returns.
As it turned out, the COVID-19 pandemic and associated containment measures proved the worst of times for economic growth, yet the best of times for many risk markets.
Frontier and Emerging Bond Markets: 2021 Outlook
The global economy has set sail for calmer waters. The rollout of COVID-19 vaccines will help restore growth and travel and tourism globally. Tourism-dependent economies like Turkey, Thailand and Egypt should benefit. US foreign policy under Biden is likely to become more predictable, guided by rule of law and international order. China’s trading praxis will remain high on the agenda, but under Biden likely to be dealt with via a coordinated US-EU approach, thus reaffirming old alliances in distress under Trump. While this could be a disadvantage for China, other economies should prosper as supply chains are reorganized. Moreover, hard commodities including base metals and iron ore will be in demand on a global drive to enhance infrastructure. As for oil, the US shale industry face stricter regulations going forward which will put limitations on output and keep the global oil market balanced.
Even as economies recover, fiscal austerity will stay out of fashion as governments seem happy to control money supply and let central banks and pension savers finance swelling budget deficits at negative nominal and/or real yields. Meanwhile, G3 monetary policy settings are ultra-loose and, based on forward guidance, likely to remain so for as long as the eye can see, thus keeping global financial markets flush with liquidity in 2021.
GLOBAL EVOLUTION FUNDS - ANNUAL REPORT 2020
Report of the Investment Manager
*Disclaimer:
Information has been obtained from sources believed to be reliable, but J.P. Morgan does not warrant its completeness or accuracy. The Index is
used with permission. The Index may not be copied, used, or distributed without J.P. Morgan’s prior written approval. Copyright 2021, J.P. Morgan
Chase & Co. All rights reserved.
14
Fiscal and monetary policies remain highly accommodative, but it has yet to be seen if this will translate into structural higher in inflation in coming years. We do expect inflation to pick up over the next 6 months on a combination of base effects, higher growth and higher commodity prices and we expect the US yield curve to bear steepen as the US treasury shifts it supply away from bills and into longer dated notes. Still, this is likely going to be matched by a shift towards more duration in Fed’s bond buying program, that will leave 10yr UST around 1.50% on a 12 months’ horizon. Even so, Emerging markets asset should be fine as long US real yields and real policy rates stay depressed.
Frontier Markets, Emerging Frontier and Frontier Opportunities The frontier strategies covering the sub fund Frontier Markets, Emerging Frontier and Frontier Opportunities, returned around 1.17% on average in 2020 (Frontier Opportunities -0.23%; Emerging Frontier 3.40%; Frontier Markets between -1% and +1.63%) with hedging costs into base currencies and fee structures being the main explanation for the dispersion in performance. Carry of 2020 performance was in local fixed income being the main contributor to performance and local currency exposure being a drag. The contribution from capital gains was mixed.
Performance drivers for 2020
Positive
At a country level, Angola, Uruguay and Ivory Coast proved the top three contributors to performance. In all cases, carry and capital gains were the main drivers of performance. After a huge rebound in Q2, consolidation in Q3, Angolan Eurobonds put in a strong performance in Q4 with the price action supported by the strong uptick in oil prices. Turning to Uruguay, performance was mainly driven by a strong collapse in local fixed income with real yields in 2040 inflation linker bond collapsing as central bank governor Labat convinced the market that he is determined to deliver on the main two objectives: lowering inflation and breaking inflation inertia and delivering a quality currency. After underperforming during Q3:20 ahead of elections in Oct 20, Ivorian Eurobond prices rebounded strongly in Q4:20 as our core post- election scenario of business as usual under incumbent President Ouattara played out.
Negative
Bottom three performers were Ecuador, Lebanon and Zambia: the former two due to distressed bond pricing, restructuring jitters and capital losses and the latter mainly due to a notable depreciation of the Zambian Kwacha. In Ecuador, we saw a sharp rebound in bond prices between March and July on expectations of an investor friendly restructuring. In fact, our exposure to Ecuador was one of the largest positive contributors in Q2:20, despite being a relatively small position. Price action following the restructuring was extremely stable but in Q4 uncertainty around elections scheduled for February 7, 2021 mounted with opinion polls suggesting that market friendly presidential candidate Guillermo Lasso would suffer a second-round election defeat to the market unfriendly Andres Arauz. Turning to Lebanon, bond prices suffered in H1, 2020 as cash trapped authorities struggled to refinance maturing Eurobonds amid dwindling FX reserves and big political differences over the options. Lebanon has now defaulted on its debt with no near-term restructuring in sight. Zambian Kwacha came under intense pressure in Q1 2020 as the COVID-19 pandemic took its toll on risk sentiment and copper prices. After the sell-off in Q1, Zambia performance better in Q2, but in Q3 the Zambian kwacha took another hit as BOZ Governor Denny Kalyalya unexpectedly was replaced with Chris Mvunga, a close ally of the President and not qualified for the job.

GLOBAL EVOLUTION FUNDS - ANNUAL REPORT 2020
Report of the Investment Manager
*Disclaimer:
Information has been obtained from sources believed to be reliable, but J.P. Morgan does not warrant its completeness or accuracy. The Index is
used with permission. The Index may not be copied, used, or distributed without J.P. Morgan’s prior written approval. Copyright 2021, J.P. Morgan
Chase & Co. All rights reserved.
15
2021 - Key investment themes and positioning Treasury duration was a strong performance driver in 2020 for high grade emerging market debt and low yielding fixed income. Following a rather dismal return in 2020 we believe that our frontier strategy is well positioned to capitalize on stronger global growth in 2021. Given our sanguine outlook for hard commodities and a likely pick-up in US inflation and US Treasury yields, we expect the strategy to perform well thanks to its relatively low duration of around 3.5. Moreover, the combination of a modestly weaker US dollar, a solid demand for commodities and a pick-up in global trade should help ease the pressure on external balances and frontier currencies.
EM Absolute Debt
In a rather difficult global market environment, the sub fund EM Absolute Debt made a full year return of 6.45% (Performance for Share class I USD difference compared to other classes is linked to hedging costs and fee structures).
Performance drivers for 2020
The EM Absolute Debt strategy managed to successfully weather the downturn in March. We started to reduce risk already in January as the first news came to the fore and reduced risk further into February as the full extent of the pandemic slowly unfolded. In the first place, we reduced Emerging Market foreign exchange risk and/or hedged with US Dollar call options and then reduced spread duration especially in the risk sensitive high yielders. As a further hedge we switched into US treasuries as a safe haven. This has helped to reduce the drawdown to around 4.7% versus drawdowns for J.P. Morgan EMBI Global Diversified* and J.P. Morgan GBI-EM Global Diversified* of around 20% and 21%, respectively. After the announcement of the emergency central bank programs, we slowly added to risk again. First, we took profit on Emerging Market foreign exchange hedges and then slowly added to overall spread and local risk in the following weeks. Ahead of the US election in November we reduced risk again to avoid potential volatility around event. Once it became clear that Biden is going to be the winner, which was largely expected but nevertheless the result was much narrower than expected, we added to risk again or unwound our hedges.
Best performing country position in 2020 was Mexico which was badly hit in March but swiftly recovered afterwards. We added to the very long end of local Mexican bonds and they performed strongly after the sell-off. Also, our positioning in MXN, which we used as one of our risk hedges contributed nicely to the performance. Second best was Indonesia, where we were positioned in the long end of the local curve and tactically managed the FX risk. Worst position was our hard currency bonds in Romania followed by Sri Lanka. Both positions were hit in March and we sold the position after they hit our stop levels.
Key investment themes and positioning for 2021
Given our sanguine outlook for hard commodities and a likely pick-up in US inflation and US Treasury yields, we expect the strategy to perform relatively well as we stay underweight duration in High Grade credits. We favor better rated credits in the higher yielding credit bucket where spreads offer scope to absorb a rise in US inflation and US treasury yields. In local fixed income the theme is identical. Low yielding fixed income markets are likely to suffer headwinds as US treasury yields inch higher and we are therefore focusing on higher yielding fixed income supported by relative strong external balances and preferably commodity exports. With the US forecasted to run sizeable fiscal and external deficits and with the Fed presumably on hold through 2021 and 2022, we expect broad based dollar weakness to be a supportive factor for emerging markets currency performance.

GLOBAL EVOLUTION FUNDS - ANNUAL REPORT 2020
Report of the Investment Manager
*Disclaimer:
Information has been obtained from sources believed to be reliable, but J.P. Morgan does not warrant its completeness or accuracy. The Index is used
with permission. The Index may not be copied, used, or distributed without J.P. Morgan’s prior written approval. Copyright 2021, J.P. Morgan Chase
& Co. All rights reserved.
16
EM Debt
EM Debt returned a solid 6.32% (Performance for Share class I USD, difference compared to other classes is linked to hedging costs) in 2020, thus outperforming its benchmark (J.P. Morgan EMBI Global Diversified*) by around 100bps.
Performance drivers for 2020
Arguably, the full-year performance proved much stronger than one dared to hope for when financial markets were rocked by the COVID-19 Pandemic in Q1 2020. Even though high-grade duration was the main contributor to benchmark performance, our strategy did well by being overweight selective frontier-like credits including Ivory Coast, Egypt, Ukraine and Dominican Republic and overweight high conviction trades including Indonesia. Also, overweight allocation (compared to the benchmark: J.P. Morgan EMBI Global Diversified*) to Qatar as a proxy for low yielding Saudi Arabia proved beneficial. Moreover, a zero weight to China and an underweight to Sri Lanka also served us well from a relative performance perspective, with the former simply underperforming the market and the latter priced for debt restructuring. Our zero-weight to Saudi Arabia was a drag on relative performance (we were compensated via Qatar as per above). Also, an underweight to oil sensitive Nigeria weighed on relative performance as the credit benefitted from higher oil prices. Still, being overweight in Angola our beta to oil felt sufficient. In Argentina the market increasingly subscribed to our longstanding view that the debt work-out would be less painful for bond holders than anticipated. However, this did not stop our exposure to the sovereign from underperforming the benchmark again in 2020.
Key investment themes and positioning for 2021
Going into 2021, we expect coupons to be the main driver of performance. The credit spread of J.P. Morgan EMBI Global Diversified* is about fair according to our modelling but since we expect US treasury yields to inch higher, low yielding high grade credits are likely to face headwinds as opposed to the situation in 2020. Hence, we continue to favor better rated credits in the higher yielding credit bucket where spreads offer scope to absorb a rise in US inflation and US treasury yields. In Latin America, Mexico, Panama and Paraguay are the main overweight positions whereas in Eastern Europe, Ukraine, Azerbaijan and Russia are the largest bets. Turning to Africa, Egypt is the largest overweight followed by Ivory Coast, Zambia and Angola. Our underweight to The Middle East is mainly reflected in an underweight to Saudi Arabia where we see little value given tight spreads and potentially higher US yields.

GLOBAL EVOLUTION FUNDS - ANNUAL REPORT 2020
Report of the Investment Manager
*Disclaimer:
Information has been obtained from sources believed to be reliable, but J.P. Morgan does not warrant its completeness or accuracy. The Index is used
with permission. The Index may not be copied, used, or distributed without J.P. Morgan’s prior written approval. Copyright 2020, J.P. Morgan Chase
& Co. All rights reserved.
17
Emerging Markets Local Debt
In 2020 our Emerging Markets local currency debt fund made a disappointing negative return of -6.72% (Performance for Share class I EUR, difference compared to other classes is linked to hedging costs and fee structures). Measured against benchmark J.P. Morgan GBI-EM Global Diversified in EUR*, our strategy underperformed by 93bps.
Performance drivers in 2020
The COVID-19 Pandemic proved to be an unprecedented exogenous shock that left fiscal and monetary policy settings in uncharted easing territory, thus offering little support to local currency performance and as the euro gained 8.9% against the US dollar, local currency performance suffered even as base metals and other cyclical indicators started to recover. From early Q4, local currencies performance finally started to improve on COVID-19 vaccine optimism and in relief that a Biden victory in the US presidential elections would see a return to international order and policy predictability. Our positioning to Turkey (underweight), Mexico (overweight) and China (underweight) were the best contributors to relative performance whereas positioning to South Africa (underweight while positioned in long duration), Thailand (underweight) and Ukraine (off benchmark overweight) were the worst contributors to relative performance.
Key investment themes and positioning for 2021
Following a disappointing performance in 2020, in absolute terms as well as relative to benchmark, we are optimistic that 2021 will see better returns. Given our sanguine outlook for hard commodities and a likely pick-up in US inflation and US Treasury yields, we expect the strategy to perform relatively well as we stay underweight duration in lower yielding fixed income markets. A slightly stronger euro will cause some headwinds to performance but the combination of a modestly weaker US dollar, a solid demand for commodities and a pick-up in global trade, travel and tourism should help ease the pressure on external balances and local currencies. We are biased towards local currencies backed by attractive real yields and preferably also backed by commodity exports. Following gradual inclusion in benchmark J.P. Morgan GBI-EM Global Diversified in EUR* in 2020, China now has a benchmark weight of 10%. Arguably this has improved the risk adjusted return potential of the benchmark. Even so, we plan to stay underweight China as we explore opportunities in higher yielding markets including markets with certain frontier characteristics such as Egypt and Ukraine.

GLOBAL EVOLUTION FUNDS - ANNUAL REPORT 2020
Report of the Investment Manager
*Disclaimer:
Information has been obtained from sources believed to be reliable, but J.P. Morgan does not warrant its completeness or accuracy. The Index is used
with permission. The Index may not be copied, used, or distributed without J.P. Morgan’s prior written approval. Copyright 2021, J.P. Morgan Chase
& Co. All rights reserved.
18
EM Blended Debt Our Emerging Markets blended debt fund returned 1.85% (Performance for Share class I EUR, difference compared to other classes is linked fee structures) in 2020 net of fees while underperforming its benchmark (“50% J.P. Morgan EMBI Global Diversified, hedged to EUR and 50% J.P. Morgan GBI-EM Global Diversified in USD, hedged to EUR”*) by around 36 bps.
Performance drivers in 2020
The strategy entered 2020 with a modest overweight to local currency debt in anticipation of an overall risk friendly market environment. The COVID-19 pandemic changed that. Risk assets sold off, credits spreads widened, and local currencies came under pressure. By April our allocation to local fixed income and FX had been lowered to around 40% to take advantage of the now wider credit spreads. In early June, we raised the allocation to local currency debt to 45% to lock in some of the outperformance of hard currency debt in May. We remained underweight local currency debt through June, July and August 2020 but then moved to a 50/50 allocation betting on a local currency performance catalyst soon to appear. As COVID-19 vaccine optimism gained momentum and with Joe Biden declared winner of the US Presidential election, the allocation to local currency debt was lifted to around 55%.
In terms of relative performance and idiosyncratic risk, overweight positions to high yield credits Ivory Coast, Ecuador and Egypt proved the best contributors to relative performance thanks to high carry and as the exposure to Ecuador was increased ahead the debt restructuring taking place in the third quarter. Contrary, an overweight to Costa Rica’s local law hard currency debt turned out the worst contributor to relative performance as the parliament’s procrastination over the policies needed for an IMF program made the market doubt if it would ever be forthcoming. Also weighing on relative performance, our zero weight positions to Chile and Saudi Arabia went against us as the two high grade credits gained on the rally in US treasury bonds (in the case of our zero weight to Saudi Arabia, we were fully compensated being overweight Qatar’s hard currency debt). In local currency debt the best contribution to relative performance zero weight to Turkey local fixed income and FX proved the best contributor to performance as the Turkish lira came under pressure following President Erdogan’s plain intervention in monetary and fiscal policy settings and with local hoarding dollars. Our overweight to Russia local fixed income and FX based on Russia’s solid fundamentals turned out the worst contributor to relative performance as we suffered from disappointing FX performance.
Key investment themes and positioning for 2021
Going into 2021, in hard currency debt we expect coupons to be the main driver of performance. The credit spread of J.P. Morgan EMBI Global Diversified* is about fair according to our modelling and since we expect US treasury yields to inch higher, low yielding high grade credits are likely to face headwinds as opposed to the situation in 2020. Hence, we favor better rated credits in the higher yielding credit bucket where spreads offer scope to absorb a rise in US inflation and US treasury yields. In local fixed income the theme is identical. Low yielding fixed income markets are likely to suffer as US treasury yields inch higher and we are therefore focusing on higher yielding fixed income supported by relative strong external balances and preferably commodity exports. We expect local currencies to be the main driver of performance as we expect base metals and oil be supportive thanks to infrastructure spending ranging from bridges to grids and as the US shale industry faces tighter regulations under a Biden administration. Also, with the US forecasted to run sizeable fiscal and external deficits and with the Fed presumably on hold through 2021 and 2022, we expect broad based dollar weakness to be a supportive factor. We enter 2021 with a slight overweight to local fixed income and biased to add.

GLOBAL EVOLUTION FUNDS - ANNUAL REPORT 2020
*Disclaimer:
Information has been obtained from sources believed to be reliable, but J.P. Morgan does not warrant its completeness or accuracy. The Index is
used with permission. The Index may not be copied, used, or distributed without J.P. Morgan’s prior written approval. Copyright 2020, J.P. Morgan
Chase & Co. All rights reserved.
19
Conning Global High Dividend Equity
The Conning Global High Dividend Equity Fund (GHDE) returned 0.96% during 2020, underperforming its benchmark MSCI ACWI Large Cap Index (Benchmark price Change: +14.5% Total Return: +17.05%). The Sub-fund’s dividend yield as of December 31, 2020, stood at 3.03%, more than 1% higher than that of the MSCI ACWI Large Cap Index.
Stock selection and sector allocation were both contributors to the underperformance for the year.
Performance Drivers in 2020
By far the largest impact on the performance of the Sub-fund was the impact of the COVID-19 pandemic and its commensurate effect on the winners and losers in world equity markets.
Global markets sold off dramatically in the initial wake of the pandemic, as uncertainty regarding its eventual scope and impact took its toll on investor confidence, not to mention the horrible toll in human life taken by the virus. Fears of a significant and lasting drop in world GDP snuffed out the beginnings of a market broadening that had commenced in late-2019. Many of the large technology companies that had thrived due to a low growth environment pre-2020 began to rise again, flying in the face of the rest of the markets that fell precipitously. Ten large tech companies (not eligible for ownership Conning GHDE because they pay little or no dividend) rose 25% in the first half of 2020 while the rest of the market fell almost 10%.
A broader market recovery, though, had already started in Q2 2020 and continued through the end of the year. Many expectations for earnings reductions and dividend cuts did not materialize to the extent feared (save for specific industries such as leisure and travel). Companies in general were able to significantly outperform lowered expectations for Q2 and Q3 and with the advent of vaccines for COVID-19 were able to look forward to a better year in 2021.
Within the Sub-fund, the largest negative performance impact came from positions in Carnival Corp., CK Infrastructure and Suncor Energy. These make sense in the context of the economic slowdown driven by COVID-19. The largest positive performance impact came from positions in QUALCOMM, UPS and Samsung, as the flip side of the COVID-19 slowdown was a demand for technology and shipping. As alluded to above, the inability of GHDE to own some large tech companies was damaging to performance as well. Apple, Amazon, Tesla and Microsoft cost the Sub-fund more than 500 bps in relative performance over the course of 2020.
From a sector allocation perspective, the largest negative impacts came from an underweight to technology driven by the above limitations and from an overweight to consumer staples in an environment of uncertainty that did not reward these cash flow cows. The Fund was underweight real estate and energy during 2020 and this was beneficial as economic uncertainty was not kind to either of these economic sectors.
Outlook for 2021
Global growth should continue to recover in 2021. A risk-on sentiment is being driven by vaccine rollout and prospective fiscal stimulus and should drive market returns to an average year of returns.

Global Evolution Funds - ANNUAL REPORT 2020
Statement of Net Assets as of December 31, 2020
The accompanying notes are an integral part of these financial statements.
20
COMBINED Frontier Markets* EM Absolute Debt
EM Debt
EUR USD USD USD
ASSETS
Portfolio at market value (note 2.2) 2,697,796,421.14 2,200,268,023.98 57,724,460.18 284,129,074.67
Unrealised gain on foreign exchange contracts (note 11)
33,151,108.56 24,410,097.90 1,057,156.83 1,738,525.81
Option purchased at market value (note 12) 123,153.18 - 150,684.07 -
Cash at banks (note 10) 117,250,040.63 86,984,887.12 5,851,425.64 6,008,816.56
Interest receivable 51,855,536.48 44,231,737.25 690,712.42 4,075,763.51
Dividend receivable 38,775.77 - - - Subscription receivable 2,581,863.84 3,159,039.36 - -
Sales of investments receivable 2,974,820.00 2,695,465.84 - -
Other assets 14,826.04 - - -
TOTAL ASSETS 2,905,786,545.64 2,361,749,251.45 65,474,439.14 295,952,180.55
LIABILITIES
Unrealised loss on foreign exchange contracts (note 11)
6,062,262.07 5,609,448.28 702,159.07 591,726.93
Fixed administration fee payable (note 6) 1,029,520.38 964,969.56 24,391.82 86,442.85
Investment management fee payable (note 7) 2,269,430.82 2,104,651.42 54,245.19 185,235.73
Redemption payable 664,234.78 812,724.43 - -
Performance fee payable (note 8) 1,581,049.79 1,934,485.00 7.89 -
Other liabilities 85,776.41 69,652.68 1,458.69 7,916.44
TOTAL LIABILITIES 11,692,274.25 11,495,931.37 782,262.66 871,321.95
TOTAL NET ASSETS 2,894,094,271.39 2,350,253,320.08 64,692,176.48 295,080,858.60
*On January 17, 2020, the reference currency for Sub Fund Frontier Markets changed from EUR to USD.

Global Evolution Funds - ANNUAL REPORT 2020
The accompanying notes are an integral part of these financial statements.
21
EM Blended Debt Emerging Frontier
Emerging Markets
Local Debt
Frontier Opportunities
EUR USD EUR EUR
ASSETS
Portfolio at market value (note 2.2) 6,361,117.74 354,864,318.82 33,980,996.06 255,744,799.01
Unrealised gain on foreign exchange contracts (note 11)
158,678.45 229,579.42 - 10,569,675.70
Option purchased at market value (note 12) - - - -
Cash at banks (note 10) 136,590.02 22,414,278.25 627,147.47 17,283,299.23
Interest receivable 94,009.79 7,157,168.02 477,438.11 5,388,633.83
Dividend receivable - - - - Subscription receivable - - - -
Sales of investments receivable - 606,250.00 - 276,347.53
Other assets - - - -
TOTAL ASSETS 6,750,396.00 385,271,594.51 35,085,581.64 289,262,755.30
LIABILITIES
Unrealised loss on foreign exchange contracts (note 11)
- 514,146.15 - -
Fixed administration fee payable (note 6) 2,779.49 80,989.16 10,321.94 60,997.39
Investment management fee payable (note 7) 7,386.16 178,179.37 17,833.71 160,376.05
Redemption payable - - - -
Performance fee payable (note 8) 0.41 - - -
Other liabilities 488.38 9,118.81 5,367.65 7,067.06
TOTAL LIABILITIES 10,654.44 782,433.49 33,523.30 228,440.50
TOTAL NET ASSETS 6,739,741.56 384,489,161.02 35,052,058.34 289,034,314.80
Global Evolution Funds - ANNUAL REPORT 2020
The accompanying notes are an integral part of these financial statements.
22
Conning Global High Dividend
Equity
USD
ASSETS
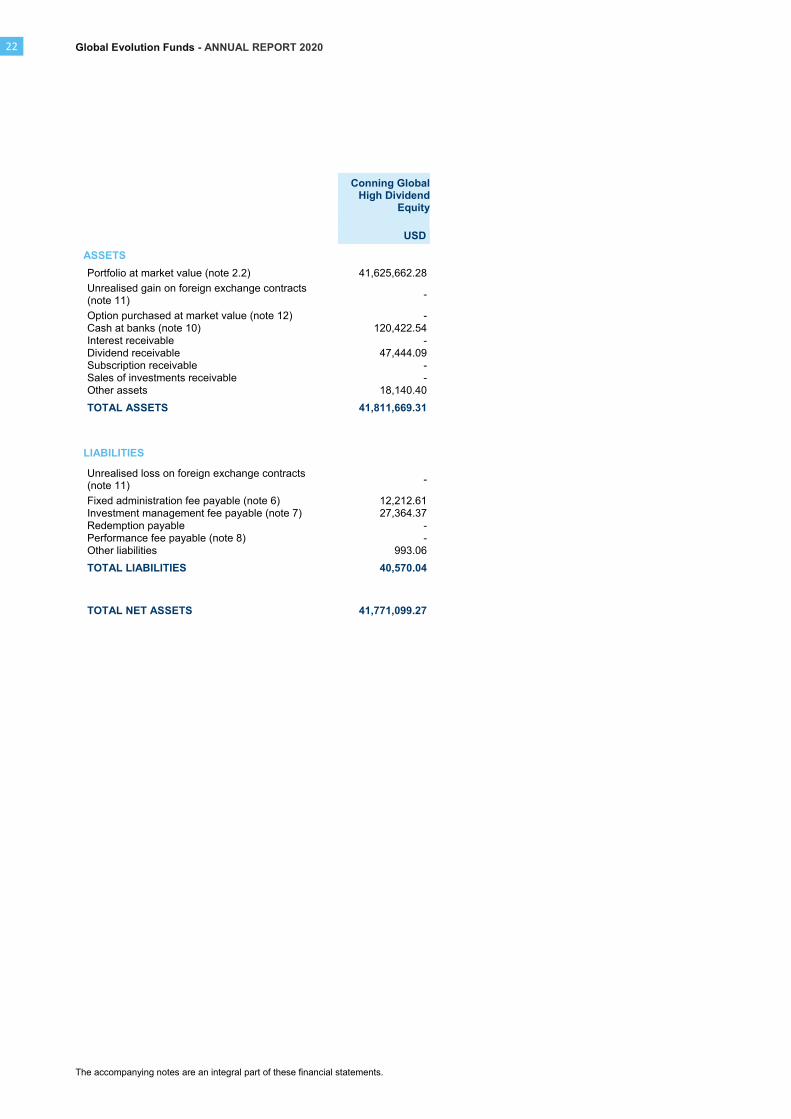
Portfolio at market value (note 2.2) 41,625,662.28
Unrealised gain on foreign exchange contracts (note 11)
-
Option purchased at market value (note 12) -
Cash at banks (note 10) 120,422.54
Interest receivable -
Dividend receivable 47,444.09 Subscription receivable -
Sales of investments receivable -
Other assets 18,140.40
TOTAL ASSETS 41,811,669.31
LIABILITIES
Unrealised loss on foreign exchange contracts (note 11)
-
Fixed administration fee payable (note 6) 12,212.61
Investment management fee payable (note 7) 27,364.37
Redemption payable -
Performance fee payable (note 8) -
Other liabilities 993.06
TOTAL LIABILITIES 40,570.04
TOTAL NET ASSETS 41,771,099.27

Global Evolution Funds - ANNUAL REPORT 2020
The accompanying notes are an integral part of these financial statements.
23
This page has been intentionally left blank.

Global Evolution Funds - ANNUAL REPORT 2020
Statement of Operations and Changes in Net Assets for the year ending December 31, 2020
The accompanying notes are an integral part of these financial statements.
24
COMBINED Frontier Markets* EM Absolute Debt
EM Debt
EUR USD USD USD
NET ASSET VALUE AT THE BEGINNING OF THE YEAR
3,689,493,915.07 2,731,414,781.80 59,329,738.68 322,280,765.54
Income
Interest on securities (note 2.5) 227,375,846.24 198,404,556.41 3,219,889.59 14,679,558.68
Interest on bank accounts 386,738.53 334,117.04 - 28,310.65
Accretion of market discount (note 2.6) 44,961,937.74 44,766,766.98 750,626.09 962,228.21
Dividend income (note 2.5) 807,764.16 - - -
Other income 4,018.84 4,917.25 - -
TOTAL INCOME 273,536,305.51 243,510,357.68 3,970,515.68 15,670,097.54
EXPENSES
Interest on bank overdraft 428.28 - 524.02 -
Fixed Administration fee (note 6) 12,177,111.90 11,407,466.96 274,256.88 1,026,027.81
Investment management fee (note 7) 26,921,302.41 25,194,378.74 610,022.02 2,198,640.25
Performance fee (note 8) 1,581,049.79 1,934,485.00 7.89 - Amortization of market premium (note 2.6) 27,085,783.95 29,590,297.04 541,296.56 1,082,663.66
Other expenses 181,702.21 150,526.83 3,378.51 16,423.02
TOTAL EXPENSES 67,947,378.54 68,277,154.57 1,429,485.88 4,323,754.74
NET INCOME/(LOSS) FROM INVESTMENTS 205,588,926.97 175,233,203.11 2,541,029.80 11,346,342.80
NET REALISED GAIN/(LOSS)
- on securities (note 2.3) (113,842,457.62) (102,838,125.49) (4,238,207.89) (9,397,648.18)
- on forward foreign exchange contracts 6,099,289.06 (8,179,750.68) 1,830,753.98 6,666,081.14 - on options (9,337.49) - (11,424.89) -
- on swaps - - - -
- on spot foreign exchange 15,591,973.16 28,026,551.76 (115,717.81) 5,014,150.09
TOTAL NET REALISED GAIN/(LOSS) (92,160,532.89) (82,991,324.41) (2,534,596.61) 2,282,583.05
NET CHANGE IN UNREALISED GAIN/(LOSS)
- on securities (note 2.4) (45,168,745.90) (38,644,041.92) 4,969,122.99 10,222,457.90
- on forward foreign exchange contracts 25,074,381.63 19,828,342.21 877,810.20 (780,837.99)
- on options (45,514.18) - (55,688.87) -
- on swaps - - - -
- on spot foreign exchange 528,434.22 954,727.64 9,764.31 33,537.31
TOTAL NET CHANGE IN UNREALISED GAIN/(LOSS) (19,611,444.23) (17,860,972.07) 5,801,008.63 9,475,157.22
Net proceeds from subscriptions/redemptions (602,780,111.77) (444,888,690.78) (445,004.02) (50,303,990.01)
Dividends paid (8,707,186.50) (10,653,677.57) - - Currency Translation (277,729,295.26)
NET ASSET VALUE AT THE END OF THE YEAR 2,894,094,271.39 2,350,253,320.08 64,692,176.48 295,080,858.60
*On January 17, 2020, the reference currency for Sub Fund Frontier Markets changed from EUR to USD. As of conversion date Profit & Loss EUR Balances were converted from to USD with the applicable exchange rate of the conversion date.
Global Evolution Funds - ANNUAL REPORT 2020
The accompanying notes are an integral part of these financial statements.
25
EM Blended Debt Emerging Frontier
Emerging Markets
Local Debt
Frontier Opportunities
EUR USD EUR EUR
NET ASSET VALUE AT THE BEGINNING OF THE YEAR
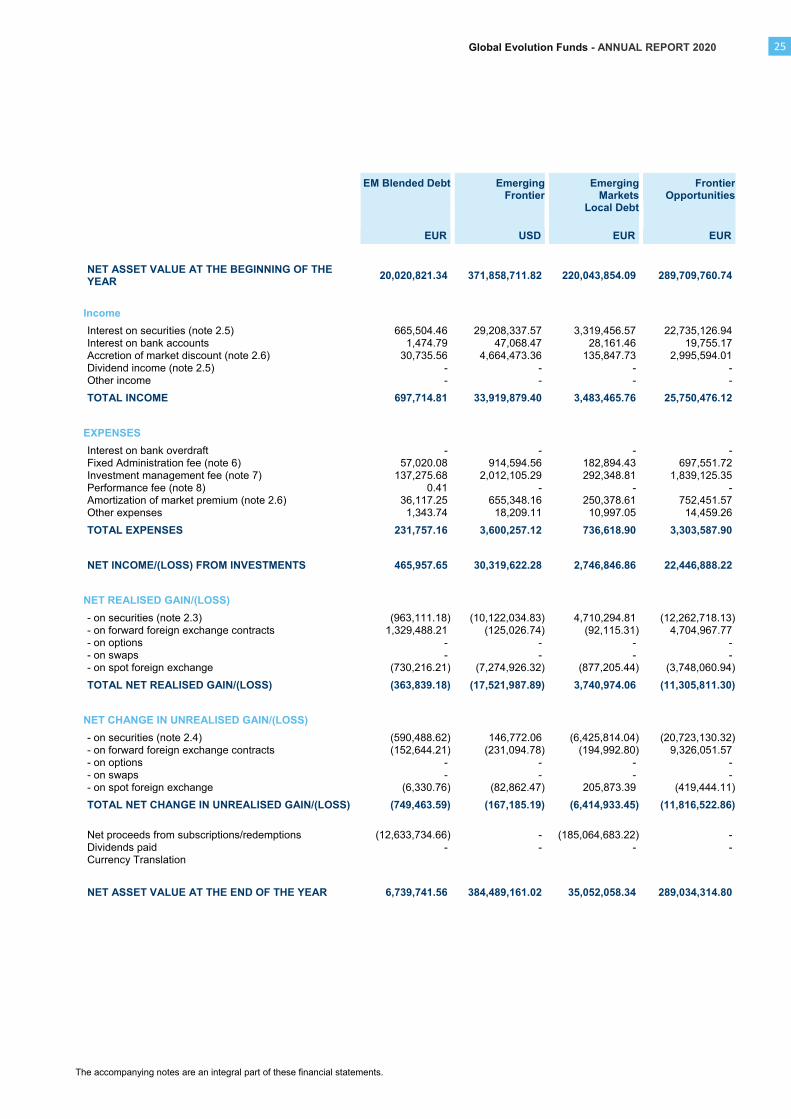
20,020,821.34 371,858,711.82 220,043,854.09 289,709,760.74
Income
Interest on securities (note 2.5) 665,504.46 29,208,337.57 3,319,456.57 22,735,126.94
Interest on bank accounts 1,474.79 47,068.47 28,161.46 19,755.17
Accretion of market discount (note 2.6) 30,735.56 4,664,473.36 135,847.73 2,995,594.01
Dividend income (note 2.5) - - - -
Other income - - - -
TOTAL INCOME 697,714.81 33,919,879.40 3,483,465.76 25,750,476.12
EXPENSES
Interest on bank overdraft - - - -
Fixed Administration fee (note 6) 57,020.08 914,594.56 182,894.43 697,551.72
Investment management fee (note 7) 137,275.68 2,012,105.29 292,348.81 1,839,125.35
Performance fee (note 8) 0.41 - - - Amortization of market premium (note 2.6) 36,117.25 655,348.16 250,378.61 752,451.57
Other expenses 1,343.74 18,209.11 10,997.05 14,459.26
TOTAL EXPENSES 231,757.16 3,600,257.12 736,618.90 3,303,587.90
NET INCOME/(LOSS) FROM INVESTMENTS 465,957.65 30,319,622.28 2,746,846.86 22,446,888.22
NET REALISED GAIN/(LOSS)
- on securities (note 2.3) (963,111.18) (10,122,034.83) 4,710,294.81 (12,262,718.13)
- on forward foreign exchange contracts 1,329,488.21 (125,026.74) (92,115.31) 4,704,967.77 - on options - - - -
- on swaps - - - -
- on spot foreign exchange (730,216.21) (7,274,926.32) (877,205.44) (3,748,060.94)
TOTAL NET REALISED GAIN/(LOSS) (363,839.18) (17,521,987.89) 3,740,974.06 (11,305,811.30)
NET CHANGE IN UNREALISED GAIN/(LOSS)
- on securities (note 2.4) (590,488.62) 146,772.06 (6,425,814.04) (20,723,130.32)
- on forward foreign exchange contracts (152,644.21) (231,094.78) (194,992.80) 9,326,051.57
- on options - - - -
- on swaps - - - -
- on spot foreign exchange (6,330.76) (82,862.47) 205,873.39 (419,444.11)
TOTAL NET CHANGE IN UNREALISED GAIN/(LOSS) (749,463.59) (167,185.19) (6,414,933.45) (11,816,522.86)
Net proceeds from subscriptions/redemptions (12,633,734.66) - (185,064,683.22) -
Dividends paid - - - - Currency Translation
NET ASSET VALUE AT THE END OF THE YEAR 6,739,741.56 384,489,161.02 35,052,058.34 289,034,314.80

Global Evolution Funds - ANNUAL REPORT 2020
The accompanying notes are an integral part of these financial statements.
26
Conning Global High Dividend
Equity
USD
NET ASSET VALUE AT THE BEGINNING OF THE YEAR
41,374,936.59
Income
Interest on securities (note 2.5) -
Interest on bank accounts 3,264.88
Accretion of market discount (note 2.6) -
Dividend income (note 2.5) 988,339.79
Other income -
TOTAL INCOME 991,604.67
EXPENSES
Interest on bank overdraft -
Fixed Administration fee (note 6) 129,921.65
Investment management fee (note 7) 148,483.07
Performance fee (note 8) - Amortization of market premium (note 2.6) -
Other expenses 993.06
TOTAL EXPENSES 279,397.78
NET INCOME/(LOSS) FROM INVESTMENTS 712,206.89
NET REALISED GAIN/(LOSS)
- on securities (note 2.3) (2,276,734.74)
- on forward foreign exchange contracts (23.51)- on options -
- on swaps -
- on spot foreign exchange (19,799.36)
TOTAL NET REALISED GAIN/(LOSS) (2,296,557.61)
NET CHANGE IN UNREALISED GAIN/(LOSS)
- on securities (note 2.4) 1,980,054.08
- on forward foreign exchange contracts -
- on options -
- on swaps -
- on spot foreign exchange 459.32
TOTAL NET CHANGE IN UNREALISED GAIN/(LOSS) 1,980,513.40
Net proceeds from subscriptions/redemptions -
Dividends paid - Currency Translation
NET ASSET VALUE AT THE END OF THE YEAR 41,771,099.27

Global Evolution Funds - ANNUAL REPORT 2020
The accompanying notes are an integral part of these financial statements.
27
This page has been intentionally left blank.
Global Evolution Funds - ANNUAL REPORT 2020
Statistical information
The accompanying notes are an integral part of these financial statements.
28
Sub-fund and Share Class Currency Number ofshares
outstanding
31.12.2020
Net asset value
per share
31.12.2020
Net asset value
per share
31.12.2019
Net asset value
per share
31.12.2018
Frontier Markets
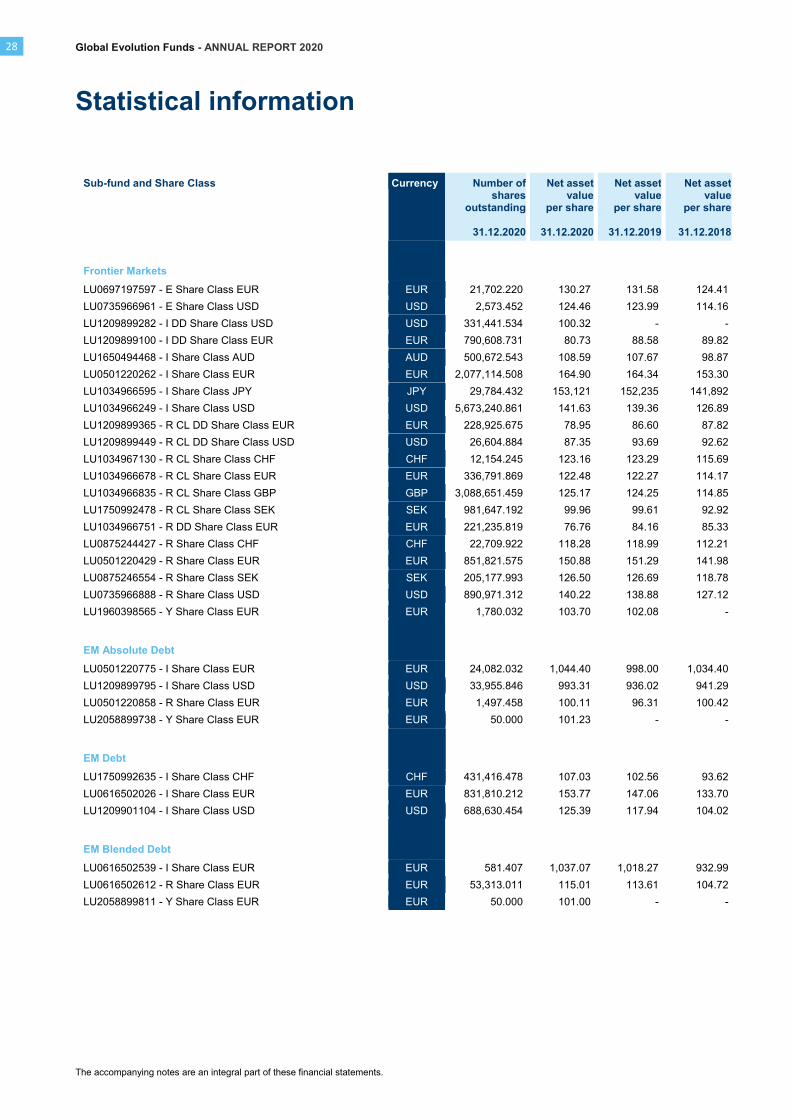
LU0697197597 - E Share Class EUR EUR 21,702.220 130.27 131.58 124.41
LU0735966961 - E Share Class USD USD 2,573.452 124.46 123.99 114.16
LU1209899282 - I DD Share Class USD USD 331,441.534 100.32 - -
LU1209899100 - I DD Share Class EUR EUR 790,608.731 80.73 88.58 89.82
LU1650494468 - I Share Class AUD AUD 500,672.543 108.59 107.67 98.87
LU0501220262 - I Share Class EUR EUR 2,077,114.508 164.90 164.34 153.30
LU1034966595 - I Share Class JPY JPY 29,784.432 153,121 152,235 141,892
LU1034966249 - I Share Class USD USD 5,673,240.861 141.63 139.36 126.89
LU1209899365 - R CL DD Share Class EUR EUR 228,925.675 78.95 86.60 87.82
LU1209899449 - R CL DD Share Class USD USD 26,604.884 87.35 93.69 92.62
LU1034967130 - R CL Share Class CHF CHF 12,154.245 123.16 123.29 115.69
LU1034966678 - R CL Share Class EUR EUR 336,791.869 122.48 122.27 114.17
LU1034966835 - R CL Share Class GBP GBP 3,088,651.459 125.17 124.25 114.85
LU1750992478 - R CL Share Class SEK SEK 981,647.192 99.96 99.61 92.92
LU1034966751 - R DD Share Class EUR EUR 221,235.819 76.76 84.16 85.33
LU0875244427 - R Share Class CHF CHF 22,709.922 118.28 118.99 112.21
LU0501220429 - R Share Class EUR EUR 851,821.575 150.88 151.29 141.98
LU0875246554 - R Share Class SEK SEK 205,177.993 126.50 126.69 118.78
LU0735966888 - R Share Class USD USD 890,971.312 140.22 138.88 127.12
LU1960398565 - Y Share Class EUR EUR 1,780.032 103.70 102.08 -
EM Absolute Debt
LU0501220775 - I Share Class EUR EUR 24,082.032 1,044.40 998.00 1,034.40
LU1209899795 - I Share Class USD USD 33,955.846 993.31 936.02 941.29
LU0501220858 - R Share Class EUR EUR 1,497.458 100.11 96.31 100.42
LU2058899738 - Y Share Class EUR EUR 50.000 101.23 - -
EM Debt
LU1750992635 - I Share Class CHF CHF 431,416.478 107.03 102.56 93.62
LU0616502026 - I Share Class EUR EUR 831,810.212 153.77 147.06 133.70
LU1209901104 - I Share Class USD USD 688,630.454 125.39 117.94 104.02
EM Blended Debt
LU0616502539 - I Share Class EUR EUR 581.407 1,037.07 1,018.27 932.99
LU0616502612 - R Share Class EUR EUR 53,313.011 115.01 113.61 104.72
LU2058899811 - Y Share Class EUR EUR 50.000 101.00 - -
Global Evolution Funds - ANNUAL REPORT 2020
The accompanying notes are an integral part of these financial statements.
29
Sub-fund and Share Class Currency Number ofshares
outstanding
31.12.2020
Net asset value
per share
31.12.2020
Net asset value
per share
31.12.2019
Net asset value
per share
31.12.2018
Emerging Frontier
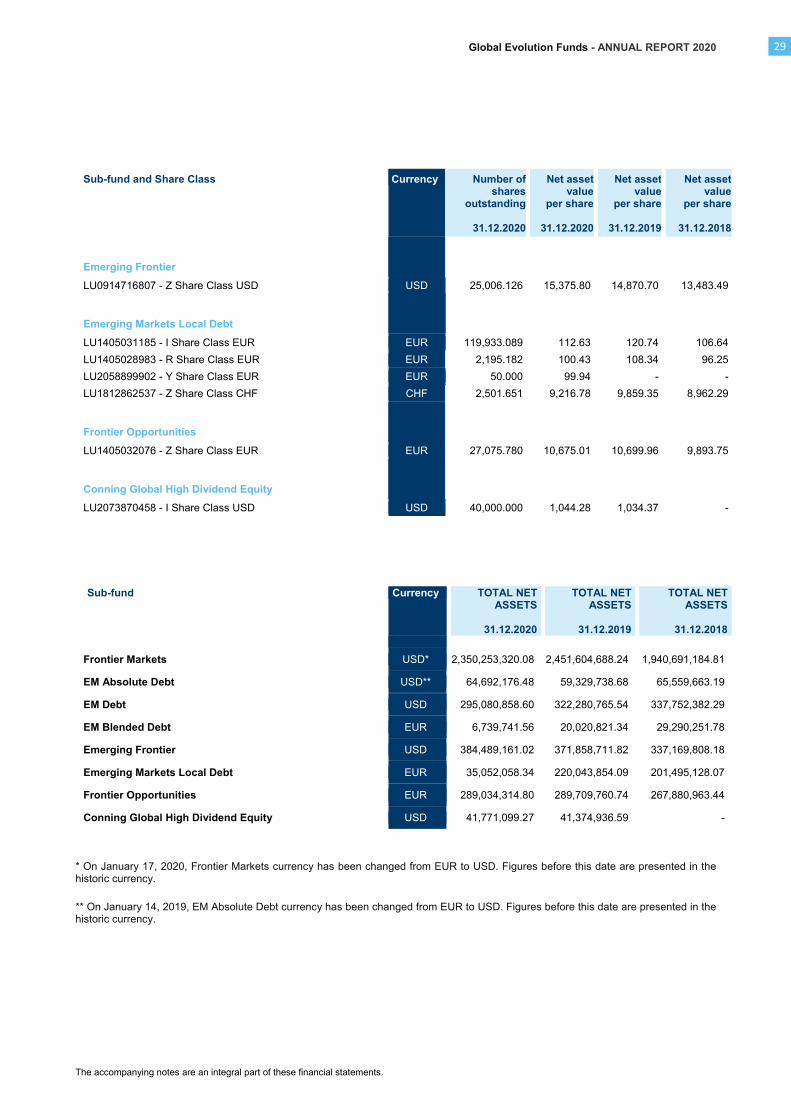
LU0914716807 - Z Share Class USD USD 25,006.126 15,375.80 14,870.70 13,483.49
Emerging Markets Local Debt
LU1405031185 - I Share Class EUR EUR 119,933.089 112.63 120.74 106.64
LU1405028983 - R Share Class EUR EUR 2,195.182 100.43 108.34 96.25
LU2058899902 - Y Share Class EUR EUR 50.000 99.94 - -
LU1812862537 - Z Share Class CHF CHF 2,501.651 9,216.78 9,859.35 8,962.29
Frontier Opportunities
LU1405032076 - Z Share Class EUR EUR 27,075.780 10,675.01 10,699.96 9,893.75
Conning Global High Dividend Equity
LU2073870458 - I Share Class USD USD 40,000.000 1,044.28 1,034.37 -
Sub-fund Currency TOTAL NET ASSETS
31.12.2020
TOTAL NET ASSETS
31.12.2019
TOTAL NET ASSETS
31.12.2018
Frontier Markets USD* 2,350,253,320.08 2,451,604,688.24 1,940,691,184.81
EM Absolute Debt USD** 64,692,176.48 59,329,738.68 65,559,663.19
EM Debt USD 295,080,858.60 322,280,765.54 337,752,382.29
EM Blended Debt EUR 6,739,741.56 20,020,821.34 29,290,251.78
Emerging Frontier USD 384,489,161.02 371,858,711.82 337,169,808.18
Emerging Markets Local Debt EUR 35,052,058.34 220,043,854.09 201,495,128.07
Frontier Opportunities EUR 289,034,314.80 289,709,760.74 267,880,963.44
Conning Global High Dividend Equity USD 41,771,099.27 41,374,936.59 -
* On January 17, 2020, Frontier Markets currency has been changed from EUR to USD. Figures before this date are presented in the historic currency.
** On January 14, 2019, EM Absolute Debt currency has been changed from EUR to USD. Figures before this date are presented in the historic currency.

Global Evolution Funds - ANNUAL REPORT 2020
Schedule of Investments and Other Net Assets as of December 31, 2020 (in USD)
The accompanying notes are an integral part of these financial statements.
30 Frontier Markets
DESCRIPTION Currency QUANTITY/NOMINAL
VALUE
MARKET VALUE
(in USD)
% OFNET
ASSETS
TRANSFERABLE SECURITIES ADMITTED TO OFFICIAL STOCK EXCHANGE LISTING OR TRADED ON ANOTHER REGULATED MARKET
Angola
XS1318576086 Angola 9.5% 12/11/2025 USD 18,061,000 18,812,427.91 0.80 XS1337184193 Aurora Australis BV CLN FRN 19/12/2023 USD 7,788,750 7,486,546.50 0.32
XS1819680288 Angola 8.25% 09/05/2028 USD 31,810,000 30,598,802.44 1.30
XS1819680528 Angola 9.375% 08/05/2048 USD 35,679,000 33,738,954.38 1.44
Total in Angola 90,636,731.23 3.86
Argentina
US040114HS26 Argentina 0.125% 09/07/2030 USD 7,511,134 3,057,031.54 0.13 US040114HT09 Argentina 0.125% 09/07/2035 USD 85,045,980 31,211,874.66 1.33
US040114HX11 Argentina 1% 09/07/2029 USD 3,322,870 1,447,973.83 0.06
XS1649634034 Buenos Aires 5.375% 20/01/2023 (flat trading) EUR 12,800,000 5,872,856.11 0.25
Total in Argentina 41,589,736.14 1.77
Azerbaijan
XS1505657079 Frontera Capital BV CLN VAR 18/10/2021 USD 3,491,000 3,331,810.40 0.14 XS2201941247 Frontera Capital BV CLN 10% 01/08/2023 AZN 12,575,000 7,401,406.38 0.31
Total in Azerbaijan 10,733,216.78 0.45
Belarus
XS1981779975 Dev. Bank of the Republic of Belarus 12% 15/05/2022 BYN 32,000,000 12,584,171.58 0.54
Total in Belarus 12,584,171.58 0.54
Bosnia and Herzegovina
XS0082227546 Bosnia and Herzegovina FRN 20/12/2021 DEM 2,802,997 1,695,848.30 0.07
Total in Bosnia and Herzegovina 1,695,848.30 0.07
Cameroon
XS1313779081 Cameroon 9.5% 19/11/2025 USD 30,328,000 33,850,597.20 1.44
Total in Cameroon 33,850,597.20 1.44
Côte d'Ivoire
XS0496488395 Côte d'Ivoire 5.75% 31/12/2032 USD 15,453,585 15,637,699.01 0.67
XS1793329225 Côte d'Ivoire 5.25% 22/03/2030 EUR 37,700,000 49,608,777.62 2.11
XS1796266754 Côte d'Ivoire 6.625% 22/03/2048 EUR 15,500,000 21,072,114.21 0.90
XS2264871828 Côte d'Ivoire 4.875% 30/01/2032 EUR 1,319,000 1,663,698.45 0.07
Total in Côte d'Ivoire 87,982,289.29 3.75

Global Evolution Funds - ANNUAL REPORT 2020
The accompanying notes are an integral part of these financial statements.
Frontier Markets 31
DESCRIPTION Currency QUANTITY/NOMINAL
VALUE
MARKET VALUE
(in USD)
% OFNET
ASSETS
TRANSFERABLE SECURITIES ADMITTED TO OFFICIAL STOCK EXCHANGE LISTING OR TRADED ON ANOTHER REGULATED MARKET (continued)
Dominican Republic
USP3579EBZ99 Dominican Republic 8.9% 15/02/2023 DOP 2,258,000,000 40,154,282.55 1.71 USP3579ECD78 Dominican Republic 9.75% 05/06/2026 DOP 1,494,000,000 27,724,226.38 1.18
XS1084826483 Dominican Republic GDN 11.5% 10/05/2024 DOP 796,400,000 15,612,808.51 0.66
XS1180454321 Dominican Republic GDN 12% 20/01/2022 DOP 34,750,000 634,540.12 0.03
XS1203837528 Dominican Republic GDN 10.375% 04/03/2022 DOP 136,600,000 2,483,962.76 0.11
XS1597325098 Dominican Republic GDN 10.5% 07/04/2023 DOP 940,000,000 17,461,566.92 0.74
Total in Dominican Republic 104,071,387.24 4.43
Ecuador
XS2214237807 Ecuador 0.5% 31/07/2030 USD 17,312,352 11,144,826.60 0.47
XS2214238441 Ecuador 0.5% 31/07/2035 USD 44,428,903 24,269,732.55 1.03
XS2214239175 Ecuador 0.5% 31/07/2040 USD 20,003,264 10,251,872.83 0.44
XS2214239506 Ecuador 0% 31/07/2030 USD 4,776,598 2,286,796.29 0.10
Total in Ecuador 47,953,228.27 2.04
Egypt
XS1633841751 ICBC Standard Bank PLC CLN 18.4% 03/06/2024 EGP 96,967,439 6,994,900.64 0.30
XS1799503674 Frontera Capital BV CLN 15.58% 17/05/2027 EGP 128,000,000 8,894,890.50 0.38
XS1863918378 ICBC Standard Bank PLC CLN 15.7% 09/11/2027 EGP 388,000,000 26,913,674.40 1.15
XS2038507609 ICBC Standard Bank PLC CLN 16.1% 09/05/2029 EGP 281,035,654 19,927,511.52 0.85
XS2119484181 Citigroup Global Markets CLN 0% 04/02/2021 EGP 264,708,267 16,639,073.33 0.71 XS2232102108 Shamrock Capital PLC CLN 0% 20/09/2021 EGP 170,000,000 9,906,351.43 0.42
XS2251937384 ICBC Standard Bank PLC CLN 14.313% 17/10/2023 EGP 209,150,000 13,405,993.22 0.57
XS2267892862 Citigroup Global Markets CLN 14.313% 17/10/2023 EGP 115,000,000 7,642,628.85 0.33
Total in Egypt 110,325,023.89 4.71
El Salvador
USP01012AR71 El Salvador 7.625% 01/02/2041 USD 8,600,000 8,008,836.00 0.34 USP01012CA29 El Salvador 7.1246% 20/01/2050 USD 10,200,000 9,154,500.00 0.39
XS0146173371 El Salvador 8.25% 10/04/2032 USD 7,900,000 7,781,500.00 0.33
Total in El Salvador 24,944,836.00 1.06
Ethiopia
XS1151974877 Ethiopia 6.625% 11/12/2024 USD 24,837,000 25,337,962.29 1.08
Total in Ethiopia 25,337,962.29 1.08
Gabon
XS1003557870 Gabon 6.375% 12/12/2024 USD 8,240,744 8,601,276.55 0.37
XS1245960684 Gabon 6.95% 16/06/2025 USD 10,100,000 10,844,875.00 0.46
XS2113615228 Gabon 6.625% 06/02/2031 USD 14,314,000 14,815,811.77 0.63
Total in Gabon 34,261,963.32 1.46

Global Evolution Funds - ANNUAL REPORT 2020
The accompanying notes are an integral part of these financial statements.
32 Frontier Markets
DESCRIPTION Currency QUANTITY/NOMINAL
VALUE
MARKET VALUE
(in USD)
% OFNET
ASSETS
TRANSFERABLE SECURITIES ADMITTED TO OFFICIAL STOCK EXCHANGE LISTING OR TRADED ON ANOTHER REGULATED MARKET (continued)
Georgia
XS1389210698 Frontera Capital BV CLN VAR 29/10/2021 USD 8,890,000 6,247,892.00 0.27 XS1456452801 Frontera Capital BV CLN VAR 04/08/2021 USD 1,253,886 1,103,169.31 0.05
XS1639850558 Zambezi BV CLN 9.5% 09/08/2022 USD 11,000,000 8,434,800.00 0.36
XS1801123321 FMO NV FRN 06/04/2021 USD 32,500,000 23,952,630.00 1.02
XS2111225103 ICBC Standard Bank PLC CLN 6.75% 13/07/2021 GEL 22,000,000 6,854,695.63 0.29
XS2111225798 ICBC Standard Bank PLC CLN 9.375% 12/04/2022 GEL 40,000,000 12,637,218.22 0.54
XS2270780062 ICBC Standard Bank PLC CLN 9.125% 03/06/2025 GEL 5,000,000 1,580,420.43 0.07 XS2279406545 Frontera Capital Group BV CLN 8.4% 25/01/2024 USD 15,000,000 15,000,000.00 0.64
Total in Georgia 75,810,825.59 3.24
Ghana
GHGGOG041880 Ghana 24.75% 01/03/2021 GHS 15,500,000 2,697,464.94 0.11
GHGGOG042631 Ghana 24.5% 21/06/2021 GHS 14,546,000 2,578,710.18 0.11
GHGGOG042813 Ghana 24.75% 19/07/2021 GHS 20,002,000 3,554,549.99 0.15 GHGGOG043563 Ghana 19% 02/11/2026 GHS 227,746,000 37,006,959.99 1.57
GHGGOG045980 Ghana 18.25% 25/07/2022 GHS 70,550,000 12,096,305.41 0.51
GHGGOG048331 Ghana 16.5% 06/02/2023 GHS 58,539,000 9,661,234.53 0.41
GHGGOG048935 Ghana 16.5% 22/03/2021 GHS 33,450,000 5,754,598.95 0.24
GHGGOG049263 Ghana 16.25% 07/04/2025 GHS 38,000,000 5,808,464.14 0.25
GHGGOG053935 Ghana 21% 27/01/2025 GHS 16,957,000 2,979,735.07 0.13 GHGGOG055500 Ghana 19.7% 23/05/2022 GHS 21,000,000 3,653,228.34 0.16
XS1136935506 Saderea DAC 12.5% 30/11/2026 USD 19,858,612 21,050,129.07 0.90
Total in Ghana 106,841,380.61 4.54
Iraq
XS0240295575 Iraq 5.8% 15/01/2028 USD 13,135,313 12,354,483.85 0.53
XS1662407862 Iraq 6.752% 09/03/2023 USD 23,380,000 22,904,637.84 0.97
Total in Iraq 35,259,121.69 1.50
Kazakhstan
XS1814831563 Dev. Bank Kazakhstan 8.95% 04/05/2023 KZT 1,875,000,000 4,381,876.41 0.19
XS2275031909 Kazakhstan GDN 5% 15/05/2023 KZT 4,250,000,000 9,097,423.24 0.39
Total in Kazakhstan 13,479,299.65 0.58
Kenya
KE3000008130 Kenya 11% 15/09/2025 KES 49,038 458.30 -
KE4000001109 Kenya 11% 12/10/2026 KES 223,900,000 2,127,585.62 0.09
KE4000001653 Kenya 11% 15/03/2027 KES 904,550,000 8,439,646.91 0.36
KE5000004654 Kenya 12.5% 12/05/2025 KES 1,653,950,000 16,098,093.20 0.68
KE5000006659 Kenya 12% 06/10/2031 KES 1,250,900,000 12,116,596.85 0.52
KE5000008093 Kenya 12.5% 10/01/2033 KES 5,550,000,000 56,145,512.06 2.39 KE6000008653 Kenya 10.2% 25/05/2026 KES 100,000,000 930,687.49 0.04
KE6000009545 Kenya 10.9% 11/08/2031 KES 720,000,000 6,660,195.13 0.28
Total in Kenya 102,518,775.56 4.36
Global Evolution Funds - ANNUAL REPORT 2020
The accompanying notes are an integral part of these financial statements.
Frontier Markets 33
DESCRIPTION Currency QUANTITY/NOMINAL
VALUE
MARKET VALUE
(in USD)
% OFNET
ASSETS
TRANSFERABLE SECURITIES ADMITTED TO OFFICIAL STOCK EXCHANGE LISTING OR TRADED ON ANOTHER REGULATED MARKET (continued)
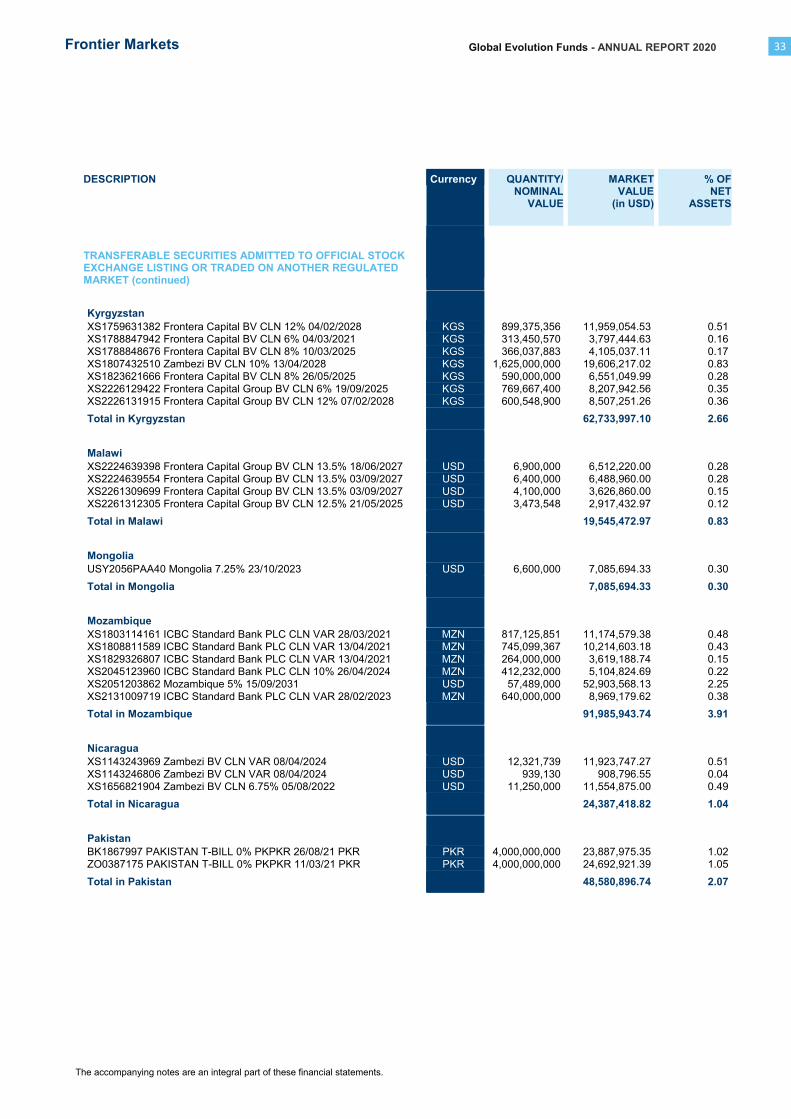
Kyrgyzstan
XS1759631382 Frontera Capital BV CLN 12% 04/02/2028 KGS 899,375,356 11,959,054.53 0.51 XS1788847942 Frontera Capital BV CLN 6% 04/03/2021 KGS 313,450,570 3,797,444.63 0.16
XS1788848676 Frontera Capital BV CLN 8% 10/03/2025 KGS 366,037,883 4,105,037.11 0.17
XS1807432510 Zambezi BV CLN 10% 13/04/2028 KGS 1,625,000,000 19,606,217.02 0.83
XS1823621666 Frontera Capital BV CLN 8% 26/05/2025 KGS 590,000,000 6,551,049.99 0.28
XS2226129422 Frontera Capital Group BV CLN 6% 19/09/2025 KGS 769,667,400 8,207,942.56 0.35
XS2226131915 Frontera Capital Group BV CLN 12% 07/02/2028 KGS 600,548,900 8,507,251.26 0.36
Total in Kyrgyzstan 62,733,997.10 2.66
Malawi
XS2224639398 Frontera Capital Group BV CLN 13.5% 18/06/2027 USD 6,900,000 6,512,220.00 0.28
XS2224639554 Frontera Capital Group BV CLN 13.5% 03/09/2027 USD 6,400,000 6,488,960.00 0.28
XS2261309699 Frontera Capital Group BV CLN 13.5% 03/09/2027 USD 4,100,000 3,626,860.00 0.15
XS2261312305 Frontera Capital Group BV CLN 12.5% 21/05/2025 USD 3,473,548 2,917,432.97 0.12
Total in Malawi 19,545,472.97 0.83
Mongolia
USY2056PAA40 Mongolia 7.25% 23/10/2023 USD 6,600,000 7,085,694.33 0.30
Total in Mongolia 7,085,694.33 0.30
Mozambique
XS1803114161 ICBC Standard Bank PLC CLN VAR 28/03/2021 MZN 817,125,851 11,174,579.38 0.48 XS1808811589 ICBC Standard Bank PLC CLN VAR 13/04/2021 MZN 745,099,367 10,214,603.18 0.43
XS1829326807 ICBC Standard Bank PLC CLN VAR 13/04/2021 MZN 264,000,000 3,619,188.74 0.15
XS2045123960 ICBC Standard Bank PLC CLN 10% 26/04/2024 MZN 412,232,000 5,104,824.69 0.22
XS2051203862 Mozambique 5% 15/09/2031 USD 57,489,000 52,903,568.13 2.25
XS2131009719 ICBC Standard Bank PLC CLN VAR 28/02/2023 MZN 640,000,000 8,969,179.62 0.38
Total in Mozambique 91,985,943.74 3.91
Nicaragua
XS1143243969 Zambezi BV CLN VAR 08/04/2024 USD 12,321,739 11,923,747.27 0.51
XS1143246806 Zambezi BV CLN VAR 08/04/2024 USD 939,130 908,796.55 0.04
XS1656821904 Zambezi BV CLN 6.75% 05/08/2022 USD 11,250,000 11,554,875.00 0.49
Total in Nicaragua 24,387,418.82 1.04
Pakistan
BK1867997 PAKISTAN T-BILL 0% PKPKR 26/08/21 PKR PKR 4,000,000,000 23,887,975.35 1.02
ZO0387175 PAKISTAN T-BILL 0% PKPKR 11/03/21 PKR PKR 4,000,000,000 24,692,921.39 1.05
Total in Pakistan 48,580,896.74 2.07

Global Evolution Funds - ANNUAL REPORT 2020
The accompanying notes are an integral part of these financial statements.
34 Frontier Markets
DESCRIPTION Currency QUANTITY/NOMINAL
VALUE
MARKET VALUE
(in USD)
% OFNET
ASSETS
TRANSFERABLE SECURITIES ADMITTED TO OFFICIAL STOCK EXCHANGE LISTING OR TRADED ON ANOTHER REGULATED MARKET (continued)
Papua New Guinea
USY6726SAP66 Papua New Guinea 8.375% 04/10/2028 USD 23,941,000 24,449,746.25 1.04
Total in Papua New Guinea 24,449,746.25 1.04
Paraguay
XS1467408719 Frontera Capital BV CLN 10% 18/08/2023 USD 1,415,000 1,158,177.50 0.05
XS1633940900 Zambezi BV CLN 11% 23/03/2027 USD 11,600,000 9,998,040.00 0.43
XS1939352495 Frontera Capital BV CLN 11% 15/02/2029 PYG 90,000,000,000 13,227,614.14 0.56
XS2108503504 Frontera Capital BV CLN 8% 10/01/2023 PYG 75,000,000,000 10,910,066.64 0.46
Total in Paraguay 35,293,898.28 1.50
Sri Lanka
USY8137FAF54 Sri Lanka 6.825% 18/07/2026 #N/A 5,000,000 2,900,900.00 0.12
USY8137FAH11 Sri Lanka 6.2% 11/05/2027 USD 13,709,000 7,876,368.86 0.34
USY8137FAL23 Sri Lanka 6.75% 18/04/2028 USD 18,831,000 10,863,227.28 0.46
USY8137FAP37 Sri Lanka 7.85% 14/03/2029 USD 5,845,000 3,394,483.75 0.14 USY8137FAR92 Sri Lanka 7.55% 28/03/2030 USD 33,726,000 19,471,706.10 0.83
Total in Sri Lanka 44,506,685.99 1.89
Supranational
XS1839713523 EBRD 9.5% 21/06/2021 USD 10,000,000 7,809,300.00 0.33
XS1956842436 Intl. Bank Recon. & Dev. 9% 26/02/2021 KZT 11,850,000,000 28,249,745.55 1.20
XS2107448941 Intl. Bank Recon. & Dev. 9.25% 20/01/2023 RWF 23,800,000,000 24,165,102.83 1.03 XS2129433475 EBRD 10% 28/02/2023 USD 34,000,000 29,225,002.74 1.24
XS2170191253 EBRD 10.5% 11/05/2023 USD 13,300,000 12,957,696.99 0.55
XS2231184024 EBRD 7.25% 15/09/2021 USD 22,700,000 22,730,567.26 0.97
XS2231338604 EBRD 14% 14/06/2023 USD 6,800,000 7,495,398.62 0.32
XS2243341760 Intl. Bank Recon. & Dev. 9.1% 14/10/2022 KZT 10,980,000,000 26,419,883.60 1.12
XS2260213298 EBRD 10.4% 23/11/2022 USD 17,550,000 17,651,552.20 0.75
Total in Supranational 176,704,249.79 7.51
Suriname
USP68788AA97 Suriname 9.25% 26/10/2026 (flat trading) USD 13,847,000 8,887,004.60 0.38
Total in Suriname 8,887,004.60 0.38
Tajikistan
XS1676401414 Tajikistan 7.125% 14/09/2027 USD 45,693,000 39,764,333.25 1.69 XS1871090194 Frontera Capital BV CLN 10.78% 15/02/2023 USD 6,128,077 5,226,024.00 0.22
XS2099998978 FMO NV 9.28% 09/01/2022 USD 9,900,000 8,011,345.81 0.34
Total in Tajikistan 53,001,703.06 2.25

Global Evolution Funds - ANNUAL REPORT 2020
The accompanying notes are an integral part of these financial statements.
Frontier Markets 35
DESCRIPTION Currency QUANTITY/NOMINAL
VALUE
MARKET VALUE
(in USD)
% OFNET
ASSETS
TRANSFERABLE SECURITIES ADMITTED TO OFFICIAL STOCK EXCHANGE LISTING OR TRADED ON ANOTHER REGULATED MARKET (continued)
Tanzania, United Republic of
XS1805618896 Zambezi BV CLN 8.65% 23/04/2021 TZS 6,058,333,273 2,615,872.84 0.11
Total in Tanzania, United Republic of 2,615,872.84 0.11
Tunisia
XS1175223699 Banque Centrale de Tunisie SA 5.75% 30/01/2025 USD 22,303,000 20,408,935.12 0.87
XS2023698553 Banque Centrale de Tunisie SA 6.375% 15/07/2026 EUR 11,767,000 13,252,909.99 0.56
Total in Tunisia 33,661,845.11 1.43
Uganda
UG0000001079 Uganda 11% 09/06/2022 UGX 13,100,000,000 3,445,629.36 0.15
UG0000001244 Uganda 11% 13/04/2023 UGX 30,000,000,000 7,608,158.98 0.32
UG0000001533 Uganda 14.25% 23/08/2029 UGX 35,800,000,000 8,994,949.11 0.38
UG12H0707226 Uganda 14.125% 07/07/2022 UGX 48,200,000,000 13,141,527.33 0.56
UG12H1802216 Uganda 18.375% 18/02/2021 UGX 32,500,000,000 9,021,288.84 0.38
UG12H2109215 Uganda 16.5% 21/09/2021 UGX 20,935,000,000 5,961,539.95 0.25 UG12H2810218 Uganda 16.75% 28/10/2021 UGX 47,110,100,000 13,513,071.38 0.57
UG12H2811224 Uganda 12.5% 28/11/2022 UGX 26,435,000,000 6,954,131.73 0.30
UG12J0605277 Uganda 16% 06/05/2027 UGX 1,616,200,000 446,013.51 0.02
UG12J1411303 Uganda 16% 14/11/2030 UGX 5,000,000,000 1,350,373.46 0.06
UG12J2708269 Uganda 16.625% 27/08/2026 UGX 5,656,500,000 1,588,141.08 0.07
UG12K0304317 Uganda 17% 03/04/2031 UGX 18,000,000,000 5,150,725.03 0.22 UG12K0811352 Uganda 16.25% 08/11/2035 UGX 60,000,000,000 16,120,644.25 0.69
UG12K2206346 Uganda 14.25% 22/06/2034 UGX 35,100,000,000 8,546,540.07 0.36
Total in Uganda 101,842,734.08 4.33
Ukraine
XS1710579571 Citigroup Global Markets CLN 14.16% 14/10/2022 UAH 500,000,000 19,111,159.20 0.81
XS1766785189 ICBC Standard Bank PLC CLN 14.91% 14/10/2022 UAH 462,000,000 17,683,168.47 0.75 XS1815292963 Citigroup Global Markets CLN 15.22% 26/04/2023 UAH 260,000,000 10,220,329.54 0.43
XS1840649872 ICBC Standard Bank PLC CLN 15.97% 21/04/2023 UAH 100,000,000 3,927,225.60 0.17
XS2004503533 Citigroup Global Markets CLN 9.3% 28/08/2023 UAH 506,000,000 17,785,439.10 0.76
XS2011002750 ICBC Standard Bank PLC CLN 17% 13/05/2022 UAH 300,000,000 11,552,666.88 0.49
XS2014271774 Ukraine GDN 15.84% 26/02/2025 UAH 300,000,000 11,905,199.88 0.51
XS2277965963 ICBC Standard Bank PLC CLN 15.84% 28/02/2025 UAH 460,000,000 19,017,056.55 0.81
Total in Ukraine 111,202,245.22 4.73
Uruguay
US917288BL51 Uruguay 3.875% 02/07/2040 UYU 2,969,141,000 84,044,103.85 3.58
USP80557BV53 Uruguay 8.5% 15/03/2028 UYU 584,540,000 14,519,417.52 0.62
USP96006AE41 Uruguay 9.875% 20/06/2022 UYU 400,557,000 9,845,356.49 0.42
Total in Uruguay 108,408,877.86 4.62

Global Evolution Funds - ANNUAL REPORT 2020
The accompanying notes are an integral part of these financial statements.
36 Frontier Markets
DESCRIPTION Currency QUANTITY/NOMINAL
VALUE
MARKET VALUE
(in USD)
% OFNET
ASSETS
TRANSFERABLE SECURITIES ADMITTED TO OFFICIAL STOCK EXCHANGE LISTING OR TRADED ON ANOTHER REGULATED MARKET (continued)
Uzbekistan
XS2026817432 Frontera Capital Group BV CLN 12.5% 10/08/2022 UZS 187,000,000,00 18,029,029.52 0.77 XS2093764236 Frontera Capital BV CLN VAR 08/01/2021 USD 8,000,000 7,608,000.00 0.32
XS2093766280 Frontera Capital BV CLN VAR 10/01/2023 USD 8,000,000 7,665,600.00 0.33
XS2093769037 Frontera Capital BV CLN VAR 10/01/2025 USD 8,000,000 7,744,000.00 0.33
XS2093770555 Frontera Capital BV CLN 14.75% 11/01/2027 USD 8,000,000 7,782,400.00 0.33
XS2226716715 Frontera Capital Group BV CLN 12% 21/09/2022 USD 5,200,000 5,198,440.00 0.22
XS2264056313 Uzbekistan 14.5% 25/11/2023 UZS 237,220,000,00 22,981,782.80 0.98
Total in Uzbekistan 77,009,252.32 3.28
Zambia
XS1267081575 Zambia 8.97% 30/07/2027 (flat trading) USD 45,481,000 24,105,612.22 1.03
ZM1000002809 Zambia 12% 23/11/2022 ZMW 8,085,000 278,945.57 0.01
ZM1000002924 Zambia 12% 23/05/2023 ZMW 64,120,000 2,106,040.11 0.09
ZM1000002973 Zambia 11% 29/08/2021 ZMW 269,720,000 11,360,620.67 0.48 ZM1000002999 Zambia 13% 29/08/2026 ZMW 633,285,000 14,869,272.51 0.63
ZM1000003039 Zambia 11% 21/11/2021 ZMW 70,000,000 2,843,478.16 0.12
ZM1000003047 Zambia 12% 21/11/2023 ZMW 10,910,000 336,301.35 0.01
ZM1000003096 Zambia 11% 05/12/2021 ZMW 6,465,000 260,699.14 0.01
ZM1000003104 Zambia 12% 05/12/2023 ZMW 6,465,000 198,199.30 0.01
ZM1000003153 Zambia 11% 27/02/2022 ZMW 17,300,000 673,374.39 0.03 ZM1000003211 Zambia 14% 24/04/2032 ZMW 50,000,000 1,042,824.48 0.04
ZM1000003278 Zambia 11% 04/09/2022 ZMW 340,000,000 12,235,286.50 0.52
ZM1000003351 Zambia 13% 18/12/2027 ZMW 60,000,000 1,345,393.92 0.06
ZM1000003815 Zambia 10% 26/02/2021 ZMW 30,000,000 1,387,455.07 0.06
ZM1000003864 Zambia 12% 23/04/2025 ZMW 78,500,000 2,069,640.12 0.09
ZM1000003872 Zambia 14% 23/04/2033 ZMW 45,000,000 927,152.36 0.04 ZM1000003898 Zambia 12% 04/07/2025 ZMW 75,000,000 1,875,561.27 0.08
ZM1000004433 Zambia 11% 27/07/2025 ZMW 127,000,000 3,011,317.27 0.13
Total in Zambia 80,927,174.41 3.44
Zimbabwe
XS2056560225 Frontera Capital BV CLN VAR 30/04/2021 USD 32,695,837 25,960,494.79 1.10
Total in Zimbabwe 25,960,494.79 1.10
TOTAL TRANSFERABLE SECURITIES ADMITTED TO OFFICIAL STOCK EXCHANGE LISTING OR TRADED ON ANOTHER REGULATED MARKET
2,098,667,602.93 89.30
OTHER TRANSFERABLE SECURITIES
Costa Rica
XS1555634861 Costa Rica GDN 10.12% 20/03/2024 CRC 5,800,000,000 10,390,606.56 0.44
XS1559107989 Costa Rica GDN 10.58% 26/09/2029 CRC 3,700,000,000 6,372,257.31 0.27
XS1563513859 Costa Rica GDN 9.66% 30/09/2026 CRC 18,000,000,000 30,707,117.42 1.31
XS1788369517 Costa Rica GDN 8.05% 18/09/2024 CRC 15,150,000,000 25,410,583.62 1.08 XS1968712338 Costa Rica GDN 9.2% 21/02/2029 USD 13,650,000 14,211,765.75 0.60
Total in Costa Rica 87,092,330.66 3.70

Global Evolution Funds - ANNUAL REPORT 2020
The accompanying notes are an integral part of these financial statements.
Frontier Markets 37
DESCRIPTION Currency QUANTITY/NOMINAL
VALUE
MARKET VALUE
(in USD)
% OFNET
ASSETS
OTHER TRANSFERABLE SECURITIES (continued)
Kazakhstan
XS2267984800 Kazakhstan GDN 5.3% 19/03/2022 KZT 1,460,000,000 3,300,577.17 0.14
Total in Kazakhstan 3,300,577.17 0.14
Zambia
XS2124187902 Zambia 12% 04/07/2025 ZMW 458,000,000 11,207,513.22 0.48
Total in Zambia 11,207,513.22 0.48
TOTAL OTHER TRANSFERABLE SECURITIES 101,600,421.05 4.32
TOTAL INVESTMENT IN SECURITIES 2,200,268,023.98 93.62
Cash and cash equivalent 86,984,887.12 3.70 Other Net Assets 63,000,408.98 2.68
TOTAL NET ASSETS 2,350,253,320.08 100.00
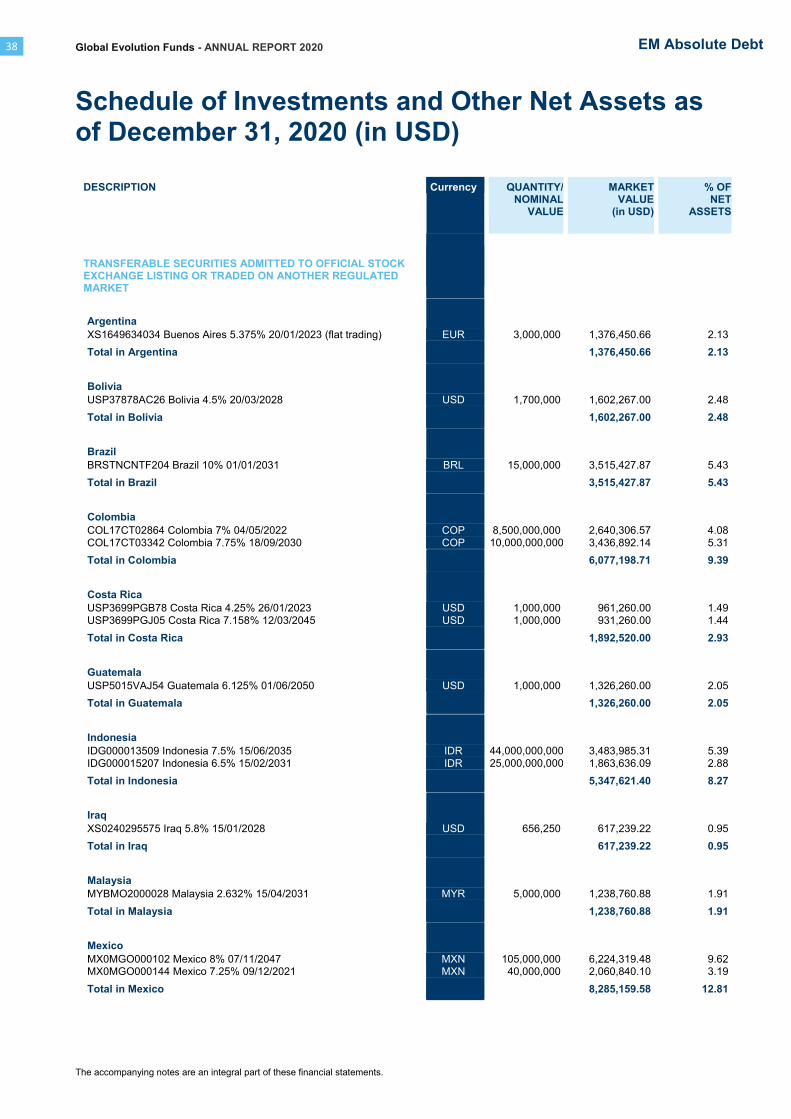
Global Evolution Funds - ANNUAL REPORT 2020
Schedule of Investments and Other Net Assets as of December 31, 2020 (in USD)
The accompanying notes are an integral part of these financial statements.
38 EM Absolute Debt
DESCRIPTION Currency QUANTITY/NOMINAL
VALUE
MARKET VALUE
(in USD)
% OFNET
ASSETS
TRANSFERABLE SECURITIES ADMITTED TO OFFICIAL STOCK EXCHANGE LISTING OR TRADED ON ANOTHER REGULATED MARKET
Argentina
XS1649634034 Buenos Aires 5.375% 20/01/2023 (flat trading) EUR 3,000,000 1,376,450.66 2.13
Total in Argentina 1,376,450.66 2.13
Bolivia
USP37878AC26 Bolivia 4.5% 20/03/2028 USD 1,700,000 1,602,267.00 2.48
Total in Bolivia 1,602,267.00 2.48
Brazil
BRSTNCNTF204 Brazil 10% 01/01/2031 BRL 15,000,000 3,515,427.87 5.43
Total in Brazil 3,515,427.87 5.43
Colombia
COL17CT02864 Colombia 7% 04/05/2022 COP 8,500,000,000 2,640,306.57 4.08
COL17CT03342 Colombia 7.75% 18/09/2030 COP 10,000,000,000 3,436,892.14 5.31
Total in Colombia 6,077,198.71 9.39
Costa Rica
USP3699PGB78 Costa Rica 4.25% 26/01/2023 USD 1,000,000 961,260.00 1.49
USP3699PGJ05 Costa Rica 7.158% 12/03/2045 USD 1,000,000 931,260.00 1.44
Total in Costa Rica 1,892,520.00 2.93
Guatemala
USP5015VAJ54 Guatemala 6.125% 01/06/2050 USD 1,000,000 1,326,260.00 2.05
Total in Guatemala 1,326,260.00 2.05
Indonesia
IDG000013509 Indonesia 7.5% 15/06/2035 IDR 44,000,000,000 3,483,985.31 5.39
IDG000015207 Indonesia 6.5% 15/02/2031 IDR 25,000,000,000 1,863,636.09 2.88
Total in Indonesia 5,347,621.40 8.27
Iraq
XS0240295575 Iraq 5.8% 15/01/2028 USD 656,250 617,239.22 0.95
Total in Iraq 617,239.22 0.95
Malaysia
MYBMO2000028 Malaysia 2.632% 15/04/2031 MYR 5,000,000 1,238,760.88 1.91
Total in Malaysia 1,238,760.88 1.91
Mexico
MX0MGO000102 Mexico 8% 07/11/2047 MXN 105,000,000 6,224,319.48 9.62 MX0MGO000144 Mexico 7.25% 09/12/2021 MXN 40,000,000 2,060,840.10 3.19
Total in Mexico 8,285,159.58 12.81
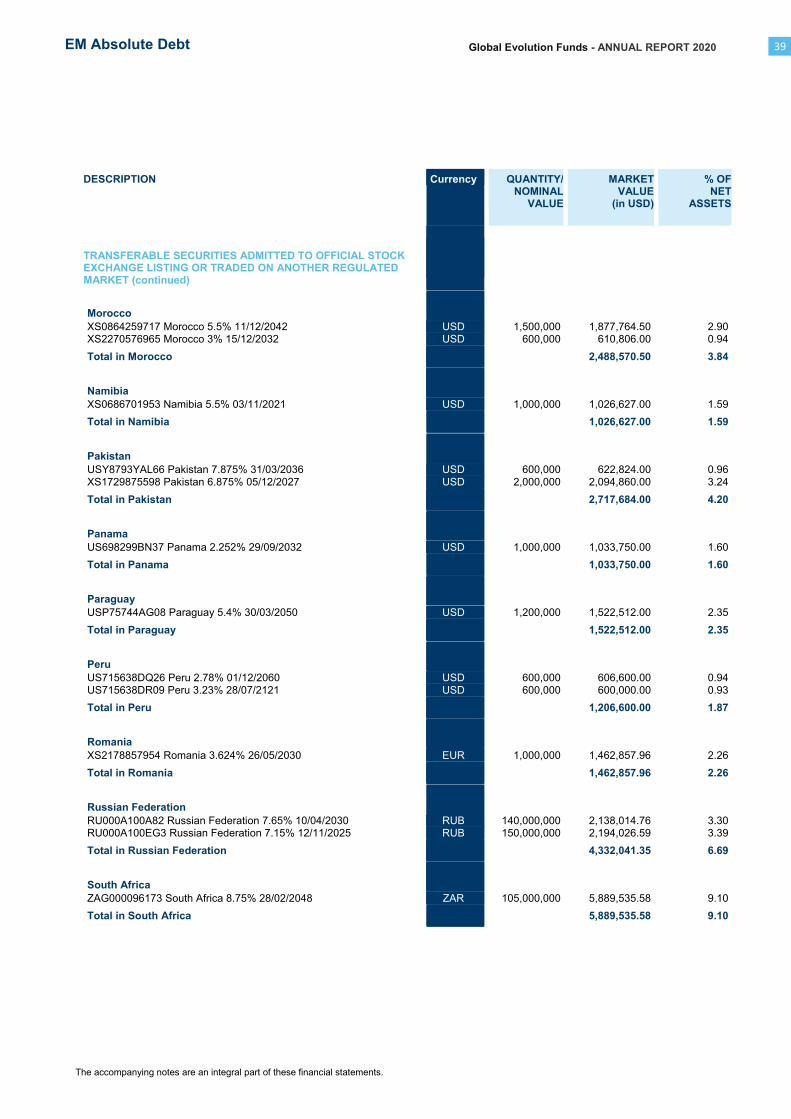
Global Evolution Funds - ANNUAL REPORT 2020
The accompanying notes are an integral part of these financial statements.
EM Absolute Debt 39
DESCRIPTION Currency QUANTITY/NOMINAL
VALUE
MARKET VALUE
(in USD)
% OFNET
ASSETS
TRANSFERABLE SECURITIES ADMITTED TO OFFICIAL STOCK EXCHANGE LISTING OR TRADED ON ANOTHER REGULATED MARKET (continued)
Morocco
XS0864259717 Morocco 5.5% 11/12/2042 USD 1,500,000 1,877,764.50 2.90 XS2270576965 Morocco 3% 15/12/2032 USD 600,000 610,806.00 0.94
Total in Morocco 2,488,570.50 3.84
Namibia
XS0686701953 Namibia 5.5% 03/11/2021 USD 1,000,000 1,026,627.00 1.59
Total in Namibia 1,026,627.00 1.59
Pakistan
USY8793YAL66 Pakistan 7.875% 31/03/2036 USD 600,000 622,824.00 0.96
XS1729875598 Pakistan 6.875% 05/12/2027 USD 2,000,000 2,094,860.00 3.24
Total in Pakistan 2,717,684.00 4.20
Panama
US698299BN37 Panama 2.252% 29/09/2032 USD 1,000,000 1,033,750.00 1.60
Total in Panama 1,033,750.00 1.60
Paraguay
USP75744AG08 Paraguay 5.4% 30/03/2050 USD 1,200,000 1,522,512.00 2.35
Total in Paraguay 1,522,512.00 2.35
Peru
US715638DQ26 Peru 2.78% 01/12/2060 USD 600,000 606,600.00 0.94
US715638DR09 Peru 3.23% 28/07/2121 USD 600,000 600,000.00 0.93
Total in Peru 1,206,600.00 1.87
Romania
XS2178857954 Romania 3.624% 26/05/2030 EUR 1,000,000 1,462,857.96 2.26
Total in Romania 1,462,857.96 2.26
Russian Federation
RU000A100A82 Russian Federation 7.65% 10/04/2030 RUB 140,000,000 2,138,014.76 3.30 RU000A100EG3 Russian Federation 7.15% 12/11/2025 RUB 150,000,000 2,194,026.59 3.39
Total in Russian Federation 4,332,041.35 6.69
South Africa
ZAG000096173 South Africa 8.75% 28/02/2048 ZAR 105,000,000 5,889,535.58 9.10
Total in South Africa 5,889,535.58 9.10
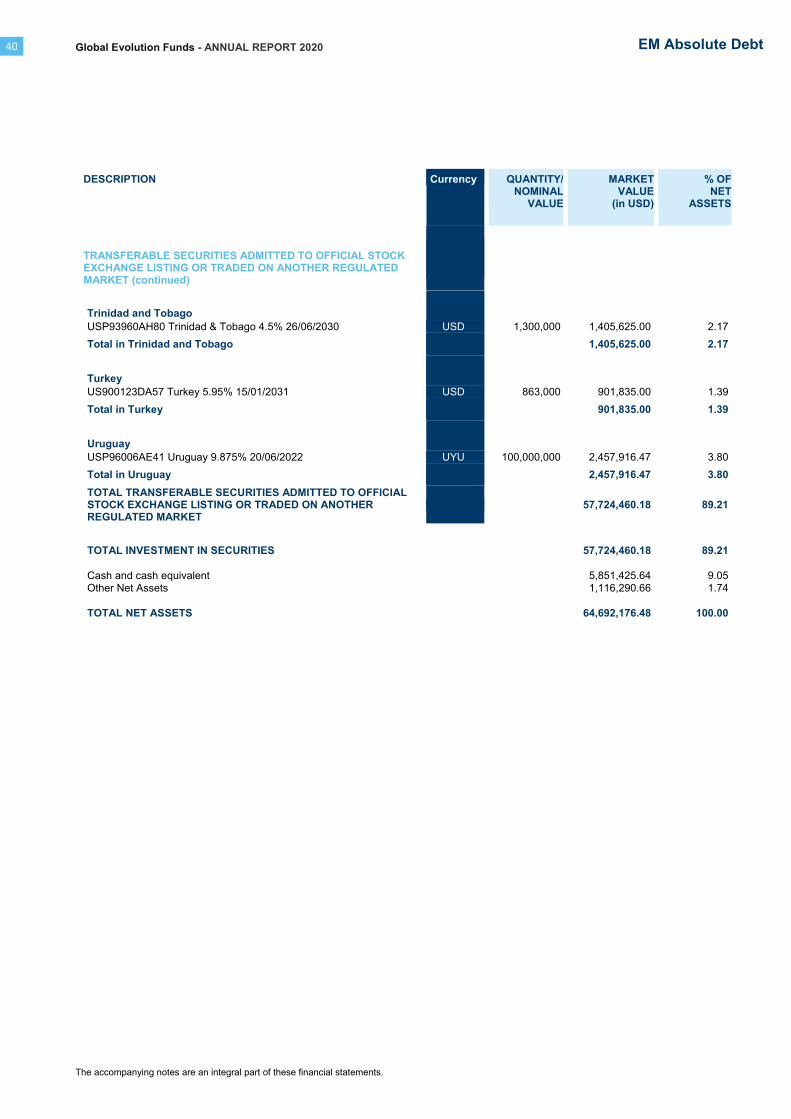
Global Evolution Funds - ANNUAL REPORT 2020
The accompanying notes are an integral part of these financial statements.
40 EM Absolute Debt
DESCRIPTION Currency QUANTITY/NOMINAL
VALUE
MARKET VALUE
(in USD)
% OFNET
ASSETS
TRANSFERABLE SECURITIES ADMITTED TO OFFICIAL STOCK EXCHANGE LISTING OR TRADED ON ANOTHER REGULATED MARKET (continued)
Trinidad and Tobago
USP93960AH80 Trinidad & Tobago 4.5% 26/06/2030 USD 1,300,000 1,405,625.00 2.17
Total in Trinidad and Tobago 1,405,625.00 2.17
Turkey
US900123DA57 Turkey 5.95% 15/01/2031 USD 863,000 901,835.00 1.39
Total in Turkey 901,835.00 1.39
Uruguay
USP96006AE41 Uruguay 9.875% 20/06/2022 UYU 100,000,000 2,457,916.47 3.80
Total in Uruguay 2,457,916.47 3.80
TOTAL TRANSFERABLE SECURITIES ADMITTED TO OFFICIAL STOCK EXCHANGE LISTING OR TRADED ON ANOTHER REGULATED MARKET
57,724,460.18 89.21
TOTAL INVESTMENT IN SECURITIES 57,724,460.18 89.21
Cash and cash equivalent 5,851,425.64 9.05
Other Net Assets 1,116,290.66 1.74
TOTAL NET ASSETS 64,692,176.48 100.00

Global Evolution Funds - ANNUAL REPORT 2020
Schedule of Investments and Other Net Assets as of December 31, 2020 (in USD)
The accompanying notes are an integral part of these financial statements.
EM Debt 41
DESCRIPTION Currency QUANTITY/NOMINAL
VALUE
MARKET VALUE
(in USD)
% OFNET
ASSETS
TRANSFERABLE SECURITIES ADMITTED TO OFFICIAL STOCK EXCHANGE LISTING OR TRADED ON ANOTHER REGULATED MARKET
Albania
XS1877938404 Albania 3.5% 09/10/2025 EUR 650,000 846,815.55 0.29 XS2010031990 Albania 3.5% 16/06/2027 EUR 670,000 877,654.82 0.30
Total in Albania 1,724,470.37 0.59
Angola
XS1318576086 Angola 9.5% 12/11/2025 USD 1,222,000 1,272,841.31 0.43
XS1819680288 Angola 8.25% 09/05/2028 USD 2,514,000 2,418,276.94 0.82
XS1819680528 Angola 9.375% 08/05/2048 USD 3,148,000 2,976,827.50 1.01 XS2083302419 Angola 8% 26/11/2029 USD 200,000 188,508.00 0.06
Total in Angola 6,856,453.75 2.32
Argentina
US040114HU71 Argentina 0.125% 09/01/2038 USD 1,468,233 603,076.70 0.20
US040114HV54 Argentina 0.125% 09/07/2041 USD 4,178,887 1,585,887.62 0.54
US040114HW38 Argentina 0.125% 09/07/2046 USD 2,874,837 1,059,377.43 0.36 US040114HX11 Argentina 1% 09/07/2029 USD 287,008 125,066.61 0.04
XS1380274735 Buenos Aires 9.125% 16/03/2024 (flat trading) USD 3,500,000 1,465,625.00 0.50
XS1649634034 Buenos Aires 5.375% 20/01/2023 (flat trading) EUR 3,473,000 1,593,471.04 0.54
Total in Argentina 6,432,504.40 2.18
Azerbaijan
XS1044540547 Azerbaijan 4.75% 18/03/2024 USD 5,300,000 5,822,431.60 1.97 XS1678623734 Azerbaijan 3.5% 01/09/2032 USD 2,814,000 2,986,357.50 1.01
Total in Azerbaijan 8,808,789.10 2.98
Bahrain
XS1110833123 Bahrain 6% 19/09/2044 USD 370,000 384,397.28 0.13
XS2058948451 Bahrain 5.625% 30/09/2031 USD 1,580,000 1,677,224.67 0.57
XS2226916216 Bahrain 5.45% 16/09/2032 USD 959,000 1,011,612.56 0.34
Total in Bahrain 3,073,234.51 1.04
Belarus
XS2120091991 Belarus 5.875% 24/02/2026 USD 232,000 238,614.32 0.08
XS2120882183 Belarus 6.378% 24/02/2031 USD 1,207,000 1,230,210.61 0.42
Total in Belarus 1,468,824.93 0.50
Brazil
US105756BW95 Brazil 5% 27/01/2045 USD 1,250,000 1,392,868.75 0.47
US105756CB40 Brazil 4.75% 14/01/2050 USD 1,391,000 1,490,630.38 0.51
US105756CC23 Brazil 3.875% 12/06/2030 USD 2,126,000 2,246,650.50 0.76
Total in Brazil 5,130,149.63 1.74

Global Evolution Funds - ANNUAL REPORT 2020
The accompanying notes are an integral part of these financial statements.
42 EM Debt
DESCRIPTION Currency QUANTITY/NOMINAL
VALUE
MARKET VALUE
(in USD)
% OFNET
ASSETS
TRANSFERABLE SECURITIES ADMITTED TO OFFICIAL STOCK EXCHANGE LISTING OR TRADED ON ANOTHER REGULATED MARKET (continued)
Chile
US168863CA49 Chile 3.125% 21/01/2026 USD 1,600,000 1,779,200.00 0.60 US168863DN50 Chile 2.55% 27/01/2032 USD 1,465,000 1,578,537.50 0.53
Total in Chile 3,357,737.50 1.13
Colombia
US195325BR53 Colombia 5.625% 26/02/2044 USD 1,950,000 2,532,075.00 0.86
US195325CX13 Colombia 4.5% 28/01/2026 USD 2,150,000 2,439,938.25 0.83
US195325DR36 Colombia 3% 30/01/2030 USD 1,400,000 1,469,839.00 0.50
Total in Colombia 6,441,852.25 2.19
Costa Rica
USP3699PGE18 Costa Rica 4.375% 30/04/2025 USD 1,600,000 1,497,848.00 0.51
XS1764001373 Costa Rica GDN 6.44% 21/11/2029 USD 3,160,000 2,714,108.20 0.92
Total in Costa Rica 4,211,956.20 1.43
Côte d'Ivoire
XS1793329225 Côte d'Ivoire 5.25% 22/03/2030 EUR 245,000 322,391.27 0.11
XS1796266754 Côte d'Ivoire 6.625% 22/03/2048 EUR 3,466,000 4,711,996.63 1.60
XS2064786754 Côte d'Ivoire 5.875% 17/10/2031 EUR 835,000 1,132,275.70 0.38
XS2064786911 Côte d'Ivoire 6.875% 17/10/2040 EUR 100,000 139,554.19 0.05
Total in Côte d'Ivoire 6,306,217.79 2.14
Croatia
XS0908769887 Croatia 5.5% 04/04/2023 USD 4,500,000 4,963,612.50 1.68
Total in Croatia 4,963,612.50 1.68
Dominican Republic
USP3579EBD87 Dominican Republic 5.5% 27/01/2025 USD 2,000,000 2,257,520.00 0.77
USP3579EBE60 Dominican Republic 6.85% 27/01/2045 USD 3,400,000 4,160,784.00 1.41
USP3579EBK21 Dominican Republic 6.875% 29/01/2026 USD 3,400,000 4,109,784.00 1.39 USP3579EBY25 Dominican Republic 6.5% 15/02/2048 USD 275,000 325,877.75 0.11
USP3579ECE51 Dominican Republic 6.4% 05/06/2049 USD 300,000 353,253.00 0.12
USP3579ECF27 Dominican Republic 4.5% 30/01/2030 USD 460,000 499,679.60 0.17
USP3579ECG00 Dominican Republic 5.875% 30/01/2060 USD 473,000 522,669.73 0.18
USP3579ECH82 Dominican Republic 4.875% 23/09/2032 USD 1,800,000 1,998,018.00 0.68
Total in Dominican Republic 14,227,586.08 4.83
Ecuador
XS2214237807 Ecuador 0.5% 31/07/2030 USD 1,417,122 912,272.29 0.31
XS2214238441 Ecuador 0.5% 31/07/2035 USD 3,713,759 2,028,677.99 0.69
XS2214239175 Ecuador 0.5% 31/07/2040 USD 1,702,046 872,315.60 0.30
XS2214239506 Ecuador 0% 31/07/2030 USD 450,000 215,437.50 0.07
Total in Ecuador 4,028,703.38 1.37

Global Evolution Funds - ANNUAL REPORT 2020
The accompanying notes are an integral part of these financial statements.
EM Debt 43
DESCRIPTION Currency QUANTITY/NOMINAL
VALUE
MARKET VALUE
(in USD)
% OFNET
ASSETS
TRANSFERABLE SECURITIES ADMITTED TO OFFICIAL STOCK EXCHANGE LISTING OR TRADED ON ANOTHER REGULATED MARKET (continued)
Egypt
XS1558078496 Egypt 8.5% 31/01/2047 USD 1,600,000 1,818,600.00 0.62 XS1807305328 Egypt 5.625% 16/04/2030 EUR 4,371,000 5,608,858.48 1.90
XS1980255936 Egypt 6.375% 11/04/2031 EUR 2,793,000 3,684,921.29 1.25
XS2079842642 Egypt 7.0529% 15/01/2032 USD 1,672,000 1,825,615.00 0.62
XS2241075014 Egypt 5.25% 06/10/2025 USD 439,000 467,469.15 0.16
Total in Egypt 13,405,463.92 4.55
El Salvador
USP01012AR71 El Salvador 7.625% 01/02/2041 USD 550,000 512,193.00 0.17
USP01012AT38 El Salvador 6.375% 18/01/2027 USD 1,303,000 1,236,234.28 0.42
USP01012CC84 El Salvador 9.5% 15/07/2052 USD 550,000 558,250.00 0.19
XS0146173371 El Salvador 8.25% 10/04/2032 USD 350,000 344,750.00 0.12
Total in El Salvador 2,651,427.28 0.90
Ghana
XS1297557412 Ghana 10.75% 14/10/2030 USD 569,000 763,250.91 0.26
XS1821416408 Ghana 8.627% 16/06/2049 USD 940,000 965,243.70 0.33
XS2115141751 Ghana 7.875% 11/02/2035 USD 2,335,000 2,409,042.85 0.82
Total in Ghana 4,137,537.46 1.41
Guatemala
USP5015VAD84 Guatemala 5.75% 06/06/2022 USD 500,000 531,875.00 0.18 USP5015VAE67 Guatemala 4.875% 13/02/2028 USD 1,420,000 1,638,325.00 0.56
USP5015VAF33 Guatemala 4.5% 03/05/2026 USD 1,000,000 1,113,750.00 0.38
USP5015VAH98 Guatemala 4.9% 01/06/2030 USD 925,000 1,083,230.50 0.37
USP5015VAJ54 Guatemala 6.125% 01/06/2050 USD 1,161,000 1,539,787.86 0.52
USP5015VAK28 Guatemala 5.375% 24/04/2032 USD 676,000 827,255.00 0.28
Total in Guatemala 6,734,223.36 2.29
Honduras
USP5178RAC27 Honduras 6.25% 19/01/2027 USD 2,110,000 2,452,875.00 0.83
USP5178RAD00 Honduras 5.625% 24/06/2030 USD 1,904,000 2,184,840.00 0.74
Total in Honduras 4,637,715.00 1.57
Hungary
US445545AJ57 Hungary 5.75% 22/11/2023 USD 350,000 399,604.80 0.14 US445545AL04 Hungary 5.375% 25/03/2024 USD 2,916,000 3,331,669.97 1.13
Total in Hungary 3,731,274.77 1.27
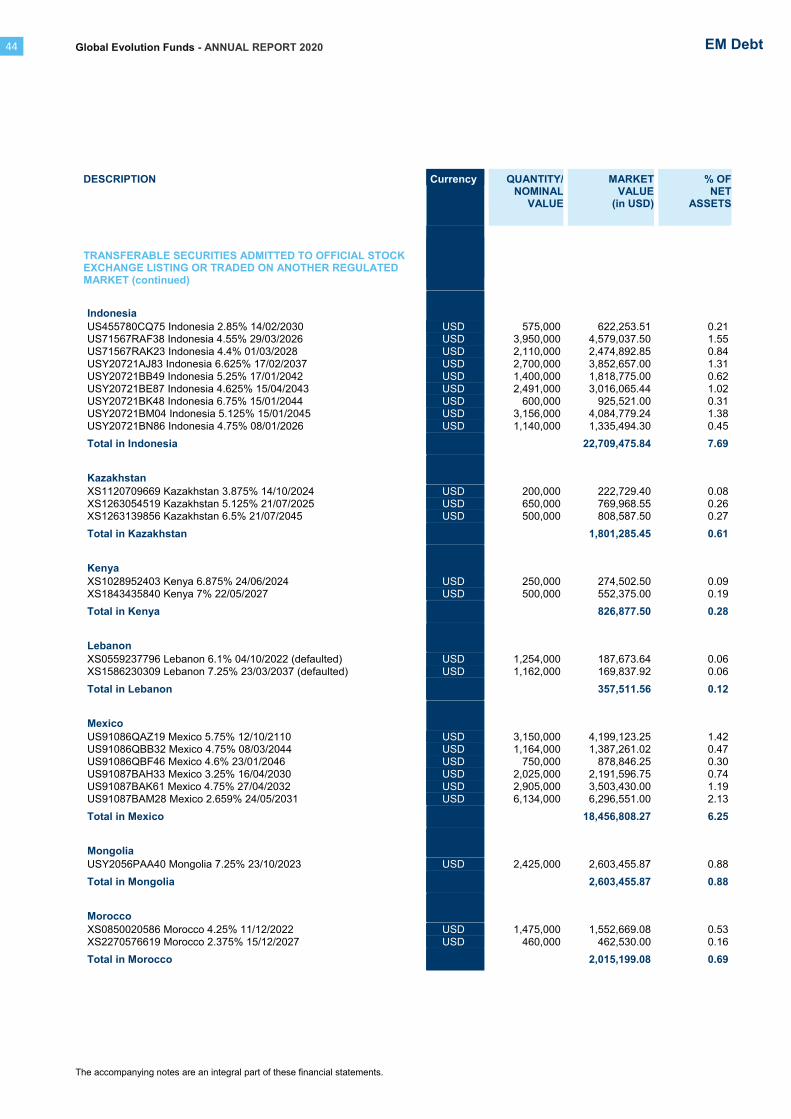
Global Evolution Funds - ANNUAL REPORT 2020
The accompanying notes are an integral part of these financial statements.
44 EM Debt
DESCRIPTION Currency QUANTITY/NOMINAL
VALUE
MARKET VALUE
(in USD)
% OFNET
ASSETS
TRANSFERABLE SECURITIES ADMITTED TO OFFICIAL STOCK EXCHANGE LISTING OR TRADED ON ANOTHER REGULATED MARKET (continued)
Indonesia
US455780CQ75 Indonesia 2.85% 14/02/2030 USD 575,000 622,253.51 0.21 US71567RAF38 Indonesia 4.55% 29/03/2026 USD 3,950,000 4,579,037.50 1.55
US71567RAK23 Indonesia 4.4% 01/03/2028 USD 2,110,000 2,474,892.85 0.84
USY20721AJ83 Indonesia 6.625% 17/02/2037 USD 2,700,000 3,852,657.00 1.31
USY20721BB49 Indonesia 5.25% 17/01/2042 USD 1,400,000 1,818,775.00 0.62
USY20721BE87 Indonesia 4.625% 15/04/2043 USD 2,491,000 3,016,065.44 1.02
USY20721BK48 Indonesia 6.75% 15/01/2044 USD 600,000 925,521.00 0.31 USY20721BM04 Indonesia 5.125% 15/01/2045 USD 3,156,000 4,084,779.24 1.38
USY20721BN86 Indonesia 4.75% 08/01/2026 USD 1,140,000 1,335,494.30 0.45
Total in Indonesia 22,709,475.84 7.69
Kazakhstan
XS1120709669 Kazakhstan 3.875% 14/10/2024 USD 200,000 222,729.40 0.08
XS1263054519 Kazakhstan 5.125% 21/07/2025 USD 650,000 769,968.55 0.26 XS1263139856 Kazakhstan 6.5% 21/07/2045 USD 500,000 808,587.50 0.27
Total in Kazakhstan 1,801,285.45 0.61
Kenya
XS1028952403 Kenya 6.875% 24/06/2024 USD 250,000 274,502.50 0.09
XS1843435840 Kenya 7% 22/05/2027 USD 500,000 552,375.00 0.19
Total in Kenya 826,877.50 0.28
Lebanon
XS0559237796 Lebanon 6.1% 04/10/2022 (defaulted) USD 1,254,000 187,673.64 0.06
XS1586230309 Lebanon 7.25% 23/03/2037 (defaulted) USD 1,162,000 169,837.92 0.06
Total in Lebanon 357,511.56 0.12
Mexico
US91086QAZ19 Mexico 5.75% 12/10/2110 USD 3,150,000 4,199,123.25 1.42 US91086QBB32 Mexico 4.75% 08/03/2044 USD 1,164,000 1,387,261.02 0.47
US91086QBF46 Mexico 4.6% 23/01/2046 USD 750,000 878,846.25 0.30
US91087BAH33 Mexico 3.25% 16/04/2030 USD 2,025,000 2,191,596.75 0.74
US91087BAK61 Mexico 4.75% 27/04/2032 USD 2,905,000 3,503,430.00 1.19
US91087BAM28 Mexico 2.659% 24/05/2031 USD 6,134,000 6,296,551.00 2.13
Total in Mexico 18,456,808.27 6.25
Mongolia
USY2056PAA40 Mongolia 7.25% 23/10/2023 USD 2,425,000 2,603,455.87 0.88
Total in Mongolia 2,603,455.87 0.88
Morocco
XS0850020586 Morocco 4.25% 11/12/2022 USD 1,475,000 1,552,669.08 0.53
XS2270576619 Morocco 2.375% 15/12/2027 USD 460,000 462,530.00 0.16
Total in Morocco 2,015,199.08 0.69
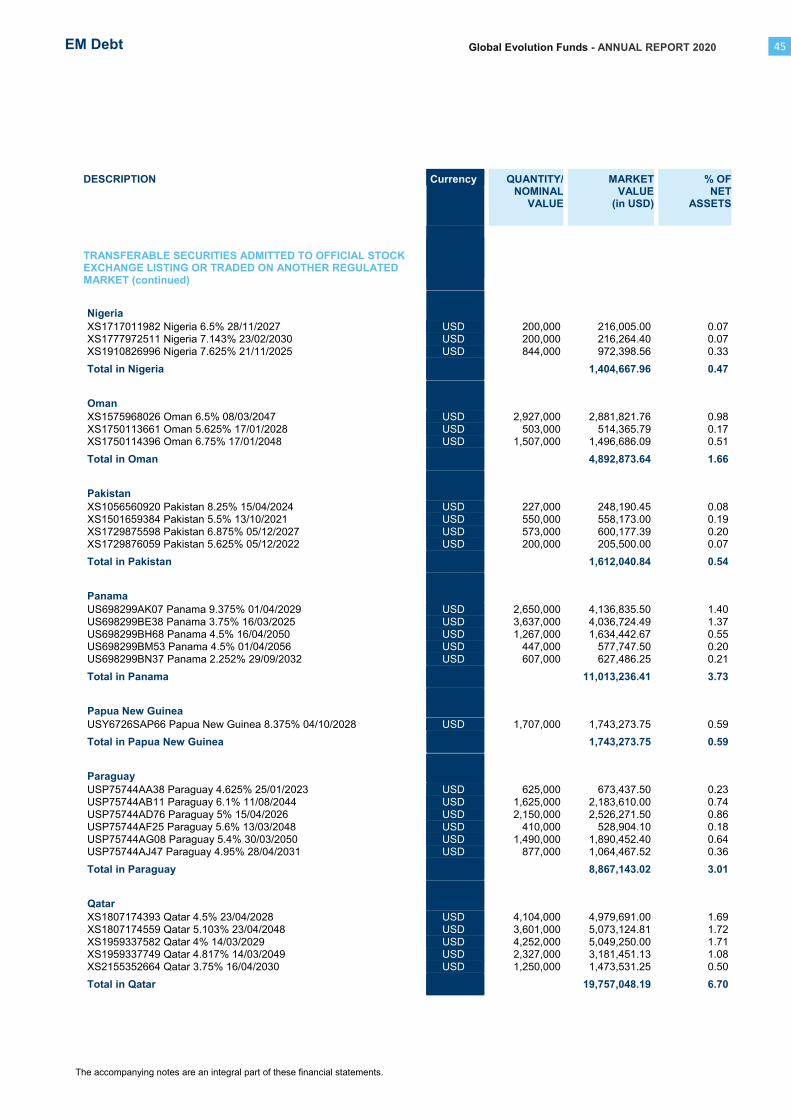
Global Evolution Funds - ANNUAL REPORT 2020
The accompanying notes are an integral part of these financial statements.
EM Debt 45
DESCRIPTION Currency QUANTITY/NOMINAL
VALUE
MARKET VALUE
(in USD)
% OFNET
ASSETS
TRANSFERABLE SECURITIES ADMITTED TO OFFICIAL STOCK EXCHANGE LISTING OR TRADED ON ANOTHER REGULATED MARKET (continued)
Nigeria
XS1717011982 Nigeria 6.5% 28/11/2027 USD 200,000 216,005.00 0.07 XS1777972511 Nigeria 7.143% 23/02/2030 USD 200,000 216,264.40 0.07
XS1910826996 Nigeria 7.625% 21/11/2025 USD 844,000 972,398.56 0.33
Total in Nigeria 1,404,667.96 0.47
Oman
XS1575968026 Oman 6.5% 08/03/2047 USD 2,927,000 2,881,821.76 0.98
XS1750113661 Oman 5.625% 17/01/2028 USD 503,000 514,365.79 0.17 XS1750114396 Oman 6.75% 17/01/2048 USD 1,507,000 1,496,686.09 0.51
Total in Oman 4,892,873.64 1.66
Pakistan
XS1056560920 Pakistan 8.25% 15/04/2024 USD 227,000 248,190.45 0.08
XS1501659384 Pakistan 5.5% 13/10/2021 USD 550,000 558,173.00 0.19
XS1729875598 Pakistan 6.875% 05/12/2027 USD 573,000 600,177.39 0.20 XS1729876059 Pakistan 5.625% 05/12/2022 USD 200,000 205,500.00 0.07
Total in Pakistan 1,612,040.84 0.54
Panama
US698299AK07 Panama 9.375% 01/04/2029 USD 2,650,000 4,136,835.50 1.40
US698299BE38 Panama 3.75% 16/03/2025 USD 3,637,000 4,036,724.49 1.37
US698299BH68 Panama 4.5% 16/04/2050 USD 1,267,000 1,634,442.67 0.55 US698299BM53 Panama 4.5% 01/04/2056 USD 447,000 577,747.50 0.20
US698299BN37 Panama 2.252% 29/09/2032 USD 607,000 627,486.25 0.21
Total in Panama 11,013,236.41 3.73
Papua New Guinea
USY6726SAP66 Papua New Guinea 8.375% 04/10/2028 USD 1,707,000 1,743,273.75 0.59
Total in Papua New Guinea 1,743,273.75 0.59
Paraguay
USP75744AA38 Paraguay 4.625% 25/01/2023 USD 625,000 673,437.50 0.23
USP75744AB11 Paraguay 6.1% 11/08/2044 USD 1,625,000 2,183,610.00 0.74
USP75744AD76 Paraguay 5% 15/04/2026 USD 2,150,000 2,526,271.50 0.86
USP75744AF25 Paraguay 5.6% 13/03/2048 USD 410,000 528,904.10 0.18
USP75744AG08 Paraguay 5.4% 30/03/2050 USD 1,490,000 1,890,452.40 0.64 USP75744AJ47 Paraguay 4.95% 28/04/2031 USD 877,000 1,064,467.52 0.36
Total in Paraguay 8,867,143.02 3.01
Qatar
XS1807174393 Qatar 4.5% 23/04/2028 USD 4,104,000 4,979,691.00 1.69
XS1807174559 Qatar 5.103% 23/04/2048 USD 3,601,000 5,073,124.81 1.72
XS1959337582 Qatar 4% 14/03/2029 USD 4,252,000 5,049,250.00 1.71 XS1959337749 Qatar 4.817% 14/03/2049 USD 2,327,000 3,181,451.13 1.08
XS2155352664 Qatar 3.75% 16/04/2030 USD 1,250,000 1,473,531.25 0.50
Total in Qatar 19,757,048.19 6.70

Global Evolution Funds - ANNUAL REPORT 2020
The accompanying notes are an integral part of these financial statements.
46 EM Debt
DESCRIPTION Currency QUANTITY/NOMINAL
VALUE
MARKET VALUE
(in USD)
% OFNET
ASSETS
TRANSFERABLE SECURITIES ADMITTED TO OFFICIAL STOCK EXCHANGE LISTING OR TRADED ON ANOTHER REGULATED MARKET (continued)
Romania
XS1837994794 Romania 5.125% 15/06/2048 USD 1,726,000 2,213,595.00 0.75 XS2109813142 Romania 3.375% 28/01/2050 EUR 1,054,000 1,487,251.00 0.50
Total in Romania 3,700,846.00 1.25
Russian Federation
RU000A0JWHA4 Russian Federation 4.75% 27/05/2026 USD 1,000,000 1,156,894.00 0.39
RU000A0JXTS9 Russian Federation 4.25% 23/06/2027 USD 3,000,000 3,429,375.00 1.16
RU000A0ZYYN4 Russian Federation 4.375% 21/03/2029 USD 1,000,000 1,168,703.00 0.40 RU000A1006S9 Russian Federation 5.1% 28/03/2035 USD 2,000,000 2,533,720.00 0.86
XS0767472458 Russian Federation 4.5% 04/04/2022 USD 1,600,000 1,673,059.20 0.57
XS0767473852 Russian Federation 5.625% 04/04/2042 USD 800,000 1,114,500.00 0.38
Total in Russian Federation 11,076,251.20 3.76
South Africa
US836205AU87 South Africa 4.3% 12/10/2028 USD 922,000 963,194.96 0.33 US836205AV60 South Africa 5% 12/10/2046 USD 2,475,000 2,330,757.00 0.79
US836205AX27 South Africa 5.65% 27/09/2047 USD 575,000 575,477.25 0.20
US836205BA15 South Africa 4.85% 30/09/2029 USD 200,000 212,888.40 0.07
Total in South Africa 4,082,317.61 1.39
Sri Lanka
USY8137FAH11 Sri Lanka 6.2% 11/05/2027 USD 1,350,000 775,629.00 0.26 USY8137FAR92 Sri Lanka 7.55% 28/03/2030 USD 1,291,000 745,358.85 0.25
Total in Sri Lanka 1,520,987.85 0.51
Tajikistan
XS1676401414 Tajikistan 7.125% 14/09/2027 USD 1,390,000 1,209,647.50 0.41
Total in Tajikistan 1,209,647.50 0.41
Tunisia
XS1567439689 Banque Centrale de Tunisie SA 5.625% 17/02/2024 EUR 700,000 794,885.71 0.27
XS1901183043 Banque Centrale de Tunisie SA 6.75% 31/10/2023 EUR 1,050,000 1,228,327.91 0.42
Total in Tunisia 2,023,213.62 0.69
Turkey
US900123CB40 Turkey 4.875% 16/04/2043 USD 6,713,000 5,895,692.25 2.00
US900123CJ75 Turkey 4.25% 14/04/2026 USD 350,000 347,845.05 0.12 US900123CX69 Turkey 4.25% 13/03/2025 USD 200,000 201,061.60 0.07
US900123CY43 Turkey 5.25% 13/03/2030 USD 984,000 989,589.12 0.34
US900123DA57 Turkey 5.95% 15/01/2031 USD 1,764,000 1,843,380.00 0.62
Total in Turkey 9,277,568.02 3.15
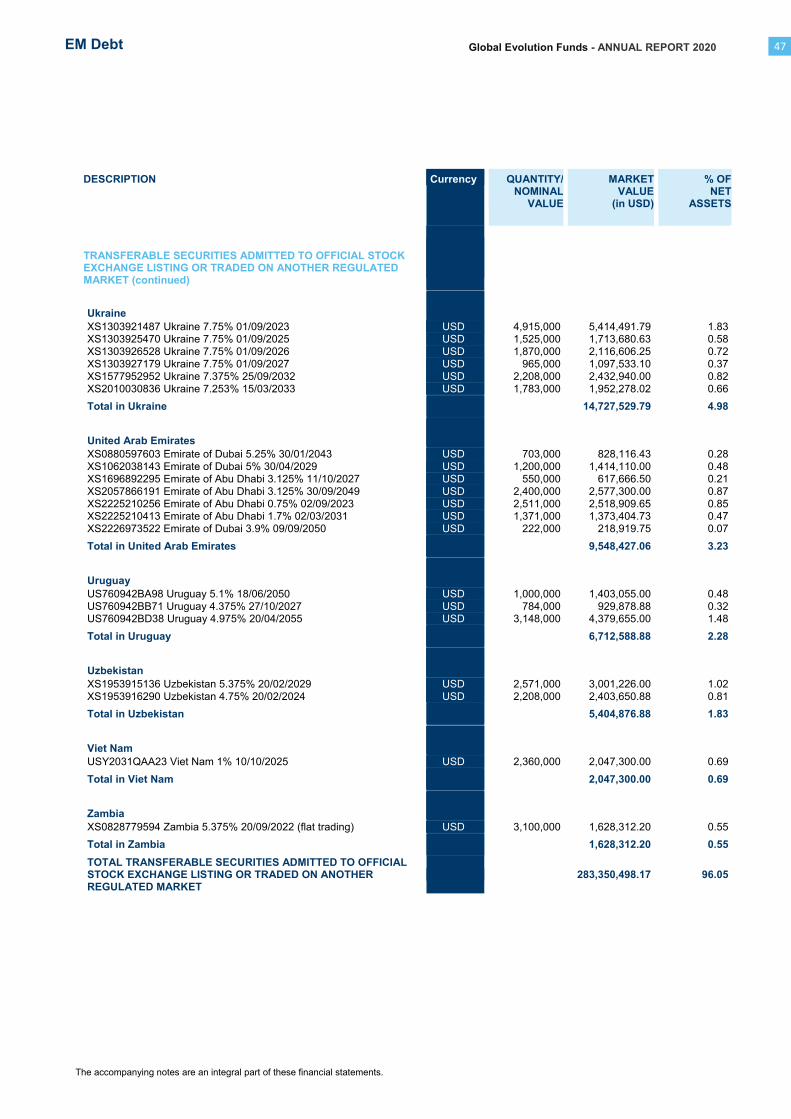
Global Evolution Funds - ANNUAL REPORT 2020
The accompanying notes are an integral part of these financial statements.
EM Debt 47
DESCRIPTION Currency QUANTITY/NOMINAL
VALUE
MARKET VALUE
(in USD)
% OFNET
ASSETS
TRANSFERABLE SECURITIES ADMITTED TO OFFICIAL STOCK EXCHANGE LISTING OR TRADED ON ANOTHER REGULATED MARKET (continued)
Ukraine
XS1303921487 Ukraine 7.75% 01/09/2023 USD 4,915,000 5,414,491.79 1.83 XS1303925470 Ukraine 7.75% 01/09/2025 USD 1,525,000 1,713,680.63 0.58
XS1303926528 Ukraine 7.75% 01/09/2026 USD 1,870,000 2,116,606.25 0.72
XS1303927179 Ukraine 7.75% 01/09/2027 USD 965,000 1,097,533.10 0.37
XS1577952952 Ukraine 7.375% 25/09/2032 USD 2,208,000 2,432,940.00 0.82
XS2010030836 Ukraine 7.253% 15/03/2033 USD 1,783,000 1,952,278.02 0.66
Total in Ukraine 14,727,529.79 4.98
United Arab Emirates
XS0880597603 Emirate of Dubai 5.25% 30/01/2043 USD 703,000 828,116.43 0.28
XS1062038143 Emirate of Dubai 5% 30/04/2029 USD 1,200,000 1,414,110.00 0.48
XS1696892295 Emirate of Abu Dhabi 3.125% 11/10/2027 USD 550,000 617,666.50 0.21
XS2057866191 Emirate of Abu Dhabi 3.125% 30/09/2049 USD 2,400,000 2,577,300.00 0.87
XS2225210256 Emirate of Abu Dhabi 0.75% 02/09/2023 USD 2,511,000 2,518,909.65 0.85 XS2225210413 Emirate of Abu Dhabi 1.7% 02/03/2031 USD 1,371,000 1,373,404.73 0.47
XS2226973522 Emirate of Dubai 3.9% 09/09/2050 USD 222,000 218,919.75 0.07
Total in United Arab Emirates 9,548,427.06 3.23
Uruguay
US760942BA98 Uruguay 5.1% 18/06/2050 USD 1,000,000 1,403,055.00 0.48
US760942BB71 Uruguay 4.375% 27/10/2027 USD 784,000 929,878.88 0.32 US760942BD38 Uruguay 4.975% 20/04/2055 USD 3,148,000 4,379,655.00 1.48
Total in Uruguay 6,712,588.88 2.28
Uzbekistan
XS1953915136 Uzbekistan 5.375% 20/02/2029 USD 2,571,000 3,001,226.00 1.02
XS1953916290 Uzbekistan 4.75% 20/02/2024 USD 2,208,000 2,403,650.88 0.81
Total in Uzbekistan 5,404,876.88 1.83
Viet Nam
USY2031QAA23 Viet Nam 1% 10/10/2025 USD 2,360,000 2,047,300.00 0.69
Total in Viet Nam 2,047,300.00 0.69
Zambia
XS0828779594 Zambia 5.375% 20/09/2022 (flat trading) USD 3,100,000 1,628,312.20 0.55
Total in Zambia 1,628,312.20 0.55
TOTAL TRANSFERABLE SECURITIES ADMITTED TO OFFICIAL STOCK EXCHANGE LISTING OR TRADED ON ANOTHER REGULATED MARKET
283,350,498.17 96.05

Global Evolution Funds - ANNUAL REPORT 2020
The accompanying notes are an integral part of these financial statements.
48 EM Debt
DESCRIPTION Currency QUANTITY/NOMINAL
VALUE
MARKET VALUE
(in USD)
% OFNET
ASSETS
OTHER TRANSFERABLE SECURITIES
Costa Rica
XS1689695119 Costa Rica GDN 5.98% 24/05/2028 USD 900,000 778,576.50 0.26
Total in Costa Rica 778,576.50 0.26
TOTAL OTHER TRANSFERABLE SECURITIES 778,576.50 0.26
TOTAL INVESTMENT IN SECURITIES 284,129,074.67 96.31
Cash and cash equivalent 6,008,816.56 2.04
Other Net Assets 4,942,967.37 1.65
TOTAL NET ASSETS 295,080,858.60 100.00

Global Evolution Funds - ANNUAL REPORT 2020
Schedule of Investments and Other Net Assets as of December 31, 2020 (in EUR)
The accompanying notes are an integral part of these financial statements.
EM Blended Debt 49
DESCRIPTION Currency QUANTITY/NOMINAL
VALUE
MARKET VALUE
(in EUR)
% OFNET
ASSETS
TRANSFERABLE SECURITIES ADMITTED TO OFFICIAL STOCK EXCHANGE LISTING OR TRADED ON ANOTHER REGULATED MARKET
Argentina
US040114HT09 Argentina 0.125% 09/07/2035 USD 282,304 84,676.21 1.26 US040114HU71 Argentina 0.125% 09/01/2038 USD 52,000 17,456.58 0.26
US040114HX11 Argentina 1% 09/07/2029 USD 18,539 6,602.55 0.10
XS0234085461 Buenos Aires 4% 01/05/2020 (defaulted) EUR 25,000 9,447.81 0.14
XS1649634034 Buenos Aires 5.375% 20/01/2023 (flat trading) EUR 100,000 37,498.83 0.56
Total in Argentina 155,681.98 2.32
Azerbaijan
XS1678623734 Azerbaijan 3.5% 01/09/2032 USD 300,000 260,205.97 3.86
Total in Azerbaijan 260,205.97 3.86
Brazil
BRSTNCNTF147 Brazil 10% 01/01/2023 BRL 500,000 86,886.41 1.29
BRSTNCNTF170 Brazil 10% 01/01/2025 BRL 325,000 59,162.15 0.88
BRSTNCNTF1P8 Brazil 10% 01/01/2027 BRL 500,000 93,090.48 1.38
Total in Brazil 239,139.04 3.55
Chile
CL0002172501 Chile 4.5% 01/03/2026 CLP 65,000,000 85,808.48 1.27
Total in Chile 85,808.48 1.27
China
XS1450882169 JPMorgan Chase Bank NA CLN 2.68% 21/05/2030 CNY 800,000 95,826.09 1.42
Total in China 95,826.09 1.42
Colombia
COL17CT02385 Colombia 10% 24/07/2024 COP 200,000,000 58,053.09 0.86
COL17CT02914 Colombia 6% 28/04/2028 COP 500,000,000 127,974.59 1.90
COL17CT03490 Colombia 7% 30/06/2032 COP 100,000,000 26,395.46 0.39
Total in Colombia 212,423.14 3.15
Costa Rica
XS1764001373 Costa Rica GDN 6.44% 21/11/2029 USD 180,000 126,354.55 1.87
Total in Costa Rica 126,354.55 1.87
Côte d'Ivoire
XS1793329225 Côte d'Ivoire 5.25% 22/03/2030 EUR 220,000 236,601.86 3.51
Total in Côte d'Ivoire 236,601.86 3.51
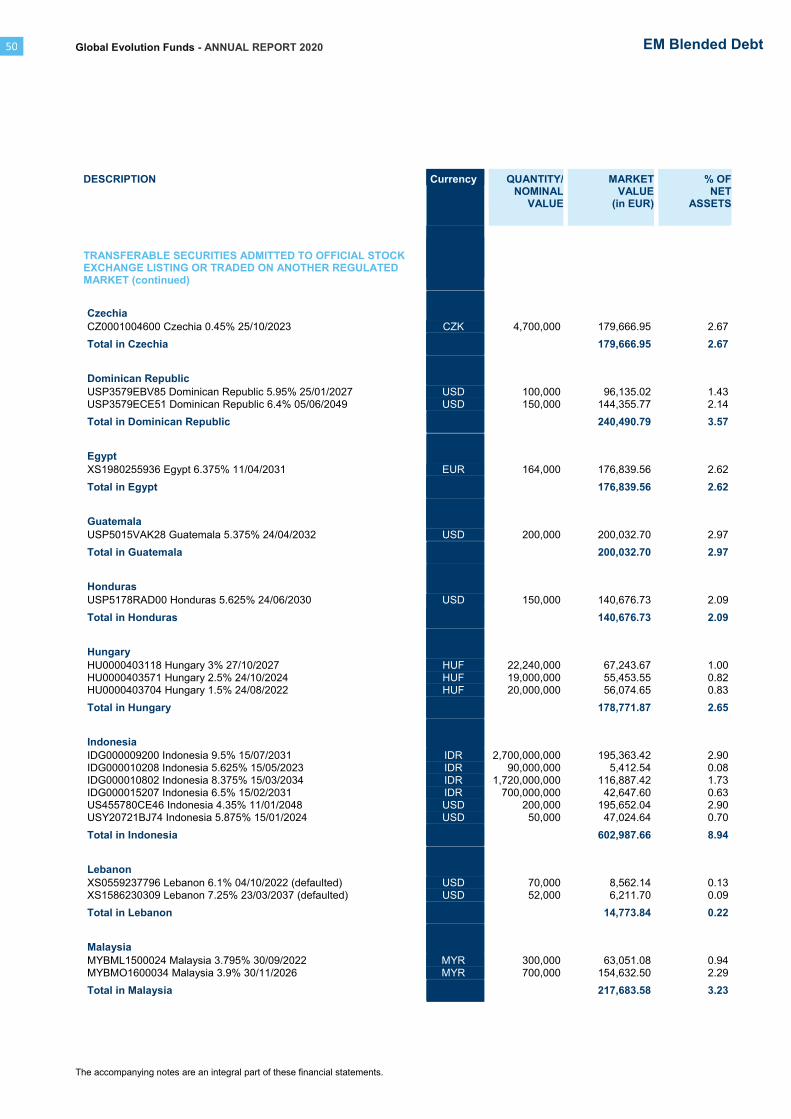
Global Evolution Funds - ANNUAL REPORT 2020
The accompanying notes are an integral part of these financial statements.
50 EM Blended Debt
DESCRIPTION Currency QUANTITY/NOMINAL
VALUE
MARKET VALUE
(in EUR)
% OFNET
ASSETS
TRANSFERABLE SECURITIES ADMITTED TO OFFICIAL STOCK EXCHANGE LISTING OR TRADED ON ANOTHER REGULATED MARKET (continued)
Czechia
CZ0001004600 Czechia 0.45% 25/10/2023 CZK 4,700,000 179,666.95 2.67
Total in Czechia 179,666.95 2.67
Dominican Republic
USP3579EBV85 Dominican Republic 5.95% 25/01/2027 USD 100,000 96,135.02 1.43
USP3579ECE51 Dominican Republic 6.4% 05/06/2049 USD 150,000 144,355.77 2.14
Total in Dominican Republic 240,490.79 3.57
Egypt
XS1980255936 Egypt 6.375% 11/04/2031 EUR 164,000 176,839.56 2.62
Total in Egypt 176,839.56 2.62
Guatemala
USP5015VAK28 Guatemala 5.375% 24/04/2032 USD 200,000 200,032.70 2.97
Total in Guatemala 200,032.70 2.97
Honduras
USP5178RAD00 Honduras 5.625% 24/06/2030 USD 150,000 140,676.73 2.09
Total in Honduras 140,676.73 2.09
Hungary
HU0000403118 Hungary 3% 27/10/2027 HUF 22,240,000 67,243.67 1.00
HU0000403571 Hungary 2.5% 24/10/2024 HUF 19,000,000 55,453.55 0.82
HU0000403704 Hungary 1.5% 24/08/2022 HUF 20,000,000 56,074.65 0.83
Total in Hungary 178,771.87 2.65
Indonesia
IDG000009200 Indonesia 9.5% 15/07/2031 IDR 2,700,000,000 195,363.42 2.90
IDG000010208 Indonesia 5.625% 15/05/2023 IDR 90,000,000 5,412.54 0.08
IDG000010802 Indonesia 8.375% 15/03/2034 IDR 1,720,000,000 116,887.42 1.73
IDG000015207 Indonesia 6.5% 15/02/2031 IDR 700,000,000 42,647.60 0.63 US455780CE46 Indonesia 4.35% 11/01/2048 USD 200,000 195,652.04 2.90
USY20721BJ74 Indonesia 5.875% 15/01/2024 USD 50,000 47,024.64 0.70
Total in Indonesia 602,987.66 8.94
Lebanon
XS0559237796 Lebanon 6.1% 04/10/2022 (defaulted) USD 70,000 8,562.14 0.13
XS1586230309 Lebanon 7.25% 23/03/2037 (defaulted) USD 52,000 6,211.70 0.09
Total in Lebanon 14,773.84 0.22
Malaysia
MYBML1500024 Malaysia 3.795% 30/09/2022 MYR 300,000 63,051.08 0.94
MYBMO1600034 Malaysia 3.9% 30/11/2026 MYR 700,000 154,632.50 2.29
Total in Malaysia 217,683.58 3.23
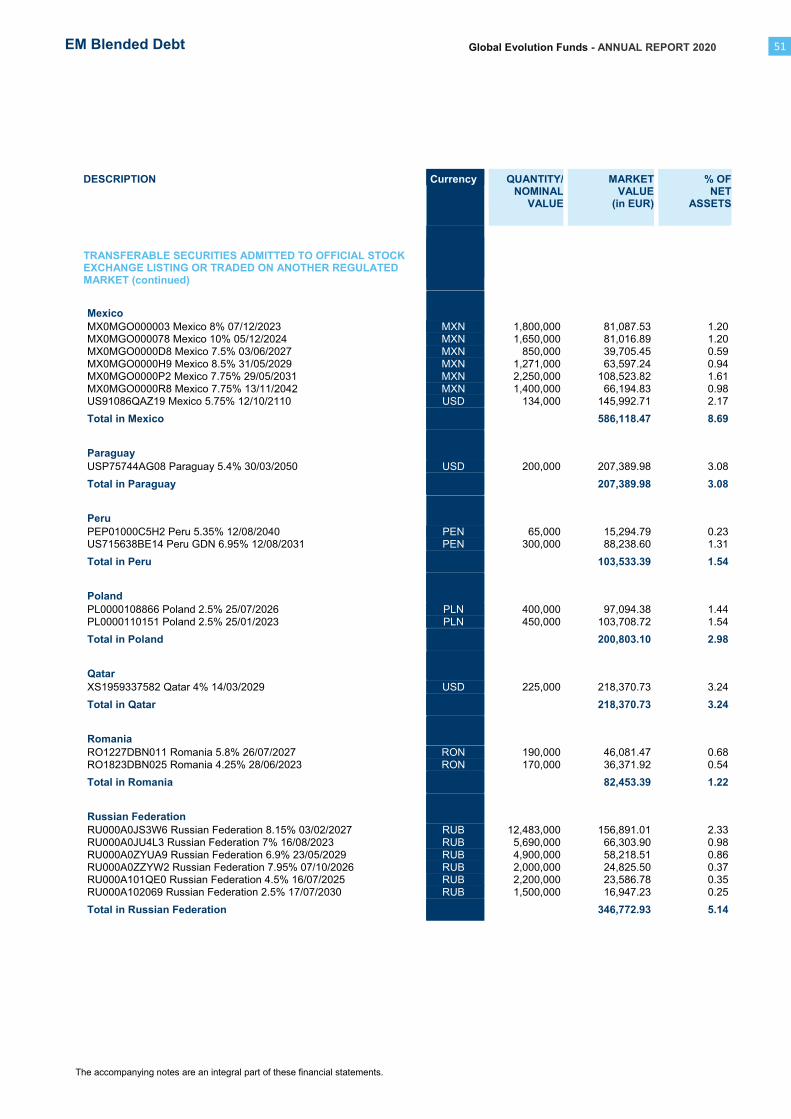
Global Evolution Funds - ANNUAL REPORT 2020
The accompanying notes are an integral part of these financial statements.
EM Blended Debt 51
DESCRIPTION Currency QUANTITY/NOMINAL
VALUE
MARKET VALUE
(in EUR)
% OFNET
ASSETS
TRANSFERABLE SECURITIES ADMITTED TO OFFICIAL STOCK EXCHANGE LISTING OR TRADED ON ANOTHER REGULATED MARKET (continued)
Mexico
MX0MGO000003 Mexico 8% 07/12/2023 MXN 1,800,000 81,087.53 1.20 MX0MGO000078 Mexico 10% 05/12/2024 MXN 1,650,000 81,016.89 1.20
MX0MGO0000D8 Mexico 7.5% 03/06/2027 MXN 850,000 39,705.45 0.59
MX0MGO0000H9 Mexico 8.5% 31/05/2029 MXN 1,271,000 63,597.24 0.94
MX0MGO0000P2 Mexico 7.75% 29/05/2031 MXN 2,250,000 108,523.82 1.61
MX0MGO0000R8 Mexico 7.75% 13/11/2042 MXN 1,400,000 66,194.83 0.98
US91086QAZ19 Mexico 5.75% 12/10/2110 USD 134,000 145,992.71 2.17
Total in Mexico 586,118.47 8.69
Paraguay
USP75744AG08 Paraguay 5.4% 30/03/2050 USD 200,000 207,389.98 3.08
Total in Paraguay 207,389.98 3.08
Peru
PEP01000C5H2 Peru 5.35% 12/08/2040 PEN 65,000 15,294.79 0.23 US715638BE14 Peru GDN 6.95% 12/08/2031 PEN 300,000 88,238.60 1.31
Total in Peru 103,533.39 1.54
Poland
PL0000108866 Poland 2.5% 25/07/2026 PLN 400,000 97,094.38 1.44
PL0000110151 Poland 2.5% 25/01/2023 PLN 450,000 103,708.72 1.54
Total in Poland 200,803.10 2.98
Qatar
XS1959337582 Qatar 4% 14/03/2029 USD 225,000 218,370.73 3.24
Total in Qatar 218,370.73 3.24
Romania
RO1227DBN011 Romania 5.8% 26/07/2027 RON 190,000 46,081.47 0.68
RO1823DBN025 Romania 4.25% 28/06/2023 RON 170,000 36,371.92 0.54
Total in Romania 82,453.39 1.22
Russian Federation
RU000A0JS3W6 Russian Federation 8.15% 03/02/2027 RUB 12,483,000 156,891.01 2.33
RU000A0JU4L3 Russian Federation 7% 16/08/2023 RUB 5,690,000 66,303.90 0.98
RU000A0ZYUA9 Russian Federation 6.9% 23/05/2029 RUB 4,900,000 58,218.51 0.86
RU000A0ZZYW2 Russian Federation 7.95% 07/10/2026 RUB 2,000,000 24,825.50 0.37 RU000A101QE0 Russian Federation 4.5% 16/07/2025 RUB 2,200,000 23,586.78 0.35
RU000A102069 Russian Federation 2.5% 17/07/2030 RUB 1,500,000 16,947.23 0.25
Total in Russian Federation 346,772.93 5.14
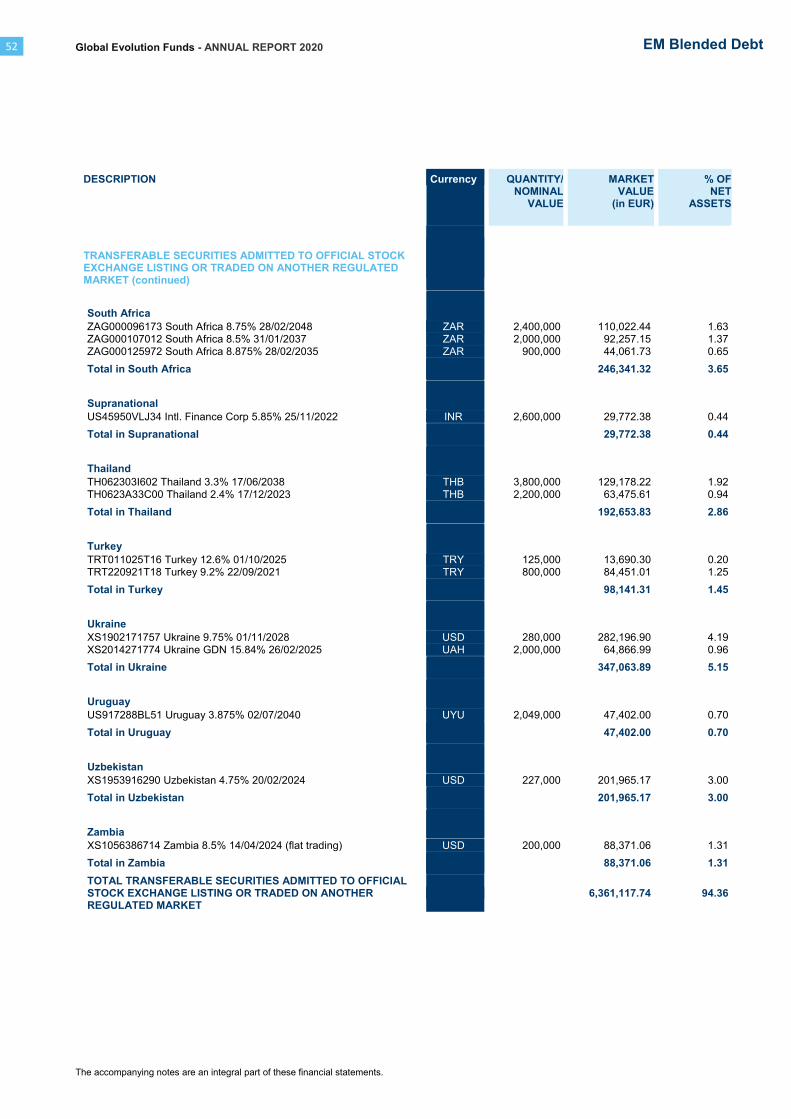
Global Evolution Funds - ANNUAL REPORT 2020
The accompanying notes are an integral part of these financial statements.
52 EM Blended Debt
DESCRIPTION Currency QUANTITY/NOMINAL
VALUE
MARKET VALUE
(in EUR)
% OFNET
ASSETS
TRANSFERABLE SECURITIES ADMITTED TO OFFICIAL STOCK EXCHANGE LISTING OR TRADED ON ANOTHER REGULATED MARKET (continued)
South Africa
ZAG000096173 South Africa 8.75% 28/02/2048 ZAR 2,400,000 110,022.44 1.63 ZAG000107012 South Africa 8.5% 31/01/2037 ZAR 2,000,000 92,257.15 1.37
ZAG000125972 South Africa 8.875% 28/02/2035 ZAR 900,000 44,061.73 0.65
Total in South Africa 246,341.32 3.65
Supranational
US45950VLJ34 Intl. Finance Corp 5.85% 25/11/2022 INR 2,600,000 29,772.38 0.44
Total in Supranational 29,772.38 0.44
Thailand
TH062303I602 Thailand 3.3% 17/06/2038 THB 3,800,000 129,178.22 1.92
TH0623A33C00 Thailand 2.4% 17/12/2023 THB 2,200,000 63,475.61 0.94
Total in Thailand 192,653.83 2.86
Turkey
TRT011025T16 Turkey 12.6% 01/10/2025 TRY 125,000 13,690.30 0.20 TRT220921T18 Turkey 9.2% 22/09/2021 TRY 800,000 84,451.01 1.25
Total in Turkey 98,141.31 1.45
Ukraine
XS1902171757 Ukraine 9.75% 01/11/2028 USD 280,000 282,196.90 4.19
XS2014271774 Ukraine GDN 15.84% 26/02/2025 UAH 2,000,000 64,866.99 0.96
Total in Ukraine 347,063.89 5.15
Uruguay
US917288BL51 Uruguay 3.875% 02/07/2040 UYU 2,049,000 47,402.00 0.70
Total in Uruguay 47,402.00 0.70
Uzbekistan
XS1953916290 Uzbekistan 4.75% 20/02/2024 USD 227,000 201,965.17 3.00
Total in Uzbekistan 201,965.17 3.00
Zambia
XS1056386714 Zambia 8.5% 14/04/2024 (flat trading) USD 200,000 88,371.06 1.31
Total in Zambia 88,371.06 1.31
TOTAL TRANSFERABLE SECURITIES ADMITTED TO OFFICIAL STOCK EXCHANGE LISTING OR TRADED ON ANOTHER REGULATED MARKET
6,361,117.74 94.36
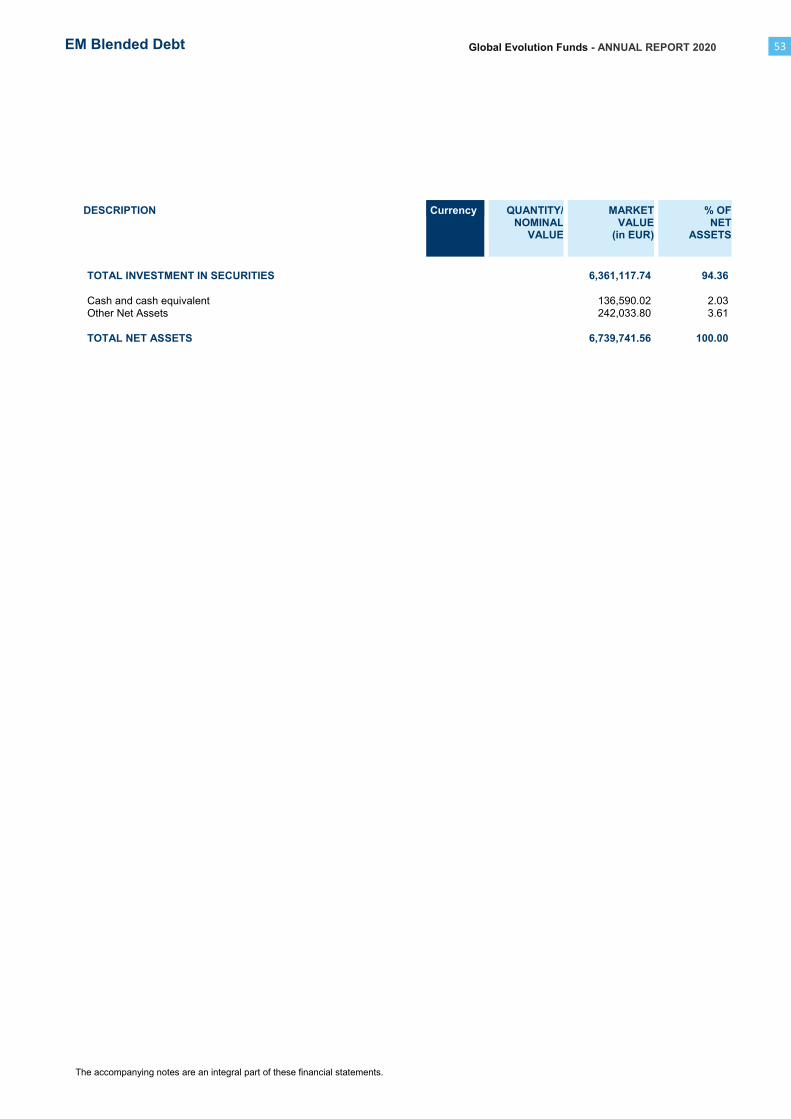
Global Evolution Funds - ANNUAL REPORT 2020
The accompanying notes are an integral part of these financial statements.
EM Blended Debt 53
DESCRIPTION Currency QUANTITY/NOMINAL
VALUE
MARKETVALUE
(in EUR)
% OF NET
ASSETS
TOTAL INVESTMENT IN SECURITIES 6,361,117.74 94.36
Cash and cash equivalent 136,590.02 2.03
Other Net Assets 242,033.80 3.61
TOTAL NET ASSETS 6,739,741.56 100.00

Global Evolution Funds - ANNUAL REPORT 2020
Schedule of Investments and Other Net Assets as of December 31, 2020 (in USD)
The accompanying notes are an integral part of these financial statements.
54 Emerging Frontier
DESCRIPTION Currency QUANTITY/NOMINAL
VALUE
MARKET VALUE
(in USD)
% OFNET
ASSETS
TRANSFERABLE SECURITIES ADMITTED TO OFFICIAL STOCK EXCHANGE LISTING OR TRADED ON ANOTHER REGULATED MARKET
Angola
XS1318576086 Angola 9.5% 12/11/2025 USD 1,810,000 1,885,305.05 0.49 XS1337184193 Aurora Australis BV CLN FRN 19/12/2023 USD 3,637,500 3,496,365.00 0.91
XS1819680288 Angola 8.25% 09/05/2028 USD 3,695,000 3,554,309.18 0.92
XS1819680528 Angola 9.375% 08/05/2048 USD 5,682,000 5,373,041.25 1.40
Total in Angola 14,309,020.48 3.72
Argentina
US040114HS26 Argentina 0.125% 09/07/2030 USD 1,135,403 462,109.02 0.12 US040114HT09 Argentina 0.125% 09/07/2035 USD 16,188,950 5,941,344.65 1.55
US040114HX11 Argentina 1% 09/07/2029 USD 848,167 369,597.25 0.10
XS1649634034 Buenos Aires 5.375% 20/01/2023 (flat trading) EUR 900,000 412,935.20 0.11
Total in Argentina 7,185,986.12 1.88
Azerbaijan
XS1505657079 Frontera Capital BV CLN VAR 18/10/2021 USD 1,180,000 1,126,192.00 0.29 XS2201941247 Frontera Capital BV CLN 10% 01/08/2023 AZN 1,200,000 706,297.23 0.18
Total in Azerbaijan 1,832,489.23 0.47
Belarus
XS1981779975 Dev. Bank of the Republic of Belarus 12% 15/05/2022 BYN 4,000,000 1,573,021.45 0.41
Total in Belarus 1,573,021.45 0.41
Cameroon
XS1313779081 Cameroon 9.5% 19/11/2025 USD 4,300,000 4,799,445.00 1.25
Total in Cameroon 4,799,445.00 1.25
Côte d'Ivoire
XS0496488395 Côte d'Ivoire 5.75% 31/12/2032 USD 5,057,010 5,117,259.22 1.33
XS1793329225 Côte d'Ivoire 5.25% 22/03/2030 EUR 2,675,000 3,519,986.22 0.92
XS1796266754 Côte d'Ivoire 6.625% 22/03/2048 EUR 2,240,000 3,045,260.38 0.79 XS2064786754 Côte d'Ivoire 5.875% 17/10/2031 EUR 1,500,000 2,034,028.21 0.53
XS2264871828 Côte d'Ivoire 4.875% 30/01/2032 EUR 221,000 278,754.63 0.07
Total in Côte d'Ivoire 13,995,288.66 3.64
Dominican Republic
USP3579EBZ99 Dominican Republic 8.9% 15/02/2023 DOP 253,300,000 4,504,464.03 1.17
USP3579ECD78 Dominican Republic 9.75% 05/06/2026 DOP 247,950,000 4,601,219.50 1.20 XS1084826483 Dominican Republic GDN 11.5% 10/05/2024 DOP 85,000,000 1,666,359.52 0.43
XS1180454321 Dominican Republic GDN 12% 20/01/2022 DOP 25,000,000 456,503.68 0.12
XS1203837528 Dominican Republic GDN 10.375% 04/03/2022 DOP 40,000,000 727,368.31 0.19
XS1597325098 Dominican Republic GDN 10.5% 07/04/2023 DOP 235,000,000 4,365,391.73 1.14
Total in Dominican Republic 16,321,306.77 4.25

Global Evolution Funds - ANNUAL REPORT 2020
The accompanying notes are an integral part of these financial statements.
Emerging Frontier 55
DESCRIPTION Currency QUANTITY/NOMINAL
VALUE
MARKET VALUE
(in USD)
% OFNET
ASSETS
TRANSFERABLE SECURITIES ADMITTED TO OFFICIAL STOCK EXCHANGE LISTING OR TRADED ON ANOTHER REGULATED MARKET (continued)
Ecuador
XS2214237807 Ecuador 0.5% 31/07/2030 USD 2,634,660 1,696,062.38 0.44 XS2214238441 Ecuador 0.5% 31/07/2035 USD 6,904,482 3,771,642.34 0.98
XS2214239175 Ecuador 0.5% 31/07/2040 USD 3,164,380 1,621,776.39 0.42
XS2214239506 Ecuador 0% 31/07/2030 USD 671,122 321,299.66 0.08
Total in Ecuador 7,410,780.77 1.92
Egypt
XS1799503674 Frontera Capital BV CLN 15.58% 17/05/2027 EGP 5,000,000 347,456.66 0.09 XS1863918378 ICBC Standard Bank PLC CLN 15.7% 09/11/2027 EGP 20,000,000 1,387,302.80 0.36
XS2038507609 ICBC Standard Bank PLC CLN 16.1% 09/05/2029 EGP 68,129,856 4,830,911.92 1.26
XS2119484181 Citigroup Global Markets CLN 0% 04/02/2021 EGP 35,000,000 2,200,035.43 0.57
XS2232102108 Shamrock Capital PLC CLN 0% 20/09/2021 EGP 65,000,000 3,787,722.60 0.99
XS2251937384 ICBC Standard Bank PLC CLN 14.313% 17/10/2023 EGP 80,207,266 5,141,085.65 1.34
XS2267892862 Citigroup Global Markets CLN 14.313% 17/10/2023 EGP 13,000,000 863,949.35 0.22
Total in Egypt 18,558,464.41 4.83
El Salvador
USP01012AN67 El Salvador 7.65% 15/06/2035 USD 2,000,000 1,905,000.00 0.50
USP01012AR71 El Salvador 7.625% 01/02/2041 USD 1,500,000 1,396,890.00 0.36
USP01012CA29 El Salvador 7.1246% 20/01/2050 USD 3,000,000 2,692,500.00 0.70
XS0146173371 El Salvador 8.25% 10/04/2032 USD 1,300,000 1,280,500.00 0.33
Total in El Salvador 7,274,890.00 1.89
Ethiopia
XS1151974877 Ethiopia 6.625% 11/12/2024 USD 3,250,000 3,315,552.50 0.86
Total in Ethiopia 3,315,552.50 0.86
Gabon
XS1003557870 Gabon 6.375% 12/12/2024 USD 1,287,315 1,343,635.03 0.35 XS2113615228 Gabon 6.625% 06/02/2031 USD 2,709,000 2,803,970.52 0.73
Total in Gabon 4,147,605.55 1.08
Georgia
XS1389210698 Frontera Capital BV CLN VAR 29/10/2021 USD 4,000,000 2,811,200.00 0.73
XS1456452801 Frontera Capital BV CLN VAR 04/08/2021 USD 320,961 282,381.22 0.07
XS1639850558 Zambezi BV CLN 9.5% 09/08/2022 USD 3,200,000 2,453,760.00 0.64 XS2111225103 ICBC Standard Bank PLC CLN 6.75% 13/07/2021 GEL 3,000,000 934,731.22 0.24
XS2111225798 ICBC Standard Bank PLC CLN 9.375% 12/04/2022 GEL 3,000,000 947,791.37 0.25
XS2270780062 ICBC Standard Bank PLC CLN 9.125% 03/06/2025 GEL 6,000,000 1,896,504.52 0.49
XS2279406545 Frontera Capital Group BV CLN 8.4% 25/01/2024 USD 1,300,000 1,300,000.00 0.34
Total in Georgia 10,626,368.33 2.76
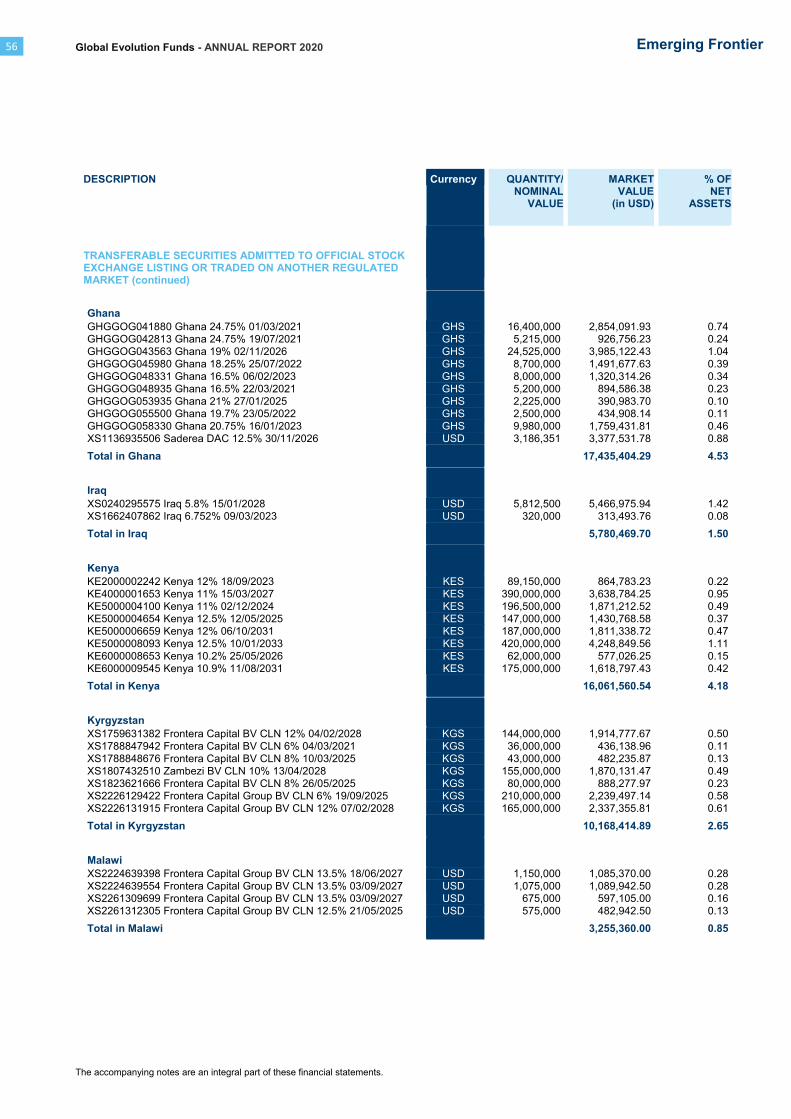
Global Evolution Funds - ANNUAL REPORT 2020
The accompanying notes are an integral part of these financial statements.
56 Emerging Frontier
DESCRIPTION Currency QUANTITY/NOMINAL
VALUE
MARKET VALUE
(in USD)
% OFNET
ASSETS
TRANSFERABLE SECURITIES ADMITTED TO OFFICIAL STOCK EXCHANGE LISTING OR TRADED ON ANOTHER REGULATED MARKET (continued)
Ghana
GHGGOG041880 Ghana 24.75% 01/03/2021 GHS 16,400,000 2,854,091.93 0.74 GHGGOG042813 Ghana 24.75% 19/07/2021 GHS 5,215,000 926,756.23 0.24
GHGGOG043563 Ghana 19% 02/11/2026 GHS 24,525,000 3,985,122.43 1.04
GHGGOG045980 Ghana 18.25% 25/07/2022 GHS 8,700,000 1,491,677.63 0.39
GHGGOG048331 Ghana 16.5% 06/02/2023 GHS 8,000,000 1,320,314.26 0.34
GHGGOG048935 Ghana 16.5% 22/03/2021 GHS 5,200,000 894,586.38 0.23
GHGGOG053935 Ghana 21% 27/01/2025 GHS 2,225,000 390,983.70 0.10 GHGGOG055500 Ghana 19.7% 23/05/2022 GHS 2,500,000 434,908.14 0.11
GHGGOG058330 Ghana 20.75% 16/01/2023 GHS 9,980,000 1,759,431.81 0.46
XS1136935506 Saderea DAC 12.5% 30/11/2026 USD 3,186,351 3,377,531.78 0.88
Total in Ghana 17,435,404.29 4.53
Iraq
XS0240295575 Iraq 5.8% 15/01/2028 USD 5,812,500 5,466,975.94 1.42 XS1662407862 Iraq 6.752% 09/03/2023 USD 320,000 313,493.76 0.08
Total in Iraq 5,780,469.70 1.50
Kenya
KE2000002242 Kenya 12% 18/09/2023 KES 89,150,000 864,783.23 0.22
KE4000001653 Kenya 11% 15/03/2027 KES 390,000,000 3,638,784.25 0.95
KE5000004100 Kenya 11% 02/12/2024 KES 196,500,000 1,871,212.52 0.49 KE5000004654 Kenya 12.5% 12/05/2025 KES 147,000,000 1,430,768.58 0.37
KE5000006659 Kenya 12% 06/10/2031 KES 187,000,000 1,811,338.72 0.47
KE5000008093 Kenya 12.5% 10/01/2033 KES 420,000,000 4,248,849.56 1.11
KE6000008653 Kenya 10.2% 25/05/2026 KES 62,000,000 577,026.25 0.15
KE6000009545 Kenya 10.9% 11/08/2031 KES 175,000,000 1,618,797.43 0.42
Total in Kenya 16,061,560.54 4.18
Kyrgyzstan
XS1759631382 Frontera Capital BV CLN 12% 04/02/2028 KGS 144,000,000 1,914,777.67 0.50
XS1788847942 Frontera Capital BV CLN 6% 04/03/2021 KGS 36,000,000 436,138.96 0.11
XS1788848676 Frontera Capital BV CLN 8% 10/03/2025 KGS 43,000,000 482,235.87 0.13
XS1807432510 Zambezi BV CLN 10% 13/04/2028 KGS 155,000,000 1,870,131.47 0.49
XS1823621666 Frontera Capital BV CLN 8% 26/05/2025 KGS 80,000,000 888,277.97 0.23 XS2226129422 Frontera Capital Group BV CLN 6% 19/09/2025 KGS 210,000,000 2,239,497.14 0.58
XS2226131915 Frontera Capital Group BV CLN 12% 07/02/2028 KGS 165,000,000 2,337,355.81 0.61
Total in Kyrgyzstan 10,168,414.89 2.65
Malawi
XS2224639398 Frontera Capital Group BV CLN 13.5% 18/06/2027 USD 1,150,000 1,085,370.00 0.28
XS2224639554 Frontera Capital Group BV CLN 13.5% 03/09/2027 USD 1,075,000 1,089,942.50 0.28 XS2261309699 Frontera Capital Group BV CLN 13.5% 03/09/2027 USD 675,000 597,105.00 0.16
XS2261312305 Frontera Capital Group BV CLN 12.5% 21/05/2025 USD 575,000 482,942.50 0.13
Total in Malawi 3,255,360.00 0.85
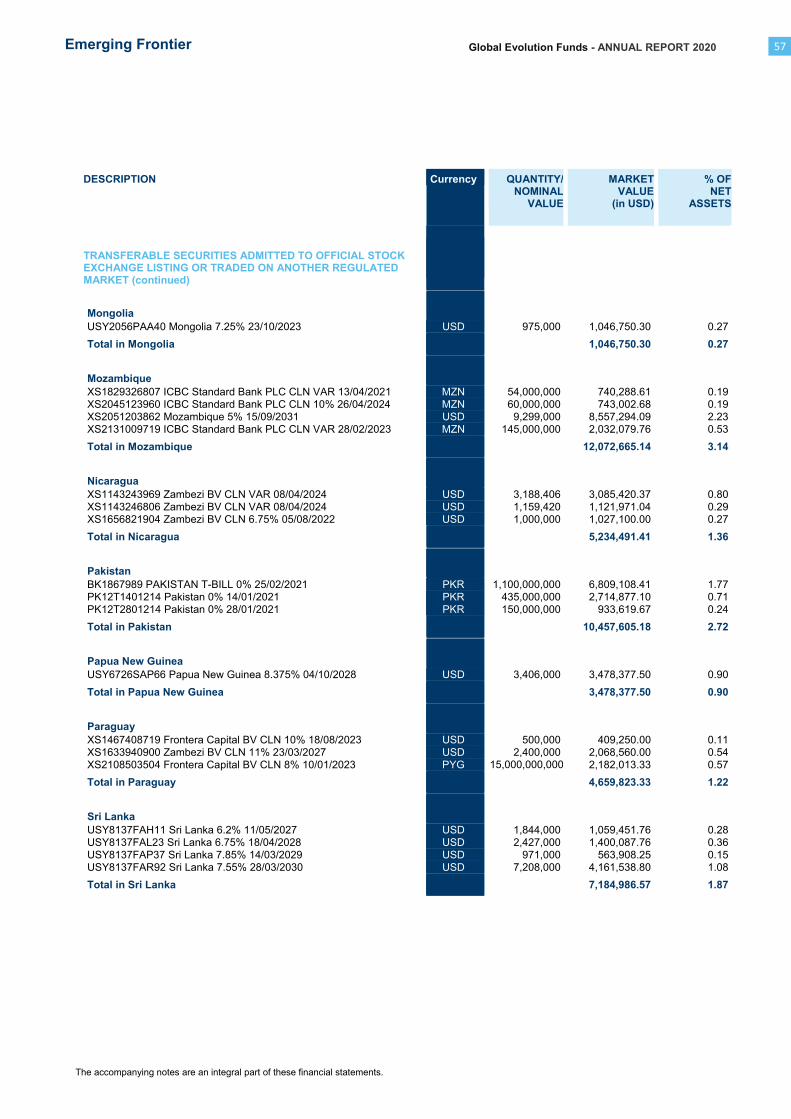
Global Evolution Funds - ANNUAL REPORT 2020
The accompanying notes are an integral part of these financial statements.
Emerging Frontier 57
DESCRIPTION Currency QUANTITY/NOMINAL
VALUE
MARKET VALUE
(in USD)
% OFNET
ASSETS
TRANSFERABLE SECURITIES ADMITTED TO OFFICIAL STOCK EXCHANGE LISTING OR TRADED ON ANOTHER REGULATED MARKET (continued)
Mongolia
USY2056PAA40 Mongolia 7.25% 23/10/2023 USD 975,000 1,046,750.30 0.27
Total in Mongolia 1,046,750.30 0.27
Mozambique
XS1829326807 ICBC Standard Bank PLC CLN VAR 13/04/2021 MZN 54,000,000 740,288.61 0.19
XS2045123960 ICBC Standard Bank PLC CLN 10% 26/04/2024 MZN 60,000,000 743,002.68 0.19
XS2051203862 Mozambique 5% 15/09/2031 USD 9,299,000 8,557,294.09 2.23
XS2131009719 ICBC Standard Bank PLC CLN VAR 28/02/2023 MZN 145,000,000 2,032,079.76 0.53
Total in Mozambique 12,072,665.14 3.14
Nicaragua
XS1143243969 Zambezi BV CLN VAR 08/04/2024 USD 3,188,406 3,085,420.37 0.80
XS1143246806 Zambezi BV CLN VAR 08/04/2024 USD 1,159,420 1,121,971.04 0.29
XS1656821904 Zambezi BV CLN 6.75% 05/08/2022 USD 1,000,000 1,027,100.00 0.27
Total in Nicaragua 5,234,491.41 1.36
Pakistan
BK1867989 PAKISTAN T-BILL 0% 25/02/2021 PKR 1,100,000,000 6,809,108.41 1.77
PK12T1401214 Pakistan 0% 14/01/2021 PKR 435,000,000 2,714,877.10 0.71
PK12T2801214 Pakistan 0% 28/01/2021 PKR 150,000,000 933,619.67 0.24
Total in Pakistan 10,457,605.18 2.72
Papua New Guinea
USY6726SAP66 Papua New Guinea 8.375% 04/10/2028 USD 3,406,000 3,478,377.50 0.90
Total in Papua New Guinea 3,478,377.50 0.90
Paraguay
XS1467408719 Frontera Capital BV CLN 10% 18/08/2023 USD 500,000 409,250.00 0.11
XS1633940900 Zambezi BV CLN 11% 23/03/2027 USD 2,400,000 2,068,560.00 0.54
XS2108503504 Frontera Capital BV CLN 8% 10/01/2023 PYG 15,000,000,000 2,182,013.33 0.57
Total in Paraguay 4,659,823.33 1.22
Sri Lanka
USY8137FAH11 Sri Lanka 6.2% 11/05/2027 USD 1,844,000 1,059,451.76 0.28
USY8137FAL23 Sri Lanka 6.75% 18/04/2028 USD 2,427,000 1,400,087.76 0.36
USY8137FAP37 Sri Lanka 7.85% 14/03/2029 USD 971,000 563,908.25 0.15
USY8137FAR92 Sri Lanka 7.55% 28/03/2030 USD 7,208,000 4,161,538.80 1.08
Total in Sri Lanka 7,184,986.57 1.87

Global Evolution Funds - ANNUAL REPORT 2020
The accompanying notes are an integral part of these financial statements.
58 Emerging Frontier
DESCRIPTION Currency QUANTITY/NOMINAL
VALUE
MARKET VALUE
(in USD)
% OFNET
ASSETS
TRANSFERABLE SECURITIES ADMITTED TO OFFICIAL STOCK EXCHANGE LISTING OR TRADED ON ANOTHER REGULATED MARKET (continued)
Supranational
XS1839713523 EBRD 9.5% 21/06/2021 USD 2,500,000 1,952,325.00 0.51 XS1956842436 Intl. Bank Recon. & Dev. 9% 26/02/2021 KZT 900,000,000 2,145,550.29 0.56
XS2107448941 Intl. Bank Recon. & Dev. 9.25% 20/01/2023 RWF 3,200,000,000 3,249,089.46 0.85
XS2129433475 EBRD 10% 28/02/2023 USD 5,000,000 4,297,794.52 1.12
XS2170191253 EBRD 10.5% 11/05/2023 USD 4,000,000 3,897,051.73 1.01
XS2231184024 EBRD 7.25% 15/09/2021 USD 3,350,000 3,354,511.03 0.87
XS2231338604 EBRD 14% 14/06/2023 USD 1,200,000 1,322,717.41 0.34 XS2243341760 Intl. Bank Recon. & Dev. 9.1% 14/10/2022 KZT 3,455,000,000 8,313,360.46 2.16
XS2260213298 EBRD 10.4% 23/11/2022 USD 2,900,000 2,916,780.71 0.76
Total in Supranational 31,449,180.61 8.18
Suriname
USP68788AA97 Suriname 9.25% 26/10/2026 (flat trading) USD 2,725,000 1,748,905.00 0.45
Total in Suriname 1,748,905.00 0.45
Tajikistan
XS1676401414 Tajikistan 7.125% 14/09/2027 USD 7,374,000 6,417,223.50 1.67
XS1871090194 Frontera Capital BV CLN 10.78% 15/02/2023 USD 880,096 750,546.00 0.20
XS2099998978 FMO NV 9.28% 09/01/2022 USD 1,300,000 1,051,994.90 0.27
Total in Tajikistan 8,219,764.40 2.14
Tanzania, United Republic of
XS1805618896 Zambezi BV CLN 8.65% 23/04/2021 TZS 766,666,659 331,032.05 0.09
Total in Tanzania, United Republic of 331,032.05 0.09
Tunisia
XS1175223699 Banque Centrale de Tunisie SA 5.75% 30/01/2025 USD 3,550,000 3,248,519.02 0.84
XS2023698553 Banque Centrale de Tunisie SA 6.375% 15/07/2026 EUR 1,162,000 1,308,734.72 0.34
Total in Tunisia 4,557,253.74 1.18
Uganda
UG0000000865 Uganda 11% 21/01/2021 UGX 2,620,000,000 719,156.44 0.19
UG0000001079 Uganda 11% 09/06/2022 UGX 4,400,000,000 1,157,310.62 0.30
UG0000001244 Uganda 11% 13/04/2023 UGX 3,700,000,000 938,339.61 0.24
UG0000001533 Uganda 14.25% 23/08/2029 UGX 6,300,000,000 1,582,910.04 0.41
UG12H1305210 Uganda 16.5% 13/05/2021 UGX 4,398,000,000 1,238,748.87 0.32 UG12H1802216 Uganda 18.375% 18/02/2021 UGX 3,800,000,000 1,054,796.85 0.27
UG12H2810218 Uganda 16.75% 28/10/2021 UGX 11,900,000,000 3,413,398.60 0.89
UG12J1801248 Uganda 14% 18/01/2024 UGX 1,400,000,000 369,969.20 0.10
UG12K0811352 Uganda 16.25% 08/11/2035 UGX 4,200,000,000 1,128,445.10 0.29
UG12K2206346 Uganda 14.25% 22/06/2034 UGX 17,900,000,000 4,358,491.94 1.13
Total in Uganda 15,961,567.27 4.14

Global Evolution Funds - ANNUAL REPORT 2020
The accompanying notes are an integral part of these financial statements.
Emerging Frontier 59
DESCRIPTION Currency QUANTITY/NOMINAL
VALUE
MARKET VALUE
(in USD)
% OFNET
ASSETS
TRANSFERABLE SECURITIES ADMITTED TO OFFICIAL STOCK EXCHANGE LISTING OR TRADED ON ANOTHER REGULATED MARKET (continued)
Ukraine
XS1710579571 Citigroup Global Markets CLN 14.16% 14/10/2022 UAH 90,000,000 3,440,008.66 0.89 XS1766785189 ICBC Standard Bank PLC CLN 14.91% 14/10/2022 UAH 50,000,000 1,913,762.82 0.50
XS1815292963 Citigroup Global Markets CLN 15.22% 26/04/2023 UAH 132,500,000 5,208,437.17 1.35
XS2004503533 Citigroup Global Markets CLN 9.3% 28/08/2023 UAH 50,500,000 1,775,029.00 0.46
XS2014271774 Ukraine GDN 15.84% 26/02/2025 UAH 100,000,000 3,968,399.96 1.03
XS2277965963 ICBC Standard Bank PLC CLN 15.84% 28/02/2025 UAH 45,000,000 1,860,364.23 0.48
Total in Ukraine 18,166,001.84 4.71
Uruguay
US917288BL51 Uruguay 3.875% 02/07/2040 UYU 356,290,000 10,085,096.59 2.62
USP80557BV53 Uruguay 8.5% 15/03/2028 UYU 196,488,000 4,880,575.00 1.27
USP96006AE41 Uruguay 9.875% 20/06/2022 UYU 81,073,000 1,992,706.62 0.52
Total in Uruguay 16,958,378.21 4.41
Uzbekistan
XS2026817432 Frontera Capital Group BV CLN 12.5% 10/08/2022 UZS 17,000,000,000 1,639,002.68 0.43
XS2093764236 Frontera Capital BV CLN VAR 08/01/2021 USD 1,000,000 951,000.00 0.25
XS2093766280 Frontera Capital BV CLN VAR 10/01/2023 USD 1,000,000 958,200.00 0.25
XS2093769037 Frontera Capital BV CLN VAR 10/01/2025 USD 1,000,000 968,000.00 0.25
XS2093770555 Frontera Capital BV CLN 14.75% 11/01/2027 USD 1,000,000 972,800.00 0.25
XS2226716715 Frontera Capital Group BV CLN 12% 21/09/2022 USD 3,400,000 3,398,980.00 0.88 XS2264056313 Uzbekistan 14.5% 25/11/2023 UZS 48,240,000,000 4,673,472.74 1.22
Total in Uzbekistan 13,561,455.42 3.53
Zambia
XS1267081575 Zambia 8.97% 30/07/2027 (flat trading) USD 12,250,000 6,492,683.75 1.69
ZM1000002809 Zambia 12% 23/11/2022 ZMW 5,000,000 172,508.08 0.04
ZM1000002924 Zambia 12% 23/05/2023 ZMW 16,250,000 533,735.99 0.14 ZM1000002973 Zambia 11% 29/08/2021 ZMW 46,400,000 1,954,370.46 0.51
ZM1000002999 Zambia 13% 29/08/2026 ZMW 100,500,000 2,359,698.85 0.61
ZM1000003047 Zambia 12% 21/11/2023 ZMW 8,200,000 252,765.45 0.07
ZM1000003096 Zambia 11% 05/12/2021 ZMW 2,000,000 80,649.38 0.02
ZM1000003104 Zambia 12% 05/12/2023 ZMW 2,000,000 61,314.56 0.02
ZM1000003211 Zambia 14% 24/04/2032 ZMW 20,000,000 417,129.79 0.11 ZM1000003344 Zambia 12% 18/12/2024 ZMW 50,000,000 1,364,857.42 0.35
ZM1000003351 Zambia 13% 18/12/2027 ZMW 44,000,000 986,622.21 0.26
ZM1000004433 Zambia 11% 27/07/2025 ZMW 24,500,000 580,923.41 0.15
Total in Zambia 15,257,259.35 3.97
Zimbabwe
XS2056560225 Frontera Capital BV CLN VAR 30/04/2021 USD 4,339,509 3,445,570.36 0.90
Total in Zimbabwe 3,445,570.36 0.90
TOTAL TRANSFERABLE SECURITIES ADMITTED TO OFFICIAL STOCK EXCHANGE LISTING OR TRADED ON ANOTHER REGULATED MARKET
337,842,496.37 87.85

Global Evolution Funds - ANNUAL REPORT 2020
The accompanying notes are an integral part of these financial statements.
60 Emerging Frontier
DESCRIPTION Currency QUANTITY/NOMINAL
VALUE
MARKET VALUE
(in USD)
% OFNET
ASSETS
OTHER TRANSFERABLE SECURITIES
Costa Rica
XS1563513859 Costa Rica GDN 9.66% 30/09/2026 CRC 3,200,000,000 5,459,043.10 1.42
XS1788369517 Costa Rica GDN 8.05% 18/09/2024 CRC 3,750,000,000 6,289,748.42 1.64
XS1968712338 Costa Rica GDN 9.2% 21/02/2029 USD 3,125,000 3,253,609.38 0.85
Total in Costa Rica 15,002,400.90 3.91
Kazakhstan
XS2267984800 Kazakhstan GDN 5.3% 19/03/2022 KZT 325,000,000 734,717.52 0.19
Total in Kazakhstan 734,717.52 0.19
Zambia
XS2124187902 Zambia 12% 04/07/2025 ZMW 52,500,000 1,284,704.03 0.33
Total in Zambia 1,284,704.03 0.33
TOTAL OTHER TRANSFERABLE SECURITIES 17,021,822.45 4.43
TOTAL INVESTMENT IN SECURITIES 354,864,318.82 92.28
Cash and cash equivalent 22,414,278.25 5.83
Other Net Assets 7,210,563.95 1.89
TOTAL NET ASSETS 384,489,161.02 100.00
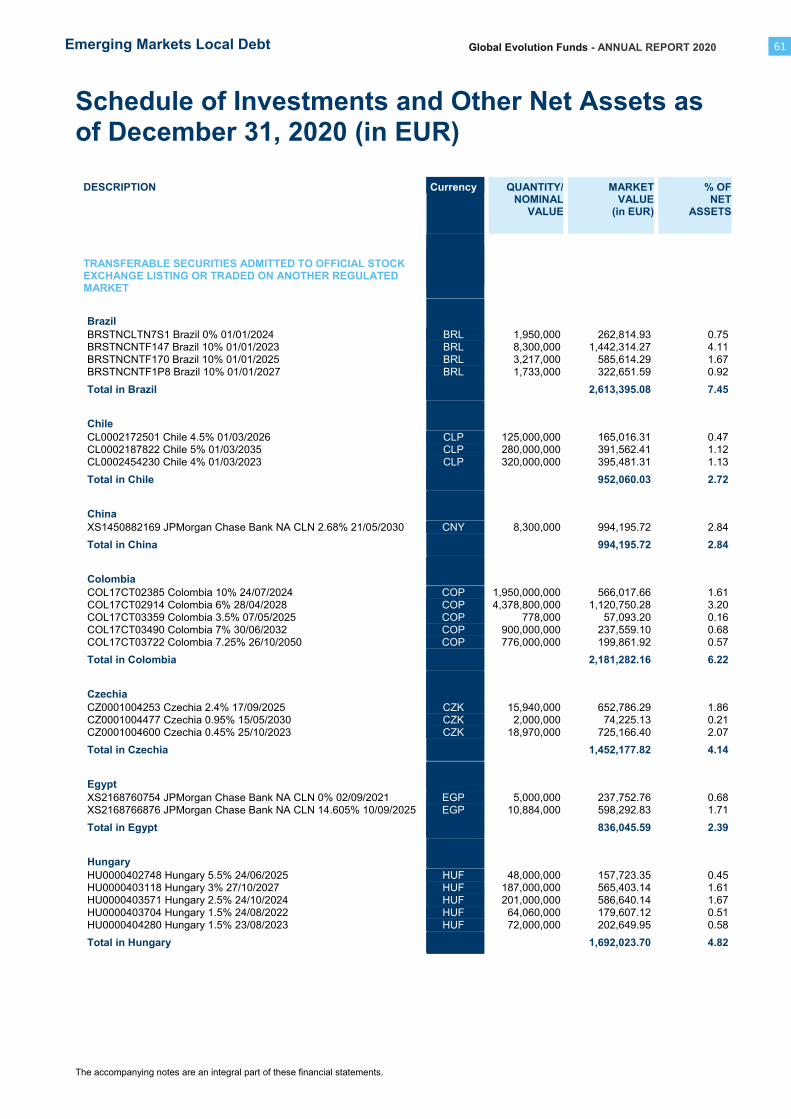
Global Evolution Funds - ANNUAL REPORT 2020
Schedule of Investments and Other Net Assets as of December 31, 2020 (in EUR)
The accompanying notes are an integral part of these financial statements.
Emerging Markets Local Debt 61
DESCRIPTION Currency QUANTITY/NOMINAL
VALUE
MARKET VALUE
(in EUR)
% OFNET
ASSETS
TRANSFERABLE SECURITIES ADMITTED TO OFFICIAL STOCK EXCHANGE LISTING OR TRADED ON ANOTHER REGULATED MARKET
Brazil
BRSTNCLTN7S1 Brazil 0% 01/01/2024 BRL 1,950,000 262,814.93 0.75 BRSTNCNTF147 Brazil 10% 01/01/2023 BRL 8,300,000 1,442,314.27 4.11
BRSTNCNTF170 Brazil 10% 01/01/2025 BRL 3,217,000 585,614.29 1.67
BRSTNCNTF1P8 Brazil 10% 01/01/2027 BRL 1,733,000 322,651.59 0.92
Total in Brazil 2,613,395.08 7.45
Chile
CL0002172501 Chile 4.5% 01/03/2026 CLP 125,000,000 165,016.31 0.47 CL0002187822 Chile 5% 01/03/2035 CLP 280,000,000 391,562.41 1.12
CL0002454230 Chile 4% 01/03/2023 CLP 320,000,000 395,481.31 1.13
Total in Chile 952,060.03 2.72
China
XS1450882169 JPMorgan Chase Bank NA CLN 2.68% 21/05/2030 CNY 8,300,000 994,195.72 2.84
Total in China 994,195.72 2.84
Colombia
COL17CT02385 Colombia 10% 24/07/2024 COP 1,950,000,000 566,017.66 1.61
COL17CT02914 Colombia 6% 28/04/2028 COP 4,378,800,000 1,120,750.28 3.20
COL17CT03359 Colombia 3.5% 07/05/2025 COP 778,000 57,093.20 0.16
COL17CT03490 Colombia 7% 30/06/2032 COP 900,000,000 237,559.10 0.68
COL17CT03722 Colombia 7.25% 26/10/2050 COP 776,000,000 199,861.92 0.57
Total in Colombia 2,181,282.16 6.22
Czechia
CZ0001004253 Czechia 2.4% 17/09/2025 CZK 15,940,000 652,786.29 1.86
CZ0001004477 Czechia 0.95% 15/05/2030 CZK 2,000,000 74,225.13 0.21
CZ0001004600 Czechia 0.45% 25/10/2023 CZK 18,970,000 725,166.40 2.07
Total in Czechia 1,452,177.82 4.14
Egypt
XS2168760754 JPMorgan Chase Bank NA CLN 0% 02/09/2021 EGP 5,000,000 237,752.76 0.68
XS2168766876 JPMorgan Chase Bank NA CLN 14.605% 10/09/2025 EGP 10,884,000 598,292.83 1.71
Total in Egypt 836,045.59 2.39
Hungary
HU0000402748 Hungary 5.5% 24/06/2025 HUF 48,000,000 157,723.35 0.45 HU0000403118 Hungary 3% 27/10/2027 HUF 187,000,000 565,403.14 1.61
HU0000403571 Hungary 2.5% 24/10/2024 HUF 201,000,000 586,640.14 1.67
HU0000403704 Hungary 1.5% 24/08/2022 HUF 64,060,000 179,607.12 0.51
HU0000404280 Hungary 1.5% 23/08/2023 HUF 72,000,000 202,649.95 0.58
Total in Hungary 1,692,023.70 4.82
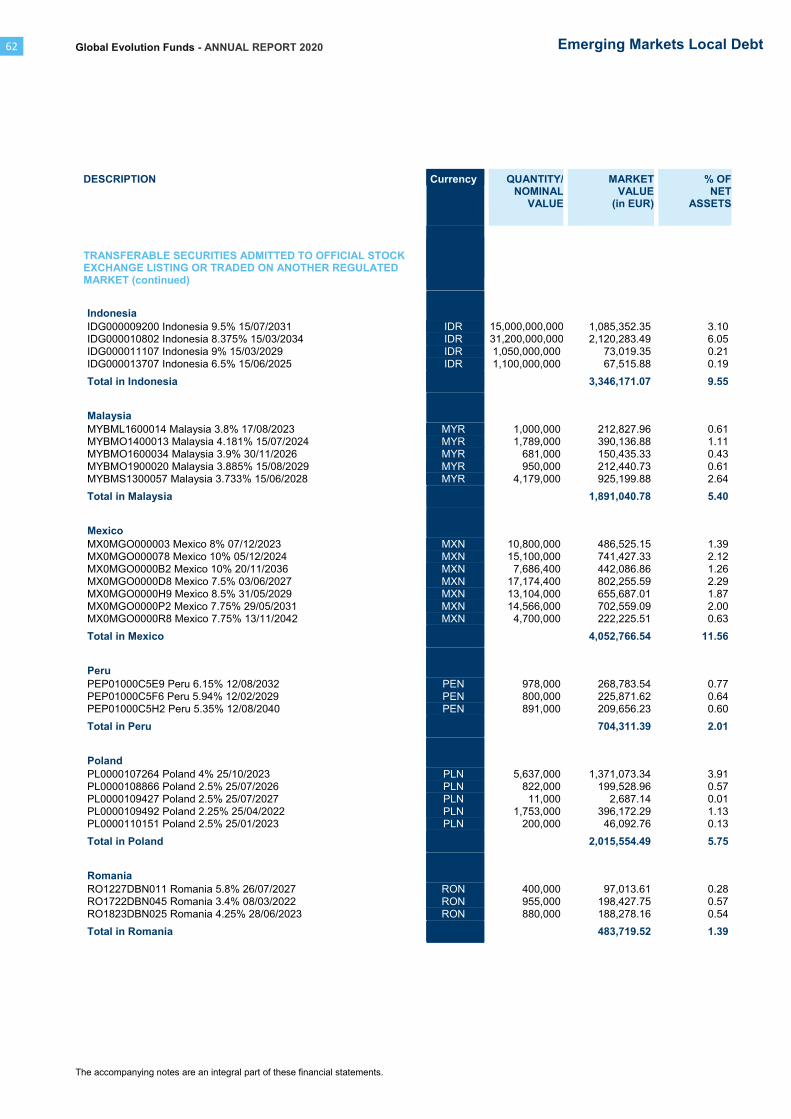
Global Evolution Funds - ANNUAL REPORT 2020
The accompanying notes are an integral part of these financial statements.
62 Emerging Markets Local Debt
DESCRIPTION Currency QUANTITY/NOMINAL
VALUE
MARKET VALUE
(in EUR)
% OFNET
ASSETS
TRANSFERABLE SECURITIES ADMITTED TO OFFICIAL STOCK EXCHANGE LISTING OR TRADED ON ANOTHER REGULATED MARKET (continued)
Indonesia
IDG000009200 Indonesia 9.5% 15/07/2031 IDR 15,000,000,000 1,085,352.35 3.10 IDG000010802 Indonesia 8.375% 15/03/2034 IDR 31,200,000,000 2,120,283.49 6.05
IDG000011107 Indonesia 9% 15/03/2029 IDR 1,050,000,000 73,019.35 0.21
IDG000013707 Indonesia 6.5% 15/06/2025 IDR 1,100,000,000 67,515.88 0.19
Total in Indonesia 3,346,171.07 9.55
Malaysia
MYBML1600014 Malaysia 3.8% 17/08/2023 MYR 1,000,000 212,827.96 0.61 MYBMO1400013 Malaysia 4.181% 15/07/2024 MYR 1,789,000 390,136.88 1.11
MYBMO1600034 Malaysia 3.9% 30/11/2026 MYR 681,000 150,435.33 0.43
MYBMO1900020 Malaysia 3.885% 15/08/2029 MYR 950,000 212,440.73 0.61
MYBMS1300057 Malaysia 3.733% 15/06/2028 MYR 4,179,000 925,199.88 2.64
Total in Malaysia 1,891,040.78 5.40
Mexico
MX0MGO000003 Mexico 8% 07/12/2023 MXN 10,800,000 486,525.15 1.39
MX0MGO000078 Mexico 10% 05/12/2024 MXN 15,100,000 741,427.33 2.12
MX0MGO0000B2 Mexico 10% 20/11/2036 MXN 7,686,400 442,086.86 1.26
MX0MGO0000D8 Mexico 7.5% 03/06/2027 MXN 17,174,400 802,255.59 2.29
MX0MGO0000H9 Mexico 8.5% 31/05/2029 MXN 13,104,000 655,687.01 1.87
MX0MGO0000P2 Mexico 7.75% 29/05/2031 MXN 14,566,000 702,559.09 2.00 MX0MGO0000R8 Mexico 7.75% 13/11/2042 MXN 4,700,000 222,225.51 0.63
Total in Mexico 4,052,766.54 11.56
Peru
PEP01000C5E9 Peru 6.15% 12/08/2032 PEN 978,000 268,783.54 0.77
PEP01000C5F6 Peru 5.94% 12/02/2029 PEN 800,000 225,871.62 0.64
PEP01000C5H2 Peru 5.35% 12/08/2040 PEN 891,000 209,656.23 0.60
Total in Peru 704,311.39 2.01
Poland
PL0000107264 Poland 4% 25/10/2023 PLN 5,637,000 1,371,073.34 3.91
PL0000108866 Poland 2.5% 25/07/2026 PLN 822,000 199,528.96 0.57
PL0000109427 Poland 2.5% 25/07/2027 PLN 11,000 2,687.14 0.01
PL0000109492 Poland 2.25% 25/04/2022 PLN 1,753,000 396,172.29 1.13 PL0000110151 Poland 2.5% 25/01/2023 PLN 200,000 46,092.76 0.13
Total in Poland 2,015,554.49 5.75
Romania
RO1227DBN011 Romania 5.8% 26/07/2027 RON 400,000 97,013.61 0.28
RO1722DBN045 Romania 3.4% 08/03/2022 RON 955,000 198,427.75 0.57
RO1823DBN025 Romania 4.25% 28/06/2023 RON 880,000 188,278.16 0.54
Total in Romania 483,719.52 1.39

Global Evolution Funds - ANNUAL REPORT 2020
The accompanying notes are an integral part of these financial statements.
Emerging Markets Local Debt 63
DESCRIPTION Currency QUANTITY/NOMINAL
VALUE
MARKET VALUE
(in EUR)
% OFNET
ASSETS
TRANSFERABLE SECURITIES ADMITTED TO OFFICIAL STOCK EXCHANGE LISTING OR TRADED ON ANOTHER REGULATED MARKET (continued)
Russian Federation
RU000A0JS3W6 Russian Federation 8.15% 03/02/2027 RUB 50,000,000 628,418.71 1.79 RU000A0JU4L3 Russian Federation 7% 16/08/2023 RUB 70,487,000 821,364.33 2.34
RU000A0ZYUA9 Russian Federation 6.9% 23/05/2029 RUB 25,850,000 307,132.32 0.88
RU000A0ZZYW2 Russian Federation 7.95% 07/10/2026 RUB 41,907,000 520,181.12 1.48
RU000A100A82 Russian Federation 7.65% 10/04/2030 RUB 27,800,000 346,981.06 0.99
RU000A100EF5 Russian Federation 7.7% 16/03/2039 RUB 26,000,000 328,269.62 0.94
RU000A1014N4 Russian Federation 6% 06/10/2027 RUB 11,000,000 123,925.24 0.35 RU000A102069 Russian Federation 2.5% 17/07/2030 RUB 16,840,000 190,260.92 0.54
Total in Russian Federation 3,266,533.32 9.31
South Africa
ZAG000077470 South Africa 7% 28/02/2031 ZAR 3,658,506 174,585.04 0.50
ZAG000096173 South Africa 8.75% 28/02/2048 ZAR 20,896,693 957,960.51 2.73
ZAG000107004 South Africa 8.25% 31/03/2032 ZAR 7,000,000 351,135.83 1.00 ZAG000107012 South Africa 8.5% 31/01/2037 ZAR 11,486,637 529,862.19 1.51
ZAG000125972 South Africa 8.875% 28/02/2035 ZAR 4,373,086 214,095.26 0.61
Total in South Africa 2,227,638.83 6.35
Supranational
US45950VEM46 Intl. Finance Corp 6.3% 25/11/2024 INR 20,000,000 232,132.00 0.66
XS1640903537 Asian Development Bank 5.9% 20/12/2022 INR 5,000,000 57,096.22 0.16 XS2177447179 Intl. Finance Corp 0% 20/05/2030 BRL 4,500,000 379,886.67 1.08
Total in Supranational 669,114.89 1.90
Thailand
TH0623039C03 Thailand 1.6% 17/12/2029 THB 13,100,000 371,568.42 1.06
TH062303I602 Thailand 3.3% 17/06/2038 THB 30,398,000 1,033,357.80 2.95
TH0623A33C00 Thailand 2.4% 17/12/2023 THB 4,000,000 115,410.19 0.33 TH0623A3C606 Thailand 3.775% 25/06/2032 THB 16,000,000 552,251.64 1.58
Total in Thailand 2,072,588.05 5.92
Turkey
TRT011025T16 Turkey 12.6% 01/10/2025 TRY 900,000 98,570.16 0.28
TRT220921T18 Turkey 9.2% 22/09/2021 TRY 8,000,000 844,510.10 2.41
Total in Turkey 943,080.26 2.69
Ukraine
XS2014271774 Ukraine GDN 15.84% 26/02/2025 UAH 22,910,000 743,051.35 2.12
Total in Ukraine 743,051.35 2.12

Global Evolution Funds - ANNUAL REPORT 2020
The accompanying notes are an integral part of these financial statements.
64 Emerging Markets Local Debt
DESCRIPTION Currency QUANTITY/NOMINAL
VALUE
MARKET VALUE
(in EUR)
% OFNET
ASSETS
TRANSFERABLE SECURITIES ADMITTED TO OFFICIAL STOCK EXCHANGE LISTING OR TRADED ON ANOTHER REGULATED MARKET (continued)
Uruguay
US917288BL51 Uruguay 3.875% 02/07/2040 UYU 20,989,000 485,564.00 1.39
Total in Uruguay 485,564.00 1.39
Uzbekistan
XS2264056313 Uzbekistan 14.5% 25/11/2023 UZS 4,530,000,000 358,681.47 1.02
Total in Uzbekistan 358,681.47 1.02
TOTAL TRANSFERABLE SECURITIES ADMITTED TO OFFICIAL STOCK EXCHANGE LISTING OR TRADED ON ANOTHER REGULATED MARKET
33,980,996.06 96.94
TOTAL INVESTMENT IN SECURITIES 33,980,996.06 96.94
Cash and cash equivalent 627,147.47 1.79
Other Net Assets 443,914.81 1.27
TOTAL NET ASSETS 35,052,058.34 100.00

Global Evolution Funds - ANNUAL REPORT 2020
Schedule of Investments and Other Net Assets as of December 31, 2020 (in EUR)
The accompanying notes are an integral part of these financial statements.
Frontier Opportunities 65
DESCRIPTION Currency QUANTITY/NOMINAL
VALUE
MARKET VALUE
(in EUR)
% OFNET
ASSETS
TRANSFERABLE SECURITIES ADMITTED TO OFFICIAL STOCK EXCHANGE LISTING OR TRADED ON ANOTHER REGULATED MARKET
Angola
XS1337184193 Aurora Australis BV CLN FRN 19/12/2023 USD 2,028,750 1,593,751.45 0.55 XS1819680288 Angola 8.25% 09/05/2028 USD 5,041,000 3,963,106.61 1.37
XS1819680528 Angola 9.375% 08/05/2048 USD 6,843,000 5,288,637.30 1.83
Total in Angola 10,845,495.36 3.75
Argentina
US040114HS26 Argentina 0.125% 09/07/2030 USD 1,339,194 445,467.68 0.15
US040114HT09 Argentina 0.125% 09/07/2035 USD 12,952,107 3,884,944.20 1.34 US040114HX11 Argentina 1% 09/07/2029 USD 719,056 256,087.49 0.09
XS1649634034 Buenos Aires 5.375% 20/01/2023 (flat trading) EUR 800,000 299,990.62 0.10
Total in Argentina 4,886,489.99 1.68
Azerbaijan
XS1505657079 Frontera Capital BV CLN VAR 18/10/2021 USD 829,000 646,641.03 0.22
XS2201941247 Frontera Capital BV CLN 10% 01/08/2023 AZN 1,300,000 625,356.84 0.22
Total in Azerbaijan 1,271,997.87 0.44
Belarus
XS1981779975 Dev. Bank of the Republic of Belarus 12% 15/05/2022 BYN 3,400,000 1,092,777.81 0.38
Total in Belarus 1,092,777.81 0.38
Bosnia and Herzegovina
XS0082227546 Bosnia and Herzegovina FRN 20/12/2021 DEM 520,666 257,455.38 0.09
Total in Bosnia and Herzegovina 257,455.38 0.09
Cameroon
XS1313779081 Cameroon 9.5% 19/11/2025 USD 4,472,000 4,079,459.79 1.41
Total in Cameroon 4,079,459.79 1.41
Côte d'Ivoire
XS1793329225 Côte d'Ivoire 5.25% 22/03/2030 EUR 3,700,000 3,979,213.10 1.38 XS1796266754 Côte d'Ivoire 6.625% 22/03/2048 EUR 4,370,000 4,855,524.48 1.68
XS2064786754 Côte d'Ivoire 5.875% 17/10/2031 EUR 1,500,000 1,662,399.00 0.58
XS2264871828 Côte d'Ivoire 4.875% 30/01/2032 EUR 198,000 204,114.24 0.07
Total in Côte d'Ivoire 10,701,250.82 3.71

Global Evolution Funds - ANNUAL REPORT 2020
The accompanying notes are an integral part of these financial statements.
66 Frontier Opportunities
DESCRIPTION Currency QUANTITY/NOMINAL
VALUE
MARKET VALUE
(in EUR)
% OFNET
ASSETS
TRANSFERABLE SECURITIES ADMITTED TO OFFICIAL STOCK EXCHANGE LISTING OR TRADED ON ANOTHER REGULATED MARKET (continued)
Dominican Republic
US25714PBF45 Dominican Republic GDN 15.95% 04/06/2021 DOP 216,600,000 3,185,866.40 1.10 US25714PBP27 Dominican Republic GDN 16.95% 04/02/2022 DOP 34,500,000 541,418.59 0.19
USP3579EBZ99 Dominican Republic 8.9% 15/02/2023 DOP 255,000,000 3,706,179.27 1.28
USP3579ECD78 Dominican Republic 9.75% 05/06/2026 DOP 212,850,000 3,228,202.75 1.12
XS1180454321 Dominican Republic GDN 12% 20/01/2022 DOP 8,250,000 123,122.25 0.04
XS1203837528 Dominican Republic GDN 10.375% 04/03/2022 DOP 32,400,000 481,523.74 0.17
XS1597325098 Dominican Republic GDN 10.5% 07/04/2023 DOP 30,000,000 455,464.91 0.16
Total in Dominican Republic 11,721,777.91 4.06
Ecuador
XS2214237807 Ecuador 0.5% 31/07/2030 USD 3,885,965 2,044,534.41 0.71
XS2214238441 Ecuador 0.5% 31/07/2035 USD 5,961,145 2,661,383.04 0.92
XS2214239175 Ecuador 0.5% 31/07/2040 USD 1,101,467 461,372.95 0.16
XS2214239506 Ecuador 0% 31/07/2030 USD 318,751 124,720.73 0.04
Total in Ecuador 5,292,011.13 1.83
Egypt
XS1633841751 ICBC Standard Bank PLC CLN 18.4% 03/06/2024 EGP 23,032,561 1,357,926.15 0.47
XS1799503674 Frontera Capital BV CLN 15.58% 17/05/2027 EGP 47,000,000 2,669,357.81 0.92
XS1863918378 ICBC Standard Bank PLC CLN 15.7% 09/11/2027 EGP 12,000,000 680,300.54 0.24
XS2232102108 Shamrock Capital PLC CLN 0% 20/09/2021 EGP 20,000,000 952,517.81 0.33 XS2251937384 ICBC Standard Bank PLC CLN 14.313% 17/10/2023 EGP 136,890,000 7,171,188.66 2.48
XS2267892862 Citigroup Global Markets CLN 14.313% 17/10/2023 EGP 12,000,000 651,785.17 0.23
Total in Egypt 13,483,076.14 4.67
El Salvador
USP01012AR71 El Salvador 7.625% 01/02/2041 USD 1,000,000 761,113.19 0.26
USP01012CA29 El Salvador 7.1246% 20/01/2050 USD 2,700,000 1,980,507.63 0.69 XS0146173371 El Salvador 8.25% 10/04/2032 USD 1,000,000 805,034.57 0.28
Total in El Salvador 3,546,655.39 1.23
Ethiopia
XS1151974877 Ethiopia 6.625% 11/12/2024 USD 3,000,000 2,501,336.39 0.87
Total in Ethiopia 2,501,336.39 0.87
Gabon
XS1003557870 Gabon 6.375% 12/12/2024 USD 1,152,820 983,413.78 0.34
XS2113615228 Gabon 6.625% 06/02/2031 USD 2,392,000 2,023,503.27 0.70
Total in Gabon 3,006,917.05 1.04

Global Evolution Funds - ANNUAL REPORT 2020
The accompanying notes are an integral part of these financial statements.
Frontier Opportunities 67
DESCRIPTION Currency QUANTITY/NOMINAL
VALUE
MARKET VALUE
(in EUR)
% OFNET
ASSETS
TRANSFERABLE SECURITIES ADMITTED TO OFFICIAL STOCK EXCHANGE LISTING OR TRADED ON ANOTHER REGULATED MARKET (continued)
Georgia
XS1389210698 Frontera Capital BV CLN VAR 29/10/2021 USD 2,110,000 1,211,971.78 0.42 XS1456452801 Frontera Capital BV CLN VAR 04/08/2021 USD 297,424 213,863.99 0.07
XS1639850558 Zambezi BV CLN 9.5% 09/08/2022 USD 3,800,000 2,381,463.88 0.82
XS1801123321 FMO NV FRN 06/04/2021 USD 2,500,000 1,505,872.32 0.52
XS2270780062 ICBC Standard Bank PLC CLN 9.125% 03/06/2025 GEL 5,500,000 1,420,835.33 0.49
XS2279406545 Frontera Capital Group BV CLN 8.4% 25/01/2024 USD 1,200,000 980,752.77 0.34
Total in Georgia 7,714,760.07 2.66
Ghana
GHGGOG041880 Ghana 24.75% 01/03/2021 GHS 3,100,000 440,924.37 0.15
GHGGOG042631 Ghana 24.5% 21/06/2021 GHS 3,454,000 500,448.72 0.17
GHGGOG042813 Ghana 24.75% 19/07/2021 GHS 20,678,000 3,003,295.28 1.04
GHGGOG043563 Ghana 19% 02/11/2026 GHS 23,204,000 3,081,582.56 1.07
GHGGOG045980 Ghana 18.25% 25/07/2022 GHS 10,175,000 1,425,832.28 0.49 GHGGOG048935 Ghana 16.5% 22/03/2021 GHS 4,000,000 562,415.43 0.19
GHGGOG055500 Ghana 19.7% 23/05/2022 GHS 5,100,000 725,113.51 0.25
GHGGOG056219 Ghana 19.5% 08/07/2024 GHS 7,500,000 1,045,487.51 0.36
XS1136935506 Saderea DAC 12.5% 30/11/2026 USD 2,445,843 2,118,910.96 0.73
Total in Ghana 12,904,010.62 4.45
Iraq
XS0240295575 Iraq 5.8% 15/01/2028 USD 3,000,000 2,306,129.81 0.80
XS1662407862 Iraq 6.752% 09/03/2023 USD 2,400,000 1,921,624.21 0.66
Total in Iraq 4,227,754.02 1.46
Kenya
KE3000008130 Kenya 11% 15/09/2025 KES 962 7.35 -
KE4000001653 Kenya 11% 15/03/2027 KES 60,450,000 460,963.25 0.16 KE5000004100 Kenya 11% 02/12/2024 KES 106,200,000 826,539.04 0.29
KE5000004654 Kenya 12.5% 12/05/2025 KES 274,050,000 2,180,018.41 0.75
KE5000006659 Kenya 12% 06/10/2031 KES 202,100,000 1,599,936.23 0.55
KE5000007988 Kenya 12.5% 18/11/2024 KES 220,000,000 1,750,802.02 0.61
KE5000008093 Kenya 12.5% 10/01/2033 KES 329,000,000 2,720,171.31 0.94
KE6000008653 Kenya 10.2% 25/05/2026 KES 53,000,000 403,142.00 0.14 KE6000009545 Kenya 10.9% 11/08/2031 KES 250,000,000 1,890,047.68 0.65
Total in Kenya 11,831,627.29 4.09
Kyrgyzstan
XS1759631382 Frontera Capital BV CLN 12% 04/02/2028 KGS 119,000,000 1,293,245.97 0.45
XS1788847942 Frontera Capital BV CLN 6% 04/03/2021 KGS 37,000,000 366,355.25 0.13
XS1788848676 Frontera Capital BV CLN 8% 10/03/2025 KGS 50,000,000 458,288.93 0.16 XS1807432510 Zambezi BV CLN 10% 13/04/2028 KGS 190,000,000 1,873,580.46 0.65
XS1823621666 Frontera Capital BV CLN 8% 26/05/2025 KGS 80,000,000 725,984.25 0.25
XS2226129422 Frontera Capital Group BV CLN 6% 19/09/2025 KGS 152,000,000 1,324,808.52 0.46
XS2226131915 Frontera Capital Group BV CLN 12% 07/02/2028 KGS 120,000,000 1,389,314.08 0.48
Total in Kyrgyzstan 7,431,577.46 2.58
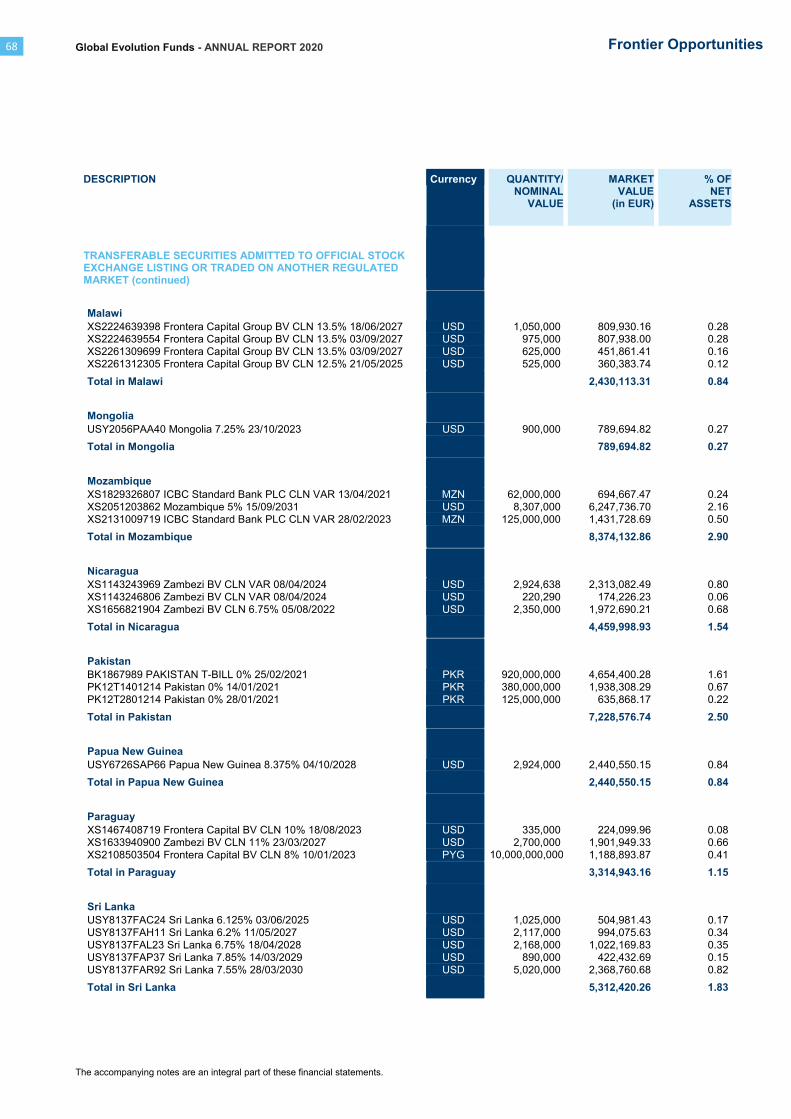
Global Evolution Funds - ANNUAL REPORT 2020
The accompanying notes are an integral part of these financial statements.
68 Frontier Opportunities
DESCRIPTION Currency QUANTITY/NOMINAL
VALUE
MARKET VALUE
(in EUR)
% OFNET
ASSETS
TRANSFERABLE SECURITIES ADMITTED TO OFFICIAL STOCK EXCHANGE LISTING OR TRADED ON ANOTHER REGULATED MARKET (continued)
Malawi
XS2224639398 Frontera Capital Group BV CLN 13.5% 18/06/2027 USD 1,050,000 809,930.16 0.28 XS2224639554 Frontera Capital Group BV CLN 13.5% 03/09/2027 USD 975,000 807,938.00 0.28
XS2261309699 Frontera Capital Group BV CLN 13.5% 03/09/2027 USD 625,000 451,861.41 0.16
XS2261312305 Frontera Capital Group BV CLN 12.5% 21/05/2025 USD 525,000 360,383.74 0.12
Total in Malawi 2,430,113.31 0.84
Mongolia
USY2056PAA40 Mongolia 7.25% 23/10/2023 USD 900,000 789,694.82 0.27
Total in Mongolia 789,694.82 0.27
Mozambique
XS1829326807 ICBC Standard Bank PLC CLN VAR 13/04/2021 MZN 62,000,000 694,667.47 0.24
XS2051203862 Mozambique 5% 15/09/2031 USD 8,307,000 6,247,736.70 2.16
XS2131009719 ICBC Standard Bank PLC CLN VAR 28/02/2023 MZN 125,000,000 1,431,728.69 0.50
Total in Mozambique 8,374,132.86 2.90
Nicaragua
XS1143243969 Zambezi BV CLN VAR 08/04/2024 USD 2,924,638 2,313,082.49 0.80
XS1143246806 Zambezi BV CLN VAR 08/04/2024 USD 220,290 174,226.23 0.06
XS1656821904 Zambezi BV CLN 6.75% 05/08/2022 USD 2,350,000 1,972,690.21 0.68
Total in Nicaragua 4,459,998.93 1.54
Pakistan
BK1867989 PAKISTAN T-BILL 0% 25/02/2021 PKR 920,000,000 4,654,400.28 1.61
PK12T1401214 Pakistan 0% 14/01/2021 PKR 380,000,000 1,938,308.29 0.67
PK12T2801214 Pakistan 0% 28/01/2021 PKR 125,000,000 635,868.17 0.22
Total in Pakistan 7,228,576.74 2.50
Papua New Guinea
USY6726SAP66 Papua New Guinea 8.375% 04/10/2028 USD 2,924,000 2,440,550.15 0.84
Total in Papua New Guinea 2,440,550.15 0.84
Paraguay
XS1467408719 Frontera Capital BV CLN 10% 18/08/2023 USD 335,000 224,099.96 0.08
XS1633940900 Zambezi BV CLN 11% 23/03/2027 USD 2,700,000 1,901,949.33 0.66
XS2108503504 Frontera Capital BV CLN 8% 10/01/2023 PYG 10,000,000,000 1,188,893.87 0.41
Total in Paraguay 3,314,943.16 1.15
Sri Lanka
USY8137FAC24 Sri Lanka 6.125% 03/06/2025 USD 1,025,000 504,981.43 0.17
USY8137FAH11 Sri Lanka 6.2% 11/05/2027 USD 2,117,000 994,075.63 0.34
USY8137FAL23 Sri Lanka 6.75% 18/04/2028 USD 2,168,000 1,022,169.83 0.35
USY8137FAP37 Sri Lanka 7.85% 14/03/2029 USD 890,000 422,432.69 0.15
USY8137FAR92 Sri Lanka 7.55% 28/03/2030 USD 5,020,000 2,368,760.68 0.82
Total in Sri Lanka 5,312,420.26 1.83
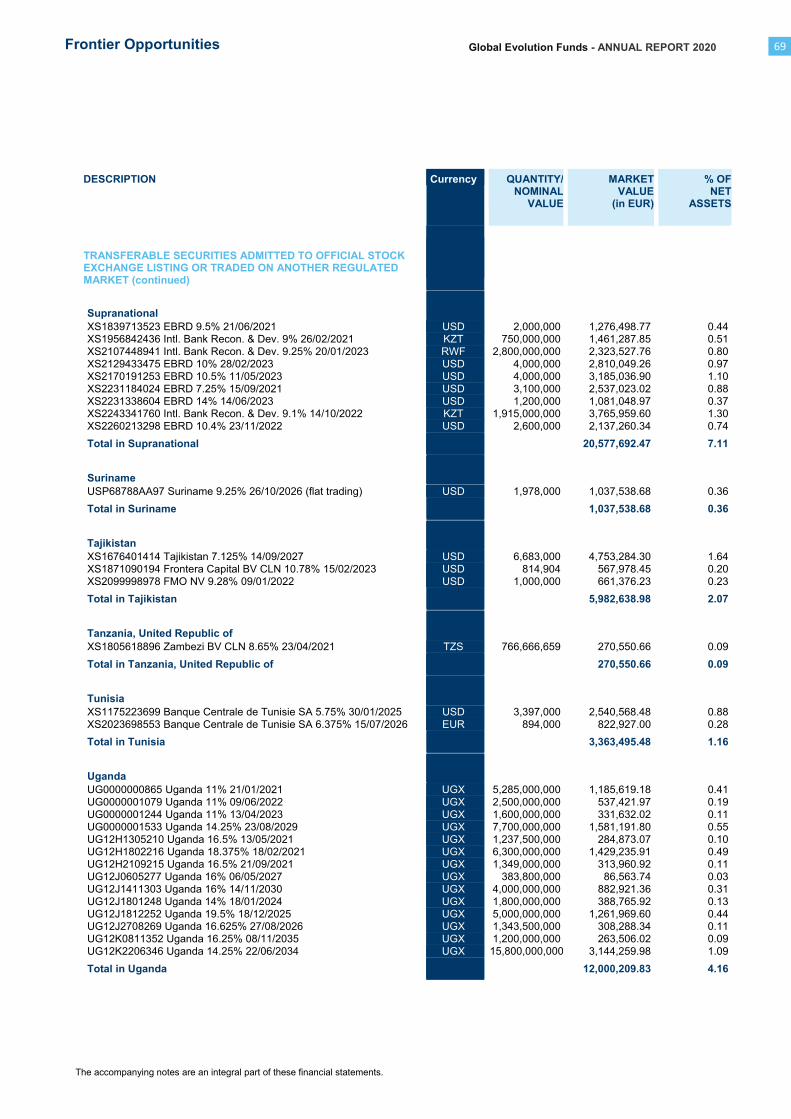
Global Evolution Funds - ANNUAL REPORT 2020
The accompanying notes are an integral part of these financial statements.
Frontier Opportunities 69
DESCRIPTION Currency QUANTITY/NOMINAL
VALUE
MARKET VALUE
(in EUR)
% OFNET
ASSETS
TRANSFERABLE SECURITIES ADMITTED TO OFFICIAL STOCK EXCHANGE LISTING OR TRADED ON ANOTHER REGULATED MARKET (continued)
Supranational
XS1839713523 EBRD 9.5% 21/06/2021 USD 2,000,000 1,276,498.77 0.44 XS1956842436 Intl. Bank Recon. & Dev. 9% 26/02/2021 KZT 750,000,000 1,461,287.85 0.51
XS2107448941 Intl. Bank Recon. & Dev. 9.25% 20/01/2023 RWF 2,800,000,000 2,323,527.76 0.80
XS2129433475 EBRD 10% 28/02/2023 USD 4,000,000 2,810,049.26 0.97
XS2170191253 EBRD 10.5% 11/05/2023 USD 4,000,000 3,185,036.90 1.10
XS2231184024 EBRD 7.25% 15/09/2021 USD 3,100,000 2,537,023.02 0.88
XS2231338604 EBRD 14% 14/06/2023 USD 1,200,000 1,081,048.97 0.37 XS2243341760 Intl. Bank Recon. & Dev. 9.1% 14/10/2022 KZT 1,915,000,000 3,765,959.60 1.30
XS2260213298 EBRD 10.4% 23/11/2022 USD 2,600,000 2,137,260.34 0.74
Total in Supranational 20,577,692.47 7.11
Suriname
USP68788AA97 Suriname 9.25% 26/10/2026 (flat trading) USD 1,978,000 1,037,538.68 0.36
Total in Suriname 1,037,538.68 0.36
Tajikistan
XS1676401414 Tajikistan 7.125% 14/09/2027 USD 6,683,000 4,753,284.30 1.64
XS1871090194 Frontera Capital BV CLN 10.78% 15/02/2023 USD 814,904 567,978.45 0.20
XS2099998978 FMO NV 9.28% 09/01/2022 USD 1,000,000 661,376.23 0.23
Total in Tajikistan 5,982,638.98 2.07
Tanzania, United Republic of
XS1805618896 Zambezi BV CLN 8.65% 23/04/2021 TZS 766,666,659 270,550.66 0.09
Total in Tanzania, United Republic of 270,550.66 0.09
Tunisia
XS1175223699 Banque Centrale de Tunisie SA 5.75% 30/01/2025 USD 3,397,000 2,540,568.48 0.88
XS2023698553 Banque Centrale de Tunisie SA 6.375% 15/07/2026 EUR 894,000 822,927.00 0.28
Total in Tunisia 3,363,495.48 1.16
Uganda
UG0000000865 Uganda 11% 21/01/2021 UGX 5,285,000,000 1,185,619.18 0.41
UG0000001079 Uganda 11% 09/06/2022 UGX 2,500,000,000 537,421.97 0.19
UG0000001244 Uganda 11% 13/04/2023 UGX 1,600,000,000 331,632.02 0.11
UG0000001533 Uganda 14.25% 23/08/2029 UGX 7,700,000,000 1,581,191.80 0.55
UG12H1305210 Uganda 16.5% 13/05/2021 UGX 1,237,500,000 284,873.07 0.10 UG12H1802216 Uganda 18.375% 18/02/2021 UGX 6,300,000,000 1,429,235.91 0.49
UG12H2109215 Uganda 16.5% 21/09/2021 UGX 1,349,000,000 313,960.92 0.11
UG12J0605277 Uganda 16% 06/05/2027 UGX 383,800,000 86,563.74 0.03
UG12J1411303 Uganda 16% 14/11/2030 UGX 4,000,000,000 882,921.36 0.31
UG12J1801248 Uganda 14% 18/01/2024 UGX 1,800,000,000 388,765.92 0.13
UG12J1812252 Uganda 19.5% 18/12/2025 UGX 5,000,000,000 1,261,969.60 0.44 UG12J2708269 Uganda 16.625% 27/08/2026 UGX 1,343,500,000 308,288.34 0.11
UG12K0811352 Uganda 16.25% 08/11/2035 UGX 1,200,000,000 263,506.02 0.09
UG12K2206346 Uganda 14.25% 22/06/2034 UGX 15,800,000,000 3,144,259.98 1.09
Total in Uganda 12,000,209.83 4.16

Global Evolution Funds - ANNUAL REPORT 2020
The accompanying notes are an integral part of these financial statements.
70 Frontier Opportunities
DESCRIPTION Currency QUANTITY/NOMINAL
VALUE
MARKET VALUE
(in EUR)
% OFNET
ASSETS
TRANSFERABLE SECURITIES ADMITTED TO OFFICIAL STOCK EXCHANGE LISTING OR TRADED ON ANOTHER REGULATED MARKET (continued)
Ukraine
XS1710579571 Citigroup Global Markets CLN 14.16% 14/10/2022 UAH 86,000,000 2,686,542.88 0.93 XS1766785189 ICBC Standard Bank PLC CLN 14.91% 14/10/2022 UAH 184,000,000 5,755,913.15 1.99
XS2004503533 Citigroup Global Markets CLN 9.3% 28/08/2023 UAH 21,000,000 603,269.92 0.21
XS2014271774 Ukraine GDN 15.84% 26/02/2025 UAH 91,000,000 2,951,447.95 1.02
XS2277965963 ICBC Standard Bank PLC CLN 15.84% 28/02/2025 UAH 33,000,000 1,115,007.29 0.39
Total in Ukraine 13,112,181.19 4.54
Uruguay
US917288BL51 Uruguay 3.875% 02/07/2040 UYU 359,605,000 8,319,178.78 2.88
USP80557BV53 Uruguay 8.5% 15/03/2028 UYU 119,459,000 2,425,113.90 0.84
USP96006AE41 Uruguay 9.875% 20/06/2022 UYU 123,885,000 2,488,651.89 0.86
Total in Uruguay 13,232,944.57 4.58
Uzbekistan
XS2026817432 Frontera Capital Group BV CLN 12.5% 10/08/2022 UZS 16,000,000,000 1,260,750.25 0.44 XS2093764236 Frontera Capital BV CLN VAR 08/01/2021 USD 1,000,000 777,246.57 0.27
XS2093766280 Frontera Capital BV CLN VAR 10/01/2023 USD 1,000,000 783,131.09 0.27
XS2093769037 Frontera Capital BV CLN VAR 10/01/2025 USD 1,000,000 791,140.57 0.27
XS2093770555 Frontera Capital BV CLN 14.75% 11/01/2027 USD 1,000,000 795,063.58 0.28
XS2226716715 Frontera Capital Group BV CLN 12% 21/09/2022 USD 3,900,000 3,186,490.27 1.10
XS2264056313 Uzbekistan 14.5% 25/11/2023 UZS 30,900,000,000 2,446,635.27 0.85
Total in Uzbekistan 10,040,457.60 3.48
Zambia
XS1267081575 Zambia 8.97% 30/07/2027 (flat trading) USD 9,000,000 3,898,602.60 1.35
ZM1000002809 Zambia 12% 23/11/2022 ZMW 1,915,000 53,999.10 0.02
ZM1000002924 Zambia 12% 23/05/2023 ZMW 15,230,000 408,838.07 0.14
ZM1000002973 Zambia 11% 29/08/2021 ZMW 56,080,000 1,930,524.02 0.67 ZM1000002999 Zambia 13% 29/08/2026 ZMW 138,825,000 2,664,013.97 0.92
ZM1000003047 Zambia 12% 21/11/2023 ZMW 2,590,000 65,250.21 0.02
ZM1000003096 Zambia 11% 05/12/2021 ZMW 1,535,000 50,589.19 0.02
ZM1000003104 Zambia 12% 05/12/2023 ZMW 1,535,000 38,460.97 0.01
ZM1000003351 Zambia 13% 18/12/2027 ZMW 34,000,000 623,096.66 0.22
ZM1000004433 Zambia 11% 27/07/2025 ZMW 24,000,000 465,095.71 0.16
Total in Zambia 10,198,470.50 3.53
Zimbabwe
XS2056560225 Frontera Capital BV CLN VAR 30/04/2021 USD 3,797,071 2,464,038.41 0.85
Total in Zimbabwe 2,464,038.41 0.85
TOTAL TRANSFERABLE SECURITIES ADMITTED TO OFFICIAL STOCK EXCHANGE LISTING OR TRADED ON ANOTHER REGULATED MARKET
243,427,079.09 84.20
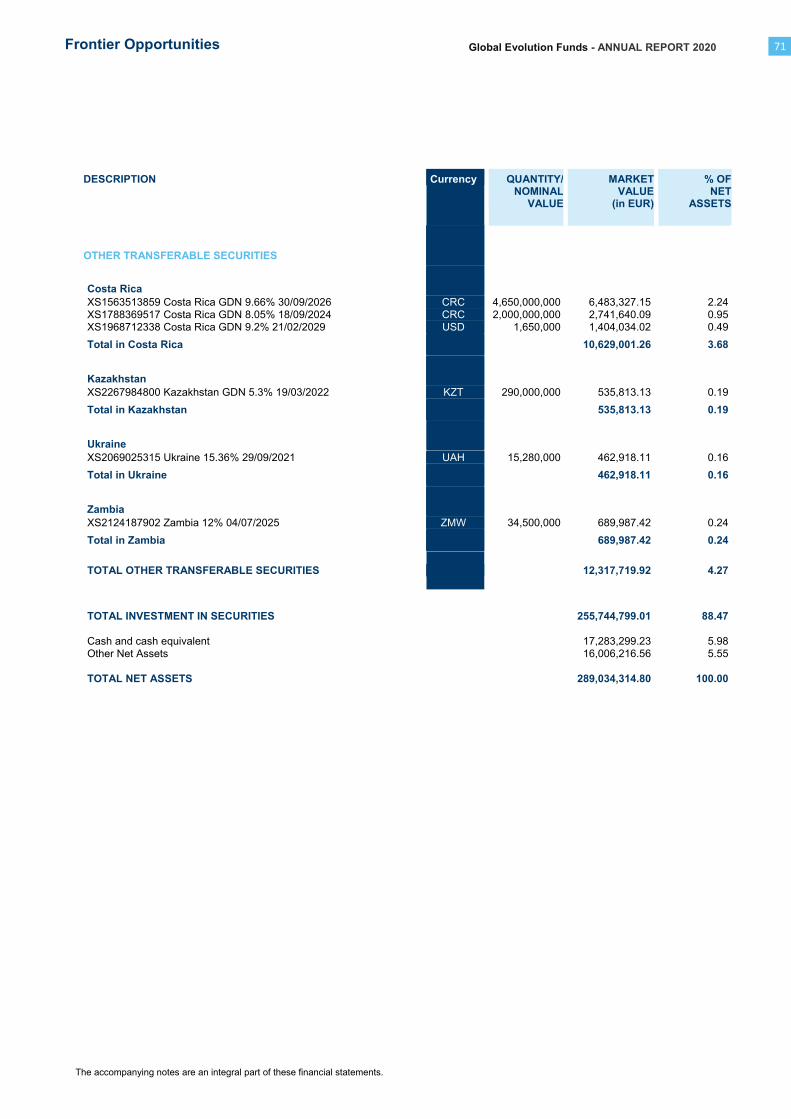
Global Evolution Funds - ANNUAL REPORT 2020
The accompanying notes are an integral part of these financial statements.
Frontier Opportunities 71
DESCRIPTION Currency QUANTITY/NOMINAL
VALUE
MARKET VALUE
(in EUR)
% OFNET
ASSETS
OTHER TRANSFERABLE SECURITIES
Costa Rica
XS1563513859 Costa Rica GDN 9.66% 30/09/2026 CRC 4,650,000,000 6,483,327.15 2.24
XS1788369517 Costa Rica GDN 8.05% 18/09/2024 CRC 2,000,000,000 2,741,640.09 0.95
XS1968712338 Costa Rica GDN 9.2% 21/02/2029 USD 1,650,000 1,404,034.02 0.49
Total in Costa Rica 10,629,001.26 3.68
Kazakhstan
XS2267984800 Kazakhstan GDN 5.3% 19/03/2022 KZT 290,000,000 535,813.13 0.19
Total in Kazakhstan 535,813.13 0.19
Ukraine
XS2069025315 Ukraine 15.36% 29/09/2021 UAH 15,280,000 462,918.11 0.16
Total in Ukraine 462,918.11 0.16
Zambia
XS2124187902 Zambia 12% 04/07/2025 ZMW 34,500,000 689,987.42 0.24
Total in Zambia 689,987.42 0.24
TOTAL OTHER TRANSFERABLE SECURITIES 12,317,719.92 4.27
TOTAL INVESTMENT IN SECURITIES 255,744,799.01 88.47
Cash and cash equivalent 17,283,299.23 5.98
Other Net Assets 16,006,216.56 5.55
TOTAL NET ASSETS 289,034,314.80 100.00
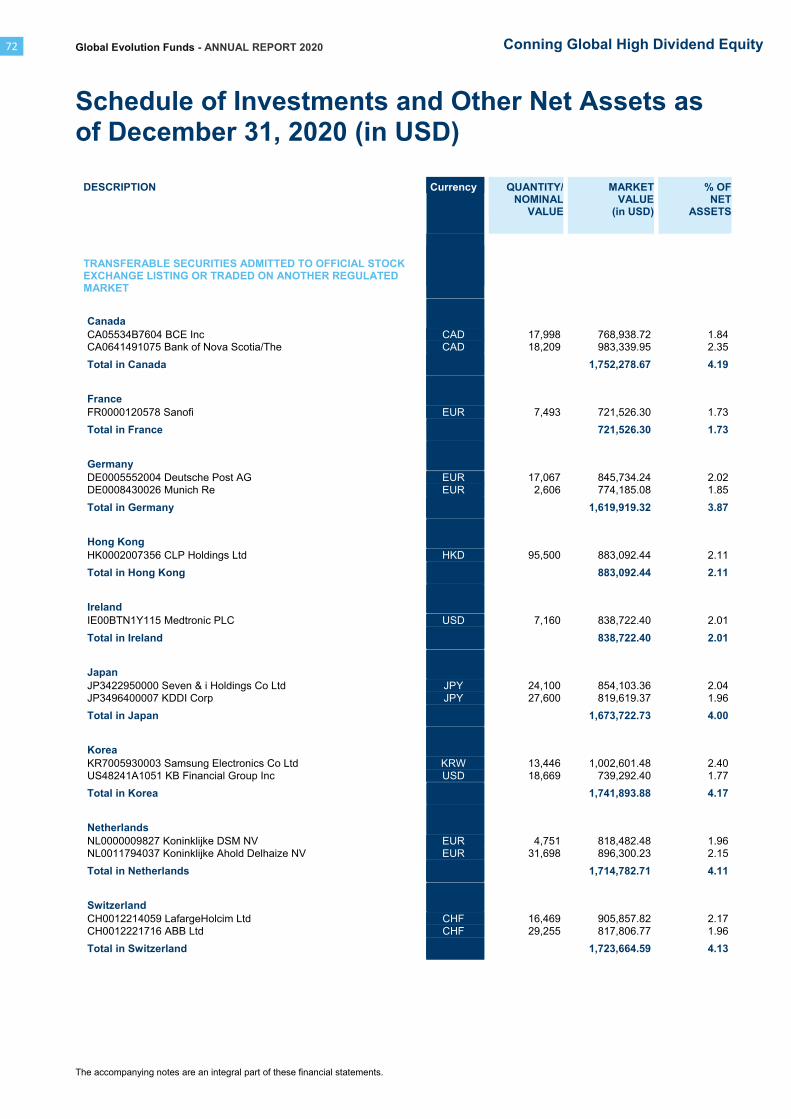
Global Evolution Funds - ANNUAL REPORT 2020
Schedule of Investments and Other Net Assets as of December 31, 2020 (in USD)
The accompanying notes are an integral part of these financial statements.
72 Conning Global High Dividend Equity
DESCRIPTION Currency QUANTITY/NOMINAL
VALUE
MARKET VALUE
(in USD)
% OFNET
ASSETS
TRANSFERABLE SECURITIES ADMITTED TO OFFICIAL STOCK EXCHANGE LISTING OR TRADED ON ANOTHER REGULATED MARKET
Canada
CA05534B7604 BCE Inc CAD 17,998 768,938.72 1.84 CA0641491075 Bank of Nova Scotia/The CAD 18,209 983,339.95 2.35
Total in Canada 1,752,278.67 4.19
France
FR0000120578 Sanofi EUR 7,493 721,526.30 1.73
Total in France 721,526.30 1.73
Germany
DE0005552004 Deutsche Post AG EUR 17,067 845,734.24 2.02
DE0008430026 Munich Re EUR 2,606 774,185.08 1.85
Total in Germany 1,619,919.32 3.87
Hong Kong
HK0002007356 CLP Holdings Ltd HKD 95,500 883,092.44 2.11
Total in Hong Kong 883,092.44 2.11
Ireland
IE00BTN1Y115 Medtronic PLC USD 7,160 838,722.40 2.01
Total in Ireland 838,722.40 2.01
Japan
JP3422950000 Seven & i Holdings Co Ltd JPY 24,100 854,103.36 2.04
JP3496400007 KDDI Corp JPY 27,600 819,619.37 1.96
Total in Japan 1,673,722.73 4.00
Korea
KR7005930003 Samsung Electronics Co Ltd KRW 13,446 1,002,601.48 2.40
US48241A1051 KB Financial Group Inc USD 18,669 739,292.40 1.77
Total in Korea 1,741,893.88 4.17
Netherlands
NL0000009827 Koninklijke DSM NV EUR 4,751 818,482.48 1.96
NL0011794037 Koninklijke Ahold Delhaize NV EUR 31,698 896,300.23 2.15
Total in Netherlands 1,714,782.71 4.11
Switzerland
CH0012214059 LafargeHolcim Ltd CHF 16,469 905,857.82 2.17
CH0012221716 ABB Ltd CHF 29,255 817,806.77 1.96
Total in Switzerland 1,723,664.59 4.13
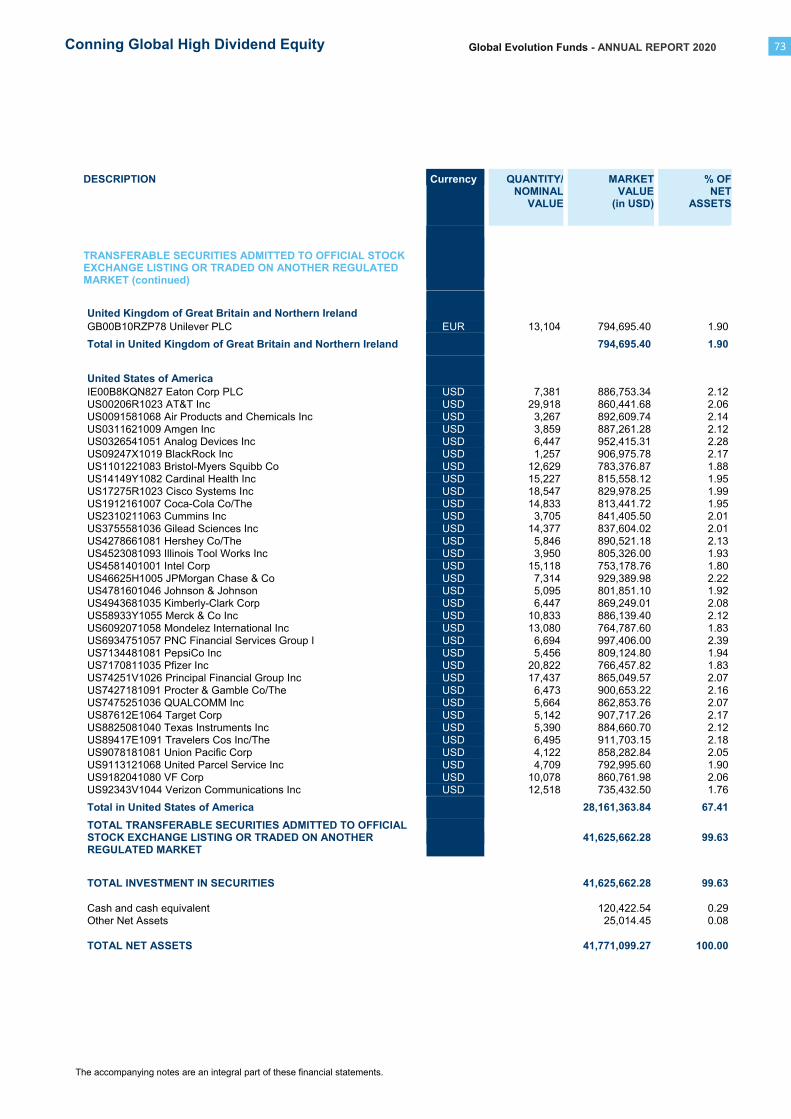
Global Evolution Funds - ANNUAL REPORT 2020
The accompanying notes are an integral part of these financial statements.
Conning Global High Dividend Equity 73
DESCRIPTION Currency QUANTITY/NOMINAL
VALUE
MARKET VALUE
(in USD)
% OFNET
ASSETS
TRANSFERABLE SECURITIES ADMITTED TO OFFICIAL STOCK EXCHANGE LISTING OR TRADED ON ANOTHER REGULATED MARKET (continued)
United Kingdom of Great Britain and Northern Ireland
GB00B10RZP78 Unilever PLC EUR 13,104 794,695.40 1.90
Total in United Kingdom of Great Britain and Northern Ireland 794,695.40 1.90
United States of America
IE00B8KQN827 Eaton Corp PLC USD 7,381 886,753.34 2.12
US00206R1023 AT&T Inc USD 29,918 860,441.68 2.06
US0091581068 Air Products and Chemicals Inc USD 3,267 892,609.74 2.14
US0311621009 Amgen Inc USD 3,859 887,261.28 2.12 US0326541051 Analog Devices Inc USD 6,447 952,415.31 2.28
US09247X1019 BlackRock Inc USD 1,257 906,975.78 2.17
US1101221083 Bristol-Myers Squibb Co USD 12,629 783,376.87 1.88
US14149Y1082 Cardinal Health Inc USD 15,227 815,558.12 1.95
US17275R1023 Cisco Systems Inc USD 18,547 829,978.25 1.99
US1912161007 Coca-Cola Co/The USD 14,833 813,441.72 1.95 US2310211063 Cummins Inc USD 3,705 841,405.50 2.01
US3755581036 Gilead Sciences Inc USD 14,377 837,604.02 2.01
US4278661081 Hershey Co/The USD 5,846 890,521.18 2.13
US4523081093 Illinois Tool Works Inc USD 3,950 805,326.00 1.93
US4581401001 Intel Corp USD 15,118 753,178.76 1.80
US46625H1005 JPMorgan Chase & Co USD 7,314 929,389.98 2.22 US4781601046 Johnson & Johnson USD 5,095 801,851.10 1.92
US4943681035 Kimberly-Clark Corp USD 6,447 869,249.01 2.08
US58933Y1055 Merck & Co Inc USD 10,833 886,139.40 2.12
US6092071058 Mondelez International Inc USD 13,080 764,787.60 1.83
US6934751057 PNC Financial Services Group I USD 6,694 997,406.00 2.39
US7134481081 PepsiCo Inc USD 5,456 809,124.80 1.94 US7170811035 Pfizer Inc USD 20,822 766,457.82 1.83
US74251V1026 Principal Financial Group Inc USD 17,437 865,049.57 2.07
US7427181091 Procter & Gamble Co/The USD 6,473 900,653.22 2.16
US7475251036 QUALCOMM Inc USD 5,664 862,853.76 2.07
US87612E1064 Target Corp USD 5,142 907,717.26 2.17
US8825081040 Texas Instruments Inc USD 5,390 884,660.70 2.12 US89417E1091 Travelers Cos Inc/The USD 6,495 911,703.15 2.18
US9078181081 Union Pacific Corp USD 4,122 858,282.84 2.05
US9113121068 United Parcel Service Inc USD 4,709 792,995.60 1.90
US9182041080 VF Corp USD 10,078 860,761.98 2.06
US92343V1044 Verizon Communications Inc USD 12,518 735,432.50 1.76
Total in United States of America 28,161,363.84 67.41
TOTAL TRANSFERABLE SECURITIES ADMITTED TO OFFICIAL STOCK EXCHANGE LISTING OR TRADED ON ANOTHER REGULATED MARKET
41,625,662.28 99.63
TOTAL INVESTMENT IN SECURITIES 41,625,662.28 99.63
Cash and cash equivalent 120,422.54 0.29
Other Net Assets 25,014.45 0.08
TOTAL NET ASSETS 41,771,099.27 100.00

Global Evolution Funds - ANNUAL REPORT 2020
74
Notes to the Financial Statements
Note 1 - General
Global Evolution Funds ("the Fund") was established in the Grand Duchy of Luxembourg on December 3, 2010 in accordance with Part 1 of the Law of December 17, 2010. The Fund is organized as a variable capital company, Société d´investissement à capital variable (SICAV), under the Law of August 10, 1915 relating to commercial companies. The Fund has been established for an indefinite period.
The Fund comprises several sub-funds, each relating to a separate investment portfolio of securities, cash and other assets. Separate classes of shares are issued in relation to the sub-funds.
The Board of Directors of the Fund may authorise the creation of additional sub-funds/share classes in the future.
The Board of Directors of the SICAV has appointed Global Evolution Manco as management company of the Fund within the meaning of chapter 15 of the 2010 Law. Global Evolution Manco was incorporated on August 16, 2016 as a corporation (société anonyme) under the laws of Luxembourg for an unlimited duration. It has its registered office at 15, rue d’Epernay, 2nd Floor, L-1490 Luxembourg.
During the year from January 1, 2020 to December 31, 2020, the following events occurred:
• With the effective date from January 02, 2020 Mr. Søren Rump has resigned from the function of a Board Member of Global Evolution Funds.
• With the effective date from January 02, 2020 Mr. Torben Schytt, COO of Global Evolution Fondsmæglerselskab A/S has been co-opted as a new Director as a replacement of Mr. Søren Rump until the next general meeting of the shareholders of the Fund.
• On January 17, 2020, the Reference Currency for Frontier Markets changed from EUR to USD.
• In February 2020, the official address of the Management Company changed from: 6B, route de Trèves, L - 2633 Senningerberg, Grand Duchy of Luxembourg to: 15, rue d’ Epernay, 2nd Floor, L-1490 Luxembourg, Grand Duchy of Luxembourg.
• On February 10, 2020 Emerging Markets Local Debt share class Z EUR went dormant.
• On April 29, 2020 Mr. Torben Schytt was appointed to serve as director of the Fund until the annual general meeting of the shareholders of the Fund to be held in 2024.
• On May 12, 2020, the “Soft-closure” of Sub Fund Global Evolution Funds – Frontier Markets was
terminated, the Sub‐Fund has been re‐opened for normal subscriptions and conversions activity.
• On December 11, 2020, EM Absolute Debt Y EUR share class (LU2058899738) was activated and launched
• On December 11, 2020, EM Blended Debt Y EUR share class (LU2058899811) was activated and launched
• On December 11, 2020, Emerging Markets Local Debt Y EUR share class (LU2058899902) was activated and launched
• On December 11, 2020, Frontier Markets Class I (DD) Shares (USD) (LU1209899282) was activated and launched

Global Evolution Funds - ANNUAL REPORT 2020
75
Note 2 - Significant accounting policies
The Fund keeps the books of each sub-fund in its respective currency and the financial statements were prepared in EUR and in accordance with the Luxembourg regulation relating to undertakings for collective investments.
2.1 Annual charges and expenses borne by the Fund
All costs and expenses relating to the organisation of the Fund, including government incorporation charges, professional fees and expenses in connection with the preparation of the Fund´s offering documents and the preparation of its basic corporate and contract documents is amortized by the Fund over a period of five (5) years from the Fund´s commencement of operation.
For any additional sub-funds created, expenses incurred in connection with the creation of such additional sub-funds shall exclusively be borne by the relevant sub-fund and shall be amortized over a maximum period of five (5) years as indicated in the relevant appendix to the prospectus.
The Fixed Administration fee covers most of the fees (see details in Note 6).
Other expenses, which are not covered by the Fixed Administration fee, are expensed when incurred.
2.2 Valuation of assets
The value of such assets is determined as follows:
a) The value of any cash on hand or in deposits, bills, demand notes and accounts receivables, prepaid ex-penses and dividends and interests matured but not yet received shall be valued at the par-value of the assets except however if it appears that such value is unlikely to be received. In such a case, subject to the approval of the Board of Directors, the value shall be determined by deducting a certain amount to reflect the recover-able value of these assets;
b) The value of assets which are listed or dealt in on any stock exchange is based on the last available price on the stock exchange which is normally the principal market for such assets;
c) The value of assets dealt in on any other regulated market is based on the last available price;
d) In the event that any assets are not listed or dealt in on any stock exchange or on any other regulated market, or if, with respect to assets listed or dealt in on any stock exchange, or other regulated market as aforementioned, the price as determined pursuant to sub-paragraph (b) or (c) is not representative of the fair market value of the relevant assets, the value of such assets is based on the reasonably foreseeable sales price determined prudently and in good faith, as determined by the Directors in accordance with recognized accounting and financial reporting principles, using latest dealing prices, valuations from reliable sources, as-set values and other relevant factors. The Directors estimate that these valuation methods most fairly present the amount which would be realizable had the investment been sold as of the date of the computation of the net asset value. The carrying value of these investments may differ positively or negatively from the values retained that would have been used had a ready market existed for these investments and the difference could be material;
e) The market value of forward foreign exchange or options contracts not traded on exchanges or on other regulated markets shall mean their net liquidating value determined, pursuant to the policies established by the Board of Directors, on a basis consistently applied for each different variety of contracts. The market value of futures or options contracts traded on exchanges or on other regulated markets shall be based upon the last available settlement prices of these contracts on exchanges and regulated markets on which the particular futures or options contracts are traded by the Fund. Provided that if a futures, forward foreign exchange or options contract could not be liquidated on the day with respect to which net assets are being determined, the basis for determining the liquidating value of such contract shall be such value as the Board of Directors may deem fair and reasonable. Interest rate swaps are valued at their market value established by reference to the applicable interest rate curve;
Global Evolution Funds - ANNUAL REPORT 2020
76
f) The value of money market instruments not listed or dealt in on any stock exchange or any other regulated market and with remaining maturity of less than twelve (12) calendar months and of more than ninety (90) calendar days is deemed to be the market value thereof, increased by any interest accrued thereon. Money market instruments with a remaining maturity of ninety (90) calendar days or less are valued by the amortized cost method, which approximates market value;
g) Units or shares of open-ended UCI are valued at their last determined and available net asset value or, if such price is not representative of the fair market value of such assets, then the price shall be determined by the Board of Directors on a fair and equitable basis. Units or shares of a closed-ended UCI are valued at their last available stock market value;
h) All other securities and other assets are valued at fair market value, as determined in good faith pursuant to procedures established by the Board of Directors of the Fund.
The value of all assets and liabilities not expressed in the reference currency of the sub-fund is converted into the reference currency of such sub-fund at the rate of exchange determined at the relevant valuation day in good faith by or under procedures established by the Board of Directors.
To the extent that the Board of Directors consider that it is in the best interests of the Fund, given the prevailing market conditions and the level of subscriptions or redemptions requested by shareholders in relation to the size of any sub-fund, an adjustment, as determined by the Board of Directors at their discretion, may be re-flected in the net asset value of the sub-fund for such sum as may represent the percentage estimate of costs and expenses which may be incurred by the relevant sub-fund under such conditions.
The Board of Directors and the management company may at their discretion permit any other method of valuation to be used if they consider that such method of valuation better reflects value generally or in particular markets or market conditions and is in accordance with good practice.
2.3 Net realised gain (loss) on sales of investments
The realized gains or losses on the sales of securities are calculated on the basis of the average cost of the securities sold.
2.4 Cost of investment securities
The cost of securities denominated in currencies other than the reference currency of the different sub-funds is converted at the exchange rate prevailing on the day of acquisition.
2.5 Dividend and Interest Income
Interest income is accrued on a daily basis over the life of the investment.
Dividends are shown net of withholding tax deducted at source and are recorded as income on the ex-dividend date.
2.6 Market premium and market discount
Amortization of the market premium and accretion of the market discount are accrued on a daily basis until the maturity date of the security.
Global Evolution Funds - ANNUAL REPORT 2020
77
Note 3 - Taxes
The Fund is not subject to any Luxembourg taxes on income or capital gains under existing legislation. The Fund is, however, subject to the "taxe d'abonnement", which is charged at the rate of 0.05% per annum, based on the net assets of the sub-fund at the end of each calendar quarter. Such tax is reduced to a rate of 0.01% per annum in respect of the assets attributable to such unit classes which are reserved to institutional investors as well as to certain sub-funds investing exclusively in money market instruments and the placing of deposits with credit institutions and sub-funds whose sole object is the collective investment in deposits with credit institutions. The tax is accrued daily and paid quarterly.
The classes/sub-funds may be exempt from this tax if they comply with the requirements of the 2010 law as: (i) the shares of the class/sub-fund must be reserved to institutional investors; (ii) the exclusive object of the class/sub-fund's portfolio must be the investment in money market instruments and/or deposits with credit institutions; (iii) the remaining average maturity of the class/sub-fund's portfolio must be less than 90 days and (iv) the class/sub-fund must benefit from the highest possible rating of a recognised rating agency. Also exempt from the tax are the value of assets represented by units/shares held in other UCIs provided that such units/shares have already been subject to this tax as provided for by article 174 of the 2010 law, as amended.
Note 4 - Changes in portfolio composition
Details of purchases and sales of investments are available, free of charge, from the registered office of the Fund.
Note 5 - Foreign exchange rates
As of December 31, 2020, positions denominated in foreign currencies were translated at the following ex-change rates (WM-Company/Fixing 17:00 CET):
Foreign exchange rates to EUR:
Currency Rate
Currency Rate
Currency Rate
Currency Rate
ARS 171.651
GHS 7.176
MZN 91.277
UAH 34.669 BRL 6.355
HUF 362.685
NGN 482.996
UGX 4,469.612
CLP 869.332
IDR 17,190.879
PEN 4.426
USD 1.224 COP 4185.153
KES 133.612
PLN 4.559
UYU 51.970
CRC 751.156
KGS 101.126
RON 4.867
UZS 12,819.035 CZK 26.262
KZT 515.286
RUB 90.499
ZAR 17.972
DEM 1.956
LKR 226.663
THB 36.658
ZMW 25.896 DOP 71.143 MXN 24.380 TRY 9.094 EGP 19.246 MYR 4.922 TZS 2,837.413
Foreign exchange rates to USD:
Currency Rate Currency Rate Currency Rate Currency Rate ARS 140.289 GHS 5.865 MZN 74.600 UYU 42.475 CRC 613.916 KES 109.200 NGN 394.750 UZS 10476.920 DOP 58.145 KGS 82.650 TZS 2319.001 ZMW 21.165 EGP 15.730 KZT 421.140 UAH 28.335
EUR 0.817 LKR 185.250 UGX 3652.987
Global Evolution Funds - ANNUAL REPORT 2020
78
Note 6 – Fixed Administration Fee
The Fund bears all ordinary expenses incurred in the operation of the Fund. Such expenses have been esti-mated in a fixed amount per annum (the “Fixed Administration fee”) for each Class.
The Fixed Administration fee provides greater certainty for Shareholders than actual expenses, as to the amount of ordinary expenses incurred by the Classes and thus a better view on the management results. The Fixed Administration fee is fixed in the sense that the Management Company will either (i) bear any excess of the actual ordinary operating expenses to the Fixed Administration fee or (ii) be entitled to retain any amount of Fixed Administration fee in excess of the actual ordinary operating expenses.
The following list is indicative but not exclusive of the types of services that the Fixed Administration fee covers:
• Expenses directly incurred by the Fund, including but not limited to: o Depositary fees and expenses; o Management company fee (including the Management Company's reasonable out-of-pocket
expenses); o Auditor's fees and expenses; o Directors' fees and expenses; o Hedging costs and fees (including any fees charged by the Management Company); o The Luxembourg annual subscription tax (taxe d'abonnement).
• A “Management Company fee” paid to the Management Company for administrative and related additional management services and certain expenses incurred in the day-to-day operation and administration of the Fund (excluding the investment management fees), including, but not limited to:
o Administrative agent, domiciliary agent, registrar and transfer agent and paying agent fees and expenses;
o Local paying agents' fees and expenses; o Legal fees and expenses; o Miscellaneous Fees.
Fixed Administration fee does not cover any cost or expense incurred by a Class in respect of the following costs, which will be borne and paid out of the assets of the Fund in addition to Fixed Administration fee:
o Investment management fee, o Distribution fee, o Performance fee, o Dilution levy, o Brokerage charges and non-custody related transactions, o Legal fees and expenses connected to civil suits or other extraordinary costs outside general legal
work.
For the sub-funds of Global Evolution Funds, the management company receives an annual minimum fee of EUR 45,000 per sub-fund. For the share classes of the sub-funds Global Evolution Funds, the management company receives remuneration in the amount of up to:
• 0.60% p.a. of the net asset value for the share classes R, R DD, R CL, R CL DD,E and Y;
• 0.50% p.a. of the net asset value for the share classes I and I DD;
• 0.25% of the net asset value for the share class Z.
Global Evolution Funds - ANNUAL REPORT 2020
79
Note 7 - Investment Management fee
For the sub-fund Conning Global High Dividend Equity, the investment manager receives remuneration in the amount of up to 0.40% p.a. of the net asset value of the share class I.
For the sub-funds Frontier Markets and EM Absolute Debt, the investment manager receives remuneration in the amount of up to 1.00% p.a. of the net asset value of the share classes I, I DD, R CL DD and R CL and up to 1.50% p.a. of the net asset value of the share classes R, R DD and E.
For the sub-fund EM Debt, the investment manager receives remuneration in the amount of up to 0.75% p.a. of the net asset value of the share classes I and I DD, up to 1.00% p.a. of the net asset value of the share classes R CL and R CL DD and up to 1.35% p.a. of the net asset value of the share classes R, R DD and E.
For the sub-fund EM Blended Debt, the investment manager receives remuneration in the amount of up to 0.85% p.a. of the net asset value of the share classes I and I DD, up to 1.00% p.a. of the net asset value of the share classes R CL and R CL DD and up to 1.35% p.a. of the net asset value of the share classes R, R DD and E.
For the sub-fund Emerging Frontier, the investment manager receives remuneration in the amount of up to 0.55% p.a. of the net asset value of the share class Z.
For the Z share class of the sub-fund Frontier Opportunities, the investment manager receives remuneration based on a tiered rate where the applied percentage rate is changed at different net asset levels. The investment manager charges a per annum tiered rate of:
• 0.80% for the first EUR 50,000,000
• 0.70% for amounts between EUR 50,000,000 and EUR 80,000,000
• 0.65% for amounts between EUR 80,000,000 and EUR 125,000,000
• 0.625% for amounts between EUR 125,000,000 and EUR 175,000,000
• and 0.60% for amounts over EUR 175,000,000
For the sub-fund Emerging Markets Local Debt the investment manager receives remuneration in the amount of up to 0.85% p.a. of the net asset value of the share classes I and I DD, up to 1.00% p.a. of the net asset value of the share classes R CL and R CL DD, up to 1.35% p.a. of the net asset value of the share classes R, R DD and E and up to 0.30% p.a. of the net asset value of the share classes Z.
The amount of this remuneration is calculated on each valuation date, and paid to the Investment Manager, on a monthly basis.
For the sub-fund Emerging Frontier the total combined investment management and performance fees within any fiscal period should not exceed 1.35%, and is thereby capped.
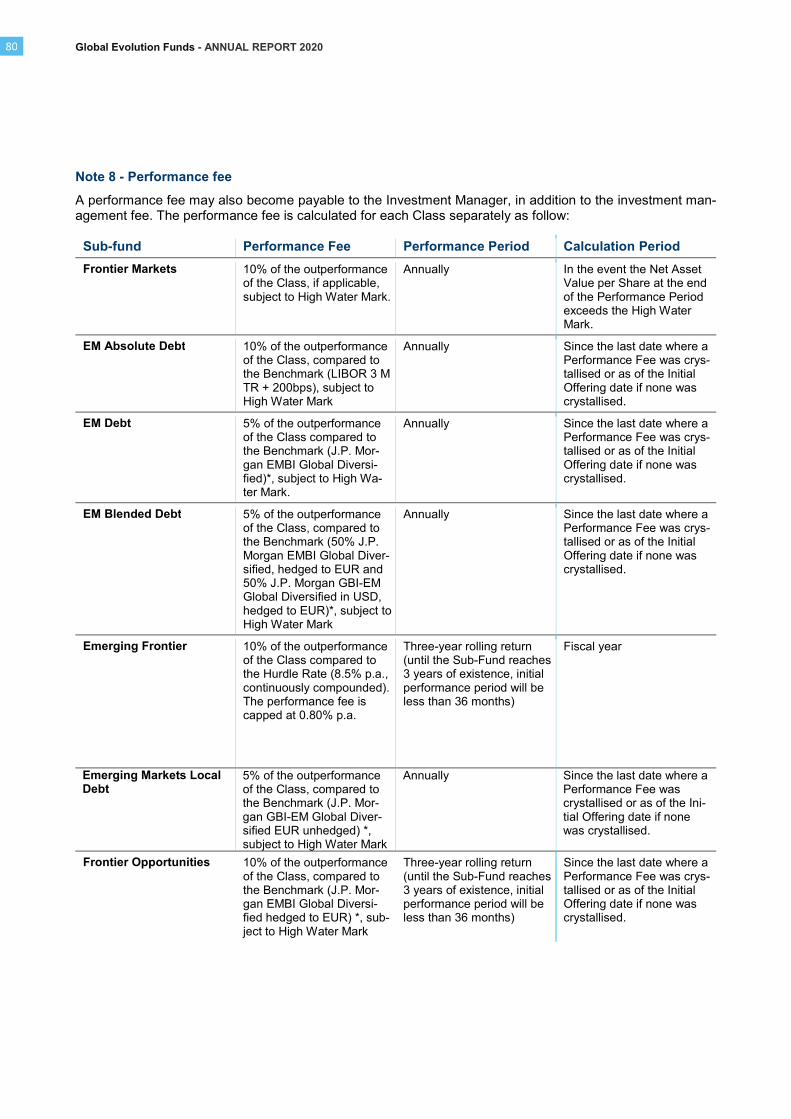
Global Evolution Funds - ANNUAL REPORT 2020
80
Note 8 - Performance fee
A performance fee may also become payable to the Investment Manager, in addition to the investment man-agement fee. The performance fee is calculated for each Class separately as follow:
Sub-fund Performance Fee Performance Period Calculation Period
Frontier Markets 10% of the outperformance of the Class, if applicable, subject to High Water Mark.
Annually In the event the Net Asset Value per Share at the end of the Performance Period exceeds the High Water Mark.
EM Absolute Debt 10% of the outperformance of the Class, compared to the Benchmark (LIBOR 3 M TR + 200bps), subject to High Water Mark
Annually Since the last date where a Performance Fee was crys-tallised or as of the Initial Offering date if none was crystallised.
EM Debt 5% of the outperformance of the Class compared to the Benchmark (J.P. Mor-gan EMBI Global Diversi-fied)*, subject to High Wa-ter Mark.
Annually Since the last date where a Performance Fee was crys-tallised or as of the Initial Offering date if none was crystallised.
EM Blended Debt 5% of the outperformance of the Class, compared to the Benchmark (50% J.P. Morgan EMBI Global Diver-sified, hedged to EUR and 50% J.P. Morgan GBI-EM Global Diversified in USD, hedged to EUR)*, subject to High Water Mark
Annually Since the last date where a Performance Fee was crys-tallised or as of the Initial Offering date if none was crystallised.
Emerging Frontier
10% of the outperformance of the Class compared to the Hurdle Rate (8.5% p.a., continuously compounded). The performance fee is capped at 0.80% p.a.
Three-year rolling return (until the Sub-Fund reaches 3 years of existence, initial performance period will be less than 36 months)
Fiscal year
Emerging Markets Local Debt
5% of the outperformance of the Class, compared to the Benchmark (J.P. Mor-gan GBI-EM Global Diver-sified EUR unhedged) *, subject to High Water Mark
Annually Since the last date where a Performance Fee was crystallised or as of the Ini-tial Offering date if none was crystallised.
Frontier Opportunities 10% of the outperformance of the Class, compared to the Benchmark (J.P. Mor-gan EMBI Global Diversi-fied hedged to EUR) *, sub-ject to High Water Mark
Three-year rolling return (until the Sub-Fund reaches 3 years of existence, initial performance period will be less than 36 months)
Since the last date where a Performance Fee was crys-tallised or as of the Initial Offering date if none was crystallised.

Global Evolution Funds - ANNUAL REPORT 2020
81
Sub-fund Performance Fee Performance Period Calculation Period
Conning Global High Divi-dend Equity
N/A N/A N/A
* Disclaimer for the benchmarks: Information has been obtained from sources believed to be reliable but J.P. Morgan does not warrant its completeness or accuracy. The Index is used with permission. The Index may not be copied, used, or distributed without J.P. Morgan’s prior written approval. Copyright 2021, J.P. Morgan Chase & Co. All rights reserved. Note 9 – Transaction costs
Transaction fees include broker costs and bank commissions. These are integrated into the cost of the invest-ments and are therefore not listed here.
Sub Fund Conning Global High Dividend Equity: The Transaction fees for the year from 01.01.2020 to 31.12.2020 were USD 10,122.62. Note 10 – Collateral
The cash accounts of the below mentioned sub-funds include the following collaterals:
List of collaterals posted by the Fund to the counterparties
Sub-fund Amount collateral Counterparty
Emerging Frontier USD (520,000.00) The Bank of New York Mellon
List of collaterals received by the Fund from the counterparties
Sub-fund Amount collateral Counterparty
EM Absolute Debt USD 480,000.00 The Bank of New York Mellon
EM Blended Debt USD 170,000.00 The Bank of New York Mellon
EM Debt USD 1,160,000.00 The Bank of New York Mellon
Emerging Frontier USD 140,000.00 ICBC Standard Bank Plc
Frontier Markets USD 11,040,000.00 The Bank of New York Mellon
Frontier Markets USD 470,000.00 ICBC Standard Bank Plc
Frontier Opportunities USD 250,000.00 ICBC Standard Bank Plc
Frontier Opportunities USD 12,780,000.00 The Bank of New York Mellon
Collaterals listed above are connected to the derivative positions of the sub-funds presented in the Notes 11 and 12.
Collaterals are recorded in the Statement of Net Assets under “Cash at banks”.

Global Evolution Funds - ANNUAL REPORT 2020
82
Note 11 – Foreign exchange contracts
The unrealised gains/(losses) on foreign exchange contracts are disclosed in the Statement of Net Assets under the headings “Unrealised gain/(loss) on foreign exchange contracts”.
Frontier Markets
Counterparty Amount purchased Amount sold Maturity date Unrealised gain/(loss) in USD
ICBC Standard Bank Plc
KZT 3,960,000,000.00 USD 9,000,000.00 16.02.2021 326,954.93
KZT 2,727,000,000.00 USD 6,000,000.00 22.07.2021 208,885.23
KZT 2,988,600,000.00 USD 6,800,000.00 25.03.2021 180,974.68
KZT 3,460,160,000.00 USD 8,000,000.00 19.01.2021 192,679.71
KZT 3,598,000,000.00 USD 8,000,000.00 18.06.2021 251,664.03
BYN 11,175,000.00 USD 5,000,000.00 22.01.2021 (715,716.82)
The Bank of New York Mellon
AUD 54,143,521.98 USD 40,598,253.07 15.01.2021 1,188,613.76
CHF 4,166,654.77 USD 4,695,939.39 15.01.2021 20,065.22
EUR 20,000,000.00 USD 23,825,060.00 22.01.2021 659,352.63
EUR 898,887.59 USD 1,102,673.91 15.01.2021 (2,429.03)
EUR 619,149,864.82 USD 750,491,443.66 15.01.2021 7,352,451.78
EUR 132,435.67 USD 162,902.50 05.01.2021 (840.66)
EUR 508,338.45 USD 622,282.51 04.01.2021 (243.05)
GBP 384,955,129.47 USD 513,170,250.09 15.01.2021 13,107,681.81
JPY 4,541,280,815.00 USD 43,518,951.51 15.01.2021 474,829.63
SEK 267,095.40 USD 32,583.84 15.01.2021 (54.71)
SEK 123,830,974.90 USD 14,638,761.15 15.01.2021 442,418.59
USD 117,592,500.00 EUR 100,000,000.00 22.01.2021 (4,829,563.13)
USD 9,085,504.10 EUR 7,467,246.97 15.01.2021 (54,459.98)
USD 1,297,671.29 EUR 1,058,907.76 15.01.2021 1,560.56
USD 369,859.20 EUR 300,686.31 05.01.2021 1,908.66
USD 8,884.66 EUR 7,257.82 04.01.2021 3.47
USD 62,322.78 SEK 521,199.37 15.01.2021 (1,153.28)
USD 9,101.52 SEK 74,500.00 05.01.2021 29.48
USD 23,476.21 SEK 192,595.40 04.01.2021 23.73
USD 1,198,860.00 AUD 1,560,000.00 05.01.2021 (4,987.62)
Unrealised Gain-Gross 24,410,097.90
Unrealised Loss-Gross (5,609,448.28)
Net Unrealised Gain 18,800,649.62
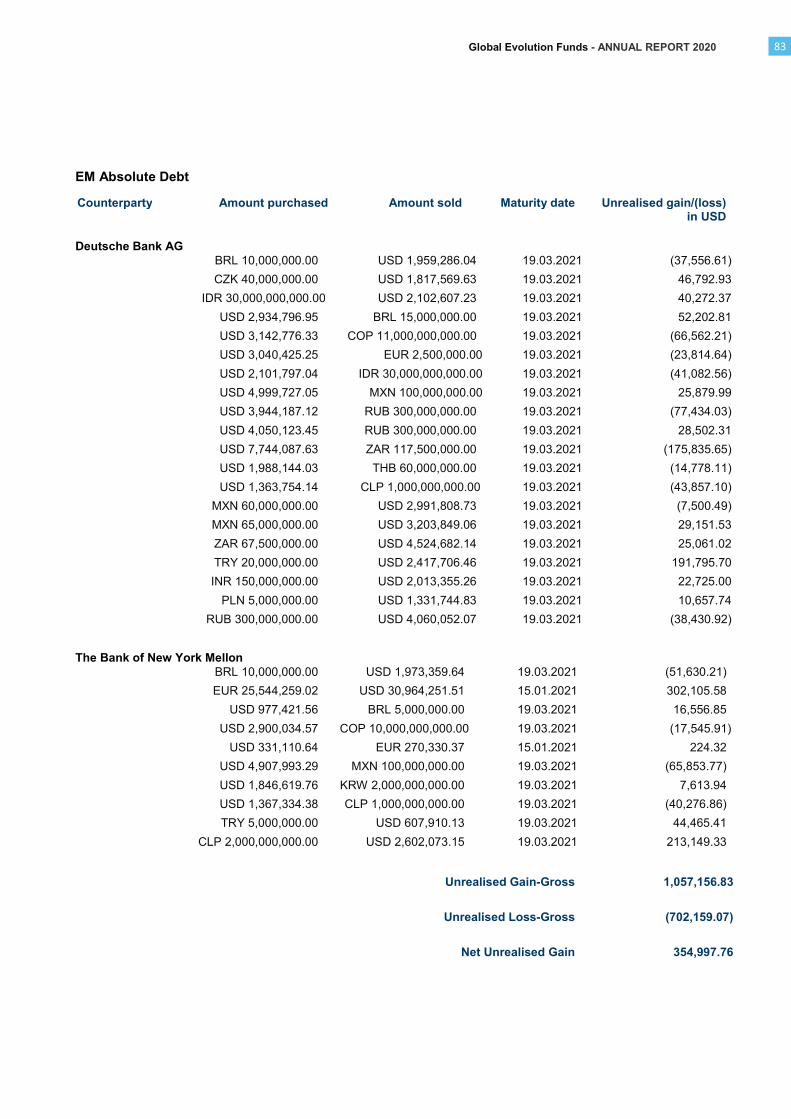
Global Evolution Funds - ANNUAL REPORT 2020
83
EM Absolute Debt
Counterparty Amount purchased Amount sold Maturity date Unrealised gain/(loss) in USD
Deutsche Bank AG
BRL 10,000,000.00 USD 1,959,286.04 19.03.2021 (37,556.61)
CZK 40,000,000.00 USD 1,817,569.63 19.03.2021 46,792.93
IDR 30,000,000,000.00 USD 2,102,607.23 19.03.2021 40,272.37
USD 2,934,796.95 BRL 15,000,000.00 19.03.2021 52,202.81
USD 3,142,776.33 COP 11,000,000,000.00 19.03.2021 (66,562.21)
USD 3,040,425.25 EUR 2,500,000.00.00 19.03.2021 (23,814.64)
USD 2,101,797.04 IDR 30,000,000,000.00.00 19.03.2021 (41,082.56)
USD 4,999,727.05 MXN 100,000,000.00.00 19.03.2021 25,879.99
USD 3,944,187.12 RUB 300,000,000.00 19.03.2021 (77,434.03)
USD 4,050,123.45 RUB 300,000,000.00 19.03.2021 28,502.31
USD 7,744,087.63 ZAR 117,500,000.00 19.03.2021 (175,835.65)
USD 1,988,144.03 THB 60,000,000.00 19.03.2021 (14,778.11)
USD 1,363,754.14 CLP 1,000,000,000.00 19.03.2021 (43,857.10)
MXN 60,000,000.00 USD 2,991,808.73 19.03.2021 (7,500.49)
MXN 65,000,000.00 USD 3,203,849.06 19.03.2021 29,151.53
ZAR 67,500,000.00 USD 4,524,682.14 19.03.2021 25,061.02
TRY 20,000,000.00 USD 2,417,706.46 19.03.2021 191,795.70
INR 150,000,000.00 USD 2,013,355.26 19.03.2021 22,725.00
PLN 5,000,000.00 USD 1,331,744.83 19.03.2021 10,657.74
RUB 300,000,000.00 USD 4,060,052.07 19.03.2021 (38,430.92)
The Bank of New York Mellon
BRL 10,000,000.00 USD 1,973,359.64 19.03.2021 (51,630.21)
EUR 25,544,259.02 USD 30,964,251.51 15.01.2021 302,105.58
USD 977,421.56 BRL 5,000,000.00 19.03.2021 16,556.85
USD 2,900,034.57 COP 10,000,000,000.00 19.03.2021 (17,545.91)
USD 331,110.64 EUR 270,330.37 15.01.2021 224.32
USD 4,907,993.29 MXN 100,000,000.00 19.03.2021 (65,853.77)
USD 1,846,619.76 KRW 2,000,000,000.00 19.03.2021 7,613.94
USD 1,367,334.38 CLP 1,000,000,000.00 19.03.2021 (40,276.86)
TRY 5,000,000.00 USD 607,910.13 19.03.2021 44,465.41
CLP 2,000,000,000.00 USD 2,602,073.15 19.03.2021 213,149.33
Unrealised Gain-Gross 1,057,156.83
Unrealised Loss-Gross (702,159.07)
Net Unrealised Gain 354,997.76

Global Evolution Funds - ANNUAL REPORT 2020
84
EM Debt
Counterparty Amount purchased Amount sold Maturity date Unrealised gain/(loss) in USD
The Bank of New York Mellon
CHF 503,807.68 USD 572,051.36 15.01.2021 (1,819.49)
CHF 45,800,910.49 USD 51,608,028.56 15.01.2021 231,472.57
EUR 1,403,750.28 USD 1,724,553.54 15.01.2021 (6,353.08)
EUR 126,439,884.45 USD 153,258,862.47 15.01.2021 1,504,467.08
USD 168,762.37 CHF 150,000.00 15.01.2021 (1,014.28)
USD 21,444,651.00 EUR 18,000,000.00 06.01.2021 (582,540.08)
USD 1,226,319.00 EUR 1,000,000.00 06.01.2021 2,586.16
Unrealised Gain-Gross 1,738,525.81
Unrealised Loss-Gross (591,726.93)
Net Unrealised Gain 1,146,798.88
EM Blended Debt
Counterparty Amount purchased Amount sold Maturity date Unrealised gain in EUR
The Bank of New York Mellon
EUR 6,000,000.00 USD 7,148,217.00 06.01.2021 158,678.45
Unrealised Gain-Gross 158,678.45
Net Unrealised Gain 158,678.45
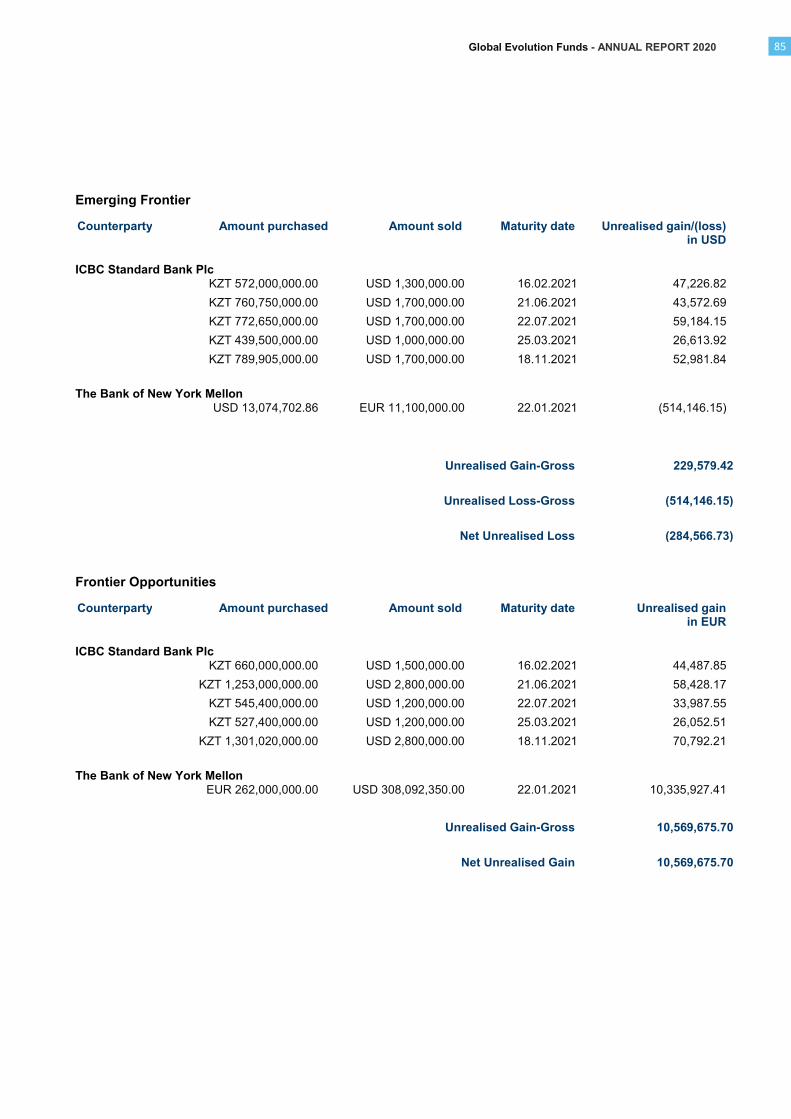
Global Evolution Funds - ANNUAL REPORT 2020
85
Emerging Frontier
Counterparty Amount purchased Amount sold Maturity date Unrealised gain/(loss) in USD
ICBC Standard Bank Plc
KZT 572,000,000.00 USD 1,300,000.00 16.02.2021 47,226.82
KZT 760,750,000.00 USD 1,700,000.00 21.06.2021 43,572.69
KZT 772,650,000.00 USD 1,700,000.00 22.07.2021 59,184.15
KZT 439,500,000.00 USD 1,000,000.00 25.03.2021 26,613.92
KZT 789,905,000.00 USD 1,700,000.00 18.11.2021 52,981.84
The Bank of New York Mellon
USD 13,074,702.86 EUR 11,100,000.00 22.01.2021 (514,146.15)
Unrealised Gain-Gross 229,579.42
Unrealised Loss-Gross (514,146.15)
Net Unrealised Loss (284,566.73)
Frontier Opportunities
Counterparty Amount purchased Amount sold Maturity date Unrealised gain in EUR
ICBC Standard Bank Plc
KZT 660,000,000.00 USD 1,500,000.00 16.02.2021 44,487.85
KZT 1,253,000,000.00 USD 2,800,000.00 21.06.2021 58,428.17
KZT 545,400,000.00 USD 1,200,000.00 22.07.2021 33,987.55
KZT 527,400,000.00 USD 1,200,000.00 25.03.2021 26,052.51
KZT 1,301,020,000.00 USD 2,800,000.00 18.11.2021 70,792.21
The Bank of New York Mellon
EUR 262,000,000.00 USD 308,092,350.00 22.01.2021 10,335,927.41
Unrealised Gain-Gross 10,569,675.70
Net Unrealised Gain 10,569,675.70
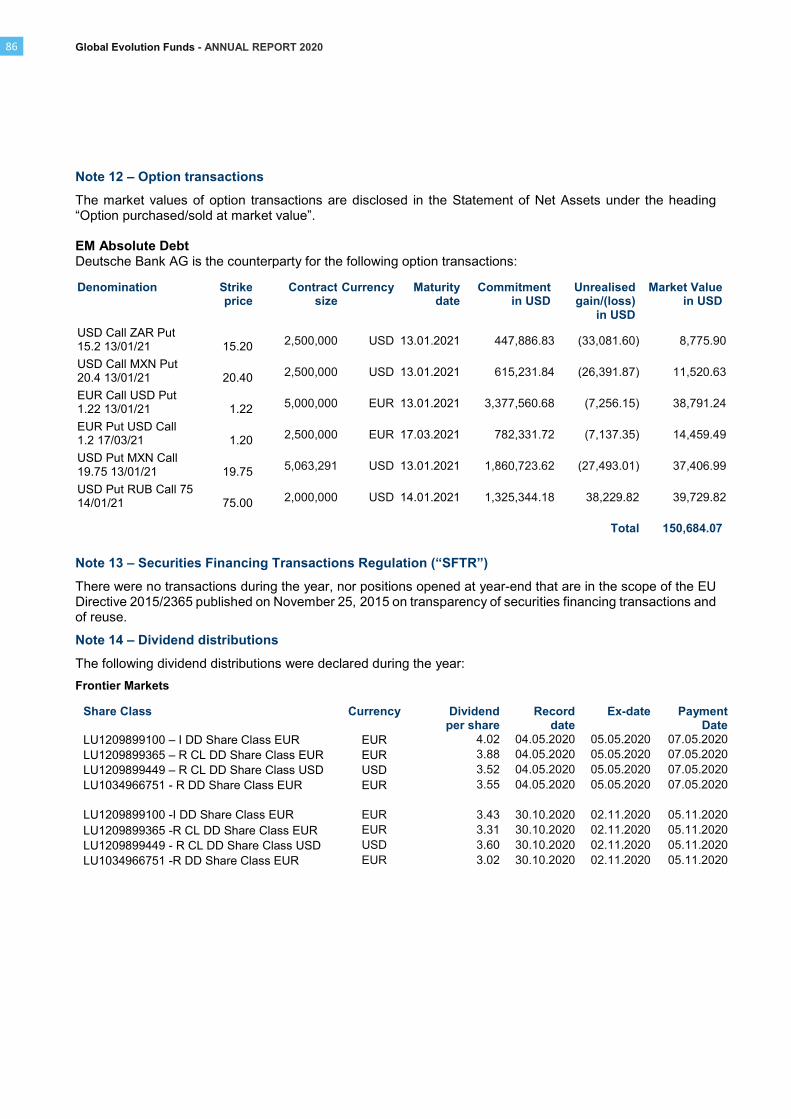
Global Evolution Funds - ANNUAL REPORT 2020
86
Note 12 – Option transactions
The market values of option transactions are disclosed in the Statement of Net Assets under the heading “Option purchased/sold at market value”. EM Absolute Debt Deutsche Bank AG is the counterparty for the following option transactions:
Denomination Strike price
Contract size
Currency Maturity date
Commitment in USD
Unrealised gain/(loss)
in USD
Market Value in USD
USD Call ZAR Put 15.2 13/01/21 15.20
2,500,000 USD 13.01.2021 447,886.83 (33,081.60) 8,775.90
USD Call MXN Put 20.4 13/01/21 20.40
2,500,000 USD 13.01.2021 615,231.84 (26,391.87) 11,520.63
EUR Call USD Put 1.22 13/01/21 1.22
5,000,000 EUR 13.01.2021 3,377,560.68 (7,256.15) 38,791.24
EUR Put USD Call 1.2 17/03/21 1.20
2,500,000 EUR 17.03.2021 782,331.72 (7,137.35) 14,459.49
USD Put MXN Call 19.75 13/01/21 19.75
5,063,291 USD 13.01.2021 1,860,723.62 (27,493.01) 37,406.99
USD Put RUB Call 75 14/01/21 75.00
2,000,000 USD 14.01.2021 1,325,344.18 38,229.82 39,729.82
Total 150,684.07
Note 13 – Securities Financing Transactions Regulation (“SFTR”)
There were no transactions during the year, nor positions opened at year-end that are in the scope of the EU Directive 2015/2365 published on November 25, 2015 on transparency of securities financing transactions and of reuse.
Note 14 – Dividend distributions
The following dividend distributions were declared during the year:
Frontier Markets
Share Class Currency Dividend per share
Record date
Ex-date Payment Date
LU1209899100 – I DD Share Class EUR EUR 4.02 04.05.2020 05.05.2020 07.05.2020
LU1209899365 – R CL DD Share Class EUR EUR 3.88 04.05.2020 05.05.2020 07.05.2020
LU1209899449 – R CL DD Share Class USD USD 3.52 04.05.2020 05.05.2020 07.05.2020
LU1034966751 - R DD Share Class EUR EUR 3.55 04.05.2020 05.05.2020 07.05.2020
LU1209899100 -I DD Share Class EUR EUR 3.43 30.10.2020 02.11.2020 05.11.2020
LU1209899365 -R CL DD Share Class EUR EUR 3.31 30.10.2020 02.11.2020 05.11.2020
LU1209899449 - R CL DD Share Class USD USD 3.60 30.10.2020 02.11.2020 05.11.2020
LU1034966751 -R DD Share Class EUR EUR 3.02 30.10.2020 02.11.2020 05.11.2020
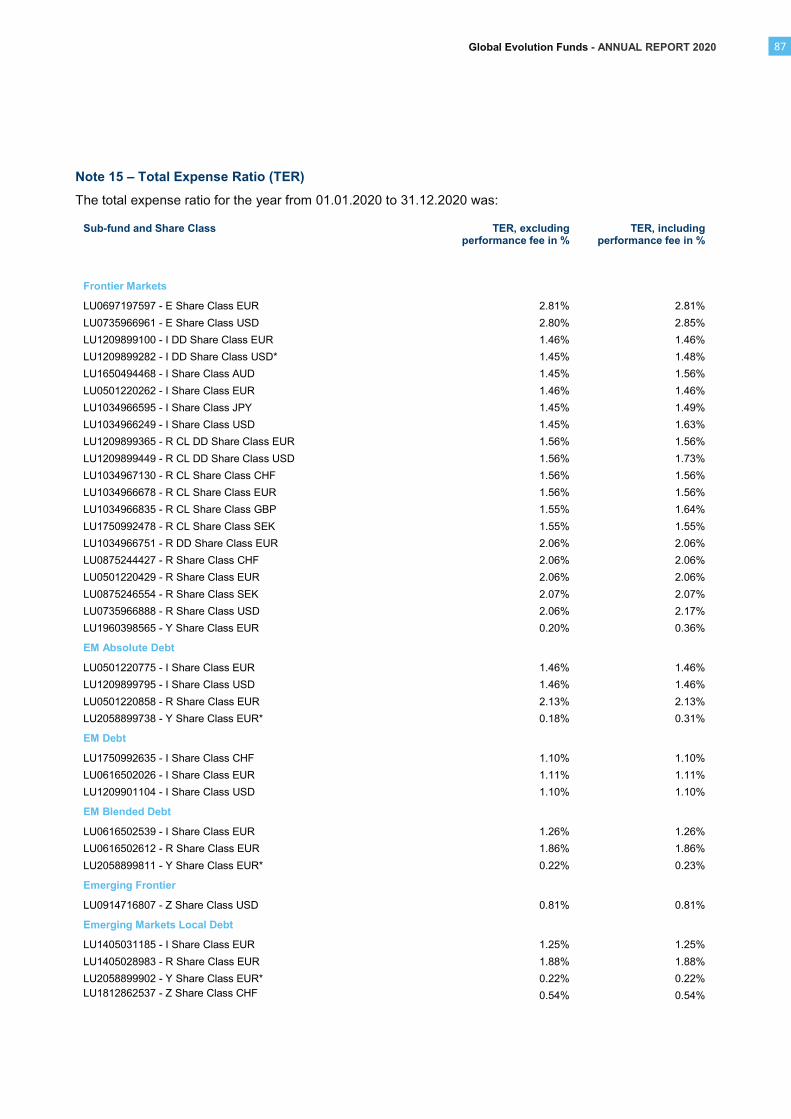
Global Evolution Funds - ANNUAL REPORT 2020
87
Note 15 – Total Expense Ratio (TER)
The total expense ratio for the year from 01.01.2020 to 31.12.2020 was:
Sub-fund and Share Class TER, excludingperformance fee in %
TER, includingperformance fee in %
Frontier Markets
LU0697197597 - E Share Class EUR 2.81% 2.81%
LU0735966961 - E Share Class USD 2.80% 2.85%
LU1209899100 - I DD Share Class EUR 1.46% 1.46%
LU1209899282 - I DD Share Class USD* 1.45% 1.48%
LU1650494468 - I Share Class AUD 1.45% 1.56%
LU0501220262 - I Share Class EUR 1.46% 1.46%
LU1034966595 - I Share Class JPY 1.45% 1.49%
LU1034966249 - I Share Class USD 1.45% 1.63%
LU1209899365 - R CL DD Share Class EUR 1.56% 1.56%
LU1209899449 - R CL DD Share Class USD 1.56% 1.73%
LU1034967130 - R CL Share Class CHF 1.56% 1.56%
LU1034966678 - R CL Share Class EUR 1.56% 1.56%
LU1034966835 - R CL Share Class GBP 1.55% 1.64%
LU1750992478 - R CL Share Class SEK 1.55% 1.55%
LU1034966751 - R DD Share Class EUR 2.06% 2.06%
LU0875244427 - R Share Class CHF 2.06% 2.06%
LU0501220429 - R Share Class EUR 2.06% 2.06%
LU0875246554 - R Share Class SEK 2.07% 2.07%
LU0735966888 - R Share Class USD 2.06% 2.17%
LU1960398565 - Y Share Class EUR 0.20% 0.36%
EM Absolute Debt
LU0501220775 - I Share Class EUR 1.46% 1.46%
LU1209899795 - I Share Class USD 1.46% 1.46%
LU0501220858 - R Share Class EUR 2.13% 2.13%
LU2058899738 - Y Share Class EUR* 0.18% 0.31%
EM Debt
LU1750992635 - I Share Class CHF 1.10% 1.10%
LU0616502026 - I Share Class EUR 1.11% 1.11%
LU1209901104 - I Share Class USD 1.10% 1.10%
EM Blended Debt
LU0616502539 - I Share Class EUR 1.26% 1.26%
LU0616502612 - R Share Class EUR 1.86% 1.86%
LU2058899811 - Y Share Class EUR* 0.22% 0.23%
Emerging Frontier
LU0914716807 - Z Share Class USD 0.81% 0.81%
Emerging Markets Local Debt
LU1405031185 - I Share Class EUR 1.25% 1.25%
LU1405028983 - R Share Class EUR 1.88% 1.88%
LU2058899902 - Y Share Class EUR* 0.22% 0.22%
LU1812862537 - Z Share Class CHF
0.54% 0.54%

Global Evolution Funds - ANNUAL REPORT 2020
88
Sub-fund and Share Class TER, excludingperformance fee in %
TER, includingperformance fee in %
Frontier Opportunities
LU1405032076 - Z Share Class EUR 0.91% 0.91%
Conning Global High Dividend Equity
LU2073870458 - I Share Class USD 0.75% 0.75%
* It is brought to the attention of the investors that the TER of the share classes for the reporting year is an annualized number based on actual expenses from a period shorter than a year. As the TER for the year is an annualized number, it only reflects an estimation of the Expense.

Global Evolution Funds - ANNUAL REPORT 2020
* Performance is shown on a total return basis including the reinvestment factor. ** The performance shown is less than the reporting year. *** Share Class inactive since February 10, 2020. Performance presented until February 10, 2020.
89
Note 16 – Performance
As of December 31, 2020, the net asset value and the share price performance of the active share classes during the reporting year were as follows:
Sub-fund and Share Class 31.12.2020in %
31.12.2019in %
31.12.2018in %
Frontier Markets
LU0697197597 - E Share Class EUR -1.00 5.76 -7.29
LU0735966961 - E Share Class USD 0.38 8.61 -4.92
LU1209899100 - I DD Share Class EUR* 0.31 7.20 -6.05
LU1209899282 - I DD Share Class USD 0.32** - -
LU1650494468 - I Share Class AUD 0.85 8.90 -3.76
LU0501220262 - I Share Class EUR 0.34 7.20 -6.05
LU1034966595 - I Share Class JPY 0.58 7.29 -6.0
LU1034966249 - I Share Class USD 1.63 9.83 -3.65
LU1209899365 - R CL DD Share Class EUR* 0.22 7.10 -6.13
LU1209899449 - R CL DD Share Class USD* 1.51 9.35 -3.70
LU1034967130 - R CL Share Class CHF -0.11 6.57 -6.59
LU1034966678 - R CL Share Class EUR 0.17 7.09 -6.14
LU1034966835 - R CL Share Class GBP 0.74 8.18 -5.22
LU1750992478 - R CL Share Class SEK 0.35 7.20 -7.08**
LU1034966751 - R DD Share Class EUR* -0.30 6.55 -6.60
LU0875244427 - R Share Class CHF -0.60 6.04 -7.03
LU0501220429 - R Share Class EUR -0.27 6.56 -6.60
LU0875246554 - R Share Class SEK -0.15 6.66 -6.68
LU0735966888 - R Share Class USD 0.96 9.25 -4.16
LU1960398565 - Y Share Class EUR 1.59 2.08** -
EM Absolute Debt
LU0501220775 - I Share Class EUR 4.65 -3.52 -9.41
LU1209899795 - I Share Class USD 6.12 -0.56 -5.87**
LU0501220858 - R Share Class EUR 3.95 -4.09 -10.02
LU2058899738 - Y Share Class EUR
1.23** - -
EM Debt
LU1750992635 - I Share Class CHF 4.36 9.55 -6.38**
LU0616502026 - I Share Class EUR 4.56 9.99 -8.23
LU1209901104 - I Share Class USD 6.32 13.38 -5.56
EM Blended Debt
LU0616502539 - I Share Class EUR 1.85 9.14 -10.54
LU0616502612 - R Share Class EUR 1.23 8.49 -11.08
LU2058899811 - Y Share Class EUR 1.00** - -
Emerging Frontier
LU0914716807 - Z Share Class USD 3.40 10.29 -1.32
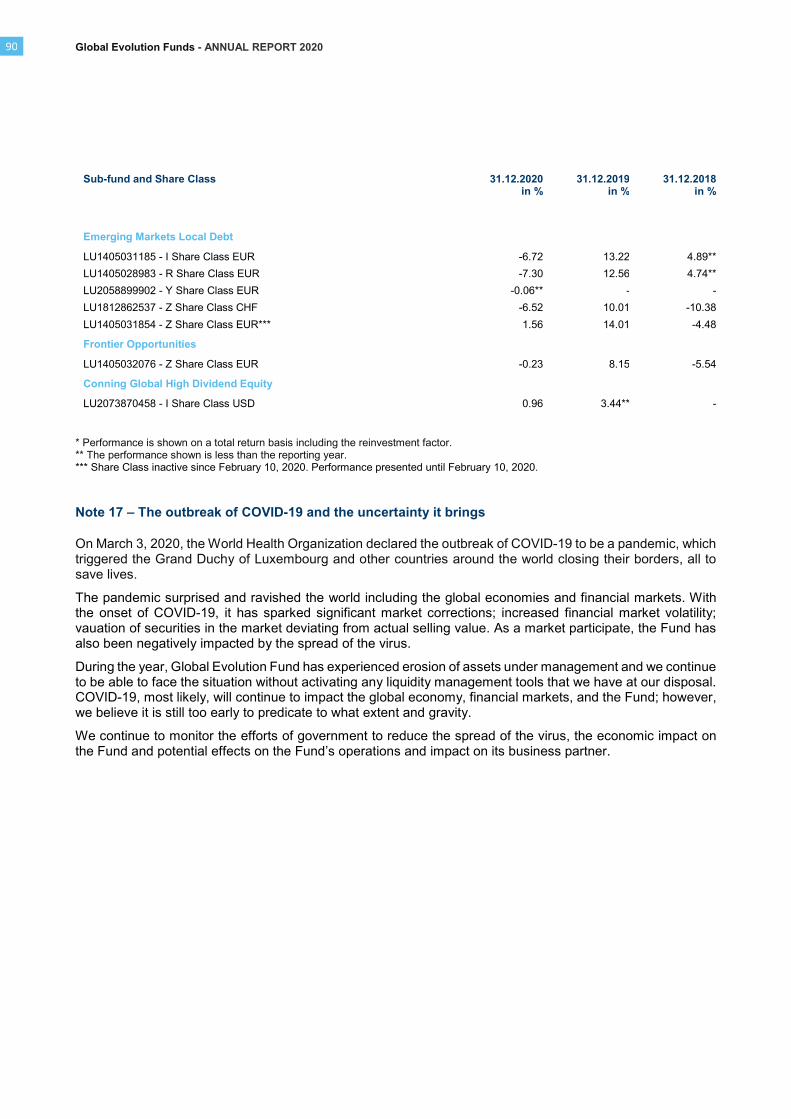
Global Evolution Funds - ANNUAL REPORT 2020
90
Sub-fund and Share Class 31.12.2020in %
31.12.2019in %
31.12.2018in %
Emerging Markets Local Debt
LU1405031185 - I Share Class EUR -6.72 13.22 4.89**
LU1405028983 - R Share Class EUR -7.30 12.56 4.74**
LU2058899902 - Y Share Class EUR -0.06** - -
LU1812862537 - Z Share Class CHF -6.52 10.01 -10.38
LU1405031854 - Z Share Class EUR*** 1.56 14.01 -4.48
Frontier Opportunities
LU1405032076 - Z Share Class EUR -0.23 8.15 -5.54
Conning Global High Dividend Equity
LU2073870458 - I Share Class USD 0.96 3.44** -
* Performance is shown on a total return basis including the reinvestment factor. ** The performance shown is less than the reporting year. *** Share Class inactive since February 10, 2020. Performance presented until February 10, 2020.
Note 17 – The outbreak of COVID-19 and the uncertainty it brings
On March 3, 2020, the World Health Organization declared the outbreak of COVID-19 to be a pandemic, which triggered the Grand Duchy of Luxembourg and other countries around the world closing their borders, all to save lives.
The pandemic surprised and ravished the world including the global economies and financial markets. With the onset of COVID-19, it has sparked significant market corrections; increased financial market volatility; vauation of securities in the market deviating from actual selling value. As a market participate, the Fund has also been negatively impacted by the spread of the virus.
During the year, Global Evolution Fund has experienced erosion of assets under management and we continue to be able to face the situation without activating any liquidity management tools that we have at our disposal. COVID-19, most likely, will continue to impact the global economy, financial markets, and the Fund; however, we believe it is still too early to predicate to what extent and gravity.
We continue to monitor the efforts of government to reduce the spread of the virus, the economic impact on the Fund and potential effects on the Fund’s operations and impact on its business partner.

Global Evolution Funds - ANNUAL REPORT 2020
Unaudited Appendix
91
Additional Information in relation to the Schedule of Investments and Other Net Assets
The Schedule of Investment and Other Assets section of the annual report includes the ISIN code of securities, whenever that information was available. In some cases, access to specific security information via the public or paid financial data providers systems can be limited or restricted by the proprietor of these systems.
Global Remuneration Policy
The Management Company has adopted a Remuneration Policy, which is in accordance with the principles established by the law of May 10, 2016, amending the law of December 17, 2010 (“the UCITS Law”).
During the financial year 2020, the UCITS paid the Management Company a total fee of EUR 12,177,111 and the Investment Managers a total fee of EUR 28,502,352 (including performance fees).
Remuneration for the financial year 2020 (in thousands EUR)
Global Evolution Manco
Management Company
Number of total Staff
Fixed remuneration
Variable remuneration
Total remuneration
All staff 8 766.0 - 766.0
Global Evolution Fondsmæglerselskab
Investment Manager
Number of Risktakers
Fixed remuneration
Variable remuneration
Total remuneration
Identified Staff 17 1,064.3 551.8 1,616.1
Conning Inc.
Investment Manager
Number of Risktakers
Fixed remuneration
Variable remuneration
Total remuneration
Identified Staff 1 0.4 0.5 0.9
The provided figures are based on the audited financial situation as of December 31, 2020.
Fixed remuneration is composed of base salary and any other fixed allowances paid during the exercise and it is exclusive of social charges. Variable remuneration is the portion of compensation that is determined or linked to either the performance of the employee, company or other factors and conditions. Variable Remuneration, if any, would be paid in 2021 on the basis of the individual’s performance for the year 2020.
Global Evolution Funds - ANNUAL REPORT 2020
92
The investment manager’s identified Staff are Employees (including Senior Management) conducting activities that may have material impact on the UCIT’s risk profile. The disclosure of the renumeration of the investment manager’s is done on a prorated basis, remumeration presented is proportional to the part of the total assets which are managed by the delegates.
In the case of the management company, the total remuneration for the company, which includes all employees and independent conducting officer, has been presented in the table. This approach has been taken in respect of GDPR and other personal information regulation; it is due to the fact that there were only three risk taker at the Management Company for the financial year 2020.
An independent audit of the implementation of the remuneration policy for the financial years 2016, 2017, 2018 and 2019 were conducted. No significant issues were found.
All changes to the remuneration policy in 2020 are limited to regulatory updates.
More information on the determination of the variable remuneration is set out in the Management Company’s remuneration policy, which is available at the company’s office.
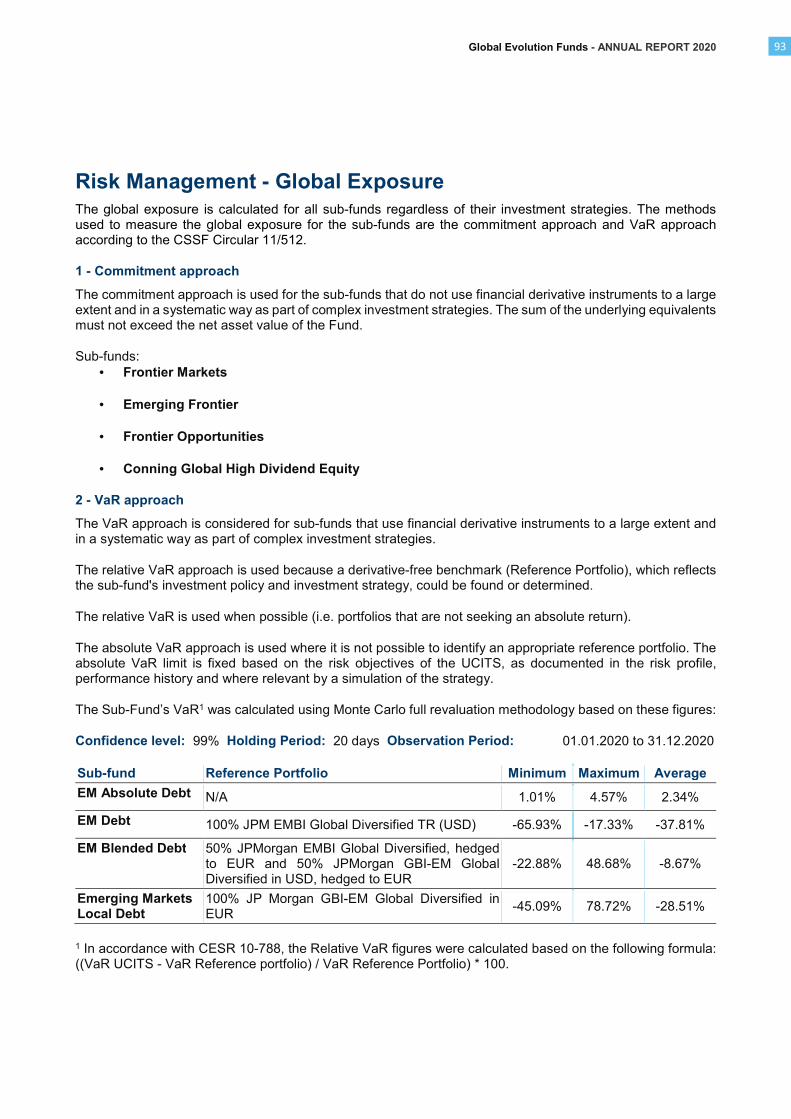
Global Evolution Funds - ANNUAL REPORT 2020
93
Risk Management - Global Exposure
The global exposure is calculated for all sub-funds regardless of their investment strategies. The methods used to measure the global exposure for the sub-funds are the commitment approach and VaR approach according to the CSSF Circular 11/512.
1 - Commitment approach
The commitment approach is used for the sub-funds that do not use financial derivative instruments to a large extent and in a systematic way as part of complex investment strategies. The sum of the underlying equivalents must not exceed the net asset value of the Fund.
Sub-funds:
• Frontier Markets
• Emerging Frontier
• Frontier Opportunities
• Conning Global High Dividend Equity
2 - VaR approach
The VaR approach is considered for sub-funds that use financial derivative instruments to a large extent and in a systematic way as part of complex investment strategies.
The relative VaR approach is used because a derivative-free benchmark (Reference Portfolio), which reflects the sub-fund's investment policy and investment strategy, could be found or determined.
The relative VaR is used when possible (i.e. portfolios that are not seeking an absolute return).
The absolute VaR approach is used where it is not possible to identify an appropriate reference portfolio. The absolute VaR limit is fixed based on the risk objectives of the UCITS, as documented in the risk profile, performance history and where relevant by a simulation of the strategy.
The Sub-Fund’s VaR1 was calculated using Monte Carlo full revaluation methodology based on these figures:
Confidence level: 99% Holding Period: 20 days Observation Period: 01.01.2020 to 31.12.2020
Sub-fund Reference Portfolio Minimum Maximum Average
EM Absolute Debt N/A 1.01% 4.57% 2.34%
EM Debt 100% JPM EMBI Global Diversified TR (USD) -65.93% -17.33% -37.81%
EM Blended Debt 50% JPMorgan EMBI Global Diversified, hedged to EUR and 50% JPMorgan GBI-EM Global Diversified in USD, hedged to EUR
-22.88% 48.68% -8.67%
Emerging Markets Local Debt
100% JP Morgan GBI-EM Global Diversified in EUR
-45.09% 78.72% -28.51%
1 In accordance with CESR 10-788, the Relative VaR figures were calculated based on the following formula: ((VaR UCITS - VaR Reference portfolio) / VaR Reference Portfolio) * 100.

Global Evolution Funds - ANNUAL REPORT 2020
94
Risk Management - Leverage
Derivatives
According to point 40a) of the “Guidelines for competent authorities and UCITS management companies - Guidelines on ETFs and other UCITS issues” issued by the European Securities and Markets Authority, the derivatives exposure as per financial period end for each sub-fund is shown in the table below. The calculation is based on the derivatives sum of notional of each sub funds.
Average Leverage
For sub funds using the VaR approach the average leverage calculation is based on the average sum of no-tional for the past reporting period. For sub funds using the commitment approach the average leverage calculation is based on the average commitment for the past reporting period.*
Derivatives Exposure and Average level of Leverage
The derivative exposure (as per reporting period end) is shown in the following tables:
Sub-fund Derivative** Exposure in % (commitment)
Derivative** Exposure in %
(sum of notional)
EM Absolute Debt 163.66%
EM Debt 7.86%
EM Blended Debt 86.84%
Emerging Markets Local Debt 0.00%
Frontier Markets 1.87%
Emerging Frontier 2.06%
Frontier Opportunities 52.10%
Conning Global High Dividend Equity 0.00%
From January 1, 2020 to December 31, 2020:
Sub-fund Average level of Leverage (commitment) in %
Average level of Leverage (sum of notional) in %
EM Absolute Debt 211.73% EM Debt 9.71% EM Blended Debt 128.84% Emerging Markets Local Debt 5.07% Frontier Markets 5.89% Emerging Frontier 1.30% Frontier Opportunities 55.22% Conning Global High Dividend Equity 0.00%
* Global Evolution Funds’ sub-funds leverage according is mainly driven by the use FX forwards, CDS, FX Options and Bond Future transactions. Please note the sub-funds may use other derivative contracts according to the investment policy. ** Reference is made to CESR Guideline 10-788.

Global Evolution Funds Société d’Investissement à Capital Variable
Vertigo Building - Polaris, 2 - 4, rue Eugène Ruppert, L - 2453 Luxembourg, Grand Duchy of Luxembourg R.C.S. Luxembourg B 157.442