audit results report - annual 2018 financial audits
TRANSCRIPT

Report 19: May 2019
Western Australian Auditor General’s Report
Audit Results Report - Annual 2018
Financial Audits

Office of the Auditor General Western Australia 7th Floor Albert Facey House 469 Wellington Street, Perth Mail to: Perth BC, PO Box 8489 PERTH WA 6849 T: 08 6557 7500 F: 08 6557 7600 E: [email protected] W: www.audit.wa.gov.au National Relay Service TTY: 13 36 77 (to assist people with hearing and voice impairment) We can deliver this report in an alternative format for those with visual impairment. © 2019 Office of the Auditor General Western Australia. All rights reserved. This material may be reproduced in whole or in part provided the source is acknowledged. ISSN: 2200-1913 (Print) ISSN: 2200-1921 (Online)
WESTERN AUSTRALIAN AUDITOR GENERAL’S REPORT
Audit Results Report - Annual 2018 Financial Audits
Report 19 May 2019
THE PRESIDENT THE SPEAKER LEGISLATIVE COUNCIL LEGISLATIVE ASSEMBLY AUDIT RESULTS REPORT – ANNUAL 2018 FINANCIAL AUDITS
This report has been prepared under the provisions of section 24 of the Auditor General Act 2006 and covers financial audits completed since 1 November 2018 including:
• opinions and results of audits on controls, financial statements and key performance indicators of the 4 universities and 5 TAFEs for the year ended 31 December 2018
• opinions and results of audits of university subsidiaries and request audits
• key financial indicators commonly used to analyse financial health, and graduate survey results for the tertiary education sector
• other audit opinions issued, including statutory authorities, local government entities and cemetery boards
• audit certifications of financial and statistical information produced by entities to discharge conditions of Commonwealth funding, grants and other legislation and Royalties for Regions program agreements.
I wish to acknowledge the assistance provided by the senates, governing councils, vice chancellors, managing directors, chief executive officers, chief finance officers and others during the conduct of the annual financial audit program and in finalising this report.
CAROLINE SPENCER AUDITOR GENERAL 15 May 2019
Audit Results Report - Annual 2018 Financial Audits | 3
Contents Auditor General’s overview ......................................................................................... 5
Executive summary .................................................................................................... 6
Key findings.................................................................................................................. 6
Recommendation ......................................................................................................... 7
Audit opinions for universities, TAFEs and others ...................................................... 8
Clear opinions were issued for all universities and TAFEs............................................ 8
Seven other audit opinions were issued ....................................................................... 9
Fifty-seven audit certifications were issued .................................................................. 9
Management and reporting issues at universities and TAFEs .................................. 10
Financial control and reporting issues .........................................................................10
Information system control issues ...............................................................................11
Universities’ and TAFEs’ management of leave liabilities ............................................12
TAFEs’ new student management system ..................................................................13
Best practice entities for financial reporting and controls .............................................13
Universities’ financial performance in 2018 .............................................................. 14
Universities’ first time adjustment for new standard .....................................................14
Selected significant financial transactions ...................................................................14
Key financial ratios of universities ................................................................................15
Equivalent Full Time Student Load for universities ......................................................18
Universities’ graduate survey information ................................................................. 19
Graduate satisfaction of undergraduate students ........................................................19
Graduate destination of domestic undergraduate students ..........................................19
TAFEs’ financial and other performance in 2018 ...................................................... 20
New streamlined format for TAFE financial statements ...............................................20
Selected significant financial transactions ...................................................................20
TAFE financial results and liquidity ..............................................................................21
TAFE student enrolments ............................................................................................21
Cost per Student Curriculum Hour ...............................................................................22
TAFE student and graduate survey information ....................................................... 23
TAFE student satisfaction............................................................................................23
4 | Western Australian Auditor General
TAFE graduate achievement and destination ratings ..................................................23
Appendix 1: Other audit opinions issued since 1 November 2018 ............................ 25
Appendix 2: Certifications issued since 1 November 2018, including Royalties for Regions .................................................................................................................... 26
Appendix 3: Universities’ and TAFEs’ expenditure and sources of revenue ............. 29
Glossary ................................................................................................................... 31

Audit Results Report - Annual 2018 Financial Audits | 5
Auditor General’s overview This report summarises the results of the annual audits of the 4 public universities, their subsidiaries and the 5 TAFEs for the 31 December 2018 reporting year. The report also contains the results of a small number of other annual audits of statutory authorities, local government entities and cemetery boards.
We issued clear (unqualified) opinions for all the universities and TAFEs on their financial statements, controls and key performance indicators.
In 2018 for the first time, TAFEs used a new streamlined financial reporting format specified by the Department of Treasury. My office has advocated simplified reporting requirements for small to medium sized entities for several years, and I commend the TAFEs, Department of Training and Workforce Development and Department of Treasury for successfully implementing this reporting reform.
Our audit findings indicate that entities have generally improved financial and management control procedures in recent years, but information system and risk management controls are generally not improving. I recommend that executive management in each entity gives priority to monitoring information system security, continuity and functionality.
In 2018, universities applied Australian Accounting Standard AASB 9 Financial Instruments for the first time, resulting in several adjustments, mainly reclassification of certain investments. The adjustments are detailed in this report.
One university and one TAFE achieved our best practice status for good financial controls and reporting practices.
I wish to thank my staff and the staff in the audited entities who contributed to the audit process and outcomes.

6 | Western Australian Auditor General
Executive summary This report contains the findings primarily from the financial audits of universities and TAFEs for reporting periods ending on 31 December 2018, and other audits finalised since the date of our last results report1.
Western Australia’s public tertiary education sector comprises 4 universities and 5 TAFEs (2 metropolitan and 3 regional). The universities had combined assets of $6.5 billion while the TAFEs had assets valued at $1.2 billion at 31 December 2018. Total revenue of this sector in 2018 was $3.1 billion (universities $2.6 billion and TAFEs $501 million), including Commonwealth and State funding. Further details of the sector’s revenue and expenditure are included in Appendix 3.
To ensure the sector produces timely and accurate financial reports, it is important that university and TAFE management keep appropriate accounts and records. An effective internal control system is essential for accurate reporting, to alert management to irregularities in electronic environments and manual procedures, and to help prevent, detect and investigate errors and fraud.
The Auditor General Act 2006 (AG Act) requires the Auditor General to annually audit the financial statements, controls and key performance indicators (KPIs) of universities and TAFEs.
A clear (unqualified) audit opinion generally indicates that satisfactory financial controls are in place. It also indicates that financial statements are complete, accurate, comply with relevant legislation and applicable accounting standards; and fairly represent performance during the year and the financial position at year end.
Key findings • We issued clear audit opinions:
o on financial statements, controls and KPIs of the 4 public universities and the 5 TAFEs
o on the financial statements of 12 university subsidiaries and request audits
o for 5 other smaller entities
o for 2 local government entities
o for 57 certifications. (page 8 and Appendices 1 and 2)
• We issued a qualified opinion for the Shire of Laverton. (page 25)
Management issues • The financial management controls at universities and TAFEs were generally
appropriate for ensuring efficient and effective use of resources and governance. (page 10)
• There were 34 financial and management control weaknesses identified at universities and TAFEs, compared to 60 last year. Twenty-six per cent were unresolved from the previous year, compared to 28% last year. (page 10)
1 Audit Results Report – Annual 2017-18 Financial Audits of State Government Entities, Report 7, November 2018

Audit Results Report - Annual 2018 Financial Audits | 7
• We identified 90 information system control issues at the 4 universities and 5 TAFEs. Fifty-seven percent were unresolved issues from the previous year. Last year there were 114 issues and 33% were unresolved prior year issues. (page 11)
• Annual leave and long service leave liabilities of the universities decreased by 3% and by 0.2% for TAFEs in 2018, with a combined total of $312.5 million at year end. (page 12)
• The new Student Management System has been implemented at all of the TAFEs with successful data migration and generally sound controls. (page 13)
Financial reporting • The universities and TAFEs adopted the new accounting standard AASB 9 Financial
Instruments for the first time in 2018. This mainly impacted universities. It changed the classification and measurement of financial assets and required adjustments to be reported from 1 January 2018. (page 14)
• The TAFEs applied the reduced disclosure requirements for financial reporting by Tier 2 entities, in accordance with Australian Accounting Standard AASB 1053, for the first time this year. This followed a Department of Treasury decision to streamline financial reporting, which we have long supported. (page 20)
• One university and one TAFE met our best practice standard for their good financial controls and reporting practices in 2018. (page 13)
Financial and performance measures • The universities predominantly rated low to medium risk when measured against
financial indicators. The risk level decreased slightly in 2018. (page 15)
• We have summarised significant financial transactions of universities and TAFEs noted during our audits. Key financial ratios and information commonly used for assessing financial performance are also presented. (pages 15 and 21)
• The results of surveys of universities’ and TAFEs’ students and graduates are presented to show performance measures for each institution. (pages 19 and 23)
Recommendation Universities, TAFEs and other entities should address identified financial management, KPI and information systems control weaknesses in a timely manner to ensure the continuing integrity of their financial controls and external reporting.

8 | Western Australian Auditor General
Audit opinions for universities, TAFEs and others Management of the universities and TAFEs are responsible for keeping proper accounts and records to enable the timely and accurate preparation of financial reports.
An effective internal control system should operate to enable the preparation of financial statements that are free from material misstatement, whether due to fraud or error, and to alert management to irregularities in procedures. They also assist universities and TAFEs to prevent, detect and investigate errors and fraud.
The Auditor General is required to issue an audit opinion for each university and TAFE to the responsible Minister. The opinion relates to:
• financial statements – assurance that the financial statements and supporting notes are materially complete, accurate, reliable and comply with relevant legislation and applicable accounting standards
• controls – assurance that the internal financial control systems and procedures are materially adequate to ensure that financial transactions comply with legislative requirements
• key performance indicators (KPIs) – assurance that the KPIs are relevant, appropriate, based on reliable data and, in all material respects, fairly present the performance of the entity in achieving its desired outcomes.
These audit opinions relate to historical information reported in the financial statements and KPIs and are not predictive of future expectations.
Clear opinions were issued for all universities and TAFEs For the year ended 31 December 2018, we issued clear audit opinions on the financial statements, controls and KPIs of all universities, university subsidiaries and for the 5 TAFEs. University and TAFE audit opinions are included in their annual reports which are tabled in Parliament.
Some universities use subsidiary companies to conduct activities on their behalf. The audit opinions we issued for these subsidiaries relate to financial statements only as they are not required to submit KPIs. The financial results of the subsidiaries are included in the consolidated financial statements of their controlling university. Annual reports of subsidiaries are not required to be tabled in Parliament.
UNIVERSITIES Opinion on financial statements, controls and KPIs Opinion issued
Curtin University (Curtin) 22/03/2019
Edith Cowan University (ECU) 12/03/2019
Murdoch University (Murdoch) 15/03/2019
The University of Western Australia (UWA) 12/03/2019
TAFEs Opinion on financial statements, controls and KPIs Opinion issued
Central Regional TAFE 08/03/2019
North Metropolitan TAFE 06/03/2019
North Regional TAFE 05/03/2019
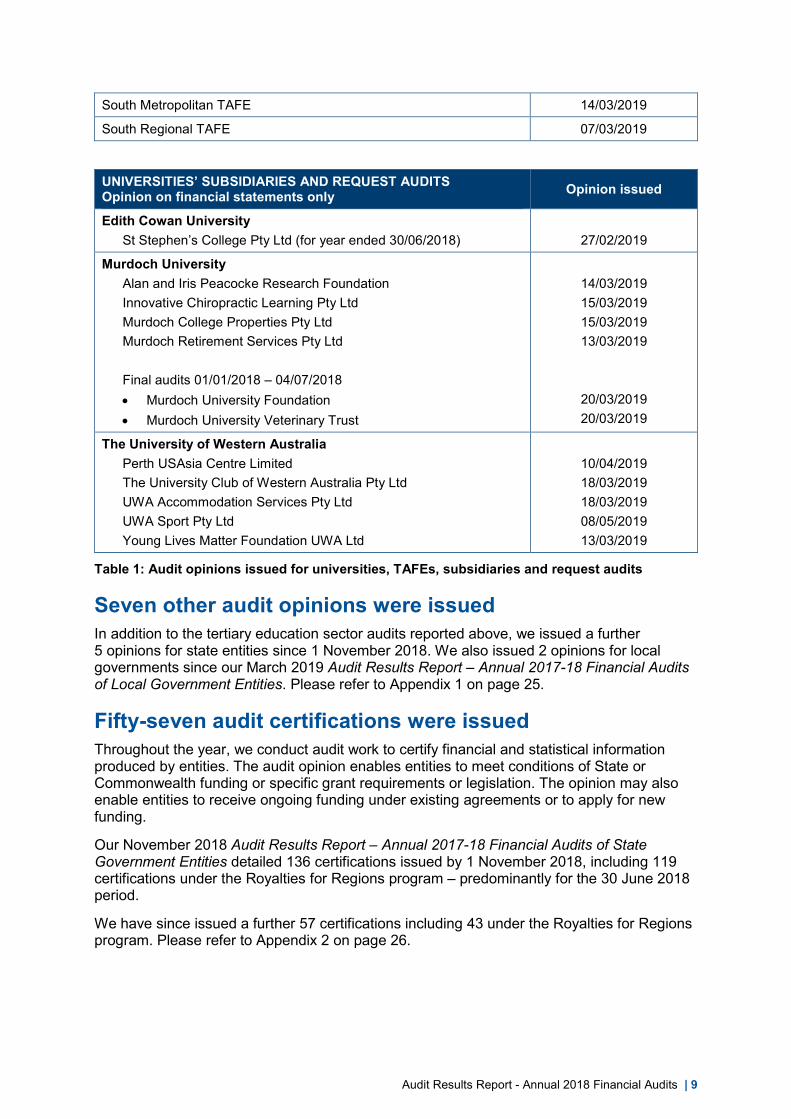
Audit Results Report - Annual 2018 Financial Audits | 9
South Metropolitan TAFE 14/03/2019
South Regional TAFE 07/03/2019
UNIVERSITIES’ SUBSIDIARIES AND REQUEST AUDITS Opinion on financial statements only Opinion issued
Edith Cowan University St Stephen’s College Pty Ltd (for year ended 30/06/2018)
27/02/2019
Murdoch University Alan and Iris Peacocke Research Foundation Innovative Chiropractic Learning Pty Ltd Murdoch College Properties Pty Ltd Murdoch Retirement Services Pty Ltd Final audits 01/01/2018 – 04/07/2018 • Murdoch University Foundation • Murdoch University Veterinary Trust
14/03/2019 15/03/2019 15/03/2019 13/03/2019
20/03/2019 20/03/2019
The University of Western Australia Perth USAsia Centre Limited The University Club of Western Australia Pty Ltd UWA Accommodation Services Pty Ltd UWA Sport Pty Ltd Young Lives Matter Foundation UWA Ltd
10/04/2019 18/03/2019 18/03/2019 08/05/2019 13/03/2019
Table 1: Audit opinions issued for universities, TAFEs, subsidiaries and request audits
Seven other audit opinions were issued In addition to the tertiary education sector audits reported above, we issued a further 5 opinions for state entities since 1 November 2018. We also issued 2 opinions for local governments since our March 2019 Audit Results Report – Annual 2017-18 Financial Audits of Local Government Entities. Please refer to Appendix 1 on page 25.
Fifty-seven audit certifications were issued Throughout the year, we conduct audit work to certify financial and statistical information produced by entities. The audit opinion enables entities to meet conditions of State or Commonwealth funding or specific grant requirements or legislation. The opinion may also enable entities to receive ongoing funding under existing agreements or to apply for new funding.
Our November 2018 Audit Results Report – Annual 2017-18 Financial Audits of State Government Entities detailed 136 certifications issued by 1 November 2018, including 119 certifications under the Royalties for Regions program – predominantly for the 30 June 2018 period.
We have since issued a further 57 certifications including 43 under the Royalties for Regions program. Please refer to Appendix 2 on page 26.
10 | Western Australian Auditor General
Management and reporting issues at universities and TAFEs Financial control and reporting issues Every entity is responsible for developing and maintaining an internal control system and procedures to ensure legislative compliance, as well as accurately recording and reporting financial information and KPIs. The internal control system of an entity includes the controls for financial and human resource management, in addition to information systems procedures and governance processes. Where internal controls are weak, it is more likely that errors or fraud may occur and go undetected.
The AG Act requires the Auditor General to form an opinion on the controls of universities and TAFEs. In forming this opinion, the Auditor General assesses compliance with key aspects of legislation, and the ability of internal control systems and procedures to record and report reliable financial information and KPIs.
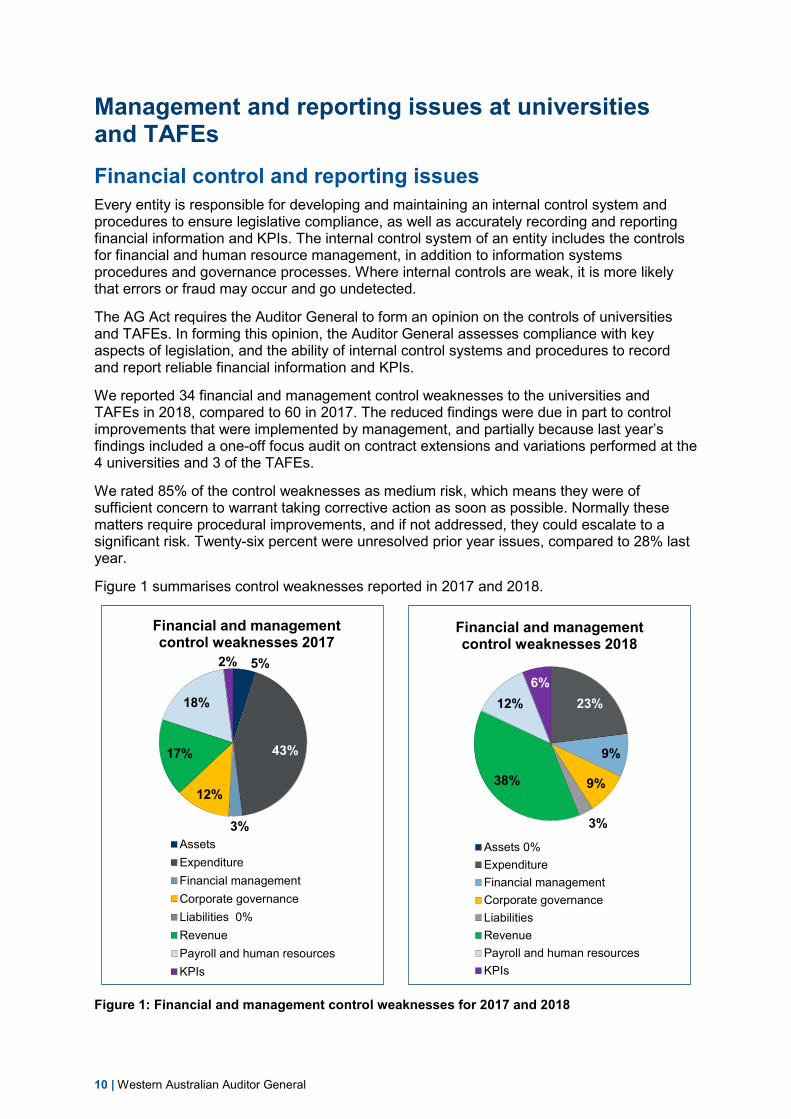
We reported 34 financial and management control weaknesses to the universities and TAFEs in 2018, compared to 60 in 2017. The reduced findings were due in part to control improvements that were implemented by management, and partially because last year’s findings included a one-off focus audit on contract extensions and variations performed at the 4 universities and 3 of the TAFEs.
We rated 85% of the control weaknesses as medium risk, which means they were of sufficient concern to warrant taking corrective action as soon as possible. Normally these matters require procedural improvements, and if not addressed, they could escalate to a significant risk. Twenty-six percent were unresolved prior year issues, compared to 28% last year.
Figure 1 summarises control weaknesses reported in 2017 and 2018.
Figure 1: Financial and management control weaknesses for 2017 and 2018
5%
43%
3%
12%
17%
18%
2%
Financial and management control weaknesses 2017
AssetsExpenditureFinancial managementCorporate governanceLiabilities 0%RevenuePayroll and human resourcesKPIs
0%
23%
9%
9%
3%
38%
12%6%
Financial and management control weaknesses 2018
Assets 0%ExpenditureFinancial managementCorporate governanceLiabilitiesRevenuePayroll and human resourcesKPIs

Audit Results Report - Annual 2018 Financial Audits | 11
Findings relating to revenue increased this year and were reported to 7 of the universities and TAFEs for 2018, compared to 5 the previous year. Common control weaknesses we identified this year related to revenue and purchasing cards.
Revenue control procedures were not routinely applied:
• for approving changes to resource fee charges to some students
• for review of student fee discounts and processing refunds.
Purchasing card control procedures were not followed to ensure that:
• purchasing card accounts were acquitted by cardholders within timelines set by management
• cards of former employees were cancelled promptly with the bank.
Information system control issues Each year we audit the design, implementation and operating effectiveness of information system (IS) controls at selected universities and TAFEs. Information system audits provide insights about the extent to which controls enable reliable and secure processing of financial and key performance information.
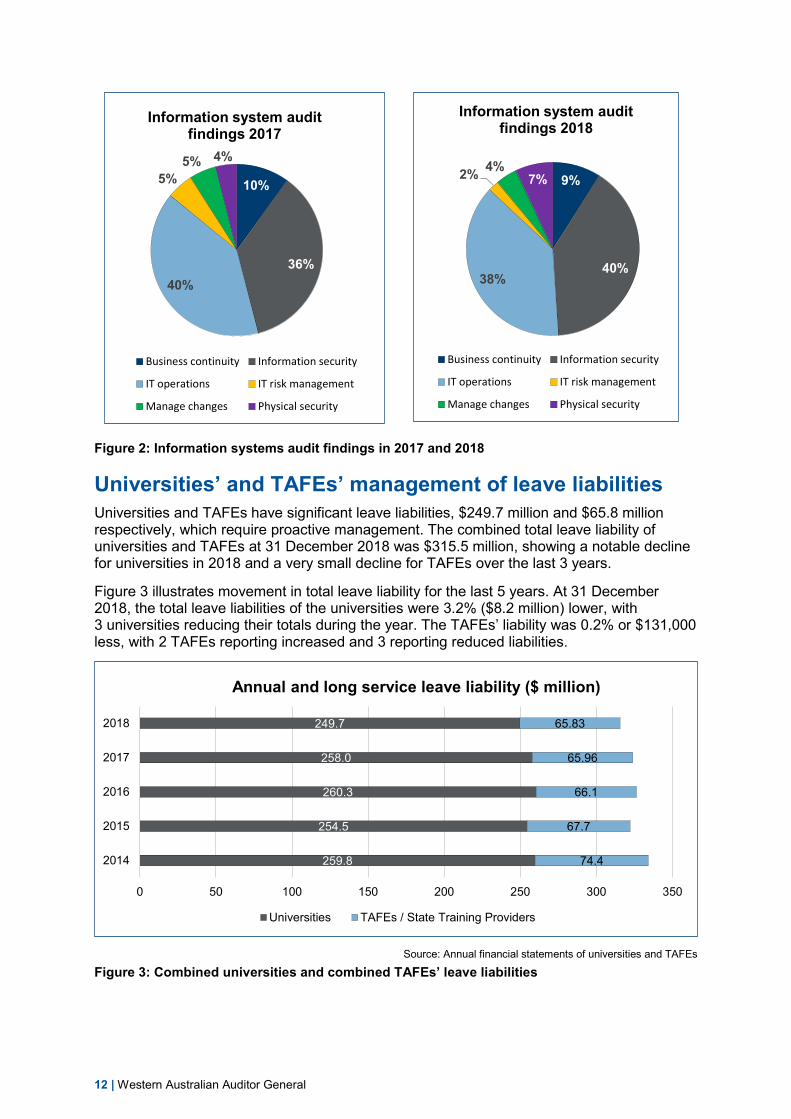
In 2018, we identified 90 IS control weaknesses across the 4 universities and 5 TAFEs we reviewed. We rated 2% of the weaknesses as significant, 60% as moderate, and the remainder as minor. Prompt corrective action is recommended for all significant findings and as soon as practicable for all findings rated as moderate.
Of the weaknesses identified:
• 40% related to information security issues. These included system vulnerabilities, weak passwords, and unauthorised and inappropriate access.
• 38% related to IT operations issues. These included the processing and handling of information, monitoring and logging user activity, and management and review of access privileges.
• 57% were unactioned from our previous audits.
Information system control weaknesses have the potential to compromise the confidentiality, integrity and availability of key computer systems if they are not addressed. Figure 2 shows the distribution of our findings across the 6 control categories we assessed during our audits.
More information on our IS audit results will be included in our next annual IS audit report.
12 | Western Australian Auditor General
Figure 2: Information systems audit findings in 2017 and 2018
Universities’ and TAFEs’ management of leave liabilities Universities and TAFEs have significant leave liabilities, $249.7 million and $65.8 million respectively, which require proactive management. The combined total leave liability of universities and TAFEs at 31 December 2018 was $315.5 million, showing a notable decline for universities in 2018 and a very small decline for TAFEs over the last 3 years.
Figure 3 illustrates movement in total leave liability for the last 5 years. At 31 December 2018, the total leave liabilities of the universities were 3.2% ($8.2 million) lower, with 3 universities reducing their totals during the year. The TAFEs’ liability was 0.2% or $131,000 less, with 2 TAFEs reporting increased and 3 reporting reduced liabilities.
Source: Annual financial statements of universities and TAFEs
Figure 3: Combined universities and combined TAFEs’ leave liabilities
10%
36%40%
5%5% 4%
Information system audit findings 2017
Business continuity Information security
IT operations IT risk management
Manage changes Physical security
9%
40%38%
2% 4%7%
Information system audit findings 2018
Business continuity Information security
IT operations IT risk management
Manage changes Physical security
259.8
254.5
260.3
258.0
249.7
74.4
67.7
66.1
65.96
65.83
0 50 100 150 200 250 300 350
2014
2015
2016
2017
2018
Annual and long service leave liability ($ million)
Universities TAFEs / State Training Providers
Audit Results Report - Annual 2018 Financial Audits | 13
The universities and particularly the TAFEs need to continue to closely manage these liabilities for a number of reasons. We consider that large balances can lead to payouts at a higher pay rate than when the entitlement accrued. It is also important that staff take regular leave for their health and wellbeing, and to promote staff rotation through roles responsible for key financial management controls. Staff rotation, like segregation of duties, is recognised as an important risk management tool as it can prevent and identify practices that contribute to error or fraud.
TAFEs’ new student management system During 2018 the 5 TAFEs commenced transitioning from their Unified Enrolments (UE) system to the new Student Management System (SMS). SMS is a key system for each TAFE’s student applications, enrolments, fees and life cycle management as students’ progress through their TAFE studies. Data integrity and security are paramount as the system is accessed by all TAFE campuses, students and the Department of Training and Workforce Development (DTWD). Data from SMS is also used to determine each TAFE’s funding.
DTWD’s project team managed the staged transition of the TAFEs to SMS during 2018. North Metropolitan TAFE was the first TAFE to start using the new SMS from 1 January 2018. The project required controls to be implemented for data capture, segregation of duties, data integrity and fraud prevention for each campus. By the end of 2018, 4 TAFEs were operating SMS, and South Metropolitan TAFE transitioned in January 2019.
Our audit teams reviewed SMS’s fee calculation, student enrolments, student bank account interface, student information (including online access and services), system access protocols, and departmental reporting for the VET Management Information Statistical Standard.
DTWD completed internal audit work around the migration of data from UE to SMS. Our review of this work, including corroboration as required by the auditing standards, confirmed that we could rely on the internal audit work.
Best practice entities for financial reporting and controls Edith Cowan University and South Metropolitan TAFE submitted good quality statements within the planned and agreed timelines, and also met our other best practice criteria.
The universities and TAFEs were again timely in submitting their financial statements, with the 5 TAFEs submitting them to our audit teams earlier than the previous year. The new reduced reporting requirements detailed on page 20, which applied to the TAFEs for the first time for this reporting period, contributed to this improvement.
We consider timely preparation of good quality financial statements and KPIs, and being audit ready, enables entities to release resources for other important tasks.
Our criteria for achieving best practice status include: • clear (unqualified) opinions on their financial statements, controls and KPIs • being audit ready early, ideally by 31 January • good quality financial statements and KPIs, supported by reliable working papers and
submitted for audit within the agreed timeframe • management resolution of accounting standards and presentation issues (before the
audit process begins) • key staff available during the audit process • assessment of the number and significance of control weaknesses we identified.
14 | Western Australian Auditor General
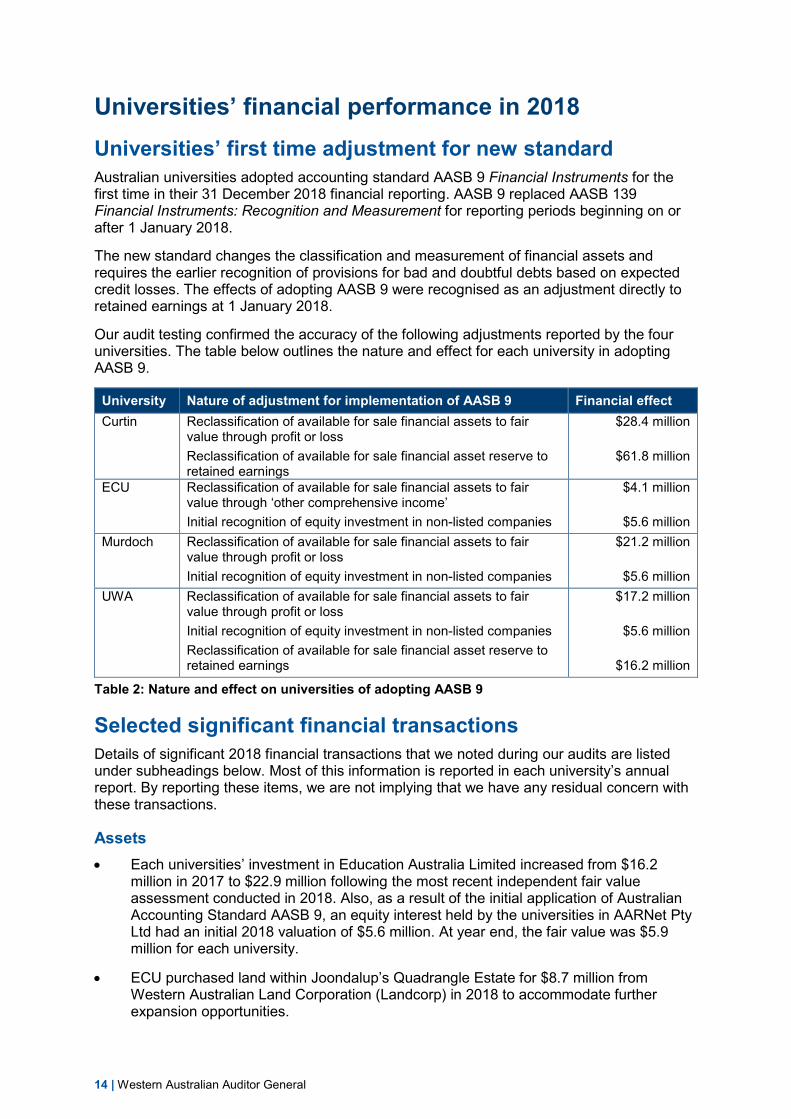
Universities’ financial performance in 2018 Universities’ first time adjustment for new standard Australian universities adopted accounting standard AASB 9 Financial Instruments for the first time in their 31 December 2018 financial reporting. AASB 9 replaced AASB 139 Financial Instruments: Recognition and Measurement for reporting periods beginning on or after 1 January 2018.
The new standard changes the classification and measurement of financial assets and requires the earlier recognition of provisions for bad and doubtful debts based on expected credit losses. The effects of adopting AASB 9 were recognised as an adjustment directly to retained earnings at 1 January 2018.
Our audit testing confirmed the accuracy of the following adjustments reported by the four universities. The table below outlines the nature and effect for each university in adopting AASB 9.
University Nature of adjustment for implementation of AASB 9 Financial effect Curtin Reclassification of available for sale financial assets to fair
value through profit or loss Reclassification of available for sale financial asset reserve to retained earnings
$28.4 million
$61.8 million
ECU Reclassification of available for sale financial assets to fair value through ‘other comprehensive income’ Initial recognition of equity investment in non-listed companies
$4.1 million
$5.6 million Murdoch Reclassification of available for sale financial assets to fair
value through profit or loss Initial recognition of equity investment in non-listed companies
$21.2 million
$5.6 million UWA Reclassification of available for sale financial assets to fair
value through profit or loss Initial recognition of equity investment in non-listed companies Reclassification of available for sale financial asset reserve to retained earnings
$17.2 million
$5.6 million
$16.2 million
Table 2: Nature and effect on universities of adopting AASB 9
Selected significant financial transactions Details of significant 2018 financial transactions that we noted during our audits are listed under subheadings below. Most of this information is reported in each university’s annual report. By reporting these items, we are not implying that we have any residual concern with these transactions.
Assets • Each universities’ investment in Education Australia Limited increased from $16.2
million in 2017 to $22.9 million following the most recent independent fair value assessment conducted in 2018. Also, as a result of the initial application of Australian Accounting Standard AASB 9, an equity interest held by the universities in AARNet Pty Ltd had an initial 2018 valuation of $5.6 million. At year end, the fair value was $5.9 million for each university.
• ECU purchased land within Joondalup’s Quadrangle Estate for $8.7 million from Western Australian Land Corporation (Landcorp) in 2018 to accommodate further expansion opportunities.
Audit Results Report - Annual 2018 Financial Audits | 15
• During 2018 ECU acquired all of the issued share capital of St Stephen’s College in two transactions totalling $3.1 million. The college is a provider of English and business education in China for high school students as a pathway to tertiary study in Australia.
• The University of Western Australia’s property, plant and equipment increased to $1.33 billion as a result of the $23 million capital investment in Ezone, a new student hub for engineering and mathematical science students.
• Curtin received $70 million of grant funding from the Commonwealth to upgrade the Pawsey Supercomputing Centre. Curtin was nominated by the Pawsey management board, which is comprised of CSIRO, Curtin, Murdoch University, ECU and UWA, as the most appropriate member organisation to receive the grant.
Liabilities • Curtin’s current borrowings decreased by 60% ($21 million) mainly due to the final
repayment of two Western Australian Treasury Corporation loans for Bentley Campus ($17 million) and Muresk Campus ($2 million) which matured during the year.
Revenue • Murdoch University’s fees and charges increased by 26% or $19.9 million to $95.8
million in 2018. Murdoch attributed this to strong growth in onshore international student enrolments as a result of their International Welcome Scholarship and recruitment activities in targeted overseas countries.
• UWA’s donation income was $17.1 million in 2018 compared to $49.3 million in 2017 when a $33.5 million donation was received for the Forrest Research Foundation.
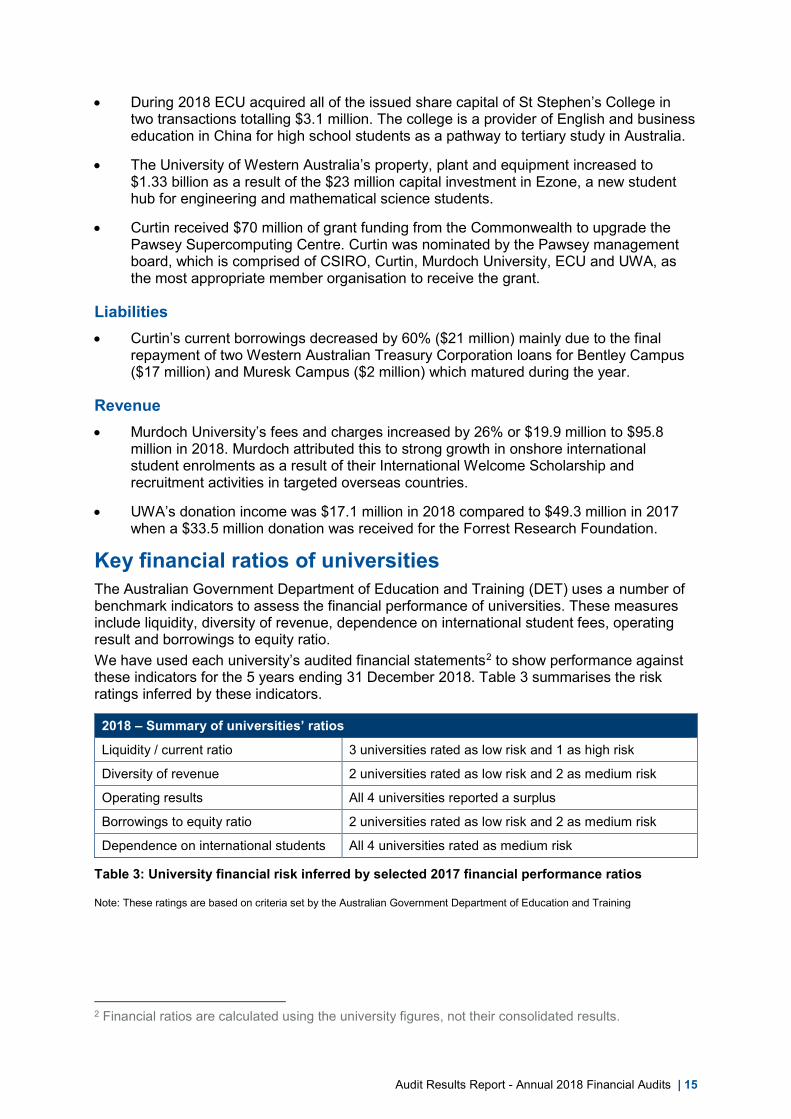
Key financial ratios of universities The Australian Government Department of Education and Training (DET) uses a number of benchmark indicators to assess the financial performance of universities. These measures include liquidity, diversity of revenue, dependence on international student fees, operating result and borrowings to equity ratio. We have used each university’s audited financial statements2 to show performance against these indicators for the 5 years ending 31 December 2018. Table 3 summarises the risk ratings inferred by these indicators.
2018 – Summary of universities’ ratios
Liquidity / current ratio 3 universities rated as low risk and 1 as high risk
Diversity of revenue 2 universities rated as low risk and 2 as medium risk
Operating results All 4 universities reported a surplus
Borrowings to equity ratio 2 universities rated as low risk and 2 as medium risk
Dependence on international students All 4 universities rated as medium risk
Table 3: University financial risk inferred by selected 2017 financial performance ratios
Note: These ratings are based on criteria set by the Australian Government Department of Education and Training
2 Financial ratios are calculated using the university figures, not their consolidated results.

16 | Western Australian Auditor General
Liquidity / current ratio The liquidity or current ratio assesses an entity’s ability to meet their debts as and when they fall due. The traditional accounting formula is current assets divided by current liabilities.
DET considers a ratio of more than 1 is low risk and below 0.75 to be high risk. Based on this rating, 3 universities were low risk, while UWA was high risk when assessed on this indicator for 2018.
Table 4: Liquidity ratio for universities
As the liquidity ratio recognises current assets only, we have also shown in Table 5, details of the universities’ total current and non-current cash and other financial assets for each year. Each university’s liquidity ratio would improve if their non-current liquid assets were included in the calculation.
Current and non-current cash and other financial assets ($m) 2014 2015 2016 2017 2018
Curtin 563 549 504 567 630
ECU 281 287 315 328 371
Murdoch 163 171 195 171 208
UWA 759 779 830 889 871
Table 5: Investments of universities (cash and other financial assets)
Diversity of revenue – dependence on Australian Government funding Universities can reduce their financial risk by diversifying their revenue sources. Each university has a different capacity to generate revenue, depending on factors such as location, size, courses offered, extent of research activity, perceived standing and student profiles.
DET considers universities with 55% or less of revenue received from Australian Government funding a low risk and between 55 and 65% to be medium risk. Australian Government financial assistance includes Commonwealth Grants Scheme and other grants, HECS-HELP and FEE-HELP payments. For 2018, Murdoch and UWA rated as low risk while Curtin and ECU were a medium risk for this indicator.
Table 6: Diversity of revenue (dependence on Australian Government funding) ratio
Liquidity / Current ratio 2014 2015 2016 2017 2018 Trendline2014 ↔ 2018
Curtin 1.4 1.3 1.2 1.3 1.3
ECU 2.4 1.7 1.7 1.7 1.4
Murdoch 2 1.9 1.9 1.7 1.8
UWA 1.2 1 0.7 0.6 0.6
Diversity of revenue i(dependence on Australian iGovernment funding)
2014 2015 2016 2017 2018 Trendline2014 ↔ 2018
Curtin 55% 56% 57% 56% 60%
ECU 65% 64% 62% 61% 61%
Murdoch 53% 56% 50% 59% 55%
UWA 55% 53% 52% 50% 51%
Audit Results Report - Annual 2018 Financial Audits | 17
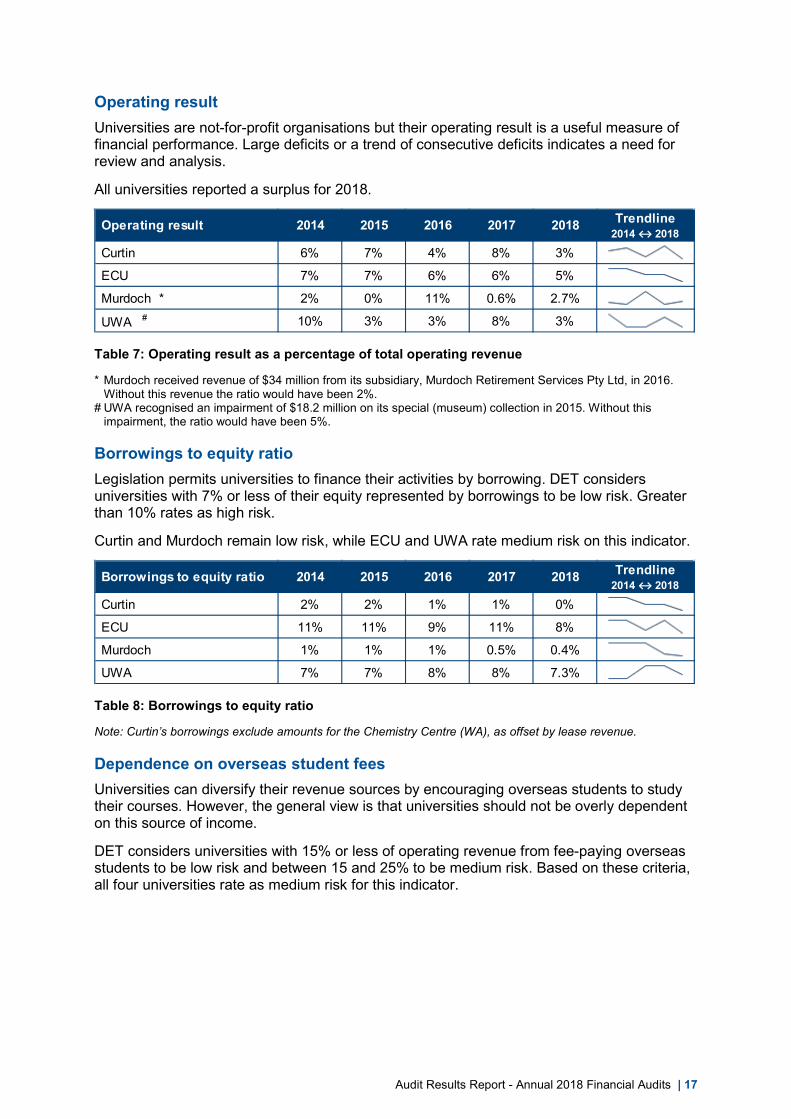
Operating result Universities are not-for-profit organisations but their operating result is a useful measure of financial performance. Large deficits or a trend of consecutive deficits indicates a need for review and analysis.
All universities reported a surplus for 2018.
Table 7: Operating result as a percentage of total operating revenue
* Murdoch received revenue of $34 million from its subsidiary, Murdoch Retirement Services Pty Ltd, in 2016. Without this revenue the ratio would have been 2%.
# UWA recognised an impairment of $18.2 million on its special (museum) collection in 2015. Without this impairment, the ratio would have been 5%.
Borrowings to equity ratio Legislation permits universities to finance their activities by borrowing. DET considers universities with 7% or less of their equity represented by borrowings to be low risk. Greater than 10% rates as high risk.
Curtin and Murdoch remain low risk, while ECU and UWA rate medium risk on this indicator.
Table 8: Borrowings to equity ratio
Note: Curtin’s borrowings exclude amounts for the Chemistry Centre (WA), as offset by lease revenue.
Dependence on overseas student fees Universities can diversify their revenue sources by encouraging overseas students to study their courses. However, the general view is that universities should not be overly dependent on this source of income.
DET considers universities with 15% or less of operating revenue from fee-paying overseas students to be low risk and between 15 and 25% to be medium risk. Based on these criteria, all four universities rate as medium risk for this indicator.
Operating result 2014 2015 2016 2017 2018 Trendline2014 ↔ 2018
Curtin 6% 7% 4% 8% 3%
ECU 7% 7% 6% 6% 5%
Murdoch * 2% 0% 11% 0.6% 2.7%
UWA # 10% 3% 3% 8% 3%
Borrowings to equity ratio 2014 2015 2016 2017 2018 Trendline2014 ↔ 2018
Curtin 2% 2% 1% 1% 0%
ECU 11% 11% 9% 11% 8%
Murdoch 1% 1% 1% 0.5% 0.4%
UWA 7% 7% 8% 8% 7.3%

18 | Western Australian Auditor General
Table 9: Fees from overseas students as a proportion of total operating revenue
The proportion of university student enrolments relating to international students for each university for 2014 to 2017 ranged from 16% to 44%, as shown below in Table 10.
Equivalent Full Time Student Load for universities Universities measure their student enrolments as Equivalent Full Time Student Load (EFTSL). As this information is released by the DET in September of the following year, the 2018 student enrolment information is not yet available.
The following table shows the EFTSL for the universities from 2014 to 2017, and the percentage of these enrolments relating to international students. ECU’s EFTSL has increased each year, as has their proportion of international students. The other 3 universities have an overall decreasing trend in their EFTSL with Curtin and Murdoch’s proportion of international students also decreasing.
EFTSL 2014 2015 2016 2017
EFTSL % International EFTSL %
International EFTSL % International EFTSL %
International
Curtin 35,310 33% 35,609 33% 35,002 32% 34,354 31%
ECU 17,272 16% 17,294 18% 18,267 20% 19,078 21%
Murdoch 16,392 44% 15,526 45% 15,665 43% 15,172 36%
UWA 21,093 20% 19,675 19% 19,565 20% 19,416 23%
Source: Data from Australian Government Department of Education and Training
Table 10: EFTSL (all students) and percentage of EFTSL that is international students
Overseas student fees ratio 2014 2015 2016 2017 2018 Trendline2014 ↔ 2018
Curtin 19% 19% 20% 19% 18%
ECU 15% 17% 20% 21% 23%
Murdoch 17% 18% 11% 12% 16%
UWA 11% 11% 13% 15% 16%

Audit Results Report - Annual 2018 Financial Audits | 19
Universities’ graduate survey information This section presents survey results of students graduating from university. These survey results are not usually reported in each university’s annual report.
Tables 11 and 12 present graduate responses to the Graduate Outcome Survey, a national online course evaluation survey conducted by the Social Research Centre on behalf of the Australian Government Department of Education and Training3. The survey instrument changed in 2016, including a shift in the reported population from the term ‘bachelor’ to ‘undergraduate’. As a result, prior year data in Tables 11 and 12 has been reworked by DET to be as comparable as possible.
Graduates are surveyed approximately 4 months after completing their courses. The 2018 information relates to students who completed their studies in 2017.
Graduate satisfaction of undergraduate students Table 11 presents the survey results showing the percentage of graduates who were satisfied with their overall undergraduate study experience.
Graduate satisfaction 2015 2016 2017 2018
Curtin 80.1% 81.9% 81.1% 80.5%
ECU 84.5% 84.8% 85.3% 84.0%
Murdoch 85.4% 80.5% 80.3% 80.2%
UWA 77.0% 74.4% 74.2% 75.2%
Western Australian university average 82.2% 81.3% 81.4% 81.1%
National university average 83.8% 80.6% 79.4% 79.7% Source: Australian Graduate Survey and Graduate Outcome Survey data (unpublished) from DET
Table 11: Graduate satisfaction survey results for university graduates
Graduate destination of domestic undergraduate students Table 12 shows the percentage of domestic undergraduate level graduates in employment, including full-time, part-time or casual, in the year after graduation. The numerator includes those graduates who are employed, irrespective of whether they want to work more hours.
Graduate destination 2015 2016 2017 2018
Curtin 87.8% 87.6% 87.0% 87.2%
ECU 89.7% 86.3% 82.5% 82.4%
Murdoch 84.8% 84.8% 82.8% 84.0%
UWA 88.8% 83.2% 82.2% 83.4%
Western Australian university average 88.9% 86.4% 84.9% 85.4%
National university average 89.8% 86.5% 86.7% 87.2% Source: Australian Graduate Survey and Graduate Outcome Survey (unpublished) data from DET
Table 12: Graduate destination survey results for university graduates
3 University survey results are available on the Quality Indicators for Learning and Teaching (QILT) website. QILT is administered by the Social Research Centre on behalf of the Australian Government Department of Education and Training.

20 | Western Australian Auditor General
TAFEs’ financial and other performance in 2018 New streamlined format for TAFE financial statements The reduced disclosure requirements prescribed by AASB 1053 Application of Tiers of Australian Accounting Standards, is included in Treasurer’s Instruction 1107 Application of Tiered Reporting – Reduced Disclosure Requirements for Tier 2 entities. This applied to TAFEs for their 2018 financial reports for the first time. The same recognition and measurement requirements apply to all entities, but Tier 2 entities, such as TAFEs, have fewer disclosure requirements than Tier 1 entities.
General purpose financial statements continue to be prepared by Tier 2 entities but the required level of detail is reduced so that the reports are shorter but still provide relevant information to users. A number of disclosure notes were reduced in detail without impacting the usefulness and understandability of the financial statements for users. Examples are the notes on financial instruments and the annual leave and long service leave provisions. Entities may include additional disclosures based on their judgement of user needs.
New Tier 2 entity model financial statements prepared by the Department of Training and Workforce Development were a guide for the TAFEs’ 2018 financial reporting.
These reduced disclosure requirements will apply to future financial reporting by the TAFEs. This will make preparation of annual financial statements less onerous and reduce the annual reporting cost burden to the TAFEs.
Selected significant financial transactions Listed below are significant 2018 financial transactions we noted during our TAFE audits. Most of this information can be found in each TAFE’s annual report. By reporting these items, we are not implying that we have any residual concern with these transactions.
Assets • South Metropolitan TAFE’s property, plant and equipment reduced by $12 million due
to the eTech land and buildings on its Fremantle campus being transferred to the Department of Planning, Land and Heritage.
Liabilities • Staff from South Metropolitan TAFE’s Balga and Midland campuses transferred to
North Metropolitan TAFE, with leave liabilities of $2.7 million also transferred. The South Metropolitan TAFE reported this liability at 31 December 2017 and paid the amount to North Metropolitan TAFE in 2018.
Revenue • South Metropolitan TAFE’s fee for service revenue was down 11% ($3.1 million) from
the previous year due mainly to a $2.4 million decrease in international student revenue.
• North Metropolitan TAFE reported a $5.1 million reduction in fee for service revenue, mainly due to a significant decrease in the number of international students studying in 2018.
• Central Regional TAFE’s student fees and fee for service revenue was lower by $1.7 million this year, mainly due to lower enrolments in the Gascoyne and Kalgoorlie regions.

Audit Results Report - Annual 2018 Financial Audits | 21
Expenses • North Regional TAFE’s 2018 employment costs were $2.1 million higher than the prior
year due to an increase in staff numbers, primarily required for the SMS system implementation.
TAFE financial results and liquidity • In 2018, the 5 TAFEs reported deficits for the third successive year since
amalgamation of the previous 11 state training providers. It should be noted that the 2017 deficits are higher than 2016 and 2018 because of significant revaluation decrements for land and buildings that were required to be brought to account as expenses in 2017 following amalgamation.
Source: Audited financial statements of TAFEs
Table 13: Financial results of TAFEs Note: The TAFEs are not funded for depreciation and amortisation which is reported in their Income Statements. The combined total was $33.9 million in 2018.
Although all TAFEs recorded deficits for the period, they nevertheless had a favourable liquidity ratio at 31 December 2018.
The liquidity or current ratio is a traditional way of assessing an entity’s ability to meet its debts as and when they fall due. A ratio of more than 1 is generally accepted as low risk. Table 14 shows that on this basis, all 5 TAFEs were low risk. However, care should be taken in concluding on the broader financial position of an entity solely on this indicator which compares current assets to current liabilities.
Liquidity / current ratio at year end 2016 2017 2018
Central Regional TAFE 1.6 1.8 1.3
North Metropolitan TAFE 1.8 1.8 1.6
North Regional TAFE 1.7 1.8 1.9
South Metropolitan TAFE 1.4 1.6 1.8
South Regional TAFE 1.7 1.5 1.8 Source: Audited financial statements of TAFEs
Table 14: Liquidity / current ratios for TAFEs
TAFE student enrolments Student curriculum hours (SCH) is the measure used to report the quantum of training delivered by the TAFEs. In 2018, a total of 21.5 million SCH of training was delivered by the 5 TAFEs through their Delivery and Performance Agreements (DPA) with DTWD. Overall this was a slight increase on the 2017 delivery, but still down from 2016.
Table 15 shows the delivery for each TAFE.
Deficit financial results ($000s) 2016 2017 2018
Central Regional TAFE (4,549) (9,586) (9,323)
North Metropolitan TAFE (14,040) (14,293) (7,797)
North Regional TAFE (6,879) (24,026) (3,141)
South Metropolitan TAFE (7,039) (15,350) (3,982)
South Regional TAFE (1,638) (5,707) (5,309)

22 | Western Australian Auditor General
Source: Audited KPIs of TAFEs
Table 15: Hours of DPA training delivered in 2016 to 2018 Note: The comparability of 2016 and 2017 figures has been impacted by the transfer of the Midland and Balga campuses from South Metropolitan TAFE to North Metropolitan TAFE.
Cost per Student Curriculum Hour The cost per SCH is a key financial performance measure. It is calculated by dividing the total cost of services by the total number of SCH of training delivered, including both DPA and other training delivered.
Many factors influence this measure, so this data alone should not be used to compare TAFEs. However, it provides a high level indication of efficiency. Factors can include regional location and economic conditions, the relative cost of different courses offered and student demographics.
Cost per SCH 2017 2018
Central Regional TAFE $30.30 $30.42
North Metropolitan TAFE $15.30 $17.68
North Regional TAFE $63.76 $52.27
South Metropolitan TAFE $18.43 $17.70
South Regional TAFE $22.79 $22.70 Source: Audited KPIs of TAFEs
Table 16: Cost per SCH for 2017 and 2018
DPA hours delivered 2016 2017 2018 Trendline2016 ↔ 2018
Central Regional TAFE 1,876,357 1,929,043 1,857,162
North Metropolitan TAFE 7,126,655 8,804,997 8,559,701
North Regional TAFE 959,914 1,078,535 1,101,631
South Metropolitan TAFE 9,291,117 7,290,774 7,464,046
South Regional TAFE 2,503,290 2,333,204 2,480,070
TOTAL DPA hours delivered 21,757,333 21,436,553 21,462,610

Audit Results Report - Annual 2018 Financial Audits | 23
TAFE student and graduate survey information TAFE students’ satisfaction surveys are conducted by the DTWD, and the National Centre for Vocational Education Research (NCVER) also surveys TAFE graduates at the end of each year.
TAFE student satisfaction DTWD administers the student satisfaction survey for TAFEs. This annual survey is a measure of the quality of the service provided by the TAFEs.
The student satisfaction rating reports the percentage of ‘satisfied’ and ‘very satisfied’ respondents to the survey. Table 17 compares satisfaction ratings provided by students studying in the last 3 years against the State average of our TAFEs including the Western Australian Academy of Performing Arts (WAAPA).
Student satisfaction 2016 2017 2018
Central Regional TAFE 92.2% 90.3% 92.0%
North Metropolitan TAFE 86.4% 84.6% 85.3%
North Regional TAFE 92.3% 90.9% 93.1%
South Metropolitan TAFE 88.7% 87.1% 87.8%
South Regional TAFE 89.7% 90.0% 90.3%
State average for TAFEs and WAAPA 88.9% 87.3% 88.2% Source: Audited KPIs of TAFEs
Table 17: Student satisfaction survey results for TAFE students
TAFE graduate achievement and destination ratings NCVER conducts the student outcomes survey of TAFE graduates annually. The aim of the survey is to measure vocational education and training graduates’ employment, further study and other opinions of the training undertaken. Tables 18 and 19 show the results published in 2017 and 2018 for TAFE graduates who completed their TAFE courses during 2016 and 2017 respectively.
TAFE graduate achievement The graduate achievement rating is an indicator of the extent to which TAFE graduates consider they have fully or partly achieved their main reason for undertaking their training.
Graduate achievement rating 2017 2018
Central Regional TAFE 89.1% 87.2%
North Metropolitan TAFE 79.6% 76.9%
North Regional TAFE 90.5% 92.4%
South Metropolitan TAFE 81.0% 79.5%
South Regional TAFE 86.1% 84.1%
TAFE Australia 83.2% 82.1% Source: Audited KPIs of TAFEs
Table 18: TAFE graduate achievement survey results

24 | Western Australian Auditor General
TAFE graduate destination The graduate destination indicator is the proportion of graduates in employment and shows the extent to which TAFE is providing relevant and quality training that improved graduates’ employability.
Graduate destination rating 2017 2018
Central Regional TAFE 80.6% 78.9%
North Metropolitan TAFE 66.1% 64.1%
North Regional TAFE 88.0% 88.4%
South Metropolitan TAFE 73.2% 68.4%
South Regional TAFE 74.5% 75.1%
TAFE Australia 73.1% 72.4% Source: Audited KPIs of TAFEs
Table 19: TAFE graduate destination survey results
Audit Results Report - Annual 2018 Financial Audits | 25
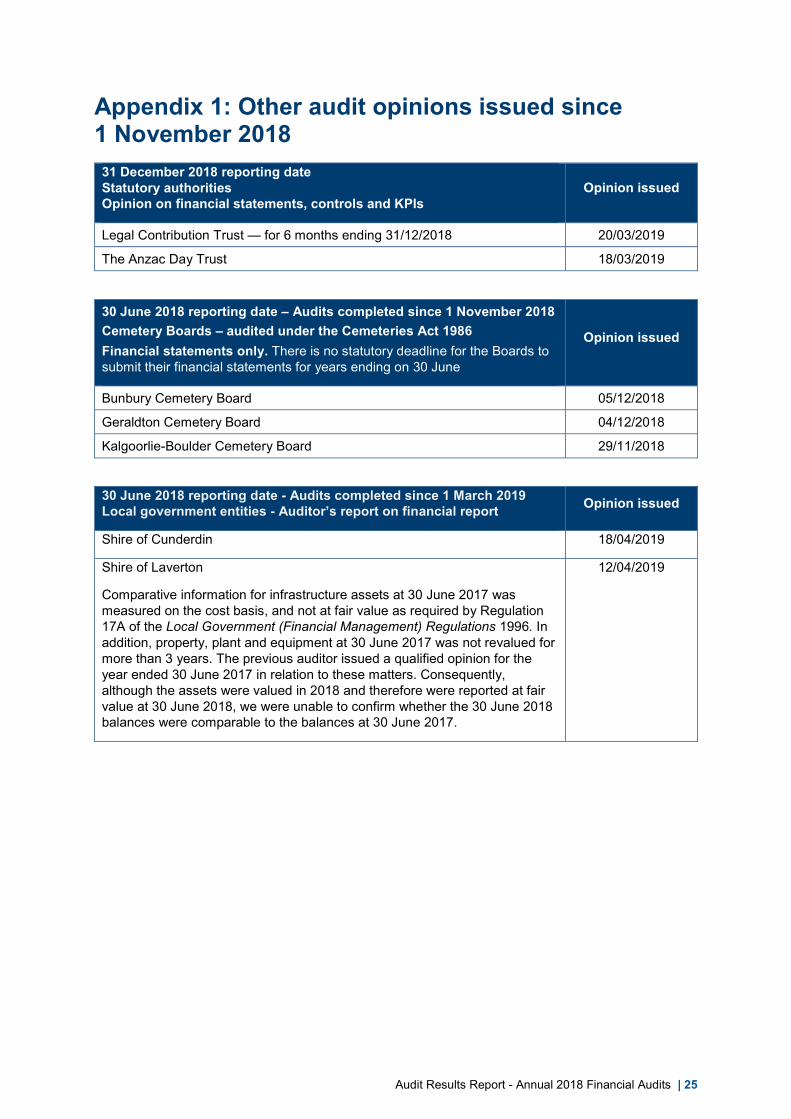
Appendix 1: Other audit opinions issued since 1 November 2018
31 December 2018 reporting date Statutory authorities Opinion on financial statements, controls and KPIs
Opinion issued
Legal Contribution Trust — for 6 months ending 31/12/2018 20/03/2019
The Anzac Day Trust 18/03/2019
30 June 2018 reporting date – Audits completed since 1 November 2018 Cemetery Boards – audited under the Cemeteries Act 1986 Financial statements only. There is no statutory deadline for the Boards to submit their financial statements for years ending on 30 June
Opinion issued
Bunbury Cemetery Board 05/12/2018
Geraldton Cemetery Board 04/12/2018
Kalgoorlie-Boulder Cemetery Board 29/11/2018
30 June 2018 reporting date - Audits completed since 1 March 2019 Local government entities - Auditor’s report on financial report Opinion issued
Shire of Cunderdin 18/04/2019
Shire of Laverton
Comparative information for infrastructure assets at 30 June 2017 was measured on the cost basis, and not at fair value as required by Regulation 17A of the Local Government (Financial Management) Regulations 1996. In addition, property, plant and equipment at 30 June 2017 was not revalued for more than 3 years. The previous auditor issued a qualified opinion for the year ended 30 June 2017 in relation to these matters. Consequently, although the assets were valued in 2018 and therefore were reported at fair value at 30 June 2018, we were unable to confirm whether the 30 June 2018 balances were comparable to the balances at 30 June 2017.
12/04/2019
26 | Western Australian Auditor General
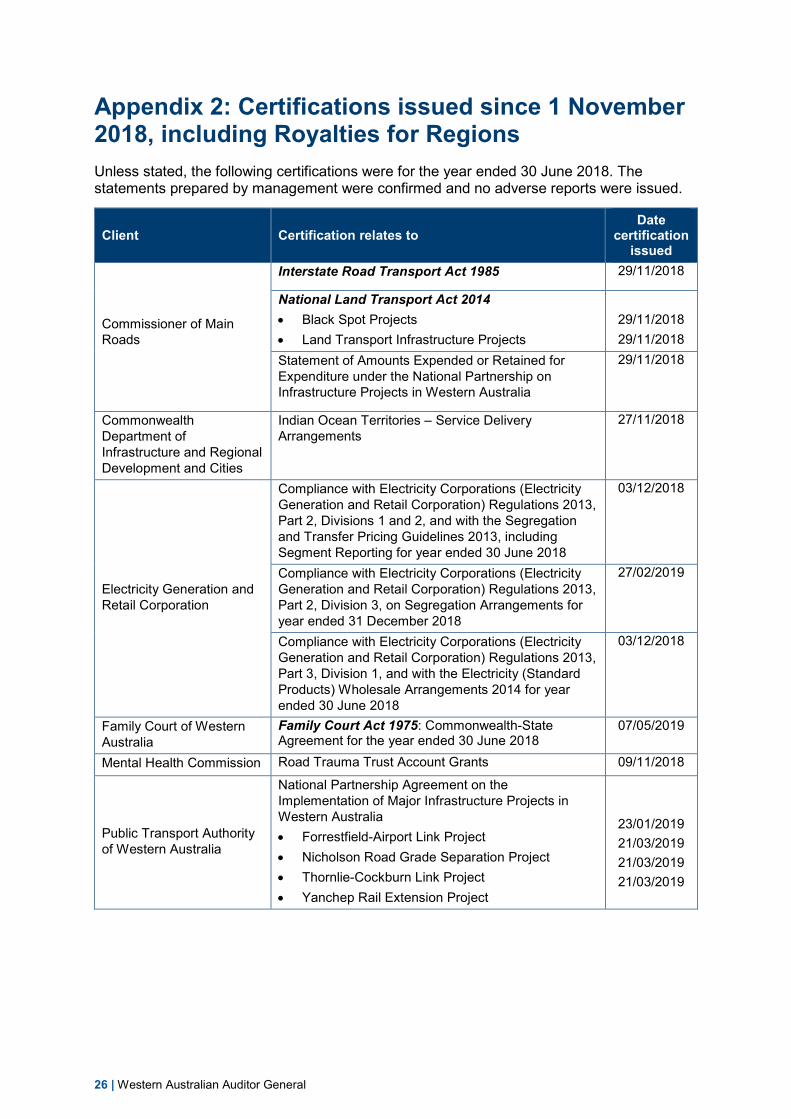
Appendix 2: Certifications issued since 1 November 2018, including Royalties for Regions Unless stated, the following certifications were for the year ended 30 June 2018. The statements prepared by management were confirmed and no adverse reports were issued.
Client Certification relates to Date
certification issued
Commissioner of Main Roads
Interstate Road Transport Act 1985 29/11/2018
National Land Transport Act 2014 • Black Spot Projects • Land Transport Infrastructure Projects
29/11/2018 29/11/2018
Statement of Amounts Expended or Retained for Expenditure under the National Partnership on Infrastructure Projects in Western Australia
29/11/2018
Commonwealth Department of Infrastructure and Regional Development and Cities
Indian Ocean Territories – Service Delivery Arrangements
27/11/2018
Electricity Generation and Retail Corporation
Compliance with Electricity Corporations (Electricity Generation and Retail Corporation) Regulations 2013, Part 2, Divisions 1 and 2, and with the Segregation and Transfer Pricing Guidelines 2013, including Segment Reporting for year ended 30 June 2018
03/12/2018
Compliance with Electricity Corporations (Electricity Generation and Retail Corporation) Regulations 2013, Part 2, Division 3, on Segregation Arrangements for year ended 31 December 2018
27/02/2019
Compliance with Electricity Corporations (Electricity Generation and Retail Corporation) Regulations 2013, Part 3, Division 1, and with the Electricity (Standard Products) Wholesale Arrangements 2014 for year ended 30 June 2018
03/12/2018
Family Court of Western Australia
Family Court Act 1975: Commonwealth-State Agreement for the year ended 30 June 2018
07/05/2019
Mental Health Commission Road Trauma Trust Account Grants 09/11/2018
Public Transport Authority of Western Australia
National Partnership Agreement on the Implementation of Major Infrastructure Projects in Western Australia • Forrestfield-Airport Link Project • Nicholson Road Grade Separation Project • Thornlie-Cockburn Link Project • Yanchep Rail Extension Project
23/01/2019 21/03/2019 21/03/2019 21/03/2019

Audit Results Report - Annual 2018 Financial Audits | 27
Royalties for Regions certifications
Delivering entity Royalties for Regions approved projects Date
certification issued
Department of Local Government, Sport and Cultural Industries
Local Government Capacity Building and Regional Reform 22/01/2019 Local Government Capacity Building 2015-16, 2016-17 and 2017-18
22/01/2019
Department of Mines, Industry Regulation and Safety
Regional Workers Incentives – District Allowance Administration
26/02/2019
Department of Primary Industries and Regional Development
Aboriginal Governance and Leadership Development Program
21/01/2019
Administration of Country Local Government Fund 18/12/2018 Agricultural Sciences Research and Development Fund 18/03/2019 Coral Bay Seasonal Staff Accommodation – Management Agreement
18/12/2018
Food Industry Innovation 05/04/2019 Gascoyne Food Bowl Initiative 18/03/2019 Goldfields Esperance Revitalisation Fund – Project Development, Assessment and Management
18/03/2019
Great Kimberley Marine Park 18/12/2018 Kimberley Schools Project Unit 18/12/2018 Local Infrastructure Asset Renewal and New Assets 29/11/2018 Managing Western Australia’s Natural Resources – Supporting Community Involvement
18/03/2019
Northern Beef Futures 05/04/2019 Ord-East Kimberley Expansion Project 18/03/2019 Potato Industry Adjustment 21/12/2018 Radar as an Enabling Technology 21/12/2018 Regional Development Leverage Unit 18/03/2019 Regional Groupings of Local Government 29/11/2018 Regional Men’s Health Initiative 18/12/2018 Regional Natural Resource Management – State Barrier Fence
21/01/2019
Regional Telecommunications Project Round 2 29/11/2018 South Coast Aquaculture Development Zone 29/11/2018 Seizing the Opportunity Agriculture – Infrastructure Investment Fund: • Extension of Doppler Radar Coverage as an Enabling
Technology – Upgrading Existing Radars • State Agricultural Telecommunications Infrastructure
Improvement Fund
21/12/2018
18/12/2018
Sheep Industry Business Innovation 18/03/2019 WA Community Resource Network 2016/17 – 2019/20 18/12/2018 WA Wild Dog Action Plan 2016-2021 05/04/2019
Department of the Premier and Cabinet
Great Kimberley Marine Park Project 16/01/2019
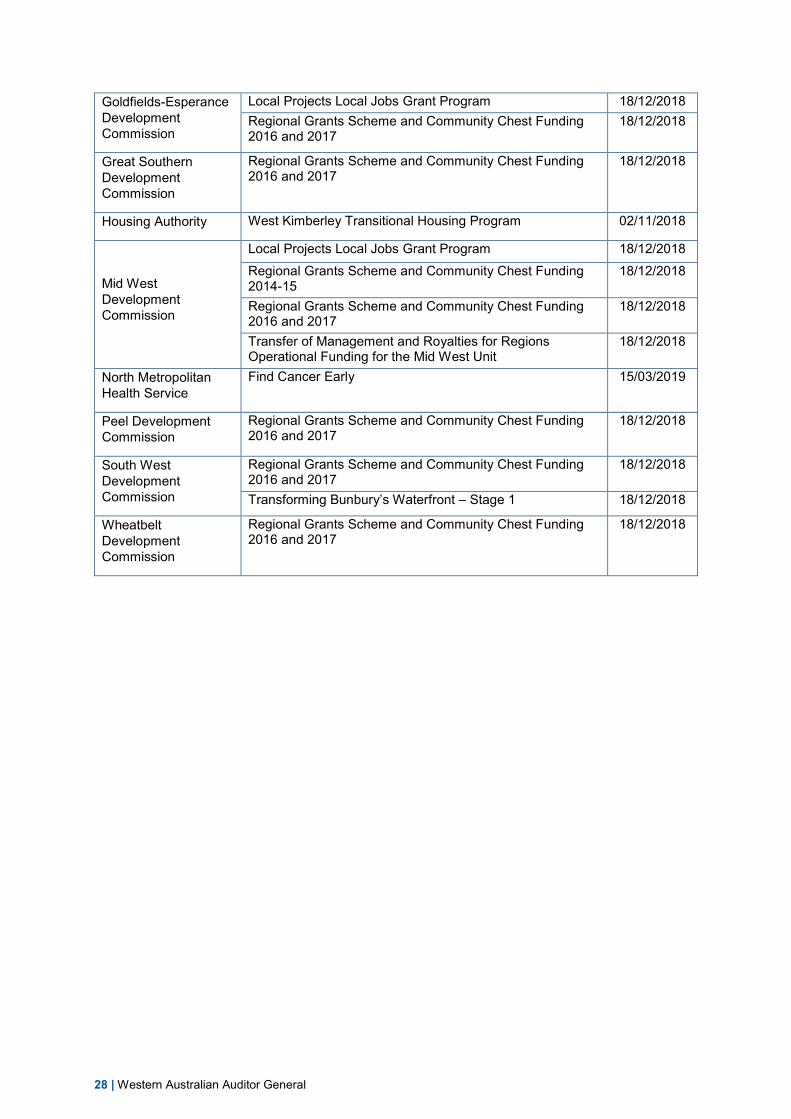
28 | Western Australian Auditor General
Goldfields-Esperance Development Commission
Local Projects Local Jobs Grant Program 18/12/2018 Regional Grants Scheme and Community Chest Funding 2016 and 2017
18/12/2018
Great Southern Development Commission
Regional Grants Scheme and Community Chest Funding 2016 and 2017
18/12/2018
Housing Authority West Kimberley Transitional Housing Program 02/11/2018
Mid West Development Commission
Local Projects Local Jobs Grant Program 18/12/2018 Regional Grants Scheme and Community Chest Funding 2014-15
18/12/2018
Regional Grants Scheme and Community Chest Funding 2016 and 2017
18/12/2018
Transfer of Management and Royalties for Regions Operational Funding for the Mid West Unit
18/12/2018
North Metropolitan Health Service
Find Cancer Early 15/03/2019
Peel Development Commission
Regional Grants Scheme and Community Chest Funding 2016 and 2017
18/12/2018
South West Development Commission
Regional Grants Scheme and Community Chest Funding 2016 and 2017
18/12/2018
Transforming Bunbury’s Waterfront – Stage 1 18/12/2018
Wheatbelt Development Commission
Regional Grants Scheme and Community Chest Funding 2016 and 2017
18/12/2018

Audit Results Report - Annual 2018 Financial Audits | 29
Appendix 3: Universities’ and TAFEs’ expenditure and sources of revenue The following breakdown of total revenue sources and total expenses by categories for the past 5 years for the universities and TAFEs are provided for the information of Parliament.
Source: Annual financial statements of universities
Source: Annual financial statements of universities
1,026.5
995.8
1,008.5
1,010.2
1,006.7
425.7
428.7
442.4
459.7
477.0
525.4
537.5
574.9
601.4
621.6
189.1
203.2
215.5
198.0
160.0
0 250 500 750 1,000 1,250 1,500 1,750 2,000 2,250 2,500 2,750
2014
2015
2016
2017
2018
Universities - revenue sources ($ million)
Australian Government grantsHELP-Australian Government paymentsState and Local Government financial assistanceHECS-HELP Student paymentsFees and chargesInvestment revenue, Royalties, trademarks and licencesConsultancy and contracts, research grantsOther Revenue
1,468.6
1,468.6
1,558.9
1,518.8
1,532.6
121.5
145.3
146.0
158.4
153.3
738.5
735.7
729.4
748.6
765.0
0 250 500 750 1,000 1,250 1,500 1,750 2,000 2,250 2,500 2,750
2014
2015
2016
2017
2018
Universities' expenses ($ million)
Employee related expenses
Depreciation, amortisation and impairment of assets
Repairs and maintenance
Borrowing costs and investment losses
Other expenses

30 | Western Australian Auditor General
Source: Annual financial statements of TAFEs
Note: Excludes asset revaluation increments
Source: Annual financial statements of TAFEs
Note: Excludes asset revaluation decrements
416.3
394.3
352.2
352.4
356.4
86.9
84.5
78.0
65.8
56.3
71.6
76.9
76.7
71.3
67.6
0 50 100 150 200 250 300 350 400 450 500 550 600 650
2014
2015
2016
2017
2018
TAFEs' revenue sources ($ million)
Income from State Government Fee for service
Student fees and charges Commonwealth Grants and contributions
Interest Revenue Other Revenue
417.1
409.2
370.3
354.2
353.7
30.0
31.8
29.7
34.4
34.2
123.5
125.2
105.9
108.6
110.6
42.8
42.2
38.0
34.7
37.5
0 50 100 150 200 250 300 350 400 450 500 550 600 650
2014
2015
2016
2017
2018
TAFEs' operating expenses ($ million)
Employee benefits expense
Depreciation, amortisation and loss on disposal of assets
Supplies and services
Other expenses
Audit Results Report - Annual 2018 Financial Audits | 31
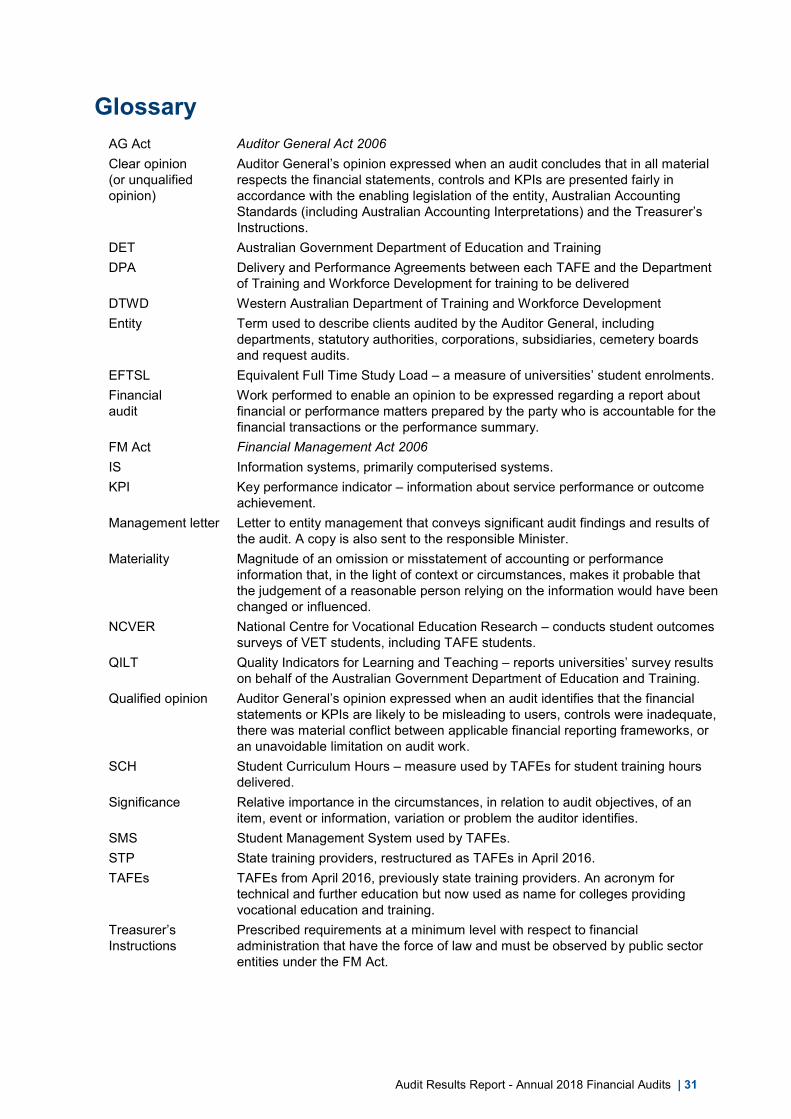
Glossary AG Act Auditor General Act 2006 Clear opinion (or unqualified opinion)
Auditor General’s opinion expressed when an audit concludes that in all material respects the financial statements, controls and KPIs are presented fairly in accordance with the enabling legislation of the entity, Australian Accounting Standards (including Australian Accounting Interpretations) and the Treasurer’s Instructions.
DET Australian Government Department of Education and Training DPA Delivery and Performance Agreements between each TAFE and the Department
of Training and Workforce Development for training to be delivered DTWD Western Australian Department of Training and Workforce Development Entity Term used to describe clients audited by the Auditor General, including
departments, statutory authorities, corporations, subsidiaries, cemetery boards and request audits.
EFTSL Equivalent Full Time Study Load – a measure of universities’ student enrolments. Financial audit
Work performed to enable an opinion to be expressed regarding a report about financial or performance matters prepared by the party who is accountable for the financial transactions or the performance summary.
FM Act Financial Management Act 2006 IS Information systems, primarily computerised systems. KPI Key performance indicator – information about service performance or outcome
achievement. Management letter Letter to entity management that conveys significant audit findings and results of
the audit. A copy is also sent to the responsible Minister. Materiality Magnitude of an omission or misstatement of accounting or performance
information that, in the light of context or circumstances, makes it probable that the judgement of a reasonable person relying on the information would have been changed or influenced.
NCVER National Centre for Vocational Education Research – conducts student outcomes surveys of VET students, including TAFE students.
QILT Quality Indicators for Learning and Teaching – reports universities’ survey results on behalf of the Australian Government Department of Education and Training.
Qualified opinion Auditor General’s opinion expressed when an audit identifies that the financial statements or KPIs are likely to be misleading to users, controls were inadequate, there was material conflict between applicable financial reporting frameworks, or an unavoidable limitation on audit work.
SCH Student Curriculum Hours – measure used by TAFEs for student training hours delivered.
Significance Relative importance in the circumstances, in relation to audit objectives, of an item, event or information, variation or problem the auditor identifies.
SMS Student Management System used by TAFEs. STP State training providers, restructured as TAFEs in April 2016. TAFEs TAFEs from April 2016, previously state training providers. An acronym for
technical and further education but now used as name for colleges providing vocational education and training.
Treasurer’s Instructions
Prescribed requirements at a minimum level with respect to financial administration that have the force of law and must be observed by public sector entities under the FM Act.

Auditor General’s Reports
Report number Reports Date tabled
18 Firearm Controls 15 May 2019
17 Records Management in Local Government 9 April 2019
16 Management of Supplier Master Files 7 March 2019
15 Audit Results Report Annual 2017-18 Financial Audits of Local Government Entities 7 March 2019
14 Opinions on Ministerial Notifications 13 February 2019
13 Opinion on Ministerial Notification 23 January 2019
12 Managing Disruptive Behaviour in Public Housing 20 December 2018
11 Opinions on Ministerial Notifications 20 December 2018
10 Opinions on Ministerial Notifications 18 December 2018
9 Treatment Services for People with Methamphetamine Dependence 18 December 2018
8 Opinions on Ministerial Notifications 10 December 2018
7 Audit Results Report – Annual 2017-18 Financial Audits of State Government Entities 8 November 2018
6 Opinion on Ministerial Notification 31 October 2018
5 Local Government Procurement 11 October 2018
4 Opinions on Ministerial Notifications 30 August 2018
3 Implementation of the GovNext-ICT Program 30 August 2018
2 Young People Leaving Care 22 August 2018
1 Information Systems Audit Report 2018 21 August 2018

Office of the Auditor General Western Australia 7th Floor Albert Facey House 469 Wellington Street, Perth Mail to: Perth BC, PO Box 8489 PERTH WA 6849 T: 08 6557 7500 F: 08 6557 7600 E: [email protected] W: www.audit.wa.gov.au
Follow us on Twitter @OAG_WA
Download QR Code Scanner app and scan code to access more information about our Office