audit report - tn · pdf fileaudit report state of tennessee ... donna jewell, cpa, cfe...
TRANSCRIPT

Tennessee Board of Regents
The University of Memphis
For the Year Ended June 30, 2013
AUDIT REPORT
STATE OF TENNESSEE
COMPTROLLER OF THE TREASURY
Department of Audit
Division of State Audit

Deborah V. Loveless, CPA, CGFM Director Edward Burr, CPA, CGFM Assistant Director
Donna Jewell, CPA, CFE Walter Bond, CPA Audit Manager In-Charge Auditor
Benjamin Elliott Andrew E. Moss Staff Auditors
Gerry C. Boaz, CPA, CGFM Amy Brack Amanda Adams Technical Manager Editor Assistant Editor
Comptroller of the Treasury, Division of State Audit 1500 James K. Polk Building, Nashville, TN 37243-1402
(615) 401-7897
Financial/compliance audits of colleges and universities are available online at www.comptroller.tn.gov/sa/AuditReportCategories.asp.
For more information about the Comptroller of the Treasury, please visit our website at www.comptroller.tn.gov.

STATE OF TENNESSEE C O M P T R O L L E R O F T H E T R E A S U R Y
DEPARTMENT OF AUDIT DIVISION OF STATE AUDIT
S U I T E 1 5 0 0 , JAMES K. POLK STATE OFFICE BUILDING NASHVILLE, TENNESSEE 37243-1402
PHONE (615) 401-7897 FAX (615) 532-2765
March 13, 2014
The Honorable Bill Haslam, Governor Members of the General Assembly The Honorable John G. Morgan, Chancellor Mr. R. Brad Martin, Interim President Ladies and Gentlemen: Transmitted herewith is the financial and compliance audit of the Tennessee Board of Regents, The University of Memphis, for the year ended June 30, 2013. You will note from the independent auditor’s report that unmodified opinions were given on the fairness of the presentation of the financial statements. Consideration of the internal control over financial reporting and tests of compliance disclosed certain deficiencies, which are detailed in the Findings and Recommendations section of this report. The university’s administration has responded to the audit findings; the responses are included following each finding. The Division of State Audit will follow up the audit to examine the application of the procedures instituted because of the audit findings. Sincerely,
Deborah V. Loveless, CPA Director 13/064

Audit Report Tennessee Board of Regents
The University of Memphis For the Year Ended June 30, 2013
TABLE OF CONTENTS
Page
Audit Highlights 1 Financial Section
Independent Auditor’s Report 2
Management’s Discussion and Analysis 5
Basic Financial Statements
Statement of Net Position 15
Statement of Revenues, Expenses, and Changes in Net Position 16
Statement of Cash Flows 17
Notes to the Financial Statements 19
Required Supplementary Information
OPEB Schedule of Funding Progress 42
Supplementary Information
Schedule of Cash Flows – Component Unit 43
Internal Control, Compliance, and Other Matters
Independent Auditor’s Report on Internal Control Over Financial Reporting and on Compliance and Other Matters Based on an Audit of Financial Statements Performed in Accordance With Government Auditing Standards 44
TABLE OF CONTENTS (Continued)
Page
Findings and Recommendations 46
Finding 1 - The University of Memphis’ data security policies should be strengthened
46
Finding 2 - The University of Memphis did not report student status change dates correctly, resulting in excessive grace periods for repayment of Perkins loans
46
1
State of Tennessee
A u d i t H i g h l i g h t s
Comptroller of the Treasury Division of State Audit
Financial and Compliance Audit Tennessee Board of Regents
The University of Memphis For the Year Ended June 30, 2013
_______
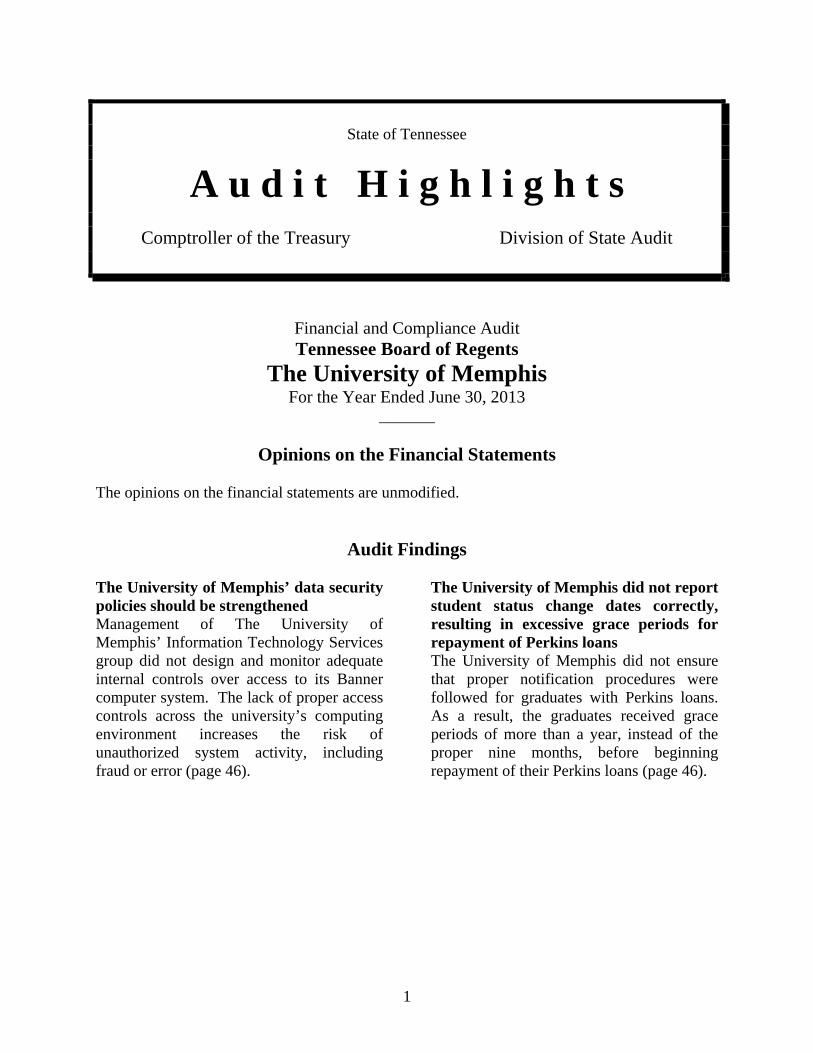
Opinions on the Financial Statements
The opinions on the financial statements are unmodified.
Audit Findings
The University of Memphis’ data security policies should be strengthened Management of The University of Memphis’ Information Technology Services group did not design and monitor adequate internal controls over access to its Banner computer system. The lack of proper access controls across the university’s computing environment increases the risk of unauthorized system activity, including fraud or error (page 46).
The University of Memphis did not report student status change dates correctly, resulting in excessive grace periods for repayment of Perkins loans The University of Memphis did not ensure that proper notification procedures were followed for graduates with Perkins loans. As a result, the graduates received grace periods of more than a year, instead of the proper nine months, before beginning repayment of their Perkins loans (page 46).

STATE OF TENNESSEE C O M P T R O L L E R O F T H E T R E A S U R Y
DEPARTMENT OF AUDIT DIVISION OF STATE AUDIT
S U I T E 1 5 0 0 , JAMES K. POLK STATE OFFICE BUILDING NASHVILLE, TENNESSEE 37243-1402
PHONE (615) 401-7897 FAX (615) 532-2765
2
Independent Auditor’s Report
The Honorable Bill Haslam, Governor Members of the General Assembly The Honorable John G. Morgan, Chancellor Mr. R. Brad Martin, Interim President Report on the Financial Statements We have audited the accompanying financial statements of The University of Memphis, an institution of the Tennessee Board of Regents, which is a component unit of the State of Tennessee, and its discretely presented component unit as of and for the year ended June 30, 2013, and the related notes to the financial statements, which collectively comprise the basic financial statements as listed in the table of contents. Management’s Responsibility for the Financial Statements Management is responsible for the preparation and fair presentation of these financial statements in accordance with accounting principles generally accepted in the United States of America; this includes the design, implementation, and maintenance of internal control relevant to the preparation and fair presentation of financial statements that are free from material misstatement, whether due to fraud or error. Auditor’s Responsibility Our responsibility is to express opinions on these financial statements, based on our audit. We did not audit the financial statements of The University of Memphis Foundation, a discretely presented component unit. Those statements were audited by other auditors, whose report has been furnished to us. Our opinion, insofar as it relates to the amounts included for the foundation, is based solely on the report of the other auditors. We conducted our audit in accordance with auditing standards generally accepted in the United States of America and the standards applicable to financial audits contained in Government Auditing Standards, issued by the Comptroller General of the United States. Those standards require that we plan and perform the audit to obtain reasonable assurance about whether the financial statements are free of material misstatement. An audit involves performing procedures to obtain audit evidence about the amounts and disclosures in the financial statements. The procedures selected depend on the auditor’s judgment, including the assessment of the risks of material misstatement of the financial statements, whether due to fraud or error. In making those risk assessments, the auditor

3
considers internal control relevant to the entity’s preparation and fair presentation of the financial statements in order to design audit procedures that are appropriate in the circumstances, but not for the purpose of expressing an opinion on the effectiveness of the entity’s internal control. Accordingly, we express no such opinion. An audit also includes evaluating the appropriateness of accounting policies used and reasonableness of significant accounting estimates made by management, as well as evaluating the overall presentation of the financial statements. We believe that the audit evidence we have obtained is sufficient and appropriate to provide a basis for our audit opinions. Opinions In our opinion, based on our audit and the report of the other auditors, the financial statements referred to above present fairly, in all material respects, the respective financial position of The University of Memphis and its discretely presented component unit as of June 30, 2013, as well as the respective changes in financial position and, where applicable, cash flows thereof for the year then ended, in accordance with accounting principles generally accepted in the United States of America. Emphasis of Matters As discussed in Note 1, the financial statements of The University of Memphis, an institution of the Tennessee Board of Regents, are intended to present the financial position, the changes in financial position, and the cash flows of only The University of Memphis. They do not purport to, and do not, present fairly the financial position of the Tennessee Board of Regents, as of June 30, 2013, and the changes in financial position and cash flows thereof for the year then ended, in accordance with accounting principles generally accepted in the United States of America. Our opinion is not modified with respect to this matter. As discussed in Note 1, the university implemented GASB Statement 65, Items Previously Reported as Assets and Liabilities, during the year ended June 30, 2013. Our opinion is not modified with respect to this matter. As discussed in Note 21, the financial statements of The University of Memphis Foundation, a discretely presented component unit of The University of Memphis, include investments valued at $34,394,180 (29% of net position of the foundation), whose fair values have been estimated by management in the absence of readily determinable fair values. Management’s estimates are based on information provided by the fund managers or the general partners. Our opinion is not modified with respect to this matter. Other Matters Required Supplementary Information Accounting principles generally accepted in the United States of America require that the management’s discussion and analysis on pages 5 through 14 and the schedule of funding
4
progress on page 42 be presented to supplement the basic financial statements. Such information, although not a part of the basic financial statements, is required by the Governmental Accounting Standards Board, which considers it to be an essential part of financial reporting for placing the basic financial statements in an appropriate operational, economic, or historical context. We have applied certain limited procedures to the required supplementary information in accordance with auditing standards generally accepted in the United States of America, which consisted of inquiries of management about the methods of preparing the information and comparing the information for consistency with management’s responses to our inquiries, the basic financial statements, and other knowledge we obtained during the audit of the basic financial statements. We do not express an opinion or provide any assurance on the information because the limited procedures do not provide us with sufficient evidence to express an opinion or provide any assurance. Supplementary Information Our audit was conducted for the purpose of forming opinions on the financial statements that collectively comprise the university’s basic financial statements. The schedule of cash flows – component unit on page 43 is presented for purposes of additional analysis and is not a required part of the basic financial statements. The schedule of cash flows – component unit is the responsibility of the university’s management and was derived from, and relates directly to, the underlying accounting and other records used to prepare the basic financial statements. Such information has been subjected to the auditing procedures applied in the audit of the basic financial statements and certain additional procedures, including comparing and reconciling such information directly to the underlying accounting and other records used to prepare the basic financial statements or to the basic financial statements themselves, as well as other additional procedures in accordance with auditing standards generally accepted in the United States of America by us and other auditors. In our opinion, the information is fairly stated in all material respects in relation to the basic financial statements as a whole. Other Reporting Required by Government Auditing Standards In accordance with Government Auditing Standards, we have also issued our report dated November 27, 2013, on our consideration of the university’s internal control over financial reporting and on our tests of its compliance with certain provisions of laws, regulations, contracts, and grant agreements and other matters. The purpose of that report is to describe the scope of our testing of internal control over financial reporting and compliance and the results of that testing, and not to provide an opinion on the internal control over financial reporting or on compliance. That report is an integral part of an audit performed in accordance with Government Auditing Standards in considering the university’s internal control over financial reporting and compliance.
Deborah V. Loveless, CPA Director November 27, 2013

5
Tennessee Board of Regents THE UNIVERSITY OF MEMPHIS
Management’s Discussion and Analysis Introduction This section of The University of Memphis’s annual financial report presents a discussion and analysis of the financial performance of the university during the fiscal year ended June 30, 2013, with comparative information presented for the fiscal year ended June 30, 2012. This discussion has been prepared by management along with the financial statements and related note disclosures and should be read in conjunction with the independent auditor’s report, the audited financial statements, and the accompanying notes. The financial statements, notes, and this discussion are the responsibility of management. The university has one discretely presented component unit, the University of Memphis Foundation. More detailed information about the foundation is presented in Note 21 to the financial statements. This discussion and analysis focuses on the university and does not include the foundation. Overview of the Financial Statements The financial statements have been prepared in accordance with generally accepted accounting principles as prescribed by the Governmental Accounting Standards Board (GASB), which establishes standards for external financial reporting for public colleges and universities. The financial statements are presented on a consolidated basis to focus on the university as a whole. The full scope of the university’s activities is considered to be a single business-type activity and, accordingly, is reported within a single column in the basic financial statements. The university’s financial report includes the statement of net position; the statement of revenues, expenses, and changes in net position; and the statement of cash flows. Notes to the financial statements are also presented to provide additional information that is essential to a full understanding of the financial statements. The Statement of Net Position The statement of net position is a point-in-time financial statement. The statement of net position presents the financial position of the university at the end of the fiscal year. To aid the reader in determining the university’s ability to meet immediate and future obligations, the statement includes all assets, liabilities, deferred outflows/inflows, and net position of the university and segregates the assets and liabilities into current and noncurrent components. Current assets are those that are available to satisfy current liabilities, inclusive of assets that will be converted to cash within one year. Current liabilities are those that will be paid within one year. The statement of net position is prepared under the accrual basis of accounting; assets and
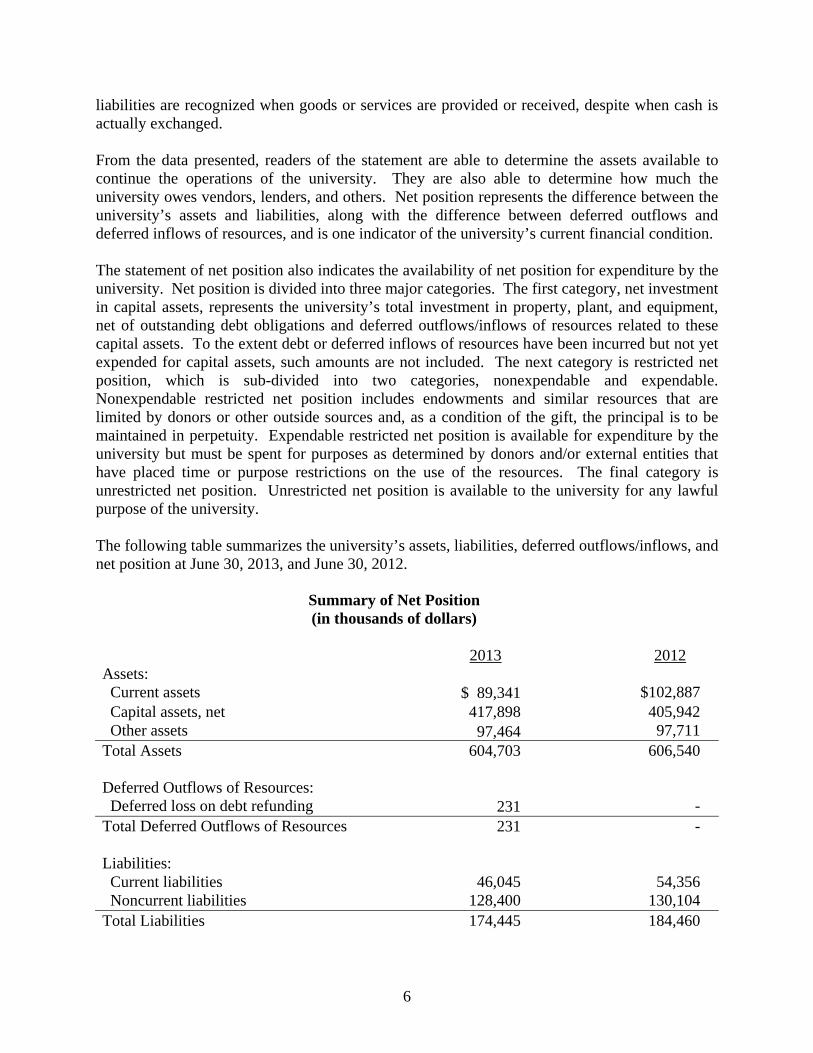
6
liabilities are recognized when goods or services are provided or received, despite when cash is actually exchanged. From the data presented, readers of the statement are able to determine the assets available to continue the operations of the university. They are also able to determine how much the university owes vendors, lenders, and others. Net position represents the difference between the university’s assets and liabilities, along with the difference between deferred outflows and deferred inflows of resources, and is one indicator of the university’s current financial condition. The statement of net position also indicates the availability of net position for expenditure by the university. Net position is divided into three major categories. The first category, net investment in capital assets, represents the university’s total investment in property, plant, and equipment, net of outstanding debt obligations and deferred outflows/inflows of resources related to these capital assets. To the extent debt or deferred inflows of resources have been incurred but not yet expended for capital assets, such amounts are not included. The next category is restricted net position, which is sub-divided into two categories, nonexpendable and expendable. Nonexpendable restricted net position includes endowments and similar resources that are limited by donors or other outside sources and, as a condition of the gift, the principal is to be maintained in perpetuity. Expendable restricted net position is available for expenditure by the university but must be spent for purposes as determined by donors and/or external entities that have placed time or purpose restrictions on the use of the resources. The final category is unrestricted net position. Unrestricted net position is available to the university for any lawful purpose of the university. The following table summarizes the university’s assets, liabilities, deferred outflows/inflows, and net position at June 30, 2013, and June 30, 2012.
Summary of Net Position (in thousands of dollars)
2013 2012 Assets: Current assets $ 89,341 $102,887 Capital assets, net 417,898 405,942 Other assets 97,464 97,711 Total Assets 604,703 606,540 Deferred Outflows of Resources: Deferred loss on debt refunding 231 - Total Deferred Outflows of Resources 231 - Liabilities: Current liabilities 46,045 54,356 Noncurrent liabilities 128,400 130,104 Total Liabilities 174,445 184,460
7
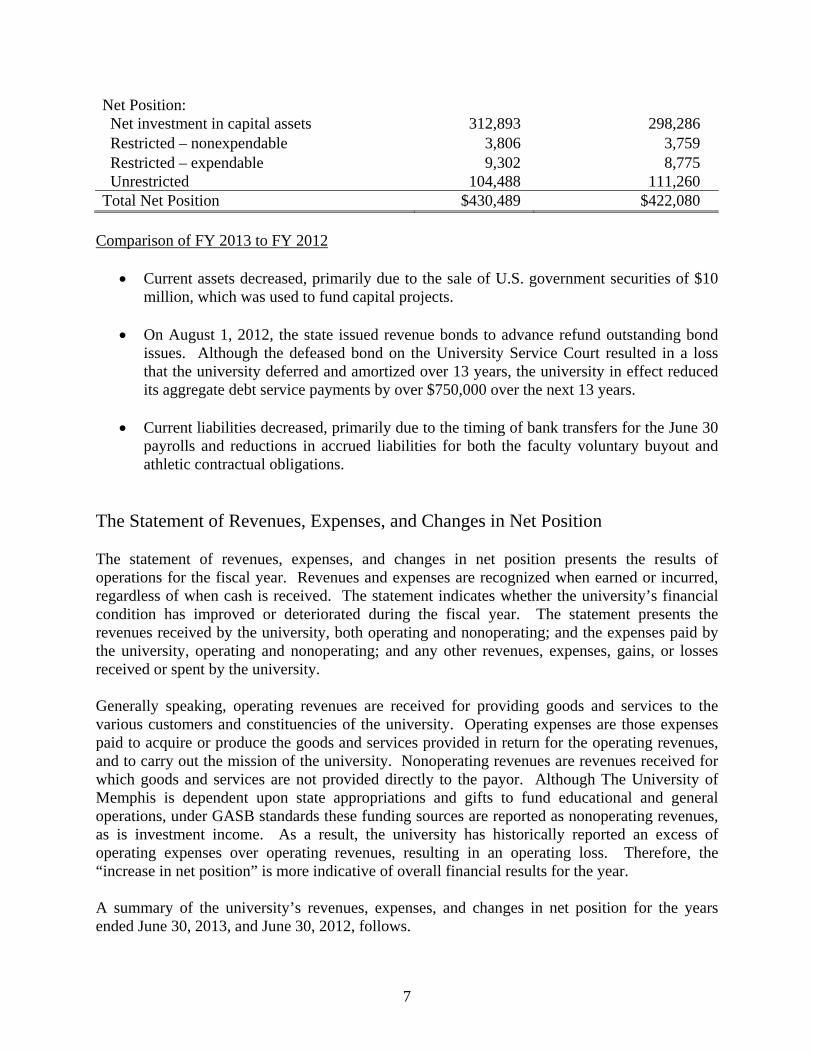
Net Position: Net investment in capital assets 312,893 298,286 Restricted – nonexpendable 3,806 3,759 Restricted – expendable 9,302 8,775 Unrestricted 104,488 111,260 Total Net Position $430,489 $422,080
Comparison of FY 2013 to FY 2012
Current assets decreased, primarily due to the sale of U.S. government securities of $10 million, which was used to fund capital projects.
On August 1, 2012, the state issued revenue bonds to advance refund outstanding bond issues. Although the defeased bond on the University Service Court resulted in a loss that the university deferred and amortized over 13 years, the university in effect reduced its aggregate debt service payments by over $750,000 over the next 13 years.
Current liabilities decreased, primarily due to the timing of bank transfers for the June 30 payrolls and reductions in accrued liabilities for both the faculty voluntary buyout and athletic contractual obligations.
The Statement of Revenues, Expenses, and Changes in Net Position The statement of revenues, expenses, and changes in net position presents the results of operations for the fiscal year. Revenues and expenses are recognized when earned or incurred, regardless of when cash is received. The statement indicates whether the university’s financial condition has improved or deteriorated during the fiscal year. The statement presents the revenues received by the university, both operating and nonoperating; and the expenses paid by the university, operating and nonoperating; and any other revenues, expenses, gains, or losses received or spent by the university. Generally speaking, operating revenues are received for providing goods and services to the various customers and constituencies of the university. Operating expenses are those expenses paid to acquire or produce the goods and services provided in return for the operating revenues, and to carry out the mission of the university. Nonoperating revenues are revenues received for which goods and services are not provided directly to the payor. Although The University of Memphis is dependent upon state appropriations and gifts to fund educational and general operations, under GASB standards these funding sources are reported as nonoperating revenues, as is investment income. As a result, the university has historically reported an excess of operating expenses over operating revenues, resulting in an operating loss. Therefore, the “increase in net position” is more indicative of overall financial results for the year. A summary of the university’s revenues, expenses, and changes in net position for the years ended June 30, 2013, and June 30, 2012, follows.

8
Summary of Revenues, Expenses, and Changes in Net Position (in thousands of dollars)
2013 2012 Operating revenues $223,364 $219,851 Operating expenses 416,970 427,176 Operating loss (193,606) (207,325) Nonoperating revenues and expenses 182,587 190,146 Loss before other revenues, expenses, gains, or losses (11,019) (17,179) Other revenues, expenses, gains, or losses 19,428 37,594 Increase in net position 8,409 20,415 Net position at beginning of year 422,080 404,065 Prior period adjustment - (2,400) Net position at end of year $430,489 $422,080
Operating Revenues The following summarizes the operating revenues by source that were used to fund operating activities for the last two fiscal years:
Comparison of FY 2013 to FY 2012
Tuition revenues increased by $7.6 million, primarily due to an 8.2% increase in student fees.
59%
17%
14%10%
2013
Tuition and Fees
Grants and Contracts
Sales and Services
Auxiliaries
57%
19%
14%10%
2012

9
Grants and contracts revenue decreased by $4.6 million, primarily due to a reduction in federally funded grants.
Operating Expenses Operating expenses may be reported by nature or function. The university has chosen to report the expenses in its natural classification on the statement of revenues, expenses, and changes in net position and has displayed the functional classification in the notes to the financial statements. The following summarizes the operating expenses by natural classifications for the last two fiscal years:
Comparison of FY 2013 to FY 2012
Salary and wages increased, primarily due to a 2.5% across-the-board pay raise effective July 1, 2012.
Benefits increased and scholarships expense decreased by $13.5 million, due to the reclassification of tuition remissions for graduate assistants from scholarships to benefits.
Depreciation expense decreased by $10 million, due to the removal of periodicals as a capitalized asset in FY 2012, which resulted in a corresponding increase in depreciation expense of $10.9 million that year.
Nonoperating Revenues and Expenses Certain revenue sources that the university relies on to provide funding for operations, including state noncapital appropriations, certain gifts and grants, and investment income, are defined by the GASB as nonoperating. Nonoperating expenses include capital financing costs and other costs related to capital assets. The following summarizes the university’s nonoperating revenues and expenses for the last two fiscal years:
45%
17%
23%
10%5%
2013
Salaries and wages
Benefits
Utilities, Supplies,and Other Services
Scholarships andFellowships
Depreciation
43%
13%
24%
13%
7%
2012
10
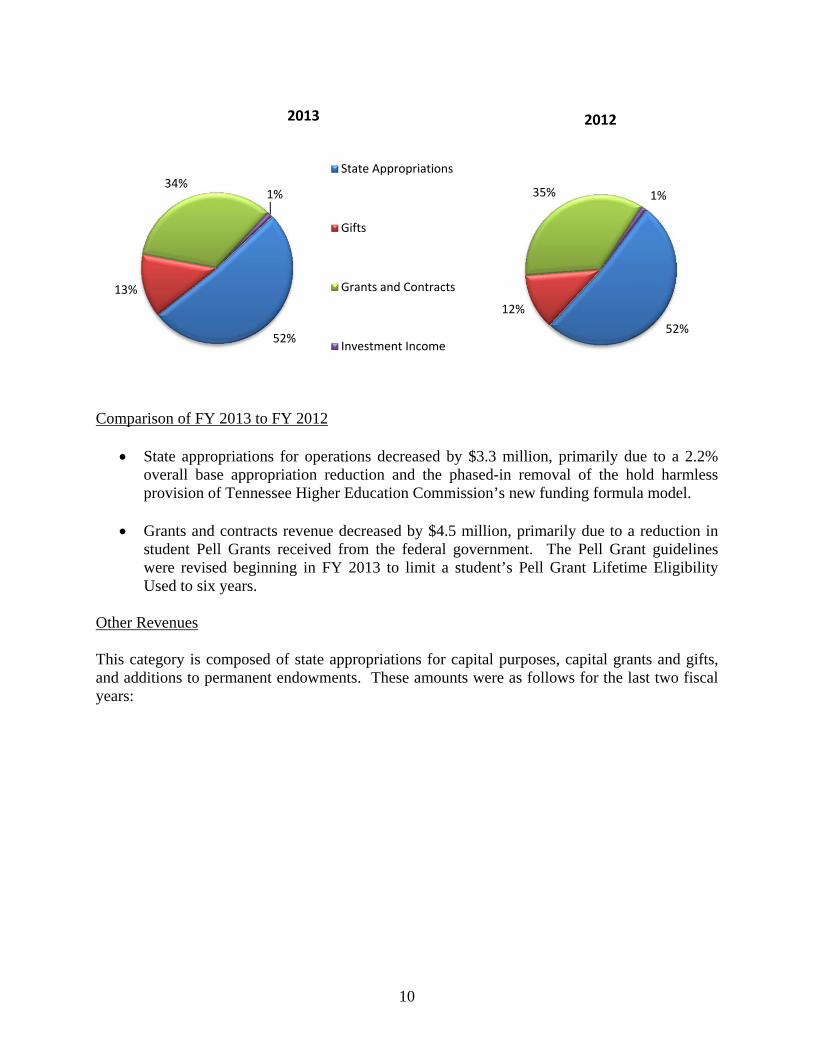
Comparison of FY 2013 to FY 2012
State appropriations for operations decreased by $3.3 million, primarily due to a 2.2% overall base appropriation reduction and the phased-in removal of the hold harmless provision of Tennessee Higher Education Commission’s new funding formula model.
Grants and contracts revenue decreased by $4.5 million, primarily due to a reduction in student Pell Grants received from the federal government. The Pell Grant guidelines were revised beginning in FY 2013 to limit a student’s Pell Grant Lifetime Eligibility Used to six years.
Other Revenues This category is composed of state appropriations for capital purposes, capital grants and gifts, and additions to permanent endowments. These amounts were as follows for the last two fiscal years:
52%
13%
34%1%
2013
State Appropriations
Gifts
Grants and Contracts
Investment Income
52%
12%
35% 1%
2012
11
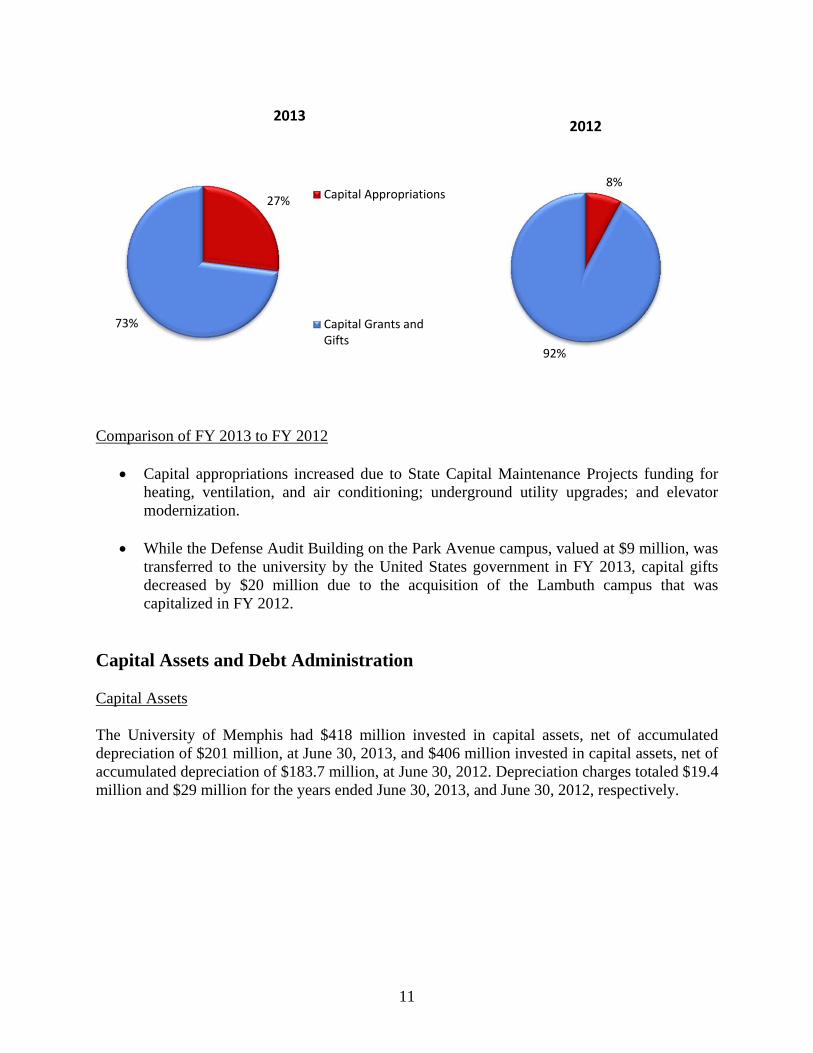
Comparison of FY 2013 to FY 2012
Capital appropriations increased due to State Capital Maintenance Projects funding for heating, ventilation, and air conditioning; underground utility upgrades; and elevator modernization.
While the Defense Audit Building on the Park Avenue campus, valued at $9 million, was transferred to the university by the United States government in FY 2013, capital gifts decreased by $20 million due to the acquisition of the Lambuth campus that was capitalized in FY 2012.
Capital Assets and Debt Administration Capital Assets The University of Memphis had $418 million invested in capital assets, net of accumulated depreciation of $201 million, at June 30, 2013, and $406 million invested in capital assets, net of accumulated depreciation of $183.7 million, at June 30, 2012. Depreciation charges totaled $19.4 million and $29 million for the years ended June 30, 2013, and June 30, 2012, respectively.
27%
73%
2013
Capital Appropriations
Capital Grants andGifts
8%
92%
2012

12
Schedule of Capital Assets, Net of Depreciation (in thousands of dollars)
2013 2012 Land $ 18,575 $ 18,487 Land improvements and infrastructure 51,287 49,417 Buildings 299,147 296,891 Equipment 15,393 14,719 Library holdings 6,664 6,997 Intangible assets 4,378 5,119 Projects in progress 22,454 14,312 Total $417,898 $405,942
Significant additions to capital assets occurred in FY 2013. These additions were from the acquisition of the Defense Audit Building located on the Park Avenue campus; the construction in progress of the Community Health Facility and a new student housing facility; and various HVAC, roof replacement, and elevator modernization projects. At June 30, 2013, outstanding commitments under construction contracts totaled $14 million for various renovations and repairs of buildings and infrastructure, as well as new building construction. Future state capital outlay appropriations will fund $5.2 million of these costs. More detailed information about the university’s capital assets is presented in Note 5 to the financial statements. Debt The university had $105.2 million and $107.6 million in debt outstanding at June 30, 2013, and June 30, 2012, respectively. The table below summarizes these amounts by type of debt instrument.
Outstanding Debt (in thousands of dollars)
2013 2012
TSSBA bonds payable $ 96,420 $100,507 TSSBA commercial paper payable 2,684 88 GO commercial paper 4,085 4,271 Capital lease 2,047 2,790 Total $105,236 $107,656
The Tennessee State School Bond Authority (TSSBA) issued bonds with interest rates ranging from 0.18% to 5.63% due 2040 on behalf of The University of Memphis. The university is
13
responsible for the debt service of these bonds. The current portion of the $96.4 million outstanding at June 30, 2013, is $4 million. The TSSBA issued commercial paper with variable interest rates on behalf of The University of Memphis. The university is responsible for the debt service of these obligations. The outstanding amount at June 30, 2013, is $2.7 million. The Tennessee State Funding Board issued general obligation commercial paper with variable interest rates on behalf of The University of Memphis. The university is responsible for the debt service of these obligations. The outstanding amount at June 30, 2013, is $4.1 million. The university has a capital lease agreement for the campuswide data network equipment and services. This agreement has an imputed interest rate of 5.517% due December 31, 2015. The current portion of the $2 million outstanding at June 30, 2013, is $785,299. The ratings on debt issued by the TSSBA at June 30, 2013, were as follows:
Fitch AA+ Moody’s Investor Service Aa1 Standard & Poor’s AA
More information about the university’s long-term liabilities is presented in Note 8 to the financial statements. Economic Factors That Will Affect the Future Despite relatively modest economic growth, the state has been able to make up additional ground previously lost over the course of the recession. The July 2013 collections of the Tennessee Department of Revenue revealed a 4.4% increase from July 2012 collections. Even though the state’s revenue collections continue on a gradual upward trend in the midst of a still-uncertain economic recovery in Tennessee, the impact this will have on future higher education funding both in operating appropriation and future building projects is not clear. For the sixth consecutive year, the university’s base state appropriations will be reduced. The impact of the reduction for FY 2014 is $737,300, or 0.9%, from the previous year. Since FY 2008, the university has sustained a cumulative state appropriation reduction of $44.3 million, or 36%, by FY 2014. However, in his 2013 State of the State address, the Governor reiterated his commitment to making significant progress in education. He revealed “Drive to 55,” a strategic initiative to increase the percentage of Tennesseans who have earned an associate’s degree or higher from 32% to 55% by 2025. The expectation is that higher education will be a prime area of focus during the upcoming legislative session, with an emphasis on the financial burden of higher education on students. To compensate for the reduction in state appropriations, the university will utilize FY 2013 operating carry forward funds to transition to reduced state appropriations, in accordance with
14
the university’s financial plan, which includes budget reductions, restructuring, and position attritions. The university has implemented a 6.0% increase in student fees for FY 2014, which will provide funding for faculty merit and equity, tenure track faculty promotions, student retention efforts, and scholarship costs associated with tuition increases. We continue to remain cognizant of the impact future tuition increases may have on our students and are striving to minimize tuition increases to the greatest extent possible. In July 2013, Interim President R. Brad Martin began his leadership role at The University of Memphis. He has outlined several key initiatives, which include a strategic review of the university’s organization and operations to improve effectiveness and efficiency, in addition to a commitment to build actionable plans to increase enrollment by 1,000 students for 2014-15 and by 1,000 students for 2015-16. The university’s continued focus on the development of online courses and the expansion of course offerings at The University of Memphis’ Lambuth campus provide a significant opportunity for enrollment and revenue growth. We are not aware of any other factors, decisions, or conditions that are expected to have a significant impact on the financial position or results of operation during this fiscal year. Requests for Information This financial report is designed to provide a general overview of the institution’s finances for all those with an interest in the university’s finances. Questions concerning any of the information provided in this report or requests for additional financial information should be directed to Libby Shelton, Controller; Administration Building, Room 275, Memphis, Tennessee 38152.

15
ASSETSCurrent assets: Cash (Notes 2 and 21) 39,397,710.80$ 684,874.00$ Short-term investments (Note 3) 20,659,822.50 - Accounts, notes, and grants receivable (net) (Note 4) 17,567,239.14 - Due from component unit 10,271,206.00 - Pledges receivable (net) (Note 21) - 3,708,957.00 Inventories 593,825.75 - Prepaid expenses 295,456.27 - Accrued interest receivable 555,614.80 23,580.00 Total current assets 89,340,875.26 4,417,411.00 Noncurrent assets: Cash (Note 2) 74,022,878.26 - Investments (Notes 3 and 21) 19,019,545.60 114,682,570.00 Accounts, notes, and grants receivable (net) (Note 4) 4,419,582.60 - Pledges receivable (net) (Note 21) - 10,211,809.00 Capital assets (net) (Note 5) 417,898,190.74 - Other assets 2,500.00 778,265.00 Total noncurrent assets 515,362,697.20 125,672,644.00 Total assets 604,703,572.46 130,090,055.00
DEFERRED OUTFLOWS OF RESOURCESDeferred loss on debt refunding (Note 8) 230,708.43 - Total deferred outflows of resources 230,708.43 -
LIABILITIESCurrent liabilities: Accounts payable (Note 6) 7,147,670.70 1,274,845.00 Accrued liabilities 16,517,679.56 163,085.00 Student deposits 1,378,390.45 - Unearned revenue 10,972,818.02 - Compensated absences (Note 8) 2,563,080.52 - Accrued interest payable 726,795.31 - Long-term liabilities, current portion (Note 8) 4,791,343.36 - Deposits held in custody for others 870,052.23 - Voluntary buyout program liability (Note 20) 1,077,190.11 - Due to university - 10,271,206.00 Total current liabilities 46,045,020.26 11,709,136.00 Noncurrent liabilities: Net OPEB obligation (Note 12) 15,808,236.38 - Compensated absences (Note 8) 7,053,916.38 - Long-term liabilities (Note 8) 100,444,501.12 - Due to grantors (Note 8) 4,419,582.60 - Voluntary buyout program liability (Note 20) 674,028.38 - Total noncurrent liabilities 128,400,264.86 - Total liabilities 174,445,285.12 11,709,136.00
NET POSITIONNet investment in capital assets 312,893,054.69 - Restricted for: Nonexpendable: Scholarships and fellowships 1,485,040.02 27,722,571.00 Instructional department uses - 19,611,107.00 Other 2,321,025.35 13,142,621.00 Expendable: Scholarships and fellowships (Note 9) 1,054,203.09 9,443,633.00 Research 1,758,203.14 5,493,100.00 Instructional department uses (Note 9) 2,387,988.83 12,886,934.00 Loans (Note 9) 2,752,629.77 - Capital projects 46,865.32 4,928,344.00 Debt service 8,884.66 - Other (Note 9) 1,293,108.85 16,764,423.00Unrestricted 104,487,992.05 8,388,186.00 Total net position 430,488,995.77$ 118,380,919.00$
The notes to the financial statements are an integral part of this statement.
University Component Unit
June 30, 2013
Tennessee Board of RegentsTHE UNIVERSITY OF MEMPHIS
Statement of Net Position

Tennesee Board of RegentsTHE UNIVERSITY OF MEMPHIS
Statement of Revenues, Expenses, and Changes in Net PositionFor the Year Ended June 30, 2013
REVENUES Operating revenues: Student tuition and fees (net of scholarship allowances of $49,625,319.36) 132,684,540.32$ -$ Gifts and contributions - 26,523,406.00 Governmental grants and contracts 31,509,077.73 - Nongovernmental grants and contracts 6,044,950.69 - Sales and services of educational activities 5,345,904.33 - Sales and services of other activities 25,184,089.96 - Auxiliary enterprises: Residential life (net of scholarship allowances of $286,902.45; all residential life revenues are used as security for revenue bonds; see Note 8) 15,108,189.28 - Bookstore 674,706.40 - Food service 1,018,378.46 - Other auxiliaries 5,612,220.21 - Interest earned on loans to students 182,262.20 - Total operating revenues 223,364,319.58 26,523,406.00
EXPENSES Operating expenses (Note 17): Salaries and wages 189,062,482.63 - Benefits 69,055,970.29 - Utilities, supplies, and other services 96,545,059.93 132,987.00 Scholarships and fellowships 42,931,670.25 - Depreciation expense 19,375,957.08 - Payments to or on behalf of The University of Memphis (Note 21) - 25,261,468.00 Total operating expenses 416,971,140.18 25,394,455.00 Operating income (loss) (193,606,820.60) 1,128,951.00
NONOPERATING REVENUES (EXPENSES) State appropriations 97,266,259.00 - Gifts 23,269,311.29 - Grants and contracts 64,375,338.06 - Investment income (net of investment expense of $38,112.98 for the university and $184,862.00 for the component unit) 2,178,911.38 9,424,247.00Interest on capital asset-related debt (4,201,215.68) - Other nonoperating revenues (expenses) (301,205.44) 1,060,101.00 Net nonoperating revenues 182,587,398.61 10,484,348.00 Income (loss) before other revenues, expenses, gains, or losses (11,019,421.99) 11,613,299.00 Capital appropriations 5,241,430.91 - Capital grants and gifts 14,149,011.91 - Additions to permanent endowments 37,684.44 3,292,915.00 Total other revenues 19,428,127.26 3,292,915.00 Increase in net position 8,408,705.27 14,906,214.00
NET POSITION Net position - beginning of year 422,080,290.50 103,474,705.00Net position - end of year 430,488,995.77$ 118,380,919.00$
The notes to the financial statements are an integral part of this statement.
University Component Unit
16
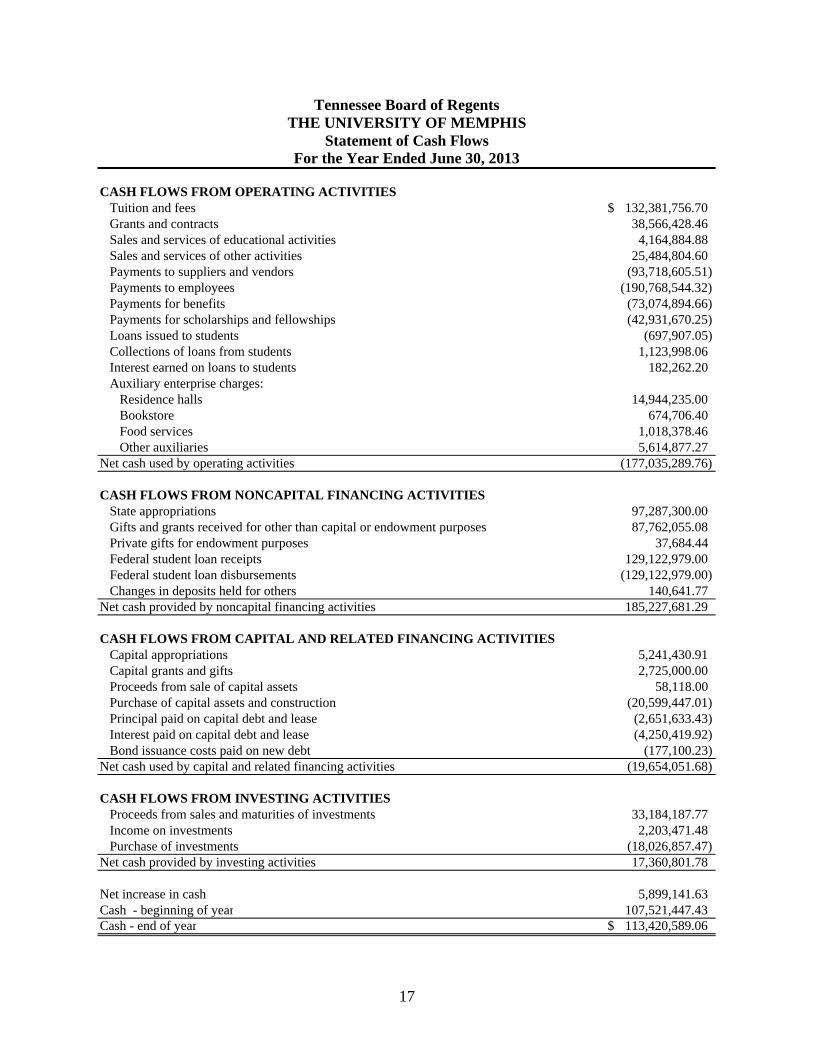
17
CASH FLOWS FROM OPERATING ACTIVITIES Tuition and fees 132,381,756.70$ Grants and contracts 38,566,428.46 Sales and services of educational activities 4,164,884.88 Sales and services of other activities 25,484,804.60 Payments to suppliers and vendors (93,718,605.51) Payments to employees (190,768,544.32) Payments for benefits (73,074,894.66) Payments for scholarships and fellowships (42,931,670.25) Loans issued to students (697,907.05) Collections of loans from students 1,123,998.06 Interest earned on loans to students 182,262.20 Auxiliary enterprise charges: Residence halls 14,944,235.00 Bookstore 674,706.40 Food services 1,018,378.46 Other auxiliaries 5,614,877.27 Net cash used by operating activities (177,035,289.76)
CASH FLOWS FROM NONCAPITAL FINANCING ACTIVITIES State appropriations 97,287,300.00 Gifts and grants received for other than capital or endowment purposes 87,762,055.08 Private gifts for endowment purposes 37,684.44 Federal student loan receipts 129,122,979.00 Federal student loan disbursements (129,122,979.00) Changes in deposits held for others 140,641.77 Net cash provided by noncapital financing activities 185,227,681.29
CASH FLOWS FROM CAPITAL AND RELATED FINANCING ACTIVITIES Capital appropriations 5,241,430.91 Capital grants and gifts 2,725,000.00 Proceeds from sale of capital assets 58,118.00 Purchase of capital assets and construction (20,599,447.01) Principal paid on capital debt and lease (2,651,633.43) Interest paid on capital debt and lease (4,250,419.92) Bond issuance costs paid on new debt (177,100.23) Net cash used by capital and related financing activities (19,654,051.68)
CASH FLOWS FROM INVESTING ACTIVITIES Proceeds from sales and maturities of investments 33,184,187.77 Income on investments 2,203,471.48 Purchase of investments (18,026,857.47) Net cash provided by investing activities 17,360,801.78
Net increase in cash 5,899,141.63 Cash - beginning of year 107,521,447.43 Cash - end of year 113,420,589.06$
Tennessee Board of RegentsTHE UNIVERSITY OF MEMPHIS
Statement of Cash FlowsFor the Year Ended June 30, 2013

18
Reconciliation of operating loss to net cash used by operating activities:Operating loss (193,606,820.60)$ Adjustments to reconcile operating loss to net cash used by operating activities: Depreciation expense 19,375,957.08 Other adjustments (Note 19) 167,959.00 Change in assets, liabilities, and deferrals: Receivables, net 4,195,940.25 Inventories (2,765.78) Prepaid expenses 9,909.92 Accounts payable (5,625,048.77) Accrued liabilities (1,881,463.61) Unearned revenue (1,133,672.42) Deposits 185,473.41 Compensated absences 181,400.87 Other 1,097,840.89 Net cash used by operating activities (177,035,289.76)$
Noncash investing, capital, and financing activities Gifts in-kind - capital 11,424,011.91$ Loss on disposal of capital assets (138,442.79)$
The notes to the financial statements are an integral part of this statement.
THE UNIVERSITY OF MEMPHISTennessee Board of Regents
Statement of Cash Flows (Continued)For the Year Ended June 30, 2013
Tennessee Board of Regents THE UNIVERSITY OF MEMPHIS
Notes to the Financial Statements June 30, 2013
19
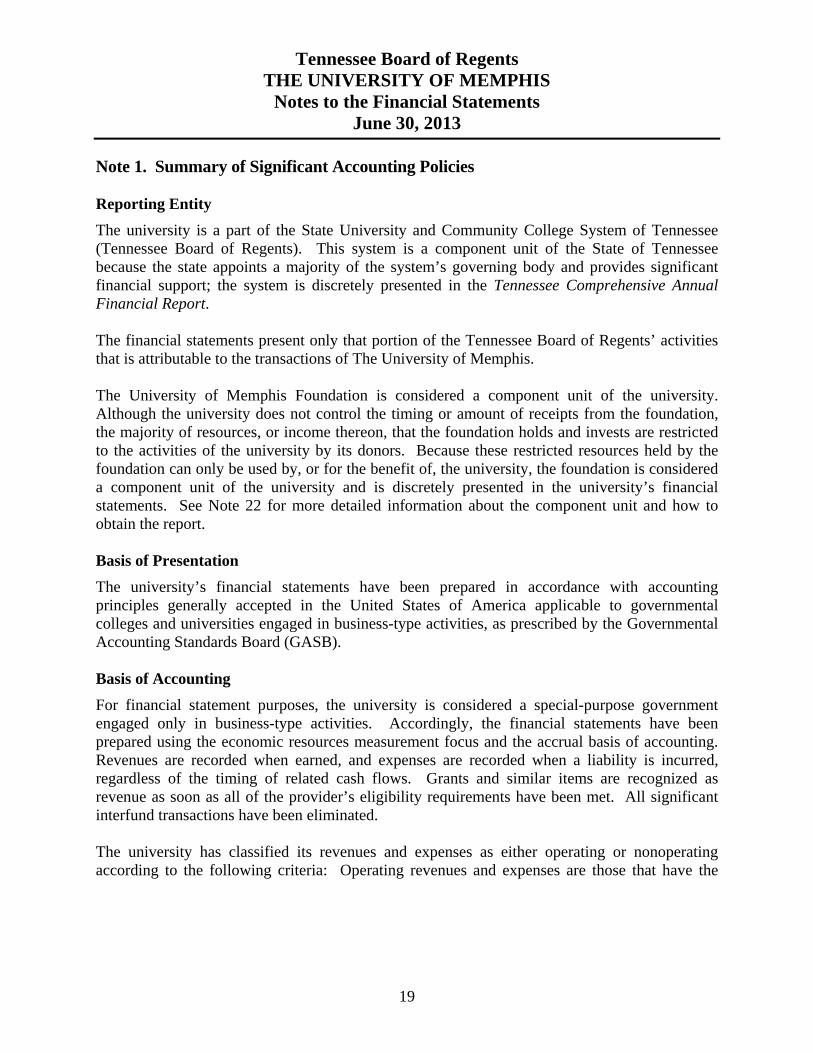
Note 1. Summary of Significant Accounting Policies Reporting Entity
The university is a part of the State University and Community College System of Tennessee (Tennessee Board of Regents). This system is a component unit of the State of Tennessee because the state appoints a majority of the system’s governing body and provides significant financial support; the system is discretely presented in the Tennessee Comprehensive Annual Financial Report. The financial statements present only that portion of the Tennessee Board of Regents’ activities that is attributable to the transactions of The University of Memphis. The University of Memphis Foundation is considered a component unit of the university. Although the university does not control the timing or amount of receipts from the foundation, the majority of resources, or income thereon, that the foundation holds and invests are restricted to the activities of the university by its donors. Because these restricted resources held by the foundation can only be used by, or for the benefit of, the university, the foundation is considered a component unit of the university and is discretely presented in the university’s financial statements. See Note 22 for more detailed information about the component unit and how to obtain the report. Basis of Presentation
The university’s financial statements have been prepared in accordance with accounting principles generally accepted in the United States of America applicable to governmental colleges and universities engaged in business-type activities, as prescribed by the Governmental Accounting Standards Board (GASB).
Basis of Accounting
For financial statement purposes, the university is considered a special-purpose government engaged only in business-type activities. Accordingly, the financial statements have been prepared using the economic resources measurement focus and the accrual basis of accounting. Revenues are recorded when earned, and expenses are recorded when a liability is incurred, regardless of the timing of related cash flows. Grants and similar items are recognized as revenue as soon as all of the provider’s eligibility requirements have been met. All significant interfund transactions have been eliminated. The university has classified its revenues and expenses as either operating or nonoperating according to the following criteria: Operating revenues and expenses are those that have the

Notes to the Financial Statements (Continued)
20
characteristics of exchange transactions. Operating revenues include (1) tuition and fees, net of scholarship discounts and allowances; (2) certain federal, state, local, and private grants and contracts; (3) sales and services of auxiliary enterprises; and (4) interest on institutional loans. Operating expenses include (1) salaries and wages; (2) employee benefits; (3) utilities, supplies, and other services; (4) scholarships and fellowships; and (5) depreciation. Nonoperating revenues and expenses include activities that have the characteristics of nonexchange transactions, such as gifts and contributions, and other activities that are defined as nonoperating by GASB Statement 9, Reporting Cash Flows of Proprietary and Nonexpendable Trust Funds and Governmental Entities that Use Proprietary Fund Accounting, and GASB Statement 34, such as state appropriations and investment income. When both restricted and unrestricted resources are available for use, it is the university’s policy to determine which to use first, depending upon existing facts and circumstances. Inventories
Inventories are valued at the lower of cost or market and are maintained on an average cost or first-in, first-out basis. Compensated Absences
The university’s employees accrue annual and sick leave at varying rates, depending on length of service or classification. Some employees also earn compensatory time. The amount of the liabilities for annual leave and compensatory time and their related benefits are reported in the statement of net position. There is no liability for unpaid accumulated sick leave since the university’s policy is to pay this only if the employee dies or is absent because of illness, injury, or related family death. Capital Assets
Capital assets, which include property, plant, equipment, library holdings, and intangible assets, are reported in the statement of net position at historical cost or at fair value at date of donation, less accumulated depreciation/amortization. The costs of normal maintenance and repairs that do not add to the value of the asset or materially extend the asset’s useful life are not capitalized. A capitalization threshold of $100,000 is used for buildings, and $50,000 is used for infrastructure. Equipment is capitalized when the unit acquisition cost is $5,000 or greater. The capitalization threshold for additions and improvements to buildings and land is set at $50,000. The capitalization threshold for intangible assets is set at $100,000. These assets, with the exception of land, are depreciated/amortized using the straight-line method over the estimated useful lives, which range from 5 to 40 years.
Notes to the Financial Statements (Continued)
21
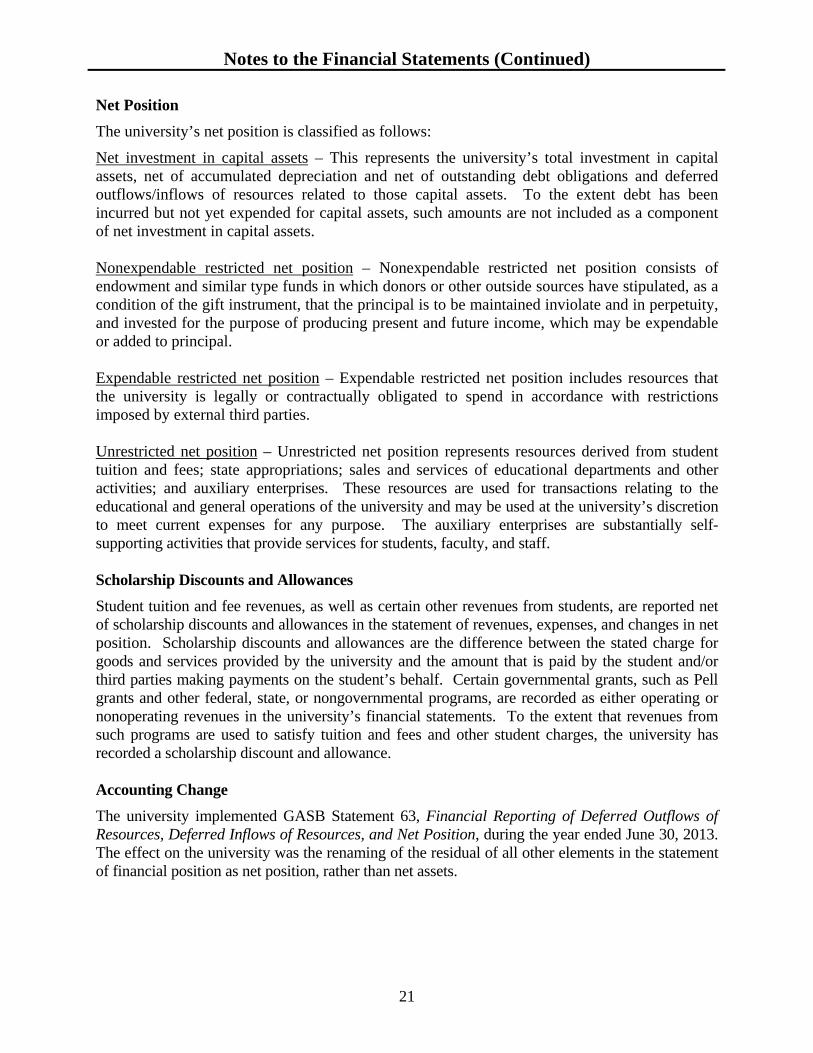
Net Position
The university’s net position is classified as follows:
Net investment in capital assets – This represents the university’s total investment in capital assets, net of accumulated depreciation and net of outstanding debt obligations and deferred outflows/inflows of resources related to those capital assets. To the extent debt has been incurred but not yet expended for capital assets, such amounts are not included as a component of net investment in capital assets. Nonexpendable restricted net position – Nonexpendable restricted net position consists of endowment and similar type funds in which donors or other outside sources have stipulated, as a condition of the gift instrument, that the principal is to be maintained inviolate and in perpetuity, and invested for the purpose of producing present and future income, which may be expendable or added to principal. Expendable restricted net position – Expendable restricted net position includes resources that the university is legally or contractually obligated to spend in accordance with restrictions imposed by external third parties. Unrestricted net position – Unrestricted net position represents resources derived from student tuition and fees; state appropriations; sales and services of educational departments and other activities; and auxiliary enterprises. These resources are used for transactions relating to the educational and general operations of the university and may be used at the university’s discretion to meet current expenses for any purpose. The auxiliary enterprises are substantially self-supporting activities that provide services for students, faculty, and staff. Scholarship Discounts and Allowances
Student tuition and fee revenues, as well as certain other revenues from students, are reported net of scholarship discounts and allowances in the statement of revenues, expenses, and changes in net position. Scholarship discounts and allowances are the difference between the stated charge for goods and services provided by the university and the amount that is paid by the student and/or third parties making payments on the student’s behalf. Certain governmental grants, such as Pell grants and other federal, state, or nongovernmental programs, are recorded as either operating or nonoperating revenues in the university’s financial statements. To the extent that revenues from such programs are used to satisfy tuition and fees and other student charges, the university has recorded a scholarship discount and allowance. Accounting Change
The university implemented GASB Statement 63, Financial Reporting of Deferred Outflows of Resources, Deferred Inflows of Resources, and Net Position, during the year ended June 30, 2013. The effect on the university was the renaming of the residual of all other elements in the statement of financial position as net position, rather than net assets.
Notes to the Financial Statements (Continued)
22
Early Implementation of Accounting Pronouncement
In March 2012, GASB issued Statement No. 65, Items Previously Reported as Assets and Liabilities. This statement establishes accounting and financial reporting standards that reclassify, as deferred outflows of resources or deferred inflows of resources, certain items that were previously reported as assets and liabilities; it also recognizes, as outflows of resources or inflows of resources, certain items that were previously reported as assets and liabilities. The provisions of this statement are effective for financial statements for periods beginning after December 15, 2012. However, the university has elected to implement the provisions of this statement for fiscal year 2013. Note 2. Cash
This classification includes demand deposits and petty cash on hand. At June 30, 2013, cash consisted of $10,506,575.01 in bank accounts; $50,920.00 of petty cash on hand; $96,783,423.04 in the State of Tennessee Local Government Investment Pool (LGIP) administered by the State Treasurer; and $6,079,671.01 in LGIP deposits for capital projects. The university has deposits in the LGIP, which is administered by the State Treasurer. The LGIP is part of the State Pooled Investment Fund. The fund’s required risk disclosures are presented in the State of Tennessee’s Treasurer’s Report. That report is available on the state’s website at www.treasury.tn.gov. LGIP deposits for capital projects – Payments related to the university’s capital projects are made by the State of Tennessee’s Department of Finance and Administration. The university’s estimated local share of the cost of each project is held in a separate LGIP account. As expenses are incurred, the Tennessee Board of Regents withdraws funds from the LGIP account and transfers them to the Department of Finance and Administration. The funds in the account are not available to the university for any other purpose until the project is completed and the Tennessee Board of Regents releases any remaining funds. Note 3. Investments All investments permitted to be reported at fair value under GASB Statement 31, Accounting and Financial Reporting for Certain Investments and External Investment Pools, as amended, are reported at fair value, including those with a maturity date of one year or less at the time of purchase. At June 20, 2013, the university had the following investments and maturities:

Notes to the Financial Statements (Continued)
23
Interest Rate Risk
Interest rate risk is the risk that changes in interest rates will adversely affect the fair value of a debt investment. The university does not have a formal investment policy that limits investment maturities as a means of managing its exposure to fair value losses arising from increasing interest rates. Credit Risk
Credit risk is the risk that an issuer or other counterparty to an investment will not fulfill its obligations. The university is authorized by statute to invest funds in accordance with Tennessee Board of Regents policies. Under the current policy, funds other than endowments may be invested only in obligations of the United States or its agencies backed by the full faith and credit of the United States; repurchase agreements for United States securities; certificates of deposit in banks and savings and loan associations; bankers’ acceptances; commercial paper; money market mutual funds; and the State of Tennessee Local Government Investment Pool. The policy requires that investments of endowments in equity securities be limited to funds from private gifts or other sources external to the university and that endowment investments be prudently diversified. Securities are rated by Standard and Poor’s, Moody’s Investors Service, and/or Fitch Ratings and are presented below using the Standard and Poor’s rating scale. Tennessee Board of Regents policy restricts investments in bankers’ acceptances and commercial paper. The policy requires that prime bankers’ acceptances must be issued by domestic banks with a minimum AA rating or foreign banks with a AAA long-term debt rating by a majority of the ratings services that have rated the issuer. Prime bankers’ acceptances are required to be eligible for purchase by the Federal Reserve System. To be eligible, the original maturity must not be more than 270 days, and it must 1) arise out of the current shipment of goods between countries or with the United States, or 2) arise out of storage within the United States of goods that are under contract of sale or are expected to move into the channel of trade within a reasonable time and that are secured throughout their life by a warehouse receipt or similar document conveying title to the underlying goods. The policy requires that prime commercial paper shall be limited to that of corporations that meet the following criteria: 1) Senior long-term debt, if any, should have a minimum rating of A1 or equivalent, and short-term debt should have a minimum rating of A1 or equivalent, as provided by a majority of the rating services that rate the issuer. If there is no long-term debt rating, the short-term debt rating must be A1 by all rating services (minimum of two). 2) The
Investment Maturities (in Years)
Investment Type
Fair Value
Less than 1
1 to 5 U.S. Treasury notes $38,729,510.60 $19,709,965.00 $19,019,545.60 Commercial paper 749,857.50 749,857.50 - Certificates of deposit 200,000.00 - 200,000.00 Total investments $39,679,368.10 $ 20,459,822.50 $ 19,219,545.60

Notes to the Financial Statements (Continued)
24
rating should be based on the merits of the issuer or guarantee by a nonbank. 3) A financial review should be made to ascertain the issuer’s financial strength to cover the debt. 4) Commercial paper of a banking institution should not be purchased. Prime commercial paper shall not have a maturity that exceeds 270 days. At June 30, 2013, the university’s investments were rated as follows:
Note 4. Receivables Receivables at June 30, 2013, included the following: Student accounts receivable $ 11,461,597.19 Grants receivable 10,099,625.81 Notes receivable 1,040,556.40 Other receivables 6,572,585.06 Subtotal 29,174,364.46 Less allowance for doubtful accounts (11,111,008.48) Total receivables $18,063,355.98
Federal Perkins Loan Program funds at June 30, 2013, included the following: Perkins loans receivable $4,451,989.77 Less allowance for doubtful accounts (528,524.01) Total $3,923,465.76
Credit Quality Rating Investment Type Fair Value A+ Unrated
LGIP $102,863,094.05 $ - $102,863,094.05Commercial paper 749,857.50 749,857.50 - Total $103,612,951.55 $749,857.50 $102,863,094.05

Notes to the Financial Statements (Continued)
25
Note 5. Capital Assets Capital asset activity for the year ended June 30, 2013, was as follows:
Beginning Balance Additions Transfers Reductions
Ending Balance
Land $ 18,486,551.93 $ 88,264.00 $ - $ - $ 18,574,815.93 Land improvements and infrastructure
71,805,304.00
2,943,375.41
2,847,913.06
-
77,596,592.47
Buildings 424,988,684.43 9,483,574.84 2,848,251.13 - 437,320,510.40 Equipment 37,200,765.11 3,621,170.11 - 1,188,304.10 39,633,631.12 Library holdings 13,907,651.50 1,321,382.04 - 971,021.04 14,258,012.50 Intangible assets: Easement 1,200,000.00 - - - 1,200,000.00 Software 7,818,675.37 156,440.35 - - 7,975,115.72 Projects in progress 14,312,427.39 13,838,180.32 (5,696,164.19) - 22,454,443.52 Total 589,720,059.73 31,452,387.07 - 2,159,325.14 619,013,121.66 Less accumulated depreciation/amortization Land improvements and infrastructure
22,388,405.07
3,921,570.64
-
-
26,309,975.71
Buildings 128,097,885.76 10,075,767.58 - - 138,173,653.34 Equipment 22,481,564.98 2,826,721.43 - 1,067,538.97 24,240,747.44 Library holdings 6,910,165.77 1,654,592.35 - 971,021.04 7,593,737.08 Intangible assets: Software 3,899,512.27 897,305.08 - - 4,796,817.35 Total 183,777,533.85 19,375,957.08 - 2,038,560.01 201,114,930.92 Capital assets, net $405,942,525.88 $ 12,076,429.99 $ - $ 120,765.13 $ 417,898,190.74
Note 6. Accounts Payable Accounts payable at June 30, 2013, included the following: Vendors payable $4,029,615.99Construction projects payments 152,901.24Other payables 2,965,153.47 Total accounts payables $7,147,670.70
Notes to the Financial Statements (Continued)
26
Note 7. Capital Leases The university has capital lease agreements for the campuswide data network equipment and services. These agreements have beginning and ending dates ranging from January 1, 2011, to December 31, 2015, with an imputed interest rate of 5.517%. This lease agreement includes a purchase option at the end of the initial term or any renewal term to purchase all or part of the equipment for $1.00, with any accrued but unpaid late charges. If a written notice to purchase or surrender the equipment is not submitted at least 90 days before the end of the initial term, the lease will automatically renew for an additional three-month term and will thereafter renew for a successive one-month term until the equipment is delivered or purchased. During such renewals the amount of each rental payment remains the same.
Asset balances were $2,047,794.14 at June 30, 2013, net of accumulated depreciation of $2,047,794.15. The following is a schedule by years of future minimum lease payments under capital leases, together with the present value of the net minimum lease payment at June 30, 2013:
Year Ending June 30 2014 $ 878,591.28 2015 878,591.28 2016 439,295.64
Total minimum lease payments 2,196,478.20 Less amount representing interest (149,130.32)
Present value of net minimum lease payments $2,047,347.88 Note 8. Long-term Liabilities Long-term liabilities activity of the year ended June 30, 2013, was as follows:
Beginning Balance Additions Reductions
Ending Balance
Current Portion
Payables: TSSBA debt: Bonds $ 96,493,193.46 $ 5,343,791.00 $ 9,582,529.47 $ 92,254,454.99 $ 4,006,044.46 Unamortized bond premium
4,014,464.73
432,585.02
281,776.77
4,165,272.98
-
Commercial paper
87,868.89
2,596,224.79
-
2,684,093.68
-
General obligation debt:
Commercial paper
4,270,653.20
156,555.75
342,534.00
4,084,674.95
-
Capital lease obligations 2,790,589.20 - 743,241.32 2,047,347.88 785,298.90
Subtotal 107,656,769.48 8,529,156.56 10,950,081.56 105,235,844.48 4,791,343.36

Notes to the Financial Statements (Continued)
27
Other liabilities: Compensated absences
9,435,596.03
5,470,749.17
5,289,348.30
9,616,996.90
2,563,080.52
Due to grantor 4,375,802.18 84,657.00 40,876.58 4,419,582.60 - Subtotal 13,811,398.21 5,555,406.17 5,330,224.88 14,036,579.50 2,563,080.52 Total long-term liabilities
$121,468,167.69
$14,084,562.73
$16,280,306.44
$119,272,423.98
$7,354,423.88
TSSBA Debt – Bonds
Bonds, with interest rates ranging from 0.18% to 5.63%, were issued by the Tennessee State School Bond Authority (TSSBA). The bonds are due serially to 2040 and are secured by pledges of the facilities’ revenues to which they relate and certain other revenues and fees of the university, including state appropriations; see Note 10 for further details. The bonded indebtedness with the Tennessee State School Bond Authority included in long-term liabilities on the statement of net position is shown net of assets held by the authority in the debt service reserve and unexpended debt proceeds. The reserve amount was $4,750,591.97 at June 30, 2013. Debt service requirements to maturity for the university’s portion of TSSBA bonds at June 30, 2013, are as follows:
Year Ending June 30 Principal Interest Total
2014 $ 4,006,044.46 $ 4,354,129.60 $ 8,360,174.062015 4,070,992.36 4,204,165.95 8,275,158.312016 4,249,113.05 4,027,405.95 8,276,519.002017 4,445,477.15 3,831,933.16 8,277,410.312018 4,639,359.22 3,649,248.00 8,288,607.22
2019 – 2023 25,039,106.75 14,903,358.55 39,942,465.302024 – 2028 26,400,705.00 8,922,892.01 35,323,597.012029 – 2033 11,153,476.00 3,363,914.69 14,517,390.692034 – 2038 6,890,021.00 1,409,332.84 8,299,353.842039 – 2040 1,360,160.00 170,920.00 1,531,080.00
Total
$ 92,254,454.99
$ 48,837,300.75
$ 141,091,755.74
TSSBA Debt – Commercial Paper
The Tennessee State School Bond Authority (TSSBA) issues commercial paper to finance the costs of various capital projects during the construction phase. When projects are placed in service, TSSBA issues long-term, fixed-rate debt to finance the project over its useful payback period and redeems the commercial paper. The amount issued for projects at the university was $2,684,093.68 at June 30, 2013. For the commercial paper program, TSSBA maintains an interest rate reserve fund. The university contributes amounts to the reserve fund based on the amounts drawn. The principal of the reserve

Notes to the Financial Statements (Continued)
28
will be contributed to pay off notes or will be credited back to the university when the notes are converted to bonds. The interest earned on the reserve is used to pay interest due during the month. More detailed information regarding the bonds and commercial paper can be found in the notes to the financial statements in the financial report for the Tennessee State School Bond Authority. That report is available on the state’s website at www.comptroller.tn.gov/tssba/cafr.asp. General Obligation Debt – Commercial Paper
The Tennessee State Funding Board issues commercial paper for the purpose of, among other things, acquisition of certain sites and existing structures for TBR expansion purposes on behalf of the university. The amount outstanding for projects at the university was $4,084,674.95 at June 30, 2013. More detailed information regarding the commercial paper can be found in the notes to the financial statements in the Tennessee Comprehensive Annual Financial Report, which is available on the state’s website at www.tn.gov/finance/act/cafr.shtml. Refunding of Debt
On August 1, 2012, the state issued $5,343,791.00 in revenue bonds, with an average interest rate of 4.21%, to advance refund $5,536,955.46 of outstanding 1998D, 2004A, and 2005B Series bonds with an average interest rate of 4.42%. The net proceeds of $5,838,705.28 (after payment of $16,679.95 in underwriter’s fees and issuance costs) were deposited with an escrow agent to provide for all future debt service payments on these bonds. As a result, these bonds are considered to be defeased, and the liability for those bonds has been removed from the university’s long-term liabilities. Although the advance refunding resulted in the recognition of a deferred loss of $249,934.13 for the University Service Court to be amortized over the next 13 years, the university in effect reduced its aggregate debt service payments by $782,478.96 over the next 13 years and obtained an economic gain (difference between the present values of the old and new debt service payments) of $643,459.26. Note 9. Endowments If a donor has not provided specific instructions to the university, state law permits the university to authorize for expenditure the net appreciation (realized and unrealized) of the investments of endowment funds. When administering its power to spend net appreciation, the university is required to consider the university’s long-term and short-term needs; present and anticipated financial requirements; expected total return on its investments; price-level trends; and general economic conditions. Any net appreciation spent is required to be spent for the purposes for which the endowment was established. The university chooses to spend only a portion of the investment income (including changes in the value of investments) each year. Under the spending plan established by the university, all interest earnings have been authorized for expenditure. The remaining amount, if any, is retained to be used in future years when the amount computed using the spending plan exceeds the investment

Notes to the Financial Statements (Continued)
29
income. At June 30, 2013, net appreciation of $170,219.00 is available to be spent, of which $93,319.89 is included in restricted net position expendable for scholarships and fellowships; $641.33 is included in restricted net position expendable for instructional departmental uses; $64,049.30 is included in restricted net position expendable for loans; and $12,208.48 is included in restricted net position expendable for other. Note 10. Pledged Revenues The university has pledged certain revenues and fees, including state appropriations, to repay $92,254,454.99 in revenue bonds issued from November 1985 to August 2012 (see Note 8 for further detail). Proceeds from the bonds provided financing for construction and renovation of various facilities, as well as for building systems and equipment. The bonds are payable through 2040. Annual principal and interest payments on the bonds are expected to require 1.82% of available revenues. The total principal and interest remaining to be paid on the bonds is $141,091,755.74. Principal and interest paid for the current year and total available revenues were $8,471,497.75 and $359,726,410.95, respectively. The amount of principal and interest paid for the current year does not include debt of $5,536,955.46 defeased through a bond refunding in the current year. Note 11. Pension Plans Defined Benefit Plans
Tennessee Consolidated Retirement System
Plan Description – The university contributes to the State Employees, Teachers, and Higher Education Employees Pension Plan (SETHEEPP), a cost-sharing, multiple-employer, defined benefit pension plan administered by the Tennessee Consolidated Retirement System (TCRS). TCRS provides retirement, death, and disability benefits, as well as annual cost-of-living adjustments to plan members and their beneficiaries. Title 8, Chapters 34-37, Tennessee Code Annotated, establishes benefit provisions. State statutes are amended by the Tennessee General Assembly. TCRS issues a publicly available financial report that includes financial statements and required supplementary information for SETHEEPP. That report is available on the state’s website at www.treasury.tn.gov/tcrs. Funding Policy – Plan members are noncontributory. The university is required to contribute an actuarially determined rate. The current rate is 15.03% of annual covered payroll. Contribution requirements for the university are established and may be amended by the TCRS’ Board of Trustees. The university’s contributions to TCRS for the years ended June 30, 2013; June 30, 2012; and June 30, 2011, were $8,364,880.14; $8,338,695.98; and $8,072,255.73, respectively. Contributions met the requirements for each year.

Notes to the Financial Statements (Continued)
30
Defined Contribution Plans
Optional Retirement Plans
Plan Description – The university contributes to three defined contribution plans: Teachers Insurance and Annuity Association–College Retirement Equities Fund, ING Life Insurance and Annuity Company, and Variable Annuity Life Insurance Company. These plans are administered by the Tennessee Department of the Treasury. Each plan provides retirement benefits to faculty and staff who are exempt from the overtime provisions of the Fair Labor Standards Act and who waive membership in the TCRS. Benefits depend solely on amounts contributed to the plan plus investment earnings. Plan provisions are established by state statute in Title 8, Chapter 35, Part 4, Tennessee Code Annotated. State statutes are amended by the Tennessee General Assembly. Funding Policy – Plan members are noncontributory. The university contributes an amount equal to 10% of the employee’s base salary up to the social security wage base and 11% above the social security wage base. Contribution requirements are established and amended by state statute. The contributions made by the university to the plans were $9,999,571.70 for the year ended June 30, 2013, and $9,692,300.76 for the year ended June 30, 2012. Contributions met the requirements for each year. Note 12. Other Postemployment Benefits
Health care is the only “other postemployment benefit” (OPEB) provided to employees. The State of Tennessee administers a group health insurance program that provides postemployment health insurance benefits to eligible university retirees. This program includes two plans available to higher education employees—the State Employee Group Plan and the Medicare Supplement Plan. For accounting purposes, the plans are agent multiple-employer, defined benefit OPEB plans. Benefits are established and amended by an insurance committee created by Section 8-27-101, Tennessee Code Annotated. Prior to reaching age 65, all members have the option of choosing between the standard or partnership preferred provider organization plan for health care benefits. Subsequent to age 65, members who are also in the state’s retirement system may participate in a state-administered Medicare supplement that does not include pharmacy. The state makes on-behalf payments to the Medicare Supplement Plan for the university’s eligible retirees; see Note 19. The plans are reported in the Tennessee Comprehensive Annual Financial Report (CAFR). The CAFR is available on the state’s website at www.tn.gov/finance/act/cafr.shtml. Special Funding Situation
The State of Tennessee is legally responsible for contributions to the Medicare Supplement Plan, which covers the retirees of other governmental entities, including The University of Memphis. The state is the sole contributor for the university retirees who participate in the Medicare Supplement Plan and, therefore, is acting as the employer.

Notes to the Financial Statements (Continued)
31
Funding Policy
The premium requirements of members of the State Employee Group Plan are established and may be amended by the insurance committee. The plan is self-insured and financed on a pay-as-you-go basis, with the risk shared equally among the participants. The plan’s claims liabilities are periodically computed using actuarial and statistical techniques to establish premium rates. The plan’s administrative costs are allocated to plan participants. In accordance with Section 8-27-205(b), Tennessee Code Annotated, retirees in the State Employee Group Plan pay the same base premium, adjusted for years of service, as active employees. Retirees with 30 years of service are subsidized 80%; retirees with 20 years of service but less than 30 years of service, 70%; and retirees with less than 20 years of service, 60%. Retirees in the Medicare Supplement Plan have flat-rate premium subsidies based on years of service. Retirees with 30 years of service receive $50 per month; retirees with 20 years of service but less than 30 years of service, $37.50; and retirees with 15 years of service but less than 20 years of service, $25.
University’s Annual OPEB Cost and Net OPEB Obligation State Employee Group Plan
Annual required contribution (ARC) $ 3,828,000.00 Interest on the net OPEB obligation 588,415.82 Adjustment to the ARC (624,590.86) Annual OPEB cost 3,791,824.96 Amount of contribution (2,693,984.07) Increase in net OPEB obligation 1,097,840.89 Net OPEB obligation – beginning of year 14,710,395.49 Net OPEB obligation – end of year $15,808,236.38
Year-end
Plan
Annual OPEB Cost
Percentage of Annual OPEB
Cost Contributed
Net OPEB Obligation at Year-end
June 30, 2013
State Employee Group Plan
$3,791,824.96
71.05%
$15,808,236.38
June 30, 2012 State Employee
Group Plan
$3,757,128.53
75.07%
$14,710,395.49
June 30, 2011 State Employee
Group Plan
$4,463,886.32
54.28%
$13,773,657.17 Funded Status and Funding Progress
The funded status of the university’s portion of the State Employee Group Plan as of July 1, 2011, was as follows:

Notes to the Financial Statements (Continued)
32
State Employee Group Plan Actuarial valuation date July 1, 2011Actuarial accrued liability (AAL) $30,832,000.00Actuarial value of plan assets -Unfunded actuarial accrued liability (UAAL) $30,832,000.00Actuarial value of assets as a percentage of the AAL 0.0%Covered payroll (active plan members) $118,128,155.32UAAL as percentage of covered payroll 26.10% Actuarial valuations involve estimates of the value of reported amounts and assumptions about the probability of events far into the future, and actuarially determined amounts are subject to continual revision as actual results are compared to past expectations and new estimates are made about the future. The schedule of funding progress, presented as required supplementary information following the notes to the financial statements, presents multiyear trend information about whether the actuarial value of plan assets is increasing or decreasing over time relative to the actuarial accrued liability for benefits. Actuarial Methods and Assumptions
Calculations are based on the types of benefits provided under the terms of the substantive plan at the time of each valuation and on the pattern of sharing of costs between the employer and plan members to that point. Actuarial calculations reflect a long-term perspective. Consistent with that perspective, actuarial methods and assumptions used include techniques that are designed to reduce short-term volatility in actuarial accrued liabilities and the actuarial value of assets. In the July 1, 2011, actuarial valuation, the Projected Unit Credit actuarial cost method was used. The actuarial assumptions included a 4% investment rate of return (net of administrative expenses) and an annual health care cost trend rate of 9.25% initially. The rate decreased to 8.75% in fiscal year 2013 and then reduces by decrements to an ultimate rate of 5% in fiscal year 2021. All rates include a 2.5% inflation assumption, which also represents the projected salary increase. The unfunded actuarial accrued liability is being amortized as a level percentage of payroll on a closed basis over a 30-year period beginning with July 1, 2007. Note 13. Insurance-related Activities It is the policy of the state not to purchase commercial insurance for the risks associated with casualty losses for general liability, automobile liability, professional medical malpractice, and workers’ compensation. The state’s management believes it is more economical to manage these risks internally and set aside assets for claim settlement in its internal service fund, the Risk Management Fund. The state purchases commercial insurance for real property; builder’s risk (for construction projects starting prior to July 1, 2012); and crime and fidelity coverage on the state’s officials and employees. The contractor is responsible for acquiring builder’s risk insurance for all construction projects after June 30, 2012; thus, builder’s risk is no longer covered by the Risk
Notes to the Financial Statements (Continued)
33
Management Fund. For property coverage, the deductible for an individual state agency is the first $25,000 of losses. The Risk Management Fund is responsible for property losses for the annual aggregate deductible of $10 million for perils other than earthquakes and flood. Purchased insurance coverage is responsible for losses exceeding the $10 million annual aggregate deductible. For earthquake and flood, there is a deductible of $10 million per occurrence. The maximum insurance coverage is $750 million per year for perils other than earthquake and flood. The maximum flood insurance coverage is $50 million per occurrence, except there is only $25 million of coverage in flood zones A and V. The maximum earthquake insurance coverage is $50 million per occurrence. The amounts of settlements have not exceeded insurance coverage for each of the three past fiscal years. The university participates in the Risk Management Fund. The fund allocates the cost of providing claims servicing and claims payment by charging a premium to the university based on a percentage of the university’s expected loss costs, which include both experience and exposures. This charge considers recent trends in actual claims experience of the state as a whole. An actuarial valuation is performed as of fiscal year-end to determine the fund liability and premium allocation. Information regarding the determination of the claims liabilities and the changes in the balances of the claims liabilities for the year ended June 30, 2013, is presented in the Tennessee Comprehensive Annual Financial Report (CAFR). The CAFR is available on the state’s website at www.tn.gov/finance/act/cafr.shtml. Since the university participates in the Risk Management Fund, it is subject to the liability limitations under the provisions of the Tennessee Claims Commission Act, Section 9-8-101 et seq., Tennessee Code Annotated. Liability for negligence of the university for bodily injury and property damage is limited to $300,000 per person and $1,000,000 per occurrence. The limits of liability under workers’ compensation are set forth in Section 50-6-101 et seq., Tennessee Code Annotated. Claims are paid through the state’s Risk Management Fund. At June 30, 2013, the Risk Management Fund held $108.5 million in cash designated for payment of claims. At June 30, 2013, the scheduled coverage for the university was $1,387,356,200.00 for buildings and $368,699,100.00 for contents. The state has also set aside assets in the Employee Group Insurance Fund, an internal service fund, to provide a program of health insurance coverage for the employees of the state, with the risk retained by the state. The university participates in the Employee Group Insurance Fund. The fund allocates the cost of providing claims servicing and claims payment by charging a premium to the university based on estimates of the ultimate cost of claims, including the cost of claims that have been reported but not settled and of claims that have been incurred but not reported. Employees and providers have 13 months to file medical claims. Note 14. Commitments and Contingencies Sick Leave
The university records the cost of sick leave when paid. The dollar amount of unused sick leave was $77,917,511.60 at June 30, 2013.

Notes to the Financial Statements (Continued)
34
Operating Leases
The university has entered into various operating leases for buildings and equipment. Such leases will probably continue to be required. Expenses under operating leases for real property were $2,253,597.79, and expenses for personal property were $707,159.30 for the year ended June 30, 2013. All operating leases are cancelable at the lessee’s option. Construction in Progress
At June 30, 2013, outstanding commitments under construction contracts totaled $14,168,890.69 for the Community Health Facility, Biochemistry and Biology Facility, new student housing, Carney-Johnston Dormitory, housing sprinkler upgrades, various roof replacements, various building HVAC updates, underground utility updates, South Campus electric and gas modification, variable flow pumping, and law school HVAC replacement, of which $5,162,835.32 will be funded by future state capital outlay appropriations. Litigation
The university is involved in several lawsuits, none of which are expected to have a material effect on the accompanying financial statements. American Athletic Conference
On February 7, 2012, the university signed a Membership Expansion Agreement to join the American Athletic Conference, effective July 1, 2013. The university will pay a one-time entry fee of $2,500,000, payable in five annual installments of $500,000, with the first installment due June 30, 2014. Note 15. Chairs of Excellence The university had $68,531,858.26 on deposit at June 30, 2013, with the State Treasurer for its Chairs of Excellence program. These funds are held in trust by the state and are not included in the financial statements. Note 16. Funds Held in Trust by Others The university is a beneficiary under the Herbert Herff, Van Vleet, Mike Driver, Pope M. Farrington, and C.M. Gooch trusts. The underlying assets are not considered assets of the university and are not included in the university’s financial statements. The university received $1,142,953.13 from these funds during the year ended June 30, 2013. Note 17. Natural Classification With Functional Classifications The university’s operating expenses for the year ended June 30, 2013, are as follows:

Notes to the Financial Statements (Continued)
35
Expenses initially incurred by the academic support function as a result of providing internal services to the other functional classifications were allocated to the other functional areas by reducing the academic support function’s operating expenses by the total amount of salaries, benefits, and operating expenses incurred in the provision of these services, and allocating this amount to the other functional areas’ operating expenses on the basis of usage. As a result of this process, expenses totaling $7,817,239.95 were reallocated from academic support to the other functional areas. Note 18. Affiliated Entity Not Included The University of Memphis Research Foundation is a private, nonprofit foundation with the university as the sole beneficiary. The University of Memphis Research Foundation is controlled by a board independent of the university. The financial records, investments, and other financial transactions are handled external to the university, and these amounts are not included in the university’s financial report. As reported in the foundation’s most recently audited financial report, at June 30, 2012, the assets of the foundation totaled $4,606,379.00, liabilities were $864,903.00, and the net position amounted to $3,741,476.00. Note 19. On-behalf Payments During the year ended June 30, 2013, the State of Tennessee made payments of $167,959.00 on behalf of the university for retirees participating in the Medicare Supplement Plan. The Medicare Supplement Plan is a postemployment benefit health care plan and is discussed further in Note 12. The plan is reported in the Tennessee Comprehensive Annual Financial Report. That report is available on the state’s website at www.tn.gov/finance/act/cafr.shtml.
Natural Classification
Functional Classification
Salaries
Benefits
Other Operating
Scholarships
Depreciation
Total
Instruction $ 90,477,159.55 $ 33,265,639.50 $17,404,031.43 $ - $ - $ 141,146,830.48 Research 21,401,043.69 7,533,996.70 9,643,515.28 - - 38,578,555.67 Public service 6,192,338.79 1,736,084.46 2,975,405.19 - - 10,903,828.44 Academic support
16,316,188.48
6,647,989.42
5,078,383.86
-
-
28,042,561.76
Student services 22,796,440.95 7,660,510.75 23,031,006.75 - - 53,487,958.45 Institutional support
17,340,092.03
6,128,842.38
11,792,010.27
-
-
35,260,944.68
Maintenance & operation
11,752,852.84
5,302,497.09
14,179,880.79
-
-
31,235,230.72
Scholarships & fellowships
-
-
-
42,931,670.25
-
42,931,670.25
Auxiliary 2,786,366.30 780,409.99 12,440,826.36 - - 16,007,602.65 Depreciation - - - - 19,375,957.08 19,375,957.08 Total $189,062,482.63 $69,055,970.29 $96,545,059.93 $42,931,670.25 $19,375,957.08 $416,971,140.18
Notes to the Financial Statements (Continued)
36
Note 20. Voluntary Buyout Program The university implemented a Voluntary Buyout Plan in fiscal year 2011 as a strategy to assist the university in addressing budgetary constraints due to several years of state appropriation reductions and potential budget reductions in the forthcoming fiscal years. The university had 26 employees participate in the Voluntary Buyout Program, with 15 terminating by June 30, 2011; 7 terminating by June 30, 2012; and 4 terminating by June 30, 2013. Participants will receive 150% of their institutional base salary calculated on the date of separation, to be paid over a three-year time period in three equal annual installments. As of June 30, 2013, expenditures for payout of accrued annual leave, compensatory time, or worked holidays for the Voluntary Buyout Plan and Post-Retirement Service Program were $1,480,351.85. Accrued expenses for severance pay were $1,751,218.49 at June 30, 2013. Note 21. Component Unit The University of Memphis Foundation (the foundation) is a legally separate, tax-exempt organization supporting The University of Memphis. The foundation acts primarily as a fund-raising organization to supplement the resources that are available to the university in support of its programs. The 40-member board of the foundation is self-perpetuating and consists of graduates and friends of the university. Although the university does not control the timing or amount of receipts from the foundation, the majority of resources, or income thereon, that the foundation holds and invests are restricted to the activities of the university by the donors. Because these restricted resources held by the foundation can only be used by, or for the benefit of, the university, the foundation is considered a component unit of the university and is discretely presented in the university’s financial statements. The foundation is a nonprofit organization that reports under Financial Accounting Standards Board (FASB) standards. As such, certain revenue recognition criteria and presentation features are different from GASB revenue recognition criteria and presentation features. With the exception of necessary presentation adjustments, no modifications have been made to the foundation’s financial information in the university’s financial statements for these differences. During the year ended June 30, 2013, the foundation made distributions of $25,261,468.00 to or on behalf of the university for both restricted and unrestricted purposes. Complete financial statements for the foundation can be obtained from the Managing Director, University of Memphis Foundation, 635 Normal Street, Memphis, Tennessee, 38152-3750, or online at http://www.memphis.edu/foundation/statements.php. Fair-value Measurements
The foundation reports certain assets and liabilities at fair value. Fair value has been determined using quoted prices in active markets for identical assets and liabilities that are accessible at the measurement date (Level 1); inputs other than quoted market prices included in Level 1 that are directly or indirectly observable for the asset or liability (Level 2); or significant unobservable

Notes to the Financial Statements (Continued)
37
inputs (Level 3). The following table categorizes the recurring fair-value measurements for assets and liabilities at June 30, 2013.
Total Fair Value at June 30, 2013
Quoted Prices Level 1
Significant
Other Inputs Level 2
Significant Unobservable
Inputs Level 3
Assets: Money market funds $ 2,066,450.00 $ 2,066,450.00 $ - $ - Limited partnerships and LLCs
41,295,327.00
2,069,684.00
4,831,463.00
34,394,180.00
Common/collective trust fund–inter- national equity
7,139,332.00
-
7,139,332.00
- Mutual funds 63,992,400.00 63,992,400.00 - - U.S. government securities
178,718.00
-
178,718.00
-
Corporate bonds 10,343.00 - 10,343.00 - Total assets $114,682,570.00 $68,128,534.00 $12,159,856.00 $34,394,180.00 The following table reconciles beginning and ending balances of all assets and liabilities valued using Level 3 inputs.
Beginning Balance
Total Gains/(Losses),
Unrealized
Purchases, Issuances, and
Settlements Sales/
distributions Ending Balance
Assets: Limited partner- ships and LLCs
$31,847,251.00
$2,946,402.00
$1,413,613.00
$(1,813,086.00)
$34,394,180.00
Total assets $31,847,251.00 $2,946,402.00 $1,412,613.00 $(1,813,086.00) $34,394,180.00
All gains and losses, both realized and unrealized, have been reported on the statement of revenues, expenses, and changes in net position as investment income. Of this total, $2,946,402 is attributable to the change in unrealized gains or losses relating to those assets and liabilities still held at June 30, 2013. The following is a description of the categories of limited partnership and limited liability company (LLC) investments used for Level 3 assets measured at fair value. Hedged Equity: This category consists of funds of funds that make long and short position equity investments. The bulk of the investment is subject to semi-annual or annual redemption. Hedged Absolute Return: This category consists of a multi-manager, absolute return hedge fund of funds. The fund seeks to maintain low correlations and betas to the Barclays Aggregate Bond
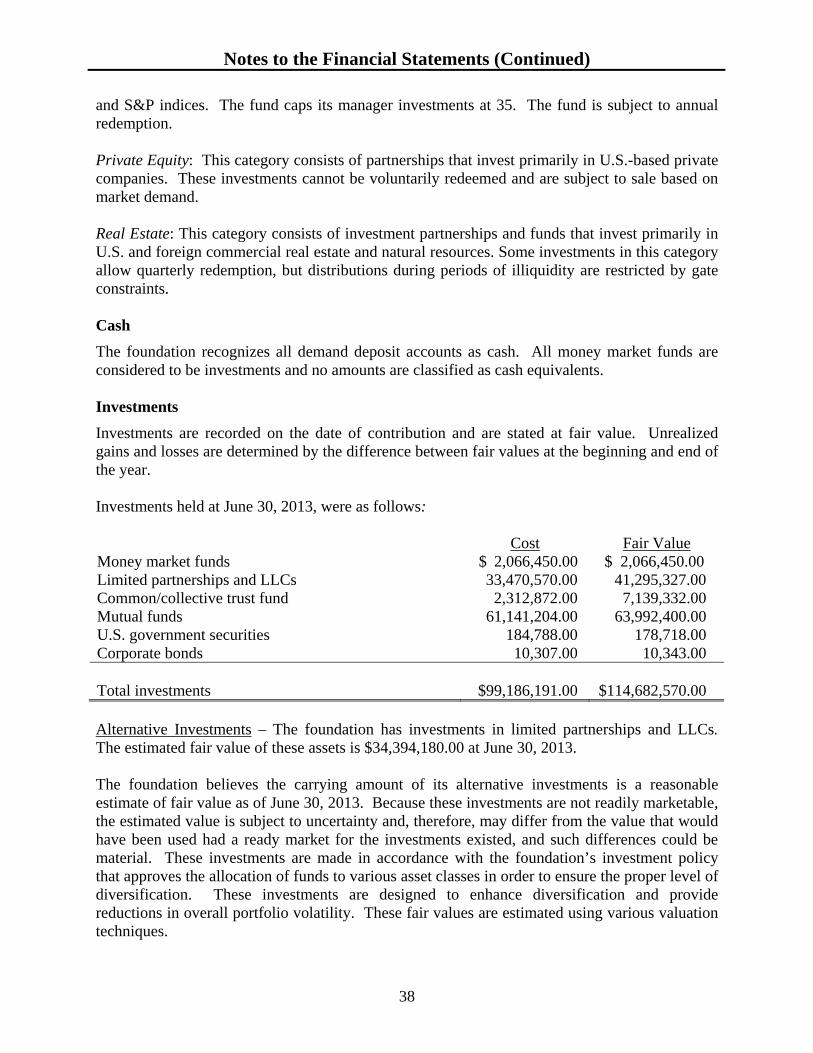
Notes to the Financial Statements (Continued)
38
and S&P indices. The fund caps its manager investments at 35. The fund is subject to annual redemption. Private Equity: This category consists of partnerships that invest primarily in U.S.-based private companies. These investments cannot be voluntarily redeemed and are subject to sale based on market demand. Real Estate: This category consists of investment partnerships and funds that invest primarily in U.S. and foreign commercial real estate and natural resources. Some investments in this category allow quarterly redemption, but distributions during periods of illiquidity are restricted by gate constraints. Cash
The foundation recognizes all demand deposit accounts as cash. All money market funds are considered to be investments and no amounts are classified as cash equivalents. Investments
Investments are recorded on the date of contribution and are stated at fair value. Unrealized gains and losses are determined by the difference between fair values at the beginning and end of the year. Investments held at June 30, 2013, were as follows:
Cost Fair Value Money market funds $ 2,066,450.00 $ 2,066,450.00 Limited partnerships and LLCs 33,470,570.00 41,295,327.00 Common/collective trust fund 2,312,872.00 7,139,332.00 Mutual funds 61,141,204.00 63,992,400.00 U.S. government securities 184,788.00 178,718.00 Corporate bonds 10,307.00 10,343.00 Total investments $99,186,191.00 $114,682,570.00 Alternative Investments – The foundation has investments in limited partnerships and LLCs. The estimated fair value of these assets is $34,394,180.00 at June 30, 2013. The foundation believes the carrying amount of its alternative investments is a reasonable estimate of fair value as of June 30, 2013. Because these investments are not readily marketable, the estimated value is subject to uncertainty and, therefore, may differ from the value that would have been used had a ready market for the investments existed, and such differences could be material. These investments are made in accordance with the foundation’s investment policy that approves the allocation of funds to various asset classes in order to ensure the proper level of diversification. These investments are designed to enhance diversification and provide reductions in overall portfolio volatility. These fair values are estimated using various valuation techniques.
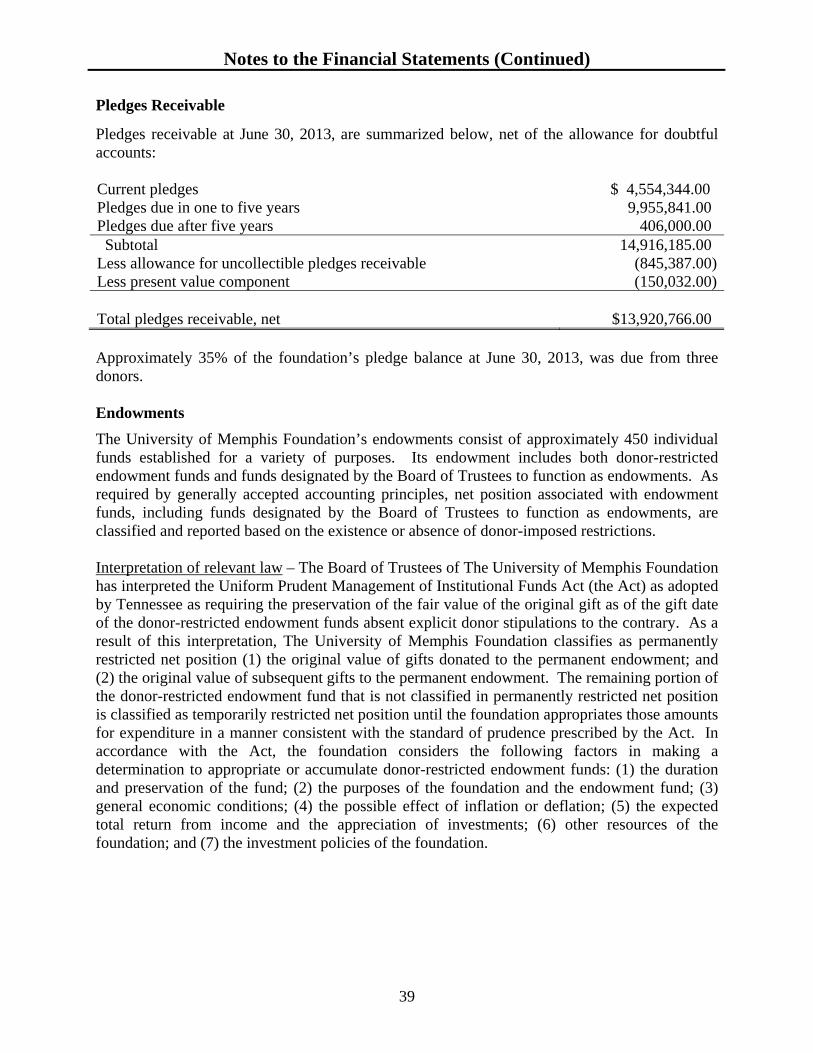
Notes to the Financial Statements (Continued)
39
Pledges Receivable
Pledges receivable at June 30, 2013, are summarized below, net of the allowance for doubtful accounts: Current pledges $ 4,554,344.00 Pledges due in one to five years 9,955,841.00 Pledges due after five years 406,000.00 Subtotal 14,916,185.00 Less allowance for uncollectible pledges receivable (845,387.00)Less present value component (150,032.00) Total pledges receivable, net $13,920,766.00 Approximately 35% of the foundation’s pledge balance at June 30, 2013, was due from three donors. Endowments
The University of Memphis Foundation’s endowments consist of approximately 450 individual funds established for a variety of purposes. Its endowment includes both donor-restricted endowment funds and funds designated by the Board of Trustees to function as endowments. As required by generally accepted accounting principles, net position associated with endowment funds, including funds designated by the Board of Trustees to function as endowments, are classified and reported based on the existence or absence of donor-imposed restrictions. Interpretation of relevant law – The Board of Trustees of The University of Memphis Foundation has interpreted the Uniform Prudent Management of Institutional Funds Act (the Act) as adopted by Tennessee as requiring the preservation of the fair value of the original gift as of the gift date of the donor-restricted endowment funds absent explicit donor stipulations to the contrary. As a result of this interpretation, The University of Memphis Foundation classifies as permanently restricted net position (1) the original value of gifts donated to the permanent endowment; and (2) the original value of subsequent gifts to the permanent endowment. The remaining portion of the donor-restricted endowment fund that is not classified in permanently restricted net position is classified as temporarily restricted net position until the foundation appropriates those amounts for expenditure in a manner consistent with the standard of prudence prescribed by the Act. In accordance with the Act, the foundation considers the following factors in making a determination to appropriate or accumulate donor-restricted endowment funds: (1) the duration and preservation of the fund; (2) the purposes of the foundation and the endowment fund; (3) general economic conditions; (4) the possible effect of inflation or deflation; (5) the expected total return from income and the appreciation of investments; (6) other resources of the foundation; and (7) the investment policies of the foundation.
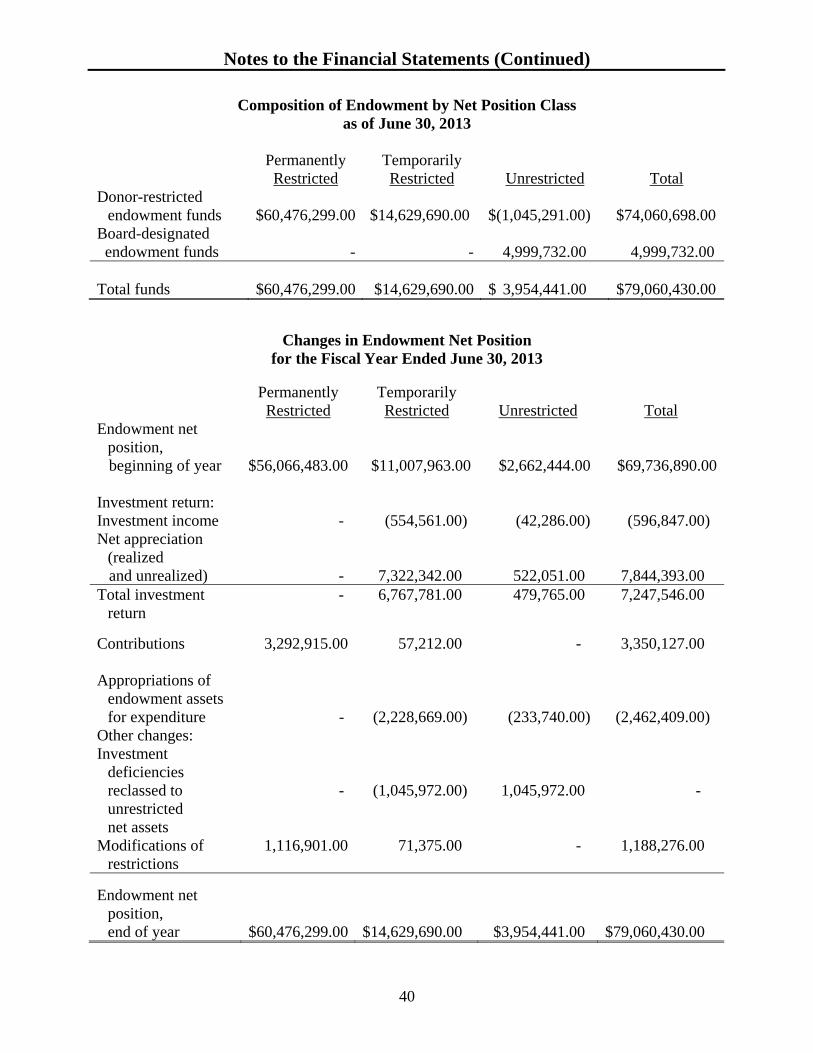
Notes to the Financial Statements (Continued)
40
Composition of Endowment by Net Position Class as of June 30, 2013
Permanently
Restricted Temporarily Restricted
Unrestricted
Total
Donor-restricted endowment funds $60,476,299.00 $14,629,690.00 $(1,045,291.00) $74,060,698.00
Board-designated endowment funds - - 4,999,732.00 4,999,732.00 Total funds $60,476,299.00 $14,629,690.00 $ 3,954,441.00 $79,060,430.00
Changes in Endowment Net Position for the Fiscal Year Ended June 30, 2013
Permanently
Restricted Temporarily Restricted Unrestricted Total
Endowment net position,
beginning of year $56,066,483.00 $11,007,963.00 $2,662,444.00 $69,736,890.00 Investment return: Investment income - (554,561.00) (42,286.00) (596,847.00) Net appreciation
(realized and unrealized) - 7,322,342.00 522,051.00 7,844,393.00 Total investment
return - 6,767,781.00 479,765.00 7,247,546.00
Contributions 3,292,915.00 57,212.00 - 3,350,127.00 Appropriations of
endowment assets for expenditure - (2,228,669.00) (233,740.00) (2,462,409.00)
Other changes: Investment
deficiencies reclassed to unrestricted net assets
-
(1,045,972.00)
1,045,972.00
-
Modifications of restrictions
1,116,901.00 71,375.00 - 1,188,276.00
Endowment net position, end of year $60,476,299.00 $14,629,690.00 $3,954,441.00 $79,060,430.00

Notes to the Financial Statements (Continued)
41
Funds with deficiencies – From time to time, the fair value of assets associated with individual donor-restricted endowment funds may fall below the level that the foundation is required to retain in a fund of perpetual duration. In accordance with accounting principles generally accepted in the United States of America, deficiencies of this nature are reported in unrestricted net position. These deficiencies resulted from unfavorable market fluctuations that occurred after the investment of permanently restricted contributions and/or continued appropriation for fees and previously approved budgeted expenditures. At June 30, 2013, deficiencies of this nature totaled $1,045,291.00. Return objectives and risk parameters – The foundation has adopted investment and spending policies for endowment assets that attempt to provide a predictable stream of funding to programs supported by its endowment, while seeking to maintain the purchasing power of the endowment assets. Endowment assets include those assets of donor-restricted funds that the organization must hold in perpetuity or for a donor-specified period, as well as board-designated funds. Under this policy, as approved by the Board of Trustees, the endowment assets are invested in a manner that is intended to produce consistent long-term growth of capital without undue exposure to risk. Strategies employed for achieving objectives – To satisfy its long-term rate-of-return objectives, the foundation relies on a total return strategy in which investment returns are achieved through both capital appreciation (realized and unrealized) and current yield (interest and dividends). The foundation targets a diversified asset allocation that places a greater emphasis on equity-based investments to achieve its long-term return objectives within prudent risk restraints. Spending policy and how the investment objectives relate – The foundation has a policy of budgeting for expenditure each year a percentage of its endowment funds’ average fair value over the prior 12 quarters through the fiscal year-end one year preceding the fiscal year in which the expenditure is planned. For fiscal year 2013, this percentage was 4.75%. In establishing this policy, the foundation considered the long-term expected return on its endowment. Accordingly, over the long term, the foundation expects the current spending policy to allow for endowment growth. This is consistent with the foundation’s objective to maintain the purchasing power of the endowment assets held in perpetuity or for a specified term, as well as to provide additional real growth through new gifts and investment return. Contingency
The foundation has been named as a defendant in an ongoing civil lawsuit involving injuries to an individual. Although the ultimate outcome of the litigation is uncertain at this time, in the opinion of management after consultation with counsel, the ultimate outcome of this lawsuit will not have a material adverse effect upon the financial position of the foundation.
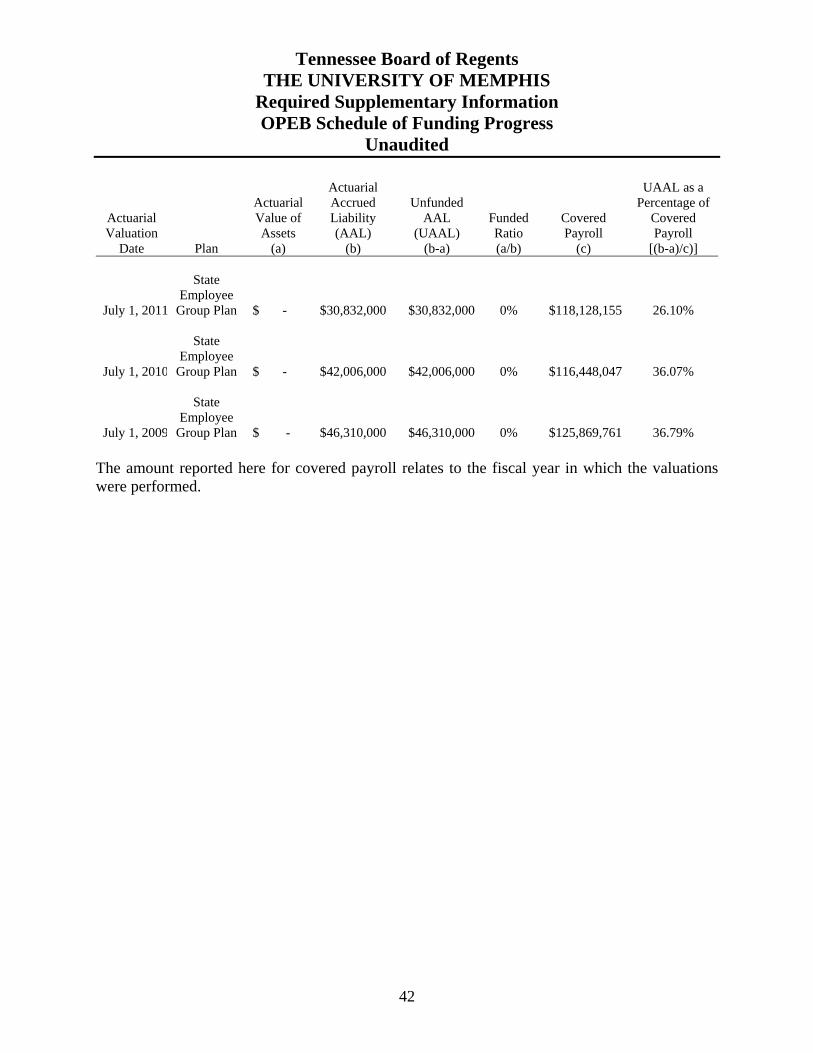
Tennessee Board of Regents THE UNIVERSITY OF MEMPHIS
Required Supplementary Information OPEB Schedule of Funding Progress
Unaudited
42
Actuarial Valuation
Date
Plan
Actuarial Value of Assets
(a)
Actuarial Accrued Liability (AAL)
(b)
Unfunded
AAL (UAAL)
(b-a)
Funded Ratio (a/b)
Covered Payroll
(c)
UAAL as a Percentage of
Covered Payroll
[(b-a)/c)] July 1, 2011
State Employee
Group Plan
$ -
$30,832,000
$30,832,000
0%
$118,128,155
26.10% July 1, 2010
State Employee
Group Plan
$ -
$42,006,000
$42,006,000
0%
$116,448,047
36.07% July 1, 2009
State Employee
Group Plan
$ -
$46,310,000
$46,310,000
0%
$125,869,761
36.79% The amount reported here for covered payroll relates to the fiscal year in which the valuations were performed.

43
Supplementary InformationTHE UNIVERSITY OF MEMPHIS
Supplementary Schedule of Cash Flows - Component UnitFor the Year Ended June 30, 2013
CASH FLOWS FROM OPERATING ACTIVITIES Gifts and contributions 19,470,170.00$ Payments to suppliers and vendors (7,241,619.00) Payments to The University of Memphis (17,231,217.00) Net cash used by operating activities (5,002,666.00)
CASH FLOWS FROM NONCAPITAL FINANCING ACTIVITIES Private gifts for endowment purposes 3,292,915.00 Other noncapital financing receipts (payments) 1,054,743.00 Net cash provided by noncapital financing activities 4,347,658.00
CASH FLOWS FROM INVESTING ACTIVITIES Proceeds from sales and maturities of investments 59,164,760.00 Income on investments 1,336,114.00 Purchases of investments (60,846,461.00) Net cash used by investing activities (345,587.00)
Net decrease in cash (1,000,595.00) Cash - beginning of year 1,685,469.00 Cash - end of year 684,874.00$
Reconciliation of operating income to net cash used by operating activities:Operating income 1,128,951.00$ Adjustments to reconcile operating income to net cash provided by operating activities: Change in assets, liabilities, and deferrals: Accounts receivable (7,053,236.00) Due to The University of Memphis (282,516.00) Accrued liabilities (70,710.00) Accounts payable 1,274,845.00 Net cash used by operating activities (5,002,666.00)$
Noncash investing, capital, and financing activities Gifts in-kind - capital 4,334,687.37$ Unrealized gains on investments 7,188,765.00$

STATE OF TENNESSEE C O M P T R O L L E R O F T H E T R E A S U R Y
DEPARTMENT OF AUDIT DIVISION OF STATE AUDIT
S U I T E 1 5 0 0 , JAMES K. POLK STATE OFFICE BUILDING NASHVILLE, TENNESSEE 37243-1402
PHONE (615) 401-7897 FAX (615) 532-2765
44
Independent Auditor’s Report on Internal Control Over Financial Reporting and on Compliance and Other Matters Based on an Audit of
Financial Statements Performed in Accordance With Government Auditing Standards
The Honorable Bill Haslam, Governor Members of the General Assembly The Honorable John G. Morgan, Chancellor Mr. R. Brad Martin, Interim President We have audited the financial statements of The University of Memphis, an institution of the Tennessee Board of Regents, which is a component unit of the State of Tennessee, and its discretely presented component unit as of and for the year ended June 30, 2013, and the related notes to the financial statements, which collectively comprise the university’s basic financial statements, and have issued our report thereon dated November 27, 2013. We conducted our audit in accordance with the auditing standards generally accepted in the United States of America and the standards applicable to financial audits contained in Government Auditing Standards issued by the Comptroller General of the United States. Our report includes a reference to other auditors who audited the financial statements of The University of Memphis Foundation, as described in our report on the university’s financial statements. This report does not include the results of the other auditors’ testing of internal control over financial reporting or compliance and other matters that are reported on separately by those auditors. Internal Control Over Financial Reporting In planning and performing our audit of the financial statements, we considered the university’s internal control over financial reporting (internal control) to determine the audit procedures that are appropriate in the circumstances for the purpose of expressing our opinions on the financial statements, but not for the purpose of expressing an opinion on the effectiveness of the university’s internal control. Accordingly, we do not express an opinion on the effectiveness of the university’s internal control. A deficiency in internal control exists when the design or operation of a control does not allow management or employees, in the normal course of performing their assigned functions, to prevent, or detect and correct, misstatements on a timely basis. A material weakness is a deficiency, or a combination of deficiencies, in internal control, such that there is a reasonable possibility that a material misstatement of the financial statements will not be prevented, or detected and corrected, on a timely basis. A significant deficiency is a deficiency, or a combination of deficiencies, in internal control that is less severe than a material weakness, yet important enough to merit attention by those charged with governance.
45
Our consideration of internal control was for the limited purpose described in the first paragraph of this section and was not designed to identify all deficiencies in internal control that might be material weaknesses or significant deficiencies, and, therefore, material weaknesses or significant deficiencies may exist that were not identified. Given these limitations, during our audit we did not identify any deficiencies that we consider to be material weaknesses. We did identify a deficiency in internal control, as described below, that we consider to be a significant deficiency:
The University of Memphis’ data security policies should be strengthened.
This deficiency is described in the Findings and Recommendations section of this report. Compliance and Other Matters
As part of obtaining reasonable assurance about whether the university’s financial statements are free from material misstatement, we performed tests of its compliance with certain provisions of laws, regulations, contracts, and grant agreements, noncompliance with which could have a direct and material effect on the determination of financial statement amounts. However, providing an opinion on compliance with those provisions was not an objective of our audit, and accordingly, we do not express such an opinion. The results of our tests disclosed no instances of noncompliance or other matters that are required to be reported under Government Auditing Standards. We did, however, note an immaterial instance of noncompliance that we have included in the Findings and Recommendations section of this report.
The University of Memphis’s Responses to Findings
The university’s responses to the findings identified in our audit are included in the Findings and Recommendations section of this report. The university’s responses were not subjected to the auditing procedures applied in the audit of the financial statements, and, accordingly, we express no opinion on them. Purpose of This Report The purpose of this report is solely to describe the scope of our testing of internal control and compliance and the results of that testing, and not to provide an opinion on the effectiveness of the entity’s internal control or on compliance. This report is an integral part of an audit performed in accordance with Government Auditing Standards in considering the entity’s internal control and compliance. Accordingly, this communication is not suitable for any other purpose.
Deborah V. Loveless, CPA Director November 27, 2013

46
Findings and Recommendations
1. The University of Memphis’ data security policies should be strengthened
Finding
Management of The University of Memphis’ Information Technology Services (ITS) group did not design and monitor adequate internal controls over access to its Banner computer system. The lack of proper access controls across the university’s computing environment increases the risk of unauthorized system activity, including fraud or error.
The wording of this finding does not identify specific vulnerabilities that could allow someone to exploit the university’s systems. Disclosing those vulnerabilities could present a potential security risk by providing readers with information that might be confidential pursuant to Section 10-7-504(i), Tennessee Code Annotated. We provided the university with detailed information regarding the conditions we identified, as well as our recommendations for improvement.
Recommendation
The Chief Information Officer (CIO) should ensure that these conditions are remedied through the prompt development and implementation of effective access controls. In addition, the CIO should ensure that the risks associated with this finding are adequately identified and assessed in the university’s documented risk assessment. The CIO should implement effective controls to ensure compliance with applicable requirements; assign staff to be responsible for ongoing monitoring of the risks and mitigating controls; and take action if deficiencies occur.
Management’s Comment We do not concur that the issue noted rises to the level of a finding; however, we do agree that data security policies could be strengthened in some areas and agree to continue our risk assessments as we have always conducted. We will consider the recommended changes and implement such changes that are appropriate to the IT security environment at UOM to strengthen controls over data security. 2. The University of Memphis did not report student status change dates correctly,
resulting in excessive grace periods for repayment of Perkins loans
Finding
The University of Memphis did not ensure that proper notification procedures were followed for graduates with Perkins loans. As a result, the graduates received grace periods of
47
more than a year, instead of the proper nine months, before beginning repayment of their Perkins loans.
According to the 2012-2013 Federal Student Aid Handbook, Volume 6, p. 109, “A
Perkins borrower is entitled to an initial grace period of nine consecutive months after dropping below half-time enrollment.” In addition, the Handbook states on page 110, “A grace period is always day specific – an initial grace period begins the day after the day the borrower drops below half-time enrollment.”
For the year ended June 30, 2013, we reviewed the files of 25 Perkins loan recipients
entering repayment to determine whether repayment status began nine months after dropping below half-time attendance, as required. Two out of 25 recipients tested (8%) were not required to begin repayment of their loans for over a year. These two individuals were law school students who graduated on May 12, 2012, and did not enter repayment until June 1, 2013. We then expanded our testwork to include all Perkins recipients who graduated in spring 2012 and discovered that 11 of 60 Perkins graduates tested (18% of the population, all of whom were law school graduates) graduated on May 12, 2012, but did not begin repayment until June 1, 2013.
Based on discussions with the Associate Director of Financial Aid and the Bursar’s
Coordinator of Collections, Perkins loan servicing is handled by an outside vendor, University Accounting Services (UAS), which sends required reminder notifications during the grace period and initiates repayment plans nine months after a student’s reported status change to less than half-time attendance. The Bursar reported these status changes as having occurred on August 25, 2012, based on information supplied by the Financial Aid Department. Accordingly, UAS required the students to begin repaying their loans on June 1, 2013, approximately nine months after August 25, 2012, since UAS was unaware that the status changes had actually occurred on May 12, 2012.
When a Perkins loan recipient drops below half-time attendance at The University of
Memphis, a representative of the student’s college is required to enter the status change into the Banner student information system on the day the school becomes aware that the change occurred. An employee in the Financial Aid Department, using a Hyperion report prepared by Business and Finance Support Services on the 5th of each month, identifies all reportable status changes and emails the information to the Bursar’s Office, which in turn relays the information to UAS. If the status change is discovered after it actually occurred, the date of the status change, not the date it was discovered, should be reported so that the allowable grace period is not exceeded.
However, for the spring 2012 semester, a deviation from this standard process caused the
errors previously noted. The Registrar at the law school did not enter the school’s spring graduates into Banner until 38 days after graduation, on June 19, 2012. At this point, according to the Associate Director of Financial Aid, the Hyperion report on which the Financial Aid Department relied did not include the 11 law school graduates mentioned above since the report no longer accessed status changes from the spring term. On August 25, 2012, as the fall semester began, the Hyperion report noted the students as “not enrolled,” and the Financial Aid Department reported them to the Bursar as students whose status had changed on August 25,

48
2012 instead of May 12, 2012. The Bursar supplied this information to UAS, who then sent the required reminder notifications during the grace period and began the repayment plans on June 1, 2013, approximately nine months after the incorrectly reported graduation date, but more than a year after the graduations actually occurred.
Not accurately reporting student status changes to the loan servicer resulted in a delayed initiation of the loan repayment process. That delay prevented funds from returning to the program for the use of other prospective Perkins loan borrowers.
Recommendation
The university should initiate necessary procedures to ensure that the correct dates of status changes for Perkins loan recipients are reported to the loan servicing contractor.
Management should also ensure that risks such as those noted in this finding are
adequately identified and assessed in the university’s risk assessment activities and should identify specific staff to be responsible for the design and implementation of internal controls to ensure timely reporting, to monitor compliance with all requirements, and to take prompt action should exceptions occur.
Management’s Comment We concur with the finding and recommendation. The university has implemented controls to ensure that all law student status changes are timely reported to the loan servicer. The law school is now reporting expected graduation dates so that these status changes will be identified earlier. In order to identify any law students who are graduating for a specific term, the Financial Aid Office will report expected graduation dates in addition to actual dates. Also, a Hyperion report is now run monthly to identify all student status changes (including law students), as well as those in a prior term. These new controls (i.e., expected graduation dates now reported in the Banner system by the law school and modified Hyperion reports to look at expected graduation dates and actual dates reported for prior terms) will ensure that student status changes are reported timely. The university currently has an established risk assessment process that includes Financial Aid processes with specific staff assigned responsibility for the design and implementation of internal controls, which includes controls for timely reporting and compliance monitoring. This exception was due to a unique process involving the Law School and was addressed immediately upon discovery. Care will be taken in the future to make sure that unique processes are considered and addressed as part of the university risk assessment process.