audit quality of complex accounting estimates: … ghosh_2016 summer... · 1 audit quality of...
TRANSCRIPT
1
Audit Quality of Complex Accounting Estimates: Evidence from Audit Tests of Goodwill and Special Charges
Aloke (Al) Ghosh** Zicklin School of Business
Baruch College, City University of New York
Cunyu Xing
School of Business and Administration South Western University of Finance and Economics
China and
Jun Wang
Zicklin School of Business Baruch College, City University of New York
January 2016 Version 6.1
____________________ **Corresponding author B12-225, One Bernard Baruch Way New York, NY 10010 Phone: 646.312.3184, email: [email protected]
We greatly benefited from the comments of Kathleen Bakarich, Jane Barton, Jeremy Bertomeu, Bob Colson, Ming Deng, Rajib Doogar, John Elliott, Henry Jarva, Karla Johnstone, Gopal Krishnan, Edward Li, Chen Li, Steve Lilien, Emma-Riikka Myllymäki, Hugo Nurnberg, Liz Peltier, Karthik Ramanna, Tom Ray, Bill Ruland, Min Shen, Jackie Siriviriyakul, the participants at the 2015 Annual Meetings of the American Accounting Association in Chicago, Aalto University Finance and Accounting workshop (Helsinki), and Oklahoma University accounting seminar. We are especially indebted to Chris Hogan and Carol Marquardt for suggesting some extensions.

2
Audit Quality of Complex Accounting Estimates: Evidence from Audit Tests of Goodwill and Special Charges
Abstract
Because auditing complex accounting estimates are particularly challenging for the auditor, and given the PCAOB inspections reports indicating audit deficiencies with the valuation tests of goodwill and other complex estimates, we highlight the quality of audit stress tests of goodwill, and audit tests of impairments, restructuring charges and other types of special charges. We find that: (1) auditors charge a substantial fee premium for testing goodwill account balances and there is an auxiliary fee surcharge for impairments, restructuring and other types of special charges, (2) audit tests of goodwill, impairments and other special charges lead to longer audit report lags, but not for restructuring charges, (3) the likelihood of an impairment or a special charge increases with audit quality, and (4) investors react negatively to all types of complex accounting estimates but the reaction depends on audit quality for impairments only. Collectively, our results underscore the prominence and relevance of audits of complex accounting estimates, especially goodwill account balances, which helps explain why goodwill impairments and special charges are timely and informative for investors. Keywords Audit tests of goodwill; Goodwill impairments; Audit fees; Audit report lag; Timeliness of goodwill; Informativeness of goodwill impairments; audit quality JEL Classification M40; M42; C42

3
1. Introduction
Auditing complex accounting estimates are particularly challenging for the auditor
because of estimation uncertainty, volatility in the financial markets, macroeconomic risks, and
injection of managerial biases (e.g., Griffith et al. 2015, Christensen et al. 2015, Bratten et al.
2013, Beatty and Webber 2005). The rising importance of complex accounting estimates in
today’s financial statements (Barth 2006), which affects financial reporting quality, dictates a
better understanding of the audit tests involving such estimates. In addition, PCAOB (2010, 2012)
inspection reports have identified chronic deficiencies in audits of fair value estimates and
impairments, which raises concerns about audit quality and integrity of financial statements.
Despite the prominence of goodwill and other complex accounting estimates including
restructuring charges, write-downs, write-offs, impairments, and reserves (commonly known as
“special charges”) in today’s financial statements,1 very little is known how auditors make their
decisions in complex and judgment-laden settings (Martin et al. 2006). In this study, we fill this
void by underscoring key auditing attributes of engagements with complex accounting estimates
and the associated stock market reaction to the announcement of such estimates. By comparing
the various attributes of engagements with and without complex accounting estimates, we can
remark on the quality of audits and whether investors view such information as timely and useful.
1According to Financial Times (July 17, 2008), the aggregate goodwill (goodwill impairment) recognized by
S&P 1500 companies exceeded $2 trillion ($281 billion). For some companies, goodwill is the single largest asset on their balance sheet (Chasan and Murphy 2013, Gu and Lev 2011). Similarly, the 1990s was marked by a dramatic rise in restructuring charges, write-offs and other special charges (Bens and Johnston 2009, Elliott and Hanna 1996, Francis et al. 1996).

4
While we analyze key complex accounting estimates, our pivotal research interest
remains goodwill, which is potentially more challenging to audit than other classes of complex
accounting estimates. For instance, audits of goodwill encompass fair value estimates of Level 3
assets (ASU 820), which are hard to verify, contain subjective information inputs and are prone
to managerial biases (Johnstone et al. 2014, Griffin 2014). Therefore, auditors must carefully
evaluate the underlying data, determine the appropriateness of assignments of assets/liabilities
to reporting units, and assess the appropriateness of discount rates and other assumptions used
to generate fair value estimates of reporting units by comparing them to historical experience
and industry standards (Deloitte 2011), which makes the audit task more onerous (Martin et al
2006). Further, goodwill testing must be conducted at least annually using a demanding “two-
step” procedure,2 while special charges are more infrequent and management has considerable
latitude in its estimation because the professional guidance is less detailed, which could render
audit tests of special charges somewhat less challenging.
According to the “professional perspective,” goodwill testing constitutes a large portion
of audit fees and the detailed testing leads to substantial delays in audit report date because
auditors must test all assertions associated with goodwill account balances (AU 328, AU 342),
2 Under ASU 350, in the first step, the company calculates the fair value of the reporting unit and then
compares that amount with the carrying amount of the unit including goodwill. If the carrying amount exceeds the fair value, the company must perform the second step, which measures the amount of the goodwill impairment by comparing the implied fair value of the reporting unit’s goodwill with the carrying amount of that goodwill. In response to concerns about the costs associated with the two-step impairment testing process, FASB introduced a simplified optional “qualitative assessment” framework that allows companies to skip the annual two-step test (ASU 2011-08).
5
verify fair value estimates, rely on valuation experts for independent verification of fair value
estimates,3 confront potential manipulation by management with the timing of impairments, and
require appropriate adjustments to fair value estimates when audit tests indicate biases or errors
in estimates. A contrasting “regulatory perspective” is that audit testing of goodwill is lacking in
quality because auditors often inappropriately rely on clients’ estimation of fair value estimates
to determine whether goodwill is impaired without obtaining sufficient independent audit
evidence (Komissarov et al. 2014, Herron and Gilbertson 2011), which suggests that goodwill
testing may not have a material effect on audit fees and audit report lag.
Similarly, special charges are material amounts and often subject to manipulation by
management (e.g. Riedl 2004, Burgstahler et al. 2002, Pourciau 1992), which increase the risk of
material misstatements (Bills et al. 2015). Therefore, according to the professional perspective,
auditors are expected to increase audit effort, conduct detailed substantive testing, invest more
in technology, require more experienced personnel, which is expected to lead to higher fees and
audit report delays. A conflicting viewpoint is that testing of special charges do not lead to higher
fees or delays in audit report date because of insufficient professional guidance pertaining to
these accounting estimates (Bens and Johnston 2009), which circumvents detailed audit testing.
Our study provides a deeper understanding of the quality of audit based on the following
tests. First, using audit fees as a proxy for audit effort (e.g., Bell et al. 2001, Bedard and Johnstone
2004), we investigate whether auditors charge a fee-premium for complex accounting estimates
3Because fair value estimates are difficult to verify (Ramanna and Watts 2012), auditors frequently seek the
help of valuation specialists for independent verification of fair value estimates and assumptions (AU 328).
6
and whether the fee-premium varies with auditor size, audit complexity, and auditor switching.
Second, using auditor report lag as a more direct measure of audit effort (e.g., Ashton et al. 1987,
Bamber et al. 1993), we analyze whether audit tests of goodwill and other complex accounting
estimates lead to unusual delays in auditor report lag. Third, we study whether audit quality plays
a role in the timing of impairments and the recognition of special charges. Finally, we analyze the
usefulness of complex accounting estimates by evaluating investor reactions to the release of
such information and whether the quality of information depends on audit quality.
Our tests are based on a large sample of publicly traded firms with available data from
2000 to 2013. To facilitate our analyses, we partition complex accounting estimates into four
board groups: (1) annual stress tests of goodwill, (2) goodwill impairments, (3) restructuring
charges, which include estimated exit/closing costs, and (4) other types of special charges
including impairment of intangibles, write-down of long-lived assets, and losses from
discontinued operations. Consistent with the professional perspective, the univariate analysis
indicates that clients with goodwill, with goodwill impairments, with restructuring costs, and
with other special charges pay considerably more than other clients without such traits.
In multivariate regressions of audit fees on Goodwill (goodwill to total assets) and
Goodwill-Impair (indicator for goodwill impairment), Restructuring-Charges (indicator for
restructuring charges), Special-Charges (indicator for other special charges), and after including
control variables, all the coefficients are highly significant which suggests that auditors charge
considerably more for audit tests of all classes of complex accounting estimates. Our estimates
suggest that the fee premium is large for testing goodwill for impairments; clients pay an

7
additional 1% for every 1% increase in goodwill. Further, clients pay an added 10% when goodwill
is impaired, an added 26% for restructuring charges, and an added 12% for other special charges.
When we partition the sample into Big 4 and non-Big 4, we find that the fee premium is
significantly larger for the Big 4 sample for goodwill testing and goodwill impairments but not for
restructuring or other complex accounting estimates.
A more powerful test of whether auditors are diligent in audits of goodwill is to study
variations in the goodwill-fee-premium over the changing landscape of goodwill accounting.
Between 2000 and 2001 when goodwill was amortized, the Goodwill coefficient is around 0.44.
For the transition period (2002), when goodwill amortization was no longer permitted, the
Goodwill coefficient increases to 0.53. The Goodwill coefficient jumps to 0.82 for fully phased in
two-step testing period (2003-2011). Finally, between 2012 and 2013 when goodwill testing was
simplified by FASB, the Goodwill coefficient remains at 0.70. Further, consistent with auditing
theories, we examine and find that that the goodwill-related fee premium is larger for companies
with more reportable segments, for companies with more foreign operations, for clients more
likely to have their goodwill impaired, and for companies with more intangible assets (excluding
goodwill).
Assuming that fees are a reliable proxy for effort (e.g., Ghosh and Tang 2015), our results
suggest that auditors charge more because testing complex estimates entails added audit work.
It is highly unlikely that the fee premium represents compensation for higher litigation risk. For
instance, a securities class action lawsuit was filed against Regions Financial Corp., and its
auditors, alleging that the goodwill impairment charge of $6 billion in the company’s 2008 fourth
8
quarter results was false and misleading. The plaintiffs asserted that the market turmoil of 2007
and 2008 should have led Regions to adjust goodwill much more and much earlier (Milbank et al.
2011). The District Court dismissed all claims on the grounds that goodwill impairment charge
represents “judgment and opinion, rather than fact.”4 Nonetheless, we also examine whether
audit testing of goodwill and other complex accounting estimates require more effort using audit
report lag as a more direct proxy for audit effort (e.g., Schwartz and Soo 1996). Consistent with
the audit fee results, we find that goodwill, goodwill impairments, and other special charges are
all associated with economically longer audit report lags, which suggest that goodwill testing,
goodwill impairments, and tests of other special charges are significantly involved. However, the
coefficient on restructuring charges is negative which raises some concerns about the audits of
restructuring charges.
We also investigate the role of audit quality on the timing of goodwill impairments,
restructuring and other special charges. Using auditor tenure, and auditor specialization as
alternative constructs for superior audit quality, and after controlling for other factors, we find
that goodwill impairments are more frequent when tenure is long and auditors are industry
specialists, which suggest that client- and industry-specific knowledge improves audit quality of
goodwill impairments. In contrast, restructuring and other special charges are more frequent for
clients with longer tenure but not when auditors are industry specialists, which suggest that only
client-specific knowledge improves audit quality of restructuring and other special charges.
4The plaintiffs subsequently appealed to the U.S. Court of Appeals, but the Second Circuit Court affirmed
the dismissal (see Fait v. Regions Financial Corp., No. 10-2311-cv; 2d Cir. Aug. 23, 2011).
9
If goodwill impairments provide timely new information, we expect investors to
incorporate this information at the time of the earnings announcements. Although prior studies
examine the information content of accounting estimates (e.g., Bens and Johnston 2009, Li et al.
2011, Francis et al. 1996, Elliott and Hanna 1996), the results are inconclusive. More importantly,
prior studies do not consider how audit quality might affect the information content of
accounting estimates. We find a strong negative stock market reaction around the earnings
release date for firms with goodwill impairments, with restructuring and other special charges.
More importantly, we show that the stock market reaction to accounting estimates is more
negative when audit quality is high. The results are the strongest for goodwill impairments which
is consistent with our priors that auditors are more diligent in their audits of goodwill relative to
other classes of accounting estimates.
Our study contributes to the literature as follows. We document that goodwill
impairments are timely and informative particularly when audit quality is high. However, our
results also suggest that goodwill testing imposes larger costs on clients who must pay more and
encounter potential delays in earnings announcements because auditors take longer to complete
their audits. Our results can inform regulators whether their concerns regarding audit testing of
goodwill, which are based on a limited number of inspections of actual audit procedures and
tests, extend to a broader cross section of companies. One concern with our study is that, in the
absence of access to audit work papers, we cannot test audit effort directly but must rely on
indirect proxies, which makes our analysis prone to measurement error.
10
We organize the remainder of the paper as follows. Section 2 develops our hypotheses.
Section 3 describes research methodologies. Section 4 shows data selection procedures. Section
5 presents empirical test results. Section 6 reports sensitivity analyses test results. Section 7
concludes the paper.
2. Background and hypotheses development
2.1. Background
PCAOB defines accounting estimate as “an approximation of a financial statement
element, item, or account. Accounting estimates are often included in historical financial
statements because the measurement of some amounts or the valuation of some accounts is
uncertain, pending the outcome of future events” (AU Section 342). While some accounting
estimates may be easily determinable, others are inherently subjective or complex because the
estimates involve multiple assumptions and intricate computational models. The subjective
nature of assumptions and the use of intricate calculations or models to determine complex
accounting estimates can result in a wide range of measurement uncertainty (PCAOB 2014).
In evaluating the degree of complexity or judgment in the recognition or measurement of
an accounting estimate, especially those measurements involving a wide range of measurement
uncertainty, PCAOB (2014) advises that the auditor should take into account: (a) the extent of
unobservable inputs used, (b) the type of models or calculations used, if applicable, (c) the degree
of subjectivity associated with a future occurrence or outcome of events underlying the
assumptions used such as estimates of future cash flows or prepayment assumptions, and (d) the

11
extent of market liquidity or activity for the asset or liability, if relevant to the measurement
objective.
Fair value measurements in the absence of reliable market prices are considered
particularly complex classes of accounting estimates because they involve high degree of
subjectivity and judgment, the estimation process often depends on subjective information
inputs with imprecise range of possible outcomes, and they are prone to misstatements (Griffin
2014). Yet, PCAOB considers fair value estimates as an important part of a company’s financial
statements and critical to investors’ decision-making. Goodwill constitutes a unique example of
Level 3 fair value asset measurement.5 Prior to ASC 350, goodwill was recognized as an asset and
amortized over a period not exceeding 40 years, which meant that goodwill was mostly exempt
from fair value measurement. However, ASC 350 abolished goodwill amortization; instead,
goodwill is to be evaluated for any impairment at least annually or when there are changes in the
market conditions indicating that the carrying amount of an asset obtained in an acquisition may
not be recoverable (Beatty and Weber 2006). Under ASC 350, the estimation of the fair value of
goodwill relies exclusively on management’s estimate of goodwill’s current value which is a
function of management’s future actions and implementation of future strategy thereby making
it particularly complex and challenging to audit (Ramanna and Watts 2012).
5Goodwill is recognized as an asset on the date of the acquisition measured as any excess of the acquisition-
date amounts of the consideration transferred over the acquisition-date amounts of the net identifiable assets acquired (ASC 805).

12
The periodic tests for goodwill impairment are to be based on a two-step process. In the
first step, the company calculates the fair value of the reporting unit and compares that amount
with the carrying amount of the unit including goodwill. Therefore, the emphasis in step one is
on discounted future cash flows, i.e., fair value estimates, and not on undiscounted future cash
flows as in the case of impairment tests for assets with definite lives. Further, the analyses are
performed at the reporting unit and not on asset groupings under SFAS 121. Reporting unit is
defined by management and how they view their business. Finally, management is required to
allocate goodwill to reporting units based on the expected synergistic benefits to those units
(Beatty and Weber 2006). In the second step, which is required if the carrying amount exceeds
the fair value, the company measures the amount of the goodwill impairment, if any, by
comparing the implied fair value of the reporting unit’s goodwill with the carrying amount of that
goodwill. Goodwill is considered impaired when the implied fair value of goodwill in a reporting
unit of a company is less than its carrying amount, or book value, including any deferred income
taxes.
Public and private companies expressed serious reservations about the recurring cost and
complexity of calculating the fair value of a reporting unit under the first step of the two-step
goodwill impairment tests. This is because most clients have to retain the services of a reputable
appraisal company to estimate the fair value of their reporting units which can become costly for
the client as the appraisal must be done at least annually. Some preparers recommended that
FASB consider allowing companies to use a qualitative approach to testing for goodwill
impairment. Responding to the market place concerns, FASB issued an update that simplifies how
13
companies test for goodwill impairment (ASC 2011-08). The amendments in the update permit a
company to first assess qualitative factors to determine whether it is more likely than not that
the fair value of a reporting unit is less than its carrying amount as a basis for determining
whether it is necessary to perform the two-step goodwill impairment. FASB defines more likely
than not as having a likelihood of more than 50 percent.
In determining whether it is more likely than not that the fair value of a reporting unit is
less than its carrying amount under the qualitative test, the company must assess relevant events
and circumstances including the following:
Macroeconomic conditions (such as a deterioration in general economic conditions, limited access to capital and fluctuations in foreign exchange rates),
Industry and market considerations (including a deterioration in the environment in which the company operates, increased competition, changes in the market for the company’s products or services, and regulatory or political developments),
Cost factors (such as increases in the costs of raw materials, labor and other items that have a negative effect on the company’s earnings and cash flow),
Overall financial performance (including negative or declining cash flow and declines in actual or planned revenue or earnings as compared with previous periods’ actual and projected results),
Other relevant company-specific events (such as changes in management, key staff, strategy or customers; potential bankruptcy; or litigation),
Events affecting the reporting unit (for example, changes in the composition or carrying amount of net assets; a more-likely-than-not expectation of selling or disposing of all or part of the reporting unit; or recognition of a goodwill impairment loss in the financial statements of a subsidiary of the reporting unit), and
For public companies, a sustained decrease in share price both in absolute and relative to peers.
Some other classes of complex accounting estimates that are recognized in the income
statement include restructuring charges, asset write-offs or write-downs, litigation reserves,
losses from disposal of assets, which are also collectively known as special charges. Special
charges are considered complex because: (1) of the inherent estimation uncertainty, (2) the
subjectivity involved and reliance on managerial judgements, and (3) they are frequently used as

14
device to manage earnings (Bens and Johnston (2009). A key distinction between testing goodwill
for impairment and special charges is that any goodwill testing must be done periodically while
special charges by definition are unusual and infrequent in nature.
2.2. Hypotheses development
2.2.1. Audit tests of goodwill and special charges
The independent auditor’s objective is to obtain sufficient and appropriate audit evidence
as a reasonable basis for forming an opinion (AU Section 230). However, obtaining audit evidence
for soft assets like goodwill and special charges, some prominent examples of complex
accounting estimates, poses special challenges for the auditor because verification is difficult.
Auditing theory and accounting standards on goodwill and special charges suggest that the
determination of the continued existence of goodwill and audits of special charges involve
significant audit effort and difficult audit judgments for several reasons.
First, auditors need to evaluate the reasonableness of management’s estimates, whether
the assumptions are consistent with market conditions, management’s plans and strategies, past
experience, other financial statement assumptions, and the risk associated with the future cash
flows based on the audit guidelines (AU Section 341). Second, because accounting standards
require that goodwill and other long-lived assets be reviewed for impairment whenever events
or changes in circumstances indicate that the carrying amount of an asset may not be
recoverable, auditors must be alert for any changes that may affect the recoverability of the
asset. Third, auditors need to consider the processes and controls used by management to
develop the estimates and then examine appropriate internal and external data in support of the

15
significant assumptions (AU 342). The auditors need to consider whether the information
gathered indicates that one or more significant assumptions are not reasonable. In some
instances, auditors may also decide to use the services of a valuation specialist to determine
whether there are material differences between the fair value estimates determined by an
appraiser engaged by the auditor and those determined by management.
Fourth, audits of Level 3 fair values and other complex estimates often involve substantial
risk of material misstatements (Whittington and Pany 2014, Watts 2003). The auditor must
understand the business, the current strategy in utilizing assets, and the likelihood of future
success. The level of the risk is influenced by length of the forecast period, the number of complex
assumptions, the degree of subjectivity associated with those assumptions, and the availability
of objective data. Therefore, auditors need to design added tests and procedures to reduce the
risk of material misstatements. Finally, when assets are impaired, losses are estimated,
restructuring charges are computed, auditors need to evaluate the reasonableness of
management’s determination of the magnitude of the charges (AU 328).
Collectively, the professional perspective suggests that auditing goodwill and other
complex accounting estimates are time consuming and costly because of the need for added
substantive testing, use of services of external specialist experts, reliance on more senior
manager and partner time, which is why clients are expected to pay more for such testing.
An opposing regulatory viewpoint is that auditors are not rigorous in their tests of
goodwill account balances or other complex accounting estimates because they tend to rely on
management’s representations without obtaining independent verification of the estimates

16
(Church and Shefchik 2012). For instance, the Audit Quality Review (AQR) team, formerly the
Audit Inspection Unit (AIU), which monitors the audit quality of major audit firms in the UK,
identified deficiencies in the audit of fair value measurements and impairments identified in a
significant number of audits inspected in 2013/14 (FRC 2014). For example, AIU raised concerns
about the adequacy of audit work carried out by KPMG in connection with the carrying value of
goodwill (Crump 2012). Failings included insufficient consideration of the reasonableness of
growth rates, source data and methodologies used by management in considering the potential
for impairment.
Similarly, PCAOB inspectors found deficiencies in connection with the valuations inherent
in performing a goodwill impairment test (PCAOB 2013, 2008). At the AICPA Fair Value
conference in 2012, PCAOB Board Member Jay D. Hansen (Hansen 2012) asserted that “PCAOB
inspectors identified deficiencies that included auditors' failures to evaluate the reasonableness
of significant assumptions used by issuers to estimate the fair value of reporting units in their
goodwill impairment assessments or in measuring fair value for other intangible assets and other
long-lived assets acquired in business combinations.” Inspectors also identified instances in
which auditors did not test, or tested only through inquiry of management, issuers' significant
assumptions, such as forecasted revenue growth rates, operating margins, discount rates,
implied control premiums, and weighted average cost of capital measures. Firms sometimes
neglected to challenge issuers' conclusions that goodwill need not be tested for impairment
despite the existence of impairment indicators, such as recent declines in issuers' stock prices or
reduced estimates of future revenue.

17
Thus, the conflicting theories make it difficult to predict whether tests of goodwill account
balances or special charges involve significant incremental audit effort which leads to auditors
charging more and whether the added tests lead to delays in the audit report date. Therefore,
our first two hypotheses stated in alternative form are as follows.
Hypothesis 1: Auditors charge considerably more for tests related to goodwill account balances and special charges.
Hypothesis 2: Audit report date is delayed because of tests of goodwill account balances and
special charges.
2.2.2. Audit quality and goodwill impairment and special charges
Ramanna and Watts (2012) investigate whether agency-based contracting motivations
explain the likelihood, the timing, and the amount of a goodwill impairment. In particular, they
examine whether the managerial decision to delay recognition of losses from goodwill
impairments depends on debt and compensation contracts, management reputation, and stock
price concerns. Similarly, Beatty and Webber (2006) examine whether managers use their
reporting discretion around the adoption of goodwill impairment standard (ASU 350) to
accelerate or delay the recognition of goodwill impairment charges.
Auditors are expected to play a strategic role in the timely recognition of impairments
and special charges when they are more independent, have greater expertise, or conduct added
audit testing and procedures because they are more likely to: (1) detect and correct material
misstatements, (2) ensure that financial statements comply with generally accepted accounting
principles, and (3) generally constrain managerial reporting discretion (Carmichael 1999,
DeAngelo 1981). Therefore, independence, expertise, and effort improve audit quality, which in

18
turn has a positive influence on the likelihood of goodwill impairments and special charges. Thus,
our third hypothesis is as follows.
Hypothesis 3: The likelihood of a goodwill impairment and special charges increases with audit quality.
2.2.3. Investor reactions to goodwill impairments and audit quality
If auditors are diligent in auditing goodwill account balances and special charges, goodwill
impairments and recognition of special charges are expected to be timely and informative for
investors. Therefore, one key implication is that the announcement of goodwill impairments and
special charges is associated with negative stock price reaction. In general, prior studies find
conflicting evidence surrounding the announcement of special charges (e.g., Li et al. 2011, Elliott
and Hanna 1996, Francis et al. 1996). We reexamine the results from prior studies by focusing on
a comprehensive sample of companies with impairments and special charges. More importantly,
if auditors play a critical role in evaluating goodwill account balances, assessing whether goodwill
is impaired and then estimating the amount of the write-off or other charges, we expect the stock
market reaction to the announcement of goodwill impairments to be strongly associated with
audit quality. Therefore, our fourth hypothesis is as follows.
Hypothesis 4: The information content of goodwill impairments and special charges is positively associated with audit quality.
3. Research design
3.1. Audit fees and complex accounting estimates
We partition complex accounting estimates into four groups: (1) Goodwill (ratio of
goodwill to total assets) (2) Goodwill-Impair (indicator variable for clients with a goodwill

19
impairment charges), (3) Restructuring-Charges6 (indicator variable for clients with restructuring
charges, which include estimated exit costs, closing costs, severance pay, reductions in
workforce, relocation charges and early retirements), and (4) Special-Charges (indicator variable
for clients with other types of special items, which exclude goodwill impairments and
restructuring charges, but include impairment of intangibles, write-down of inventory, assets
and receivables, reserves for litigation, and losses from discontinued operations or sale of assets
or investments).7 Drawing on the prior audit fee studies (e.g., Whisenant et al. 2003, Ghosh and
Lustgarten 2006, Hogan and Wilkins 2008), we estimate the following augmented audit fee
pricing regression model to estimate the effect of complex accounting estimates on audit fees.
Audit-fee = β0 + β1Goodwill+ β2Goodwill-Impair + β3Restructuring-Charges + β4Special-Charges +
β5Size + β6Segments + β7F-Sale + β8Ca-Cl + β9Inventory + β10Roa + β11Loss + β12Leverage
+ β13Ca-Ta + β14Growth + β15Market-Book + β16M&A + β17Discontinued + ε (1)
The dependent variable Audit-fee is the logarithmic transformation of the total fees
charged by the auditor for audit work. If auditors charge more for testing goodwill account
balances, for goodwill impairment, for restructuring charges, and for other special charges, β1 to
β4 are expected to be all positive.
6One prevalent and controversial special item is restructuring charge (Bens and Johnston 2009). Since the
1990s, an increasing number of companies have recorded restructuring charges and the magnitude of the charges have been increasing over time (Chaney et al. 1999, Elliott and Hanna 1996, Francis et al. 1996). Restructuring charges are prone to manipulation by management and frequently used to manage earnings (Burgstahler et al. 2002). Therefore, we separate restructuring charges from special items to better understand how auditors approach engagements with restructuring charges from other types of special items.
7Special items reflect all types of unusual or infrequent charges recognized on the income statement. Our
discussions with Compustat’s Capital IQ data specialists confirm that Compustat includes all classes of special items in their data variable SPI, which represents special items. Since we separately analyze goodwill impairments and restructuring charges, our definition of Special-Charges excludes these two items.

20
The control variables related to client characteristics are defined as follows. Size is the
logarithmic transformation of total assets, Segments is the sum of the number of operating
segments, F-Sale is the ratio of sales from foreign operations to total sales, Ca-Cl is the ratio of
current assets to current liabilities, Inventory is the ratio of inventory to total assets, Roa is the
ratio of operating income to total assets, Loss is an indicator variable equal to one when net
income is negative and zero otherwise, Leverage is the ratio of the sum of the long-term and
short-term debt to total assets, Ca-Ta is the ratio of current assets to total assets, Growth is the
percentage change in revenues between the current year and the prior year, Market-Book is the
ratio of the sum of the market value of equity, the book values of preferred stock, and the book
value of debt to total assets, M&A is an indicator variable when a client engages in mergers and
acquisitions and zero otherwise,8 and Discontinued is an indicator variable equal to one for clients
with discontinued operations and/or extraordinary items and zero otherwise,
3.2. Audit report lag and complex accounting estimates
As in prior studies (e.g., Ashton et al. 1987, Bamber et al. 1993), we use audit report lag
as a proxy for audit investments or audit effort. When audit investment needs are greater,
auditors are expected to work longer, which leads to longer audit report lags. As in Bronson et
8In Compustat EXPRESSFEED data, any merger/acquisition is determined by the mnemonic COMPSTAT with
the following codes: AA, AB, AF, AR and AS. AA reflects a merger/acquisition, AB reflects a merger with a new company being formed, AF reflects a combination AA and AN, where AN is the adoption of new accounting principles, AR reflects a combination AA and AZ, where AZ reflects data excluding discontinued operations, and AS reflects a combination AA and AC, where AC reflects accounting changes.

21
al. (2011), we estimate the following comprehensive audit report lag specification to study the
effects of complex accounting estimates on audit report lag.
Reportlag = β0 + β1Goodwill+ β2Goodwill-Impair + β3Restructuring-Charges + β4Special-Charges +
β5Size + β6Volume + β7Loss + β8Roa + β9Variance + β10Leverage + β11Beta +
β12Concentration + β13Book-Market + β14Inv&Rec + β15Discontinued + β16M&A +
β17Going-Concern + β18Big4 + β19Busy + Industry + ε (2)
The dependent variable Reportlag is the number of days between the fiscal year end and
the auditor signature date. If goodwill entails more audit effort which leads to delays in the audit
report, β1 to β4 are all expected to be positive.
We include several control variables that proxy for the (1) demand for information, (2)
proprietary costs, and (3) accounting and audit complexity. The following variables proxy for the
demand for information. Volume is the number of shares traded divided by the number of shares
outstanding. Variance is the standard deviation of daily returns over 200 trading days ending 45
days before the earnings announcement. Beta is estimated from the market model using daily
returns over 200 trading days ending 45 days before the earnings announcement.
The following variables proxy for proprietary costs. Concentration is the total sales of the
largest five companies within the same industry, where industry is based on the two-digit SIC
code, as a proportion of total sales within the industry. The following variables proxy for the
demand for information. Book-Market is the ratio of the book value of equity to the market value
of equity. Inv&Rec is the sum of receivables and inventory divided by total assets. Going-Concern
is an indicator variable which equals one when an auditor issues a going-concern opinion and
zero otherwise. Big4 is an indicator variable which equal one for companies with a Big 4 auditor
22
and zero otherwise. Busy is an indicator variable which equals one when client’s fiscal year-end
is December and zero otherwise. We also include industry controls for Utility (SIC code is between
4900 and 4949), Financial (SIC code is in the 6000s), and Technology (SIC codes are 2833-2836,
3570-3577, 3600-3674, 7371-7379, or 8731-8734). All the other variables are defined previously.
3.3. Audit quality and goodwill impairments
Drawing on Ramanna and Watts (2012) and Beatty and Weber (2006), we rely on the
following logistic model to estimate the likelihood of a charge.
Charges = β0 + βjAudit quality + βkMangerial opportunism + βlControl variables + ε (3)
The dependent variable Charges is an indicator variable that equals one for clients with goodwill
impairment charges, for clients with restructuring charges, and for clients with other types of
special charges, and zero otherwise. We use two proxies for audit quality: (1) Tenure, length of
the audit engagement, and (2) Industry-Specialist, an indicator variable equal to 1 when the
auditor’s market share in the industry is larger or equal to 20%. Audit quality is expected to higher
when tenure is long and with auditor specialization.
Similar to Ramanna and Watts (2012), we include four managerial opportunism variables:
(1) CEO-tenure, logarithm transformation of the number of years a CEO has served in office, (2)
Bonus, an indicator variable that equals one when the CEO is paid cash bonus and 0 otherwise,
(3) Leverage, the ratio of the sum of the long-term and short-term debt to total assets, and (4)
Goodwill, the ratio of goodwill to total asset. The coefficients on the managerial opportunism
proxies (βk) are expected to be negative.
23
The control variables are defined as follows. Internal-Control is an indicator variable equal
to 1 when a client’s internal control is effective. Age is the number of years the client is publicly
traded. ERC is the coefficient of the time series regression of price on earnings from continuing
operations per share using the 20 quarters of data. Relative-ROA is industry-adjusted ROA where
ROA is income before extraordinary items to total assets. Volatility is the standard deviation of
daily returns. Delist is an indicator variable which equals one if the client is traded on NASDAQ or
AMEX. Intangibles is intangible assets divided by total assets. Lag-size is Size from the prior year.
Returns is the buy-and-hold raw returns. All the other variables are defined previously.
3.4. Investor reactions to goodwill impairments and audit quality
We measure investor reactions to news about the recognition of various types of charges
around the earnings announcement date using the following specification
CAR = β0 + β1Charge-ratio + β2ΔEarnings + β3Size + β4Market-Book + β5Beta + ε (4)
The dependent variable CAR (cumulative abnormal returns) is measured over three-days
around the quarterly earnings announcement date where abnormal returns is defined as raw
returns less value-weighted market returns. The main independent variable (Charge-ratio) is
defined as follows: (1) Impair-Ratio is the absolute value of goodwill impairment charges divided
by total assets, (2) Restructure-Ratio is the absolute value of restructuring charges divided by
total assets, and (1) Special-ratio is the absolute value of other types of special charges divided
by total assets. If goodwill impairment and special items on the income statement provides new
information to investors, we expect β1 to be negative.

24
The control variables are defined as follows. ∆Earnings is income before extraordinary
items for current quarter minus the corresponding number four quarters prior divided by the
market value of equity at the beginning of the current fiscal quarter. All the other variables are
defined previously.
4. Data
Our data period begins with 2000 when audit fee data first became publicly available and
ends with 2013. For our audit fee and audit report lag tests, we collect data from the following
sources: (1) accounting data are from the S&P COMPUSTAT database, (2) audit fees are from Ives
Group’s Audit Analytics database, and (3) stock market data are from the CRSP database, and (4)
Analyst forecasts and firms’ actual earnings are from IBES.
Between the years 2000 and 2013, Audit Analytics has 167,184 observations with audit
fee data. When we match Audit Analytics with COMPUSTAT, we are able to identify 90,223
observations with information on both databases. The following 27,727 (observations) are
deleted because of missing data: audit fees (313), total assets (378), revenues for the current or
prior year (5,793), segments information (7,154), current assets or current liabilities (8,672),
inventory (807), income (142), long-term debt or short-term debt or preferred stock (4,468).
Finally, we delete 7,263 observations because audit report lag is either missing or negative or
greater than 365 days. Thus, data availability reduces our final sample to 55,233 firm-year
observations (8,732 unique clients).9
9To limit the effect of outlier observations, we winsorize the top and bottom one percent of the following
variables: Roa, Volume, Beta, Market-Book, Ca-Cl, Leverage, and Growth.
25
Table 1 presents the summary statistics (mean, median, first quartile and third quartile)
for the variables used in the audit fee regressions. The mean (median) audit fees are $1.520
($0.434) million. The mean (median) audit report lag is 70 (68) days. The mean (median) Goodwill
is 9.4% (1.1%), and the third quartile is 14.2% which suggests that the magnitude of goodwill
tends to be large. The mean value of Goodwill-Impair is 8%. About 8% of the observations are
associated with restructuring charges (Restructuring-Charges), while about 55% of the
observations are associated with special items (Special-Charges) which excludes restructuring
and goodwill impairments.
We also analyze several other client characteristics. The mean (median) size of a
company is $3.7 ($0.21) billion. The average company in the sample has 24% of its sales in foreign
jurisdictions (F-Sale) and has more than two operating segments (Segments). The mean (median)
liquidity as measured by current assets to current liability (Ca-Cl) and current assets to total
assets (Ca-Ta) is 2.87 (1.86). The mean (Median) Inventory is 0.095 (0.04). The median
profitability ratio based on ROA is around 2% with about 43% of the sample being associated with
losses (Loss). The mean value of Leverage is around 33%. The median growth in sales is 8%
(Growth). The median market-to-book ratio (Market-Book) is 1.277. About 18% are involved in
mergers and acquisitions (M&A). On average, 19% of the sample reports discontinued operations
(Discontinued).
Table 2 reports the distribution of the goodwill impairment, restructuring and other
types of special items. In Panel A, the mean goodwill impairment is $223 million (27%), the mean
restructuring charge is $30 million (4%), and the mean special items is $61 million (31%), which

26
indicates that the magnitudes are economically large. Panel B reports the frequency of
impairments/charges. About 60% (=1,625/2690) of the observations in the sample report only 1
impairment, about 10% only 1 restructuring charge, and about 5% only 1 special item. The
number of observations with 5 or more impairments/charges drops rapidly.
Table 3 reports the industry distribution of firms with goodwill impairment ratio,
restructuring ratio and special items ratio. The industries with the highest Impairment ratios are
in Shipbuilding, Railroad equipment and Candy & Soda industries with ratios above 200%.
Restructuring ratios are mostly in the single digits other than one industry (Other industries). Like
Impairment ratios, Special ratios tend to be high and more evenly distributed across the
industries.
5. Empirical results
5.1. Audit fee univariate results
Panel A of Table 4 reports univariate audit-fee differences between clients with and
without complex accounting estimates. The mean audit fees for clients with goodwill is $2.271
million, while that for clients without goodwill is $0.623 million. Thus, an average client pays
about 264% more when they have goodwill than when they do not. The difference in audit fees
is statistically significant at less than 1% level. The mean audit fees for clients with goodwill
impairments is $2.969 million, while that for clients without impairments is $1.395 million, which
indicates that an average client pays about 200% more when they have goodwill impairments
relative to other cases. Similarly, the fee differences are about 300% more when clients have
restructuring charges and about 200% more when clients have other special charges relative to
27
when they do not have such charges. Thus, the univariate results indicate that auditors charge
considerably more for complex accounting estimates.
5.2. Audit fee regression results
Table 4 reports the audit fee regression results where the dependent variable is the
natural logarithm of audit fees. In Model (1), which includes client attributes that are known to
affect audit fees, the coefficients on Goodwill (0.914, t-stat=41.93), Goodwill-Impair, (0.101, t-
stat=9.27), Restructuring-Charges (0.265, t-stat=35.18), and Special-Charges (0.122, t-stat=19.80)
are all positive and highly significant. Our audit fee regression results are consistent with
Hypothesis 1 stating that auditors charge more for complex accounting estimates. The adjusted
R-square is around 80%. Because fees are transformed to natural logarithm while goodwill is a
ratio, our results suggest that for a 1% increase in goodwill, auditors charge about 1% fee
surcharge. In addition, auditors charge an additional 10% (=1 ̶ e0.101) fee premium when goodwill
is impaired. Similarly, auditors charge an additional 30% fee premium for audit tests related to
restructuring charges and an added 13% for tests related to other special items.10
Because large auditors with deeper pockets and more resources can provide superior
audit quality, Big 4 might charge a larger fee premium for conducting goodwill audits than non-
10We get very similar results when we use an indicator variable for goodwill (instead of using Goodwill) or
when we use ratios (dollar amounts deflated by total assets) for goodwill impairments and special items. The results on the control variables are very similar to those reported in prior studies. Firm size is positive and highly significant which indicates that bigger clients pay more. In addition, clients pay more fees when they are more geographically and industrially diversified, report a loss, have higher leverage, have more current assets, have more growth options, and report discontinued operations. Clients pay less fees when they are more liquid, have lower inventory, and have higher sales growth.
28
Big 4. Therefore, we separately report the results for Big 4 and non-Big 4 in Models (3) and (4).11
We find that the coefficient on Goodwill, Goodwill-Impair, Restructuring-Charges, and Special-
Charges are all positive and highly significant for the Big 4 and the non-Big 4 samples with one
key difference. The coefficients on Goodwill (1.106 versus 0.574) and Goodwill-Impair (0.124
versus 0.064) in the Big 4 regression are almost twice that in the non-Big 4 regression. In sharp
contrast, the coefficients on Restructuring-Charges (0.230 versus 0.284) and Special-Charges
(0.113 versus 0.120) are very similar and not statistically different from one another. Consistent
with the importance and complexity of goodwill testing, we find that the Big 4 charge a high fee
premium for audit tests of goodwill and goodwill impairments but not for testing special items.
5.3. Additional goodwill and audit fee results
We conduct several additional analyses to increase the confidence in our results related
to the goodwill fee premium. First, we examine annual variations in the fee premium over the
changing landscape of goodwill accounting. We divide our sample into four time periods.
“Amortization” (2000 and 2001) reflects the years when goodwill was amortized, “Transition”
(2002) reflects the effective year for ASC 350, “Impairment” (2003-2011), when goodwill was to
be tested for any impairment (annually) using the two-step process, and “Qualitative
assessment” (2012-2013), when clients could rely on qualitative factors to determine whether to
perform the two-step goodwill impairment test. In Table 5, based on annual audit fee regressions,
11We prefer estimating separate regression for the two subsamples, rather than include Big 4 in Model 1
with added interactions between Big 4 and the goodwill variables, because our less restrictive estimation allows the coefficients on the control variables to vary between the Big 4 and non-Big 4.
29
we find that the average Goodwill coefficient from the Amortization period (2000-2001) is 0.44.
The Goodwill coefficient from the Transition period (2002) is 0.53. The difference between the
coefficients from two periods is statistically insignificant. However, the coefficient jumps to 0.82
for the Impairment period (2003-2013). The difference between the Impairment and Transition
periods is statistically significant. Finally, the Goodwill coefficient from the Qualitative
assessment period (2012-2013) is 0.70 and the difference between the Qualitative and the
Impairment periods is again statistically significant. Overall, our results from Table 5 suggest that,
as the accounting standards and the audit requirements became more complex for goodwill, the
premium associated with auditing goodwill for impairments also increased and when the
standards became less stringent fees also declined but not by as much.12
Second, it is possible that Goodwill regression estimates are biased upwards because we
pool companies with goodwill for the current and prior year along with companies having
goodwill only for the current year but not the prior year. Our primary interest is in the first group
of companies, i.e., testing for the continued existence of goodwill account balances.13 To better
understand the effect of auditing the continued existence of goodwill, in Table 6 we include (1)
an indicator variable Goodwillt-1&t which equals one when a client has goodwill for the current
12Although FASB is allowing companies to bypass the two-step goodwill impairment test based on
qualitative considerations from 2012 (ASU 2011-08), it is unlikely to have a considerable impact on audit effort. Auditors need to review various qualitative factors, assess the reasonableness of the company’s position, conduct ancillary analyses using projections derived at the reporting unit level, rely on sensitivity analyses based upon detailed qualitative factors associated with the company’s budget, and its most recent valuation (Deloitte 2013).
13It is not surprising that any goodwill created because of an acquisition is expected to increase audit fees
because of the added work related to an acquisition. Even though we include a variable which captures the effect of acquisitions (M&A), it may not fully incorporate the effect of the added audit work related to the current year acquisition.
30
year and the prior year, and (2) an interaction between Goodwill and Goodwillt-1&t. In Model (1),
we find that the coefficient on Goodwillt-1&t is positive and significant (0.351, t-stat=54.93)
indicating that auditors charge more for testing whether beginning goodwill account balance is
impaired. Further, in Model (2), the coefficient on the interaction between Goodwill and
Goodwillt-1&t is also positive and significant (0.590, t-stat=9.99) which suggests that the goodwill-
related fee premium increases with the magnitude of the goodwill.
Third, we examine whether the goodwill-related fee premium varies predictably
according to auditing theories. Under ASC 350, companies must allocate goodwill across various
reporting units and goodwill is to be tested for impairment for each reporting unit. Therefore,
the complexity of auditing goodwill is expected to increase as companies have more reporting
units (business or foreign operations). While information on reporting units are not publicly
disclosed, we use the mandated disclosures on segment reporting (Segments) and foreign
operations (F-Sale) as a surrogate for the complexity of auditing goodwill account balances. In
Model 1 of Table 7, when we interact Segments with Goodwill, the coefficient on
Goodwill×Segments (0.082, t-stat=8.37) is positive and significant. Similarly, in Model (2), when
we interact F-Sale with Goodwill, we find that the coefficient on Goodwill×F-Sale is again positive
and significant (0.965, t-stat=14.12). In Model (3), we interact Goodwill with an indicator variable
(Low-M/B) which equals one when the market-to-book ratio is less than one. When market
values are less than book values, it indicates deterioration in the market conditions and signals
that goodwill might be impaired which is why auditors are expected to charge more for testing
goodwill account balances in such instances. As expected, Goodwill×Low-M/B (0.110, t-stat=2.64)

31
is positive and significant. In Model (4), we interact Goodwill with intangible assets (Intangibles),
which is defined as intangible assets, excluding goodwill, to total assets. When clients have more
intangible assets, the reliance on fair value measurements increases and therefore auditors are
expected to charge more because the verification of assets becomes more complex. As expected,
Goodwill×Intangibles (2.054, t-stat=9.93) is positive and significant.
Overall, we find the following fee results: (1) a 1% increase in goodwill increases audit
fees by almost 1%, (2) when goodwill is impaired, there is an added fee premium of nearly 10%,
(3) the Big 4 charge significantly more than non-Big 4 for goodwill testing, (4) there is a significant
jump in the audit fee premium associated with goodwill for the post 2003 period which coincides
with the two-step goodwill impairment rule, (5) the goodwill-related fee premium is larger for
firms with more reportable segments, with low market-to-book and with high intangible assets,
and (6) auditors charge a fee premium of about 30% for restructuring charges and about 13% for
other special items. Our audit fee results are consistent with auditors charging substantially more
for testing complex accounting estimates because it involves significantly added audit work.
5.4. Goodwill, auditor switches and audit fees
Prior studies find that auditors offer a fee discount on initial engagements to attract new
clients (e.g., Ghosh and Lutgarten 2006, Craswell and Francis 1998, DeAngleo 1981). Therefore,
it is possible that auditors offer a similar fee discount for complex accounting estimates to attract
new clients. In Model (1) of Table 8, we replicate prior studies on low-balling or fee-discounting
of initial audit engagements. The coefficient on Initial, which is one when clients switch auditors,
32
is negative and significant (-0.083, t-stat=-7.42), which suggests that, relative to continuing
engagements, auditors offer a fee discount for initial engagements.
In Model (2), we additionally include the interaction between Initial and the four variables
measuring complex accounting estimates. We find that the coefficients on Goodwill×Initial (-
0.072, t-stat=-0.97) and that on Goodwill-Impair×Initial (0.031, t-stat=0.81) are both insignificant,
which suggest that auditors do not offer a fee discount for goodwill or goodwill impairments
when they acquire new clients. Similarly, the coefficient on Special-Charges×Initial is insignificant
(0.028, t-stat=1.27), which again suggests that auditors do not offer a fee discount for special
items. However, the coefficient on Restructuring-Charges×Initial is negative and significant (-
0.092, t-stat=-3.48), which suggests that auditors offer a fee discount for restructuring charges
when they acquire new clients.
While we find no evidence of fee discounting for goodwill or goodwill impairments, we
find some evidence of fee discounting when clients have some special items which can be a
potential source of concern.
5.5. Direct test of added audit effort: Audit report lag
In Table 9, we provide more direct evidence of the relationship between complex
accounting estimates and audit effort using audit report lag as a more direct proxy for audit
effort. The dependent variable Reportlag is the number of days between the fiscal end and the
auditor signature date. The number of observations drops because: (1) stock returns are missing
so Variance cannot be computed for 11,434 observations, (2) accounts receivable or inventory is
not available so Invrec cannot be computed for 136 observations, and (3) we delete 5,208

33
observations with Reportlag values greater than 90. Therefore, 38,455 observations are used to
estimate the audit report lag regressions.
Model (1) replicates the results from prior studies (Branson et al. 2011).14 In Model (2) we
additionally include the four variables measuring complex accounting estimates. The coefficients
on Goodwill (4.872, t-stat=7.89), Goodwill-Impair (1.600, t-stat=5.00), and Special-Charges
(0.984, t-stat=5.52) are all positive and significant. Consistent with Hypothesis 2, which states
that goodwill testing leads to delays in audit repot date, our results suggest that a 1% increase in
goodwill leads to a delay in the audit report date by 5 days and by another 2 days when a client
reports a goodwill impairment charge, and by another day for special charges. However, the
coefficient on Restructuring-Charges (-1.095, t-stat=-5.46) is negative and significant.
Inconsistent with Hypothesis 1, our results on restructuring charges suggest that auditors take
less time for auditing these types of complex accounting estimates. Because the 10-K and 10-Q
filing requirements vary between accelerated and non-accelerated filers, which might be
correlated with goodwill, in unreported results, we also estimate the audit report lag regressions
separately for accelerated and non-accelerated filers and find consistent results for both
subsamples.
14Although Bronson et al. (2011) include special items in their regression, they do not separate restructuring
charges from other types of special items. Similar to their results, we find that Loss, Leverage, Beta, Concentration, Discontinued, Going-Concern, and Busy are all positive and statistically significant, which suggests that clients with losses, with more debt, from industries with higher sales concentration, with discontinued operations, with going concern modified reports or having fiscal year ends that coincide with the busy season have longer audit report lags. The coefficients on Size, Volume, Roa, Inv&Rec, and Big4 are negative and statistically significant, which suggests that clients that are larger, with larger percentage of shares traded, with superior performance, having more inventory and receivables, and those audited by the Big 4 have shorter audit report lags. The coefficient on Book-Market is insignificant.
34
Consistent with the audit fee results, the results from audit report lag tests provide more
direct corroborating evidence that audit testing for goodwill, goodwill impairments and other
special items leads to significant delays in auditor report date but not for restructuring charges.
Because any delay in the audit report date is most likely to precipitate delays in earnings
announcement date, goodwill testing imposes real costs on clients both in terms of higher audit
fees and potential delays in earnings announcements.
5.6. Audit quality and the likelihood of goodwill impairments
In Table 10, we consider whether the likelihood of goodwill impairments, restructuring
and other special charges are affected by audit quality using two measures of audit quality –
auditor tenure (Tenure) and auditor specialization (Industry-Specialist). In Model 1, when the
dependent variable is Goodwill-Impair, Tenure (0.015, z=3.19) and Industry-Specialist (0.433,
z=4.11) are both positive and significant at the 1% level. Thus, consistent with Hypothesis 3, our
results suggest that the likelihood of a goodwill impairment increases with higher audit quality.
We also find that various contracting motivations (debt, compensation), and managerial
reputation affects the timeliness of goodwill impairments. CEOs with longer tenure, those that
are paid bonuses, and clients with higher leverage and a higher goodwill balance are less likely to
impair goodwill. The results on the control variables are also consistent with prior studies. Clients
that remain public for a longer period, that are bigger, and that have superior performance are
less likely to impair goodwill. In contrast, clients with higher volatility, with more reportable
segments, with more intangible assets, and those that were bigger the prior year are more likely
35
to impair goodwill. The pseudo R-square is around 13%. The observations decline to 8,052
because compensation and CEO-tenure data from Execucomp limit our sample to S&P 1500 firms.
In Models 2 and 3, when we use Restructuring-Charges and Special-Charges as dependent
variables, respectively, only Tenure is positive and significant (0.021, z=7.11; 0.010, z=3.16).
Industry-Specialist is insignificant. Thus, our results suggest that only auditor tenure has an effect
on the likelihood that a client recognizes special items.
5.7. Investor reactions to goodwill impairments and audit quality
If audit testing of complex accounting estimates are stringent and timely, a key prediction
is that investors are expected to respond to the announcement of goodwill impairments,
restructuring charges and other special charges. In contrast, if complex accounting estimates are
lacking in quality because the disclosure of such news provides limited information to investors,
we do not expect any stock market response to the announcement of complex accounting
estimates (Li et al. 2011).
In Table 11, we report the results of the stock market reaction around the earnings
announcement date. Because companies are expected to disclose and discuss important
reporting issues including any impairments and special charges, and how they impact earnings,
we concentrate on the earnings announcement date to assess how investors respond to goodwill
impairments and special charges. As in prior studies, our measure for stock market reaction is
cumulative abnormal returns (CAR) over a three-day window around the announcement date
where cumulative abnormal returns is raw returns minus value-weighted market returns.
36
In Panel A, we use a multivariate regression analysis to analyze how the stock market
reacts to the information contained in goodwill impairments by including Impair-Ratio (absolute
value of goodwill impairment divided by total assets) and after controlling for earnings surprise
and risk factors (ΔEarnings, Size, Market-Book and Beta). In Model 1, the coefficient on Impair-
Ratio is negative and significant (-0.067; t-stat=-7.51). In Model 2, additionally include a variable
for long auditor tenure (Long-Tenure is defined as 1 when auditor tenure is longer than 10 years
and 0 otherwise) and an interaction between Long-Tenure and Impair-ratio to examine whether
the information content of goodwill impairments varies with audit quality. We find that Impair-
ratio continues to be negative and significant (-0.053; t-stat=-5.14). Consistent with prior
research, we find that Long-Tenure is also positive and significant (0.001; t-stat=2.20). More
importantly, the coefficient on the interaction between Long-Tenure and Impair-ratio is negative
and significant (-0.058; t-stat=-2.77), which suggests that the stock market reaction to goodwill
impairments is more negative when the auditor-client relationship is long.
In Panels B and C, we repeat our analysis using Restructure-Ratio (absolute value of
restructuring charges divided by total assets) and Special-Ratio (absolute value of other special
charges divided by total assets), respectively. Similar to the Panel A results, we find that the
coefficients on Restructure-Ratio and Special-Ratio are both negative and significant (-0.049; t-
stat=-2.25; -0.045; t-stat=-6.42). The interaction coefficient between Restructure-Ratio and Long-
Tenure weakly significant (-0.099, t-stat=-1.82), while that between Special-Ratio and Long-
Tenure is insignificant (0.018, t-stat=1.09).
37
In Table 12, we construct a counter-factual market-based test to better understand the
value of audit stress tests of goodwill account balances. If goodwill impairments have negative
information content, firms with large amounts of goodwill not recognizing impairments is
expected to be good news to investors. Thus, we expect a positive stock market reaction to
earnings announcements when firms with large goodwill balances do recognize any goodwill
impairments. To test this conjecture, we create an indicator variable Goodwill-High which equals
one when goodwill to total assets is greater than the median value (0.097). We then estimate a
regression of CAR around the earnings announcement date on Goodwill-High. In Model (1),
Goodwill-High is positive and significant at the 5% level (0.001; t-stat=2.16). In Model (2) when
we include the other control variables from Table 11, the coefficient on Goodwill-High remains
positive and significant at the 1% level (0.002; t-stat=3.08). Our results suggest that the stock
market responds favorably to lack of goodwill impairments when firms have large goodwill
balances.
Overall, we find strong evidence consistent with Hypothesis 4 indicating that goodwill
impairments have information content and that this information content varies with audit
quality. While we find strong stock market reaction to the announcement of all types of special
charges, the stock market reaction to this type of information does not appear to vary with audit
quality.
6. Additional tests and analyses
6.1. Mergers, goodwill and audit fees
38
Auditors are expected to charge more following acquisitions because consolidations
increase: (1) the probability of a restatement, (2) the likelihood of new, difficult, or contentious
accounting issues arising during the merger year, and (3) the chances of business integration
problems. Therefore, it is important to account for all merger-related activities in our research
design before drawing inferences about impairment tests of existing goodwill account balances.
As in prior studies, we include an indicator variable M&A. However, one potential concern is that
our proxy for any merger and acquisition activity is not fully captured by the M&A variable.
Our own investigation of the data indicates that goodwill increases in instances when the
M&A variable indicates that a company did not engage in a merger or acquisition activity as
indicated by Compustat. Our conversations with Compustat data consultants confirm that the
M&A variable defined using Compustat codes may not capture all merger and acquisition activity.
We address this concern buy creating another indicator variable M&A-Plus which equals one
when Goodwill increases but M&A is equal to zero. Thus, M&A-Plus captures instances that
Compustat coding indicates there were no merger-related activity but goodwill nonetheless
increased from the prior year.15
In a sensitivity analysis, we replicate our audit fee regression analysis after additionally
including M&A-Plus as an control variable. Unreported results indicate the both M&A and M&A-
Plus are positive and significant which suggests that auditors are charging more for the years
clients engaging in mergers (as designated by Compustat) and for the years when goodwill
15Our data analysis indicates that 7,912 observations (or 14.32% of our sample) have M&A equal to zero
but are associated with an increase in Goodwill relative to the number reported in the prior year.
39
increases but compustat does not classify such observations as mergers. More importantly, the
coefficient on Goodwill remains positive and significant (0.901, t-stat=39.77) and that on
Goodwill-Impair is also positive and significant (0.165, t-stat=15.07).
6.2. Intangible versus tangible assets
Because all “soft assets” are hard to verify, auditors might charge a premium for all
intangible assets and not just goodwill. Also, auditors may not charge a fee premium for auditing
“hard assets” like plant, property, and equipment (PPE) because testing for their continued
existence involves less audit risk as verification is easier. In unreported results, we include
Intangibles-Other (total intangible assets less goodwill divided by total assets), Goodwill, Fixed-
Assets (PPE to total assets) and other control variables in the audit fee regressions. The coefficient
on Goodwill is positive and significant (0.864, t-stat=30.20), while that on Fixed-Assets is negative
and significant (-0.174, t-stat=-7.27). More importantly, the coefficient on Intangibles-Other is
positive and significant (0.763, t-stat=22.48). An F-test indicates that the coefficient on Goodwill
is larger than that on Intangibles-Other. Our results provide evidence that auditors charge a large
fee premium for all intangible assets, and not just goodwill, although the premium on goodwill
testing is larger.
7. Conclusions
We scrutinize whether auditors are diligent in their audit stress tests of comlex accounting
estimates by analyzing how testing of complex accounting estimates like goodwill, goodwill
impairments, restructuring charges, and other types of special items/charges recognized on the
Income Statement affect audit fees and audit report lag, whether audit quality affects the

40
likelihood of impairments and charges, and whether investor response to impairments/charges
depends on audit quality. Our results can inform academics, practitioners and regulators on the
quality, timing and informativeness of audit tests related to goodwill impairments and other
types of complex accounting estimates.
Our multivariate audit fee regression analyses suggest that: (1) a 1% increase in goodwill
leads to a 1% increase in audit fees, (2) clients pay an added 10% fee premium when goodwill is
impaired, (3) Big 4 charge considerably more for goodwill testing than non-Big 4, (4) the goodwill
fee premium varies with the complexity of goodwill audits, (5) auditors do not offer a fee discount
on testing goodwill or for goodwill impairments when clients switch auditors, and (6) clients pay
about 30% more for restructuring and about 13% more for other types of special charges. Using
audit report lag as a more direct proxy for audit effort, we find that goodwill testing and goodwill
impairments are associated with longer audit report lags, which suggest that auditing goodwill is
more involved. We find similar results for tests of other types of special charges. However, audit
report lag is less for firms with restructuring charges which can be a potential source of concern.
Using various proxies for audit quality, we also show that the audit quality is positively
associated with the likelihood of goodwill impairments which suggests that audit quality affects
the timing of goodwill impairments and other special charges. Finally, we show that the stock
market reaction around the earnings announcement date is negative to goodwill impairments
and that the magnitude of the negative market reaction depends on audit quality. While we find
evidence of strong and negative stock market reaction to restructuring and other types of special
41
charges, the magnitude of the market reaction to such news does not appear to depend audit
quality.
In summary, we provide strong and compelling evidence that auditors charge more for
goodwill, that goodwill testing leads to delays in the audit report date, and that goodwill
impairments are timely and informative. For special items the results are somewhat mixed.
Auditor charge considerably more for all types of special items but they take longer to sign off on
audit reports only for other types of special items. Investors respond to all types of special
charges but that reaction does not depend on audit quality.
Overall, our results provide evidence consistent with auditors recognizing the prominence
of testing goodwill, or other intangible assets, for impairments and that they appear to be diligent
in their audits, which is an essential result given the recent regulatory concerns related to audit
testing of goodwill. However, because audit tests of goodwill involve fair value estimates and
significant audit judgments, auditors can only test, document their tests, and comment on the
reasonableness of the assumptions made by management underlying the computations of fair
value estimates which is likely to make their assertions subjective and open to criticism.
Notwithstanding the regulatory concerns, our results also indicate that goodwill impairment
decisions are timely and informative for investors.
42
References Ashton, R. H., J. J. Willingham, and R. K. Elliott. 1987. An empirical analysis of audit delay. Journal of
Accounting Research 25 (2): 275-92. Bamber, E. M., L. S. Bamber, and M. P. Schoderbek. 1993. Audit structure and other determinants of audit report
lag: An empirical analysis. Auditing: A Journal of Practice & Theory 12 (1): 1-23. Bens, D., and R. Johnston. 2009. Accounting Discretion: Use or Abuse? An Analysis of Restructuring Charges
Surrounding Regulator Action. Contemporary Accounting Research 26: 673-698. Barth, M. E. 2006. Including Estimates of the Future in Today's Financial Statements. Accounting Horizons 20: 271-
285.
Beatty, A., B., and J. Weber, 2006, Accounting Discretion in Fair Value Estimates: An Examination of SFAS 142
Goodwill Impairments, Journal of Accounting Research, Volume 44, Issue 2, pages 257–288.
Bedard, J. C and J. M. Johnstone, 2004, Earnings Manipulation Risk, Corporate Governance Risk, and Auditors'
Planning and Pricing Decisions, The Accounting Review 79: 277-304.
Bell, T. B., W. R. Landsman, and D. A. Shackelford. 2001. Auditors' perceived business risk and audit fees: Analysis
and evidence. Journal of Accounting Research 39 (1): 35-43.
Bills, K. L., D. C. Jeter, and S. E. Stein. 2015. Auditor Industry Specialization and Evidence of Cost Efficiencies in
Homogenous Industries. The Accounting Review 90: 1721.
Bratten, B., L. M. Gaynor, L. McDaniel, N. R. Montague, and G. E. Sierra. 2013. The Audit of Fair Values and Other
Estimates: The Effects of Underlying Environmental, Task, and Auditor-Specific Factors. Auditing 32: 7-44.
Bronson, S., N., B., Hogan, C., E., H., Johnson, M., F., J., and K. Ramesh, 2011, The unintended consequences of PCAOB
auditing Standard Nos. 2 and 3 on the reliability of preliminary earnings releases, Journal of Accounting and Economics, Volume 51, Issues 1–2, 95–114
Burgstahler, D., J. Jiambalvo, and T. Shevlin. 2002. Do stock prices fully reflect the implications of special items for
future earnings? Journal of Accounting Research 40: 585-612.
Carmichael, D. R., 1999, In search of concepts of auditor independence. The CPA Journal (May): 39–43. Chasan, E., and M. Murphy, 2013, Companies get more wriggle room in soured deals, CFO Journal, November 12. Christensen, B. E, S. M. Glover, and D. A Wood. 2012. Extreme Estimation Uncertainty in Fair Value Estimates:
Implications for Audit Assurance. Auditing 31: 127-146. Church, B., K., C., and L. B. Shefchik , 2012, PCAOB Inspections and Large Accounting Firms. Accounting Horizons:
March 2012, Vol. 26, No. 1, 43-63.
43
Craswell, A. T. and J. R., Francis, 1999, Pricing initial audit engagements: A test of competing theories, The Accounting Review 74: 201-216.
Crump, R., 2012, KPMG told to improve audit of impairments, AccountancyAge,
http://www.accountancyage.com/aa/news/2184824/kpmg-told-improve-audit-impairments
DeAngelo, L., E., D., 1981, Auditor Size and Audit Quality, Journal of Accounting and Economics, Volume 3, Issue 3,
December 1981, 183–199 Deloitte, 2011, FASB’s new qualitative goodwill impairment assessment Implications and opportunities, Deloitte
Financial Advisory Services LLP, http://deloitte.wsj.com/cfo/files/2013/02/ qualitative_goodwill_impairment_assessment.pdf
Deloitte, 2013, Goodwill Impairment Testing: Building a Solid Approach to Step Zero, Deloitte Financial Advisory
Services LLP,
Elliott, J. A and D. J. Hanna, 1996, Repeated accounting write-offs and the information content of earnings,
Journal of Accounting Research 34: 135-155. Financial Accounting Standards Board (FASB), ASU 2011-08, Testing goodwill for impairments. Financial Accounting Standards Board (FASB), ASC 805, Business combinations. Financial Accounting Standards Board (FASB), ASC 350, Intangibles-goodwill and other. Financial Accounting Standards Board (FASB), ASC 360, Plant, property and equipment. Financial Accounting Standards Board (FASB), SFAS 121, Accounting for the Impairment of Long-Lived Assets and for
Long-Lived Assets to Be Disposed Of Financial Reporting Council, 2014, Audit quality inspections: Annual Report 2013/2014,
https://www.frc.org.uk/Our-Work/Publications/Audit-Quality-Review/Audit-Quality-Inspections-Annual-Report-2013-14.pdf
Francis, J., F., Hanna, J., D., H., and L. Vincent, 1996, Causes and Effects of Discretionary Asset Write-Offs, Journal of
Accounting Research, Vol.34, 117-134 Ghosh, A., and C. Tang, 2015, Financial reporting quality of family firms: The auditors’ perspective, Journal of
Accounting and Economics 60: 95-116. Ghosh, A., G., and S. Lustgarten, 2006, Pricing of Initial Audit Engagements by Large and Small Audit Firms,
Contemporary Accounting Research 23, 333–368. Griffin, J. B. 2014. The Effects of Uncertainty and Disclosure on Auditors' Fair Value Materiality Decisions. Journal of
Accounting Research 52: 1165-1193.
Griffith, E. E., J. S. Hammersley, and K. Kadous. Audits of Complex Estimates as Verification of Management Numbers:
How Institutional Pressures Shape Practice. Contemporary Accounting Research 32: 833-854.
44
Gu, F., G., and B. Lev (2011) Overpriced Shares, Ill-Advised Acquisitions, and Goodwill Impairment. The Accounting
Review, November 2011, Vol. 86, No. 6, 1995-2022.
Hansen, J. D., 2012, Auditing failure, http://pcaobus.org/News/Speech/Pages/06072012_ HansonAICPA.aspx
Herron, T. L. and D. L. Gilbertson, 2011, When Auditors Fail to Audit: Themes from PCAOB Enforcements. The CPA
Journal. Vol. 81, No. 5 Hogan, C., E., H., and M. S. Wilkins, 2008, Evidence on the Audit Risk Model: Do Auditors Increase Audit Fees in the
Presence of Internal Control Deficiencies?, Contemporary Accounting Research, Volume 25, Issue 1, 219–242
Johnstone, K, A. Grambling, and L. E. Rittenberg, 2014, Auditing: A Risk Based-Approach to Conducting a Quality
Audit, 10th Edition, Cengage Learning. Komissarov, S., J. T. Kastantin, and K. Rick, 2014, Impairment of long-lived assets: a comparison under the ASC and
IFRS, Accounting & Auditing, The CPA Journal, Vol.84 (5), 28-33. Li, Z., P. K. Shroff, R. Venkataraman, and I. V. Zhang, 2011, Causes and consequences of goodwill impairments, Review
of Accounting Studies 16, 745-778.
Martin, R. D., J. S. Rich, and T. J. Wilks. 2006. Auditing Fair Value Measurements: A Synthesis of Relevant Research.
Accounting Horizons 20: 287-303.
Milbank, Tweed, Hadley & McCloy LLP, 2011, Second circuit hold holds that statements of opinion are not actionable
under strict liability provisions of securities laws unless plaintiffs allege that the speaker did not believe
those opinions, http://www.milbank.com/images/content/6/2/6214/ 082911_Fait_v_Regions_Financial_%20Litigation_Client%20Alert.pdf
Public Company Accounting Oversight Board (PCAOB), 2014, Staff consultation paper: Auditing accounting estimates
and fair value measurements, August 19, 2014, http://pcaobus.org/Standards/Documents/ SCP_Auditing_Accounting_Estimates_Fair_Value_Measurements.pdf.
Public Company Accounting Oversight Board (PCAOB), 2013, Report on 2007-2010 inspections of domestic firms that
audit 100 or fewer public companies, PCAOB Release No. 2013-001, February 25, 2013. Public ompany Accounting Oversight Board (PCAOB), 2008, Report of the PCAOB’s 2004-2007 inspections of
domestic annually inspected firms, Release No. 2008-008, December 5, 2008. Public Cmpany Accounting Oversight Board (PCAOB), AU Section 230, Due Professional Care in the Performance of
Work. Public Company Accounting Oversight Board (PCAOB), AU Section 328, Auditing Fair Value Measurements and
Disclosures.
Public Company Accounting Oversight Board (PCAOB), AU Section 341, The Auditors’ Consideration of an Entity’s Ability to Continue as a Going Concern.

45
Public Company Accounting Oversight Board (PCAOB), AU Section 348, Auditing Accounting Estimates.
Ramanna K., R., and R., L. Watts,2012, Evidence on the use of unverifiable estimates in required goodwill impairment Review of Accounting Studies, Volume 17, Issue 4, 749-780
Ramanna, K., R., 2008, The implications of unverifiable fair-value accounting: Evidence from the political economy
of goodwill accounting, Journal of Accounting and Economics, Volume 45, Issues 2–3, August 2008, 253–281
Riedl, E. J. 2004. An Examination of Long-Lived Asset Impairments. The Accounting Review 79: 823-852.
Schwartz, K., B., and B. Soo, 1996, The Association Between Auditor Changes and Reporting Lags, Contemporary
Accounting Research, Volume 13, Issue 1, 353–370 Watts, R. L., 2003 Conservatism in Accounting Part I: Explanations and Implications. Accounting Horizons, Vol. 17,
No. 3, 207-221. Whisenant, S., S. Sankaraguruswamy, and K. Raghunandan, 2003, Evidence on the joint determination of audit and
non-audit fees. Journal of Accounting Research 41, 721-744. Whittington, O., and K. Pany, 2014, Principles of Auditing and Assurance Services, 19th edition,

46
Table 1 Summary statistics
Mean Median First Quartile Third Quartile
Audit Fees ($ million) 1.520 0.430 0.145 1.300
Report Lag (days) 70 68 54 84
Goodwill 0.094 0.011 0.000 0.142
Goodwill-Impair 0.080 0.000 0.000 0.000
Restructuring-Charges 0.231 0.000 0.000 0.000
Special-Charges 0.545 1.000 0.000 1.000
Total Assets ($ billion) 3.649 0.207 0.034 1.249
Segments 2.428 1.000 1.000 3.000
F-Sale 0.235 0.022 0.000 0.419
Ca-Cl 2.868 1.863 1.220 3.230
Inventory 0.095 0.040 0.000 0.156
Roa -0.321 0.017 -0.138 0.066
Loss 0.431 0.000 0.000 1.000
Leverage 0.329 0.176 0.010 0.365
Ca-Ta 0.507 0.504 0.289 0.724
Growth 0.253 0.080 -0.056 0.260
Market-Book 3.448 1.277 0.834 2.279
M&A 0.179 0.000 0.000 0.000
Discontinued 0.194 0.000 0.000 0.000
Audit Fees are the fees charged by the external auditor for audit related work (in million dollars). Report Lag is the difference between the auditor signature date and the firm’s fiscal year end date. Goodwill is the ratio of goodwill to total assets. Goodwill-Impair is an indicator variable that equals one for clients with goodwill impairment charges and zero otherwise. Restructuring-Charges is an indicator variable that equals one for clients with restructuring charges and zero otherwise. Special-Charges is an indicator variable that equals one for clients with special charges other than goodwill impairment and restructuring charges and zero otherwise. Segments is the number of operating segments, F-Sale is sales from foreign operations to total sales, Ca-Cl is current assets to current liabilities, Inventory is inventory to total assets, Roa is operating income to total assets, Loss is an indicator variable which equals one when net income is negative and zero otherwise, Leverage is the ratio of the sum of the long-term and short-term debt to total assets, Ca-Ta is current assets to total assets, Growth is the percentage change in revenues between the current and prior year, Market-Book is the ratio of the sum of the market value of equity, the book values of preferred stock, and the book value of debt to total assets, M&A is an indicator variable that equals one when a client engages in mergers and acquisitions and zero otherwise, and Discontinued is an indicator variable which equals one for clients with discontinued operations and/or extraordinary items and zero otherwise. The total number of observations is 55,233.

47
Table 2
Distribution of goodwill impairments, restructuring and special charges
Million dollars Ratio
Panel A: Magnitude of impairments, restructuring and special charges
Impairment 223.310 27.33%
Restructure-Charges 29.963 3.58%
Special-Charges 61.145 31.29%
Goodwill-Impair Restructure-Charges Special-Charges
Panel B: Frequency impairments, restructuring and special charges
Frequency of impairments/charges
1 1,625 1,314 1,722
2 1,238 1,456 2,384
3 747 1,362 2,694
4 408 1,220 3,088
5 240 1,020 3,220
6 108 984 2,922
7 77 903 3,073
8 56 720 2,720
9 36 945 2,421
10 or larger 77 2,827 9,676
Total 4,607 12,751 33,920
In Panel A we report the magnitude (in million dollars) of goodwill impairment charges (Goodwill-Impair), restructuring charges (Restructuring-Charges) and special items recognized on the income statement other than goodwill impairment and restructuring charges (Special-Charges). We also report the corresponding ratios (expressed as a percentage of total assets). In Panel B we report the frequency of goodwill impairments, restructuring and special charges.
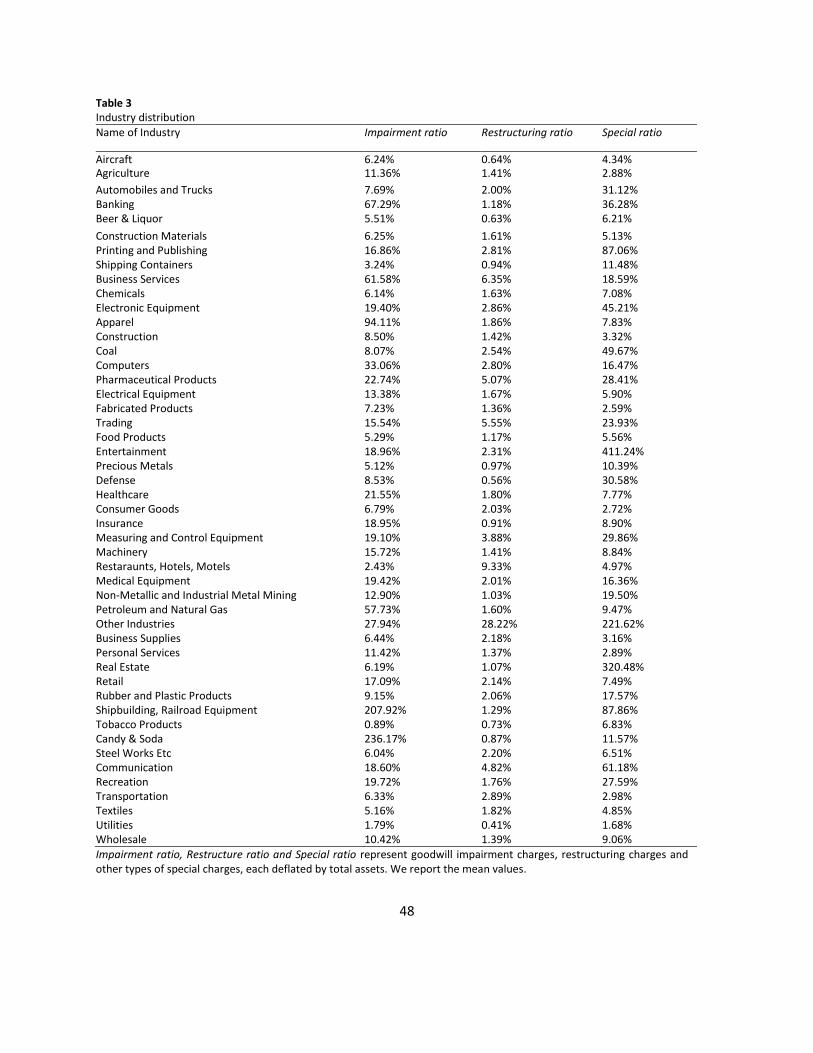
48
Table 3 Industry distribution
Name of Industry Impairment ratio Restructuring ratio Special ratio
Aircraft 6.24% 0.64% 4.34% Agriculture 11.36% 1.41% 2.88%
Automobiles and Trucks 7.69% 2.00% 31.12% Banking 67.29% 1.18% 36.28% Beer & Liquor 5.51% 0.63% 6.21%
Construction Materials 6.25% 1.61% 5.13% Printing and Publishing 16.86% 2.81% 87.06% Shipping Containers 3.24% 0.94% 11.48% Business Services 61.58% 6.35% 18.59% Chemicals 6.14% 1.63% 7.08% Electronic Equipment 19.40% 2.86% 45.21% Apparel 94.11% 1.86% 7.83% Construction 8.50% 1.42% 3.32% Coal 8.07% 2.54% 49.67% Computers 33.06% 2.80% 16.47% Pharmaceutical Products 22.74% 5.07% 28.41% Electrical Equipment 13.38% 1.67% 5.90% Fabricated Products 7.23% 1.36% 2.59% Trading 15.54% 5.55% 23.93% Food Products 5.29% 1.17% 5.56% Entertainment 18.96% 2.31% 411.24% Precious Metals 5.12% 0.97% 10.39% Defense 8.53% 0.56% 30.58% Healthcare 21.55% 1.80% 7.77% Consumer Goods 6.79% 2.03% 2.72% Insurance 18.95% 0.91% 8.90% Measuring and Control Equipment 19.10% 3.88% 29.86% Machinery 15.72% 1.41% 8.84% Restaraunts, Hotels, Motels 2.43% 9.33% 4.97% Medical Equipment 19.42% 2.01% 16.36% Non-Metallic and Industrial Metal Mining 12.90% 1.03% 19.50% Petroleum and Natural Gas 57.73% 1.60% 9.47% Other Industries 27.94% 28.22% 221.62% Business Supplies 6.44% 2.18% 3.16% Personal Services 11.42% 1.37% 2.89% Real Estate 6.19% 1.07% 320.48% Retail 17.09% 2.14% 7.49% Rubber and Plastic Products 9.15% 2.06% 17.57% Shipbuilding, Railroad Equipment 207.92% 1.29% 87.86% Tobacco Products 0.89% 0.73% 6.83% Candy & Soda 236.17% 0.87% 11.57% Steel Works Etc 6.04% 2.20% 6.51% Communication 18.60% 4.82% 61.18% Recreation 19.72% 1.76% 27.59% Transportation 6.33% 2.89% 2.98% Textiles 5.16% 1.82% 4.85% Utilities 1.79% 0.41% 1.68% Wholesale 10.42% 1.39% 9.06%
Impairment ratio, Restructure ratio and Special ratio represent goodwill impairment charges, restructuring charges and other types of special charges, each deflated by total assets. We report the mean values.

49
Table 4 Audit fees differences for companies with and without complex accounting estimates
Mean Audit Fee (million dollars) Mean Audit Fee Difference
Panel A: Audit fee differences
Goodwill 2.271 No-Goodwill (million $) 0.623 1.647 (50.66)***
Goodwill-Impair 2.969 No-Goodwill-Impair (million $) 1.395 1.574 (26.45)***
Restructuring-Charges 3.200 No-Restructuring-Charges (million $) 1.022 2.177 (57.05)***
Special-Charges 1.989 No-Special-Charges (million $) 0.969 1.019 (30.92)***
Full Sample Big4 Non-Big4
Model (1) Model (2) Model (3)
Panel B: Multivariate audit fee regressions
Intercept 9.521 (680.45)*** 9.355 (440.92)*** 9.860 (489.03)***
Experimental variables
Goodwill 0.914 (41.93)*** 1.106 (40.81)*** 0.574 (16.27)***
Goodwill-Impair 0.101 (9.27)*** 0.124 (9.61)*** 0.064 (3.30)***
Restructuring-Charges 0.265 (35.18)*** 0.230 (27.16)*** 0.284 (17.41)***
Special-Charges 0.122 (19.80)*** 0.113 (14.73)*** 0.120 (12.16)***
Control variables
Size 0.513 (319.50)*** 0.531 (226.13)*** 0.443 (147.05)***
Segments 0.027 (16.00)*** 0.029 (15.39)*** 0.011 (3.25)***
F-Sale 0.300 (31.33)*** 0.321 (27.82)*** 0.201 (12.15)***
Ca-Cl -0.039 (-42.39)*** -0.046 (-34.77)*** -0.030 (-23.33)***
Inventory -0.413 (-16.57)*** -0.431 (-12.03)*** -0.242(-7.16)***
Roa -0.077 (-28.95)*** -0.153 (-15.55)*** -0.057 (-20.95)***
Loss 0.081 (11.84)*** 0.031 (3.49)*** 0.143 (13.12)***
Leverage 0.062 (13.08)*** 0.032 (2.31)** 0.052 (10.72)***
Ca-Ta 0.978 (66.95)*** 1.188 (57.99)*** 0.657 (31.09)***
Growth -0.033 (-11.26)*** -0.028 (-6.09)*** -0.038 (-9.93)***
Market-Book 0.001 (3.78)*** 0.005 (7.85)*** 0.000 (0.01)
M&A -0.010 (-1.25) -0.021 (-2.30)** 0.029 (1.91)
Discontinued 0.079 (10.51)*** 0.074 (8.27)*** 0.104 (7.86)***
Adjusted R-Square 80.49% 74.73% 67.21%
Observations 55,233 36,370 18,863
In Panel A we report the mean audit fees (in million dollars) between firms with and without complex accounting estimates (goodwill, goodwill impairment, restructuring and special charges). We also report the difference in audit fees between the two samples and the associated t-values. In Panel B, the dependent variable Audit-fee is defined as the logarithmic transformation of the fees charged by the external auditor for audit related work. The independent variables are defined as follows. Goodwill is the ratio of goodwill to total assets. Goodwill-Impair is an indicator variable that equals one for clients with goodwill impairment charges and zero otherwise. Restructuring-Charges is an indicator variable that equals one for clients with restructure charges and zero otherwise. Special-Charges is an indicator variable that equals one for clients with special charges other than goodwill impairment and restructuring charges and zero otherwise. Segments is the number of operating segments. F-Sale is sales from foreign operations to total sales. Ca-Cl is current assets to current liabilities. Inventory is inventory to total assets. Roa is operating income to total assets. Loss is an indicator variable which equals when net income is negative and zero otherwise. Leverage is the ratio of the sum of the long-term and short-term debt to total assets. Ca-Ta is current assets to total assets. Growth is the percentage change in revenues between the current and prior year. Market-Book is the ratio of the sum of the market value of equity, the book values of preferred stock, and the book value of debt to total assets. M&A is an indicator variable that equals one when a client engages in mergers and acquisitions and zero otherwise. Discontinued is an indicator variable which equals one for clients with discontinued operations and/or extraordinary items and zero otherwise. ***, and ** denote significance at the 1% and 5% levels, respectively.

50
Table 5 Goodwill coefficients from annual audit fee regressions
Period Goodwill Difference Obs.
Amortization (2000-2001)
Average 0.44 6,634
Transition (2002)
Average 0.53 4,390
Transition ̶ Amortization 0.09
Impairment (2003-2011)
Average 0.82 37,143
Impairment ̶ Transition 0.29
Qualitative assessment (2012-2013)
Average 0.70 7,066
Qualitative ̶ Impairment -0.12
We report coefficients on Goodwill estimated from annual regressions based on Model 2 of Table 4. The sample period is divided into four sub-periods: (1) Amortization which includes the years when goodwill was amortized, (2) Transition which includes the effective year for ASC 350, (3) Impairment which represents the years when goodwill is to be tested for any impairment at least once a year, and (4) Qualitative assessment which represents the years when clients could rely on qualitative factors to determine whether to perform the two-step goodwill impairment test. We also report the difference in the average coefficients between the four sub-periods. ***, and ** denote significance at the 1% and 5% levels, respectively.

51
Table 6 Multivariate analysis of audit fees and goodwill for clients with beginning goodwill balances
Model (1) Model (2)
Intercept 9.586 (710.81)*** 9.528 (691.24)***
Experimental variables
Goodwill -0.017 (-0.32)
Goodwillt&t-1 0.351 (54.93)*** 0.264 (35.05)***
Goodwill × Goowillt&t-1 0.590 (9.99)***
Goodwill-Impair 0.077 (7.14)*** 0.073 (6.77)***
Restructuring-Charges 0.258 (34.61)*** 0.244 (32.83)***
Special-charges 0.114 (18.80)*** 0.113 (18.63)***
Control variables
Size 0.499 (311.90)*** 0.503 (313.55)***
Segments 0.022 (13.47)*** 0.023 (13.92)***
F-Sale 0.270 (28.48)*** 0.279 (29.39)***
Ca-Cl -0.038 (-40.76)*** -0.038 (-40.85)***
Inventory -0.473 (-19.21)*** -0.439 (-17.87)***
Roa -0.077 (-29.17)*** -0.078 (-29.66)***
Loss 0.105 (15.46)*** 0.109 (16.09)***
Leverage 0.059 (12.67)*** 0.061 (13.16)***
Ca-Ta 0.873 (61.50)*** 0.932 (64.58)***
Growth -0.024 (-7.95)*** -0.024 (-8.11)***
Market-Book 0.001 (3.29)*** 0.001 (3.36)***
M&A 0.033 (4.27)*** 0.006 (0.71)**
Discontinued 0.084 (11.28)*** 0.081 (10.89)***
Adjusted R-Square 80.91% 81.08%
The dependent variable Audit-fee is defined as the logarithmic transformation of the fees charged by the external auditor for audit related work. The independent variables are defined as follows. Goodwill is the ratio of goodwill to total assets. Goodwillt&t-
1 is an indicator variable that equals one for clients with goodwill in years t-1 and t and zero otherwise. Goodwill-Impair is an indicator variable that equals one for clients with goodwill impairment charges and zero otherwise. Restructuring-Charges is an indicator variable equals one for clients with restructure charges and zero otherwise. Special-Charges is an indicator variable that equals one for clients with special charges other than goodwill impairment and restructuring charges and zero otherwise. Size is the logarithmic transformation of total assets. Segments is the number of operating segments. F-Sale is sales from foreign operations to total sales. Ca-Cl is current assets to current liabilities. Inventory is inventory to total assets. Roa is operating income to total assets. Loss is an indicator variable which equals one when net income is negative and zero otherwise. Leverage is the ratio of the sum of the long-term and short-term debt to total assets. Ca-Ta is current assets to total assets. Growth is the percentage change in revenues between the current and prior year. Market-Book is the ratio of the sum of the market value of equity, the book values of preferred stock, and the book value of debt to total assets. M&A is an indicator variable that equals one when a client engages in mergers and acquisitions and zero otherwise. Discontinued is an indicator variable which equals one for clients with discontinued operations and/or extraordinary items and zero otherwise. The total number of observations is 55,233.
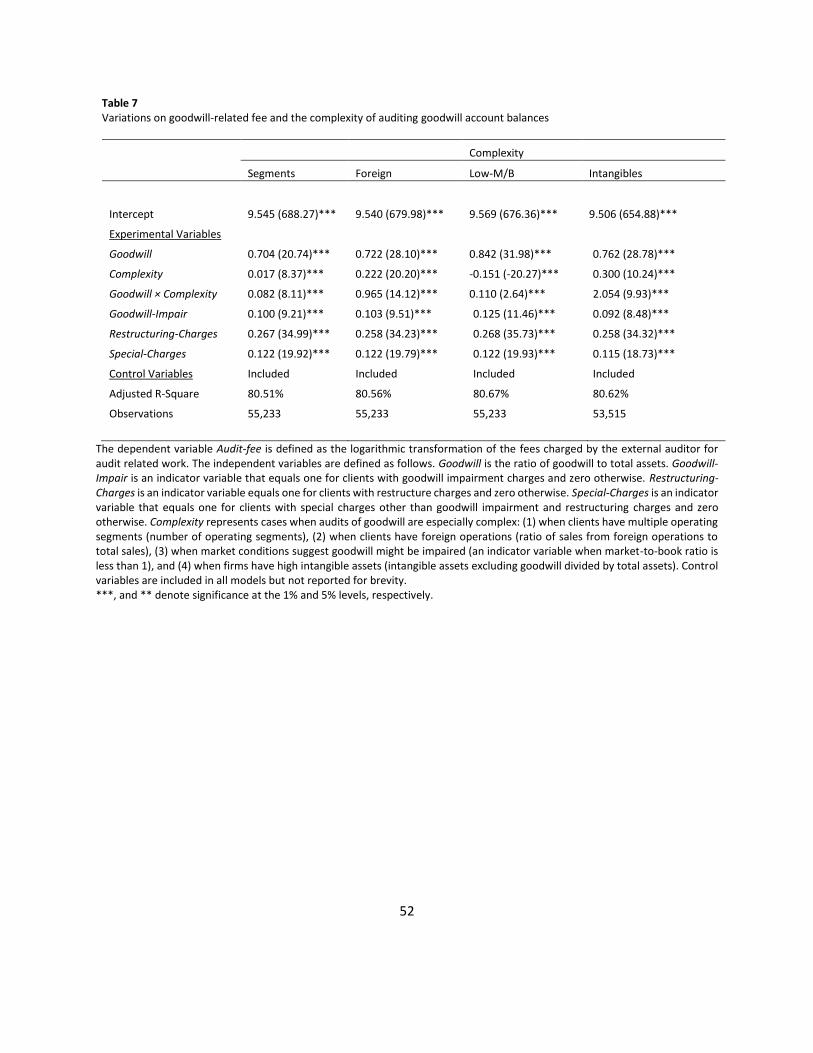
52
Table 7 Variations on goodwill-related fee and the complexity of auditing goodwill account balances
Complexity
Segments Foreign Low-M/B Intangibles
Intercept 9.545 (688.27)*** 9.540 (679.98)*** 9.569 (676.36)*** 9.506 (654.88)***
Experimental Variables
Goodwill 0.704 (20.74)*** 0.722 (28.10)*** 0.842 (31.98)*** 0.762 (28.78)***
Complexity 0.017 (8.37)*** 0.222 (20.20)*** -0.151 (-20.27)*** 0.300 (10.24)***
Goodwill × Complexity 0.082 (8.11)*** 0.965 (14.12)*** 0.110 (2.64)*** 2.054 (9.93)***
Goodwill-Impair 0.100 (9.21)*** 0.103 (9.51)*** 0.125 (11.46)*** 0.092 (8.48)***
Restructuring-Charges 0.267 (34.99)*** 0.258 (34.23)*** 0.268 (35.73)*** 0.258 (34.32)***
Special-Charges 0.122 (19.92)*** 0.122 (19.79)*** 0.122 (19.93)*** 0.115 (18.73)***
Control Variables Included Included Included Included
Adjusted R-Square 80.51% 80.56% 80.67% 80.62%
Observations 55,233 55,233 55,233 53,515
The dependent variable Audit-fee is defined as the logarithmic transformation of the fees charged by the external auditor for audit related work. The independent variables are defined as follows. Goodwill is the ratio of goodwill to total assets. Goodwill-Impair is an indicator variable that equals one for clients with goodwill impairment charges and zero otherwise. Restructuring-Charges is an indicator variable equals one for clients with restructure charges and zero otherwise. Special-Charges is an indicator variable that equals one for clients with special charges other than goodwill impairment and restructuring charges and zero otherwise. Complexity represents cases when audits of goodwill are especially complex: (1) when clients have multiple operating segments (number of operating segments), (2) when clients have foreign operations (ratio of sales from foreign operations to total sales), (3) when market conditions suggest goodwill might be impaired (an indicator variable when market-to-book ratio is less than 1), and (4) when firms have high intangible assets (intangible assets excluding goodwill divided by total assets). Control variables are included in all models but not reported for brevity. ***, and ** denote significance at the 1% and 5% levels, respectively.
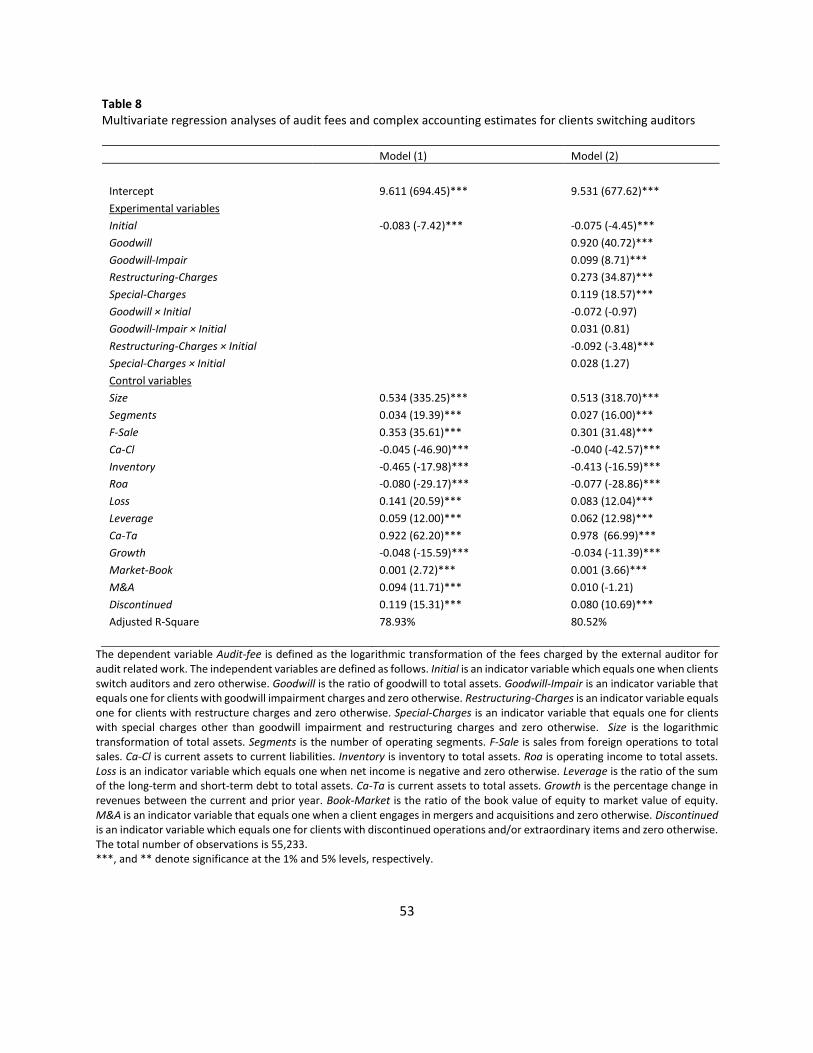
53
Table 8 Multivariate regression analyses of audit fees and complex accounting estimates for clients switching auditors
Model (1) Model (2)
Intercept 9.611 (694.45)*** 9.531 (677.62)***
Experimental variables
Initial -0.083 (-7.42)*** -0.075 (-4.45)***
Goodwill 0.920 (40.72)***
Goodwill-Impair 0.099 (8.71)***
Restructuring-Charges 0.273 (34.87)***
Special-Charges 0.119 (18.57)***
Goodwill × Initial -0.072 (-0.97)
Goodwill-Impair × Initial 0.031 (0.81)
Restructuring-Charges × Initial -0.092 (-3.48)***
Special-Charges × Initial 0.028 (1.27)
Control variables
Size 0.534 (335.25)*** 0.513 (318.70)***
Segments 0.034 (19.39)*** 0.027 (16.00)***
F-Sale 0.353 (35.61)*** 0.301 (31.48)***
Ca-Cl -0.045 (-46.90)*** -0.040 (-42.57)***
Inventory -0.465 (-17.98)*** -0.413 (-16.59)***
Roa -0.080 (-29.17)*** -0.077 (-28.86)***
Loss 0.141 (20.59)*** 0.083 (12.04)***
Leverage 0.059 (12.00)*** 0.062 (12.98)***
Ca-Ta 0.922 (62.20)*** 0.978 (66.99)***
Growth -0.048 (-15.59)*** -0.034 (-11.39)***
Market-Book 0.001 (2.72)*** 0.001 (3.66)***
M&A 0.094 (11.71)*** 0.010 (-1.21)
Discontinued 0.119 (15.31)*** 0.080 (10.69)***
Adjusted R-Square 78.93% 80.52%
The dependent variable Audit-fee is defined as the logarithmic transformation of the fees charged by the external auditor for audit related work. The independent variables are defined as follows. Initial is an indicator variable which equals one when clients switch auditors and zero otherwise. Goodwill is the ratio of goodwill to total assets. Goodwill-Impair is an indicator variable that equals one for clients with goodwill impairment charges and zero otherwise. Restructuring-Charges is an indicator variable equals one for clients with restructure charges and zero otherwise. Special-Charges is an indicator variable that equals one for clients with special charges other than goodwill impairment and restructuring charges and zero otherwise. Size is the logarithmic transformation of total assets. Segments is the number of operating segments. F-Sale is sales from foreign operations to total sales. Ca-Cl is current assets to current liabilities. Inventory is inventory to total assets. Roa is operating income to total assets. Loss is an indicator variable which equals one when net income is negative and zero otherwise. Leverage is the ratio of the sum of the long-term and short-term debt to total assets. Ca-Ta is current assets to total assets. Growth is the percentage change in revenues between the current and prior year. Book-Market is the ratio of the book value of equity to market value of equity. M&A is an indicator variable that equals one when a client engages in mergers and acquisitions and zero otherwise. Discontinued is an indicator variable which equals one for clients with discontinued operations and/or extraordinary items and zero otherwise. The total number of observations is 55,233. ***, and ** denote significance at the 1% and 5% levels, respectively.
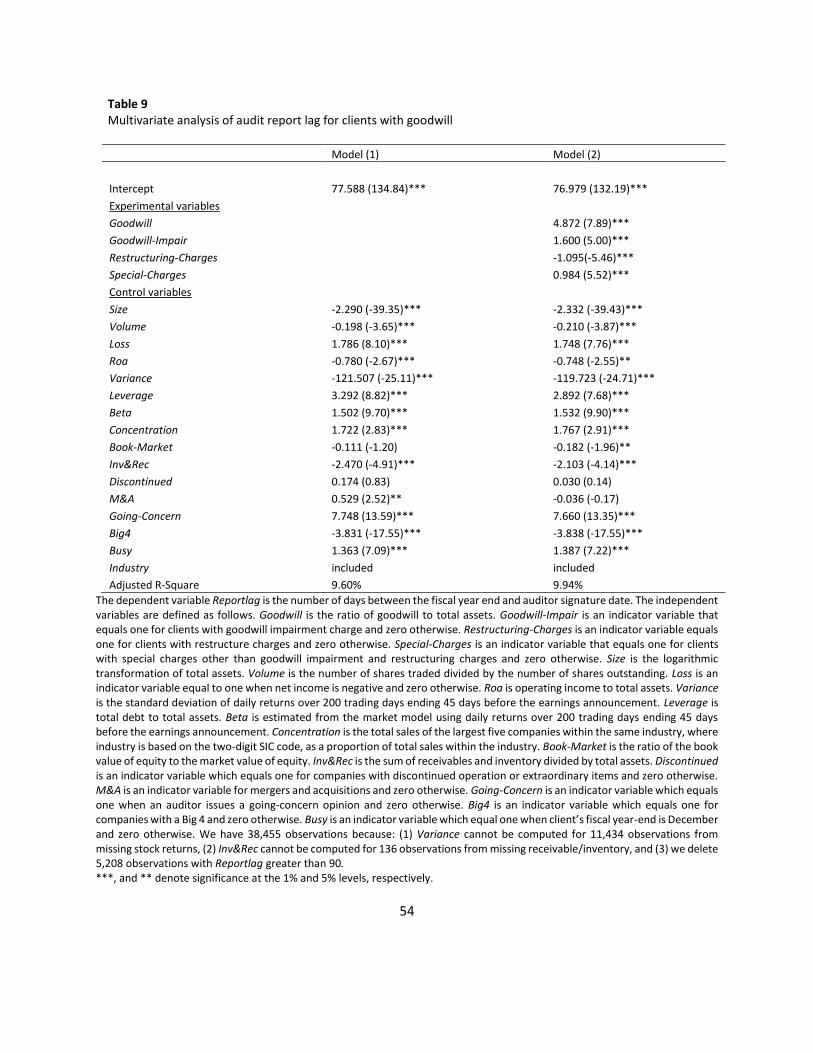
54
Table 9 Multivariate analysis of audit report lag for clients with goodwill
Model (1) Model (2)
Intercept 77.588 (134.84)*** 76.979 (132.19)***
Experimental variables
Goodwill 4.872 (7.89)***
Goodwill-Impair 1.600 (5.00)***
Restructuring-Charges -1.095(-5.46)***
Special-Charges 0.984 (5.52)***
Control variables
Size -2.290 (-39.35)*** -2.332 (-39.43)***
Volume -0.198 (-3.65)*** -0.210 (-3.87)***
Loss 1.786 (8.10)*** 1.748 (7.76)***
Roa -0.780 (-2.67)*** -0.748 (-2.55)**
Variance -121.507 (-25.11)*** -119.723 (-24.71)***
Leverage 3.292 (8.82)*** 2.892 (7.68)***
Beta 1.502 (9.70)*** 1.532 (9.90)***
Concentration 1.722 (2.83)*** 1.767 (2.91)***
Book-Market -0.111 (-1.20) -0.182 (-1.96)**
Inv&Rec -2.470 (-4.91)*** -2.103 (-4.14)***
Discontinued 0.174 (0.83) 0.030 (0.14)
M&A 0.529 (2.52)** -0.036 (-0.17)
Going-Concern 7.748 (13.59)*** 7.660 (13.35)***
Big4 -3.831 (-17.55)*** -3.838 (-17.55)***
Busy 1.363 (7.09)*** 1.387 (7.22)***
Industry included included
Adjusted R-Square 9.60% 9.94%
The dependent variable Reportlag is the number of days between the fiscal year end and auditor signature date. The independent variables are defined as follows. Goodwill is the ratio of goodwill to total assets. Goodwill-Impair is an indicator variable that equals one for clients with goodwill impairment charge and zero otherwise. Restructuring-Charges is an indicator variable equals one for clients with restructure charges and zero otherwise. Special-Charges is an indicator variable that equals one for clients with special charges other than goodwill impairment and restructuring charges and zero otherwise. Size is the logarithmic transformation of total assets. Volume is the number of shares traded divided by the number of shares outstanding. Loss is an indicator variable equal to one when net income is negative and zero otherwise. Roa is operating income to total assets. Variance is the standard deviation of daily returns over 200 trading days ending 45 days before the earnings announcement. Leverage is total debt to total assets. Beta is estimated from the market model using daily returns over 200 trading days ending 45 days before the earnings announcement. Concentration is the total sales of the largest five companies within the same industry, where industry is based on the two-digit SIC code, as a proportion of total sales within the industry. Book-Market is the ratio of the book value of equity to the market value of equity. Inv&Rec is the sum of receivables and inventory divided by total assets. Discontinued is an indicator variable which equals one for companies with discontinued operation or extraordinary items and zero otherwise. M&A is an indicator variable for mergers and acquisitions and zero otherwise. Going-Concern is an indicator variable which equals one when an auditor issues a going-concern opinion and zero otherwise. Big4 is an indicator variable which equals one for companies with a Big 4 and zero otherwise. Busy is an indicator variable which equal one when client’s fiscal year-end is December and zero otherwise. We have 38,455 observations because: (1) Variance cannot be computed for 11,434 observations from missing stock returns, (2) Inv&Rec cannot be computed for 136 observations from missing receivable/inventory, and (3) we delete 5,208 observations with Reportlag greater than 90. ***, and ** denote significance at the 1% and 5% levels, respectively.

55
Table 10 The likelihood of impairments and special charges and audit quality
Impairments/Charges
Model 1 Model 2 Model 3
Goodwill-impair Restructuring-charges Special-charges
Intercept -3.523 (-12.12)*** -1.958 (-10.27)*** -1.816 (-8.66)***
Audit quality
Tenure 0.015 (3.19)*** 0.021 (7.11)*** 0.010 (3.16)***
Industry-specialist 0.433 (4.11)*** - 0.145 (-1.92) -0.076 (-0.93)
Managerial opportunism
CEO-tenure -0.126 (-2.94)*** -0.294 (-10.92)*** -0.052 (-1.85)
Bonus -0.187 (-2.09)** -0.292 (-5.36)*** -0.090 (-1.60)
Leverage -0.543 (-2.42)** -0.591 (-4.20)*** 0.394 (2.77)***
Goodwill -1.677 (-4.50)*** 0.147 (0.88)*** -0.003 (-0.02)
Control variables
Internal-control 0.207 (1.75) -0.271 (-3.85)*** 0.077 (1.06)
Age -0.015 (-4.39)*** -0.001 (-0.30)*** -0.011 (-4.67)***
ERC -0.001 (-0.54) -0.002 (-1.97)** -0.003 (-2.63)***
Relative-ROA -0.024 (-0.20) 0.176 (2.37)** 0.110 (1.41)
Volatility 16.141 (5.46)*** 13.172 (6.24)*** 15.330 (6.42)***
Delist 0.321 (0.54) 0.725 (1.58) 0.667 (1.16)
Size -0.693 (-11.07)*** -0.267 (-6.95)*** -0.175 (-4.43)***
Segments 0.293 (4.88)*** 0.243 (6.58)*** 0.216 (5.38)***
Intangibles 2.292 (7.53)*** 1.314 (7.12)*** 1.607 (7.37)***
Lag-size 0.783 (12.24)*** 0.462 (11.82)*** 0.449 (11.21)***
Returns -0.266 (-3.39)*** 0.065 (1.37) 0.094 (1.83)
Observations 8,010 8,010 8,010
Pseudo R-Square 13.23% 8.48% 7.54%
The dependent variable in Model 1 is Goodwill-Impair defined as an indicator variable that equals one for clients with goodwill impairment charge and zero otherwise, in Model 2 is Restructuring-charges defined as an indicator variable that equals one for clients with restructure charges and zero otherwise, and in Model (3) Special-Charges defined as an indicator variable that equals one for clients with special charges other than goodwill impairment and restructuring charges and zero otherwise. other types of special charges and zero otherwise. The two audit quality variables are Tenure, defined as the number of years the auditor has been engaged by the client, and Industry-specialist, defined as an indicator variable that equals one when the auditor’s market share in the industry is larger or equal to 20% and zero otherwise. The four managerial opportunism variables are defined as follows. CEO-tenure is the logarithm transformation of the number of years a CEO has served in office. Bonus is an indicator variable that equals one when the CEO is paid cash bonus and 0 otherwise. Leverage is the ratio of the sum of the long-term and short-term debt to total assets. Goodwill is the ratio of goodwill to total asset from the previous year. The control variables are defined as follows. Internal-control is an indicator variable that is equal to 1 when the firm’s internal control is effective and zero otherwise. Age is the number of years the client is publicly traded. ERC is the coefficient of the time series regression of price on earnings from continuing operations per share using the 20 quarters of data. Relative-ROA is industry-adjusted ROA where ROA is income before extraordinary items to total assets. Volatility is the standard deviation of daily returns. Delist is an indicator variable which equals one if the client is traded on NASDAQ or AMEX. Size is the logarithm transformation of the market value of equity. Segments is the logarithm transformation of the number of business segments. Intangibles is intangible assets divided by total assets. Lag-size is Size from the prior year. Returns is the buy-and-hold raw returns. ***, and ** denote significance at the 1% and 5% levels, respectively.

56
Table 11 Stock market reaction to goodwill impairments, restructuring and special charges and audit quality
Model (1) Model (2)
Panel A: Goodwill impairments
Intercept -0.0004 (-0.43) -0.0003 (-0.39)
Impair-Ratio -0.067 (-7.51)*** -0.053 (-5.14)***
Long-Tenure 0.001 (2.20)**
Impair-Ratio × Long-Tenure -0.058 (-2.77)***
∆Earnings 0.0003 (3.30)*** 0.0003 (3.22)***
Size 0.001 (8.55)*** 0.001 (7.87)***
Market-Book -0.00002 (-1.51) -0.00002 (-1.54)
Beta -0.003 (-11.28)*** -0.003 (-10.98)***
Observations 255,697 255,622
Panel B: Restructuring charges
Intercept -0.0004 (-0.50) -0.0004 (-0.45)
Restructure-Ratio -0.049 (-2.25)** -0.027 (-1.12)
Long-Tenure 0.001 (2.26)**
Restructure-Ratio× Long-Tenure -0.099 (-1.82)*
∆Earnings 0.0003 (3.41)*** 0.0003 (3.32)***
Size 0.001 (8.68)*** 0.001 (7.95)***
Market-Book -0.00002 (-1.49) -0.00002 (-1.52)
Beta -0.003 (-11.35)*** -0.003 (-11.02)***
Observations 255,748 255,622
Panel C: Special charges
Intercept 0.0002 0.28) 0.0002 (0.18)
Special-Ratio -0.045 (-6.42)*** -0.049 (-6.05)***
Long-Tenure 0.001 (1.84)*
Special-Ratio× Long-Tenure 0.018 (1.09)
∆Earnings 0.0003 (3.32)*** 0.0003 (3.32)***
Size 0.001 (8.17)*** 0.001 (7.58)***
Market-Book -0.00002 (-1.46) -0.00002 (-1.51)
Beta -0.003 (-10.97)*** -0.003 (-10.88)***
Observations 255,675 255,622
The dependent variable is three-day cumulative abnormal returns (CAR) around the earnings announcement date where abnormal returns is defined as raw returns less value-weighted market return. The independent variables defined as follows: Impair-ratio is the absolute value of goodwill impairment divided by total assets, Restructure-Ratio is the absolute value of restructure cost divided by total assets, Special-Ratio is the absolute special items after excluding goodwill impairment and restructure cost divided by total assets, Long-Tenure is an indicator variable that is equal to 1 if the length of the audit engagement is 10 years or more and zero otherwise, ∆Earnings is income before extraordinary items for current quarter minus the corresponding number four quarters prior divided by the market value of equity at the beginning of the current fiscal quarter, Size is the logarithmic transformation of total assets, Market-Book is the ratio of the sum of the market value of equity, the book values of preferred stock, and the book value of debt to total assets at the end of the current quarter, Beta is the systematic risk estimated from the market model using daily returns over 200 trading days ending 45 days before the earnings announcement. We limit Impair-ratio, Restructure-Ratio, and Special-ratio to be one or less than one to remove the effect of outlier observations. ***, ** and * denote significance at the 1%, 5% and 10% levels, respectively.
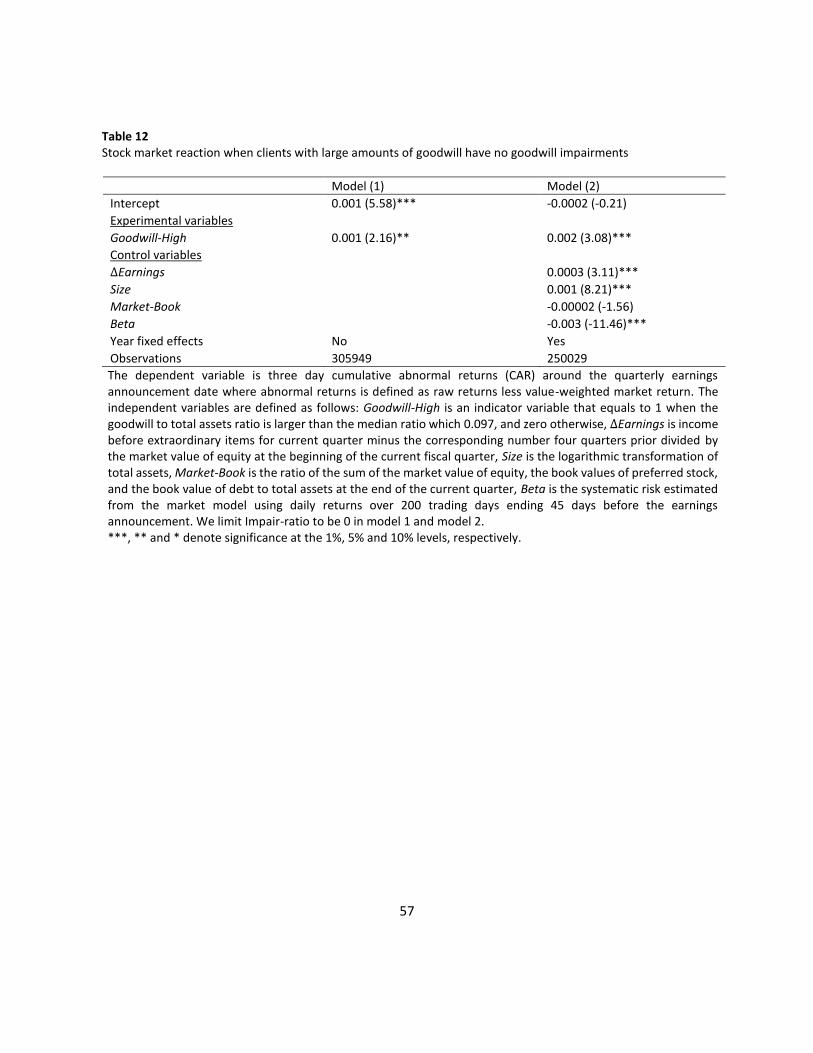
57
Table 12 Stock market reaction when clients with large amounts of goodwill have no goodwill impairments
Model (1) Model (2)
Intercept 0.001 (5.58)*** -0.0002 (-0.21)
Experimental variables
Goodwill-High 0.001 (2.16)** 0.002 (3.08)***
Control variables
∆Earnings 0.0003 (3.11)***
Size 0.001 (8.21)***
Market-Book -0.00002 (-1.56)
Beta -0.003 (-11.46)***
Year fixed effects No Yes
Observations 305949 250029
The dependent variable is three day cumulative abnormal returns (CAR) around the quarterly earnings announcement date where abnormal returns is defined as raw returns less value-weighted market return. The independent variables are defined as follows: Goodwill-High is an indicator variable that equals to 1 when the goodwill to total assets ratio is larger than the median ratio which 0.097, and zero otherwise, ∆Earnings is income before extraordinary items for current quarter minus the corresponding number four quarters prior divided by the market value of equity at the beginning of the current fiscal quarter, Size is the logarithmic transformation of total assets, Market-Book is the ratio of the sum of the market value of equity, the book values of preferred stock, and the book value of debt to total assets at the end of the current quarter, Beta is the systematic risk estimated from the market model using daily returns over 200 trading days ending 45 days before the earnings announcement. We limit Impair-ratio to be 0 in model 1 and model 2. ***, ** and * denote significance at the 1%, 5% and 10% levels, respectively.