audit of information technology capital expenditures and...
TRANSCRIPT

Office of the Auditor General/ Bureau du vérificateur général
AUDIT OF INFORMATION TECHNOLOGY CAPITAL
EXPENDITURES AND PROJECT APPROVAL PROCESS
2008
VÉRIFICATION DES DÉPENSES EN IMMOBILISATIONS LIÉES
AUX TECHNOLOGIES DE L’INFORMATION ET DU PROCESSUS
D’APPROBATION DES PROJETS


Audit of IT Capital Expenditures and Project Approval Process
Table of Contents
Executive Summary...................................................................................................................... i Résumé .......................................................................................................................................xiv 1 Introduction .......................................................................................................................... 1 2 Audit Objectives and Scope................................................................................................ 1 3 Audit Criteria and Approach............................................................................................. 2
4 Detailed Observations and Recommendations ............................................................... 4
4.1 Audit Objective 1: IT Capital Expenditure Analysis .............................................. 4 4.1.1 Overview – Total IT Spending for 2001 – 2006..................................................... 5 4.1.2 IT Capital Spending for 2001 – 2006 ..................................................................... 6 4.1.3 Client-Owned IT Capital Spending ...................................................................... 10 4.1.4 ITS-Owned IT Capital Spending .......................................................................... 15
4.2 Audit Objective 2: Project Prioritization and Approval Process......................... 18 4.2.1 Current Prioritization Process Review Results ..................................................... 18 4.2.2 Sample Program/Project Review Results ............................................................. 21
5 Mayor’s Task Force on eGovernment ............................................................................. 33 6 Conclusion .......................................................................................................................... 34 7 Acknowledgment............................................................................................................... 34
2008


Audit of IT Capital Expenditures and Project Approval Process
Executive Summary
Introduction The Audit of Information Technology (IT) Capital Expenditures and Project Approval Process was added to the 2007 audit plan as a result of the yearly risk assessment process.
The objectives of the audit were to:
1. Review IT capital expenditures during the period of 2001 to 2006 to obtain a clear and independent view of the City’s post amalgamation capital IT spending; and,
2. Identify and assess the City’s current processes for prioritizing and approving IT capital expenditures and to make recommendations where appropriate.
For the first audit objective, the scope focused on a data analysis of the historical spending of IT capital expenditures. The results of this analysis provides a view of the City of Ottawa’s IT capital spending patterns and provides some observations regarding these expenditures. The City of Ottawa Information Technology Services (ITS) and Financial Services branches provided the data for this analysis. This analysis considered the data provided for the period January 2001 to December 2006.
For the second audit objective, the assessment was made against agreed-upon criteria (i.e., COBIT1) and based on document reviews, interviews and a review of 12 selected IT capital programs/projects. City staff provided all information reviewed.
The audit looked at expenditures and the prioritization and approval process for the period 2001 to 2006. From the perspective of the process, it should be noted that the current process has only formally been in place since 2004 and that it has continued to evolve by improving and tailoring to the City environment. In addition, the sample of projects selected for review included programs/projects from the time period that includes Transition and prior to the process being fully implemented. This audit was originally scheduled to be presented in June 2008, however, the OAG was informed on March 3, 2008 that the data provided by management at the start of the audit was not accurate. The result was that the analysis on capital expenditures had
1 Control Objectives for Information and Technology (COBIT) is an industry recognized and accepted IT governance framework and supporting toolset that allows managers to bridge the gap between control requirements, technical issues and business risks. COBIT enables clear policy development and good practice for IT control throughout organizations. COBIT emphasizes regulatory compliance, helps organizations to increase the value attained from IT, and enables alignment. www.isaca.org
2008 Page i

Audit of IT Capital Expenditures and Project Approval Process
to be repeated and could not be completed in time for inclusion in the 2007 Annual Report.
Summary of Key Findings
Audit Objective 1 The table below summarizes the IT capital spending at the City of Ottawa for the 2001-2006.
($000) 2001 2002 2003 2004 2005 2006 ITS-Owned Capital Budget $13,326 $55,828 $10,274 $8,655 $9,315 $5,442ITS-Owned IT Capital Spending $7,347 $25,452 $29,393 $16,932 $9,108 $10,462Surplus/Deficit $5,979 $30,376 -$19,119 -$8,277 $207 -$5,020 Client-Owned Capital Budget $8,528 $10,486 $3,214 $475 $1,890 $2,322Client-Owned IT Capital Spending $5,138 $7,387 $5,375 $2,267 $4,454 $4,837Surplus/Deficit $3,390 $3,099 -$2,161 -$1,792 -$2,564 -$2,515 Total IT Capital Budget $21,854 $66,314 $13,488 $9,130 $11,205 $7,764Total IT Capital Spending $12,485 $32,839 $34,769 $19,199 $13,562 $15,298Surplus/Deficit $9,369 $33,475 -$21,281 -$10,069 -$2,357 -$7,534 Total City Operating Budget $1,681,519 $1,726,046 $1,838,862 $1,898,338 $1,988,358 $2,126,424Total City Capital Budget $528,989 $539,152 $505,042 $299,039 $639,791 $1,345,422Total City Budget $2,210,508 $2,265,198 $2,343,904 $2,197,377 $2,628,149 $3,471,846Total IT Spending as % of City Budget 2.13% 3.06% 3.07% 2.53% 1.93% 1.64% ITS Operating Spending $34,621 $36,376 $37,114 $36,332 $37,232 $41,813ITS-Owned IT Capital Spending $7,347 $25,452 $29,393 $16,932 $9,108 $10,462Client-Owned IT Capital Spending $5,138 $7,387 $5,375 $2,267 $4,454 $4,837Total IT Spending $47,106 $69,215 $71,882 $55,531 $50,794 $57,112 IT Operating as % of IT Total 73.50% 52.56% 51.63% 65.43% 73.30% 73.21%IT Capital as % of Total Capital 2.36% 6.09% 6.88% 6.42% 2.12% 1.14%ITS-Owned Capital as % of IT Total 15.60% 36.77% 40.89% 30.49% 17.93% 18.32%Client-Owned IT Capital as % of IT Total 10.91% 10.67% 7.48% 4.08% 8.77% 8.47%
Source: City of Ottawa Financial Services
A summary of the key observations resulting from the review of IT expenditures is provided below.
1. City of Ottawa IT Spending
• There are significant variances, both surplus and deficit, each year for both ITS- owned and client-owned capital budgets indicating a need for regular reporting on
2008 Page ii

Audit of IT Capital Expenditures and Project Approval Process
total IT capital spending as well as greater monitoring of these expenditures in the future.
• Total IT spending (capital and operating) between 2001 and 2006 was approximately 2% of the total City budget, slightly higher during Transition.
• During the period 2001 to 2006, the annual total IT spending (capital and operating) appeared generally to increase, when omitting the Transition related spending.
• Client-owned IT capital spending was relatively consistent and stable between 2001 and 2006, with the lowest spending in 2004 and the highest in 2002.
• ITS-owned IT capital spending varied by large amounts between 2001 and 2006, with the lowest spending in 2001 and the highest in 2003.
2. Client-Owned IT Capital Spending
• On average, client-owned IT capital spending remained relatively stable during the period 2001 to 2006.
• Highest three consumers were:
• Transit Services ($14.2M) 48% • Library Services ($5.2M) 18% • Fire Services ($4.5M) 15%
• Lowest three consumers were:
• CPS - Other ($116K) <1% • Utility Services ($78K) <1% • Traffic and Parking ($4K) < 1%
• Transit Services and Library Services were the only areas which had positive spending activity for every year between 2001-2006 – together consuming 66% of total client-owned IT capital.
• Only Utility Services and Traffic and Parking were not consistent consumers, i.e., they had spending in less than four out of the six years reviewed.
3. ITS-Owned IT Capital Spending
• During 2001 to 2006, the ITS-owned IT capital spending fluctuated considerably from year to year.
• The highest three activity consumers of ITS-owned IT capital, overall and consistently, between 2001 to 2006 were:
• Transition (40%, $39.9M); • Lifecycle maintenance for computers and peripherals (17%, 16.5M); and, • SAP platform sustainment (17%, $16.4M).
2008 Page iii

Audit of IT Capital Expenditures and Project Approval Process
• The lowest three activity consumers between 2001 to 2006 were:
• Departmental technology improvements (<1%, $167K); • Sustainment – electronic information technology (<1%, $132K); and, • Telecommunications (<1%, $71K).
Recommendation 1 That management ensure a complete analysis of corporate-wide IT capital spending is conducted on an annual basis to monitor and track IT expenditures.
Management Response Management agrees with this recommendation.
IT Services reviews both IT-owned and client-owned capital expenditures on a quarterly basis and provides input into quarterly financial and performance reports for Council. In addition, IT capital spending is consolidated in the annual OMBI performance report on information technology. The analysis conducted during the audit will be used as a template for future monitoring and year-end analysis of IT expenditures.
It should be noted that the analysis of budget vs. actual spending incorrectly concludes there have been significant surplus/deficits in terms of capital spending since amalgamation. This is misleading in that the analysis does not factor in the carry-over of unspent spending authority from year- to-year. Management provides regular reports to Council on operating and capital works-in-progress which clearly identify spending against budget and any variances.
Secondly, in order to ensure consistency and avoid confusion with the definitions used by Council for capital planning and reporting, the grouping of growth and strategic initiatives into one broader category is not recommended by Financial Services.
Audit Objective 2 Overall, the defined prioritization process maps well to the COBIT guidelines and controls. We have identified four key issues that could be addressed to strengthen the process and alignment with COBIT.
1. Priority Setting Criteria
The audit revealed that, while there is a process in place for portfolio value management to formally prioritize IT initiatives using the value plot, there are not consistent priority setting criteria being used to establish IT related priorities or priorities within a program with appropriate records of the decision regarding the priority.
2008 Page iv

Audit of IT Capital Expenditures and Project Approval Process
2. Governance
• The majority of new initiatives were not reviewed by the Value Assessment Panel (VAP), but by the internal IT Committee (Investment Category Selection Panel (ICSP). As a result, there is a perception that the process is not as transparent to all those affected. While it is appropriate to adopt a governance structure that best supports the IT initiative being considered, there do not appear to be guidelines regarding the structures that should be used.
• The escalation/resolution process for disputes arising from the priority-setting process has not been clearly documented and the role of Executive Management Committee should be clarified as the final approval authority.
3. Flexibility
• The current process does not differentiate between discretionary (i.e., non-mandatory) projects. Under the current process, any discretionary client-IT initiative over 10 days goes to VAP, regardless of its size, all are subject to the same steps, regardless of whether it is a small or large project. By contrast, all non-discretionary initiatives are not supported by a business case and treated equally. At the time of the audit, some changes had been identified and proposed to the process which would address this issue.
• A mechanism in the process is required which distinguishes those projects that are sustaining or operational in nature from those that are transformational. This could be in the form of requiring different levels of detail for project documents coming forward, etc. Additionally, this would provide another level to consider when balancing the overall portfolio of IT investment.
4. Capacity and Corporate-wide Management
• In a number of audits from previous years, management has expressed concern over a perceived lack of attention from ITS on required IT initiatives, however this audit has shown a process is in place for operating areas to present a business case for their requirements and obtain funding for these initiatives independently from ITS.
• ITS continues to face increasing pressure to demonstrate to clients and/or the public the value of IT work. The new accountability and performance management culture also requires ITS to account for money spent. Business cases have been tailored to provide qualitative and quantitative analysis of costs/benefits and risks.
• There remains increasing reliance on IT to assist and to enable the business to achieve operational objectives. The current process of clients receiving budget approval prior to going to ITS for workload prioritization sets expectations regarding the overall City-wide priority of the proposed initiative and the capacity for ITS to deliver in the desired timeframe. Given the limited IT resources and
2008 Page v

Audit of IT Capital Expenditures and Project Approval Process
increasing number of client programs/projects, ITS needs to ensure that the limited resources are first directed to initiatives that have risk-adjusted, highest value.
• This issue, along with the earlier observation of the need for improved monitoring of IT capital expenditures on an annual basis, suggests the need to centralize IT capital funding under a single authority. This would permit the annual IT capital budget to come forward for approval in a coordinated fashion and allow senior management and Council to have a consolidated picture of IT capital funding and priorities each year.
Recommendation 2 That management update current documentation for the existing prioritization process.
Management Response Management agrees with this recommendation.
As noted in the report, the prioritization process was under review at the time of the audit. Changes were recommended and approved by the Executive Management Committee (EMC) on November 22, 2007. Documentation has been modified and updated to reflect the approved changes and was fully implemented as of June 30, 2008.
Recommendation 3 That management clarify the voting rights of all members of the Investment Category Selection Panel.
Management Response Management agrees with this recommendation.
As noted in the report, the terms of reference for the Investment Category Selection Panel (ICSP) were under review at the time of the audit. It was subsequently determined that the ICSP was no longer required in the new prioritization process approved by EMC on November 22, 2007.
Recommendation 4 That management clarify the project approval process including the escalation and dispute resolution process and clarify the role of the Executive Management Committee for final project approvals.
Management Response Management agrees with this recommendation.
As noted in the report, the project approval process, including the escalation and dispute resolution process, were under review at the time of the audit. Changes were approved by EMC on November 22, 2007. The role of the EMC in final project
2008 Page vi

Audit of IT Capital Expenditures and Project Approval Process
approval has been clarified in the new prioritization process, which was implemented as of June 30, 2008.
Recommendation 5 That management ensure all proposed projects are reviewed by the Value Assessment Panel to increase the transparency of the prioritization process for those parties not directly involved.
Management Response The amended prioritization process approved by EMC on November 22, 2007, requires the Value Assessment Panel (VAP) to review in detail, all proposed IT projects that are estimated to exceed $100,000. This is an industry best practice. Smaller projects will be reviewed by a committee of senior IT managers and the director/CIO, and reported to the VAP. The results of all reviews including costs, benefits, risks, and value scores, irrespective of size, will be communicated to all City Departments.
Recommendation 6 That management develop guidelines for appropriate governance models to be used.
Management Response Management agrees with this recommendation.
As noted in the report, IT Services has been working to consolidate various IT governance models that were in place during amalgamation. Since 2004, IT Services has been applying a common model for IT projects, irrespective of funding source. The governance model being used for project priority setting and selection was developed by Fujitsu Consulting and is a recognized best practice, endorsed by the IT Governance Institute and the Information Systems Audit and Control Association (ISACA). It applies to all IT-enabled projects, whether funded from operating or capital budgets. The changes approved by EMC on November 22, 2007 further clarify the IT governance model. These changes were fully implemented as of June 30, 2008 and Guidelines have been communicated to City departments.
Program governance (priority setting, financial management, monitoring and reporting) is conducted within the overall City of Ottawa governance model and its associated guidelines and criteria. In the case of ITS, a Strategic Planning Committee of managers and the director review and approve branch and program priorities as part of the annual operational planning cycle. A governance model for project management of all approved IT-enabled projects was established in 2001, based on the Project Management Institute (PMI) and the Project Management Book of Knowledge (PMBoK). Both project prioritization and project management frameworks are industry best practices that ITS continues to enhance and evolve toward a higher level of maturity.
2008 Page vii

Audit of IT Capital Expenditures and Project Approval Process
Recommendation 7 That management ensure the use of business cases for all proposed IT projects and establish a process to update the business case when needed.
Management Response Management agrees with this recommendation.
A formal business case has been required since 2004 for all "discretionary" IT projects. The changes approved by EMC on November 22, 2007 require a formal business case for all IT projects. In addition, as part of the IT project management practice and project life cycle, IT Services requires the IT project manager to review the business case at key phases in the implementation of each project. Any significant variation in either the costs or the benefits triggers an automatic review of the business case.
Recommendation 8 That management develop and document formal priority setting criteria, aligned with the value plot tool, that can be used by both business and ITS to prioritize projects and activities/projects within a program.
Management Response Management agrees with this recommendation.
As noted in the report, the prioritization process that was implemented in 2004 "is based on the Control Objectives for Information and Technology (COBIT) framework, and has appropriate steps and control points against the audit criteria". Modifications to the priority setting criteria and tools were streamlined and approved by EMC on November 22, 2007. The new processes are currently being implemented to prioritize all IT projects, including those eligible for funding through the IT Investment Fund. Although the value plot tool has been superceded by the new process, additional tools will be available for business and ITS, and plans are underway to make them available on-line (Ozone) by the end of Q4 2008.
Recommendation 9 That management include a mechanism in the process which distinguishes those projects that are sustaining or operational in nature from those that are transformational.
Management Response Management agrees with this recommendation.
Under the amended process approved by EMC on November 22, 2007, the definition of projects has been modified to distinguish sustaining/operational projects from those that are transformational. The new definitions were fully implemented as of June 30, 2008.
2008 Page viii

Audit of IT Capital Expenditures and Project Approval Process
Recommendation 10 That management ensure the project owner is clarified for all IT projects.
Management Response Management agrees with this recommendation.
The new prioritization process approved by EMC on November 22, 2007 clarifies the definition of IT operational or sustaining activities for which ITS is the owner. Similarly, the business sponsor of any IT project must be clearly identified in the business case as a condition of VAP review. Once approved, the project cannot proceed until a project sponsor has signed off on a project charter.
Recommendation 11 That management communicate to all client groups the overall requests and ITS capacity to address the requests.
Management Response Management agrees with this recommendation.
As noted in Recommendation 5, the impact of resource requests on ITS capacity will be reviewed with the Value Assessment Panel and results will be communicated to all client groups commencing in 2008. Additional tools will be researched and implemented as appropriate to facilitate the communication of overall IT investment capacity and performance results on an ongoing basis.
Recommendation 12 That management share the value score and relative priority for all IT initiatives to manage expectations regarding the ITS capacity and ability to meet the required timeframes.
Management Response Management agrees with this recommendation.
See Recommendation 5 and 11.
Recommendation 13 That management require all projects to go through the priority setting process prior to seeking funding approval via the Council budget approval process.
Management Response Management agrees with this recommendation.
The new processes and governance model approved by EMC on November 22, 2007 requires that all IT projects go through the priority-setting process prior to seeking funding approval via the Council budget approval process. The process allows for exceptions that would be addressed on a case-by-case basis (e.g., where the IT
2008 Page ix

Audit of IT Capital Expenditures and Project Approval Process
component of a capital request is secondary to the project, such as technology for a new Library which has already been approved by Council). EMC directed ITS to work with Corporate Planning and Financial Services to integrate the IT priority-setting process with the corporate planning cycle and budget process. This work is underway and will be evaluated in conjunction with the 2009 budget process.
Recommendation 14 That management centralize the Corporate IT Capital budget within a single funding envelope and ensure that annual IT Capital budgets are presented for approval on a consolidated basis.
Management Response Management disagrees with this recommendation.
For the past two budgets (2007 and 2008), the capital budget has been presented and status reports were prepared by service area. From an IT perspective, this means that if an IT-related project relates to a specific service area such as Long Term Care, that project will be presented in the Long Term Care service area. This was recommended and approved by Council in 2004 in the "It's About Accountability" document prepared by Plamondon and Associates. Corporate IT budgets that do not relate to a specific service area are presented together.
More recently, the Mayor's Task Force on e-Government conducted an external best-practice assessment of the IT budget, and specifically noted that combining IT capital funds into one budget confuses accountability. The City's SAP system can easily produce a consolidated report of IT spending from numerous cost centres and internal orders.
Since IT exists to make other branches more effective and efficient, it is important for Council to ensure that departments exploiting the technology are accountable for the benefits. To that end, the LRFP Sub-Committee recently recommended to Council that "staff be directed to incorporate anticipated efficiency savings from investments in technology in the efficiency column of the budget pages for affected branches for future budgets". ITS will support Financial Services to implement this recommendation for the next budget cycle.
2008 Page x

Audit of IT Capital Expenditures and Project Approval Process
Mayor’s Task Force on eGovernment In 2008, the Mayor asked a group of experienced high-tech executives to review the City of Ottawa’s use of technology and make recommendations that would improve interaction with the public while increasing the effectiveness and efficiency of City operations. Throughout the first four months of the year, this group interviewed Information Technology Services (IT) staff and management at the City and also reviewed existing plans and past performances. Their recommendations were released in June and their action plan approved by Council in August 2008.
The Task Force identified that Ottawa lagged behind other public and private organizations in gaining the benefits of information and communications technology. The root of the problem lay in the way that the City approached technology. Instead of making investments, which would pay off over time, Council sought to minimize expenses within a single year, thus ensuring that no major transformation of service could occur. Efforts were focused on internal processes when they should have been focused on the citizens using the service. Thus the City was not delivering the improvements and cost-reductions achieved by banks and other levels of government.
The Task Force identified that the use of technology should, over time, reduce costs and improve service, offsetting natural growth factors which were driving up expenses and tax rates. To do so, the City would need to put in a proper governance model, which focused on investment with clearly defined returns over a period of 3 three to 5five years. Projects would have to put the citizens at the centre of their business model and work to eliminate manual efforts, which drove up costs and drove down public satisfaction. The responsibility for effective use of technology lies not with IT Services but with every department in the City of Ottawa.
Eight specific recommendations were made to allow the City and its taxpayers to get the most from technology.
1. Institute a governance model that involves everyone from City Council to staff.
2. Require a citizen-centric focus for all City programs and services.
3. Implement outcome-based measures for all activities, services and projects.
4. Produce investment plans for each branch identifying how technology will be leveraged to improve service while reducing costs.
5. Ensure that when council directs staff to take action, the resulting proposal includes a technology alternative that directly or indirectly offsets any increase in staff.
6. Compare Ottawa’s service delivery, on an outcome and cost basis, with service delivery in the best public and private organizations in the world, and not just with service delivery in other Canadian municipalities.
2008 Page xi

Audit of IT Capital Expenditures and Project Approval Process
7. Ensure that all investment plans respect and leverage the City’s common technology
infrastructure, architecture, processes and applications.
8. Invest in a Chief Strategist for service delivery, reporting directly to City Council, who will drive the implementation of these recommendations.
Management indicated that its goal is to have the recommendations progressed to the point where they will make fundamental changes to the budget process for the coming year.
Conclusion The analysis of IT capital expenditures for 2001-2006 conducted during the audit provides, we believe, the first comprehensive view of the City of Ottawa’s IT capital spending patterns. There are significant variances, both surplus and deficit, each year for both ITS-owned and client-owned capital budgets indicating a need for regular reporting on total IT capital spending as well as greater monitoring of these expenditures in the future.
Until 2004, prioritization was primarily based upon decisions by the Transition Board. Since that time, ITS has developed and implemented policies and procedures for prioritizing IT capital expenditures. The overall process is in line with the COBIT standards used to assess it during the audit. There are, however, opportunities for improvement which have been discussed in this report.
Key issues identified in the audit include:
• Priority-setting criteria should be more formally developed and documented;
• Guidelines should be established in order to clarify the governance model to be used;
• All projects should be reviewed by the Value Assessment Panel to ensure transparency for all participants;
• Escalation/resolution process should be clearly documented and the role of Executive Management Committee should be clarified as the final approval authority;
• All projects should be required to go through the priority setting process prior to seeking funding approval via the Council budget approval process; and,
• IT capital funding should be centralized within a single funding envelope to improve oversight and ongoing monitoring of these expenditures.
2008 Page xii

Audit of IT Capital Expenditures and Project Approval Process
Acknowledgment We wish to express our appreciation for the cooperation and assistance afforded the audit team by management.
2008 Page xiii

Vérification des dépenses en immobilisations liées aux TI et du processus d’approbation des projets
Résumé
Introduction La vérification des dépenses en immobilisations liées aux technologies de l’information (TI) et du processus d’approbation des projets a été ajoutée au plan de vérification de 2007 à la suite du processus annuel d’évaluation des risques.
Les objectifs de la vérification étaient :
1. d'examiner les dépenses en immobilisations liées aux TI durant la période de 2001 à 2006 pour obtenir une opinion claire et indépendante sur les dépenses en immobilisations liées aux TI engagées par la Ville après la fusion;
2. de déterminer et d’évaluer les processus actuels de la Ville pour l’établissement de priorités et l’approbation de dépenses en immobilisations liées aux TI et de formuler des recommandations le cas échéant.
La portée du premier objectif de vérification a ciblé l’analyse de données concernant l’historique des dépenses en immobilisations liées aux TI. Les résultats de cette analyse donnent une idée des habitudes de dépense de la Ville d’Ottawa concernant les immobilisations liées aux TI ainsi que certaines observations sur ces dépenses. La Direction des services de technologie de l’information (STI) et la Direction des services financiers de la Ville d’Ottawa ont fourni les données de cette analyse. La présente analyse a tenu compte des données fournies pour la période de janvier 2001 à décembre 2006.
Quant au second objectif de vérification, l’évaluation a tenu compte de critères convenus (c’est-à-dire COBIT1) et est basée sur des examens de documents, des interviews et un examen de 12 programmes/projets sélectionnés d'immobilisations liées aux TI. Le personnel de la ville a fourni toute l'information examinée.
La vérification visait à examiner les dépenses et le processus d’établissement des priorités et d’approbation pour la période de 2001 à 2006. Sur le plan du processus, il faut souligner que celui en place actuellement ne l’est officiellement que depuis 2004 et qu’il a continué d’évoluer en s’améliorant et en s’adaptant à l’environnement de la Ville.
1 COBIT (Objectifs de contrôle dans les domaines de l’information et des technologies connexes) est un cadre de gouvernance des TI et un outil de soutien reconnu et accepté dans l’industrie qui permet aux gestionnaires de jeter un pont entre les exigences de contrôle, les questions techniques et les risques d’exploitaiton. COBIT permet l’établissement de politiques claires et de meilleures pratiques liées au contrôle des TI dans l’entreprise. COBIT met l’accent sur la conformité à la réglementation, aide les entreprises à augmenter la valeur obtenue grâce aux TI et permet l’harmonisation. www.isaca.org
2008 Page xiv

Vérification des dépenses en immobilisations liées aux TI et du processus d’approbation des projets
De plus, l’échantillon de projets sélectionnés pour examen comprenait des programmes/projets de la période de la transition et certains antérieurs à la mise en œuvre complète du processus. La vérification devait initialement être présentée en juin 2008 : cependant, le Bureau du vérificateur général a été informé le 3 mars 2008 que les données fournies par la direction au début de la vérification n’étaient pas exactes. Il en est résulté que l’analyse des dépenses en immobilisations a dû être recommencée et ne pouvait être terminée à temps pour faire partie du rapport annuel de 2007.
Sommaire des principales constatations
Objectif de vérification no 1 Le tableau ci-après résume les dépenses en immobilisations liées aux TI de la Ville d’Ottawa de 2001 à 2006.
(000 $) 2001 2002 2003 2004 2005 2006 Budget d’immobilisations propres aux STI 13 326 $ 55 828 $ 10 274 $ 8 655 $ 9 315 $ 5 442 $Dépenses en immobilisations liées aux TI propres aux STI 7 347 $ 25 452 $ 29 393 $ 16 932 $ 9 108 $ 10 462 $Excédent/Déficit 5 979 $ 30 376 $ -19 119 $ - 8 277 $ 207 $ - 5 020 $ Budget d’immobilisations propres aux clients 8 528 $ 10 486 $ 3 214 $ 475 $ 1 890 $ 2 322 $Dépenses en immobilisations liées aux TI propres aux clients 5 138 $ 7 387 $ 5 375 $ 2 267 $ 4 454 $ 4 837 $Excédent/Déficit 3 390 $ 3 099 $ - 2 161 $ - 1 792 $ - 2 564 $ - 2 515 $ Budget total d’immobilisations liées aux TI 21 854 $ 66 314 $ 13 488 $ 9 130 $ 11 205 $ 7 764 $Dépenses totales en immobilisations liées aux TI 12 485 $ 32 839 $ 34 769 $ 19 199 $ 13 562 $ 15 298 $Excédent/Déficit 9 369 $ 33 475 $ - 21 281 $ - 10 069 $ - 2 357 $ - 7 534 $ Budget total de fonctionnement de la Ville 1 681,519 $ 1 726 046 $ 1 838 862 $ 1 898 338 $ 1 988 358 $ 2 126 424 $Budget total d’immobilisations de la Ville 528 989 $ 539 152 $ 505 042 $ 299 039 $ 639 791 $ 1 345 422 $Budget total de la Ville 2 210 508 $ 2 265 198 $ 2 343 904 $ 2 197 377 $ 2 628 149 $ 3 471 846 $Dépenses totales de TI en % du budget de la Ville 2,13 % 3,06 % 3,07 % 2,53 % 1,93 % 1,64 % Dépenses de fonctionnement des STI 34 621 $ 36 376 $ 37 114 $ 36 332 $ 37 232 $ 41 813 $Dépenses en immobilisations liées aux TI propres aux STI 7 347 $ 25 452 $ 29 393 $ 16 932 $ 9 108 $ 10 462 $
2008 Page xv

Vérification des dépenses en immobilisations liées aux TI et du processus d’approbation des projets
(000 $) 2001 2002 2003 2004 2005 2006
Dépenses en immobilisations liées aux TI propres aux clients 5 138 $ 7 387 $ 5 375 $ 2 267 $ 4 454 $ 4 837 $Dépenses totales liées aux TI 47 106 $ 69 215 $ 71 882 $ 55 531 $ 50 794 $ 57 112 $ Fonctionnement des TI en % du total des TI 73,50 % 52,56 % 51,63 % 65,43 % 73,30 % 73,21 %Immobilisations liées aux TI en % des immobilisations totales 2,36 % 6,09 % 6,88 % 6,42 % 2,12 % 1,14 %Immobilisations propres aux STI en % des TI totales 15,60 % 36,77 % 40,89 % 30,49 % 17,93 % 18,32 %Immobilisations liées aux TI propres aux clients en % des TI totales 10,91 % 10,67 % 7,48 % 4,08 % 8,77 % 8,47 %
Source : Services financiers de la Ville d’Ottawa.
Un sommaire des principales constatations découlant de l’examen des dépenses en immobilisations en matière de TI se trouve ci-après.
1. Les dépenses liées aux TI de la Ville d’Ottawa
• Chaque année, il y a d’importants écarts, excédentaires et déficitaires à la fois, par rapport aux budgets d’immobilisations propres aux STI et propres aux clients, ce qui indique un besoin de rapports périodiques concernant l’ensemble des dépenses en immobilisations liées aux TI ainsi qu’une plus grande surveillance de ces dépenses à l’avenir.
• Toutes les dépenses liées aux TI (fonctionnement et immobilisations) de 2001 à 2006 représentent environ 2 % du budget total de la Ville, et un peu plus durant la période de transition.
• Durant la période de 2001 à 2006, les dépenses annuelles totales liées aux TI (fonctionnement et immobilisations) semblaient en général augmenter, abstraction faite des dépenses liées à la transition.
• De 2001 à 2006, les dépenses en immobilisations liées aux TI propres aux clients ont été relativement stables et constantes, les dépenses les plus faibles étant en 2004 et les plus élevées en 2002.
• Les dépenses en immobilisations liées aux TI propres aux STI ont connu de grands écarts de 2001 à 2006, les dépenses les plus faibles étant en 2001 et les plus élevées en 2003.
2. Les dépenses en immobilisations liées aux TI propres aux clients
• En moyenne, les dépenses en immobilisations liées aux TI propres aux clients sont demeurées relativement stables durant la période de 2001 à 2006.
• Les trois plus grands consommateurs étaient :
2008 Page xvi

Vérification des dépenses en immobilisations liées aux TI et du processus d’approbation des projets
• Services de transport en commun (14,2 M $) 48 % • Services de bibliothèque (5,2 M $) 18 % • Service des incendies (4,5 M $) 15 %
• Les trois consommateurs les plus faibles étaient :
• SCP – Autres (116 K $) inférieur à 1 % • Services publics (78 K $) inférieur à 1 % • Circulation et Stationnement (4 K $) inférieur à 1 %
• Les services de transport en commun et les Services de bibliothèque représentent les seuls secteurs qui ont engagé des dépenses positives chaque année de 2001 à 2006 - responsables ensemble de 66 % du total des immobilisations liées aux TI des clients.
• Seuls les Services publics et Circulation et Stationnement n’ont pas été des consommateurs réguliers, c’est-à-dire qu’ils ont engagé des dépenses durant moins de quatre années des six années examinées.
3. Les dépenses en immobilisations liées aux TI propres aux STI
• De 2001 à 2006, les dépenses en immobilisations liées aux TI propres aux STI ont varié considérablement d’une année à l’autre.
• De 2001 à 2006, dans l’ensemble et de façon continue, les trois activités les plus grandes consommatrices d’immobilisations liées aux TI propres aux STI furent :
• La transition (40 %, 39,9 M$); • La maintenance de la durée de vie utile des ordinateurs et des
périphériques (17 %, 16,5 M$); • Le maintien de la plateforme du système SAP (17 %, 16,4 M $).
• De 2001 à 2006, les trois activités les plus faibles furent : • Les améliorations aux technologies dans les services (inférieur à 1 %,
167 K$); • Le soutien - technologie de l'information électronique (inférieur à 1 %,
132 K$); • Les télécommunications (inférieur à 1 %, 71 K$).
Recommandation 1 Que la direction veille à ce qu’une analyse complète des dépenses en immobilisations liées aux TI à l’échelle de la Ville soit réalisée annuellement pour surveiller et comptabiliser les dépenses liées aux TI.
Réponse de la direction La direction est d’accord avec cette recommandation.
2008 Page xvii

Vérification des dépenses en immobilisations liées aux TI et du processus d’approbation des projets
Les Services de TI examinent trimestriellement les dépenses en immobilisations propres aux STI et aux clients et fournissent des commentaires sur les rapports trimestriels financiers et sur le rendement destinés au Conseil. De plus, les dépenses en immobilisations sont consolidées au rapport annuel sur le rendement de l’IACSM sur les technologies de l’information. L’analyse menée durant la vérification sera utilisée à l'avenir comme modèle pour le contrôle et l'analyse de fin d'exercice des dépenses en TI.
Il doit être souligné que l’analyse des dépenses prévues au budget par rapport aux dépenses réelles conclut erronément qu’il y a eu des excédents/déficits importants en ce qui a trait aux dépenses en immobilisations depuis la fusion, ce qui est trompeur en ce que l’analyse ne tient pas compte du report d’une année à l’autre du pouvoir de dépenser inutilisé. La direction fournit des rapports périodiques au Conseil sur les travaux en cours concernant le fonctionnement et les immobilisations qui indiquent clairement les dépenses par rapport au budget ainsi que tout écart.
Deuxièmement, afin d’assurer la cohérence et d’éviter la confusion quant aux définitions utilisées par le Conseil en ce qui concerne la planification des immobilisations et les rapports qui y sont liés, le regroupement des initiatives stratégiques et de croissance dans une catégorie plus large n’est pas recommandé par les Services financiers.
Objectif de vérification no 2 Dans l’ensemble, le processus défini d’établissement des priorités correspond bien aux contrôles et aux directives de COBIT. Nous avons déterminé quatre questions clés qui pourraient être étudiées pour consolider le processus et l’harmonisation avec COBIT.
1. Critères d’établissement des priorités
La vérification a établi que, bien que la Gestion de la valeur du portfolio dispose d'un processus d’établissement des priorités systématique pour les initiatives de TI à l’aide de la valeur conceptuelle, il n’existe pas de critères d’établissement des priorités uniformes pour établir des priorités liées aux TI ou des priorités à l’intérieur d’un programme avec les rapports de décision pertinents concernant la priorité.
2. Gouvernance
• La plupart des nouvelles initiatives n’ont pas été examinées par le Comité d’estimation de la valeur (CEV), mais par le Comité interne des TI (Comité de sélection de catégorie d’investissement). En conséquence, toutes les personnes concernées ne perçoivent pas le processus comme étant si transparent. Alors qu’il est approprié d’adopter une structure de gouvernance qui appuie au mieux l'initiative de TI à l'étude, il ne semble pas y avoir de directives concernant les structures qui devraient être utilisées.
2008 Page xviii

Vérification des dépenses en immobilisations liées aux TI et du processus d’approbation des projets
• Le processus de recours à la hiérarchie ou de règlement de différend découlant du
processus d’établissement des priorités n’est pas clairement documenté et le rôle du Comité de la haute direction devrait être précisé en tant que pouvoir d’approbation final.
3. Souplesse
• Le processus actuel ne fait pas de distinction entre les projets discrétionnaires (c’est-à-dire non obligatoires). En vertu du processus actuel, toute initiative discrétionnaire d’un client des STI de plus de 10 jours va au CEV sans égard à son importance, et toutes sont soumises aux mêmes étapes sans tenir compte du fait que ce soit un projet de petite ou de grande envergure. En revanche, les initiatives non discrétionnaires ne sont pas toutes appuyées par une analyse de rentabilisation et traitées de façon égale. Lors de la vérification, certains changements ont été déterminés et proposés au processus pour résoudre cette question.
• Un mécanisme dans le processus est requis pour distinguer les projets qui relèvent du maintien ou du fonctionnement de ceux qui relèvent de la transformation, ce qui pourrait se faire en exigeant différents degrés de détails pour les documents de projets à venir, etc. De plus, il y aurait ainsi un autre palier à prendre en considération lors de l'examen de l'équilibrage de l'ensemble du portefeuille des investissements en TI.
4. Capacité et gestion à l’échelle de la Ville
• Lors de plusieurs vérifications effectuées les années antérieures, la direction a exprimé son inquiétude quant à la perception qu’il existe un manque d’attention de la part des STI concernant les initiatives requises de TI; cependant, la présente vérification a montré qu’un processus est en place pour que les secteurs opérationnels présentent une analyse de rentabilisation concernant leurs besoins et obtiennent le financement de ces initiatives indépendamment des STI.
• Les STI continuent de subir une pression grandissante pour démontrer aux clients et/ou au public la valeur du travail des STI. La nouvelle culture de la direction en matière de responsabilisation et de rendement exige également que les STI rendent compte de l’argent dépensé. Les analyses de rentabilisation ont été conçues pour fournir des analyses qualitatives et quantitatives des coûts/avantages et des risques.
• Il demeure que l’on compte de plus en plus sur les TI pour aider les services à atteindre leurs objectifs opérationnels. Le processus actuel qui veut que les clients reçoivent l’approbation de leur budget avant de rencontrer les STI pour établir les priorités de la charge de travail fixe des attentes à l’échelle de la Ville à l’égard de la priorité de l’initiative proposée et de la capacité des STI à réaliser l’initiative dans les délais souhaités. Étant donné les ressources limitées des STI et le nombre grandissant de programmes – projets des clients, les STI doivent s’assurer que leurs
2008 Page xix

Vérification des dépenses en immobilisations liées aux TI et du processus d’approbation des projets
ressources limitées sont affectées en premier lieu à des initiatives qui ont la plus grande valeur en fonction des risques.
• Cette question, de même que les constatations précédentes sur le besoin d’un contrôle amélioré des dépenses en immobilisations liées aux TI sur une base annuelle tend à exprimer le besoin de centraliser le financement des immobilisations liées aux TI sous une seule autorité, ce qui permettrait de présenter le budget annuel d’immobilisations liées aux TI pour approbation de façon coordonnée et donnerait également, chaque année, aux cadres supérieurs et au Conseil une image unifiée du financement des immobilisations liées aux TI et de leurs priorités.
Recommandation 2 Que la direction mette à jour la documentation existante sur le processus actuel d’établissement des priorités.
Réponse de la direction La direction est d’accord avec cette recommandation.
Tel qu’il est indiqué dans le rapport, le processus d’établissement des priorités était à l’examen au moment de la vérification. Des changements ont été recommandés et approuvés par le Comité de la haute direction (CHD) le 22 novembre 2007. La documentation a été modifiée et mise à jour afin de refléter les changements approuvés, et mise en œuvre le 30 juin 2008.
Recommandation 3 Que la direction précise les droits de vote de tous les membres du Comité de sélection des catégories d’investissement.
Réponse de la direction La direction est d’accord avec cette recommandation.
Tel qu’il est indiqué dans le rapport, le mandat du Comité de sélection des catégories d’investissement (CSCI) était à l’examen lors de la vérification. Il a été déterminé par la suite que le nouveau processus d’établissement des priorités approuvé par le CHD le 22 novembre 2007 ne requiert plus les services du CSCI.
Recommandation 4 Que la direction précise le processus d’approbation de projet, y compris le processus de recours à la hiérarchie et de règlement de différend, et précise le rôle du Comité de la haute direction dans les approbations finales de projets.
Réponse de la direction La direction est d’accord avec cette recommandation.
Tel qu’il est indiqué dans le rapport, le processus d’approbation de projet y compris le recours à la hiérarchie et le processus de règlement de différend était à l’examen
2008 Page xx

Vérification des dépenses en immobilisations liées aux TI et du processus d’approbation des projets
lors de la vérification. Les changements ont été approuvés par le CHD le 22 novembre 2007. Le rôle du CHD dans l’approbation finale des projets a été précisé dans le nouveau processus d’établissement des priorités mis en œuvre le 30 juin 2008.
Recommandation 5 Que la direction s’assure que tous les projets proposés soient examinés par le Comité d’estimation de la valeur afin d’accroître la transparence du processus d’établissement des priorités pour ceux qui ne sont pas directement concernés.
Réponse de la direction Le processus modifié d’établissement des priorités approuvé par le CHD le 22 novembre 2007 requiert que le Comité d’estimation de la valeur (CEV) examine en détail tous les projets proposés de TI d'un montant supérieur à 100 000 $, ce qui constitue une pratique exemplaire du secteur. Les projets moins importants seront examinés par un comité de cadres supérieurs des TI et la directrice/chef de l’information qui rendront compte au CEV. Les résultats de tous ces examens, y compris les coûts, les bénéfices, les risques et l’évaluation de la valeur du projet, quelle que soit l’importance du projet, seront communiqués à tous les services de la Ville.
Recommandation 6 Que la direction élabore des directives concernant des modèles de gouvernance appropriés à utiliser.
Réponse de la direction La direction est d’accord avec cette recommandation.
Tel qu’il est indiqué dans le rapport, les services de TI s’affairent à regrouper divers modèles de gouvernance des TI en place durant la fusion. Depuis 2004, les Services de TI appliquent un même modèle aux projets de TI, indépendamment de la source de financement. Le modèle de gouvernance utilisé pour l’établissement et la sélection de priorités concernant les projets a été conçu par Fujitsu Consulting et est reconnu comme une pratique exemplaire, sanctionnée par l’Association des professionnels de la vérification et du contrôle des systèmes d’information (ISACA). Il s’applique à tous les projets fondés sur les TI, qu’ils soient financés par les budgets de fonctionnement ou d'immobilisations. Les changements approuvés par le CHD le 22 novembre 2007 précisent encore davantage le modèle de gouvernance des TI. Ces changements ont été intégralement mis en œuvre le 30 juin 2008 et les directives ont été transmises à tous les services de la Ville.
L’administration des programmes (établissement des priorités, gestion financière, contrôle et reddition de compte) se fait dans le cadre du modèle global de gouvernance de la Ville d’Ottawa et des directives et critères s’y rapportant. Dans le cas des STI, un comité de planification stratégique composé de gestionnaires et de la
2008 Page xxi

Vérification des dépenses en immobilisations liées aux TI et du processus d’approbation des projets
directrice examine et approuve les priorités des directions et des programmes dans le cadre de l’exercice annuel de planification du fonctionnement. Un modèle de gouvernance pour la gestion de tous les projets approuvés et fondés sur les TI a été établi en 2001, basé sur le Project Management Institute (PMI) et sur le Project Management Book of Knowledge (PMBoK). Les principes d’établissement des priorités des projets et de gestion de projet sont des pratiques exemplaires du secteur que les STI continuent d’améliorer et de faire progresser pour atteindre un niveau supérieur d’excellence.
Recommandation 7 Que la direction assure l’utilisation d’une analyse de rentabilisation pour tous les projets de TI proposés et qu’elle établisse un processus afin de mettre à jour l’analyse de rentabilisation le cas échéant.
Réponse de la direction La direction est d’accord avec cette recommandation.
Une analyse de rentabilisation en bonne et due forme est requise depuis 2004 pour tous les projets « discrétionnaires » de TI. Les changements approuvés par le CHD le 22 novembre 2007 imposent une analyse de rentabilisation en règle pour tous les projets de TI. De plus, dans le cadre des méthodes de gestion de projet de TI et de la durée de vie utile du projet, les services de TI exigent que le gestionnaire de projet de TI réexamine l’analyse de rentabilisation aux étapes clés de la mise en œuvre de chaque projet. Toute variation importante des coûts ou des avantages déclenche un examen automatique de l'analyse de rentabilisation.
Recommandation 8 Que la direction mette au point et documente des critères d’établissement des priorités en bonne et due forme, conformes à l’outil de valeur conceptuelle, qui peuvent être utilisés par l’administration et les STI pour établir les priorités des projets et des activités/projets à l’intérieur d’un programme.
Réponse de la direction La direction est d’accord avec cette recommandation.
Tel qu’il est indiqué dans le rapport, le processus d’établissement des priorités qui a été mis au point en 2004 est basé sur les principes des Objectifs de contrôle dans les domaines de l’information et des technologies connexes (COBIT) et il comprend les étapes et les points de contrôle par rapport aux critères de vérification. Les changements aux critères et aux outils d’établissement des priorités ont été simplifiés et approuvés par le CHD le 22 novembre 2007. Les nouveaux processus sont actuellement mis en œuvre pour établir la priorité de tous les projets de TI, y compris ceux qui sont admissibles à un financement par le biais du Fonds d'investissement en TI. Bien que l’outil de valeur du projet ait été éliminé dans le nouveau processus, des
2008 Page xxii

Vérification des dépenses en immobilisations liées aux TI et du processus d’approbation des projets
outils additionnels seront mis à la disposition de l’administration et des STI, et des plans sont en cours pour les rendre disponibles en ligne (Ozone) au plus tard à la fin du quatrième trimestre de 2008.
Recommandation 9 Que la direction inclue un mécanisme dans le processus pour distinguer les projets de nature opérationnelle ou de maintien de ceux qui relèvent de la transformation.
Réponse de la direction La direction est d’accord avec cette recommandation.
En vertu du processus modifié approuvé par le CHD le 22 novembre 2007, la définition des projets a été modifiée afin de distinguer les projets opérationnels et de maintien de ceux qui relèvent de la transformation. Les nouvelles définitions ont été intégralement mises en œuvre le 30 juin 2008.
Recommandation 10 Que la direction veille à ce que le titulaire du projet soit précisé pour tous les projets de TI.
Réponse de la direction La direction est d’accord avec cette recommandation.
Le nouveau processus d’établissement de priorités approuvé par le CHD le 22 novembre 2007 précise la définition d’activités de TI opérationnelles ou de maintien dont les STI sont le titulaire. De même, le promoteur de tout projet de TI doit être clairement désigné dans l’analyse de rentabilisation pour être admissible à l’examen par le CEV. Une fois approuvé, le projet ne peut pas commencer tant que le promoteur du projet ne l'a pas approuvé en signant la charte de projet.
Recommandation 11 Que la direction communique à tous les groupes-clients l’ensemble des demandes et la capacité des STI à répondre à ces demandes.
Réponse de la direction La direction est d’accord avec cette recommandation.
Tel qu’il est indiqué à la recommandation 5, l’impact des demandes de ressources sur la capacité des STI sera examiné par le Comité d’estimation de la valeur et les résultats seront communiqués à tous les groupes-clients dès 2008. Des outils additionnels seront examinés et mis en œuvre s’il y a lieu pour faciliter la communication de l’ensemble de la capacité d’investissement des TI et des résultats du rendement de façon continue.
2008 Page xxiii

Vérification des dépenses en immobilisations liées aux TI et du processus d’approbation des projets
Recommandation 12 Que la direction annonce la valeur du projet et la priorité relative de toutes les initiatives de TI pour gérer les attentes concernant la capacité et l’habileté des STI à respecter les délais requis.
Réponse de la direction La direction est d’accord avec cette recommandation.
Voir les recommandations 5 et 11.
Recommandation 13 Que la direction exige que tous les projets soient soumis au processus d’établissement des priorités avant de demander l’approbation de financement par le processus d’approbation de budget du Conseil.
Réponse de la direction La direction est d’accord avec cette recommandation.
Selon les nouveaux processus et le nouveau modèle de gouvernance approuvés par le CHD le 22 novembre 2007, tous les projets de TI doivent passer par le processus d'établissement des priorités avant d’obtenir l’approbation du financement par le biais du processus d’approbation de budget du Conseil. Le processus prévoit des exceptions qui seront étudiées au cas par cas (p. ex., lorsque la composante de TI d’une demande d’immobilisations est secondaire au projet, comme la technologie destinée à une nouvelle bibliothèque qui a déjà été approuvée par le Conseil). Le CHD a enjoint les STI de travailler avec la Direction de la planification municipale et les Services financiers en vue d’intégrer le processus d’établissement des priorités de TI au cycle de planification municipale et au processus budgétaire. Ces travaux sont en cours et seront évalués en même temps que le processus budgétaire de 2009.
Recommandation 14 Que la direction centralise le budget municipal d’immobilisations liées aux TI dans une seule enveloppe de financement et veille à ce que les budgets annuels d’immobilisations liées aux TI soient présentés pour approbation sur une base consolidée.
Réponse de la direction La direction n’est pas d’accord avec cette recommandation.
Lors des deux derniers budgets (2007 et 2008), le budget d’immobilisations a été présenté et les rapports de situation ont été préparés par secteurs de service, ce qui signifie, sur le plan des TI, que si un projet lié aux TI concerne un secteur de service spécifique comme les Soins de longue durée, il sera présenté dans le secteur de service de Soins de longue durée, comme il a été recommandé et approuvé par le Conseil en 2004 dans le document sur la responsabilisation préparé par Plamondon
2008 Page xxiv

Vérification des dépenses en immobilisations liées aux TI et du processus d’approbation des projets
and Associates. Les budgets municipaux de TI qui ne concernent pas un secteur de service spécifique sont présentés ensemble.
Dernièrement, le groupe de travail du maire sur la cyberadministration a procédé à une évaluation des pratiques exemplaires externes pour le budget des TI et a remarqué précisément que le regroupement des fonds d’immobilisations liées aux TI en un seul budget embrouille la responsabilisation. Le système SAP de la Ville peut facilement produire un rapport consolidé des dépenses de TI à partir des nombreux centres de coûts et des commandes internes.
Puisque les TI existent pour rendre les autres services plus efficaces et efficients, il est important que le Conseil assure que les services utilisant la technologie rendent compte des avantages. À ces fins, le sous-comité sur le PFLT a récemment recommandé au Conseil « d’aviser le personnel d’inclure les économies prévues d’efficience à la suite d’investissements en technologie dans la colonne « efficience » des pages de budget des services concernés pour les futurs budgets ». Les STI appuieront les Services financiers dans la réalisation de cette recommandation pour le prochain cycle budgétaire.
2008 Page xxv

Vérification des dépenses en immobilisations liées aux TI et du processus d’approbation des projets
Groupe de travail du maire sur le gouvernement électronique En 2008, le maire a demandé à un groupe de cadres expérimentés en haute technologie d’examiner l'utilisation de la technologie à la Ville d'Ottawa et de formuler des recommandations qui permettraient d'améliorer l'interaction avec le public tout en augmentant l'efficacité et l'efficience des opérations de la Ville. Tout au long des quatre premiers mois de l'année, ce groupe a interviewé le personnel de Services de technologie de l’information (TI) et la Direction de la Ville et a également passé en revue les plans actuels et les rendements antérieurs. Leurs recommandations ont été publiées en juin et leur plan d'action approuvé par le Conseil en août 2008.
Le Groupe de travail a identifié que la Ville d'Ottawa traîne derrière d'autres organisations publiques et privées en ce qui a trait à se prévaloir des avantages technologiques de l'information et des communications. La cause initiale du problème réside dans l‘approche de la Ville face à la technologie. Au lieu de faire des investissements, qui serait rentable au fil des ans, le Conseil a cherché à minimiser les dépenses au sein d'une même année, avec pour conséquence qu'aucune transformation de services ne put se produire. Des efforts ont été axés sur les processus internes alors qu'ils auraient du être axés sur les citoyens, utilisateurs des services. Ainsi, la Ville ne profitait pas des améliorations et des réductions de coûts réalisées par les banques et les autres paliers gouvernementaux.
Le Groupe de travail a indiqué que l'utilisation de la technologie devrait, au fil des ans, réduire les coûts et améliorer le service, compensant pour les facteurs de croissance naturelle qui ont eut comme résultat une augmentation des dépenses et des taux d'imposition. Pour ce faire, la Ville aura besoin d’établir un modèle de gouvernance adéquat, axé sur l'investissement comportant des rendements clairement définis sur une période de trois à cinq ans. Les projets devront mettre les citoyens au centre des modèles d’entreprise et s’attarder à éliminer le travail manuel, qui ont fait monter les coûts et conduit à la baisse la satisfaction du public. La responsabilité de l'utilisation efficace de la technologie ne réside pas avec le groupe de l’informatique, mais plutôt avec tous les services de la Ville d'Ottawa.
Huit recommandations spécifiques ont été faites pour permettre à la Ville et à ses contribuables d’obtenir le meilleur rendement de la technologie.
1. Instituer un modèle de gouvernance qui implique tout le monde du Conseil municipal au personnel.
2. Prescrire que les citoyens soient au cœur de tous programmes et services de la Ville.
3. Mettre en œuvre des mesures axées sur les résultats pour toutes les activités, services et projets.
2008 Page xxvi

Vérification des dépenses en immobilisations liées aux TI et du processus d’approbation des projets
4. Établir des plans d'investissement pour chaque Direction, définissant de quelle façon
la technologie sera exploitée afin d’améliorer le service tout en réduisant les coûts.
5. Veiller à ce que, lorsque le Conseil demande au personnel de prendre action, la proposition comprenne une solution de rechange de technologie qui directement ou indirectement contrebalance toute augmentation de personnel.
6. Comparer la prestation de services d’Ottawa, sur une base de coût et de résultat, avec la prestation de services dans les meilleures organisations publiques et privées dans le monde, et non seulement avec la prestation de services dans d'autres municipalités canadiennes.
7. Veiller à ce que tous les plans d'investissement respectent et exploitent les infrastructures technologiques communes, l'architecture, les processus et les applications de la Ville.
8. Investir dans un stratège en chef pour la prestation de services, qui relève directement du Conseil municipal, conduisant à la mise en œuvre de ces recommandations.
La Direction a fait état que son but est d'avoir les recommandations évoluées au point où elles vont apporter des changements fondamentaux au processus budgétaire pour l'année qui vient.
Conclusion L’analyse des dépenses en immobilisations liées aux TI de 2001 à 2006 fournit, nous croyons, la première vue d’ensemble des habitudes de dépenses en immobilisations liées aux TI de la Ville d’Ottawa. Il y a d’importants écarts, tant des excédents que des déficits, chaque année dans les budgets d’immobilisations propres aux STI et propres aux clients, ce qui indique un besoin de rapports périodiques sur les dépenses totales en immobilisations liées aux TI ainsi qu’un plus grand contrôle de ces dépenses à l’avenir.
Jusqu’en 2004, l’établissement des priorités était fondé principalement sur des décisions du Conseil de transition. Depuis ce temps, les STI ont établi et mis en œuvre des politiques et des procédures pour établir les priorités de dépenses en immobilisations liées aux TI. Le processus dans son ensemble est conforme aux normes COBIT utilisées pour l’évaluer durant la vérification. Il y a cependant des possibilités d’amélioration qui ont été discutées dans le présent rapport.
Parmi les points principaux indiqués dans la vérification, mentionnons :
• Les critères d’établissement des priorités devraient être établis et documentés plus dans les règles;
• Les directives devraient être établies afin de préciser le modèle de gouvernance à utiliser;
2008 Page xxvii

Vérification des dépenses en immobilisations liées aux TI et du processus d’approbation des projets
• Tous les projets devraient être examinés par le Comité d’estimation de la valeur afin
d’assurer la transparence à l’égard de tous les participants;
• Le processus de recours à la hiérarchie/de règlement de différend devrait être clairement documenté et le rôle du Comité de la haute direction devrait être précisé à titre d’autorité d’approbation finale;
• Tous les projets devraient être obligatoirement soumis au processus d’établissement des priorités avant de chercher à obtenir l’approbation du financement par le biais du processus d’approbation du budget par le Conseil;
• Le financement des immobilisations liées aux TI devrait être centralisé dans une seule enveloppe de financement pour améliorer la surveillance et le contrôle continu de ces dépenses.
Remerciements Nous tenons à remercier la direction et le personnel de leur collaboration bienveillante et de l’aide qu’ils ont apportée à l’équipe de vérification.
2008 Page xxviii

Audit of IT Capital Expenditures and Project Approval Process
1 Introduction This audit was not part of the original 2007 Office of the Auditor General (OAG) Audit Plan. The audit was added as a result of the yearly risk assessment process and, in part, due to concerns expressed over both the total amount of IT expenditures and the reliability/consistency of processes intended to identify and address priority of IT expenditures.
This audit was originally scheduled to be presented in June 2008; however, the OAG was informed on March 3, 2008 that the data provided by management at the start of the audit was not accurate. The result was that the analysis on capital expenditures had to be repeated and could not be completed in time for inclusion in the 2007 Annual Report.
Since the City’s amalgamation in 2001, the IT environment has grown in complexity to support an average of 24 IT services across multiple jurisdictions and departments. The City’s Information Technology Services (ITS) Branch has six divisions and approximately 363 FTEs to support this complex environment.
With the significance of IT expenditures, there is the risk that missing or ineffective controls may have an impact on the City’s ability to deliver services to its clients within the City and to citizens in a timely and economical manner.
The results of the expenditure analysis will provide a view of the City of Ottawa’s IT capital spending patterns and will note some observations regarding these expenditures. The data for this analysis was provided by the City of Ottawa ITS and Financial Services branches. This analysis only considered the data provided for the period January 2001 to December 2006.
This audit report presents the results of the audit in the following sections:
• Audit Objectives and Scope
• Audit Criteria and Approach
• Observations:
• Current Prioritization and Approval Process • Sample Program/Project Review Results
• Conclusion
2 Audit Objectives and Scope The objectives of the audit were to:
2008 Page 1

Audit of IT Capital Expenditures and Project Approval Process
1. Review IT capital expenditures during the period of 2001 to 2006. The
expenditures were reviewed to obtain a clear and independent view of the City’s post amalgamation capital IT spending; and,
2. Identify and assess current processes for prioritizing and approving IT capital expenditures and to make recommendations where appropriate.
The scope of the audit for objective 1 focused on a data analysis of the historical spending of IT capital expenditures. It did not include an analysis or assessment of the processes or controls in place to authorize the IT capital expenditures.
For audit objective 2, the audit included an assessment of the current approval and prioritization process against the COBIT1 framework and an assessment regarding the degree of compliance to the COBIT framework for a sample of 12 IT capital programs/projects during the period 2001 to 2006. The assessment was performed against the agreed-upon criteria (i.e., the COBIT framework). All information reviewed was provided by City of Ottawa staff.
3 Audit Criteria and Approach
3.1 Audit Criteria: The City has policies and procedures that allow IT capital expenditures to be prioritized effectively and to be approved by appropriate authority level and that these policies and procedures are consistent with industry accepted standards (i.e., COBIT).
3.1.1 Applicable COBIT elements: PO1 – Define a Strategic IT Plan – the City has an IT strategic plan to manage and direct all IT resources in line with the business strategy and priorities.
PO4 – Defined IT Processes, Organization and Relationships - the City’s IT process, organization and relationships are appropriately defined for IT investment management.
PO5 – Manage the IT Investment – the City has established and maintained a framework to manage IT-enabled investment programs that encompass cost, benefits,
1Control Objectives for Information and Technology (COBIT) is an industry recognized and accepted IT governance framework and supporting toolset that allows managers to bridge the gap between control requirements, technical issues and business risks. COBIT enables clear policy development and good practice for IT control throughout organizations. COBIT emphasizes regulatory compliance, helps organizations to increase the value attained from IT, and enables alignment. www.isaca.org
2008 Page 2

Audit of IT Capital Expenditures and Project Approval Process
prioritization within budget, a formal budgeting process, and management against the budget.
3.2 Approach: The approach for this audit was through conducting document reviews, interviews, and analysis of the information received. We have relied upon interviews with ITS managers and program/project managers, and information, data, and other documentary evidence provided to us by City staff as the basis for our observations. The observations and conclusions reached in our report have been based on information made available at the time of review. Specific steps undertaken during the process review included:
• Reviewed documentation, including project information, business cases, project charters, Council and committee meeting minutes, ITS value management function documents, IT operational plans, etc.;
• Completed interviews with ITS division managers and the program/project managers of the selected 12 programs/projects. The interview questions were designed in accordance with COBIT frameworks; and,
• Analyzed and summarized the interview results and information and data from document reviews.
3.3 Audit limitations The audit looked at the prioritization and approval process and additionally considered the criteria against a selected sample of programs/projects for the period 2001 to 2006. From the perspective of the process itself, the audit limitation is that the process has only formally been in place in its current form since 2004 and that it has continued to evolve by improving and tailoring to the City environment.
From the perspective of the assessment of the sample set, a sample of 12 programs/projects was selected (see Table 1 below for the list of programs/ projects included in the sample) from the IT capital programs/projects during the period 2001 to 2006. These programs/projects were selected after considering the mix of client-owned and ITS-owned capital, closed and open status, size and duration of the initiative. However, since the scope of the sample size covers the period 2001 to 2006, we have further divided them into pre-2004 and post-2004 sub-categories to assist in considering the results of the process changes that have taken place. The audit limitation for the sample set is that the sample only considered IT capital programs/projects and includes programs/projects from the time period that includes Transition and prior to the process being fully implemented.
The following are the 12 selected programs/projects from IT capital programs/projects during the period 2001 to 2006 that formed the sample for this audit.
2008 Page 3

Audit of IT Capital Expenditures and Project Approval Process
Table 1: Sample Programs/Projects
Program / Project Project
No. Description Initiated Pre-2004
Initiated Post-2004
Program 900119 Computer Aided Design & Drafting Project 900294 GPS Mobile Communications Project 900516 Transit Vehicle Information System Project 900661 (Transition) Operations Management Program 901049 Business Application Requirement Project 901066 Archives/Museums/Art Collections Project 901184 (Transition) Integrated Business Systems Program 903105 Class Registration System Program 903562 IT Security Initiatives Program
903563 Sustainment - Electronic Information Technology
Project 903576 Smart Card/Vend Card Technology Program 904067 SAP Sustainment - 2006
Table 2: Summary of Selected Projects
Before 2004 After 2004 Total
Client-Owned 3 2 5 ITS-Owned 4 3 7 Total 7 5 12
4 Detailed Observations and Recommendations
4.1 Audit Objective 1: IT Capital Expenditure Analysis The IT capital expenditure analysis considered the following:
• Overall IT spending
• IT Capital Spending
• Client-Owned IT Capital Spending • ITS-Owned IT Capital Spending
For the purposes of this analysis the following definitions were used:
• Client-Owned IT Capital – Funding secured and provided by client organizations through the City budget approval process.
2008 Page 4

Audit of IT Capital Expenditures and Project Approval Process
• ITS-Owned IT Capital – Funding secured and provided by the ITS organization
through the City budget approval process.
4.1.1 Overview – Total IT Spending for 2001 – 2006 The following section provides the context regarding the IT spending within the overall City of Ottawa budget. IT spending (including capital and operating budgets) during the period of 2001 – 2006 is depicted in the following table:
Table 3 ($000)
($000) 2001 2002 2003 2004 2005 2006 ITS-Owned Capital Budget $13,326 $55,828 $10,274 $8,655 $9,315 $5,442ITS-Owned IT Capital Spending $7,347 $25,452 $29,393 $16,932 $9,108 $10,462Surplus/Deficit $5,979 $30,376 -$19,119 -$8,277 $207 -$5,020 Client-Owned Capital Budget $8,528 $10,486 $3,214 $475 $1,890 $2,322Client-Owned IT Capital Spending $5,138 $7,387 $5,375 $2,267 $4,454 $4,837Surplus/Deficit $3,390 $3,099 -$2,161 -$1,792 -$2,564 -$2,515 Total IT Capital Budget $21,854 $66,314 $13,488 $9,130 $11,205 $7,764Total IT Capital Spending $12,485 $32,839 $34,769 $19,199 $13,562 $15,298Surplus/Deficit $9,369 $33,475 -$21,281 -$10,069 -$2,357 -$7,534 Total City Operating Budget $1,681,519 $1,726,046 $1,838,862 $1,898,338 $1,988,358 $2,126,424Total City Capital Budget $528,989 $539,152 $505,042 $299,039 $639,791 $1,345,422Total City Budget $2,210,508 $2,265,198 $2,343,904 $2,197,377 $2,628,149 $3,471,846Total IT Spending as % of City Budget 2.13% 3.06% 3.07% 2.53% 1.93% 1.64%
($000) 2001 2002 2003 2004 2005 2006
ITS Operating Spending $34,621 $36,376 $37,114 $36,332 $37,232 $41,813ITS-Owned IT Capital Spending $7,347 $25,452 $29,393 $16,932 $9,108 $10,462Client-Owned IT Capital Spending $5,138 $7,387 $5,375 $2,267 $4,454 $4,837Total IT Spending $47,106 $69,215 $71,882 $55,531 $50,794 $57,112 IT Operating as % of IT Total 73.50% 52.56% 51.63% 65.43% 73.30% 73.21%IT Capital as % of Total Capital 2.36% 6.09% 6.88% 6.42% 2.12% 1.14%ITS-Owned Capital as % of IT Total 15.60% 36.77% 40.89% 30.49% 17.93% 18.32%Client-Owned IT Capital as % of IT Total 10.91% 10.67% 7.48% 4.08% 8.77% 8.47%
Source: City of Ottawa Financial Services Based on this information IT spending specifically can be viewed as Operating and Capital spending in the following graph.
2008 Page 5

Audit of IT Capital Expenditures and Project Approval Process
IT Expenditures 2001-2006
$0$10,000,000$20,000,000$30,000,000$40,000,000$50,000,000$60,000,000$70,000,000$80,000,000
2001 2002 2003 2004 2005 2006
Client Owned IT Capital SpendingIT Owned IT Capital SpendingITS Operating Spending
Based on the tables and graph above:
• There are significant variances, both surplus and deficit, each year for both ITS--owned and client-owned capital budgets indicating a need for regular reporting on total IT capital spending as well as greater monitoring of these expenditures in the future.
• Total IT spending (capital and operating) between 2001 and 2006 was approximately 2% of the Total City Budget, slightly higher during Transition.
• During the period 2001 to 2006, the annual Total IT Spending (capital and operating) appeared generally to increase, when omitting the Transition related spending.
• Client-owned IT capital spending was relatively consistent and stable between 2001 and 2006, with the lowest spending in 2004 and the highest in 2002.
• ITS-owned IT capital varied by large amounts between 2001 and 2006, with the lowest spending in 2001 and the highest in 2003.
4.1.2 IT Capital Spending for 2001 – 2006 The scope of this analysis focuses on IT capital spending. This section provides a broad overview of IT capital spending within the City.
2008 Page 6

Audit of IT Capital Expenditures and Project Approval Process
4.1.2.1 ITS-Owned vs. Client-Owned Spending
Client Owned IT Capital vs IT Owned IT Capital
Client Owned IT Capital
23%
IT Owned IT Capital
77%
Actual Capital Programs/Projects and $ for 2001-2006
11
17
23
1918
2322
17
20 20
2117
$-
$5,000,000
$10,000,000
$15,000,000
$20,000,000
$25,000,000
$30,000,000
$35,000,000
2001 2002 2003 2004 2005 20060
5
10
15
20
25
Prog
ram
s / P
roje
cts
IT Owned IT Capital Client Owned IT CapitalClient Owned IT Projects IT Owned IT Projects
Table 4 ($000)
2001 % 2002 % 2003 % 2004 % 2005 % 2006 % Total % ITS-Owned IT Capital Spending $7,347 59% $25,452 78% $29,393 85% $16,932 88% $9,108 67% $10,462 68% $98,693 77%Client-Owned IT Capital Spending $5,138 41% $7,387 22% $5,375 15% $2,267 12% $4,454 33% $4,837 32% $29,459 23%Total IT Capital Spending $12,485 100% $32,839 100% $34,769 100% $19,199 100% $13,562 100% $15,298 100% $128,152 100%
Source: City of Ottawa Financial Services When considering the data at this level, the following observations were noted:
• IT was the primary consumer of the IT capital spending with IT responsible for 77% ($98M) of the Total IT capital spending for the period 2001 to 2006.
• Client-owned IT capital was responsible for 23% ($29M) of the Total IT capital spending for the period 2001 to 2006.
2008 Page 7

Audit of IT Capital Expenditures and Project Approval Process
• On an annual basis the amount of IT capital spending has varied significantly
during the period 2001 to 2006.
• Client-owned IT capital and ITS-owned IT capital exhibit different spending profiles. Client-owned IT capital tends to have more stable spending levels with fluctuating, and generally increasing, number of programs/projects while ITS-owned IT capital tends to have fluctuating spending levels and more stable program/project numbers.
4.1.2.2 Total IT Spending by Type of Expenditure. The City also applies a categorization to various projects regarding the type of activity either as Renewal, Strategic Investment or Transition. For the purposes of this analysis the following definitions from Financial Services were used. • Renewal - This category reflects the funding required to maintain, and/or replace,
existing capital assets throughout the full life of those assets. These assets include buildings, structures, roadways, bridges, vehicles and equipment.
• Strategic Investment - in order to illustrate the distinction between Renewal (or maintenance) expenditures and Non-Renewal expenditures, this category includes “Growth” and “Strategic Initiatives” project type definitions:
• Growth: This category includes projects that have been identified in the development charges background study that reflects the current Official Plan. More specifically, to be categorized as Growth, a project must have a development charge component that is greater than 30% of the total authority requested. Projects where the development charge component is 30% or less are categorized as renewal of City assets or strategic initiatives. Transit / light rail projects that are considered growth related are included in this category regardless of the percentage component of development charge funding.
• Strategic Initiatives: This category includes all other capital expenditures such as implementing various master plans or the Ottawa 20/20 plan, the enhancement of services currently being provided and growth costs not eligible for development charges or below the level required to be categorized growth. It also includes initiatives to enhance organizational effectiveness and respond to changes in demand for service. Within the strategic initiatives category there are two further classifications: Regulatory (which reflects legislated requirements) and all other projects that are not specific to other categories.
• Transition – This category reflects those projects which occurred to support the City amalgamation.
The line items programs/projects were categorized by type according to City of Ottawa financial definitions of Renewal, Strategic Investment and Transition.
2008 Page 8

Audit of IT Capital Expenditures and Project Approval Process
Total Client and IT Owned Spend 2001-2006 by Type
Renewal51%
Strategic Investment
10%
Transition39%
Total Client Owned Spend
2001-2006 by Type
Renewal29%
Strategic Investment
37%
Transition34%
Total ITS Owned Spend for 2001-2006 by Type
Strategic Investment
3%
Renewal57%
Transition40%
Table 5 ($000)
Project Type 2001 % 2002 % 2003 % 2004 % 2005 % 2006 % Total % Renewal $9,027 72% $10,371 32% $14,242 41% $11,247 59% $9,304 69% $10,776 70% $64,966 51% Strat. Invest. $733 6% $719 2% $2,105 6% $1,024 5% $4,219 31% $4,522 30% $13,323 10% Transition $2,725 22% $21,750 66% $18,422 53% $6,929 36% $39 0% $ 0% $49,864 39% Total $12,485 100% $32,839 100% $34,769 100% $19,199 100% $13,562 100% $15,298 100% $128,152 100%
Source: City of Ottawa Financial Services
When considering the IT capital spending from the perspective of type of spending we note the following:
• Client-owned and ITS-owned IT capital had different spending profiles with ITS--owned IT capital primarily directed at renewal while client-owned IT capital is primarily strategic investment and renewal.
• Total renewal for 2001-2006 was 51%.
• Renewal was greater than or equal to 70% for IT and client-owned IT capital combined in 2001 and 2006.
• IT Renewal project spending consumed the majority of total ITS-owned IT capital spending at 57% ($56.3M) during the period 2001 to 2006.
2008 Page 9

Audit of IT Capital Expenditures and Project Approval Process
• Total Strategic Investment spending shows an increasing trend and was highest in
2005 ($4.2M) and 2006 ($4.5M), but was $1M or less in 2001 2002, and 2004.
• Total IT Transition spending was 39% ($49.9M) for 2001-2006.
4.1.3 Client-Owned IT Capital Spending Client-owned IT capital spending refers to the capital funds provided by the City branches for various defined IT initiatives.
4.1.3.1 Total Client-Owned Spending by Branch
Total Client Owned IT Capital for the period 2001-2006
Planning, Transit & Environment - Transit Services
49%
Library18%
CPS - Housing Branch
4%
CPS - Employment &
Financial Assistance
1%
CPS - Cultural Services & Community
Funding1%
CPS - Parks & Recreation
Branch11% CPS - Fire
Services15%
Other
Table 6 ($000)
Branch 2001 % 2002 % 2003 % 2004 % 2005 % 2006 % Total % Transit $2,550 50% $2,767 37% $1,451 27% $703 31% $3,213 72% $3,516 73% $14,200 48%Library $787 15% $1,614 22% $1,290 24% $416 18% $675 15% $422 9% $5,204 18%Fire $143 3% $1,895 26% $1,951 36% $485 21% -$16 0% $ 0% $4,457 15%Parks & Rec. $1,566 30% $848 11% $357 7% $395 17% $202 5% -$15 -0.3% $3,353 11%Housing $ 0% $73 1% $27 1% $ 0% $274 6% $725 15% $1,100 4%Cultural Services $ 0% $9 0% $134 2% $158 7% $46 1% $90 2% $437 1%EFA $92 2% $166 2% $ 0% $ 0% $1 0% $43 1% $303 1%Infra. Srv. $ 0% $14 0% $105 2% $56 2% $7 0% $25 1% $206 1%Other CPS $ 0% $ 0% $61 1% $24 1% $5 0% $27 1% $116 0%Utility Services $ 0% $ 0% $ 0% $31 1% $43 1% $4 0% $78 0%Traffic & Parking $ 0% $ 0% $ 0% $ 0% $4 0% $ 0% $4 0%Total $5,138 70% $7,387 29% $5,375 18% $2,267 13% $4,454 49% $4,837 46% $29,459 30%
Source: City of Ottawa Financial Services
2008 Page 10

Audit of IT Capital Expenditures and Project Approval Process
Based on the above information, during the period 2001 to 2006:
• Highest three consumers were: • Transit Services ($14.2M) 48% • Library Services ($5.2M) 18% • Fire Services ($4.5M) 15%
• Lowest three consumers were: • CPS - Other ($116K) <1% • Utility Services ($78K) <1% • Traffic and Parking ($4K) < 1%
• Transit Services and Library Services were the only areas which had positive spending activity for every year between 2001-2006 – together consuming 66% of total client-owned IT capital.
• Only Utility Services and Traffic and Parking were not consistent consumers, i.e., they had spending in less than four out of the six years reviewed.
4.1.3.2 Client-Owned Spending vs. Number of Projects The following graph and tables indicate that overall client-owned IT capital spending appeared to decrease while the number of programs/projects increased over the time period 2001 to 2006.
Client Owned IT Capital Programs / Projects and $ for 2001-2006
2322
231817
11
$-$1,000,000$2,000,000$3,000,000$4,000,000
$5,000,000$6,000,000$7,000,000$8,000,000
2001 2002 2003 2004 2005 20060
5
10
15
20
25
Pro
gram
s / P
roje
cts
Client Owned IT Capital Client Owned IT Projects
2008 Page 11

Audit of IT Capital Expenditures and Project Approval Process
12
4.1.3.3 Number and Name of Client-Owned Initiatives Table 7 ($000)
Project# Branch Description Total Plan 2001 2002 2003 2004 2005 2006 Total Actual
900134 EFA EFA Program $974 $92 $166 $ $ $1 $43 $303 900294 Transit GPS Mobile Comm. $865 $429 $39 $ $36 $ $ $503 900300 Transit Automated Fare $1,750 $127 $113 $119 $21 $133 $268 $780 900362 Transit IVR System $1,577 $11 $61 $40 $1 $277 $359 $748 900516 Transit Vehicle Info.Sys. $6,040 $1 $142 $250 $150 $2,136 $2,336 $5,015 900519 Transit Transit Computer Sys. $6,243 $1,983 $2,412 $1,043 $369 $41 $1 $5,849 900590 Fire Transition - Dispatch $4,150 $124 $1,801 $1,812 $268 $7 $ $4,012 900645 Parks & Rec. Transition - CLASS $2,759 $1,558 $848 $351 $1 $ $ $2,759 900650 Library Transition - Int. Library $2,950 $787 $1,499 $368 $79 $ $ $2,733 900745 Library A&TS Equip. $197 $ $102 $80 $3 $ $2 $186 900746 Library Security Checkout Sys $850 $ $6 $734 $46 $12 $52 $850 900802 Library Virtual Service & SW $145 $ $7 $10 $47 $48 $ $112 900923 Fire Transition - Telecomm $460 $18 $94 $139 $217 -$23 $ $445 900982 Library Computer and IT Equip. $350 $ $ $99 $239 $12 $ $350 901002 Housing Social Housing IS $1,250 $ $73 $27 $ $274 $725 $1,100 901053 CPS EPS Program $266 $ $ $61 $24 $5 $27 $116 901066 Cultural Services Archives/Museums/ Art $476 $ $9 $134 $158 $46 $90 $437 901171 Infrastructure Svcs Infrastructure IT $222 $ $14 $105 $56 $7 $25 $206 901172 Utility Services Utility IT $126 $ $ $ $31 $43 $4 $78 901173 Traffic & Parking Traffic IT $142 $ $ $ $ $4 $ $4 902952 Transit Transit Computer Sys. $2,128 $ $ $ $126 $626 $484 $1,236 903028 Library ILS $604 $ $ $ $2 $490 $94 $586 903105 Parks & Rec. Class Reg. Sys. $1,216 $ $ $ $384 $202 -$15 $572 903365 Transit Online Cultural $68 $ $ $ $ $ $68 $68 903569 Library IT Replacement $200 $ $ $ $ $82 $78 $160 903572 Library Self-checkout Sys $100 $ $ $ $ $ $85 $85 903573 Library Desktop Upgrade $99 $ $ $ $ $28 $6 $34 903574 Library Web Based Services $120 $ $ $ $ $3 $34 $38 903576 Library Smart Card $80 $ $ $ $ $ $57 $57 903908 Library Adaptive Technology $20 $ $ $ $ $ $13 $13 991357 Parks & Rec. Parks & Rec. System $211 $8 $ $5 $10 $ $ $23 Grand Total $36,637 $5,138 $7,387 $5,375 $2,267 $4,454 $4,837 $29,459
Source: City of Ottawa Financial Services
2008 Page

Audit of IT Capital Expenditures and Project Approval Process
13
Client-Owned Spending by Type of Expenditure
Client Owned Program / Project Spend by Type for 2001 to 2006
$-
$1,000,000
$2,000,000
$3,000,000
$4,000,000
$5,000,000
$6,000,000
$7,000,000
$8,000,000
2001 2002 2003 2004 2005 2006
Renewal Strategic Investment Transition
Table 8 ($000)
Branch Renewal Strategic Invest. Transition Total $ % $ % $ % $ %
ITS-Owned $56,298 87% $2,480 19% $39,915 80% $98,693 77%CPS $116 0% 0% 0% $116 0%Cultural Srv 0% $437 3% 0% $437 0%EFA $303 0% 0% 0% $303 0%Fire 0% 0% $4,457 9% $4,457 3%Housing 0% $1,100 8% 0% $1,100 1%Parks & Rec. $572 1% $23 0% $2,759 6% $3,353 3%Library $544 1% $1,927 14% $2,733 5% $5,204 4%Transit $7,132 11% $7,068 53% 0% $14,200 11%Infra. Srv. 0% $206 2% 0% $206 0%Traffic/Parking 0% $4 0% 0% $4 0%Utility Srv 0% $78 1% 0% $78 0%Total $64,966 100% $13,323 100% $49,864 100% $128,152 100%
ITS-Owned /,% of total $56,298 87% $2,480 19% $39,915 80% $98,693 77%Client-Owned /, % of total $8,668 13% $10,842 81% $9,949 20% $29,459 23%
Source: City of Ottawa Financial Services * Note that Transition projects were not expected to continue beyond the 2005 timeframe.
When considering the breakdown of client-owned IT capital by type of expenditure it is apparent that:
• Strategic Investment spending is increasing.
• Strategic Investment programs/projects were the biggest consumers in 2005 and 2006, as there was no Transition spending in these years, and relatively small Renewal spending.
• Total Transition spending was highest in 2002 ($21.7M).
2008 Page

Audit of IT Capital Expenditures and Project Approval Process
14
4.1.3.4 Client-Owned Programs vs. Projects Another important distinction when considering IT capital spending is the difference between a project and a program. A project is a defined undertaking with a single specific objective, budget, start and end date. A program, on the other hand, has a broader scope, generally a longer timeframe and is typically made up of multiple smaller projects and activities that are managed within a larger budget to provide greater flexibility (usually for the purpose of sustainment, maintenance or enhancements). The following graphs and table provide more complete data on this distinction for client-owned IT spending.
Spending Split by Program / Project and Ownership
31%
8%
15%
46%
IT Owned Capital Program IT Owned Capital ProjectClient Owned Capital Program Client Owned Capital Project
Client Owned IT Capital Programs and Projects
$-
$1,000,000
$2,000,000
$3,000,000
$4,000,000
$5,000,000
$6,000,000
2001 $ 2002 $ 2003 $ 2004 $ 2005 $ 2006 $
ProgramProject
Table 9 Programs/Projects by Duration Program / Project 1 Year 2 Years 3 Years 4 Years 5 Years 6 Years Total Program 2 2 4 2 3 1 14 Project 3 1 1 4 5 3 17 Total 5 3 5 6 8 4 31
Source: City of Ottawa Financial Services, ITS and client identification.
Table 10 ($000)
Program / Project 2001 $ 2002 $ 2003 $ 2004 $ 2005 $ 2006 $ Total Program $1,990 $2,527 $2,032 $1,279 $1,098 $738 $9,665Project $3,148 $4,860 $3,343 $988 $3,356 $4,099 $19,794Total $5,138 $7,387 $5,375 $2,267 $4,454 $4,837 $29,459
Source: City of Ottawa Financial Services, ITS and client identification.
2008 Page

Audit of IT Capital Expenditures and Project Approval Process
15
From the graphs and tables above we note that:
• Client-owned and ITS-owned profiles differ when considering the mix of programs and projects.
• The client-owned profile shows a greater number of projects as opposed to programs, with the largest number of projects tending to require greater than 3 years to complete.
• Post Transition, client-owned IT capital tends to be directed more to projects than programs.
4.1.4 ITS-Owned IT Capital Spending ITS-owned IT capital spending refers to the capital funds provided by ITS for various defined IT initiatives.
4.1.4.1 Total ITS-Owned Spending by Project
Total IT Owned IT Capital for the period 2001-2006
GIS3%
Surveys & Mapping Program
1%
Other
Lifecycle Maintenance
17%
Electronic Services Program
4%
SAP Sustainment17%
Network Infrastructure
7%
Records Information & Management
7%
Transition40%
Table 11 ($000) Project Description 2001 % 2002 % 2003 % 2004 % 2005 % 2006 % Total %
Transition $237 3% $17,507 69% $15,752 54% $6,364 38% $55 1% $ 0% $39,915 40%Lifecycle Maint. $1,305 18% $2,361 9% $3,851 13% $2,714 16% $3,655 40% $2,610 25% $16,497 17%SAP Sustainment $2,692 37% $3,664 14% $5,006 17% $3,426 20% -$506 -6% $2,148 21% $16,432 17%Records IM $1,075 15% $ 0% $954 3% $830 5% $2,483 27% $1,931 18% $7,273 7%Network Infrastructure $594 8% $674 3% $1,603 5% $981 6% $956 10% $1,693 16% $6,501 7%Electronic Svcs $ 0% $113 0% $599 2% $956 6% $828 9% $1,031 10% $3,527 4%GIS $554 8% $274 1% $620 2% $804 5% $647 7% $185 2% $3,084 3%Smart Capital $558 8% $260 1% $669 2% $285 2% $151 2% $90 1% $2,014 2%Surveys & Mapping Prog. -$23 0% $216 1% $120 0% $270 2% $450 5% $156 1% $1,189 1%BI / Data Warehousing $94 1% $181 1% $4 0% $15 0% $77 1% $259 2% $629 1%CAD & Drafting $106 1% $149 1% $145 0% $176 1% $4 0% $24 0% $605 1%Business App. Req. $ 0% $ 0% $43 0% $109 1% $94 1% $4 0% $249 0%IT TCO $156 2% $45 0% $9 0% $ 0% $8 0% $ 0% $217 0%IT Security Initiatives $ 0% $ 0% $ 0% $ 0% $58 1% $136 1% $193 0%
2008 Page

Audit of IT Capital Expenditures and Project Approval Process
16
Project Description 2001 % 2002 % 2003 % 2004 % 2005 % 2006 % Total % Dept. Tech. Improvements $ 0% $ 0% $ 0% $ 0% $95 1% $72 1% $167 0%Sustainment - Electronic IT $ 0% $ 0% $ 0% $ 0% $26 0% $105 1% $132 0%Telecommunications $ 0% $10 0% $17 0% $2 0% $27 0% $16 0% $71 0%Grand Total $7,347 100% $25,452 100% $29,393 100% $16,932 100% $9,108 100% $10,462 100% $98,693 100%
Source: City of Ottawa Financial Services Based on the data in the table and graph above:
• The highest three activity consumers of ITS-owned IT capital, overall and consistently, between 2001 to 2006 were:
• Transition (40%, $39.9M); • Lifecycle maintenance for computers and peripherals (17%, 16.5M); and, • SAP platform sustainment (17%, $16.4M).
• The lowest three activity consumers between 2001 to 2006 were:
• Departmental technology improvements (<1%, $167K); • Sustainment – Electronic information technology (<1%, $132K); and, • Telecommunications (<1%, $71K).
4.1.4.2 ITS-Owned Spending by Type of Expenditure When considering the ITS-owned IT capital spending by type (see page 8 and 9 for definitions relating to Renewal, Strategic Investment and Transition) the following graph and tables were used.
IT Owned Program / Project Spend by Type for 2001 to 2006
$-
$5,000,000
$10,000,000
$15,000,000
$20,000,000
$25,000,000
$30,000,000
$35,000,000
2001 2002 2003 2004 2005 2006
Renewal Strategic Investment Transition
Table 12 ($000)
Type 2001 % 2002 % 2003 % 2004 % 2005 % 2006 % Total % Renewal $6,396 87% $7,641 30% $12,920 44% $10,173 60% $8,800 97% $10,368 99% $56,298 57%Strat. Invest. $714 10% $305 1% $721 2% $394 2% $252 3% $94 1% $2,480 3%Transition $237 3% $17,507 69% $15,752 54% $6,364 38% $55 1% $ 0% $39,915 40%Total $7,347 100% $25,452 100% $29,393 100% $16,932 100% $9,108 100% $10,462 100% $98,693 100%
Source: City of Ottawa Financial Services, ITS and client identification. * Note that Transition projects were not expected to continue beyond the 2005 timeframe.
2008 Page

Audit of IT Capital Expenditures and Project Approval Process
17
• Overall ITS-owned IT capital spending appeared to exhibit a slight increasing trend over the time period 2001 to 2006, when omitting Transition.
• In 2006, Strategic Investment projects were a low 1% for ITS-owned capital, while Renewal projects were the highest.
• Transition spending varied greatly, and appeared to be responsible for the noted increase in ITS-owned IT capital expenditures in 2002 and 2003.
• A total of $39.9M was spent on Transition projects from ITS-owned IT capital spending.
4.1.4.3 ITS-Owned Programs vs. Projects As mentioned previously, an important distinction when considering IT capital spending is the difference between a project and a program. The following graphs and tables provide more complete data on this distinction for IT-owned IT spending.
Spending Split by Program / Project and Ownership
31%
8%
15%
46%
IT Owned Capital Program IT Owned Capital ProjectClient Owned Capital Program Client Owned Capital Project
IT Owned IT Capital Programs and Projects
$-$2,000,000$4,000,000$6,000,000$8,000,000
$10,000,000$12,000,000$14,000,000$16,000,000$18,000,000
2001 $ 2002 $ 2003 $ 2004 $ 2005 $ 2006 $
ProgramProject
Table 13 - Programs/Projects by Duration
ITS-Owned Program/Project
1 Year 2 Year 3 Year 4 Year 5 Year 6 Year Total
Program 2 4 1 2 3 11 23 Project 1 1 0 1 1 0 4 Total 3 5 1 3 4 11 27
Source: City of Ottawa Financial Services, ITS and client identification.
2008 Page

Audit of IT Capital Expenditures and Project Approval Process
18
Table 14 ($000) Program/ Project
2001 2002 2003 2004 2005 2006 Total
Program $7,235 $8,417 $13,670 $10,567 $9,053 $10,462 $59,404 Project $112 $17,035 $15,723 $6,364 $55 $ $39,290 Total $7,347 $25,452 $29,393 $16,932 $9,108 $10,462 $98,693
Source: City of Ottawa Financial Services, ITS and client identification.
From this data, general observations are:
• ITS-owned IT capital is directed to more programs than projects.
• Most programs appear to be long term – in the area of 5 to 6 years.
Recommendation 1 That management ensure a complete analysis of corporate-wide IT capital spending is conducted on an annual basis to monitor and track IT expenditures.
Management Response Management agrees with this recommendation.
IT Services reviews both IT-owned and client-owned capital expenditures on a quarterly basis and provides input into quarterly financial and performance reports for Council. In addition, IT capital spending is consolidated in the annual OMBI performance report on information technology. The analysis conducted during the audit will be used as a template for future monitoring and year-end analysis of IT expenditures.
It should be noted that the analysis of budget vs. actual spending incorrectly concludes there have been significant surplus/deficits in terms of capital spending since amalgamation. This is misleading in that the analysis does not factor in the carry-over of unspent spending authority from year- to-year. Management provides regular reports to Council on operating and capital works-in-progress which clearly identify spending against budget and any variances.
Secondly, in order to ensure consistency and avoid confusion with the definitions used by Council for capital planning and reporting, the grouping of growth and strategic initiatives into one broader category is not recommended by Financial Services.
4.2 Audit Objective 2: Project Prioritization and Approval Process
4.2.1 Current Prioritization Process Review Results The review of documentation regarding the City’s current process for prioritizing IT capital expenditures indicate that in 2004 the City established the value management function document, including the value management function components, value management governance, and supporting documentation that contains specific value management methods, tools and techniques.
2008 Page
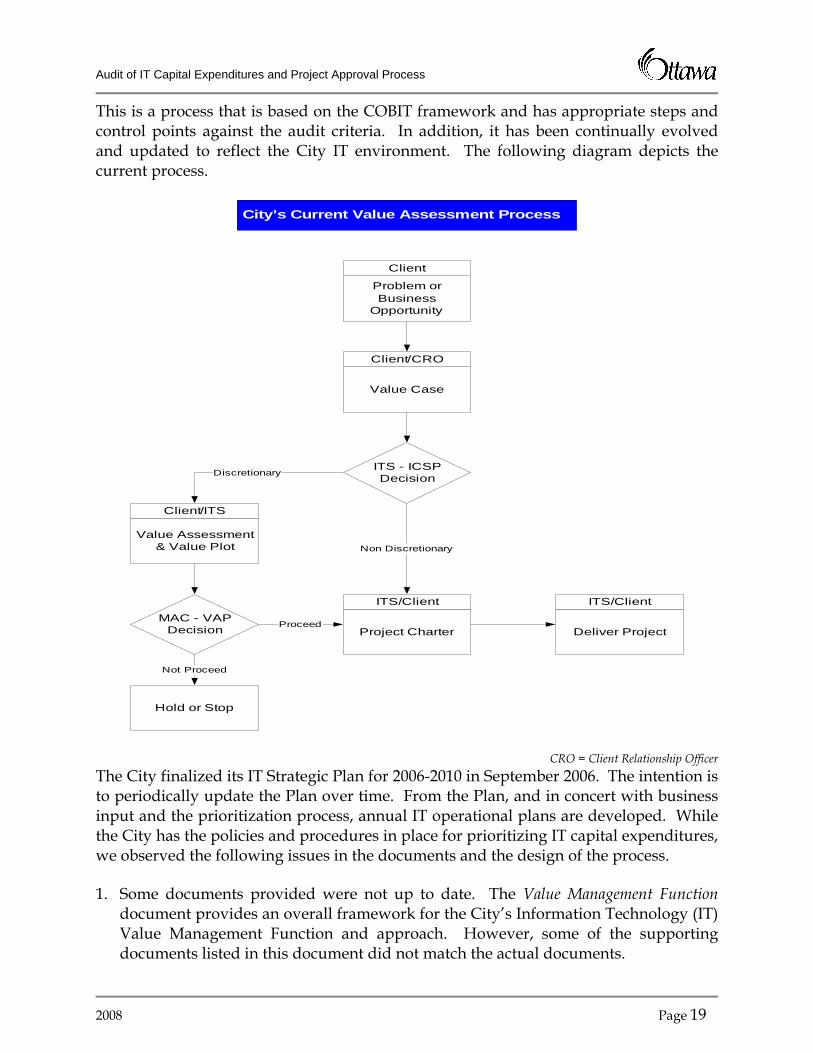
Audit of IT Capital Expenditures and Project Approval Process
19
This is a process that is based on the COBIT framework and has appropriate steps and control points against the audit criteria. In addition, it has been continually evolved and updated to reflect the City IT environment. The following diagram depicts the current process.
Problem or Business
Opportunity
Client
Value Case
Client/CRO
Value Assessment & Value Plot
Client/ITS
Project Charter
ITS/Client
Deliver Project
ITS/Client
ITS - ICSP Decision
City’s Current Value Assessment Process
MAC - VAP Decision
Discretionary
Proceed
Non Discretionary
Hold or Stop
Not Proceed
CRO = Client Relationship Officer The City finalized its IT Strategic Plan for 2006-2010 in September 2006. The intention is to periodically update the Plan over time. From the Plan, and in concert with business input and the prioritization process, annual IT operational plans are developed. While the City has the policies and procedures in place for prioritizing IT capital expenditures, we observed the following issues in the documents and the design of the process.
1. Some documents provided were not up to date. The Value Management Function document provides an overall framework for the City’s Information Technology (IT) Value Management Function and approach. However, some of the supporting documents listed in this document did not match the actual documents.
2008 Page

Audit of IT Capital Expenditures and Project Approval Process
20
2. The Investment Category Selection Panel’s (ICSP) is comprised of a subset of eight Level 5 Program Managers from ITS. The ICSP’ s primary role is to review and assess the Concept Value Case (CVC) for various IT-enabled projects and to provide a decision as to whether the project is discretionary or non-discretionary using the Investment Category Selector tool. The Investment Category Selector tool contains a detailed set of criteria and identifies as non-discretionary projects which are mandatory in accordance with legislation or policy or which sustain existing services and services levels. The tool further distinguishes sustaining projects as being immediate or deferrable. Discretionary projects are defined as those that provide enhancement to existing services and service levels through efficiency and productivity improvements or new functionality.
3. The ISCP also includes additional Level 5 Program Manager Representatives from Information Management (IM), Technology Infrastructure (TI) and other areas that may be called upon for their expertise depending on the CVC being presented. Since the panel consists of eight members (which is an even number), there arises the potential for a tie, a situation which was not addressed in any of the documentation. It was also not clear if the additional Program Manager Representatives had voting rights or if they were just consulted for their expertise. While the Terms of Reference implies that decisions are to be made on a consensus basis, this is not explicitly stated.
4. The Value Assessment Panel (VAP) is a sub-committee of the Management Advisory Committee (MAC) and consists of five members:
• Director, ITS as the Chair • Representatives from four Community and Protective Services; Public Works and
Services; Planning Transit & the Environment and Business Transformation Services.
Once the ICSP has determined whether a proposed project is discretionary or mandatory, the VAP is responsible for determining whether the project should proceed or not. The decision is based upon a comprehensive evaluation tool known as the Value Assessment Instrument which assesses each project against three categories; alignment to the business, risk of realizing intended benefits and financial worth. Within these categories are multiple questions/criteria for scoring. Although this process and assessment tool is consistent with COBIT guidelines, a number of new initiatives are not reviewed by VAP, but by the ICSP only.
5. The Terms of Reference state that non-resolved issues are to be escalated to the Value Governance Process Owners and, if necessary, to the Chief Information Officer. However, the documentation does not state how the issues are to be documented, how they will be brought to the attention of the next level and within what timeframes this is to take place.
6. If the Client Sponsor is in disagreement with the categorization by the ICSP, the issue would be directed to their Client Relationship Manager (CRM) to resolve with the Value Governance Process Owners. However, since the Client Relationship
2008 Page

Audit of IT Capital Expenditures and Project Approval Process
21
Manager is accountable for the project’s Concept Value Case, it is not clear what formal mechanism is in place for dispute discussion and resolution.
7. In the event the Client Sponsor was in disagreement with Value Assessment Panel (VAP) decision regarding high value investment opportunities to proceed, hold or stop, the issue was to be directed to the VAP Subcommittee Chair (i.e., Director, ITS) to resolve with the Client Sponsor. The Director ITS therefore has authority over the VAP Subcommittee in reviewing and/or making decisions on Value Assessment Executive Summaries for all discretionary IT-enabled project and business opportunities. However, as mentioned above, a complete approval, escalation or recourse process has not yet been described or documented. Ultimately, approval of projects and resolution of disputes should rest with the Executive Management Committee.
8. Not all programs/projects are required to go through this process as a result of attempts to streamline the process. However there is a risk that programs/projects may be inappropriately classified and miss the control points in the process.
Based on the assessment against the COBIT framework, there are appropriate checkpoints and controls in place for prioritization and approval of IT capital programs/projects. However, as was pointed out from the client perspective, there are many parties involved in the Value Management Function, and as a result, the value management process appears to be perceived, by clients, as one that takes too much time. In addition, since clients may only participate in the process infrequently there is also a client perception that it requires much paper work and is confusing.
4.2.2 Sample Program/Project Review Results Based on the results of interviews and review of provided documentation, the evaluation by ITS managers and project managers on the effectiveness of the overall process for prioritizing and approving IT expenditures by appropriate authorities was positive. We also note that the City’s ITS has its strategic IT plan and operational plans. The City’s budgeting process is well established and understood for IT planning. However, the results of the interviews indicated that some issues as discussed below exist in the process.
4.2.2.1 Mix of governance models Based on our interviews, we noted that the governance structure applied for the sample programs/projects was inconsistent. There was a mix of committee, board, individual, and business and IT governance models that were not consistent in the model selected or in the focus of the governing body. The use of governance structures to support a program/project is in line with the COBIT framework and has being applied to both pre-2004 and post-2004 programs/projects. While it is appropriate to adopt and implement different governance models depending on the size and scope of a particular program/project, it appears that there are no specific guidelines on which model should be applied. In addition, the decision records are not consistently maintained.
2008 Page

Audit of IT Capital Expenditures and Project Approval Process
22
Without a well-defined project governance structure, IT resources may not be allocated in line with business needs. The following table provides a summary of the governance bodies in use.
Table 15: Governance Bodies Pre-2004 (7 Programs/projects) # Code Project Name Governance Model 1 900119 Computer Aided Design
and Drafting (Program) Transition Board (broad composition and broad focus, beyond scope of the program)
2 900294 GPS Mobile Communications (Project)
Business directed (narrow composition and narrow focus)
3 900516 Transit Vehicle Information System (Project)
Transit-IT Governance Committee (broad composition and narrow focus)
4 900661 Transition Operations Management (Project)
Transition Board (broad composition and broad focus, beyond scope of the program)
5 901049 Business Application Requirement (Program)
Transition Board (broad composition and broad focus, beyond scope of the program)
6 901066 Archive/Museums/Art Collections (Project)
Steering Committee with ITS (broad composition and narrow focus)
7 901184 (Transition) Integrated Business Systems (Project)
Steering Committee (broad composition and narrow focus)
8 903105 Class Registration System (Program)
Governance Committee - program manager, ITS, and two area managers (broad composition, narrow focus)
9 903562 IT Security Initiatives (Program)
Security Committee (narrow composition and narrow focus)
10 903563 Electronic Information Technology (Program)
Risk discussion at management level prior to approval of operational plans; consultation with business and stakeholders (unstructured and narrow focus)
11 903576 Smart Card/Vend Card Technology (Project)
Ottawa Public Library Board (narrow composition and narrow focus)
12 904067 SAP Sustainment – 2006 (Program)
Created by Council report to close old account. ITS management. (narrow composition and narrow focus)
As stated earlier, the majority of new initiatives were not reviewed by VAP, but by the internal IT Committee (ICSP). As a result, there is a perception that the process is not as transparent to all those affected. While it is appropriate to adopt a governance structure that best supports the IT initiative being considered, there do not appear to be guidelines regarding the structures that should be used. Although management has indicated that program governance is conducted within an overall City governance model based on the Program Management Institute, this model was never referenced in the interviews conducted during the audit.
2008 Page

Audit of IT Capital Expenditures and Project Approval Process
23
Recommendation 2 That management update current documentation for the existing prioritization process.
Management Response Management agrees with this recommendation.
As noted in the report, the prioritization process was under review at the time of the audit. Changes were recommended and approved by the Executive Management Committee (EMC) on November 22, 2007. Documentation has been modified and updated to reflect the approved changes and was fully implemented as of June 30, 2008.
Recommendation 3 That management clarify the voting rights of all members of the Investment Category Selection Panel.
Management Response Management agrees with this recommendation.
As noted in the report, the terms of reference for the Investment Category Selection Panel (ICSP) were under review at the time of the audit. It was subsequently determined that the ICSP was no longer required in the new prioritization process approved by EMC on November 22, 2007.
Recommendation 4 That management clarify the project approval process including the escalation and dispute resolution process and clarify the role of the Executive Management Committee for final project approvals.
Management Response Management agrees with this recommendation.
As noted in the report, the project approval process, including the escalation and dispute resolution process, were under review at the time of the audit. Changes were approved by EMC on November 22, 2007. The role of the EMC in final project approval has been clarified in the new prioritization process, which was implemented as of June 30, 2008.
Recommendation 5 That management ensure all proposed projects are reviewed by the Value Assessment Panel to increase the transparency of the prioritization process for those parties not directly involved.
Management Response The amended prioritization process approved by EMC on November 22, 2007, requires the Value Assessment Panel (VAP) to review in detail, all proposed IT
2008 Page

Audit of IT Capital Expenditures and Project Approval Process
24
projects that are estimated to exceed $100,000. This is an industry best practice. Smaller projects will be reviewed by a committee of senior IT managers and the director/CIO, and reported to the VAP. The results of all reviews including costs, benefits, risks, and value scores, irrespective of size, will be communicated to all City Departments.
Recommendation 6 That management develop guidelines for appropriate governance models to be used.
Management Response Management agrees with this recommendation.
As noted in the report, IT Services has been working to consolidate various IT governance models that were in place during amalgamation. Since 2004, IT Services has been applying a common model for IT projects, irrespective of funding source. The governance model being used for project priority setting and selection was developed by Fujitsu Consulting and is a recognized best practice, endorsed by the IT Governance Institute and the Information Systems Audit and Control Association (ISACA). It applies to all IT-enabled projects, whether funded from operating or capital budgets. The changes approved by EMC on November 22, 2007 further clarify the IT governance model. These changes were fully implemented as of June 30, 2008 and Guidelines have been communicated to City departments.
Program governance (priority setting, financial management, monitoring and reporting) is conducted within the overall City of Ottawa governance model and its associated guidelines and criteria. In the case of ITS, a Strategic Planning Committee of managers and the director review and approve branch and program priorities as part of the annual operational planning cycle. A governance model for project management of all approved IT-enabled projects was established in 2001, based on the Project Management Institute (PMI) and the Project Management Book of Knowledge (PMBoK). Both project prioritization and project management frameworks are industry best practices that ITS continues to enhance and evolve toward a higher level of maturity.
4.2.2.2 Not all projects have formal cost/benefit and risk analysis Some projects did not have business cases, although this was primarily noted in pre-2004 programs/projects and was due to the City’s transition. For other projects, the cost/benefit and risk analysis was inconsistent and not formally documented. Post-2004 programs/projects were fairly consistent in the use of a Concept Value Case that covers the business case elements and is aligned with the COBIT framework. We noted that there was no evidence of a process to update the business case if needed or measure the results against the initial business case elements of COBIT that extend beyond the prioritization and approval processes. As a result, the business benefit and the return on investment of IT resources may not be realized as expected. The following table summarizes the results of the business case review.
2008 Page
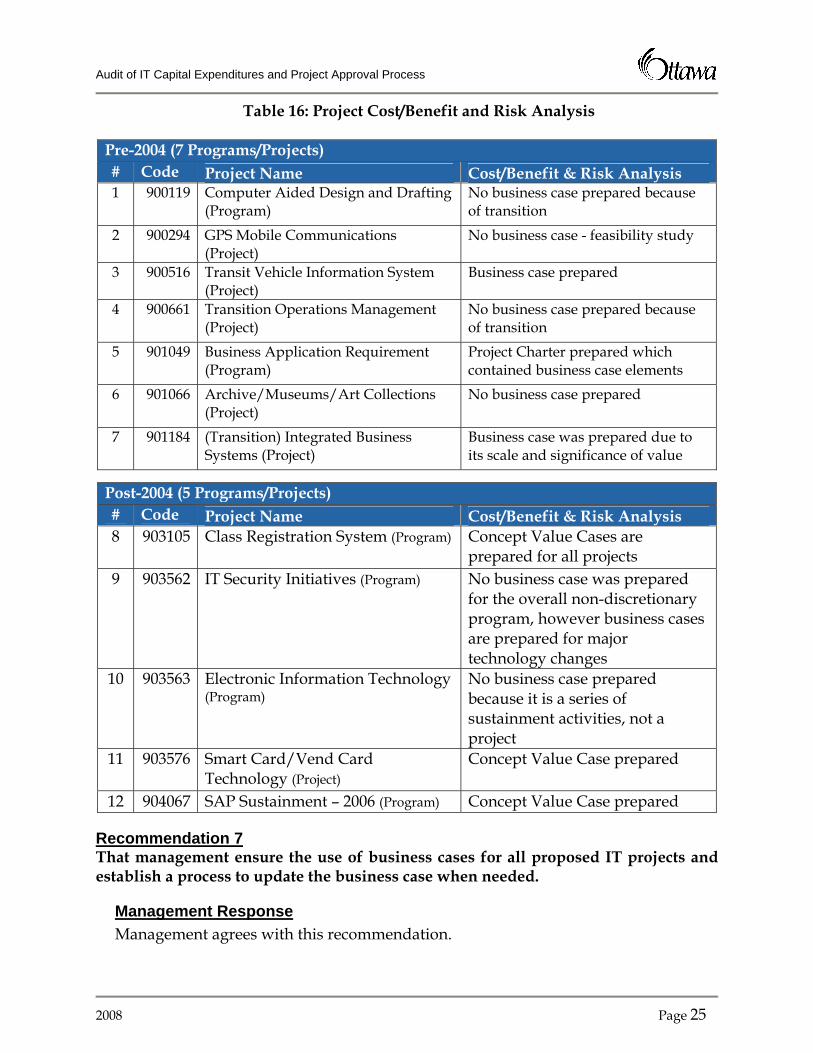
Audit of IT Capital Expenditures and Project Approval Process
25
Table 16: Project Cost/Benefit and Risk Analysis
Pre-2004 (7 Programs/Projects) # Code Project Name Cost/Benefit & Risk Analysis 1 900119 Computer Aided Design and Drafting
(Program) No business case prepared because of transition
2 900294 GPS Mobile Communications (Project)
No business case - feasibility study
3 900516 Transit Vehicle Information System (Project)
Business case prepared
4 900661 Transition Operations Management (Project)
No business case prepared because of transition
5 901049 Business Application Requirement (Program)
Project Charter prepared which contained business case elements
6 901066 Archive/Museums/Art Collections (Project)
No business case prepared
7 901184 (Transition) Integrated Business Systems (Project)
Business case was prepared due to its scale and significance of value
Post-2004 (5 Programs/Projects) # Code Project Name Cost/Benefit & Risk Analysis 8 903105 Class Registration System (Program) Concept Value Cases are
prepared for all projects 9 903562 IT Security Initiatives (Program) No business case was prepared
for the overall non-discretionary program, however business cases are prepared for major technology changes
10 903563 Electronic Information Technology (Program)
No business case prepared because it is a series of sustainment activities, not a project
11 903576 Smart Card/Vend Card Technology (Project)
Concept Value Case prepared
12 904067 SAP Sustainment – 2006 (Program) Concept Value Case prepared
Recommendation 7 That management ensure the use of business cases for all proposed IT projects and establish a process to update the business case when needed.
Management Response Management agrees with this recommendation.
2008 Page

Audit of IT Capital Expenditures and Project Approval Process
26
A formal business case has been required since 2004 for all "discretionary" IT projects. The changes approved by EMC on November 22, 2007 require a formal business case for all IT projects. In addition, as part of the IT project management practice and project life cycle, IT now requires the IT project manager to review the business case at key phases in the implementation of each project. Any significant variation in either the costs or the benefits triggers an automatic review of the business case.
4.2.2.3 Lack of documented criteria for prioritization and prioritization decision process Prioritization is taking place in three distinct places – business (i.e., Departments, Branches and Divisions within the City), program and IT. The business is defining their IT priorities when taking their projects forward to IT and to Council for budget approval. The governance structure in place for various programs are making prioritization decisions when considering the merits of various activities and projects. IT is using the value plot process to set overall IT priorities. The value plot uses defined, static prioritization criteria. However, for the other two, we noted that most of the prioritization decisions were made via discussion within the program/project governance structure. All interview participants mentioned considering similar aspects of budget, risk, business imperatives and impacts when making prioritization decisions. So, although informal adherence to the COBIT framework is taking place, there are no standard prioritization criteria in place as a guide to the decision process and to ensure consistent decision-making. Although the interview results showed that the process of prioritizing IT capital expenditures generally worked well, there is still room for improvement.
While prioritizing IT capital expenditures by discussion is acceptable, there is a lack of structure surrounding the decisions and these may be skewed without a standard guidance or a framework, resulting in inconsistent prioritization decisions. The following table provides a summary of the prioritization process.
Table 17: Project Prioritization
Pre-2004 (7 Programs/Projects) # Code Project Name Approval and Prioritization 1 900119 Computer Aided
Design and Drafting (Program)
Transition Board established initial priorities and approval
2 900294 GPS Mobile Communications (Project)
Business decision for approved feasibility study
3 900516 Transit Vehicle Information System (Project)
Transit-IT Governance Committee makes priority decisions and budgeting approval via Council budget approval
4 900661 Transition Operations Transition Board established initial priorities and
2008 Page

Audit of IT Capital Expenditures and Project Approval Process
27
Pre-2004 (7 Programs/Projects) # Code Project Name Approval and Prioritization
Management (Project) approval for integration of operational services
5 901049 Business Application Requirement (Program)
Priorities set via consultation ad discussion with Corporate Services
6 901066 Archive/Museums/Art Collections (Project)
Steering Committee discusses and sets priorities
7 901184 (Transition) Integrated Business Systems (Project)
Stage 2 of Transition Board project. Steering Committee was in place to prioritize and to approve change requests due to its size and scale
8 903105 Class Registration System (Program)
Governance Committee for prioritization decisions based on time requirements, business needs, and available resources
9 903562 IT Security Initiatives (Program)
The prioritization criteria are the IT strategy and affordability of project and discussed by the Security Committee
10 903563 Electronic Information Technology (Program)
Priorities discussed and considering against opportunities for infrastructure needs and volume discounts for hardware
11 903576 Smart Card/Vend Card Technology (Project)
Prioritization criteria are staff capacity and use of technology and decided by Ottawa Public Library Board
12 904067 SAP Sustainment – 2006 (Program)
Prioritization criteria are production performance/reliability, production capacity, and enhancement value management process
The audit revealed that while there is a process in place for Portfolio Value Management to formally prioritize IT initiatives using the value plot there are not consistent priority setting criteria being used to establish IT related priorities or priorities within a program with appropriate records of the decision regarding the priority.
Recommendation 8 That management develop and document formal priority setting criteria, aligned with the value plot tool, that can be used by both business and ITS to prioritize projects and activities/projects within a program.
Management Response Management agrees with this recommendation.
As noted in the report, the prioritization process that was implemented in 2004 "is based on the Control Objectives for Information and Technology (COBIT) framework, and has appropriate steps and control points against the audit criteria". Modifications to the priority setting criteria and tools were streamlined and
2008 Page

Audit of IT Capital Expenditures and Project Approval Process
28
approved by EMC on November 22, 2007. The new processes are currently being implemented to prioritize all IT projects, including those eligible for funding through the IT Investment Fund. Although the value plot tool has been superceded by the new process, additional tools will be available for business and ITS, and plans are underway to make them available on-line (Ozone) by the end of Q4 2008.
4.2.2.4 Lack of distinction between project and program or activity and project A project has a beginning and end for delivering a unique product/service and it is not repeated while a program has multiple projects and can be carried out in a coordinated manner to achieve a common product/service with a broader scope and more flexibility. Our interviews of the 12 selected projects/programs showed that in some instances programs, projects and activities were not clearly differentiated. There were at least three programs/projects where the definitions did not accurately align with the classification of program or project.
Without a clear distinction of project and program, project and activity, the management of these programs/projects may possibly be affected. Inappropriate categorization of projects/programs may affect the prioritization process and the allocation of IT resources. As a result, there could be an impact on managing the overall IT investment from the perspective of achieving a balance across the entire portfolio between programs and projects and sustainment and transformational initiatives.
The current process does not differentiate between discretionary projects. Under the current process, any discretionary client-IT initiative over 10 days goes to VAP, regardless of its size, all are subject to the same steps, regardless of whether it is a small or large project. By contrast, all non-discretionary initiatives are not supported by a business case and treated equally. At the time of the audit, some changes had been identified and proposed to the process which would address this issue.
Recommendation 9 That management include a mechanism in the process which distinguishes those projects that are sustaining or operational in nature from those that are transformational.
Management Response Management agrees with this recommendation.
Under the amended process approved by EMC on November 22, 2007, the definition of projects has been modified to distinguish sustaining/operational projects from those that are transformational. The new definitions were fully implemented as of June 30, 2008.
4.2.2.5 The ownership of a project is not always clear Our interviews indicated that from a financial perspective, ITS and client understanding of ownership of issues were not consistent. For example, the Credit Card Processing
2008 Page

Audit of IT Capital Expenditures and Project Approval Process
29
(PCI) process (901049 Business Application Requirements) noted the requirement for newer/updated firewall protection for processing. Unfortunately, there was no clear ownership for whether the issue of upgrading the firewalls was clearly the responsibility of the business or IT. A number of other interviews conducted during the audit also indicated that there was a lack of clarity of ownership. By nature, such projects are business problems requiring an IT solution. Since risks are involved in solving the business problem, IT and the client need to share the risk and accountability.
This may present a risk to the City in the form of delays while ownership and funding is negotiated, potentially creating the situation of further delays when the necessary project is not defined in time for the budget approval cycle. This is particularly an issue in those cases where the initial technology investment is significant. In these instances the initial financial cost is borne primarily by the business to implement the technology. However, once in place, the technology becomes part of the infrastructure and can be leveraged by other business IT initiatives at only an incremental cost. As a result, this has the potential to create situations where client groups may defer valuable initiatives because the business case is not justified based on the initial technology investment.
Recommendation 10 That management ensure the project owner is clarified for all IT projects.
Management Response Management agrees with this recommendation.
The new prioritization process approved by EMC on November 22, 2007 clarifies the definition of IT operational or sustaining activities for which ITS is the owner. Similarly, the business sponsor of any IT project must be clearly identified in the business case as a condition of VAP review. Once approved, the project cannot proceed until a project sponsor has signed off on a project charter.
4.2.2.6 ITS capacity does not match the demand In a number of audits from previous years, management has expressed concern over a perceived lack of attention from ITS on required IT initiatives. However, this audit has shown that a process is in place for operating areas to present a business case for their requirements and in fact to obtain funding for these initiatives independently from ITS. Recommendation 11 is intended to address this perception.
Our interviews indicated that ITS capacity is an important factor in the process of prioritizing IT capital expenditures. Funding for various IT initiatives is secured via various sources through the Council budget approval process, not necessarily considering the ITS capacity to deliver. There is no overall picture of the demand for ITS capacity that is shared City-wide to assist in managing the business expectations of ITS ability to deliver in the desired timeframe. There are multiple examples of business
2008 Page

Audit of IT Capital Expenditures and Project Approval Process
30
expectations not aligned with ITS capacity to respond to the various City-wide requirements for ITS services.
The ITS capacity plays an important role in the process of prioritizing IT capital expenditures. The limited ITS capacity makes the prioritizing process more significant.
Recommendation 11 That management communicate to all client groups the overall requests and ITS capacity to address the requests.
Management Response Management agrees with this recommendation.
As noted in Recommendation 5, the impact of resource requests on ITS capacity will be reviewed with the Value Assessment Panel and results will be communicated to all client groups commencing in 2008. Additional tools will be researched and implemented as appropriate to facilitate the communication of overall IT investment capacity and performance results on an ongoing basis.
Recommendation 12 That management share the value score and relative priority for all IT initiatives to manage expectations regarding the ITS capacity and ability to meet the required timeframes.
Management Response Management agrees with this recommendation.
See Recommendation 5 and 11.
4.2.2.7 Multiple steps for approval Review of documents and results of interviews both indicated that sufficient controls are in place over IT capital expenditures. ITS, business, and the Financial Services Unit work together to control the City’s IT capital expenditures. Although the process of approvals was effective, sometimes the follow-on processes are not necessarily efficient. Some staff interviewed felt that the overall CVC process could be subject to delays while one example provided indicated the subsequent procurement process can be too long resulting in losing contract resources and delaying the timeframe to delivery. In addition, the timing of budgeting process may not necessarily be consistently aligned with IT operational planning. Also, as described earlier in this report, the role of the Executive Management Committee as the final project approval authority should be clarified.
ITS is facing increasing pressure to demonstrate to clients and/or the public the value of IT work. The new accountability and performance management culture also requires IT to account for money spent. Business cases have been tailored to provide qualitative and quantitative analysis of costs/benefits and risks. However, there is increasing
2008 Page

Audit of IT Capital Expenditures and Project Approval Process
31
reliance on ITS to assist and to enable the business to achieve operational objectives. The current process of clients receiving budget approval prior to the going to ITS for workload prioritization sets expectations regarding the overall City-wide priority of the proposed initiative and the capacity for ITS to deliver in the desired timeframe. Given the limited IT resources and increasing number of client programs/projects, the ITS needs to ensure that the limited resources are first directed to initiatives that have risk-adjusted, highest value.
This issue, along with the earlier observation of the need for improved monitoring of IT capital expenditures on an annual basis, suggests the need to centralize IT capital funding within a single funding envelope. This would allow the annual IT capital budget to come forward for approval in a coordinated fashion and allow senior management and Council to have a consolidated picture of IT capital funding and priorities each year.
Recommendation 13 That management require all projects to go through the priority setting process prior to seeking funding approval via the Council budget approval process.
Management Response Management agrees with this recommendation.
The new processes and governance model approved by EMC on November 22, 2007 requires that all IT projects go through the priority-setting process prior to seeking funding approval via the Council budget approval process. The process allows for exceptions that would be addressed on a case-by-case basis (e.g., where the IT component of a capital request is secondary to the project, such as technology for a new Library which has already been approved by Council). EMC directed ITS to work with Corporate Planning and Financial Services to integrate the IT priority-setting process with the corporate planning cycle and budget process. This work is underway and will be evaluated in conjunction with the 2009 budget process.
Recommendation 14 That management centralize the Corporate IT Capital budget within a single funding envelope and ensure that annual IT Capital budgets are presented for approval on a consolidated basis.
Management Response Management disagrees with this recommendation.
For the past two budgets (2007 and 2008), the capital budget has been presented and status reports were prepared by service area. From an IT perspective, this means that if an IT-related project relates to a specific service area such as Long Term Care, that project will be presented in the Long Term Care service area. This was recommended and approved by Council in 2004 in the "It's About Accountability"
2008 Page

Audit of IT Capital Expenditures and Project Approval Process
32
document prepared by Plamondon and Associates. Corporate IT budgets that do not relate to a specific service area are presented together.
More recently, the Mayor's Task Force on e-Government conducted an external best-practice assessment of the IT budget, and specifically noted that combining IT capital funds into one budget confuses accountability. The City's SAP system can easily produce a consolidated report of IT spending from numerous cost centres and internal orders.
Since IT exists to make other branches more effective and efficient, it is important for Council to ensure that departments exploiting the technology are accountable for the benefits. To that end, the LRFP Sub-Committee recently recommended to Council that "staff be directed to incorporate anticipated efficiency savings from investments in technology in the efficiency column of the budget pages for affected branches for future budgets". ITS will support Financial Services to implement this recommendation for the next budget cycle.
2008 Page

Audit of IT Capital Expenditures and Project Approval Process
33
5 Mayor’s Task Force on eGovernment In 2008, the Mayor asked a group of experienced high-tech executives to review the City of Ottawa’s use of technology and make recommendations that would improve interaction with the public while increasing the effectiveness and efficiency of City operations. Throughout the first four months of the year, this group interviewed Information Technology Services (IT) staff and management at the City and also reviewed existing plans and past performances. Their recommendations were released in June and their action plan approved by Council in August 2008.
The Task Force identified that Ottawa lagged behind other public and private organizations in gaining the benefits of information and communications technology. The root of the problem lay in the way that the City approached technology. Instead of making investments, which would pay off over time, Council sought to minimize expenses within a single year, thus ensuring that no major transformation of service could occur. Efforts were focused on internal processes when they should have been focused on the citizens using the service. Thus the City was not delivering the improvements and cost-reductions achieved by banks and other levels of government.
The Task Force identified that the use of technology should, over time, reduce costs and improve service, offsetting natural growth factors which were driving up expenses and tax rates. To do so, the City would need to put in a proper governance model, which focused on investment with clearly defined returns over a period of 3 three to 5five years. Projects would have to put the citizens at the centre of their business model and work to eliminate manual efforts, which drove up costs and drove down public satisfaction. The responsibility for effective use of technology lies not with IT Services but with every department in the City of Ottawa.
Eight specific recommendations were made to allow the City and its taxpayers to get the most from technology.
1. Institute a governance model that involves everyone from City Council to staff.
2. Require a citizen-centric focus for all City programs and services.
3. Implement outcome-based measures for all activities, services and projects.
4. Produce investment plans for each branch identifying how technology will be leveraged to improve service while reducing costs.
5. Ensure that when council directs staff to take action, the resulting proposal includes a technology alternative that directly or indirectly offsets any increase in staff.
6. Compare Ottawa’s service delivery, on an outcome and cost basis, with service delivery in the best public and private organizations in the world, and not just with service delivery in other Canadian municipalities.
2008 Page

Audit of IT Capital Expenditures and Project Approval Process
34
7. Ensure that all investment plans respect and leverage the City’s common technology infrastructure, architecture, processes and applications.
8. Invest in a Chief Strategist for service delivery, reporting directly to City Council, who will drive the implementation of these recommendations.
Management indicated that its goal is to have the recommendations progressed to the point where they will make fundamental changes to the budget process for the coming year.
6 Conclusion The analysis of IT capital expenditures for 2001-2006 conducted during the audit provides, we believe, the first comprehensive view of the City of Ottawa’s IT capital spending patterns. There are significant variances, both surplus and deficit, each year for both ITS-owned and client-owned capital budgets indicating a need for regular reporting on total IT capital spending as well as greater monitoring of these expenditures in the future.
Until 2004, prioritization was primarily based upon decisions by the Transition Board. Since that time, ITS has developed and implemented policies and procedures for prioritizing IT capital expenditures. The overall process is in line with the COBIT standards used to assess it during the audit. There are, however, opportunities for improvement which have been discussed in this report.
Key issues identified in the audit include:
• Priority-setting criteria should be more formally developed and documented;
• Guidelines should be established in order to clarify the governance model to be used;
• All projects should be reviewed by the Value Assessment Panel to ensure transparency for all participants;
• Escalation/resolution process should be clearly documented and the role of Executive Management Committee should be clarified as the final approval authority;
• All projects should be required to go through the priority setting process prior to seeking funding approval via the Council budget approval process; and,
• IT capital funding should be centralized within a single funding envelope to improve oversight and ongoing monitoring of these expenditures.
7 Acknowledgment We wish to express our appreciation for the cooperation and assistance afforded the audit team by management.
2008 Page