audit committees and earnings quality
TRANSCRIPT

Accounting and Finance 49 (2009) 267–290
©
The AuthorsJournal compilation
©
2009 AFAANZ
Blackwell Publishing LtdOxford, UKACFIAccounting and Finance0810-53911467-629X© The AuthorsJournal compilation © 2008 AFAANZXXX
ORIGINAL ARTICLE
P. Baxter, J. Cotter/Accounting and FinanceP. Baxter, J. Cotter/Accounting and Finance
Audit committees and earnings quality
Peter Baxter
a
, Julie Cotter
b
a
School of commerce, Faculty of Business, University of the Sunshine Coast, Slippy Downs, 4556, Australia
b
School of Accounting, Economics and Finance, Faculty of Business, University of Southern Queensland, Toowoomba, 4350, Australia
Abstract
This research investigates whether audit committees are associated with improvedearnings quality for a sample of Australian listed companies prior to the introduc-tion of mandatory audit committee requirements in 2003. Two measures of earningsquality are used based on models first developed by Jones (1991) and Dechowand Dichev (2002). Our results indicate that formation of an audit committeereduces intentional earnings management but not accrual estimation errors. We alsofind differences in the associations between audit committee accounting expertiseand the two earnings quality measures. Other audit committee characteristicsexamined are not significantly related to either earnings quality measure.
Key words
: Audit committees; Corporate governance; Earnings management; Earnings quality
JEL classification
: G30, G38, M41
doi
: 10.1111/j.1467-629X.2008.00290.x
This paper is from Peter’s PhD thesis completed at the University of Southern Queensland(USQ). We are grateful for the input of his Associate Supervisor, Gary Monroe from theAustralian National University (ANU). We also thank the two anonymous reviewersfor their very helpful comments and suggestions. This paper has also benefited from thecomments of seminar participants at Griffith University, ANU, USQ, Central QueenslandUniversity (CQU), the 2005 University of Technology Sydney Accounting ResearchSummer School, and the 2005 Accounting and Finance Association of Australia and NewZealand (AFAANZ) Conference. Funding support was provided by USQ, CQU, and a PhDscholarship jointly sponsored by AFAANZ, CPA Australia and the Institute of CharteredAccountants in Australia. The Global Industry Classification Standard (GICS) industryclassification data were kindly provided by Standard & Poor’s (S&P). The GICS wasdeveloped by and is the exclusive property and a trademark of S&P, a division of theMcGraw-Hill Companies Inc. and Morgan Stanley Capital International Inc.
Received 29 November 2007; accepted 17 September 2008 by Robert Faff (Editor)
.
268 P. Baxter, J. Cotter/Accounting and Finance 49 (2009) 267–290
©
The AuthorsJournal compilation
©
2009 AFAANZ
1. Introduction
The purpose of this paper is to investigate the association between auditcommittees and earnings quality in Australia. We examine two key aspects ofthis relation: audit committee formation and audit committee characteristics.We use measures of earnings quality based on models first developed by Jones(1991) and Dechow and Dichev (2002). Measures based on the Jones ‘earningsmanagement’ model are generally characterized as capturing managements’ intentto manipulate earnings, whereas measures based on Dechow and Dichev’s‘accrual estimation error’ model include accrual estimation errors arising frommanagement lapses or environmental uncertainties.
Improved quality of financial reporting practices, and more specifically earnings,has been widely cited as one of the major benefits of companies establishing auditcommittees (Blue Ribbon Committee, 1999; Australian Accounting ResearchFoundation
et al.
, 2001; Ramsay, 2001). However, the approach adopted by theAustralian Stock Exchange (ASX)
1
from the early 1990s to 2003 was one ofdisclosure only, requiring listed companies to provide statements about theirmain corporate governance practices, including whether they had an auditcommittee and if appropriate, why they did not comply with best practiceguidelines. Audit committees only became mandatory in 2003 for those listedcompanies on the Standard and Poor’s (S&P) All Ordinaries Index followingthe recommendations of the ASX Corporate Governance Council (ASX CorporateGovernance Council, 2003).
2,3
Given the previous relative lack of audit committeeregulation in Australia as compared to the USA and other overseas jurisdictions,pre-2003 Australia represents a rich empirical setting for the analysis of theassociation between audit committees and earnings quality.
4
1
Following the merger of the Australian Stock Exchange with the Sydney FuturesExchange in 2006, the ASX became the Australian Securities Exchange.
2
A second edition of these recommendations was issued in 2007, but the 2003 editionapplies to this study.
3
In addition, entities in the top 300 of the Index are now required to comply with theASX Corporate Governance Council’s best practice recommendations relating to thecomposition, operation and responsibility of the audit committee (Australian StockExchange, 2006).
4
Audit committees have been mandatory on the major US stock exchanges since as earlyas 1978 (Vanasco, 1994). More recently, there has been an increasing trend around theworld towards requiring listed companies to not only establish audit committees, but alsoto ensure that they meet pre-specified requirements including composition and reportingobligations. For example, in the US following recommendations of the Blue Ribbon Com-mittee (1999), the New York Stock Exchange and the National Association of SecuritiesDealers changed their listing rules to require listed companies to maintain audit committeeswith at least three directors, all of whom are independent of management (Klein, 2003).

P. Baxter, J. Cotter/Accounting and Finance 49 (2009) 267–290 269
©
The AuthorsJournal compilation
©
2009 AFAANZ
Davidson
et
al
. (2005) and Koh
et
al
. (2007) are the only known publishedstudies to use this voluntary institutional setting to explore the relationshipbetween audit committees and earnings quality. We extend their research in severalways. First, we capture earnings quality using measures of accrual estimationerrors as well as abnormal accruals. The accrual estimation errors measure is amore comprehensive measure of earnings quality. We are not aware of any priorpublished research into the relationship between audit committees and earningsquality that uses measures based on Dechow and Dichev’s (2002) accrual estima-tion errors model. A comparison of our results between these two earningsquality measures allows us to investigate the potential impact of audit committeeson different aspects of earnings quality.
5
Second, we examine whether earningsquality increases following the voluntary formation of an audit committee.Although several studies including Davidson
et
al
. (2005) have examined whetherthe existence of an audit committee is associated with earnings quality, tests ofthis association do not differentiate between whether (i) the audit committeeimpacts earnings quality or (ii) firms with high-quality earnings are more likelyto form an audit committee. Overseas research (Wild, 1994; Jeon
et
al
., 2004) hasfound mixed evidence about the impact of audit committee formation on earningsquality. Third, in addition to the audit committee characteristics examined byDavidson
et
al
. (2005) and Koh
et
al
. (2007), we investigate the impact of auditcommittee expertise on earnings quality. Recent unpublished work in the USAby Dhaliwal
et
al
. (2006) reports an association between audit committeeaccounting expertise and accruals quality. Finally, we use a more refined measureof audit committee independence than that used in prior Australian studies thatinvestigate the association between audit committee characteristics and earningsquality (Davidson
et
al
., 2005; Koh
et
al
., 2007).Our results suggest that earnings quality increases in the year following
voluntary audit committee formation. However, this is only the case when earningsquality is captured using measures based on Jones’s (1991) earning managementmodel rather than Dechow and Dichev’s (2002) accrual estimation error model.This result appears to indicate that audit committees are effective in reducingintentional accrual manipulations, which are better captured by the Jonesmodel. We also find differences in the associations between audit committeeaccounting expertise and the two earnings quality measures. When we captureearnings quality using accrual estimation errors, we find higher earnings quality(lower accrual estimation errors) for companies with a greater proportion ofqualified accountants on their audit committee. However, we do not find asimilar reduction in earnings management. Indeed, we find some evidence that
5
Unpublished research by Dhaliwal
et
al
. (2006) and Kent
et
al
. (2008) use measuresbased on the Dechow and Dichev (2002) model to capture accruals quality. However,neither of these studies makes comparisons between measures of accruals quality and earningsmanagement.

270 P. Baxter, J. Cotter/Accounting and Finance 49 (2009) 267–290
©
The AuthorsJournal compilation
©
2009 AFAANZ
suggests higher abnormal accruals for firms with a greater proportion of account-ing expertise on their audit committee. Results pertaining to our other auditcommittee characteristics are similar to those found by Davidson
et
al
. (2005)with the exception of audit committee independence. Using our more refinedmeasure of independence, we find that this audit committee characteristic does notimpact earnings quality.
The remainder of this paper is organized as follows: Section 2 outlines theprior literature and hypotheses tested in this paper. Section 3 delineates ourearnings quality measures, and Section 4 describes the empirical analysis.Section 5 concludes the paper.
2. Prior literature and hypotheses
2.1. Audit committee formation
Several prior studies provide empirical support for a cross-sectional associationbetween audit committees and financial reporting quality (e.g. Dechow
et
al
.,1996; McMullen, 1996; Beasley
et
al
., 2000). However, the research designsused in these prior studies are unable to establish whether the existence of anaudit committee per se impacts earnings quality. For a more direct test of theimpact of audit committees on earnings quality, it is necessary to considerchanges in earnings quality subsequent to the formation of an audit committee.
The only known published study that directly examines the association betweenthe formation of audit committees, earnings management and, inversely, earningsquality is Jeon
et
al
. (2004). Contrary to expectations, their findings indicatethat earnings management did not significantly decrease in the period after auditcommittee formation. These results conflict with those of Wild (1994), who finds asignificant increase in the market’s reaction to earnings reports released afteraudit committee formation.
We propose an association between the formation of an audit committee andan increase in earnings quality. Tests will allow a direct assessment of whetherthe voluntary formation of an audit committee is followed by an increase inearnings quality for our sample of Australian companies.
H
1
: The formation of an audit committee is associated with an increase inearnings quality.
2.2. Audit committee characteristics
2.2.1. Independence
The independence of an audit committee is often considered an essentialcharacteristic influencing the committee’s effectiveness in overseeing the finan-cial reporting process. It can be argued that independent directors are in the

P. Baxter, J. Cotter/Accounting and Finance 49 (2009) 267–290 271
©
The AuthorsJournal compilation
©
2009 AFAANZ
best position to serve as active overseers of the financial reporting process,thereby having a greater ability to withstand pressure from management tomanipulate earnings (Klein, 2002).
Audit committee independence has been found to be significantly associatedwith measures of earnings quality in several prior studies (e.g. Klein, 2002;Bedard
et
al
., 2004; Choi
et
al
., 2004; Van der Zahn and Tower, 2004; Davidson
et
al
., 2005; Vafeas, 2005). However, within these studies, there are someinconsistencies in the results. For example, Klein (2002) finds no evidence of asignificant association between an audit committee comprised solely of inde-pendent directors and her measure of earnings management. In contrast, Bedard
et
al
. (2004) find that the same measure of audit committee independence isnegatively associated with the likelihood of aggressive earnings management.
2.2.2. Expertise
In addition to independence, the expertise of the audit committee is generallyconsidered an important characteristic for its effective operation. It has beenargued that effective oversight by an audit committee requires that its memberspossess sufficient expertise in accounting and auditing to independently assessthe matters that are presented to them (Beasley and Salterio, 2001; Davidson
et
al
., 2004; DeFond
et
al
., 2005).Several prior studies have found a significant association between the expertise
of the audit committee and earnings quality (e.g. Xie
et
al
., 2003; Bedard
et
al
.,2004; Choi
et
al
., 2004; Dhaliwal
et
al
., 2006). However, some inconsistenciesexist between the results of these studies and others such as Van der Zahnand Tower (2004) who failed to find an association between the magnitude ofearnings management and the audit committee’s financial expertise among theindependent directors.
2.2.3. Activity and size
The level of activity of an audit committee has been recommended as importantto enhance its effectiveness in improving earnings quality. Menon and Williams(1994) suggest that the mere formation of an audit committee does not meanthat the committee is actually relied on by the board of directors to enhance itsmonitoring ability. Choi
et
al
. argue that an ‘actively functioning audit committee ismore likely to detect earnings management than a dormant committee’ (2004,p. 41). In addition, the size of an audit committee can have a positive impact onearnings quality. Larger audit committees can be more effective as they are likelyto include members with varied expertise to perform more intense monitoringof financial reporting practices (Choi
et al., 2004).Inconsistent results in the prior studies also exist for the association between
audit committee activity and earnings management or earnings quality. AlthoughXie et al. (2003), Van der Zahn and Tower (2004) and Vafeas (2005) find evidence

272 P. Baxter, J. Cotter/Accounting and Finance 49 (2009) 267–290
© The AuthorsJournal compilation © 2009 AFAANZ
of a significant association between these variables, Choi et al. (2004), Bedardet al. (2004) and Davidson et al. (2005) find that audit committee activity isnot significantly related to earnings management. Similar inconsistent resultsalso exist in relation to the size of the audit committee. We use the followinghypothesis:
H2: The independence, expertise, activity and size of an audit committee arepositively associated with earnings quality.
3. Earnings quality measures
3.1. Earnings quality versus earnings management
The present paper uses two measures of earnings quality. The first measureuses a modified version of the Jones (1991) model of discretionary accruals. Thismeasure has been widely used in the literature to capture earnings management,which can be viewed as an inverse measure of earnings quality. Schipper definesearnings management as ‘a purposeful intervention in the external financialreporting process, with the intent of obtaining some private gain’ (1989, p. 92).Under this perspective, opportunistic earnings management negatively impactson the quality of earnings (i.e. the greater the earnings management, the lowerthe earnings quality).6
Our second measure of earnings quality uses a modified version of the Dechowand Dichev (2002) accrual estimation errors model. This model is based on theargument that estimation errors in accruals and subsequent corrections of theseerrors decrease the quality of accruals and earnings. However, unlike the Jones(1991) type models of discretionary accruals, no attempt is made to separate theintentional from the unintentional accrual estimation errors (Dechow and Dichev,2002). This is because both types of errors imply low-quality earnings.
3.2. Measures of earnings quality
We capture earnings quality using absolute value measures from the two modelsdescribed below. The sign of these measures is deemed not to be relevant, as alldeviations from underlying earnings reduce earnings quality, regardless of theirdirection. They are inverse measures of earnings quality. We use cross-sectionalrather than time-series specifications for each of our measures since we requiremeasures of earnings quality for specific firm-years. Information on the GlobalIndustry Classification Standard (GICS) is used to form the industry-matchedsamples required to calculate our earnings quality variables. To ensure sufficient
6 An alternative view is that earnings are managed to allow managers to reveal more privateinformation to users about the financial reports (Schipper, 1989; Healy and Wahlen, 1999).

P. Baxter, J. Cotter/Accounting and Finance 49 (2009) 267–290 273
© The AuthorsJournal compilation © 2009 AFAANZ
degrees of freedom and enhance the validity of these measures, we limit oursample to companies in those industry groups that had 20 or more companies listedon the ASX. For companies in large industry groups, our industry-matched samplescomprise 30 companies.
Our first measure of earnings quality (EQJones) is based on the modifiedversion of the Jones (1991) discretionary accruals model proposed by Dechowet al. (1995).7 We use cross-sectional samples of companies in the same industrygroups as the sample companies. The absolute value of discretionary accruals isused as our first measure of earnings quality (EQJones).
It has been argued that there is the potential for discretionary accruals modelsto misclassify expected accruals as unexpected because of the incompletenessof the expected accruals model (Bernard and Skinner, 1996; Larcker andRichardson, 2004). Guay et al. (1996) suggest that their evidence was consistentwith the models estimating discretionary accruals with considerable imprecisionand/or misspecification. Hansen (1999) concludes that studies relying entirelyon the validity of discretionary accruals models were likely to under- or overstateproposed earnings management behaviour. Dechow et al. (1995) demonstratesthat discretionary accruals models typically generated tests of low power forearnings management of economically plausible magnitudes.
In an attempt to overcome criticisms of the modified Jones model, we use anadditional proxy for earnings quality. Our second measure of earnings quality(EQDD) uses the cross-sectional version of the Dechow and Dichev (2002)accrual estimation error model used by Francis et al. (2005).8 McNichols(2002) provides a critique of the Dechow and Dichev (DD) model.9 FollowingMcNichols’s (2002) critique and associated recommendations for improvement,Francis et al. (2005) add two variables from the Jones (1991) model (i.e. thechange in current sales and the level of property plant and equipment).
We calculate EQDD by estimating the modified following regression foreach sample company relative to its industry group of companies for each ofthe years of interest. All variables in equation (1) are divided by average totalassets:
ΔWCt = β0 + β1CFOt–1 + β2CFOt + β3CFOt+1 + β4ΔSalest + β5PPEt + εt, (1)
7 This version of the Jones (1991) model includes the change in receivables in the equationused to estimate the industry-specific coefficients. Because this model is well established inthe literature, we do not provide further details about how we calculate discretionary accrualshere.8 Our results are essentially unchanged when the original Dechow and Dichev (2002) modelis used.9 McNichols (2002) identifies several specific areas of weakness with the DD model.These include a failure to separately consider how total accruals might be affected by thebehaviour of discretionary accruals.
274 P. Baxter, J. Cotter/Accounting and Finance 49 (2009) 267–290
© The AuthorsJournal compilation © 2009 AFAANZ
where:ΔWCt = ΔWorking capital in year t, i.e. ΔAccounts receivable + ΔInventory –
ΔAccounts payable – ΔTaxes payable + ΔOther assets (net);CFOt–1 = Cash flows from operations in year t – 1;CFOt = Cash flows from operations in year t;CFOt+1 = Cash flows from operations year in year t + 1;ΔSalest = Sales in year t less sales in year t – 1;PPEt = Gross property, plant and equipment in year t.
This measure of earnings quality captures the extent to which accruals mapinto cash flow realizations in past, present and future cash flows. Francis et al.(2005) use the standard deviation of the residuals from this model as a measureof earnings quality. However, we are not able to use the standard deviation ofthe residuals from our cross-sectional industry model, as this would provide ameasure of earnings quality across all companies in the industry group ratherthan just the company of interest. Following Srinidhi and Gul (2007) who alsoneed to capture this measure on a firm-year basis, we use the absolute value ofthe residual as our measure of earnings quality. The higher the absolute residualfor each sample company, the lower is the quality of earnings.
4. Empirical analysis
4.1. Data and sample
The financial statement data items used to estimate our earnings qualitymeasures are extracted from the Aspect Financial Database (Securities IndustryResearch Centre of Asia–Pacific Ltd, 2004). To facilitate testing of Hypothesis 1,which proposes an association between audit committee formation and anincrease in earnings quality, these variables are estimated for the years beforeand after audit committee formation. That is, we use industry-matched samplesto estimate our earnings quality measures for both the pre- and post-formation years.In addition, they are re-estimated for each of our sample firms in 2001, as this is theyear used to test the associations between earnings quality and audit committeeindependence, expertise, activity, and size proposed in Hypothesis 2.10
Data required for these audit committee variables are hand-collected from the2001 annual reports. Audit committee independence and expertise for eachdirector is assessed from disclosures about directors’ backgrounds, qualificationsand experience. The definition of director independence as specified by the
10 This year is selected as the base year to avoid any effects of companies anticipating thenew ASX listing rule requiring audit committees to be formed by all companies in the S&PAll Ordinaries Index. This new rule came into effect from 1 January 2003.

P. Baxter, J. Cotter/Accounting and Finance 49 (2009) 267–290 275
© The AuthorsJournal compilation © 2009 AFAANZ
ASX Corporate Governance Council (2003) was used.11 Accounting and legalexpertise are defined in terms of professional qualifications.
The sample is drawn from the top 500 Australian companies listed on theASX with financial years ending during 2001. Sample selection procedures andfinal sample sizes for hypotheses tests are shown in Table 1. We exclude com-panies without an audit committee (37) and those companies for which it couldnot be determined whether an audit committee existed (4). Banks, trusts andforeign companies (37) are also excluded because financial reporting require-ments for these companies differ from those of other companies listed on theASX. Companies in the Diversified Financials and Real Estate industry groups(15) are excluded because they do not typically generate any sales revenue,which is needed to calculate our earnings quality variables. As we requiresufficiently large numbers of companies to form the industry-matched samplesneeded to calculate our measures of earning quality, we delete 74 companiesfrom several small GICS industry groups.12 Finally, we delete 24 companies
11 Essentially, independent directors are non-executive directors who do not have a businessor other relationship with the firm that could interfere with their ability to act independently.These assessments were made by one author based on annual report information andvalidated by the other.12 These industry groups were Automobiles and Components; Consumer Durables andApparel; Food and Staples Retailing; Household and Personal Products; Transportation;Insurance; Semiconductors and Semiconductor Equipment; and Utilities.
Table 1Summary of sample sizes used for hypotheses tests
Top 500 ASX listed companies in 2001 500
LessCompanies without audit committees 37Audit committee existence could not be determined 4Banks, trusts and foreign companies 37Diversified financials and real estate 15Companies from small four digit GICS industry groups 74 167
333
Less (complete annual report data for 2001 not available) 24Sample for audit committee characteristics tests (Hypothesis 2) 309Less
Audit committee formed prior to 1993 80Listed with audit committee in place 133Complete annual report data for pre/post audit committee formation
years not available24 237
Sample for audit committee formation tests (Hypothesis 1) 72
ASX, Australian Stock Exchange; GICS, Global Industry Classification Standard.

276 P. Baxter, J. Cotter/Accounting and Finance 49 (2009) 267–290
© The AuthorsJournal compilation © 2009 AFAANZ
where complete annual report data for 2001 are not available. This leaves a finalsample size of 309 companies for tests of the association between audit committeecharacteristics and earnings quality (Hypothesis 2). Panel A of Table 2 showsthe industry breakdown of our sample.
Further deletions from our sample are needed for tests of the associationbetween the formation of an audit committee and earnings quality (Hypothesis 1).In particular, we exclude companies for which we are unable to reliably deter-mine the audit committee formation year from annual reports. These comprisecompanies whose audit committees were formed prior to 1993 requirements todisclose audit committees in annual reports (80), those that listed on the ASXwith an audit committee already in place (133), and those for which pre-/
Table 2Industry groups and years of audit committee formation
Panel A: Sample of 309 companies used for audit committee characteristics tests by industry group
Industry group Number Percentage
Capital goods 33 10.7Commercial services and supplies 21 6.8Energy 20 6.5Food, beverage and tobacco 29 9.4Healthcare equipment and services 18 5.8Hotels, restaurants and leisure 14 4.5Materials 71 23.0Media 20 6.5Pharmaceuticals and biotechnology 16 5.2Retailing 21 6.8Software and services 25 8.1Technology hardware and equipment 10 3.2Telecommunication services 11 3.5Total 309 100
Panel B: Number of audit committees formed each year by 72 Australian Stock Exchange listed companies that formed their audit committees following the 1993 requirements for audit committee disclosures
Year of audit committee formation Number of companies
1993 61994 141995 121996 151997 41998 91999 62000 6Total 72
P. Baxter, J. Cotter/Accounting and Finance 49 (2009) 267–290 277
© The AuthorsJournal compilation © 2009 AFAANZ
post-formation year annual report data are not available (24). This left a sampleof 72 companies for tests of Hypothesis 1. Panel B of Table 2 shows the numberof companies forming their audit committee by year. The higher numbers offormations during the 1994–1996 period suggest that the 1993 introduction ofdisclosure requirements provided an impetus for some companies to form anaudit committee.
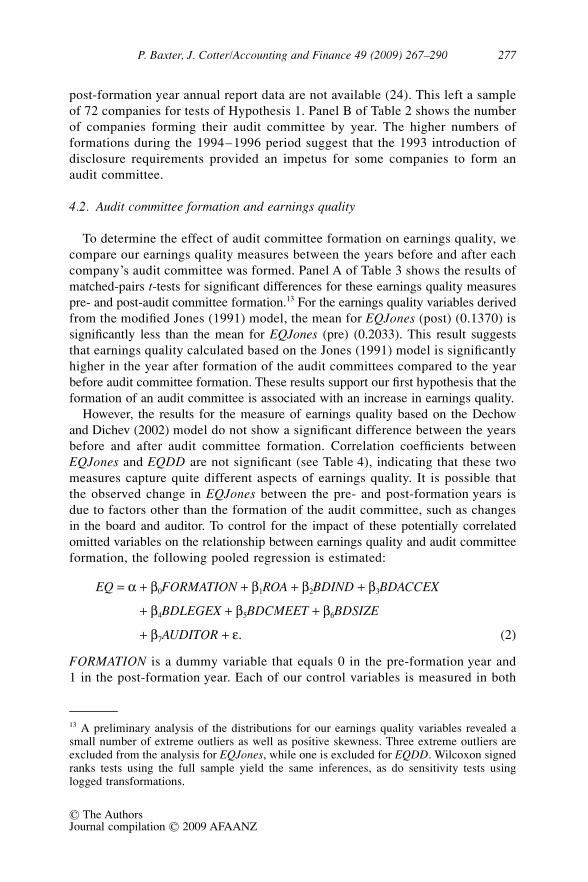
4.2. Audit committee formation and earnings quality
To determine the effect of audit committee formation on earnings quality, wecompare our earnings quality measures between the years before and after eachcompany’s audit committee was formed. Panel A of Table 3 shows the results ofmatched-pairs t-tests for significant differences for these earnings quality measurespre- and post-audit committee formation.13 For the earnings quality variables derivedfrom the modified Jones (1991) model, the mean for EQJones (post) (0.1370) issignificantly less than the mean for EQJones (pre) (0.2033). This result suggeststhat earnings quality calculated based on the Jones (1991) model is significantlyhigher in the year after formation of the audit committees compared to the yearbefore audit committee formation. These results support our first hypothesis that theformation of an audit committee is associated with an increase in earnings quality.
However, the results for the measure of earnings quality based on the Dechowand Dichev (2002) model do not show a significant difference between the yearsbefore and after audit committee formation. Correlation coefficients betweenEQJones and EQDD are not significant (see Table 4), indicating that these twomeasures capture quite different aspects of earnings quality. It is possible thatthe observed change in EQJones between the pre- and post-formation years isdue to factors other than the formation of the audit committee, such as changesin the board and auditor. To control for the impact of these potentially correlatedomitted variables on the relationship between earnings quality and audit committeeformation, the following pooled regression is estimated:
EQ = α + β0FORMATION + β1ROA + β2BDIND + β3BDACCEX
+ β4BDLEGEX + β5BDCMEET + β6BDSIZE
+ β7AUDITOR + ε. (2)
FORMATION is a dummy variable that equals 0 in the pre-formation year and1 in the post-formation year. Each of our control variables is measured in both
13 A preliminary analysis of the distributions for our earnings quality variables revealed asmall number of extreme outliers as well as positive skewness. Three extreme outliers areexcluded from the analysis for EQJones, while one is excluded for EQDD. Wilcoxon signedranks tests using the full sample yield the same inferences, as do sensitivity tests usinglogged transformations.

278 P. Baxter, J. Cotter/Accounting and Finance 49 (2009) 267–290
© The AuthorsJournal compilation © 2009 AFAANZ
Table 3Comparisons of earnings quality for the years pre- and post-audit committee formation for 72 Austral-ian Stock Exchange listed companies
Panel A: Matched-pairs t-tests
Variable N Minimum Maximum Median Mean SD t
EQJones (pre) 69 0.01 0.83 0.1209 0.2033 0.2046 3.058***EQJones (post) 69 0.00 0.83 0.0923 0.1370 0.1444EQDD (pre) 71 0.00 0.50 0.0561 0.0906 0.1047 –0.300EQDD (post) 71 0.00 0.72 0.0580 0.0961 0.1199
Panel B: Pooled regression results
Variable Predicted sign EQJones EQDD
Intercept 0.284 0.098(4.187)*** (2.220)**
FORMATION — –0.066 0.007(–2.254)** (0.350)
ROA — –0.160 –0.047(–2.512)*** (–1.121)
BDIND — 0.080 0.047(1.276) (1.123)
BDACCEX — –0.002 0.025(–0.018) (0.421)
BDLEGEX — 0.103 0.060(0.986) (0.881)
BDMEET — –0.006 –0.003(–2.230)** (–1.494)
BDSIZE — –0.003 –0.002(–0.390) (–0.358)
AUDITOR — –0.052 0.007(–1.647) (0.363)
Adjusted R2 0.098 –0.006F-statistic 2.867*** 0.901N 138 142
** and *** denote significance at the 0.05 and 0.01 levels, respectively (p-values are one-tailed).EQJones is cross-sectional earnings quality proxy from modified Jones (1991) model (i.e. absolutevalue of abnormal accruals); EQDD is Cross sectional earnings quality proxy from Dechow andDichev (2002) adjusted for Jones (1991) model variables (i.e. absolute value of regression residuals);FORMATION takes the value of 1 for year after audit committee formation; and 0 for year before auditcommittee formation; ROA is return on assets calculated as operating profit after tax scaled by averagetotal assets; BDIND is proportion of independent directors on the board; BDSIZE is number of boardmembers; BDACCEX is proportion of directors on the board with accounting qualifications;BDLEGEX is proportion of directors on the board with legal qualifications; BDMEET is number ofboard meetings per annum; AUDITOR takes the value of 1 if Big Five or Six auditor, and 0 if non-BigFive or Six auditor. SD, standard deviation.

P. Baxter, J. Cotter/Accounting and Finance 49 (2009) 267–290 279
© The AuthorsJournal compilation © 2009 AFAANZ
the pre- and post-formation years. Return on assets (ROA) is included to controlfor potential changes in firm performance. It is possible that the observed increasein earnings quality could be associated with a change in firm performance. Priorresearch has shown that the measurement of discretionary accruals can beproblematic for firms with extreme financial performance (Dechow et al., 1995;Kothari et al., 2005). It is also possible that changes to the board of directors orcompany auditor occurring at the same time that the audit committees were formedcould be associated with the increase in earnings quality. Hence, we include controlsfor board independence (BDIND), size (BDSIZE), accounting expertise (BDACCEX),legal expertise (BDLEGEX), meetings per year (BDMEET), and auditor quality(AUDITOR) for both the pre- and post-audit committee formation years.
Results of these pooled regressions are shown in Panel B of Table 3. Theresults indicate that audit committee formation remains significantly associatedwith EQJones when these other potential explanations are controlled. Thenegative coefficient on FORMATION indicates that when this variable equals 1(the post-audit committee formation year), EQJones is lower; thus indicating lessearnings management and hence higher earnings quality. ROA and BDMEET arealso significantly negatively associated with EQJones. None of these variablesare significantly correlated with EQDD.14
Our EQJones results support those of Wild (1994), who finds a significantincrease in the market reaction to earnings reports released after the formationof the audit committee. However, they are inconsistent with the results of Jeonet al. (2004), who find no significant decrease in earnings management forSouth Korean firms after they established audit committees. A potential reasonfor the inconsistency between our results and those of Jeon et al. is the differentlegal environments between South Korea and Australia. Their sample includeda majority that were required by South Korean government law to establish anaudit committee. The period of study for our paper was prior to the mandatoryrequirement for audit committee formation by large Australian listed companies,which came into effect on 1 January 2003. Companies that form audit committeesvoluntarily, not because of a government requirement, are likely to be more effectiveat constraining earnings management and, therefore, improving earnings quality.This is because they have other incentives to ensure their audit committees operateeffectively, which also drive the decision to voluntarily form an audit committee.
4.3. Audit committee characteristics and earnings quality
Table 4 provides the descriptive statistics for the variables used in the testsof association between audit committee characteristics and earnings quality
14 Extreme outliers are excluded for these tests. Results of sensitivity tests using loggedtransformations of our EQ variables yield the same inferences about the significance rela-tionship between audit committee formation and EQJones.

280 P. Baxter, J. Cotter/Accounting and Finance 49 (2009) 267–290
© The AuthorsJournal compilation © 2009 AFAANZ
Table 4Descriptive statistics for 309 Australian listed companies in 2001
Panel A: Continuous variables
Variable Minimum Maximum Median Mean SD Skewness
EQJones 0.00 2.66 0.09 0.18 0.25 4.32EQDD 0.00 1.29 0.05 0.10 0.15 4.83ACIND 0.00 1.00 0.50 0.53 0.34 –0.12ACACCEX 0.00 1.00 0.33 0.31 0.30 0.74ACLEGEX 0.00 1.00 0.00 0.13 0.20 1.49ACMEET 0.00 13.00 3.00 3.06 1.60 1.74ACSIZE 2.00 7.00 3.00 3.18 1.00 1.16BDIND 0.00 1.00 0.40 0.42 0.25 0.04BDACCEX 0.00 0.80 0.20 0.22 0.18 0.65BDLEGEX 0.00 0.50 0.09 0.11 0.12 0.99BDMEET 3.00 33.00 11.00 11.34 4.28 0.88BDSIZE 3.00 17.00 6.00 6.33 2.23 1.55TA ($A million) 3.94 84 961.00 138.28 1 276.30 6 020.56 10.60LNTA 15.19 25.17 18.74 19.01 1.77 0.55LEV 0.00 2.52 0.47 0.46 0.26 2.34OPCYCLE 1.00 1 050.00 48.00 65.68 96.94 6.32LNOC 0.00 6.96 3.87 3.72 1.02 –0.95
Panel B: Dichotomous variables
Variable Frequency of 1’s Frequency of 0’s
AUDITOR 247 (79.9%) 62 (20.1%)LOSS 108 (34.9%) 201 (65.1%)
EQJones is cross-sectional earnings quality proxy from modified Jones (1991) model (i.e. absolutevalue of abnormal accruals); EQDD is cross-sectional earnings quality proxy from Dechow and Dichev(2002) model adjusted for Jones (1991) model variables (i.e. absolute value of regression residuals);ACIND is proportion of independent directors on audit committee; ACACCEX is proportion of directorson audit committee with accounting qualifications; ACLEGEX is proportion of directors on auditcommittee with legal qualifications; ACMEET is number of audit committee meetings for the year;ACSIZE is number of audit committee members; BDIND is proportion of independent directors on theboard; BDACCEX is proportion of directors on the board with accounting qualifications; BDLEGEX isproportion of directors on the board with legal qualifications; BDMEET is number of board meetingsfor the year; BDSIZE is number of board members; TA is total assets; LNTA is natural log of totalassets; LEV is total liabilities divided by total assets; OPCYCLE is operating cycle measured as 360/(sales/average account receivables); LNOC is natural log of operating cycle, measured as 360/(sales/average account receivables); AUDITOR takes the value of 1 if Big Five or Six auditor, and 0 if non-Big Five or Six auditor; LOSS takes the value of 1 if net income for the year is less than 0, and 0otherwise. SD, standard deviation.

P. Baxter, J. Cotter/Accounting and Finance 49 (2009) 267–290 281
© The AuthorsJournal compilation © 2009 AFAANZ
(Hypothesis 2), as well as several control variables relevant to this association.The mean and median values for EQJones are similar to those reported byDavidson et al. (2005) for their absolute discretionary accruals measure that isbased on the same cross-sectional modified Jones model that we use. Weexclude several outliers for EQJones and EQDD from our primary analysis andalso report results of sensitivity analysis using logged transformations of ourearnings quality measures.
Overall, the descriptive statistics indicate that there is considerable variationin the audit committee variables for the sample companies. The mean proportionof independent directors on the audit committee is 0.53. Prior US studies suchas Yang and Krishnan (2005) provide evidence that audit committees in theUSA have much higher proportions of independent directors, which reflects thegreater degree of audit committee regulation. Our measures of ACMEET andACSIZE are slightly higher than those reported by Davidson et al. (2005). Thisis most likely due to the larger average size of the firms in our sample and theexclusion of firms without an audit committee from our sample. Descriptivestatistics for full board level variables that correspond to our audit committeevariables are also shown in Table 4. Davidson et al. (2005) and Koh et al. (2007)found board independence to impact earnings quality. It is likely that some ofthe other board level variables are also associated with earnings quality. Theremaining variables in Table 4 are controls for auditor quality, leverage, firmsize, losses and operating cycle.
Dechow and Dichev (2002) identify several innate factors that affect accrualsquality: firm size, the incidence of losses, operating cycle, and volatility ofoperating cash flows and sales. Our sample includes firms ranging in size fromtotal assets of $A3.94m to $A84.96bn, with a mean of $A1.28bn. The distribu-tion of total assets is highly positively skewed and we therefore take a logtransformation of this variable (LNTA). LOSS equals 1 if income for the year isless than 0, and 0 otherwise. One hundred and eight of the sample firms reporta loss in 2001. Length of operating cycle is measured as 360/(sales/averageaccount receivables). Operating cycles for our sample firms range between 0and 1050 days, with a mean of 65.68 days. This variable is highly positivelyskewed and we therefore use a log transformation for our hypothesis tests(LNOC). We do not include controls for volatility of operating cash flows orsales since we are unable to obtain a sufficient time-series of data to calculatethese measures for the majority of our sample firms.
Table 5 shows Pearson and Spearman correlation coefficients between theearnings quality, audit committee, full board and control variables. For EQJones,Pearson correlations show significant positive relationships with LOSS and LNOC,whereas Spearman correlations show significant relationships with ACACCEX(+), BDIND (–), BDACCEX (+), BDSIZE (–) and LOSS (+). The Spearmancorrelations between EQJones and both ACACCEX and BDACCEX are positiverather than negative as expected. This result appears to suggest that accountingexpertise could be related to an increase rather than a decrease in earnings

282P. B
axter, J. Cotter/A
ccounting and Finance 49 (2009) 267–290
© T
he Authors
Journal compilation ©
2009 AFA
AN
Z
Table 5Pearson and Spearman correlations for 309 Australian listed companies in 2001 (Pearson correlations are above diagonal; p-values are shown in parentheses)
EQJones EQDD ACInd ACAccEx ACLegEx ACMeet ACSize BDInd BDAccEx BDLegEx BDMeet BDSize LNTA Lev Auditor Loss LNOC
EQJones — 0.01(0.818)
–0.05(0.370)
0.06(0.319)
–0.05(0.343)
–0.07(0.195)
–0.01(0.226)
–0.08(0.148)
0.09(0.119)
–0.05(0.369)
0.04(0.537)
–0.10(0.079)
–0.09(0.114)
0.06(0.286)
0.10(0.071)
0.11**(0.047)
0.13**(0.035)
EQDD 0.07(0.127)
— 0.03(0.560)
–0.14**(0.015)
–0.04(0.468)
–0.03(0.567)
–0.11**(0.048)
0.05(0.347)
–0.11(0.053)
0.00(0.998)
0.01(0.802)
–0.15***(0.008)
–0.24***(0.000)
–0.03(0.632)
–0.05(0.394)
0.17***(0.003)
0.04(0.522)
ACInd –0.07(0.252)
–0.02(0.772)
— –0.10(0.09)
–0.07(0.235)
0.19***(0.001)
0.03(0.668)
0.77***(0.000)
–0.14**(0.018)
–0.18***(0.002)
0.07(0.252)
0.16***(0.006)
0.18***(0.002)
–0.01(0.899)
0.12**(0.039)
–0.09(0.108)
–0.05(0.423)
ACAccEx 0.13**(0.025)
–0.12**(0.043)
–0.13**(0.018)
— –0.20***(0.000)
–0.03(0.554)
–0.10(0.082)
–0.12**(0.042)
0.77***(0.000)
–0.13**(0.024)
0.05(0.356)
–0.03(0.619)
–0.00(0.983)
0.08(0.175)
–0.12**(0.029)
–0.02(0.782)
–0.06(0.290)
ACLegEx 0.01(0.858)
0.01(0.943)
–0.07(0.213)
–0.18***(0.002)
— 0.04(0.534)
–0.05(0.391)
–0.12**(0.040)
–0.17***(0.003)
–0.69***(0.000)
–0.05(0.396)
0.10(0.075)
0.16***(0.004)
–0.02(0.788)
0.04(0.499)
–0.01(0.867)
0.05(0.414)
ACMeet –0.07(0.242)
–0.04(0.503)
0.20***(0.000)
–0.01(0.824)
0.09(0.117)
— 0.21***(0.000)
–0.04(0.540)
–0.04(0.540)
0.04(0.477)
0.15***(0.008)
0.34***(0.000)
0.39***(0.000)
0.10(0.083)
0.15***(0.009)
–0.20***(0.001)
–0.04(0.284)
ACSize –0.08(0.170)
–0.12**(0.043)
0.03(0.547)
–0.07(0.250)
0.04(0.484)
0.16***(0.004)
— 0.03(0.633)
0.03(0.633)
–0.06(0.294)
0.09(0.110)
0.33***(0.000)
0.23***(0.000)
0.12**(0.042)
0.06(0.315)
–0.13**(0.028)
0.11(0.059)
BDInd –0.11**(0.045)
–0.02(0.690)
0.77***(0.000)
–0.14**(0.018)
–0.10(0.074)
0.22***(0.000)
0.12**(0.035)
— –0.16***(0.005)
–0.15***(0.009)
0.07(0.223)
0.18***(0.002)
0.26***(0.000)
0.01(0.928)
0.18***(0.001)
–0.10(0.096)
–0.01(0.888)
BDAccEx 0.13**(0.021)
–0.04(0.498)
–0.16***(0.006)
0.78***(0.000)
–0.13(0.020)
–0.01(0.900)
0.07(0.258)
–0.16***(0.006)
— –0.15***(0.008)
–0.12**(0.043)
–0.12**(0.043)
–0.04(0.519)
0.06(0.323)
–0.14**(0.015)
0.02(0.775)
–0.07(0.262)
BDLegEx 0.02(0.724)
–0.00(0.974)
–0.16***(0.005)
–0.12**(0.035)
0.70***(0.000)
0.09(0.115)
–0.01(0.860)
–0.13**(0.027)
–0.11**(0.045)
— –0.01(0.883)
–0.01(0.883)
0.09(0.106)
0.09(0.132)
–0.02(0.676)
0.04(0.528)
0.05(0.428)

P. Baxter, J. C
otter/Accounting and F
inance 49 (2009) 267–290283
© T
he Authors
Journal compilation ©
2009 AFA
AN
Z
BDMeet 0.01(0.905)
–0.01(0.917)
0.10(0.074)
0.07(0.252)
–0.03(0.617)
0.22***(0.000)
0.13**(0.018)
0.11(0.063)
0.11(0.051)
–0.05(0.405)
— 0.01(0.899)
0.09(0.132)
0.11**(0.046)
–0.01(0.819)
0.04(0.535)
–0.01(0.824)
BDSize –0.13**(0.027)
–0.19***(0.001)
0.15***(0.009)
–0.01(0.861)
0.14**(0.012)
0.28***(0.000)
0.36***(0.000)
0.17***(0.002)
–0.09(0.134)
0.05(0.364)
0.03(0.565)
— 0.26***(0.000)
0.12**(0.030)
0.21***(0.000)
–0.17***(0.003)
0.04(0.284)
LNTA –0.09(0.114)
–0.21***(0.000)
0.16***(0.005)
0.01(0.852)
0.18***(0.002)
0.43***(0.000)
0.25***(0.000)
0.25***(0.000)
–0.00(0.953)
0.12**(0.031)
0.12**(0.032)
0.52***(0.000)
— 0.40***(0.000)
0.34***(0.000)
–0.32***(0.000)
–0.04(0.480)
Lev 0.03(0.567)
–0.00(0.972)
–0.03(0.636)
0.07(0.209)
0.06(0.268)
0.11(0.054)
0.15***(0.008)
–0.00(0.950)
0.07(0.229)
0.09(0.123)
0.16***(0.005)
0.16**(0.005)
0.42***(0.000)
— 0.14**(0.016)
–0.18***(0.002)
–0.04(0.494)
Auditor 0.09(0.098)
–0.06(0.314)
0.11**(0.047)
–0.11(0.055)
0.06(0.287)
0.16***(0.006)
0.10(0.089)
0.17***(0.003)
–0.10(0.091)
0.01(0.898)
–0.01(0.907)
0.23***(0.000)
0.34***(0.000)
0.14**(0.018)
— –0.09(0.113)
–0.04(0.475)
Loss 0.18***(0.002)
0.19***(0.001)
–0.09(0.123)
–0.02(0.703)
0.01(0.901)
–0.22***(0.000)
–0.11**(0.046)
–0.09(0.117)
–0.01(0.901)
0.05(0.353)
–0.01(0.904)
–0.20***(0.000)
–0.34***(0.000)
–0.17***(0.002)
–0.09(0.113)
— 0.21***(0.000)
LNOC 0.08(0.173)
0.13**(0.025)
–0.04(0.501)
0.01(0.823)
0.01(0.850)
–0.10(0.109)
0.09(0.140)
–0.03(0.679)
0.06(0.314)
0.01(0.833)
–0.02(0.748)
–0.02(0.780)
–0.09(0.138)
–0.03(0.579)
–0.07(0.222)
0.19***(0.002)
—
** and *** denote significance at the 0.05 and 0.01 levels, respectively. EQJones is cross-sectional earnings quality proxy from modified Jones (1991) model (i.e.absolute value of abnormal accruals); EQDD is cross-sectional earnings quality proxy from Dechow and Dichev (2002) model adjusted for Jones (1991) model variables(i.e. absolute value of regression residuals); ACIND is proportion of independent directors on audit committee; ACACCEX is proportion of directors on audit committeewith accounting qualifications; ACLEGEX is proportion of directors on audit committee with legal qualifications; ACMEET is number of audit committee meetings forthe year; ACSIZE is number of audit committee members; BDIND is proportion of independent directors on the board; BDACCEX is proportion of directors on the boardwith accounting qualifications; BDLEGEX is proportion of directors on the board with legal qualifications; BDMEET is number of board meetings for the year; BDSIZEis number of board members; LNTA is natural log of total assets; LEV is total liabilities divided by total assets; AUDITOR takes the value of 1 if Big Five or Six auditor,and 0 if non-Big Five or Six auditor; LOSS takes the value of 1 if net income for the year is less than 0, and 0 otherwise; LNOC is natural log of operating cycle, measuredas 360/(sales/average account receivables).
EQJones EQDD ACInd ACAccEx ACLegEx ACMeet ACSize BDInd BDAccEx BDLegEx BDMeet BDSize LNTA Lev Auditor Loss LNOC

284 P. Baxter, J. Cotter/Accounting and Finance 49 (2009) 267–290
© The AuthorsJournal compilation © 2009 AFAANZ
management. When we use a log transformation of EQJones, Pearson correlationswith ACACCEX, BDACCEX, LOSS and LNOC are all positive and significant,whereas BDSIZE is significantly negatively associated with EQJones. Overall, theseresults do not support the relations between EQJones and the audit committeecharacteristics predicted in Hypothesis 2.
When we consider EQDD, Pearson correlations show significant negativerelationships between this measure of earnings quality and ACACCEX, ACSIZE,BDSIZE, LNTA, and a significant positive relation with LOSS. Spearman cor-relations support these results and also show a significant positive relation betweenEQDD and LNOC. When we use a log transformation of EQDD, the same vari-ables remain significant. These results indicate initial support for the predictedHypothesis 2 relations between earnings quality and audit committee size andaccounting expertise.
Not surprisingly, most of our audit committee and full board level variablesare very highly correlated; with the correlation coefficients for the independenceand expertise measures ranging between 0.69 and 0.78. Furthermore, auditcommittee size is significantly positively correlated with full board size and firmsize. Interestingly, the two measures of audit committee expertise (ACACCEXand ACLEGEX) are significantly negatively correlated with each other. Thissuggests that the two forms of expertise are substitutes for each other.
We use the following regression model to test our second hypothesis thatearnings quality is positively associated with audit committee independence,expertise, activity and size. EQ denotes the two earnings quality measuresdescribed above (EQJones and EQDD). This model is estimated on our sampleof listed Australian companies in 2001:
EQ = α + β1ACIND + β2ACACCEX + β3ACLEGEX + β4ACMEET
+ β5ACSIZE + β6AUDITOR + β7LNTA + β8LEV
+ β9LOSS + β10LNOC + ε. (3)
In addition, we run the above model substituting a series of industry dummyvariables for LNOC. This allows us to use a larger sample, as we were able tocollect data about industry membership for all of our sample firms, while wewere only able to obtain operating cycle data for 284 of our sample firms. Wererun this model controlling for full board independence, expertise, activity andsize. Several of these variables are significantly positively correlated with theircorresponding audit committee measures and that is why we exclude them fromequation (3). However, some of these board variables are significantly associatedwith our EQ measures and, therefore, we attempt to control for their impact byincluding them in a sensitivity test of this model.
Table 6 shows the results from ordinary least-squares regressions of equation(3). None of our audit committee variables are significantly associated withEQJones. Similarly, Davidson et al. (2005) report insignificant coefficients for

P. Baxter, J. Cotter/Accounting and Finance 49 (2009) 267–290 285
© The AuthorsJournal compilation © 2009 AFAANZ
Table 6Regression estimates of earnings quality variables on audit committee and control variables for 309 Australian Stock Exchange listed companies in 2001
VariablePredictedsign EQJones EQDD
Intercept ? 0.295 0.403 0.286 0.305(1.902) (3.304)*** (4.391)*** (3.925)***
ACIND — 0.006 –0.034 0.003 0.014(0.146) (–1.207) (0.169) (0.795)
ACACCEX — 0.045 0.031 –0.038 –0.040(1.049) (0.965) (–2.101)** (–1.916)**
ACLEGEX — –0.016 –0.001 –0.015 –0.012(–0.257) (–0.022) (–0.554) (–0.406)
ACMEET — –0.002 –0.002 0.006 0.003(–0.283) (–0.293) (1.609) (0.859)
ACSIZE — 0.006 0.005 –0.004 –0.010(0.496) (0.554) (–0.824) (–1.591)
AUDITOR — 0.080 0.070 0.001 0.006(2.350)** (2.765)*** (0.100) (0.349)
LNTA — –0.019 –0.021 –0.012 –0.012(–2.140)** (–2.930)*** (–3.357)*** (–2.616)***
LEV + 0.101 0.015 0.063 0.052(1.545) (0.309) (2.310)** (1.640)
LOSS + 0.039 0.042 0.019 0.012(1.379) (2.025)** (1.606) (0.904)
LNOC + 0.023 — 0.001 —(1.845)** (0.285)
Capital goods ? — –0.022 — –0.019(–0.379) (–0.534)
Commercial, servicesand supplies
? — 0.017 — 0.007(0.285) (0.167)
Energy ? — 0.054 — –0.017(0.855) (–0.419)
Food, beverageand tobacco
? — 0.368 — –0.023(6.302)*** (–0.629)
Healthcare equipmentand services
? — 0.012 — 0.004(0.189) (0.096)
Hotels, restaurantsand leisure
? — –0.014 — –0.025(–0.217) (–0.592)
Materials ? — 0.022 — –0.005(0.410) (–0.142)
Media ? — 0.242 — –0.017(3.861)*** (–0.433)
Pharmaceuticals andbiotechnology
? — –0.037 — 0.033(–0.559) (0.780)
Retailing ? — –0.000 — –0.008(–0.001) (–0.203)

286 P. Baxter, J. Cotter/Accounting and Finance 49 (2009) 267–290
© The AuthorsJournal compilation © 2009 AFAANZ
Software and services ? — 0.121 — 0.031(2.029)** (0.798)
Telecommunicationservices
? — 0.423 — 0.082(6.120)*** (1.861)
Adjusted R2 0.033 0.424 0.050 0.073F-statistic 1.977** 11.703*** 2.469*** 2.132***N 283 306 282 305
** and *** denote significance at the 0.05 and 0.01 levels, respectively (p-values are one-tailed whendirection is as predicted, otherwise two-tailed). EQJones is cross-sectional earnings quality proxyfrom modified Jones (1991) model (i.e. absolute value of abnormal accruals); EQDD is cross-sectionalearnings quality proxy from Dechow and Dichev (2002) model adjusted for Jones (1991) modelvariables (i.e. absolute value of regression residuals); ACIND is proportion of independent directorson audit committee; ACACCEX is proportion of directors on audit committee with accountingqualifications; ACLEGEX is proportion of directors on audit committee with legal qualifications;ACMEET is number of audit committee meetings for the year; ACSIZE is number of audit committeemembers; LNOC is natural log of operating cycle, measured as 360/(sales/average account receivables);LNTA is natural log of total assets; LEV is total liabilities divided by total assets; OPCYCLE is operatingcycle measured as 360/(sales/average account receivables); LOSS takes the value of 1 if net income forthe year is less than 0, and 0 otherwise; AUDITOR takes the value of 1 if Big Five or Six auditor, and0 if non-Big Five or Six auditor. The remaining variables are industry dummy vaciables that take thevalue of 1 if a company is from a particular industry, and 0 otherwise..
VariablePredictedsign EQJones EQDD
Table 6 (continued)
ACMEET and ACSIZE, and mixed results for ACIND depending on how it ismeasured.15 Our results indicate that EQDD is significantly negatively corre-lated with ACACCEX indicating that this measure of earnings quality is higherwhen there are a greater proportion of audit committee members with accountingexpertise. This result is consistent with Dhaliwal et al. (2006) who find a signi-ficant positive relation between accounting expertise and accruals quality. Ourother audit committee variables are not significantly related to EQDD.16
15 These authors proxy audit committee independence using a dichotomous non-executivedirector measure and find mixed results depending on whether they code this variable witha value of one if the audit committee is comprised entirely of non-executive directors or amajority. In sensitivity tests, their significant results for this variable become insignificantwhen they remove non-executive directors that had related party transactions.16 We also examine a summary measure of the overall strength of the sample companies’audit committees. This variable (AC_GOV_SCORE) is calculated as the sum of each of theaudit committee dichotomous variables discussed above. There is a significant negativePearson correlation between AC_GOV_SCORE and EQDD. However, this relation is notsignificant in a multivariate context.

P. Baxter, J. Cotter/Accounting and Finance 49 (2009) 267–290 287
© The AuthorsJournal compilation © 2009 AFAANZ
When logged transformations of our EQ variables are used, EQDD remainssignificantly negatively associated with ACACCEX, whereas EQJones is signifi-cantly positively associated with this variable. When we add the full board vari-ables to our models, the relationship between EQDD and ACACCEX becomesinsignificant and the remainder of our results are qualitatively the same. Giventhe high correlation between our board and audit committee accounting expertisevariables (r = 0.77), it is difficult to reliably interpret this result. Therefore, wererun our EQDD models with BDACCEX instead of ACACCEX and find thatBDACCEX is not significantly related to EQDD. This result suggests that it isaccounting expertise at the audit committee level rather than the full board levelthat positively impacts earnings quality.
The results for control variables shown in Table 6 indicate significant asso-ciations between EQDD and LNTA, and between EQJones and LNTA andAUDITOR, as well as some mixed results for LEV, LOSS and LNOC. The signi-ficant positive relations that we observe between EQJones and ACACCEX andAUDITOR are contrary to expectations. Several of the industry dummy variablesare significant for EQJones, which captures variation in the exercise of discretionaryaccruals across industries.
Overall, Hypothesis 2 is generally not supported, with the exception of auditcommittee accounting expertise when the EQDD measure of earnings quality isconsidered. The weight of evidence suggests that the higher the proportion ofaccounting expertise a company has on its audit committee, the lower its accrualestimation errors.
5. Conclusions
This research investigates the association between audit committees andearnings quality in Australia. The time period for the research is selected toavoid the confounding effects of mandatory audit committee requirementsintroduced for Australian companies in 2003. We hypothesize that the forma-tion of an audit committee is associated with an increase in earnings quality(Hypothesis 1); and the independence, expertise, activity and size of an auditcommittee are positively associated with earnings quality (Hypothesis 2).Overall, the results provide support for Hypothesis 1, but not Hypothesis 2.
Several conclusions can be drawn from our results. First, we find that adiscretionary accruals measure based on the Jones (1991) earnings managementmodel decreases significantly in the year following audit committee formation.Because measures based on this model are generally characterized as captur-ing managements’ intent to manipulate earnings, our results imply that theestablishment of an audit committee is an effective way to reduce earningsmanagement and, hence, improve the quality of earnings. When we capture accrualestimation errors using measures based on Dechow and Dichev’s (2002) model,we do not find an increase in earnings quality following audit committee formation.This disparity in results between the two types of earnings quality measures

288 P. Baxter, J. Cotter/Accounting and Finance 49 (2009) 267–290
© The AuthorsJournal compilation © 2009 AFAANZ
highlights the potential impact of audit committees. Although improved qualityof financial reporting practices has been widely cited as a major benefit of auditcommittees, this result appears to indicate that this improvement most likelyoccurs through a reduction in earnings manipulations rather than lower accrualestimation errors deriving from management lapses or environmental uncertainties.A caveat on these results is the relatively small sample size available for testsof Hypothesis 1.
Second, when we capture earnings quality using an accrual estimation errorsmeasure, we find that audit committee accounting expertise is associated withhigher quality earnings. However, we do not find the same association when wecapture earnings quality using an earnings management measure. Indeed, we findsome evidence of higher earnings management for firms with a greater proportionof qualified accountants on their audit committees. Future research that exploresthis result further might be able to shed some light on this unexpected finding.A potential limitation of our research relates to the endogeneity of audit committees.The characteristics of audit committees are not necessarily independent ofearnings quality. Companies with higher quality earnings might be more likelyto choose audit committee characteristics that signal the strength of their financialreporting system (Engel, 2005).
Overall, our results highlight the multifaceted nature of earnings quality andthe potential for audit committees to impact it. As we have found, differentmeasures of earnings quality can lead to different results and inferences. Eachof the available models of earnings quality has its own particular limitations andthese should be considered when interpreting our results. Additional researchthat separates out the intentional and unintentional components of the accrualestimation errors would help to further clarify which aspects of earnings qualityaudit committees tend to improve.
References
Australian Accounting Research Foundation, Institute of Internal Auditors Australia andAustralian Institute of Company Directors, 2001, Best Practice Guide: Audit Committees(Australian Accounting Research Foundation, Melbourne, Vic.).
ASX Corporate Governance Council, 2003, Principles of Good Corporate Governance andBest Practice Recommendations (ASX, Sydney, NSW)
Australian Stock Exchange, 2006, ASX Listing Rules. [Cited 4 August 2006.] Available:http://www.asx.com.au/supervision/rules_guidance/ listing_rules1.htm.
Beasley, M., and S. Salterio, 2001, The relationship between board characteristics and voluntaryimprovements in audit committee composition and experience, Contemporary AccountingResearch 18, 529 –570.
Beasley, M., J. Carcello, D. Hermanson, and P. Lapides, 2000, Fraudulent financial reporting:consideration of industry traits and corporate governance mechanisms, Accounting Horizons14, 441– 454.
Bedard, J., S. Chtourou, and L. Courteau, 2004, The effect of audit committee expertise,independence and activity on aggressive earnings management, Auditing: A Journal ofPractice and Theory 23, 13 –35.

P. Baxter, J. Cotter/Accounting and Finance 49 (2009) 267–290 289
© The AuthorsJournal compilation © 2009 AFAANZ
Bernard, V., and D. Skinner, 1996, What motivates managers’ choice of discretionaryaccruals? Journal of Accounting and Economics 22, 313–325.
Blue Ribbon Committee, 1999, Report and recommendations of the blue ribbon committeeon improving the effectiveness of corporate audit committees, Business Lawyer 54,1067–1095.
Choi, J., K. Jeon, and J. Park, 2004, The role of audit committees in decreasing earningsmanagement: Korean evidence, International Journal of Accounting, Auditing andPerformance Evaluation 1, 37–60.
Davidson, R., J. Goodwin-Stewart, and P. Kent, 2005, Internal governance structures andearnings management, Accounting and Finance 45, 241–268.
Davidson, W., B. Xie, and W. Xu, 2004, Market reaction to voluntary announcements ofaudit committee appointments: the effect of financial expertise, Journal of Accountingand Public Policy 23, 279–293.
Dechow, P., and I. Dichev, 2002, The quality of accruals and earnings: the role of accrualestimation errors, Accounting Review 77, 35–59.
Dechow, P., R. Sloan, and A. Sweeney, 1995, Detecting earnings management, AccountingReview 70, 193–225.
Dechow, P., R. Sloan, and A. Sweeney, 1996, Causes and consequences of earnings mani-pulations: an analysis of firms subject to enforcement actions by the SEC, ContemporaryAccounting Research 13, 1–36.
DeFond, M., R. Hann, and X. Xu, 2005, Does the market value financial expertise on auditcommittees of boards of directors? Journal of Accounting Research 53, 153–193.
Dhaliwal, D., V. Naiker, and F. Navissi, 2006, Audit committee financial expertise, corporategovernance and accruals quality: an empirical analysis, working paper (University ofArizona, University of Auckland and Monash University).
Engel, E., 2005, Discussion of ‘Does the market value financial expertise on audit committeesof boards of directors?’ Journal of Accounting Research 43, 195–204.
Francis, J., R. LaFond, P. Olsson, and K. Schipper, 2005, The market pricing of accrualsquality, Journal of Accounting and Economics 39, 295–337.
Guay, W., S. Kothari, and R. Watts, 1996, A market-based evaluation of discretionaryaccrual models, Journal of Accounting Research 34, 83–105.
Hansen, G., 1999, Bias and measurement error in discretionary accrual models, workingpaper (Pennsylvania State University, State College, PA).
Healy, P., and J. Wahlen, 1999, A review of earnings management literature and itsimplications for standard setting, Accounting Horizons 13, 365–383.
Jeon, K., J. Choi, and J. Park, 2004, The relationship between new audit committee estab-lishment and earnings management, Korean Accounting Review 29, 143–178.
Jones, J., 1991, Earnings management during import relief investigations, Journal ofAccounting Research 29, 193–228.
Kent, P., J. Routledge, and J. Stewart, 2008, Innate and discretionary accrual quality andcorporate governance, paper presented at the Accounting and Finance Association ofAustralia and New Zealand Annual Conference; 6–8 July 2008, Sydney, NSW.
Klein, A., 2002, Audit committee, board of director characteristics and earnings manage-ment, Journal of Accounting and Economics 33, 129–150.
Klein, A., 2003, Likely effects of stock exchange governance proposals and Sarbanes–Oxleyon corporate boards and financial reporting, Accounting Horizons 17, 343–355.
Koh, P., S. Laplante, and Y. Tong, 2007, Accountability and value enhancement roles ofcorporate governance, Accounting and Finance 47, 305–333.
Kothari, S., A. Leone, and C. Wasley, 2005, Performance matched discretionary accrualmeasures, Journal of Accounting and Economics 39, 163–197.
Larcker, D., and S. Richardson, 2004, Fees paid to audit firms, accrual choices and corpo-rate governance, Journal of Accounting Research 42, 625–658.

290 P. Baxter, J. Cotter/Accounting and Finance 49 (2009) 267–290
© The AuthorsJournal compilation © 2009 AFAANZ
McMullen, D., 1996, Audit committee performance: an investigation of the consequencesassociated with audit committees, Auditing: A Journal of Practice and Theory 15, 87–103.
McNichols, M., 2002, Discussion of ‘The quality of accruals and earnings: the role ofaccrual estimation errors’, Accounting Review 77, 61–69.
Menon, K., and D. Williams, 1994, The use of audit committee for monitoring, Journal ofAccounting and Public Policy 13, 121–139.
Ramsay, I., 2001, Independence of Australian Company Auditors: Review of CurrentAustralian Requirements and Proposals for Reform (Commonwealth of Australia,Canberra, ACT).
Schipper, K., 1989, Commentary on earnings management, Accounting Horizons 36, 91–102.
Securities Industry Research Centre of Asia–Pacific Ltd, 2004, Aspect Financial Database.[Cited 4 August 2006.] Available: http://www.sirca.org.au/uni/services/Data/accounting/aspect_financial.html).
Srinidhi, B., and F. Gul, 2007, The differential effects of auditors’ non-audit and audit feeson accrual quality, Contemporary Accounting Research 24, 595–629.
Vafeas, N., 2005, Audit committees, boards and the quality of reported earnings, Contempo-rary Accounting Research 22, 1093–1122.
Van der Zahn, M., and G. Tower, 2004, Audit committee features and earnings management:further evidence from Singapore, International Journal of Business Governance and Ethics1, 233–257.
Vanasco, R., 1994, The audit committee: an international perspective, Managerial AuditingJournal 9, 18–42.
Wild, J., 1994, The audit committee and earnings quality, Journal of Accounting, Auditingand Finance 22, 247–276.
Xie, B., W. Davidson, and P. DaDalt, 2003, Earnings management and corporate governance:the role of the board and audit committee, Journal of Corporate Finance 9, 295–316.
Yang, J., and J. Krishnan, 2005, Audit committees and quarterly earnings management,International Journal of Auditing 9, 201–219.