audit 2014 volume 8 technical economics ın İşletmeleri a.Ş
TRANSCRIPT
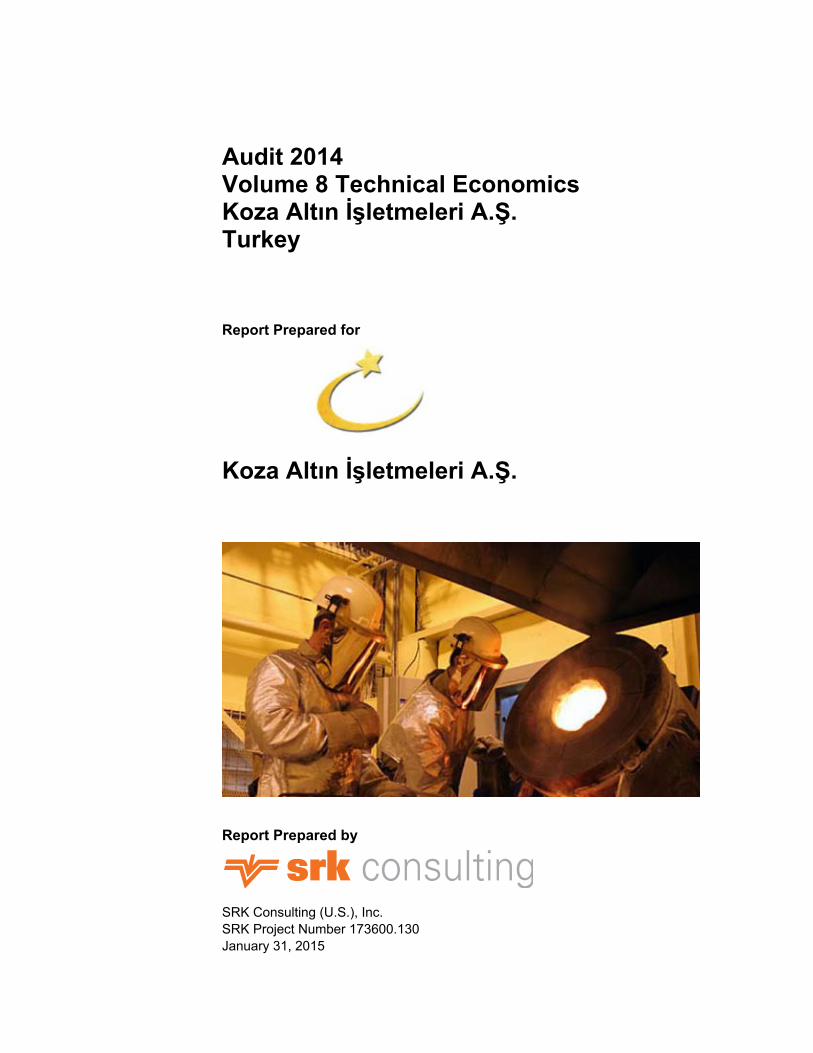
Audit 2014 Volume 8 Technical Economics Koza Altın İşletmeleri A.Ş. Turkey
Report Prepared for
Koza Altın İşletmeleri A.Ş.
Report Prepared by
SRK Consulting (U.S.), Inc. SRK Project Number 173600.130 January 31, 2015

SRK Consulting (U.S.), Inc. Audit 2014 - Koza Altın İşletmeleri A.Ş. Volume 8 - Page ii
VO/SH KozaGold_2014Audit_Vol08_Economics_173600.130_005_SH January 31, 2015
Audit 2014 Volume 8 Technical Economics Koza Altın İşletmeleri A.Ş. Turkey
Koza Altın İşletmeleri A.Ş. Istanbul Yolu 10. Km. No: 310 Batikent – ANKARA
SRK Consulting (U.S.), Inc. 7175 West Jefferson Avenue, Suite 3000 Lakewood, CO 80235 e-mail: [email protected] website: www.srk.com Tel: +1.303.985.1333 Fax: +1.303.985.9947
SRK Project Number 173600.130 January 31, 2015 Endorsed by CPs: Valerie Obie, BS Mining, MA, SME-RM Reviewed by: Grant Malensek, PEng/PGeo

SRK Consulting (U.S.), Inc. Audit 2014 - Koza Altın İşletmeleri A.Ş. Volume 8 - Page iii
VO/SH KozaGold_2014Audit_Vol08_Economics_173600.130_005_SH January 31, 2015
Table of Contents 1 Introduction .................................................................................................................. 1
2 Technical Economics .................................................................................................. 2
2.1 Basis of Technical-Economic Model (TEM) ........................................................................................ 2
General Input Parameters ....................................................................................................... 3 2.1.1
Production Summary ............................................................................................................... 3 2.1.2
2.2 Capital Expenditures ........................................................................................................................... 5
Mastra Operating Unit ............................................................................................................. 5 2.2.1
Ovacık Operating Unit ............................................................................................................. 6 2.2.2
Kaymaz Operating Unit ........................................................................................................... 7 2.2.3
Himmetdede Operating Unit .................................................................................................... 7 2.2.4
Mollakara Operating Unit ......................................................................................................... 8 2.2.5
Akbastepe Operating Unit ....................................................................................................... 8 2.2.6
2.3 Operating Costs .................................................................................................................................. 9
Mining Costs ............................................................................................................................ 9 2.3.1
Processing Costs .................................................................................................................. 10 2.3.2
G&A Costs ............................................................................................................................. 10 2.3.3
2.4 Cash flow Projections ........................................................................................................................ 11
Consolidated Operations ....................................................................................................... 11 2.4.1
Mastra Unit Annual Cost Summary ....................................................................................... 14 2.4.2
Ovacık Unit Annual Cost Summary ....................................................................................... 16 2.4.3
Kaymaz Unit Annual Cost Summary ..................................................................................... 18 2.4.4
Himmetdede Unit Annual Cost Summary ............................................................................. 19 2.4.5
Mollakara Unit Annual Cost Summary .................................................................................. 20 2.4.6
Akbastepe Unit Annual Cost Summary ................................................................................. 21 2.4.7
3 Conclusions and Recommendations ....................................................................... 23
4 Glossary ...................................................................................................................... 24
4.1 Mineral Resources and Reserves ..................................................................................................... 24
4.2 Glossary of Terms ............................................................................................................................. 25
5 Date and Signature Page ........................................................................................... 26
List of Tables Table 2.1.1.1: General Modeling Assumptions ................................................................................................... 3
Table 2.1.2.1: Operating Unit LoM Production Summary ................................................................................... 4
SRK Consulting (U.S.), Inc. Audit 2014 - Koza Altın İşletmeleri A.Ş. Volume 8 - Page iv
VO/SH KozaGold_2014Audit_Vol08_Economics_173600.130_005_SH January 31, 2015
Table 2.1.2.2: Mill/Process Parameters .............................................................................................................. 4
Table 2.1.2.3: Consolidated Ore Milled/Processed ............................................................................................ 5
Table 2.1.2.4: Consolidated Metal Recovery ...................................................................................................... 5
Table 2.2.1.1: Mastra Unit LoM Capital Costs .................................................................................................... 6
Table 2.2.2.1: Ovacık Unit LoM Capital Costs .................................................................................................... 7
Table 2.2.3.1: Kaymaz Unit LoM Capital Costs .................................................................................................. 7
Table 2.2.4.1: Himmetdede Unit LoM Capital Costs .......................................................................................... 8
Table 2.2.5.1: Mollakara Unit LoM Capital Costs ............................................................................................... 8
Table 2.2.6.1: Akbastepe Unit LoM Capital Costs .............................................................................................. 9
Table 2.3.1.1: Mine Operating Costs .................................................................................................................. 9
Table 2.3.2.1: Process (Mill) Operating Costs .................................................................................................. 10
Table 2.3.3.1: G&A Operating Costs ................................................................................................................ 10
Table 2.4.1.1: LoM Technical-Economic Model Results (US$000’s) ............................................................... 11
Table 2.4.1.2: Project Sensitivity ...................................................................................................................... 12
Table 2.4.1.3: LoM Technical-Economic Model Results (US$000’s) ............................................................... 13
Table 2.4.2.1: Mastra Unit Economic Model Results (US$000’s) .................................................................... 14
Table 2.4.3.1: LoM Ovacık Unit Economic Model Results (US$000’s) ............................................................ 16
Table 2.4.4.1: Kaymaz Unit Economic Model Results (US$000’s) .................................................................. 18
Table 2.4.5.1: Himmetdede Unit Economic Model Results (US$000’s) ........................................................... 19
Table 2.4.6.1: Mollakara Unit Economic Model Results (US$000’s) ................................................................ 20
Table 2.4.7.1: Akbastepe Unit Economic Model Results (US$000’s) .............................................................. 21
Table 4.2.1: Glossary ........................................................................................................................................ 25
Disclaimer & Copyright Disclaimer ......................................................................................................................................................... 27
Copyright ........................................................................................................................................................... 27
SRK Consulting (U.S.), Inc. Audit 2014 - Koza Altın İşletmeleri A.Ş. Volume 8 - Page v
VO/SH KozaGold_2014Audit_Vol08_Economics_173600.130_005_SH January 31, 2015
List of Abbreviations The metric system has been used throughout this report unless otherwise stated. All currency is in
U.S. dollars unless stated otherwise. Market prices are reported in $ per troy oz of gold and silver.
Tonnes are metric of 1,000 kg, or 2,204.6 lb, unless otherwise stated. The following abbreviations
are typical to the mining industry and may be used in this report.
Abbreviation Unit or Term º degree % percent AA atomic absorption AAS atomic absorption spectography Ag silver amsl above mean sea level Au gold BLEG Bulk Leach Extractible Gold BWI Bond Work Index C Celsius CoG cutoff grade CIP carbon in pulp cm centimeter CP Competent Person CPR Competent Person’s Report CRP Community Relations Plan CRM Certified Reference Material Cu copper dia. diameter Eq equivalent EIA Environmental Impact AssessmentF Fahrenheit ft feet/foot g gram g/cm grams per centimeter g/t grams per tonne ha hectares HG high-grade hr hour ID2 Inverse Distance Squared ID3 Inverse Distance Cubed in inch IP Induced Polarization kg kilogram km kilometer koz thousand troy ounce kt thousand tonnes kV kilovolt kVA kilovolt-amps L liter lb pound LHD load haul dump LG low-grade LoM life of mine

SRK Consulting (U.S.), Inc. Audit 2014 - Koza Altın İşletmeleri A.Ş. Volume 8 - Page vi
VO/SH KozaGold_2014Audit_Vol08_Economics_173600.130_005_SH January 31, 2015
m meter M million m.a. million annum min minute mm millimeter Mm million meter Moz million ounces Mt million tonnes Mt/y million tonnes per year MVA million volts amperes NN Nearest Neighbor NPV net present value OK Ordinary Kriging OP open pit oz ounce ppb parts per billion ppm parts per million QA/QC Quality Assurance/Quality Control RC reverse circulation RoM run of mine SART sulfidization, acidification, recycling, and thickeningt tonne(s) t/h tonnes per hour t/d tonnes per day t/m tonnes per month t/y tonnes per year TEM Technical Economic Model µ micron UG underground V volt WAD weak acid dissociable Zn zinc

SRK Consulting (U.S.), Inc. Audit 2014 - Koza Altın İşletmeleri A.Ş. Volume 8 - Page 1
VO/SH KozaGold_2014Audit_Vol08_Economics_173600.130_005_SH January 31, 2015
1 Introduction SRK Consulting (U.S.), Inc. (SRK) was commissioned by Koza Altın İşletmeleri A.Ş. (Koza) to audit
Koza’s gold resources and reserves and exploration projects as of the end of December 2014.
Koza’s Mining Assets are located in the Ovacık Mining District, Mastra Mining District, and Kaymaz
District, including Söğüt, as well as Mollakara in the Diyadin District in Eastern Turkey and
Himmetdede in Central Turkey.
This report is Volume 8 Technical Economics of the following ten volumes reports:
Volume 1 Executive Summary;
Volume 2 Ovacık Resources and Reserves;
Volume 3 Mastra Resources and Reserves;
Volume 4 Kaymaz Resources and Reserves;
Volume 5 Söğüt Resources and Reserves
Volume 6 Himmetdede Resources and Reserves;
Volume 7 Mollakara Resources and Reserves;
Volume 8 Technical Economics;
Volume 9 Hasandağ and Işıkdere Resource Areas; and
Volume 10 Exploration Projects.
This report is prepared using the industry accepted Australasian Code for Reporting of Exploration
Results, Mineral Resources and Ore Reserves (JORC Code 2012).
Volume I Executive Summary contains the Terms of Reference and Property Descriptions relevant to
all volumes of this audit.
SRK Consulting (U.S.), Inc. Audit 2014 - Koza Altın İşletmeleri A.Ş. Volume 8 - Page 2
VO/SH KozaGold_2014Audit_Vol08_Economics_173600.130_005_SH January 31, 2015
2 Technical Economics The financial results summarized in this section are based upon work performed by SRK as
described throughout this report. All costs are in 4Q 2014 US constant dollars. This Report includes
technical information, which requires subsequent calculations to derive subtotals, totals and
weighted averages. Such calculations inherently involve a degree of rounding and consequently can
introduce a margin of error. Where these rounding errors occur, SRK does not consider them
material.
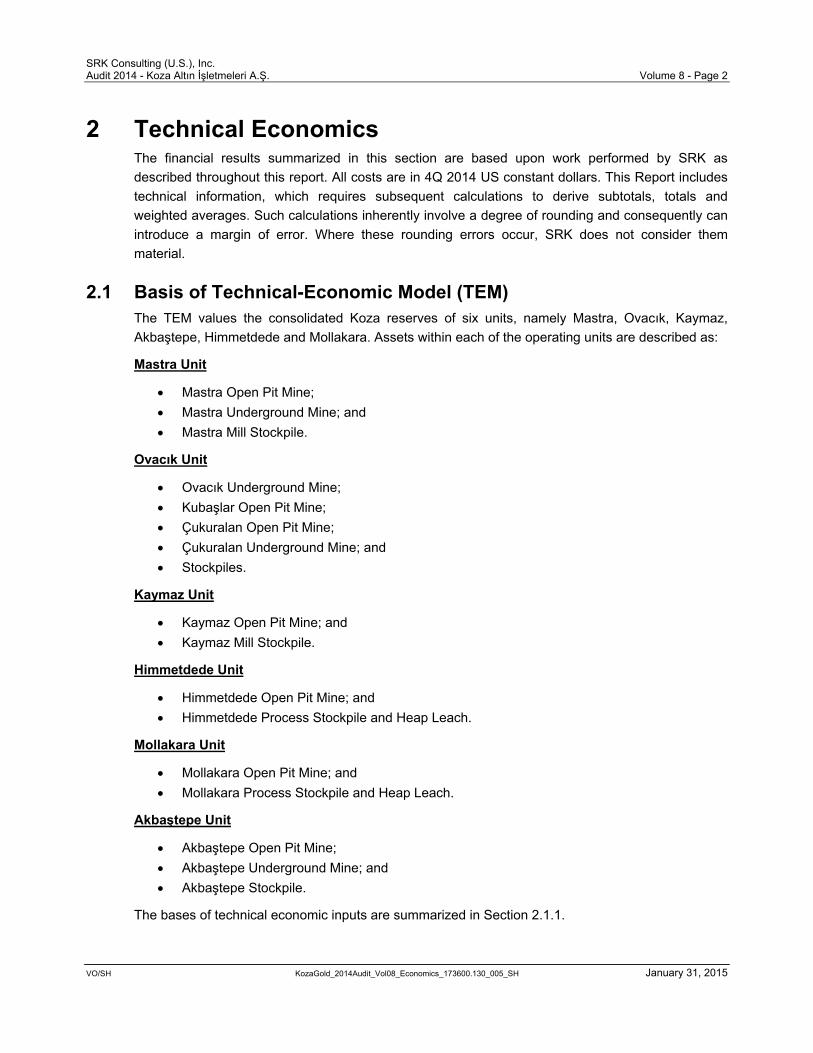
2.1 Basis of Technical-Economic Model (TEM) The TEM values the consolidated Koza reserves of six units, namely Mastra, Ovacık, Kaymaz,
Akbaştepe, Himmetdede and Mollakara. Assets within each of the operating units are described as:
Mastra Unit
Mastra Open Pit Mine;
Mastra Underground Mine; and
Mastra Mill Stockpile.
Ovacık Unit
Ovacık Underground Mine;
Kubaşlar Open Pit Mine;
Çukuralan Open Pit Mine;
Çukuralan Underground Mine; and
Stockpiles.
Kaymaz Unit
Kaymaz Open Pit Mine; and
Kaymaz Mill Stockpile.
Himmetdede Unit
Himmetdede Open Pit Mine; and
Himmetdede Process Stockpile and Heap Leach.
Mollakara Unit
Mollakara Open Pit Mine; and
Mollakara Process Stockpile and Heap Leach.
Akbaştepe Unit
Akbaştepe Open Pit Mine;
Akbaştepe Underground Mine; and
Akbaştepe Stockpile.
The bases of technical economic inputs are summarized in Section 2.1.1.

SRK Consulting (U.S.), Inc. Audit 2014 - Koza Altın İşletmeleri A.Ş. Volume 8 - Page 3
VO/SH KozaGold_2014Audit_Vol08_Economics_173600.130_005_SH January 31, 2015
General Input Parameters 2.1.1
Assumptions used in the TEM are shown in Table 2.1.1.1. Gold and silver are modeled at
US$1,250/oz and US$20/oz, respectively, for the life of mine (LoM). The prices used represent a
reasonable value between current market prices and 3-year running average. Gold and silver prices
as of December 2014 were US$1,202/oz and US$16.24/oz, respectively. LME 3-year average price
(through December 2014) for gold and silver are US$1,446/oz and US$24.68/oz, respectively.
Refining costs are estimated at US$2.00/oz-Au. The refining cost for silver is included in this cost. A
community charge (social tax) equivalent to US$1.44/oz-Au is also applied.
There are three royalties at the Koza project properties. A 1% NSR government royalty applies to all
units. An additional 1% NSR royalty is applied to production at the Mastra Open Pit. Also, a 3%
gross profits royalty is applied to the underground mining operation at Ovacık is conservatively
modeled as a NSR due to the complexity of modeling gross profits at Ovacık in a consolidated
operation. This assumption is not material to the TEM as Ovacık UG gold production accounts for
about 8% of total gold from the Ovacık unit.
An effective tax rate of 20% is assumed.
Table 2.1.1.1: General Modeling Assumptions
Description Value UnitsMarkets Gold Price US$1,250.00 per oz LoM Silver Price US$20.00 per oz LoM Outside Costs Refining Cost US$2.00 per Au-oz Community Charge US$1.44 per Au-oz Royalties Ovacık Private Royalty 3% Gross Profit Ovacık Underground Mine Mastra MTA Royalty 1% NSR Mastra Open Pit Mine Government Royalty 1% All units Tax Tax Rate 20% Depreciation 8 years
Production Summary 2.1.2
Mine production schedules are discussed in detail throughout this report, with each mine showing a
separate high-grade and low-grade (stockpile) stream. The LoM production schedules and timing
from each operating mine is shown in Table 2.1.2.1. Variations in grade and tonnage from the stated
reserve quantum are based on schedule accumulation methodology of both in-situ reserves and
stockpiles as they are applied to the technical economic model. SRK is of the opinion that this slight
variation is immaterial.
SRK Consulting (U.S.), Inc. Audit 2014 - Koza Altın İşletmeleri A.Ş. Volume 8 - Page 4
VO/SH KozaGold_2014Audit_Vol08_Economics_173600.130_005_SH January 31, 2015
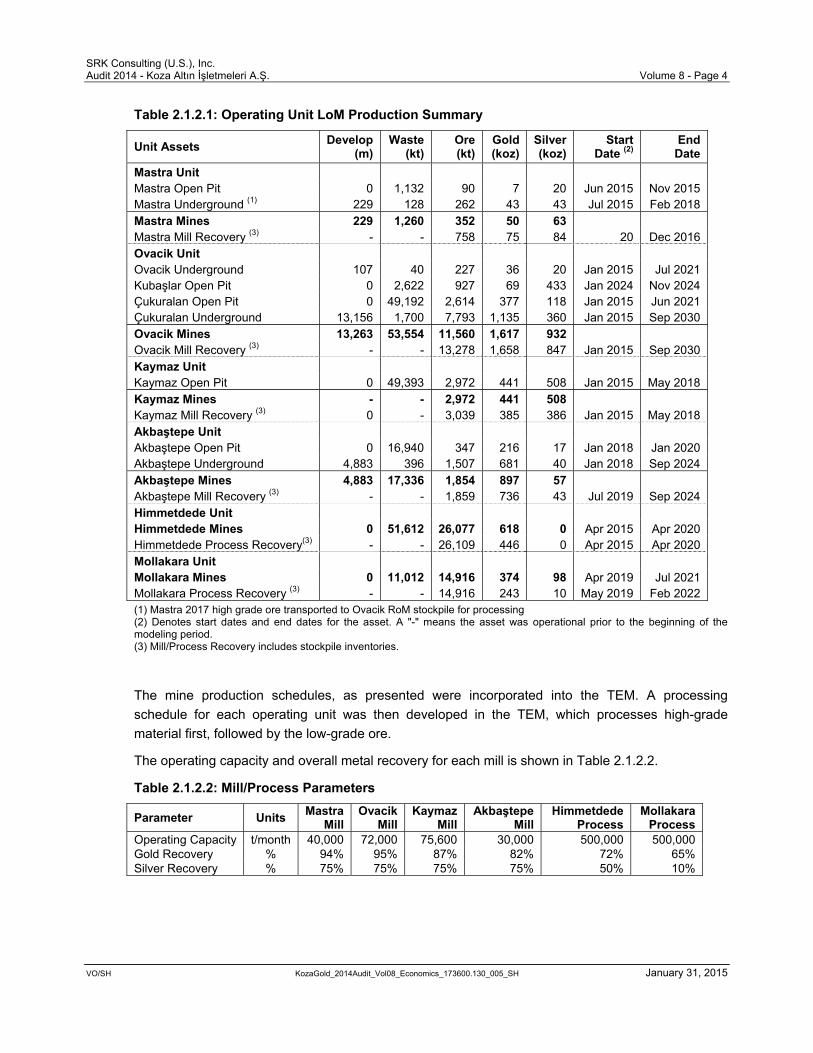
Table 2.1.2.1: Operating Unit LoM Production Summary
Unit Assets Develop
(m) Waste
(kt) Ore (kt)
Gold (koz)
Silver (koz)
Start Date (2)
End Date
Mastra Unit Mastra Open Pit 0 1,132 90 7 20 Jun 2015 Nov 2015 Mastra Underground (1) 229 128 262 43 43 Jul 2015 Feb 2018 Mastra Mines 229 1,260 352 50 63 Mastra Mill Recovery (3) - - 758 75 84 20 Dec 2016 Ovacik Unit Ovacik Underground 107 40 227 36 20 Jan 2015 Jul 2021 Kubaşlar Open Pit 0 2,622 927 69 433 Jan 2024 Nov 2024 Çukuralan Open Pit 0 49,192 2,614 377 118 Jan 2015 Jun 2021 Çukuralan Underground 13,156 1,700 7,793 1,135 360 Jan 2015 Sep 2030 Ovacik Mines 13,263 53,554 11,560 1,617 932 Ovacik Mill Recovery (3) - - 13,278 1,658 847 Jan 2015 Sep 2030 Kaymaz Unit Kaymaz Open Pit 0 49,393 2,972 441 508 Jan 2015 May 2018 Kaymaz Mines - - 2,972 441 508 Kaymaz Mill Recovery (3) 0 - 3,039 385 386 Jan 2015 May 2018 Akbaştepe Unit Akbaştepe Open Pit 0 16,940 347 216 17 Jan 2018 Jan 2020 Akbaştepe Underground 4,883 396 1,507 681 40 Jan 2018 Sep 2024 Akbaştepe Mines 4,883 17,336 1,854 897 57 Akbaştepe Mill Recovery (3) - - 1,859 736 43 Jul 2019 Sep 2024 Himmetdede Unit Himmetdede Mines 0 51,612 26,077 618 0 Apr 2015 Apr 2020 Himmetdede Process Recovery(3) - - 26,109 446 0 Apr 2015 Apr 2020 Mollakara Unit Mollakara Mines 0 11,012 14,916 374 98 Apr 2019 Jul 2021 Mollakara Process Recovery (3) - - 14,916 243 10 May 2019 Feb 2022 (1) Mastra 2017 high grade ore transported to Ovacik RoM stockpile for processing (2) Denotes start dates and end dates for the asset. A "-" means the asset was operational prior to the beginning of the modeling period. (3) Mill/Process Recovery includes stockpile inventories.
The mine production schedules, as presented were incorporated into the TEM. A processing
schedule for each operating unit was then developed in the TEM, which processes high-grade
material first, followed by the low-grade ore.
The operating capacity and overall metal recovery for each mill is shown in Table 2.1.2.2.
Table 2.1.2.2: Mill/Process Parameters
Parameter Units Mastra
Mill Ovacik
Mill Kaymaz
Mill Akbaştepe
Mill Himmetdede
Process Mollakara
Process Operating Capacity t/month 40,000 72,000 75,600 30,000 500,000 500,000 Gold Recovery % 94% 95% 87% 82% 72% 65% Silver Recovery % 75% 75% 75% 75% 50% 10%

SRK Consulting (U.S.), Inc. Audit 2014 - Koza Altın İşletmeleri A.Ş. Volume 8 - Page 5
VO/SH KozaGold_2014Audit_Vol08_Economics_173600.130_005_SH January 31, 2015
Operating capacity and recovery at the existing Mastra, Ovacık and Kaymaz mills are based upon
historic achievements at these units. Capacity and recovery at the Himmetdede plant is based on
initial operations and Mollakara process plant is an estimate.
Tables 2.1.2.3 and 2.1.2.4 summarize forecasted LoM ore processed and metals recovery from the
various operating mines.
Table 2.1.2.3: Consolidated Ore Milled/Processed
Operating Unit Ore
Milled (kt)
GoldGrade
(g/t)
SilverGrade
(g/t)
ContainedGold (koz)
ContainedSilver (koz)
Mastra Unit 758 3.25 4.62 79 113 Ovacik Unit 13,278 4.09 2.65 1,746 1,129 Kaymaz Unit 3,039 4.53 5.26 443 514 Akbaştepe Unit 1,859 15.01 0.96 897 57 Himmetdede Unit 26,109 0.74 0.00 619 0 Mollakara Unit 14,916 0.78 0.20 374 98 Total Ore Processed 59,954 2.17 0.99 4,158 1,911 Ore milled/processed and contained ounces include starting stockpile inventories.
Table 2.1.2.4: Consolidated Metal Recovery
Operating Unit Contained Metal
(koz) Recovery
(%) Recovered Metal
(koz) Gold Mastra 79 94 75 Ovacik 1,746 95 1,658 Kaymaz 443 87 385 Akbaştepe 897 82 736 Himmetdede 619 72 446 Mollakara 374 65 243 Total Gold 4,158 85% 3,543 Silver Mastra 113 75 84 Ovacik 1,129 75 847 Kaymaz 514 75 386 Akbaştepe 57 75 43 Himmetdede 0 0 0 Mollakara 98 10 10 Total Silver 1,911 72% 1,369
2.2 Capital Expenditures LoM capital expenditures are described as follows.
Mastra Operating Unit 2.2.1
Mining and processing assets in the Mastra Unit are mature operations. The Mastra Open Pit mine
will deplete its reserves in 4Q 2015 and will close. The Mastra mill will treat high-grade ore from the
Mastra Underground mine until the end of 2016 and then shut down. The Mastra Underground high-
grade mined in 2017 will be transported to the Ovacik stockpile and treated through the Ovacik mill in

SRK Consulting (U.S.), Inc. Audit 2014 - Koza Altın İşletmeleri A.Ş. Volume 8 - Page 6
VO/SH KozaGold_2014Audit_Vol08_Economics_173600.130_005_SH January 31, 2015
2018. The Mastra underground mine has a remaining life of 3.0 years based on reserves. Production
at Mastra underground is expected to cease in 1Q 2018.
LoM capital expenditures, totaling US$15.5 million will be used for development and support for the
Mastra Underground mine as well as for the tailings dam and closure of the surface operations
(Table 2.2.1.1).
Table 2.2.1.1: Mastra Unit LoM Capital Costs
Description LoM Cost (US$000’s) Mining Mastra Open Pit 0 Mastra Underground 0 Mastra Underground Develop. 785 Mining $785 Processing Mill Facility 83 Tailings Dam 8,148 Processing $8,231 Infrastructure Mastra 0 Mastra Closure 5,743 Other 1,392 Infrastructure $7,135 Total $16,151
Ovacık Operating Unit 2.2.2
The Ovacık Unit has two mature operations, Ovacık Underground which is expected to close in 3Q
2021, and Küçükdere Open Pit which closed in 4Q 2009. Additional operations have begun or are
expected to come on line: Çukuralan Underground, Çukuralan Open Pit, and Çoraklıktepe Open Pit.
The Kubaşlar Open Pit is a small operation which is expected to come on-line in 1Q 2024. The
Ovacık Mill will support all these operations as part of the company’s hub strategy.
LoM capital costs at Ovacık, shown in Table 2.2.2.1.

SRK Consulting (U.S.), Inc. Audit 2014 - Koza Altın İşletmeleri A.Ş. Volume 8 - Page 7
VO/SH KozaGold_2014Audit_Vol08_Economics_173600.130_005_SH January 31, 2015
Table 2.2.2.1: Ovacık Unit LoM Capital Costs
Description LoM Cost (US$000’s)Mining Ovacık Underground 0 Ovacık Underground Develop. 386 Kubaşlar Open Pit 0 Çukuralan Open Pit 0 Çukuralan Underground 0 Çukuralan Underground Develop. 32,914 Çoraklik Open Pit 0 Mining $33,300Processing Ovacık Mill 9,384 Tailings Dam 7,327 Processing $16,711Infrastructure Ovacik 0 Ovacık Closure 3,418 Çukuralan 0 Çukuralan Closure 13,979 Çorakliktepe 0 Çorakliktepe Closure 0 Kubaşlar 0 Kubaşlar Closure 1,089 Infrastructure $18,486Total $68,497
Kaymaz Operating Unit 2.2.3
Kaymaz is an operating unit, which consist of an open pit mine and mill commissioned near the end
of 3Q 2011. LoM capital is shown in Table 2.2.3.1.
Table 2.2.3.1: Kaymaz Unit LoM Capital Costs
Description LoM Cost (US$000’s)Mining Kaymaz Open Pit 222 Mining $222Processing Kaymaz Mill 1,742 Tailings Dam 124 Processing $1,866Infrastructure Kaymaz 3,181 Kaymaz Closure 34,050 Infrastructure $37,231Total $39,319
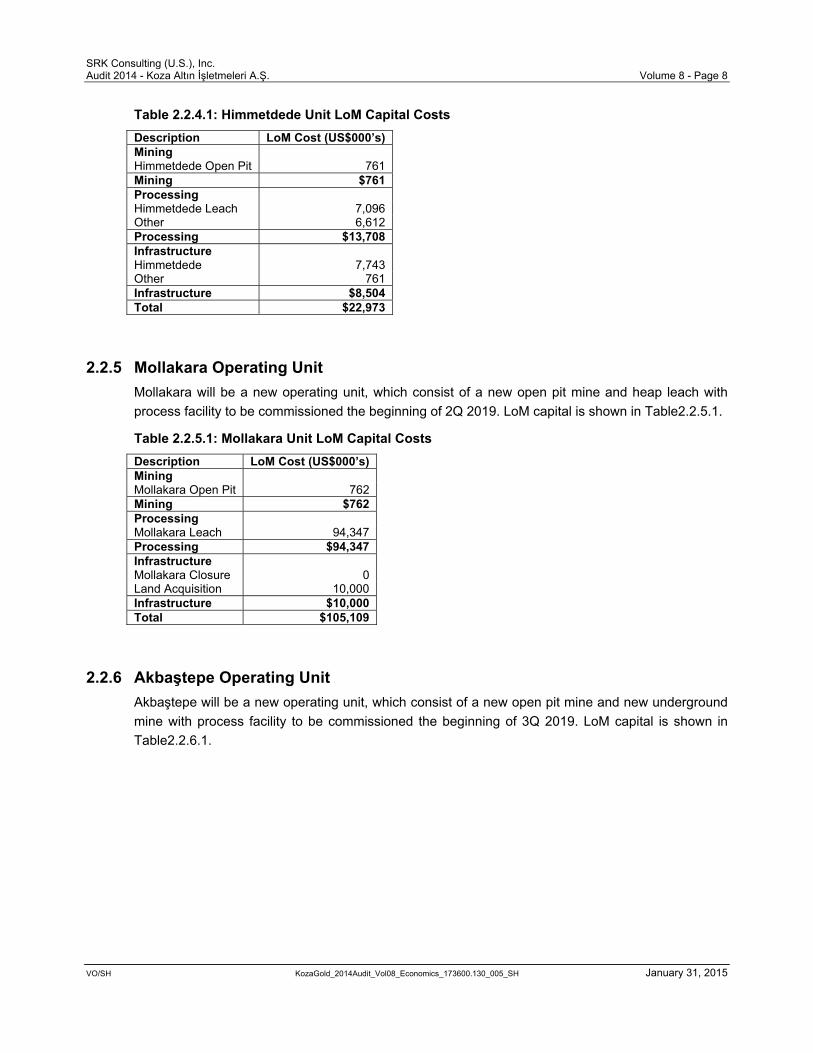
Himmetdede Operating Unit 2.2.4
Himmetdede will be a new operating unit, which consist of a new open pit mine and heap leach with
process facility to be commissioned near the end of 3Q 2013. LoM capital is shown in Table 2.2.4.1.
SRK Consulting (U.S.), Inc. Audit 2014 - Koza Altın İşletmeleri A.Ş. Volume 8 - Page 8
VO/SH KozaGold_2014Audit_Vol08_Economics_173600.130_005_SH January 31, 2015
Table 2.2.4.1: Himmetdede Unit LoM Capital Costs
Description LoM Cost (US$000’s)Mining Himmetdede Open Pit 761 Mining $761Processing Himmetdede Leach 7,096 Other 6,612 Processing $13,708Infrastructure Himmetdede 7,743 Other 761 Infrastructure $8,504Total $22,973
Mollakara Operating Unit 2.2.5
Mollakara will be a new operating unit, which consist of a new open pit mine and heap leach with
process facility to be commissioned the beginning of 2Q 2019. LoM capital is shown in Table2.2.5.1.
Table 2.2.5.1: Mollakara Unit LoM Capital Costs
Description LoM Cost (US$000’s)Mining Mollakara Open Pit 762 Mining $762Processing Mollakara Leach 94,347 Processing $94,347Infrastructure Mollakara Closure 0 Land Acquisition 10,000 Infrastructure $10,000Total $105,109
Akbaştepe Operating Unit 2.2.6
Akbaştepe will be a new operating unit, which consist of a new open pit mine and new underground
mine with process facility to be commissioned the beginning of 3Q 2019. LoM capital is shown in
Table2.2.6.1.

SRK Consulting (U.S.), Inc. Audit 2014 - Koza Altın İşletmeleri A.Ş. Volume 8 - Page 9
VO/SH KozaGold_2014Audit_Vol08_Economics_173600.130_005_SH January 31, 2015
Table 2.2.6.1: Akbaştepe Unit LoM Capital Costs
Description LoM Cost
Mining Akbaştepe Open Pit 1,000 Akbaştepe Underground 33,988 Mining $34,988 Processing Akbaştepe Mill 47,060 Tailings Dam 38,370 Processing $85,430 Infrastructure Akbaştepe 6,200 Akbaştepe Closure 3,390 Infrastructure $9,590 Total $130,008
2.3 Operating Costs
Mining Costs 2.3.1
Mining costs are shown in Table 2.3.1.1. LoM average unit costs are used in the TEM. For open pit
operations mining costs are applied to ore and waste moved. Costs include drilling blasting, loading,
hauling and support functions. An additional provision for grade control and rehandled is applied to
ore tonnes only.
Underground mining costs are all in ore costs. Costs include drilling, blasting, loading, hauling
ground control, ventilation, pumping and support costs. Development costs are capitalized.
Table 2.3.1.1: Mine Operating Costs
Operating Unit/Asset LoMCost
(US$000’s)
LoMCost
(US$/t-mined)
LoMCost
(US$/t-ore) Mastra Unit Mastra Open Pit 1,920 1.571 21.370 Mastra Underground 20,276 52.000 77.332 Ovacik Unit Ovacik Underground 14,675 55.000 64.683 Çukuralan Open Pit 104,611 2.019 40.026 Çukuralan Underground 360,728 38.000 46.287 Kubaşlar Open Pit 6,889 1.941 7.433 Kaymaz Unit Kaymaz Open Pit 72,194 1.379 24.290 Akbaştepe Unit Akbaştepe Open Pit 15,420 0.892 44.494 Akbaştepe Underground 95,394 50.130 63.289 Himmetdede Unit Himmetdede Open Pit 118,020 1.519 4.520 Mollakara Unit Mollakara Open Pit 46,038 1.776 3.087

SRK Consulting (U.S.), Inc. Audit 2014 - Koza Altın İşletmeleri A.Ş. Volume 8 - Page 10
VO/SH KozaGold_2014Audit_Vol08_Economics_173600.130_005_SH January 31, 2015
Processing Costs 2.3.2
LoM processing costs are summarized in Table 2.3.2.1. A discussion of these costs can be found
elsewhere in this report.
Table 2.3.2.1: Process (Mill) Operating Costs
Description Units Mastra Ovacik Kaymaz Akbaştepe Himmetdede Mollakara Chemicals US$/t-milled 5.500 2.270 4.860 31.970 0.740 1.905 Materials US$/t-milled 3.500 2.190 4.930 6.210 0.470 0.804 Energy US$/t-milled 5.830 2.610 5.080 23.640 1.720 0.053 Maintenance US$/t-milled 5.000 1.350 2.420 4.710 0.250 0.133 Contractors US$/t-milled $3.550 0.920 1.150 0.000 0.000 0.000 Heap Leach US$/t-ore 0.000 0.000 0.000 0.000 0.000 1.690 LoM Unit Cost $23.380 $9.340 $18.440 $66.530 $3.180 $4.585 Wages US$/year 408,000 708,000 753,600 905,760 2,088 2,088 Salaries US$/year 168,000 504,000 246,000 442,200 0 0 Maintenance US$/year 72,000 0 120,000 0 0 3,996 Other US$/year 381,360 60,240 218,400 0 3,960 0 LoM Fixed Cost US$/year $1,029,360 $1,272,240 $1,338,000 $1,347,960 $6,048 $6,084
G&A Costs 2.3.3
G&A costs, shown in Table 2.3.3.1 are LoM averages used in the model and allocated for each
operating unit. These values were incorporated into the TEM in the same manner as mining
operating costs.
Table 2.3.3.1: G&A Operating Costs
Description Units Unit Cost LoM Cost Mastra Unit Transportation-Mastra Open Pit US$/t-milled 2.000 180 G&A Allocation US$/t-milled 20.810 15,778 Mastra Unit $21.047 $15,958 Ovacik Unit Transport.-Kubaşlar US$/t-milled 11.000 10,194 Transport.-Çukuralan US$/t-milled 8.000 83,255 G&A Allocation US$/t-milled 18.100 240,724 Transport. -Mastra US$/t-milled 0 0 Ovacik Unit $25.138 $333,780 Kaymaz Unit G&A Allocation Kaymaz US$/t-milled 9.000 27,355 Kaymaz Unit $9.000 $27,355 Akbaştepe Unit G&A Allocation US$/t-milled 7.500 13,943 Akbaştepe Unit $7.521 $13,943 Himmetdede Unit G&A Allocation US$/t-milled 1.000 26,109 Himmetdede Unit $1.000 $26,109 Mollakara Unit G&A Allocation US$/t-milled 1.000 14,916 Mollakara Unit $1.000 $14,916

SRK Consulting (U.S.), Inc. Audit 2014 - Koza Altın İşletmeleri A.Ş. Volume 8 - Page 11
VO/SH KozaGold_2014Audit_Vol08_Economics_173600.130_005_SH January 31, 2015
2.4 Cash flow Projections
Consolidated Operations 2.4.1
The base case economic analysis results, shown in Table 2.4.1.1, indicate a post-tax NPV of
US$1,391.8 million at a 5% discount rate based on reserves. The SRK LoM plan and economics are
based on the following:
Proven and probable reserves only;
An overall project life of 15 years;
An overall average metallurgical recovery rate of 85% Au and 72% Ag, over the LoM;
LoM operating cost of US$30.28/t-processed, or US$510.22/oz-Au (net Ag production);
LoM capital costs of US$382.2 million;
20% tax rate; and
No allowance for salvage value is assumed in the analysis.
Table 2.4.1.1: LoM Technical-Economic Model Results (US$000’s)
Description Value US$/t-milled US$/oz-Au Net Revenue Gold 4,428,660 Silver 27,392 Net Revenue $4,456,051 Refinery (7,086) Community Charge (5,102) NSR $4,443,864 $74.11 $1,254.29 Royalties - Ovacik Private (1,380) Mastra MTA (149) Government (44,287) Net Revenue $4,398,048 $73.35 $1,241.36 Operating Costs Mastra Unit 58,220 Ovacik Unit 964,736 Himmetdede Unit 240,316 Mollakara Unit 136,903 Kaymaz Unit 160,278 Akbaştepe Unit 255,513 Environmental Cost 0 Operating Cost $1,815,967 $30.29 $512.56 Operating Margin $2,582,081 $43.06 $728.80 Capital Costs Mastra Unit 16,151 Ovacik Unit 68,497 Himmetdede Unit 22,973 Mollakara Unit 105,109 Kaymaz Unit 39,319 Akbaştepe Unit 130,008 Koza HQ 777 Capital Cost $382,834 Income Tax $363,653 Cash Flow $1,835,594 NPV $1,377,905 5%

SRK Consulting (U.S.), Inc. Audit 2014 - Koza Altın İşletmeleri A.Ş. Volume 8 - Page 12
VO/SH KozaGold_2014Audit_Vol08_Economics_173600.130_005_SH January 31, 2015
Project sensitivity, shown in Table 2.4.1.2, indicates the project is most sensitive to price followed to
a lesser extent by operating costs. This conclusion is reasonable given the maturity of the project
even with the new open pits and heap leach operations contributing the majority of the capital
expenditures. Project sensitivity is presented in Figure 2.4.1.1.
Table 2.4.1.2: Project Sensitivity
NPV 5% -15% -10% -5% Base +5% +10% +15%Revenues 976,120 1,110,148 1,244,078 1,377,905 1,511,692 1,645,459 1,779,205 Capital Costs 1,406,102 1,396,711 1,387,310 1,377,905 1,368,492 1,359,050 1,349,579 Operating Costs 1,543,250 1,488,142 1,433,026 1,377,905 1,322,779 1,267,637 1,212,472
Figure 2.4.1.1: Project Sensitivities
0
500,000
1,000,000
1,500,000
2,000,000
2,500,000
‐25% ‐20% ‐15% ‐10% ‐5% Base 5% 10% 15% 20% 25%
NPV @
5% U
S$(000)
Sensitivities: NPV @ 5%
Revenues Capital Costs Operating Costs

SRK Consulting (U.S.), Inc. Audit 2014 - Koza Altın İşletmeleri A.Ş. Volume 8 - Page 13
VO/SH KozaGold_2014Audit_Vol08_Economics_173600.130_005_SH January 31, 2015
Table 2.4.1.3: LoM Technical-Economic Model Results (US$000’s)
Production Summary Units Total or Avg. 2015 2016 2017 2018 2019 2020 2021 2022 2023 2024 2025 2026 2027 2028 2029 2030 2031 Ore Milled Mastra Unit kt 758 280 451 0 27 0 0 0 0 0 0 0 0 0 0 0 0 0 Ovacik Unit kt 13,278 864 864 864 864 864 864 864 864 864 864 864 864 864 864 864 318 0 Kaymaz Unit kt 3,039 907 907 830 395 0 0 0 0 0 0 0 0 0 0 0 0 0 Himmetdede Unit kt 26,109 3,078 5,961 6,000 6,000 4,516 554 0 0 0 0 0 0 0 0 0 0 0 Mollakara Unit kt 14,916 0 0 0 0 2,825 5,573 6,000 518 0 0 0 0 0 0 0 0 0 Akbaştepe Unit kt 1,859 0 0 0 0 180 360 360 360 360 239 0 0 0 0 0 0 0 Total Milled kt 59,959 5,130 8,183 7,694 7,286 8,384 7,351 7,224 1,742 1,224 1,103 864 864 864 864 864 318 0 Gold Recovered Mastra Unit koz 75 41 30 0 3 0 0 0 0 0 0 0 0 0 0 0 0 0 Ovacik Unit koz 1,658 125 132 104 124 134 137 143 131 142 90 105 117 60 49 49 18 0 Kaymaz Unit koz 385 80 109 141 56 0 0 0 0 0 0 0 0 0 0 0 0 0 Himmetdede Unit koz 446 58 110 93 95 75 15 0 0 0 0 0 0 0 0 0 0 0 Mollakara Unit koz 243 0 0 0 0 34 97 100 12 0 0 0 0 0 0 0 0 0 Akbaştepe Unit koz 736 0 0 0 0 88 137 120 152 158 80 0 0 0 0 0 0 0 Total koz 3,543 304 381 337 278 330 386 363 295 300 171 105 117 60 49 49 18 0 Silver Recovered Mastra Unit koz 84 40 42 0 2 0 0 0 0 0 0 0 0 0 0 0 0 0 Ovacik Unit koz 847 68 42 41 32 35 34 36 30 33 171 142 68 36 33 34 12 0 Kaymaz Unit koz 386 101 110 127 48 0 0 0 0 0 0 0 0 0 0 0 0 0 Himmetdede Unit koz - 0 0 0 0 0 0 0 0 0 0 0 0 0 0 0 0 0 Mollakara Unit koz 10 0 0 0 0 2 4 4 0 0 0 0 0 0 0 0 0 0 Akbaştepe Unit koz 43 0 0 0 0 6 10 8 8 8 3 0 0 0 0 0 0 0 Total koz 1,370 209 193 169 82 43 48 48 38 41 174 142 68 36 33 34 12 0 Cash Flow Schedule Market Price Gold - $1,250 $1,250 $1,250 $1,250 $1,250 $1,250 $1,250 $1,250 $1,250 $1,250 $1,250 $1,250 $1,250 $1,250 $1,250 $1,250 $1,250 Market Price Silver - $20 $20 $20 $20 $20 $20 $20 $20 $20 $20 $20 $20 $20 $20 $20 $20 $20 Gross Revenue Gold 000s 4,428,660 379,860 476,009 421,671 348,112 412,712 482,437 454,289 369,055 375,145 213,423 130,963 145,760 74,797 60,645 60,665 23,116 0 Silver 000s 27,392 4,179 3,862 3,372 1,639 869 965 953 761 825 3,477 2,836 1,361 719 653 684 238 0 Gross Revenue 000s 4,456,051 384,039 479,871 425,042 349,751 413,581 483,403 455,242 369,815 375,970 216,900 133,799 147,121 75,516 61,298 61,349 23,355 0 Refinery Refinery 000s (7,086) (608) (762) (675) (557) (660) (772) (727) (590) (600) (341) (210) (233) (120) (97) (97) (37) 0 Community Charge 000s (5,102) (438) (548) (486) (401) (475) (556) (523) (425) (432) (246) (151) (168) (86) (70) (70) (27) 0 Transportation 000s - 0 0 0 0 0 0 0 0 0 0 0 0 0 0 0 0 0 Refinery 000s (12,188) (1,045) (1,310) (1,160) (958) (1,136) (1,328) (1,250) (1,016) (1,032) (587) (360) (401) (206) (167) (167) (64) 0 NSR 000s 4,443,864 382,994 478,561 423,882 348,793 412,445 482,075 453,992 368,800 374,938 216,312 133,439 146,720 75,310 61,131 61,182 23,291 0 Royalty - Ovacik Private 000s (1,380) (104) (109) (87) (103) (111) (114) (119) (109) (118) (75) (87) (97) (50) (40) (40) (15) 0 Mastra MTA 000s (149) (82) (61) 0 (7) 0 0 0 0 0 0 0 0 0 0 0 0 0 Government 000s (44,287) (3,799) (4,760) (4,217) (3,481) (4,127) (4,824) (4,543) (3,691) (3,751) (2,134) (1,310) (1,458) (748) (606) (607) (231) 0 Total Royalty 000s (45,816) (3,984) (4,930) (4,303) (3,591) (4,238) (4,938) (4,662) (3,799) (3,870) (2,210) (1,397) (1,555) (798) (647) (647) (247) 0 Net Revenue 000s 4,398,048 379,009 473,631 419,579 345,202 408,207 477,137 449,330 365,000 371,068 214,103 132,042 145,165 74,512 60,484 60,535 23,044 0 Operating Costs - Mastra Unit 000s 58,220 25,857 28,172 2,705 1,487 0 0 0 0 0 0 0 0 0 0 0 0 0 Ovacik Unit 000s 964,736 64,047 54,774 61,669 80,923 82,031 88,050 75,422 69,672 67,764 83,926 62,416 53,084 36,816 35,585 35,290 13,270 0 Kaymaz Unit 000s 160,278 55,554 51,223 40,129 13,372 0 0 0 0 0 0 0 0 0 0 0 0 0 Himmetdede Unit 000s 240,316 33,888 52,531 51,547 51,238 44,763 6,348 0 0 0 0 0 0 0 0 0 0 0 Mollakara Unit 000s 136,903 0 0 0 0 36,874 51,498 45,373 3,157 0 0 0 0 0 0 0 0 0 Akbaştepe Unit 000s 255,513 0 0 0 7,971 30,169 48,422 47,542 46,973 46,719 27,717 0 0 0 0 0 0 0 Operating Costs 000s 1,815,967 179,347 186,699 156,049 154,991 193,837 194,318 168,337 119,803 114,483 111,643 62,416 53,084 36,816 35,585 35,290 13,270 0 $/t-milled 30.29 $34.96 $22.81 $20.28 $21.27 $23.12 $26.44 $23.30 $68.76 $93.53 $101.22 $72.24 $61.44 $42.61 $41.19 $40.84 $41.74 $0.00 EBITDA 000s 2,582,081 199,662 286,932 263,530 190,211 214,369 282,819 280,993 245,198 256,585 102,460 69,626 92,082 37,696 24,899 25,245 9,774 0 Cash Available for Debt Service - Operating Margin 000s 2,582,081 199,662 286,932 263,530 190,211 214,369 282,819 280,993 245,198 256,585 102,460 69,626 92,082 37,696 24,899 25,245 9,774 0 Project Capital (Equity) 000s (382,834) (14,722) (7,494) (70,966) (155,560) (35,215) (23,908) (21,744) (22,418) (15,656) (7,020) (2,772) (2,120) (885) (602) (600) (588) (564) Income Tax 000s (363,653) (35,341) (54,061) (31,884) (3,427) - (42,914) (46,924) (39,954) (44,326) (16,721) (12,379) (17,388) (7,051) (4,691) (4,799) (1,792) - Working Capital 000s - (3,387) 734 101 462 (2,133) 903 1,030 272 156 875 (54) 332 223 (152) 87 550 - CF Avail. for Debt Service 000s 1,835,594 146,213 226,111 160,781 31,686 177,022 216,900 213,354 183,097 196,759 79,594 54,421 72,907 29,983 19,454 19,933 7,944 (564) Loan Repayment 000s - 0 0 0 0 0 0 0 0 0 0 0 0 0 0 0 0 0 Interest Expense 000s - 0 0 0 0 0 0 0 0 0 0 0 0 0 0 0 0 0
Free Cash Flow 000s 1,835,594 146,213 226,111 160,781 31,686 177,022 216,900 213,354 183,097 196,759 79,594 54,421 72,907 29,983 19,454 19,933 7,944 (564) Present Value 000s 1,377,905 139,990 206,593 140,004 26,940 138,562 162,741 152,016 124,155 126,941 49,135 31,707 40,451 15,939 9,783 9,526 3,665 (244)
SRK Consulting (U.S.), Inc. Audit 2014 - Koza Altın İşletmeleri A.Ş. Volume 8 - Page 14
VO/SH KozaGold_2014Audit_Vol08_Economics_173600.130_005_SH January 31, 2015
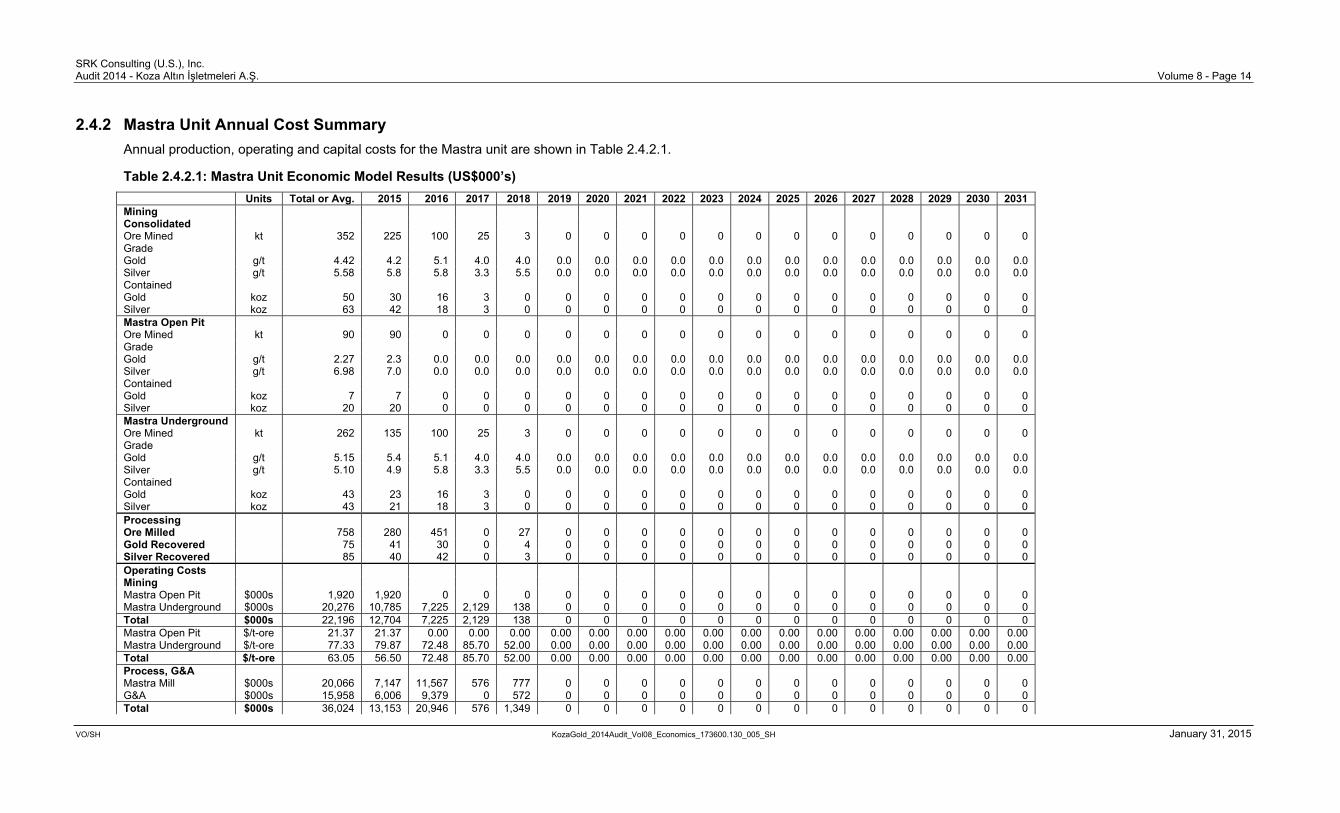
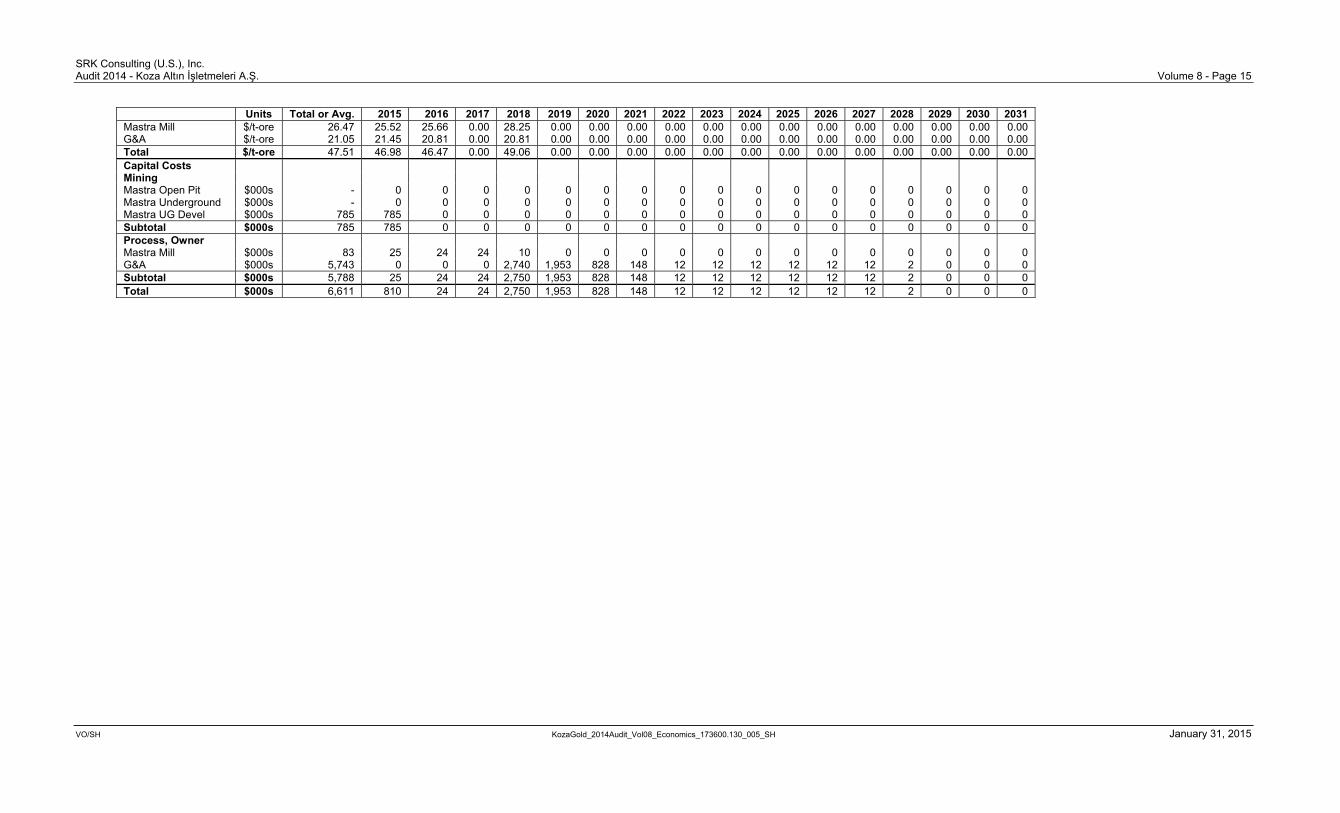
Mastra Unit Annual Cost Summary 2.4.2
Annual production, operating and capital costs for the Mastra unit are shown in Table 2.4.2.1.
Table 2.4.2.1: Mastra Unit Economic Model Results (US$000’s)
Units Total or Avg. 2015 2016 2017 2018 2019 2020 2021 2022 2023 2024 2025 2026 2027 2028 2029 2030 2031 Mining Consolidated Ore Mined kt 352 225 100 25 3 0 0 0 0 0 0 0 0 0 0 0 0 0 Grade Gold g/t 4.42 4.2 5.1 4.0 4.0 0.0 0.0 0.0 0.0 0.0 0.0 0.0 0.0 0.0 0.0 0.0 0.0 0.0 Silver g/t 5.58 5.8 5.8 3.3 5.5 0.0 0.0 0.0 0.0 0.0 0.0 0.0 0.0 0.0 0.0 0.0 0.0 0.0 Contained Gold koz 50 30 16 3 0 0 0 0 0 0 0 0 0 0 0 0 0 0 Silver koz 63 42 18 3 0 0 0 0 0 0 0 0 0 0 0 0 0 0 Mastra Open Pit Ore Mined kt 90 90 0 0 0 0 0 0 0 0 0 0 0 0 0 0 0 0 Grade Gold g/t 2.27 2.3 0.0 0.0 0.0 0.0 0.0 0.0 0.0 0.0 0.0 0.0 0.0 0.0 0.0 0.0 0.0 0.0 Silver g/t 6.98 7.0 0.0 0.0 0.0 0.0 0.0 0.0 0.0 0.0 0.0 0.0 0.0 0.0 0.0 0.0 0.0 0.0 Contained Gold koz 7 7 0 0 0 0 0 0 0 0 0 0 0 0 0 0 0 0 Silver koz 20 20 0 0 0 0 0 0 0 0 0 0 0 0 0 0 0 0 Mastra Underground Ore Mined kt 262 135 100 25 3 0 0 0 0 0 0 0 0 0 0 0 0 0 Grade Gold g/t 5.15 5.4 5.1 4.0 4.0 0.0 0.0 0.0 0.0 0.0 0.0 0.0 0.0 0.0 0.0 0.0 0.0 0.0 Silver g/t 5.10 4.9 5.8 3.3 5.5 0.0 0.0 0.0 0.0 0.0 0.0 0.0 0.0 0.0 0.0 0.0 0.0 0.0 Contained Gold koz 43 23 16 3 0 0 0 0 0 0 0 0 0 0 0 0 0 0 Silver koz 43 21 18 3 0 0 0 0 0 0 0 0 0 0 0 0 0 0 Processing Ore Milled 758 280 451 0 27 0 0 0 0 0 0 0 0 0 0 0 0 0 Gold Recovered 75 41 30 0 4 0 0 0 0 0 0 0 0 0 0 0 0 0 Silver Recovered 85 40 42 0 3 0 0 0 0 0 0 0 0 0 0 0 0 0 Operating Costs Mining Mastra Open Pit $000s 1,920 1,920 0 0 0 0 0 0 0 0 0 0 0 0 0 0 0 0 Mastra Underground $000s 20,276 10,785 7,225 2,129 138 0 0 0 0 0 0 0 0 0 0 0 0 0 Total $000s 22,196 12,704 7,225 2,129 138 0 0 0 0 0 0 0 0 0 0 0 0 0 Mastra Open Pit $/t-ore 21.37 21.37 0.00 0.00 0.00 0.00 0.00 0.00 0.00 0.00 0.00 0.00 0.00 0.00 0.00 0.00 0.00 0.00 Mastra Underground $/t-ore 77.33 79.87 72.48 85.70 52.00 0.00 0.00 0.00 0.00 0.00 0.00 0.00 0.00 0.00 0.00 0.00 0.00 0.00 Total $/t-ore 63.05 56.50 72.48 85.70 52.00 0.00 0.00 0.00 0.00 0.00 0.00 0.00 0.00 0.00 0.00 0.00 0.00 0.00 Process, G&A Mastra Mill $000s 20,066 7,147 11,567 576 777 0 0 0 0 0 0 0 0 0 0 0 0 0 G&A $000s 15,958 6,006 9,379 0 572 0 0 0 0 0 0 0 0 0 0 0 0 0 Total $000s 36,024 13,153 20,946 576 1,349 0 0 0 0 0 0 0 0 0 0 0 0 0
SRK Consulting (U.S.), Inc. Audit 2014 - Koza Altın İşletmeleri A.Ş. Volume 8 - Page 15
VO/SH KozaGold_2014Audit_Vol08_Economics_173600.130_005_SH January 31, 2015
Units Total or Avg. 2015 2016 2017 2018 2019 2020 2021 2022 2023 2024 2025 2026 2027 2028 2029 2030 2031 Mastra Mill $/t-ore 26.47 25.52 25.66 0.00 28.25 0.00 0.00 0.00 0.00 0.00 0.00 0.00 0.00 0.00 0.00 0.00 0.00 0.00 G&A $/t-ore 21.05 21.45 20.81 0.00 20.81 0.00 0.00 0.00 0.00 0.00 0.00 0.00 0.00 0.00 0.00 0.00 0.00 0.00 Total $/t-ore 47.51 46.98 46.47 0.00 49.06 0.00 0.00 0.00 0.00 0.00 0.00 0.00 0.00 0.00 0.00 0.00 0.00 0.00 Capital Costs Mining Mastra Open Pit $000s - 0 0 0 0 0 0 0 0 0 0 0 0 0 0 0 0 0 Mastra Underground $000s - 0 0 0 0 0 0 0 0 0 0 0 0 0 0 0 0 0 Mastra UG Devel $000s 785 785 0 0 0 0 0 0 0 0 0 0 0 0 0 0 0 0 Subtotal $000s 785 785 0 0 0 0 0 0 0 0 0 0 0 0 0 0 0 0 Process, Owner Mastra Mill $000s 83 25 24 24 10 0 0 0 0 0 0 0 0 0 0 0 0 0 G&A $000s 5,743 0 0 0 2,740 1,953 828 148 12 12 12 12 12 12 2 0 0 0 Subtotal $000s 5,788 25 24 24 2,750 1,953 828 148 12 12 12 12 12 12 2 0 0 0 Total $000s 6,611 810 24 24 2,750 1,953 828 148 12 12 12 12 12 12 2 0 0 0

SRK Consulting (U.S.), Inc. Audit 2014 - Koza Altın İşletmeleri A.Ş. Volume 8 - Page 16
VO/SH KozaGold_2014Audit_Vol08_Economics_173600.130_005_SH January 31, 2015
Ovacık Unit Annual Cost Summary 2.4.3
Annual production, operating and capital costs for the Ovacık unit are shown in Table 2.4.3.1.
Table 2.4.3.1: LoM Ovacık Unit Economic Model Results (US$000’s)
Units Total or Avg. 2015 2016 2017 2018 2019 2020 2021 2022 2023 2024 2025 2026 2027 2028 2029 2030 2031 Mining Consolidated Ore Mined kt 11,560 939 378 640 1,539 737 1,065 951 787 806 1,733 729 528 243 199 210 75 0 Grade Gold g/t 4.35 4.6 4.8 4.5 4.5 5.0 4.9 4.8 4.1 4.9 3.3 4.5 4.2 3.3 3.4 3.3 3.6 0.0 Silver g/t 2.51 1.5 1.6 1.7 1.5 1.7 1.6 1.5 1.3 1.5 8.4 1.5 1.2 1.2 0.8 1.3 1.1 0.0 Contained Gold koz 1,617 140 58 93 223 119 169 148 104 126 182 105 71 26 22 22 9 0 Silver koz 932 46 19 34 72 41 54 45 33 39 467 35 20 9 5 9 3 0 Ovacik Underground Ore Mined kt 227 68 26 26 23 35 30 19 0 0 0 0 0 0 0 0 0 0 Grade Gold g/t 4.92 6.0 5.8 4.0 5.9 4.4 3.1 3.6 0.0 0.0 0.0 0.0 0.0 0.0 0.0 0.0 0.0 0.0 Silver g/t 2.79 2.1 2.8 2.9 5.3 4.1 1.5 1.7 0.0 0.0 0.0 0.0 0.0 0.0 0.0 0.0 0.0 0.0 Contained Gold koz 36 13 5 3 4 5 3 2 0 0 0 0 0 0 0 0 0 0 Silver koz 20 4 2 2 4 5 1 1 0 0 0 0 0 0 0 0 0 0 Kubaşlar Open Pit Ore Mined kt 927 0 0 0 0 0 0 0 0 0 927 0 0 0 0 0 0 0 Grade Gold g/t 2.31 0.0 0.0 0.0 0.0 0.0 0.0 0.0 0.0 0.0 2.3 0.0 0.0 0.0 0.0 0.0 0.0 0.0 Silver g/t 14.53 0.0 0.0 0.0 0.0 0.0 0.0 0.0 0.0 0.0 14.5 0.0 0.0 0.0 0.0 0.0 0.0 0.0 Contained Gold koz 69 0 0 0 0 0 0 0 0 0 69 0 0 0 0 0 0 0 Silver koz 433 0 0 0 0 0 0 0 0 0 433 0 0 0 0 0 0 0 Çukuralan Open Pit Ore Mined kt 2,614 639 138 374 955 54 263 191 0 0 0 0 0 0 0 0 0 0 Grade Gold g/t 4.49 4.6 4.6 3.8 4.3 3.9 5.5 5.3 0.0 0.0 0.0 0.0 0.0 0.0 0.0 0.0 0.0 0.0 Silver g/t 1.41 1.4 1.3 1.4 1.1 1.1 2.2 2.2 0.0 0.0 0.0 0.0 0.0 0.0 0.0 0.0 0.0 0.0 Contained Gold koz 377 94 20 46 132 7 47 32 0 0 0 0 0 0 0 0 0 0 Silver koz 118 28 6 17 34 2 18 14 0 0 0 0 0 0 0 0 0 0 Çukuralan Underground Ore Mined kt 7,793 232 214 240 561 648 773 742 787 806 807 729 528 243 199 210 75 0 Grade Gold g/t 4.53 4.4 4.8 5.7 4.8 5.1 4.8 4.7 4.1 4.9 4.4 4.5 4.2 3.3 3.4 3.3 3.6 0.0 Silver g/t 1.44 1.7 1.6 2.0 1.9 1.7 1.4 1.3 1.3 1.5 1.3 1.5 1.2 1.2 0.8 1.3 1.1 0.0 Contained Gold koz 1,135 33 33 44 87 107 119 113 104 126 114 105 71 26 22 22 9 0

SRK Consulting (U.S.), Inc. Audit 2014 - Koza Altın İşletmeleri A.Ş. Volume 8 - Page 17
VO/SH KozaGold_2014Audit_Vol08_Economics_173600.130_005_SH January 31, 2015
Units Total or Avg. 2015 2016 2017 2018 2019 2020 2021 2022 2023 2024 2025 2026 2027 2028 2029 2030 2031 Silver koz 360 13 11 15 34 35 35 30 33 39 34 35 20 9 5 9 3 0 Çoraklik Tepe Open Pit Ore Mined kt - 0 0 0 0 0 0 0 0 0 0 0 0 0 0 0 0 0 Grade Gold g/t - 0.0 0.0 0.0 0.0 0.0 0.0 0.0 0.0 0.0 0.0 0.0 0.0 0.0 0.0 0.0 0.0 0.0 Silver g/t - 0.0 0.0 0.0 0.0 0.0 0.0 0.0 0.0 0.0 0.0 0.0 0.0 0.0 0.0 0.0 0.0 0.0 Contained Gold koz - 0 0 0 0 0 0 0 0 0 0 0 0 0 0 0 0 0 Silver koz - 0 0 0 0 0 0 0 0 0 0 0 0 0 0 0 0 0 Processing Ore Milled kt 13,278 864 864 864 864 864 864 864 864 864 864 864 864 864 864 864 318 0 Gold Recovered koz 1,658 125 132 104 124 134 137 143 131 142 90 105 117 60 49 49 18 0 Silver Recovered koz 847 68 42 41 32 35 34 36 30 33 171 142 68 36 33 34 12 0 Operating Costs Mining Ovacik Underground $000s 14,675 4,656 1,585 1,593 1,520 2,138 1,971 1,211 0 0 0 0 0 0 0 0 0 0 Kubaşlar Open Pit $000s 6,889 0 0 0 0 0 0 0 0 0 6,889 0 0 0 0 0 0 0 Çukuralan Open Pit $000s 104,611 16,190 14,769 17,864 16,296 17,001 16,631 5,859 0 0 0 0 0 0 0 0 0 0 Çukuralan Underground $000s 360,728 11,249 10,623 12,322 25,997 32,296 36,185 35,911 38,393 36,333 35,409 31,606 23,880 9,894 9,012 8,626 2,993 0 Çoraklik Tepe Open Pit $000s - 0 0 0 0 0 0 0 0 0 0 0 0 0 0 0 0 0 Total $000s 486,903 32,095 26,977 31,778 43,813 51,436 54,787 42,981 38,393 36,333 42,298 31,606 23,880 9,894 9,012 8,626 2,993 0 Ovacik Underground $/t-ore 64.68 68.77 60.99 60.65 65.38 60.68 66.71 64.17 0.00 0.00 0.00 0.00 0.00 0.00 0.00 0.00 0.00 0.00 Kubaşlar Open Pit $/t-ore 7.43 0.00 0.00 0.00 0.00 0.00 0.00 0.00 0.00 0.00 7.43 0.00 0.00 0.00 0.00 0.00 0.00 0.00 Çukuralan Open Pit $/t-ore 40.03 25.34 106.87 47.76 17.07 316.01 63.34 30.67 0.00 0.00 0.00 0.00 0.00 0.00 0.00 0.00 0.00 0.00 Çukuralan Underground $/t-ore 46.29 48.39 49.68 51.40 46.32 49.84 46.83 48.43 48.76 45.06 43.90 43.37 45.23 40.78 45.29 41.00 40.01 0.00 Çoraklik Tepe Open Pit $/t-ore - 0.00 0.00 0.00 0.00 0.00 0.00 0.00 0.00 0.00 0.00 0.00 0.00 0.00 0.00 0.00 0.00 0.00 Total Process, G&A $/t-ore 42.12 34.17 71.36 49.65 28.46 69.79 51.45 45.17 48.76 45.06 24.40 43.37 45.23 40.78 45.29 41.00 40.01 0.00 Ovacik Mill $000s 144,054 9,342 9,342 9,342 9,342 9,342 9,342 9,342 9,342 9,342 9,342 9,342 9,342 9,342 9,342 9,342 3,924 0 G&A $000s 333,780 22,610 18,455 20,548 27,767 21,253 23,920 23,099 21,937 22,089 32,286 21,468 19,862 17,580 17,230 17,322 6,353 0 Total $000s 477,834 31,952 27,797 29,890 37,109 30,595 33,262 32,441 31,279 31,431 41,628 30,810 29,204 26,922 26,572 26,664 10,277 0 Ovacik Mill $/t-ore 10.85 10.81 10.81 10.81 10.81 10.81 10.81 10.81 10.81 10.81 10.81 10.81 10.81 10.81 10.81 10.81 12.34 0.00 G&A $/t-ore 25.14 26.17 21.36 23.78 32.14 24.60 27.69 26.73 25.39 25.57 37.37 24.85 22.99 20.35 19.94 20.05 19.98 0.00 Total $/t-ore 35.99 36.98 32.17 34.60 42.95 35.41 38.50 37.55 36.20 36.38 48.18 35.66 33.80 31.16 30.76 30.86 32.32 0.00 Capital Costs Mining Ovacik Underground $000s - 0 0 0 0 0 0 0 0 0 0 0 0 0 0 0 0 0 Ovacik UG Develop. $000s 386 0 0 0 0 0 386 0 0 0 0 0 0 0 0 0 0 0 Kukudere Open Pit $000s - 0 0 0 0 0 0 0 0 0 0 0 0 0 0 0 0 0 Çukuralan Open Pit $000s - 0 0 0 0 0 0 0 0 0 0 0 0 0 0 0 0 0 Çukuralan Underground $000s - 0 0 0 0 0 0 0 0 0 0 0 0 0 0 0 0 0 Çukuralan UG Develop. $000s 32,914 598 911 3,720 2,133 5,171 4,397 5,443 4,854 2,556 1,354 1,344 432 0 0 0 0 0 Çoraklik Tepe OP Initial $000s - 0 0 0 0 0 0 0 0 0 0 0 0 0 0 0 0 0 subtotal $000s 33,300 598 911 3,720 2,133 5,171 4,784 5,443 4,854 2,556 1,354 1,344 432 0 0 0 0 0 Process, Owner Ovacik Mill $000s 16,711 552 1,197 7,234 552 552 552 552 552 552 552 552 552 552 552 552 552 552 G&A $000s 18,486 0 0 734 24 24 24 3,762 7,500 3,221 816 852 1,112 309 36 36 24 12 Subtotal $000s 35,197 552 1,197 7,968 576 576 576 4,314 8,052 3,773 1,368 1,404 1,664 861 588 588 576 564 Total $000s 68,497 1,150 2,108 11,688 2,709 5,747 5,360 9,757 12,906 6,329 2,722 2,748 2,096 861 588 588 576 564

SRK Consulting (U.S.), Inc. Audit 2014 - Koza Altın İşletmeleri A.Ş. Volume 8 - Page 18
VO/SH KozaGold_2014Audit_Vol08_Economics_173600.130_005_SH January 31, 2015
Kaymaz Unit Annual Cost Summary 2.4.4
Annual production, operating and capital costs for the Kaymaz unit are shown in Table 2.4.4.1.
Table 2.4.4.1: Kaymaz Unit Economic Model Results (US$000’s)
Units Total or Avg. 2015 2016 2017 2018 2019 2020 2021 2022 2023 2024 2025 2026 2027 2028 2029 2030 2031 Mining Consolidated Ore Mined kt 2,972 1,006 1,044 544 378 0 0 0 0 0 0 0 0 0 0 0 0 0 Grade Gold g/t 4.62 3.2 4.6 7.1 5.0 0.0 0.0 0.0 0.0 0.0 0.0 0.0 0.0 0.0 0.0 0.0 0.0 0.0 Silver g/t 5.32 4.6 5.1 7.4 5.0 0.0 0.0 0.0 0.0 0.0 0.0 0.0 0.0 0.0 0.0 0.0 0.0 0.0 Contained Gold koz 441.0 102 153 125 61 0 0 0 0 0 0 0 0 0 0 0 0 0 Silver koz 508.2 149 170 129 61 0 0 0 0 0 0 0 0 0 0 0 0 0 Kaymaz Open Pit Ore Mined kt 2,972 1,006 1,044 544 378 0 0 0 0 0 0 0 0 0 0 0 0 0 Grade Gold g/t 4.62 3.2 4.6 7.1 5.0 0.0 0.0 0.0 0.0 0.0 0.0 0.0 0.0 0.0 0.0 0.0 0.0 0.0 Silver g/t 5.32 4.6 5.1 7.4 5.0 0.0 0.0 0.0 0.0 0.0 0.0 0.0 0.0 0.0 0.0 0.0 0.0 0.0 Contained Gold koz 441 102 153 125 61 0 0 0 0 0 0 0 0 0 0 0 0 0 Silver koz 508 149 170 129 61 0 0 0 0 0 0 0 0 0 0 0 0 0 Processing Ore Milled kt 3,039 907 907 830 395 0 0 0 0 0 0 0 0 0 0 0 0 0 Gold Recovered koz 385 80 109 141 56 0 0 0 0 0 0 0 0 0 0 0 0 0 Silver Recovered koz 386 101 110 127 48 0 0 0 0 0 0 0 0 0 0 0 0 0 Operating Costs Mining Kaymaz Open Pit $000s 72,194 29,323 24,991 16,004 1,876 0 0 0 0 0 0 0 0 0 0 0 0 0 Akbaştepe Open Pit $000s - 0 0 0 0 0 0 0 0 0 0 0 0 0 0 0 0 0 Total $000s 72,194 29,323 24,991 16,004 1,876 0 0 0 0 0 0 0 0 0 0 0 0 0 Kaymaz Open Pit $/t-ore 24.29 29.16 23.94 29.39 4.96 0.00 0.00 0.00 0.00 0.00 0.00 0.00 0.00 0.00 0.00 0.00 0.00 0.00 Akbaştepe Open Pit $/t-ore - 0.00 0.00 0.00 0.00 0.00 0.00 0.00 0.00 0.00 0.00 0.00 0.00 0.00 0.00 0.00 0.00 0.00 Total $/t-ore 24.29 29.16 23.94 29.39 4.96 0.00 0.00 0.00 0.00 0.00 0.00 0.00 0.00 0.00 0.00 0.00 0.00 0.00 Process, G&A Kaymaz Mill $000s 60,730 18,067 18,067 16,651 7,945 0 0 0 0 0 0 0 0 0 0 0 0 0 G&A $000s 27,355 8,165 8,165 7,474 3,551 0 0 0 0 0 0 0 0 0 0 0 0 0 Total $000s 88,084 26,232 26,232 24,125 11,496 0 0 0 0 0 0 0 0 0 0 0 0 0 Kaymaz Mill $/t-ore 19.98 19.91 19.91 20.05 20.14 0.00 0.00 0.00 0.00 0.00 0.00 0.00 0.00 0.00 0.00 0.00 0.00 0.00 G&A $/t-ore 9.00 9.00 9.00 9.00 9.00 0.00 0.00 0.00 0.00 0.00 0.00 0.00 0.00 0.00 0.00 0.00 0.00 0.00 Total $/t-ore 28.98 28.91 28.91 29.05 29.14 0.00 0.00 0.00 0.00 0.00 0.00 0.00 0.00 0.00 0.00 0.00 0.00 0.00 Capital Costs Mining Kaymaz Open Pit $000s 222 222 0 0 0 0 0 0 0 0 0 0 0 0 0 0 0 0 Söğüt Open Pit $000s - 0 0 0 0 0 0 0 0 0 0 0 0 0 0 0 0 0 Subtotal $000s 222 222 0 0 0 0 0 0 0 0 0 0 0 0 0 0 0 0 Process, Owner Mastra Mill $000s 1,866 0 326 420 420 420 280 0 0 0 0 0 0 0 0 0 0 0 G&A $000s 37,231 0 707 707 5,639 5,639 5,681 5,328 5,328 5,328 2,802 12 12 12 12 12 12 0 Subtotal $000s 39,097 0 1,033 1,127 6,059 6,059 5,961 5,328 5,328 5,328 2,802 12 12 12 12 12 12 0 Total $000s 39,319 222 1,033 1,127 6,059 6,059 5,961 5,328 5,328 5,328 2,802 12 12 12 12 12 12 0

SRK Consulting (U.S.), Inc. Audit 2014 - Koza Altın İşletmeleri A.Ş. Volume 8 - Page 19
VO/SH KozaGold_2014Audit_Vol08_Economics_173600.130_005_SH January 31, 2015
Himmetdede Unit Annual Cost Summary 2.4.5
Annual production, operating and capital costs for the Himmetdede unit are shown in Table 2.4.5.1.
Table 2.4.5.1: Himmetdede Unit Economic Model Results (US$000’s)
Units Total or Avg. 2015 2016 2017 2018 2019 2020 2021 2022 2023 2024 2025 2026 2027 2028 2029 2030 2031 Mining Consolidated Ore Mined kt 26,077 3,046 6,038 5,941 6,034 4,464 554 0 0 0 0 0 0 0 0 0 0 0 Grade Gold g/t 0.74 0.9 0.8 0.7 0.7 0.7 0.9 0.0 0.0 0.0 0.0 0.0 0.0 0.0 0.0 0.0 0.0 0.0 Silver g/t - 0.0 0.0 0.0 0.0 0.0 0.0 0.0 0.0 0.0 0.0 0.0 0.0 0.0 0.0 0.0 0.0 0.0 Contained Gold koz 617.8 85 153 127 133 102 16 0 0 0 0 0 0 0 0 0 0 0 Silver koz - 0 0 0 0 0 0 0 0 0 0 0 0 0 0 0 0 0 Himmetdede Open Pit Ore Mined kt 26,077 3,046 6,038 5,941 6,034 4,464 554 0 0 0 0 0 0 0 0 0 0 0 Grade Gold g/t 0.74 0.9 0.8 0.7 0.7 0.7 0.9 0.0 0.0 0.0 0.0 0.0 0.0 0.0 0.0 0.0 0.0 0.0 Silver g/t - 0.0 0.0 0.0 0.0 0.0 0.0 0.0 0.0 0.0 0.0 0.0 0.0 0.0 0.0 0.0 0.0 0.0 Contained Gold koz 617.8 85 153 127 133 102 16 0 0 0 0 0 0 0 0 0 0 0 Silver koz - 0 0 0 0 0 0 0 0 0 0 0 0 0 0 0 0 0 Processing Ore Milled kt 26,109 3,078 5,961 6,000 6,000 4,516 554 0 0 0 0 0 0 0 0 0 0 0 Gold Recovered koz 446 62 109 93 95 75 11 0 0 0 0 0 0 0 0 0 0 0 Silver Recovered koz - 0 0 0 0 0 0 0 0 0 0 0 0 0 0 0 0 0 Operating Costs Mining Himmetdede Open Pit $000s 118,020 19,469 24,608 23,443 23,134 23,612 3,754 0 0 0 0 0 0 0 0 0 0 0 Total $000s 118,020 19,469 24,608 23,443 23,134 23,612 3,754 0 0 0 0 0 0 0 0 0 0 0 Himmetdede Open Pit $/t-ore 4.53 6.39 4.08 3.95 3.83 5.29 6.78 0.00 0.00 0.00 0.00 0.00 0.00 0.00 0.00 0.00 0.00 0.00 Total $/t-ore 4.53 6.39 4.08 3.95 3.83 5.29 6.78 0.00 0.00 0.00 0.00 0.00 0.00 0.00 0.00 0.00 0.00 0.00 Process, G&A Himmetdede Mill $000s 96,187 11,341 21,962 22,104 22,104 16,636 2,041 0 0 0 0 0 0 0 0 0 0 0 G&A $000s 26,109 3,078 5,961 6,000 6,000 4,516 554 0 0 0 0 0 0 0 0 0 0 0 Total $000s 122,296 14,419 27,923 28,104 28,104 21,151 2,595 0 0 0 0 0 0 0 0 0 0 0 Himmetdede Mill $/t-ore 3.68 3.68 3.68 3.68 3.68 3.68 0.00 0.00 0.00 0.00 0.00 0.00 0.00 0.00 0.00 0.00 0.00 0.00 G&A $/t-ore 1.00 1.00 1.00 1.00 1.00 1.00 0.00 0.00 0.00 0.00 0.00 0.00 0.00 0.00 0.00 0.00 0.00 0.00 Total $/t-ore 4.68 4.68 4.68 4.68 4.68 4.68 0.00 0.00 0.00 0.00 0.00 0.00 0.00 0.00 0.00 0.00 0.00 0.00 Capital Costs Mining Himmetdede OP $000s 761 401 270 90 0 0 0 0 0 0 0 0 0 0 0 0 0 0 Subtotal $000s 761 401 270 90 0 0 0 0 0 0 0 0 0 0 0 0 0 0 Process, Owner Himmetdede Mill $000s 13,708 2,154 3,616 4,344 2,112 1,368 114 0 0 0 0 0 0 0 0 0 0 0 G&A $000s 8,504 750 11 0 0 0 4,800 2,943 0 0 0 0 0 0 0 0 0 0 Subtotal $000s 22,212 2,904 3,627 4,344 2,112 1,368 4,914 2,943 0 0 0 0 0 0 0 0 0 0 Total $000s 22,973 3,305 3,897 4,434 2,112 1,368 4,914 2,943 0 0 0 0 0 0 0 0 0 0
SRK Consulting (U.S.), Inc. Audit 2014 - Koza Altın İşletmeleri A.Ş. Volume 8 - Page 20
VO/SH KozaGold_2014Audit_Vol08_Economics_173600.130_005_SH January 31, 2015
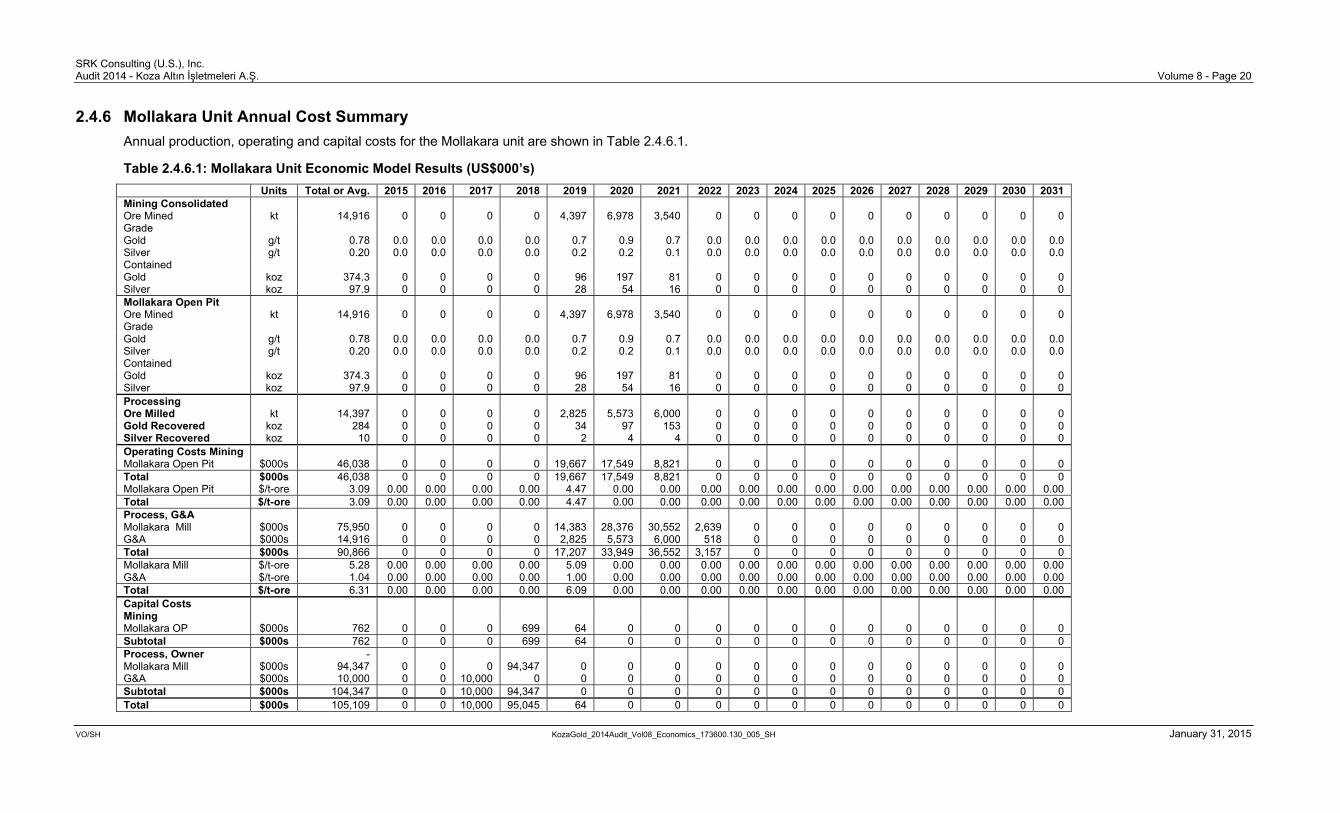
Mollakara Unit Annual Cost Summary 2.4.6
Annual production, operating and capital costs for the Mollakara unit are shown in Table 2.4.6.1.
Table 2.4.6.1: Mollakara Unit Economic Model Results (US$000’s)
Units Total or Avg. 2015 2016 2017 2018 2019 2020 2021 2022 2023 2024 2025 2026 2027 2028 2029 2030 2031 Mining Consolidated Ore Mined kt 14,916 0 0 0 0 4,397 6,978 3,540 0 0 0 0 0 0 0 0 0 0 Grade Gold g/t 0.78 0.0 0.0 0.0 0.0 0.7 0.9 0.7 0.0 0.0 0.0 0.0 0.0 0.0 0.0 0.0 0.0 0.0 Silver g/t 0.20 0.0 0.0 0.0 0.0 0.2 0.2 0.1 0.0 0.0 0.0 0.0 0.0 0.0 0.0 0.0 0.0 0.0 Contained Gold koz 374.3 0 0 0 0 96 197 81 0 0 0 0 0 0 0 0 0 0 Silver koz 97.9 0 0 0 0 28 54 16 0 0 0 0 0 0 0 0 0 0 Mollakara Open Pit Ore Mined kt 14,916 0 0 0 0 4,397 6,978 3,540 0 0 0 0 0 0 0 0 0 0 Grade Gold g/t 0.78 0.0 0.0 0.0 0.0 0.7 0.9 0.7 0.0 0.0 0.0 0.0 0.0 0.0 0.0 0.0 0.0 0.0 Silver g/t 0.20 0.0 0.0 0.0 0.0 0.2 0.2 0.1 0.0 0.0 0.0 0.0 0.0 0.0 0.0 0.0 0.0 0.0 Contained Gold koz 374.3 0 0 0 0 96 197 81 0 0 0 0 0 0 0 0 0 0 Silver koz 97.9 0 0 0 0 28 54 16 0 0 0 0 0 0 0 0 0 0 Processing Ore Milled kt 14,397 0 0 0 0 2,825 5,573 6,000 0 0 0 0 0 0 0 0 0 0 Gold Recovered koz 284 0 0 0 0 34 97 153 0 0 0 0 0 0 0 0 0 0 Silver Recovered koz 10 0 0 0 0 2 4 4 0 0 0 0 0 0 0 0 0 0 Operating Costs Mining Mollakara Open Pit $000s 46,038 0 0 0 0 19,667 17,549 8,821 0 0 0 0 0 0 0 0 0 0 Total $000s 46,038 0 0 0 0 19,667 17,549 8,821 0 0 0 0 0 0 0 0 0 0 Mollakara Open Pit $/t-ore 3.09 0.00 0.00 0.00 0.00 4.47 0.00 0.00 0.00 0.00 0.00 0.00 0.00 0.00 0.00 0.00 0.00 0.00 Total $/t-ore 3.09 0.00 0.00 0.00 0.00 4.47 0.00 0.00 0.00 0.00 0.00 0.00 0.00 0.00 0.00 0.00 0.00 0.00 Process, G&A Mollakara Mill $000s 75,950 0 0 0 0 14,383 28,376 30,552 2,639 0 0 0 0 0 0 0 0 0 G&A $000s 14,916 0 0 0 0 2,825 5,573 6,000 518 0 0 0 0 0 0 0 0 0 Total $000s 90,866 0 0 0 0 17,207 33,949 36,552 3,157 0 0 0 0 0 0 0 0 0 Mollakara Mill $/t-ore 5.28 0.00 0.00 0.00 0.00 5.09 0.00 0.00 0.00 0.00 0.00 0.00 0.00 0.00 0.00 0.00 0.00 0.00 G&A $/t-ore 1.04 0.00 0.00 0.00 0.00 1.00 0.00 0.00 0.00 0.00 0.00 0.00 0.00 0.00 0.00 0.00 0.00 0.00 Total $/t-ore 6.31 0.00 0.00 0.00 0.00 6.09 0.00 0.00 0.00 0.00 0.00 0.00 0.00 0.00 0.00 0.00 0.00 0.00 Capital Costs Mining Mollakara OP $000s 762 0 0 0 699 64 0 0 0 0 0 0 0 0 0 0 0 0 Subtotal $000s 762 0 0 0 699 64 0 0 0 0 0 0 0 0 0 0 0 0 Process, Owner - Mollakara Mill $000s 94,347 0 0 0 94,347 0 0 0 0 0 0 0 0 0 0 0 0 0 G&A $000s 10,000 0 0 10,000 0 0 0 0 0 0 0 0 0 0 0 0 0 0 Subtotal $000s 104,347 0 0 10,000 94,347 0 0 0 0 0 0 0 0 0 0 0 0 0 Total $000s 105,109 0 0 10,000 95,045 64 0 0 0 0 0 0 0 0 0 0 0 0

SRK Consulting (U.S.), Inc. Audit 2014 - Koza Altın İşletmeleri A.Ş. Volume 8 - Page 21
VO/SH KozaGold_2014Audit_Vol08_Economics_173600.130_005_SH January 31, 2015
Akbaştepe Unit Annual Cost Summary 2.4.7
Annual production, operating and capital costs for the Akbaştepe unit are shown in Table 2.4.7.1.
Table 2.4.7.1: Akbaştepe Unit Economic Model Results (US$000’s)
Units Total or Avg. 2015 2016 2017 2018 2019 2020 2021 2022 2023 2024 2025 2026 2027 2028 2029 2030 2031 Mining Consolidated Ore Mined kt 1,854 0 0 0 34 402 321 333 310 306 147 0 0 0 0 0 0 0 Grade Gold g/t 15.05 0.0 0.0 0.0 14.3 17.6 10.4 12.0 17.4 15.9 18.7 0.0 0.0 0.0 0.0 0.0 0.0 0.0 Silver g/t 0.96 0.0 0.0 0.0 1.6 1.4 0.9 0.8 0.9 0.9 0.6 0.0 0.0 0.0 0.0 0.0 0.0 0.0 Contained Gold koz 897.1 0 0 0 16 228 107 128 173 156 89 0 0 0 0 0 0 0 Silver koz 57.1 0 0 0 2 18 9 9 9 9 3 0 0 0 0 0 0 0 Akbaştepe Open Pit Ore Mined kt 347 0 0 0 34 312 0 0 0 0 0 0 0 0 0 0 0 0 Grade Gold g/t 19.36 0.0 0.0 0.0 14.3 19.9 0.0 0.0 0.0 0.0 0.0 0.0 0.0 0.0 0.0 0.0 0.0 0.0 Silver g/t 1.52 0.0 0.0 0.0 1.6 1.5 0.0 0.0 0.0 0.0 0.0 0.0 0.0 0.0 0.0 0.0 0.0 0.0 Contained Gold koz 215.7 0 0 0 16 200 0 0 0 0 0 0 0 0 0 0 0 0 Silver koz 16.9 0.00 0.00 0.00 1.73 15.16 0.00 0.00 0.00 0.00 0.00 0.00 0.00 0.00 0.00 0.00 0.00 0.00 Akbaştepe Underground Ore Mined kt 1,507.27 0 0 0 0 90 321 333 310 306 147 0 0 0 0 0 0 0 Grade Gold g/t 14.06 0.0 0.0 0.0 0.0 9.6 10.4 12.0 17.4 15.9 18.7 0.0 0.0 0.0 0.0 0.0 0.0 0.0 Silver g/t 0.83 0.0 0.0 0.0 0.0 0.9 0.9 0.8 0.9 0.9 0.6 0.0 0.0 0.0 0.0 0.0 0.0 0.0 Contained Gold koz 681.40 0 0 0 0 28 107 128 173 156 89 0 0 0 0 0 0 0 Silver koz 40.25 0 0 0 0 2 9 9 9 9 3 0 0 0 0 0 0 0 Processing Ore Milled kt 1,859 0 0 0 0 180 360 360 360 360 239 0 0 0 0 0 0 0 Gold Recovered koz 736 0 0 0 0 88 137 120 152 158 80 0 0 0 0 0 0 0 Silver Recovered koz 43 0 0 0 0 6 10 8 8 8 3 0 0 0 0 0 0 0 Operating Costs Mining Akbaştepe Open Pit $000s 15,420 0 0 0 7,971 7,449 0 0 0 0 0 0 0 0 0 0 0 0 Akbaştepe UG $000s 95,394 0 0 0 0 8,721 20,423 19,543 18,974 18,720 9,012 0 Total $000s 110,814 0 0 0 7,971 16,170 20,423 19,543 18,974 18,720 9,012 0 0 0 0 0 0 0 Akbaştepe Open Pit $/t-ore 8.29 0.00 0.00 0.00 232.17 23.86 0.00 0.00 0.00 0.00 0.00 0.00 0.00 0.00 0.00 0.00 0.00 0.00 Akbaştepe UG $/t-ore 51.31 0.00 0.00 0.00 0.00 96.88 63.63 58.66 61.25 61.11 61.29 0.00 0.00 0.00 0.00 0.00 0.00 0.00 Total $/t-ore 59.61 0.00 0.00 0.00 232.17 40.20 63.63 58.66 61.25 61.11 61.29 0.00 0.00 0.00 0.00 0.00 0.00 0.00 Process, G&A Akbaştepe Mill $000s 130,757 0 0 0 0 12,649 25,299 25,299 25,299 25,299 16,912 0 0 0 0 0 0 0 G&A $000s 13,943 0 0 0 0 1,350 2,700 2,700 2,700 2,700 1,793 0 0 0 0 0 0 0 Total $000s 144,699 0 0 0 0 13,999 27,999 27,999 27,999 27,999 18,705 0 0 0 0 0 0 0 Akbaştepe Mill $/t-ore 70.34 0.00 0.00 0.00 0.00 70.27 70.27 70.27 70.27 70.27 70.76 0.00 0.00 0.00 0.00 0.00 0.00 0.00 G&A $/t-ore 7.50 0.00 0.00 0.00 0.00 7.50 7.50 7.50 7.50 7.50 7.50 0.00 0.00 0.00 0.00 0.00 0.00 0.00

SRK Consulting (U.S.), Inc. Audit 2014 - Koza Altın İşletmeleri A.Ş. Volume 8 - Page 22
VO/SH KozaGold_2014Audit_Vol08_Economics_173600.130_005_SH January 31, 2015
Units Total or Avg. 2015 2016 2017 2018 2019 2020 2021 2022 2023 2024 2025 2026 2027 2028 2029 2030 2031 Total $/t-ore 77.84 0.00 0.00 0.00 0.00 77.77 77.77 77.77 77.77 77.77 78.26 0.00 0.00 0.00 0.00 0.00 0.00 0.00 Capital Costs Mining Akbaştepe Mine Capital $000s 34,988 0 0 17,377 3,601 2,944 2,255 2,368 2,972 2,787 684 0 0 0 0 0 0 0 Subtotal $000s 34,988 0 0 17,377 3,601 2,944 2,255 2,368 2,972 2,787 684 0 0 0 0 0 0 0 Process, Owner - Akbaştepe Mill $000s 85,430 0 0 25,884 43,090 16,456 0 0 0.00 0.00 0.00 0.00 0.00 0.00 0.00 0.00 0.00 0.00 Akbaştepe Infrastructure $000s 9,590 0 0 0 0 600 4,590 1,200 1,200 1,200 800 0 0 0 0 0 0 0 Subtotal $000s 95,020 0 0 25,884 43,090 17,056 4,590 1,200 1,200 1,200 800 0 0 0 0 0 0 0 Total $000s 130,008 0 0 43,261 46,691 20,000 6,845 3,568 4,172 3,987 1,484 0 0 0 0 0 0 0

SRK Consulting (U.S.), Inc. Audit 2014 - Koza Altın İşletmeleri A.Ş. Volume 8 - Page 23
VO/SH KozaGold_2014Audit_Vol08_Economics_173600.130_005_SH January 31, 2015
3 Conclusions and Recommendations The analysis performed has resulted in favorable economics for the group of mining operations
contained in this report. Commodity pricing for gold and silver always carry some risk when
predicting future price scenarios.
Recommendations, opportunities and risks are mainly driven on the technical aspects of the
resources, reserves, mine plans and processes and are addressed in the remaining volumes of this
report.

SRK Consulting (U.S.), Inc. Audit 2014 - Koza Altın İşletmeleri A.Ş. Volume 8 - Page 24
VO/SH KozaGold_2014Audit_Vol08_Economics_173600.130_005_SH January 31, 2015
4 Glossary
4.1 Mineral Resources and Reserves The JORC Code 2012 was used in this report to define resources and reserves.
A ‘Mineral Resource’ is a concentration or occurrence of material of intrinsic economic interest in or
on the Earth’s crust in such form, quality and quantity that there are reasonable prospects for
eventual economic extraction. The location, quantity, grade, geological characteristics and continuity
of a Mineral Resource are known, estimated or interpreted from specific geological evidence and
knowledge. Mineral Resources are sub-divided, in order of increasing geological confidence, into
Inferred, Indicated and Measured categories.
An ‘Inferred Mineral Resource’ is that part of a Mineral Resource for which tonnage, grade and
mineral content can be estimated with a low level of confidence. It is inferred from geological
evidence and assumed but not verified geological and/or grade continuity. It is based on information
gathered through appropriate techniques from locations such as outcrops, trenches, pits, workings
and drillholes which may be limited or of uncertain quality and reliability.
An ‘Indicated Mineral Resource’ is that part of a Mineral Resource for which tonnage, densities,
shape, physical characteristics, grade and mineral content can be estimated with a reasonable level
of confidence. It is based on exploration, sampling and testing information gathered through
appropriate techniques from locations such as outcrops, trenches, pits, workings and drillholes. The
locations are too widely or inappropriately spaced to confirm geological and/or grade continuity but
are spaced closely enough for continuity to be assumed.
A ‘Measured Mineral Resource’ is that part of a Mineral Resource for which tonnage, densities,
shape, physical characteristics, grade and mineral content can be estimated with a high level of
confidence. It is based on detailed and reliable exploration, sampling and testing information
gathered through appropriate techniques from locations such as outcrops, trenches, pits, workings
and drillholes. The locations are spaced closely enough to confirm geological and grade continuity.

SRK Consulting (U.S.), Inc. Audit 2014 - Koza Altın İşletmeleri A.Ş. Volume 8 - Page 25
VO/SH KozaGold_2014Audit_Vol08_Economics_173600.130_005_SH January 31, 2015
4.2 Glossary of Terms Table 4.2.1: Glossary
Term Definition Assay The chemical analysis of mineral samples to determine the metal content. Capital Expenditure All other expenditures not classified as operating costs.
Composite Combining more than one sample result to give an average result over a larger distance.
Concentrate A metal-rich product resulting from a mineral enrichment process such as gravity concentration or flotation, in which most of the desired mineral has been separated from the waste material in the ore.
Crushing Initial process of reducing ore particle size to render it more amenable for further processing.
Cutoff Grade The grade of mineralized rock, which determines as to whether or not it is economic to recover its gold content by further concentration.
Dilution Waste, which is unavoidably mined with ore. Dip Angle of inclination of a geological feature/rock from the horizontal. Fault The surface of a fracture along which movement has occurred.
Flitch Mining horizon within a bench. Basis of Selective Mining Unit and excavator dig depth.
Footwall The underlying side of an orebody or stope. Grade The measure of concentration of gold within mineralized rock. Haulage A horizontal underground excavation which is used to transport mined ore. Igneous Primary crystalline rock formed by the solidification of magma.
Kriging An interpolation method of assigning values from samples to blocks that minimizes the estimation error.
Level Horizontal tunnel the primary purpose is the transportation of personnel and materials.
Milling A general term used to describe the process in which the ore is crushed and ground and subjected to physical or chemical treatment to extract the valuable metals to a concentrate or finished product.
Mining Assets The Material Properties and Significant Exploration Properties.
SAG Mill Semi-autogenous grinding mill, a rotating mill similar to a ball mill that utilizes the feed rock material as the primary grinding media.
Sedimentary Pertaining to rocks formed by the accumulation of sediments, formed by the erosion of other rocks.
Sill A thin, tabular, horizontal to sub-horizontal body of igneous rock formed by the injection of magma into planar zones of weakness.
Smelting A high temperature pyrometallurgical operation conducted in a furnace, in which the valuable metal is collected to a molten matte or doré phase and separated from the gangue components that accumulate in a less dense molten slag phase.
Spigotted Tap/valve for controlling the release of tailings. Stope Underground void created by mining.
Strike Direction of line formed by the intersection of strata surfaces with the horizontal plane, always perpendicular to the dip direction.
Sulfide A sulfur bearing mineral.
Tailings Finely ground waste rock from which valuable minerals or metals have been extracted.
Thickening The process of concentrating solid particles in suspension. Variogram A statistical representation of the characteristics (usually grade).

SRK Consulting (U.S.), Inc. Audit 2014 - Koza Altın İşletmeleri A.Ş. Volume 8 - Page 26
VO/SH KozaGold_2014Audit_Vol08_Economics_173600.130_005_SH January 31, 2015
5 Date and Signature Page
Signed on this 31st Day of January, 2015.
Endorsed by CP:
Valerie Obie, BS Mining, MA, SME-RM Reviewed by:
Grant Malensek, PEng/PGeo
All data used as source material plus the text, tables, figures, and attachments of this document
have been reviewed and prepared in accordance with generally accepted industry practices.

SRK Consulting (U.S.), Inc. Audit 2014 - Koza Altın İşletmeleri A.Ş. Volume 8 - Page 27
VO/SH KozaGold_2014Audit_Vol08_Economics_173600.130_005_SH January 31, 2015
Disclaimer The opinions expressed in this Report have been based on the information supplied to SRK
Consulting (U.S.), Inc. (SRK) by Koza Altın İşletmeleri A.Ş. (Koza). These opinions are provided in
response to a specific request from Koza to do so, and are subject to the contractual terms between
SRK and Koza. SRK has exercised all due care in reviewing the supplied information. Whilst SRK
has compared key supplied data with expected values, the accuracy of the results and conclusions
from the review are entirely reliant on the accuracy and completeness of the supplied data. SRK
does not accept responsibility for any errors or omissions in the supplied information and does not
accept any consequential liability arising from commercial decisions or actions resulting from them.
Opinions presented in this report apply to the site conditions and features as they existed at the time
of SRK’s investigations, and those reasonably foreseeable. These opinions do not necessarily apply
to conditions and features that may arise after the date of this Report.
Copyright This report is protected by copyright vested in SRK Consulting (U.S.), Inc. It may not be reproduced
or transmitted in any form or by any means whatsoever to any person without the written permission
of the copyright holder, SRK except for the purpose as set out in this report.