auburn mckenney-harrison elementary school pm10 monitoring ... · pdf filemckenney-harrison...
TRANSCRIPT

AuburnMcKenney-Harrison Elementary School
PM10 Monitoring Special Study
October 10, 2001To
October 31, 2002
Prepared byAmbient Monitoring Section
Office of Air QualityIDEM
August 2003

1
PM10 Special Purpose Monitoring SiteAuburn, IN
Introduction
The Office of Air Quality (OAQ) of the Indiana Department of EnvironmentalManagement (IDEM) received complaints from citizens regarding the particulateemissions from the Auburn Foundry, and the air quality in the surrounding vicinity. In aneffort to determine if levels of particles in the air exceed federal health standards forcourse particulates (PM10), IDEM established a PM10 (particulate matter less than 10microns in size) monitor downwind from the foundry. The monitor was located on theroof of McKenney-Harrison Elementary School and collected data from October 10,2001 to October 31, 2002.
This report summarizes the results of the recent PM10 monitoring study conducted atMcKenney-Harrison Elementary School, which served to determine if the ambient levelsof PM10 were in compliance with the National Ambient Air Quality Standards (NAAQS)for PM10, set forth by the United States Environmental Protection Agency (USEPA).
Project Plan
In order to determine if compliance with the NAAQS was evident, a PM10 monitor wasplaced on the rooftop of McKenney-Harrison Elementary School. A meteorologicalstation located east of Auburn at SDI Butler Co. was used to measure wind speed (WS)and wind direction (WD). These data were shared with IDEM to facilitate the study. Themonitoring period established at the beginning of the study was one year. This timeperiod would allow for the collection of air quality data through all seasonal variations.
National Ambient Air Quality Standards
The USEPA has established NAAQS for six criteria pollutants. For each pollutant, aprimary and secondary standard is set. The primary NAAQS are set to protect the publichealth of the population, including the health of sensitive populations such as asthmatics,children, and the elderly. The secondary NAAQS are established to protect the publicwelfare, including protection against decreased visibility, and damage to animals, crops,vegetation, and buildings. The level of primary and secondary NAAQS for PM10 are setto the same value. For PM10, a short term (24 hour average), and a long term (annualaverage) time period is set for each of these NAAQS. The level of the short termNAAQS is 150 micrograms per cubic meter of air (ug/m3), and the level of the long termNAAQS is 50 ug/m3.
The short term standard is met when the yearly average number of exceedances for athree-year period is less than or equal to one. The long term standard is met when theaverage of the three-year averages is less than or equal to 50ug/m3. For the purposes of

2
this study, the number of exceedances allowed would be 1, and the average over thesampling period should be less than or equal to 50.
Particulate Sources
Attachment 1 is a list of the sources reporting emissions of PM10 for 2001-2002 inDeKalb County. The largest emitter of PM10 is the Auburn Foundry with estimatedemissions of 152 tons/year.
Site Location
A continuous PM10 sampling unit was installed on the roof of McKenney-HarrisonElementary School, on the west wing. The sample inlet was approximately 1400 ft. eastof the Auburn Foundry property line. The Auburn Foundry building was located between245º to 293º from the monitoring site, and the property of the facility spanned waslocated between 226º to 300º (approximately). Attachment 2 shows a regional countymap, and Attachment 3 shows the location of the monitoring site (McKenney-Harrison),as well as the pollution source (Auburn Foundry), in the city of Auburn. The UTMs ofthe site are 662.120 E and 458.072 N. The site is identified using the AIRS (AerometricInformation Retrieval System) site number 18-033-0001.
Sampling Period
The PM10 monitor began collecting data on October 10, 2001 and continued untilOctober 31, 2002. The meteorological data (WS and WD) was provided by SDI Butler'scontinuous monitoring program, and was sustained throughout this PM10 sampling studyat McKenney-Harrison School.
Equipment
A Rupperecht and Patashnick (R&P) model TEOM 1400a was used to collect PM10values continuously. The 1400a incorporates a Tapered Element Oscillating Micro-balance to measure particulate loading. Ambient air is drawn from atop the shelter intothe unit through a size selective inlet, which allows only particulate matter less than 10microns in size to pass through. A down-tube delivers the air containing the particulateto the monitor inside the shelter. A filter is placed atop a tapered glass rod, whichoscillates between 150 and 400 megahertz. As more particulate is deposited on the filter,the oscillation frequency of the rod changes proportionately to the amount of theparticulate load. The electronics of the monitor measures the difference in oscillation andcalculates the PM10 concentration.
Data Collection
Every hour the central data system of the Air Monitoring Branch, located in Indianapolis,polled the Auburn site and retrieved the data recorded for the previous hour. The hourlyvalues were reviewed each day to determine the monitor operation, and theconcentrations being collected. The data were compiled in a monthly summary and

3
reviewed by the branch staff for validity, completeness, and compliance with the NAAQSfor PM10 concentrations.
Data Return
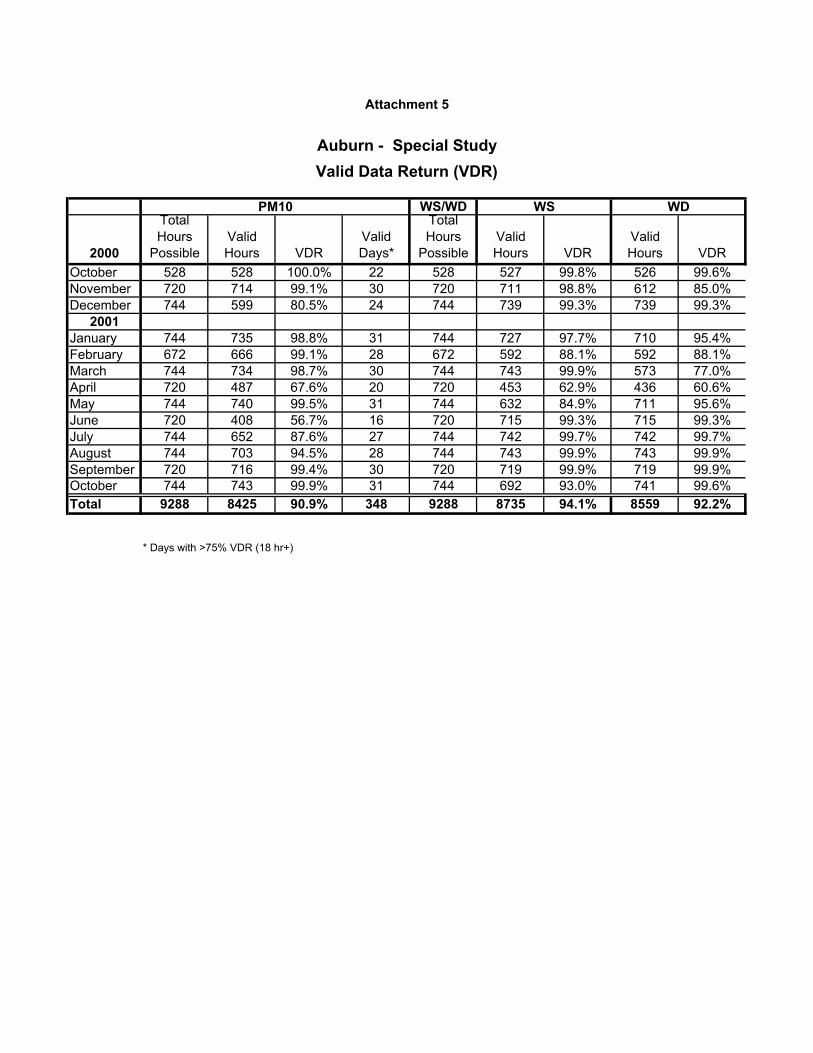
For the PM10 sampling period from October 10, 2001 until October 31, 2002 a total of9288 hours of valid data were possible. 8425 hours of valid data were collected for avalid data return of 90.9%.
A few large blocks of invalid data readings came as a result of power failure and machinemalfunction. 312 hours of data were lost in June 2002, 233 hours in April 2002, and 175hours in December 2001, due to machine malfunction. 92 hours of data were lost in July2002, due to power failure. The remainder of invalid data readings consisted of one tothree hours every few weeks as staff performed site checks, filter changes, or qualityassurance activities.
SDI Butler's meteorological program provided quality valid data return. From a possible9288 hours available during this time, 8735 hours of valid WS data were collected, for a94.1% valid data return. For WD, 8559 hours were collected resulting in 92.2% validdata return. In April 2002, 266 hours of WS data were lost because of power failure, and113 hours were lost in May 2002 because of machine malfunction. In November 2001,107 hours of WD data were lost because of machine malfunction, and in April 2002, 268hours were lost because of power failure.
Attachment 5 has a listing of the monthly Valid Data Return percentages.
Monitoring Results
Comparison to NAAQSThe concentrations of particulate matter measured in the air at this location in Auburnwere compared to both the short term (24-hour) and long term (annual) NAAQS.
For comparison to the short term NAAQS of 150 ug/m3, the daily 24 hourly valuesrecorded for a day are averaged to obtain a daily average. A valid daily average consistsof a minimum of 18 hours or 75% of the hourly values from a day. The highest dailyaverage recorded during the study was 110 ug/m3 on 5/9/02. The second highest was103 ug/m3 on 4/25/02, and the third highest was 95 ug/m3 on 10/26/01. A listing of allthe daily averages is in Attachment 6. The values are charted in Attachment 7.
The long term (annual) NAAQS is calculated by averaging the four quarterly averages ofconcentrations collected. To attain the standard, the average must be below 50 ug/m3.Since the sampling period for this study was not a calendar year, the averages werecalculated in two ways. Quarterly averages were calculated, and for the five differentquarters in which the site was operational. Then, the average of the quarters wascalculated to obtain an average for the sample period. The data are as follows:

4
Quarter Quarterly Averages (ug/m3)4 qtr. 2001 171 qtr 2002 242 qtr 2002 323 qtr 2002 324 qtr 2002 26
Sampling Period Average 26 ug/m3
Calculating an average from all the values for the entire period produces an average of 26ug/m3. Regardless of which method is used to calculate the average for the samplingperiod, the average is approximately one-half of the long term standard.
Comparison to Other CitiesThe concentrations obtained from the Auburn monitoring location were compared to thevalues collected at representative samplers in other cities throughout Indiana for this timeperiod. Most PM10 monitors are located in populated or downtown business areas. Twoof the comparison sites are located in industrial settings. One site is located in Gary andone site in Indianapolis. The annual averages for Indiana's major cities in 2001 and 2002range from 14ug/m3 to 32ug/m3. All are well below the annual NAAQS. The averageof 26 ug/m3 reported from Auburn is less than the industrialized Gary site, andcomparable to cities such as Terre Haute, Jeffersonville, and Evansville.
A comparison of the maximum 24-hour values obtained in 2001 and 2002 from thesesame sites indicates that the Gary industrialized site exceeded the 24-hour NAAQS of150 ug/m3 with a reported value of 192 ug/m3. A 24-hour concentration of 110 ug/m3was Auburn's highest value. The city of Gary was the only site that reported a higher 24-hour PM10 value in 2001-2002. Every other PM10 site in Indiana had maximum valuesbetween 21 ug/m3 and 63 ug/m3 during 2001-2002.City comparisons for annual averages can be found in attachment 8, and 24-hourcomparisons can be found in Attachment 9.
IDEM conducted a nearly identical study for 1-year during 2000-2001 at a foundry in thecity of Columbus. The results of the Columbus study were fairly similar to those found inthe Auburn study, with Auburn posting generally higher values. Using an identicalsampling method, the average PM10 concentration for the sampling period in Columbuswas 25.9 ug/m3, compared to 26.0 ug/m3 in Auburn. In both cases, the annual healthstandard (50 ug/m3) was not exceeded. Additionally, the maximum 24-hourconcentration in Columbus was 75 ug/m3, compared to 110 ug/m3 during the Auburnstudy. Although Auburn posted a significantly higher 24-hour value, the fact remainsthat the 24-hour health standard (150 ug/m3) was not exceeded. Finally, average hourlyconcentrations, which are used to determine the average 24-hour values, were also

5
compared. The maximum hourly concentration for the Columbus study was 204 ug/m3,while Auburn posted a maximum hourly average of 330 ug/m3. For the top ten days ofmaximum hourly concentrations recorded in each city, Columbus averaged 155 ug/m3,compared to 290 ug/m3 for Auburn. These data show that Auburn posted significantlyhigher maximum hourly averages during a one-year study. Factors such as factoryproduction, wind direction, and wind speed are some of the attributes to these values. Forboth cities, the 24-hour average values, which are derived from these maximum hourlyaverages, are well within the NAAQS for PM10 emissions.
Comparison to Wind DirectionOne advantage of collecting PM10 data continuously, as opposed to collecting a filter-based 24-hour integrated sample, is the ability to track the particulate concentrations asthey rise and fall during the day. The values tend to fluctuate as a result of the winddirection at the site, and the differing activities around the site. A table of WD comparedto the different concentrations of PM10 is shown in Attachment 10 and the pollution roseof this data is in Attachment 11. The predominant wind directions for the samplingperiod was between 237º (WSW) and 303º (WNW) accounting for 36.7% of the time.
The highest hourly concentration of PM10 monitored at the Auburn site during thesampling period was 330 ug/m3. A listing of the highest hourly PM10 concentrations isin Attachment 12.
The number of hours for which both PM 10 and WD were collected was 7853. Asindicated by the pollution rose, the majority of the higher PM10 concentrations occurredwhen the winds were from a westerly direction. PM10 hourly averages of 50 ug/m3 orgreater were reported during 871 hours or 11.2% of the monitoring period. Of thesehours, 815 (93.6%) were recorded when the WD was between 192º (SSW) and 348º(NNW). Essentially all concentrations greater than 100ug/m3 were recorded when theWD was between 237º (WSW) and 303º (NNW). There appeared to be no seasonaldistribution as the high values with the westerly winds occurred throughout the entirestudy.
Attachment 13 lists the 30 highest 24-hour concentrations recorded in this study. Thenumber of hours that the WD was from each direction is also listed. These data show thatthe wind came from a westerly direction nearly 95% of the time that the highestconcentrations were recorded.
Also analyzed were the days of high and low concentrations, in comparison to melt andtruckloads of sand moving from the foundry to the landfill. MELT is the total amount ofmaterial melted (in lbs.) in all furnaces; and generally the more material melted the moresand handling, grinding, etc. would occur. The amount of waste sand hauled to thelandfill and the number of truckloads is an indicator of potential fugitive PM and PM10emissions. Wind coming from the Auburn Foundry toward the monitor is defined as 270ºplus or minus 30º (240º to 300º).Attachments 15 and 16 reflect these comparisons, and use 75 ug/m3 or higher todesignate a “high” day and less than 10 ug/m3 to designate a “low” day.

6
In summary, most of the “high days” occurred when the wind was toward the monitormost of the day with high production and waste sand handling. Most of the “low days”occurred when the wind was not in the direction of the monitor or there was noproduction. However, there were some days with normal production and waste haulingand the wind toward the monitor for several hours when the PM10 concentration wasbelow 10.
Conclusions
Neither the short term (24-hour) health standard nor the long term (annual) healthstandard was exceeded during the sampling period. These are levels that have beenestablished by the USEPA as protective of the public health over these time periods.Both daily and annual average, along with maximum values were well within the federalstandards.
With the exception of the city of Gary, which is located in a highly industrialized area,the annual average and the maximum 24-hour concentration reported from the Auburnsite are among the higher values obtained from different sites across Indiana. The longterm (annual) values obtained in Auburn are comparable to those monitored at otherindustrial locations throughout Indiana. However, the short term (24-hour) values inAuburn were surpassed only by the Gary industrialized site in 2001-2002.The highest PM10 concentrations were recorded when the wind came from the directionsbetween 237º (WSW) and 303º (WNW). Since the Auburn Foundry is the largest sourceof PM10 in the area, and is located between 245º to 293º, the high concentrations ofPM10 recorded at the monitoring site are probably due to the emissions from this facility.The data clearly show that PM10 levels were higher when the wind blew from thedirection of the Auburn Foundry.
IDEM also analyzed the PM10 concentrations on the days of the monitoring period whenIDEM staff or neighbors indicated that smoke or dust emissions from the AuburnFoundry were higher than normal. Attachment 14 shows a list of dates and PM10concentrations when individuals had complained about emissions. It appears that visibleemissions from the plant are not a good indicator of PM10 emissions. This could be dueto other forms of dust and particulate that are larger than 10 micrograms, which are notanalyzed during PM10 sampling, but are also highly visible during stack emissions.

7

Attachment 1
Auburn - McKenney-Harrison School Special StudyPM 10 Emissions DeKalb County
CNTYCODE PLANT ID NAME STREET CITY
ESTEMISSIONS
(tons/yr)UTM
NORTHINGUTM
EASTING033 00002 Auburn
Foundry, Inc.Plant 1
at 635 W.11th St.
Auburn 152 4580.808 661.896
033 00043 STEELDYNAMICS,INC.
4500CountyRoad 59
Butler 125 4581.700 673.900
033 00047 FOAMEX L.P. 2211Wayne St
Auburn 21 4468.067 664.437
033 00042 AUBURNFOUNDRY
1537 WAuburnDr
Auburn 9 4579.135 660.190
033 00027 VULCRAFT 6610 Co.Rd. 60
St. Joe 2 4575.400 678.100
033 00072 NEWMILLENNIUMBUILDINGSYSTEMS, LLC
4182CountyRoad 59
Butler 1 4582.000 675.000

Attachment 2Auburn Special Study
Regional Map

Attachment 3McKenney/Harrison School and Auburn Foundry Location
PM10 Monitoring Location
Auburn Foundry

Attachment 4
Auburn - Special StudyPM 10 Calibration and Audit Results
High Flow Low FlowDate Audit/Calibration Limit = +/- 10% Limit = +/- 0.2 LPM
10/04/01 Calibration -1.8% 0.0111/07/01 Audit -2.4% -0.1112/05/01 Audit 0.3% -0.0412/11/01 Audit 1.5% 0.0201/28/02 Audit 1.4% -0.0802/28/02 Audit 1.6% -0.2004/23/02 Audit 4.9% 0.0106/18/02 Audit -0.6% 0.1207/17/02 Audit 3.9% -0.0608/13/02 Audit 2.3% -0.0609/11/02 Audit 0.8% -0.1010/08/02 Audit 3.3% 0.0511/01/02 Close Out Audit 0.9% -0.01
WS/WD
2000
Total Hours
PossibleValid Hours VDR
Valid Days*
Total Hours
PossibleValid Hours VDR
Valid Hours VDR
October 528 528 100.0% 22 528 527 99.8% 526 99.6%November 720 714 99.1% 30 720 711 98.8% 612 85.0%December 744 599 80.5% 24 744 739 99.3% 739 99.3%
2001January 744 735 98.8% 31 744 727 97.7% 710 95.4%February 672 666 99.1% 28 672 592 88.1% 592 88.1%March 744 734 98.7% 30 744 743 99.9% 573 77.0%April 720 487 67.6% 20 720 453 62.9% 436 60.6%May 744 740 99.5% 31 744 632 84.9% 711 95.6%June 720 408 56.7% 16 720 715 99.3% 715 99.3%July 744 652 87.6% 27 744 742 99.7% 742 99.7%August 744 703 94.5% 28 744 743 99.9% 743 99.9%September 720 716 99.4% 30 720 719 99.9% 719 99.9%October 744 743 99.9% 31 744 692 93.0% 741 99.6%Total 9288 8425 90.9% 348 9288 8735 94.1% 8559 92.2%
* Days with >75% VDR (18 hr+)
Attachment 5
Auburn - Special StudyValid Data Return (VDR)
PM10 WS WD

Attachment 6
Units = ug/m3
OCT NOV DEC JAN FEB MAR APR MAY JUN JUL AUG SEP OCT1 32 7 17 44 24 16 71 66 29 442 15 9 25 11 13 22 35 67 25 40 573 22 11 38 20 24 23 21 85 26 39 314 16 12 26 12 32 16 48 56 45 27 415 13 20 39 31 30 19 24 18 156 24 12 16 29 23 23 14 29 177 26 15 39 21 27 25 12 39 218 12 13 29 23 8 43 18 47 239 8 22 16 22 110 23 24 59 4310 19 11 31 12 21 81 15 44 76 4111 8 9 46 8 12 19 15 15 58 9 3612 11 14 20 12 52 20 22 10 19 43 20 2413 15 21 32 8 15 42 13 12 29 28 34 714 9 25 8 18 12 22 18 36 37 12 46 1715 32 25 10 56 59 28 28 21 41 22 31 2616 6 21 9 13 12 9 26 36 48 34 22 1417 19 10 6 76 8 12 33 6 82 23 28 2018 13 17 25 26 13 26 28 9 25 69 18 34 1719 20 11 22 17 15 17 46 10 32 50 29 28 1220 22 7 64 14 13 17 8 10 44 33 17 10 1321 30 7 26 40 36 16 8 12 52 36 21 1522 14 8 12 14 9 92 11 22 45 41 16 2123 22 14 9 14 11 55 21 44 65 18 19 22 1124 15 9 11 18 10 16 20 45 65 15 23 28 1025 62 7 10 19 31 103 15 58 24 21 23 1226 95 8 11 11 29 24 44 10 42 43 24 30 1627 6 12 11 10 81 27 21 22 40 29 28 30 1328 11 9 14 21 21 21 12 25 19 21 41 1129 34 4 14 24 17 51 28 27 25 42 1030 17 6 15 5 12 35 37 43 31 36 1431 27 16 18 89 24 25
Quarterly Averages 17.3 23.8 31.9 32.2 26.3
2002
Auburn - McKenney Harrison School PM10 24-Hour Concentrations
DAY 2001

Attachment 7Auburn - Special Study
PM10 24-hour Average Concentrations
0
20
40
60
80
100
120
140
160
10/10
/2001
11/9/
2001
12/9/
2001
1/8/20
02
2/7/20
02
3/9/20
02
4/8/20
02
5/8/20
02
6/7/20
02
7/7/20
02
8/6/20
02
9/5/20
02
10/5/
2002
Date
ug/c
ubic
met
er
24hr Health Standard

Attachment 8
Auburn Special Study Comparison of Annual Values
0102030405060
Auburn
(P,I)
Fort W
ayne
(P)
Jeffe
rsonv
ille (B
)
East C
hicag
o (P,B
)Gary
(I)Gary
(P,B
)Ham
mond (
P)Ind
ianap
olis (
I)Ind
ianap
olis (
P)And
erson
(B)
South
Bend (
B)Eva
nsvil
le (B
)Terr
e Hau
te (P
)
City
Con
c. (u
g/m
3)
Annual Average: 2001
Annual Average: 2002
Annual Average: 2 yr ave
P= Populated AreaI= Industrial AreaB=Business Area
Annual NAAQS Maximum

Attachment 9
Auburn Special Study Comparison of 24-Hour Maxs
0
50
100
150
200
250
Auburn
Fort W
ayne
(P)
Jeffe
rsonv
ille (B
)
East C
hicag
o (P,B
)
Gary (I)
Gary (P
,B)
Hammon
d (P)
Indian
apoli
s (I)
Indian
apoli
s (P)
Anders
on (B
)Sou
th Ben
d (B)
Evans
ville
(B)
Terre H
aute
(P)
City
Con
c. (u
g/m
3)
24 hour max: 200124 hour max: 200224 hour max: 2 yr max
I= Industrial AreaP=Populated
Maximum 24 Hour Value

Attachment 10Auburn - Special Study
Frequency Distribution (Concentration vs. Wind Direction)
Percentage of total period hours for each concentration category vs wind direction
Wind Direction (Degrees)Calm N NNE NE ENE E ESE SE SSE S SSW SW WSW W WNW NW NNW
ConcentrationCategory(ug/m3)
349-11 12-33 35-56 57-78 79-101 102-123 124-146 147-168 169-191 192-213 214-236 237-258 259-281 282-303 304-326 327-348
Freq perConc
Catagory
0-9 0 0.89 0.8 0.4 0.31 0.98 0.67 0.87 0.57 0.87 0.82 1.64 2.03 0.52 1.27 1.85 1.87 16.4310-19. 0 0.68 1.14 1 0.7 2.25 1.71 1.98 2.05 2.4 3.29 3.37 5.02 3.79 2.62 2.34 1.57 35.9920-29 0 0.52 0.49 0.25 0.25 1.65 1.12 1.29 0.99 1.79 1.98 1.64 2.11 1.82 1.55 1.18 0.64 19.3430-39 0 0.24 0.11 0.24 0.2 0.67 0.54 0.66 0.62 1.15 1.18 1.12 1.27 1.2 1.03 0.63 0.31 11.2440-49 0 0.14 0.1 0.02 0.03 0.21 0.22 0.26 0.24 0.4 0.48 0.73 0.71 1.4 0.75 0.34 0.16 5.9150-99 0 0.06 0.02 0.02 0.01 0 0.06 0.15 0.05 0.22 0.39 0.64 1.37 3.19 1.88 0.34 0.24 8.81100-149 0 0 0 0 0 0 0 0 0 0 0 0 0.18 0.78 0.67 0.01 0 1.65>=150 0 0 0 0 0 0 0 0 0 0 0 0 0 0.47 0.16 0 0 0.63
Percentage ofTime perDirection
0.00% 2.54% 2.68% 1.96% 1.52% 5.88% 4.33% 5.24% 4.53% 6.87% 8.17% 9.16% 12.72% 13.17% 9.95% 6.72% 4.82% 100%
Number of hours for each concentration category vs wind direction
Calm N NNE NE ENE E ESE SE SSE S SSW SW WSW W WNW NW NNWConcentrationCategory(ug/m3)
349-11 12-33 35-56 57-78 79-101 102-123 124-146 147-168 169-191 192-213 214-236 237-258 259-281 282-303 304-326 327-348# Hours per
ConcCatagory
0-9 0 70 63 31 24 77 53 68 45 68 64 129 159 41 100 145 147 129010-19. 0 53 90 79 55 177 134 155 161 188 258 265 394 298 206 184 123 282620-29 0 41 38 20 20 130 88 101 78 141 155 129 166 143 122 93 50 151930-39 0 19 9 19 16 53 42 52 49 90 93 88 100 94 81 49 24 88340-49 0 11 8 2 2 16 17 20 19 31 38 57 56 110 59 27 13 46450-99 0 5 2 2 1 8 5 12 4 17 31 50 108 251 148 27 19 692100-149 0 0 0 0 0 0 0 0 0 0 0 0 13 61 53 1 0 130>=150 0 0 0 0 0 0 0 0 0 0 0 0 0 37 13 0 0 49
# Hours perWind Direction
0 199 209 152 118 460 339 409 355 536 639 718 996 1034 780 525 376 7853

Attachment 11Auburn – Special Study
Frequency Distribution RosePM10 Concentration Categories Vs Wind Direction

Attachment 12
Auburn Foundry Special StudyHigh PM 10 Conc. vs. WD
Rank PM 10Hourly
Average(ug/m3)
WDHourly
Average(degree)
Date Hour
1 330 281 05/31/2002 122 326 266 05/09/2002 203 310 269 04/25/2002 134 300 267 05/09/2002 195 295 274 04/25/2002 146 282 266 05/09/2002 187 280 267 05/31/2002 98 272 266 05/09/2002 179 264 270 10/04/2002 2110 243 273 04/25/2002 1511 241 274 05/31/2002 1012 237 262 04/25/2002 1213 225 294 04/30/2002 1514 220 267 10/26/2001 1115 218 270 05/10/2002 216 211 260 04/25/2002 1117 203 287 09/10/2002 1518 200 270 05/10/2002 419 195 265 06/04/2002 1220 194 265 05/09/2002 2121 193 276 06/27/2002 1122 188 292 03/22/2002 1823 188 276 06/01/2002 1424 187 273 05/31/2002 1125 187 296 06/01/2002 1626 180 286 02/12/2002 1927 178 262 10/26/2001 428 174 N/A 04/19/2002 329 173 283 09/10/2002 1430 170 265 05/10/2002 531 168 273 06/01/2002 1532 165 263 10/26/2001 033 165 280 02/15/2002 1334 164 263 06/26/2002 1635 162 259 06/21/2002 836 161 287 03/22/2002 1237 161 278 09/10/2002 1338 160 271 10/26/2001 239 160 264 10/26/2001 840 160 263 05/09/2002 1241 158 279 07/04/2002 342 156 288 01/17/2002 2143 156 272 05/09/2002 14

44 156 259 07/17/2002 1145 154 297 03/22/2002 1646 153 286 03/22/2002 1047 153 276 03/23/2002 1548 151 266 10/26/2001 1049 151 289 01/17/2002 050 151 286 02/27/2002 2051 150 287 02/27/2002 1552 149 265 10/26/2001 353 149 289 02/26/2002 1554 148 292 02/12/2002 1855 147 266 10/26/2001 156 147 289 02/15/2002 1757 147 265 05/10/2002 758 146 273 04/25/2002 1659 146 275 05/09/2002 1360 146 255 07/26/2002 1161 145 273 07/17/2002 1662 142 288 02/26/2002 1663 142 286 02/27/2002 1464 142 284 03/13/2002 1765 142 259 04/25/2002 966 141 261 10/26/2001 567 141 286 03/22/2002 968 140 282 02/27/2002 1169 140 288 02/27/2002 2170 140 289 03/22/2002 1371 140 262 05/10/2002 672 139 262 10/26/2001 973 138 286 02/05/2002 1474 137 290 01/17/2002 2275 137 299 03/22/2002 1576 136 262 06/04/2002 1177 135 263 10/25/2001 2378 134 291 02/27/2002 1679 134 276 06/04/2002 1380 134 289 09/10/2002 1281 133 289 02/12/2002 1182 133 276 02/15/2002 1283 133 275 03/23/2002 1084 133 280 04/29/2002 1685 131 286 02/15/2002 1486 131 277 03/23/2002 1187 130 277 03/23/2002 1688 130 266 04/29/2002 1589 129 286 02/15/2002 2090 128 288 02/27/2002 1791 128 286 03/15/2002 1092 126 284 03/22/2002 1193 125 285 02/27/2002 1394 125 274 03/23/2002 13

95 125 274 07/16/2002 2296 124 286 02/27/2002 1897 124 292 03/22/2002 1798 124 277 07/17/2002 1299 123 269 01/15/2002 14100 123 272 03/13/2002 19

Invalid Calm N NNE NE ENE E ESE SE SSE S SSW SW WSW W WNW NW WNWHours 349-11 12-33 34-56 57-78 79-101 102-123 124-146 147-168 169-191 192-213 214-236 237-258 259-281 282-303 304-326 327-348
1 110 05/09/02 4 2 4 3 122 103 04/25/02 9 2 9 43 95 10/26/01 20 44 92 03/22/02 7 175 89 05/31/02 1 8 6 7 26 85 07/03/02 1 1 2 2 10 6 27 82 07/17/02 6 15 38 81 02/27/02 12 129 81 05/10/02 8 11 4 110 76 01/17/02 2 17 511 76 09/10/02 6 11 4 312 71 06/01/02 1 3 3 10 5 213 69 07/18/02 1 2 5 5 7 3 114 67 07/02/02 3 7 9 4 115 66 07/01/02 1 11 11 116 65 06/23/02 6 1 7 3 2 3 217 65 06/24/02 1 1 3 6 7 5 118 64 12/20/01 4 17 319 62 10/25/01 16 820 59 02/15/02 10 6 821 59 09/09/02 1 2 1 5 6 922 58 06/25/02 2 2 3 9 3 4 123 58 08/11/02 5 11 4 3 124 56 01/15/02 6 4 1425 56 07/04/02 3 6 6 6 326 56 10/02/02 1 2 1 4 12 2 1 127 55 03/23/02 1 21 228 52 02/12/02 3 7 10 3 129 52 06/21/02 3 5 3 2 4 3 1 1 230 51 04/29/02 4 2 8 10
Attachment 13
Auburn - McKenney Harrison School Special StudyMaximum 24-Hour Concentrations Vs Number of Hours per Wind Direction
Rank24-hr Conc. ug/m3
DateWind Direction (Degrees)

Attachment 14
Auburn Foundry Special StudyDate of Citizen Concern vs. 24-Hour Concentration
Date Concentration(ug/m3)
January 17, 2002 76February 19, 2002 15
March 1, 2002 24March 8, 2002 23March 16, 2002 9March 28, 2002 21April 26, 2002 44April 29, 2002 51May 6, 2002 23June 5, 2002 30
*National Ambient Air Quality Standard maximum = 150 ug/m3

Attachment 15
“LOW” DAYS
# hrs wind Tons sand to landfillDATE ug/m3 toward monitor MELT and # of truckloads
10-11-01 8 4 938,840 61/4
10-14-01 9 12 0 0
10-16-01 6 8 1,146,060 172/9
10-27-01 6 17 0 0
11-9-01 8 5 of 10 975,030 172/9
11-11-01 9 4 140,000 0
11-20-01 7 11 1,197,200 176/9
11-21-01 7 2 788,550 198/10
11-22-01 8 0 0 0
11-24-01 9 0 0 0
11-25-01 7 15 0 0
11-26-01 8 4 1,438,170 204/11
11-28-01 9 7 1,282,160 173/9
11-29-01 4 0 1,083,580 202/11
11-30-01 6 0 1,602,950 196/10
12-1-01 7 12 84,540 204/10
12-2-01 9 0 1,272,470 0
12-14-01 8 5 1,534,730 219/11
12-16-01 9 0 0 0
12-17-01 6 0 82,000 199/11
12-23-01 9 18 0 0
1-13-02 8 15 0 0

Attachment 15 (Continued)
“LOW” DAYS
# hrs wind Tons sand to landfillDATE ug/m3 toward monitor MELT and # of truckloads
1-30-02 5 0 1,355,040 179/10
1-31-02 4 0 of 9 1,497,110 168/9
2-11-02 8 8 1,541,710 247/13
2-17-02 8 1 of 17 0 19/1
2-22-02 9 2 of 13 1,505,620 324/17
3-16-02 9 0 of 7 1,538,860 259/13
3-25-02 7 4 of 11 1,933,350 146/9
4-20-02 8 no data 0 81/4
4-21-02 8 no data 0 0
5-8-02 8 0 1,668,430 197/11
5-17-02 6 0 of 14 1,787,740 350/20
5-18-02 9 3 1,309,470 0
9-11-02 9 1 1,812,980 341/20
10-13-02 7 8 0 0

Attachment 16
“High” Days
# hrs wind Tons sand to landfillDATE ug/m3 toward monitor MELT and # of truckloads
10-26-01 95 24 627,880 0
1-17-02 76 17 1,695,000 224/12
2-27-02 81 24 1,518,080 163/9
3-22-02 92 24 1,954,290 390/20
4-25-03 103 15 of 15 1,730,180 394/22
5-9-03 110 16 of 22 1,729,760 180/10
5-10-02 81 20 1,686,030 162/9
5-31-03 89 17 1,620,430 306/17
7-3-02 85 18 of 23 280,000 175/9
7-17-02 82 22 1,528,660 236/14
9-10-02 76 15 1,927,920 59/4