attracting and retaining talent at enron hr analysis and reporting november 2000 confidential and...
TRANSCRIPT
Attracting and Retaining Talent
at EnronHR Analysis and Reporting
November 2000Confidential and Proprietary

Executive Summary
Attracting Talent
Total new hires is increasing rapidy from 2,500 to over 4,500 from as a result of the company’s new business growth and increasing turnover since 1999.
An enhanced company brand will likely have a positive impact for recruiting. Enron is still an unknown to some college and experienced candidates.
Enron’s offer acceptance ratio is decreasing (91% to 86%), and compensation is the major reason candidates decline offers. Enron needs to increase marketing efforts related to non-compensation benefits such as entrepreneurial culture, free talent market, etc. as well as perform ongoing compensation market analysis. “Personal Reasons” is reported to be the second reason for declines. Offer acceptance ratio for college recruiting is 50% for 1999.
Retaining Talent
The Enron population is slightly younger and more diverse. Average tenure plunged 37% from over 7 years to less than 5 years over the past year.
Enron’s total turnover rate has almost doubled, increasing from 6.0% to 10.3% over the past year. “Personal Reasons” is reported to be the main driver. Of those who have left the company for both voluntary and involuntary reasons, these employees have on average been satisfactory or below performers, indicating that Enron is high-grading its workforce.
The most frequent tenure of voluntary separators is less than 1 year, indicating a revolving door. The average employee who voluntarily terminates is age 35, typically an experienced hire.
July to September 2000: By organizational levels, voluntary turnover is highest for the lower management at 13.8% annualized. However on average, the company is losing poorer performers rather than high performers.
NOTE: Presentation reflects domestic Enron employees, as well as international employees paid from headquarters. EOTT, PGE, EFS, Nepco and Wind employees were excluded, as well as contractors and temporary employees. 1999 data includes October 1998 to October 1999; 2000 data includes October 1999 to October 2000.
Confidential and Proprietary2

Attracting Top Talent
External Market Conditions
Company’s Staffing Growth
Recruiting Statistics

Staffing Challenges
Enron’s staffing needs are increasing
Rapid Growth New jobs created is estimated to be 10% or over 2,000 new hires.
Rising Turnover Turnover rates have almost doubled accelerating replacements
100
120
140
160
180
200
in m
illion
s of
FTE
s
Domestic Labor Supply crawls by 6 million
Domestic Labor Demand increases by 42 million
Labor Deficiencyof 36 million
NOTE: US Census is source for domestic labor demand graph.Turnover excludes Analysts and Associates who terminated to return to school.
Total New Hires
0
500
1000
1500
2000
2500
3000
3500
4000
4500
5000
1999 2000 2001
New Hires Turnover
Future labor market projections indicate a growing labor deficiency for knowledge workers.
Increasing turnover and a competitive labor market are competing factors that may impact Enron’s rapid growth
rate. Confidential and Proprietary
4
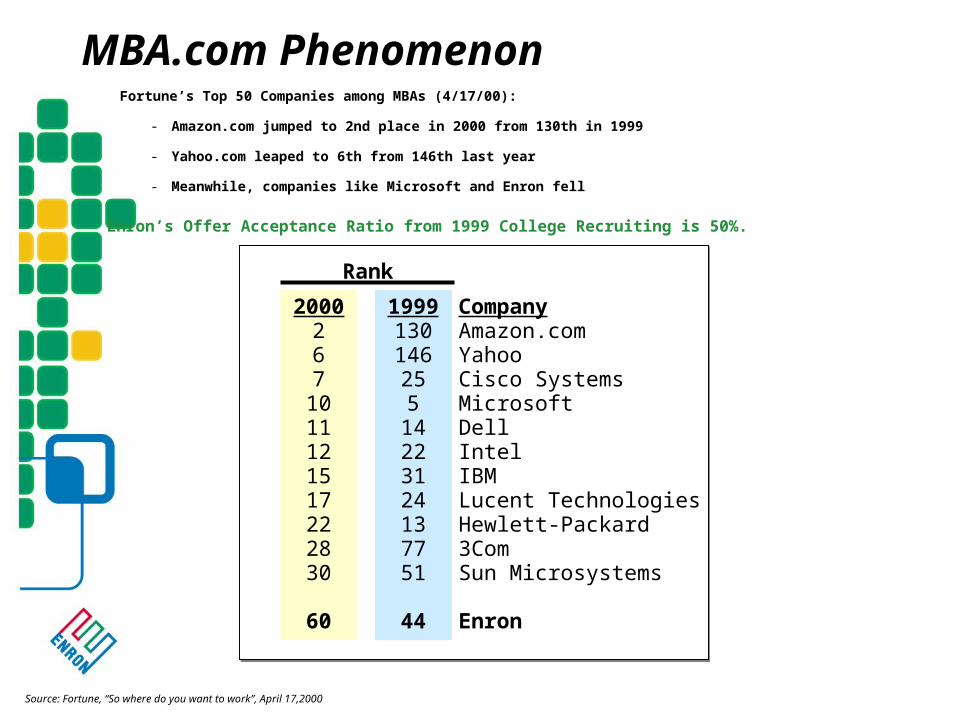
Fortune’s Top 50 Companies among MBAs (4/17/00):
- Amazon.com jumped to 2nd place in 2000 from 130th in 1999
- Yahoo.com leaped to 6th from 146th last year
- Meanwhile, companies like Microsoft and Enron fell
MBA.com Phenomenon
Source: Fortune, “So where do you want to work”, April 17,2000
Rank
2000267
1011121517222830
60
1999130146255
14223124137751
44
CompanyAmazon.comYahooCisco SystemsMicrosoftDellIntelIBMLucent TechnologiesHewlett-Packard3ComSun Microsystems
Enron
Enron’s Offer Acceptance Ratio from 1999 College Recruiting is 50%.

1999 2000 Benchmark*
Offer Acceptance Ratio 91.4% 86.4% 90.5%
Days to Fill N/A 44 50
Cost per Hire $6,557 N/A $5,249
1st Reason for Decline Personal Reasons Compensation
2nd Reason for Decline Accepted Other Offer Personal Reasons
Recruiting Efforts-Experienced Hires
* Saratoga Institute, 1999 (non-bank financial companies)
Most Innovative Company Years in a Row!Fortune, Feb. 2000
- #1 in Quality of Management- #2 in Employee Talent
innovative100 best companies to work for in america100 best companies to work for in america
most innovative companymost innovative company
Can’t stop themomentum
1 2 3 4 5
Energy/Commodity DerivativesHouse of the YearRisk magazine, Jan. 2000
100 Best Companies to Work For in AmericaFortune, Jan. 1999 (#73) Jan. 2000 (#24)
Enron’s offer acceptance ratio is decreasing. Compensation is the major reason candidates decline offers. Increased marketing for other employment benefits and ongoing compensation market studies may assist in this area. Personal reasons are reported to be the second driver
related to Enron’s reputation for long hours.Confidential and Proprietary
6

Retaining Talent
Who is Enron?
Turnover
Contribution Loss

1999 2000 2000(including GPG) (excluding
GPG)
Age 40 3836
Tenure 7.6 yrs 4.8 yrs2.7 yrs
Most Frequent Tenure 0-1 yr 0-1 yr0-1 yr
Male/Female 65%/35% 66%/34% 62%/38%
Ethnicity - Caucasian 78% 60% 53%
Education - Advanced 20% 15% 17%Degrees
The Enron population is slightly younger and more diverse. Average tenure plunged 37% from 7.6 years to 4.8 years
over the past two years.
Who is Enron?
Confidential and Proprietary8
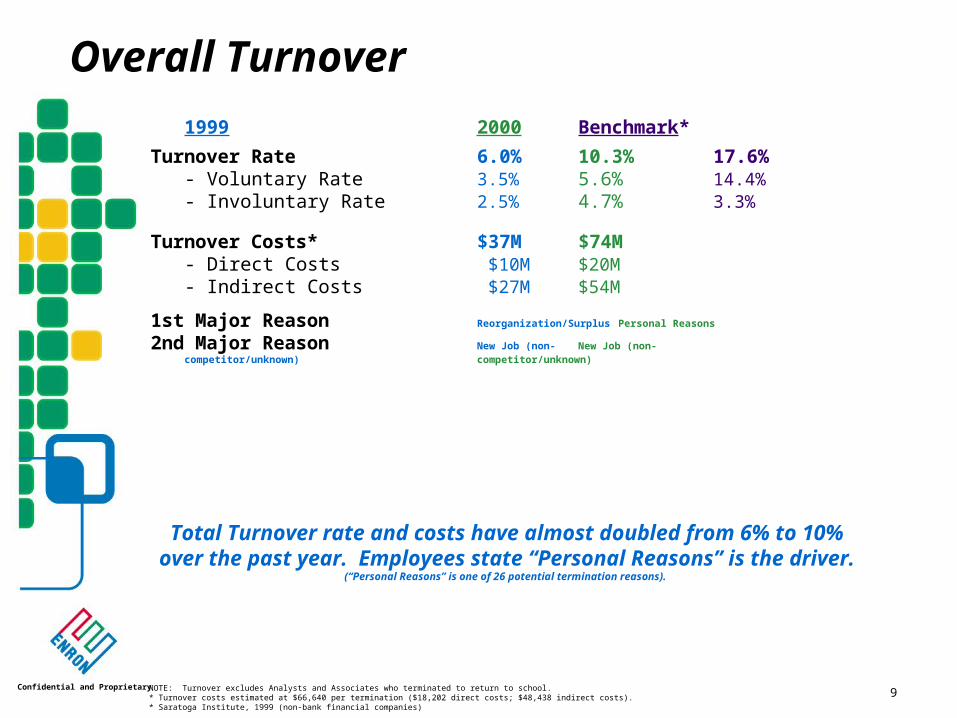
1999 2000 Benchmark*
Turnover Rate 6.0% 10.3% 17.6%- Voluntary Rate 3.5% 5.6% 14.4%- Involuntary Rate 2.5% 4.7% 3.3%
Turnover Costs* $37M $74M- Direct Costs $10M $20M- Indirect Costs $27M $54M
1st Major Reason Reorganization/Surplus Personal Reasons
2nd Major Reason New Job (non- New Job (non-competitor/unknown) competitor/unknown)
Total Turnover rate and costs have almost doubled from 6% to 10% over the past year. Employees state “Personal
Reasons” is the driver. (“Personal Reasons” is one of 26 potential termination reasons).
Overall Turnover
NOTE: Turnover excludes Analysts and Associates who terminated to return to school.* Turnover costs estimated at $66,640 per termination ($18,202 direct costs; $48,438 indirect costs).* Saratoga Institute, 1999 (non-bank financial companies)
Confidential and Proprietary9

1999 2000Age 36 35
Tenure 3.8 yrs 3.9 yrs
Most FrequentTenure 1-2 yrs 0-1 yr
Male/Female 59%/41% 60%/40%
Business UnitMost Affected ENA EEL
1st Major Reason New Job (non- Personal Reasonscompetitor/unknown)
2nd Major Reason Personal Reasons New Job (non-competitor/unknown)
Voluntary Turnover is increasing, notably after All-Employee stock options vested in July.
The most frequent tenure of voluntary separators is less than one year, indicating a revolving door. The average employee who voluntarily terminates is age 35 (an experienced hire).
Voluntary Turnover
NOTE: Turnover excludes Analysts and Associates who terminated to return to school.
Confidential and Proprietary10
2000 Turnover
0
20
40
60
80
100
120
140
160
Voluntary Involuntary

Voluntary Turnover by Level* Contribution Loss
Upper Mgt 3.5% 4.6%Executive Committee, MD, VP
Middle Mgt 9.1% 6.1%Senior Director, Director
Lower Mgt 13.8% 7.4%Senior Manager, Manager
Analysts/Associate 13.0% 12.5%Excludes Interns
Staff to Sr. Specialist 10.5% 8.6%Junior Specialist, Specialist, Sr Spec
Administrative 8.0% 7.0%
COMPANY WIDE 9.6% 7.6%
Based on July to September data, voluntary turnover is increasing from 6% to 10%. However, the contribution loss is still lower than turnover,
indicating that the company is losing on average poorer performers.These rates are based on the population count of each organizational
level.For all organizational levels, the company is losing on average poorer
performers.
Turnover and Contribution Loss by Organizational Levels ( July 2000 to September 2000)
* NOTE: Turnover period includes July 2000 to September 2000 and excludes analysts who planned to return to school. These rates have been annualized.
Confidential and Proprietary11