attitudes towards risk in the wake of a rare event
TRANSCRIPT

Centre for Research in Economics and Business
Lahore School of Economics
CREB Working Paper No. 02-14
Attitudes Towards Risk in the Wake of a Rare Event:
Evidence from PakistanFarah Said
Uzma AfzalGinger Turner

Centre for Research in Economics and Business (CREB)
Shahid SiddiquiDirectorCentre for Humanities and Social Sciences
Rana WajidDirectorCentre for Mathematicsand Statistical Sciences
Iqbal M. KhanEditorLahore School Case Study Journal
Naved HamidDirector CREB
CREB Advisory Board
Shahid Amjad ChaudhryRector
Lahore School of Economics
Sohail ZafarDeanFaculty of Business Administration
Azam ChaudhryDeanFaculty of Economics
Muneer AhmedDirectorCentre for Policy andEnvironmental Studies
Lahore School of EconomicsIntersection Main Boulevard Phase VI, DHA and Burki Road
Lahore 53200, PakistanTel: 042-36561230; 042-36560936Email: [email protected]

CREB Working Paper No. 02-14
Attitudes Towards Risk in the Wake of a Rare Event:Evidence from PakistanFarah SaidAssistant ProfessorLahore School of Economics
Uzma AfzalAssistant ProfessorLahore School of Economics
Ginger TurnerTravelers Postdoctoral FellowUniversity of Pennsylvania

© 2014 Centre for Research in Economics and BusinessLahore School of EconomicsAll rights reserved.
First printing February 2014.
The views expressed in this document are those of the authors and do not necessarily reflect the views of the Centre for Research in Economics and Business or the Lahore School of Economics.
Lahore School of EconomicsIntersection of Main Boulevard, Phase VI, DHA and Burki RoadLahore 53200, PakistanTel.: +92 42 3656 [email protected]
Price: Rs100

i
Preface
The Centre for Research in Economics and Business (CREB) was
established in 2007 to conduct policy-oriented research with a rigorous
academic perspective on key development issues facing Pakistan. In
addition, CREB (i) facilitates and coordinates research by faculty at the
Lahore School of Economics, (ii) hosts visiting international scholars
undertaking research on Pakistan, and (iii) administers the Lahore
School’s postgraduate program leading to the MPhil and PhD degrees.
An important goal of CREB is to promote public debate on policy issues
through conferences, seminars, and publications. In this connection,
CREB organizes the Lahore School’s Annual Conference on the
Management of the Pakistan Economy, the proceedings of which are
published in a special issue of the Lahore Journal of Economics.
The CREB Working Paper Series was initiated in 2008 to bring to a
wider audience the research being carried out at the Centre. It is hoped
that these papers will promote discussion on the subject and contribute
to a better understanding of economic and business processes and
development issues in Pakistan. Comments and feedback on these
papers are welcome.


iii
Acknowledgements
This paper has benefitted from comments by Wouter Botzen, Marcel
Fafchamps, Naved Hamid, Azam Chaudhry, Howard Kunreuther, Kate
Vyborny, and seminar participants at the University of Pennsylvania
Wharton School, the University of Oxford, and the Lahore School of
Economics. We gratefully acknowledge financial assistance from the
British Academy International Partnerships grant program, the Lahore
School of Economics, and the Travelers Foundation.

v
Abstract
This paper investigates the impact of rare-event experiences and
observations on risk taking. Matching detailed individual, household,
and community-level surveys with behavioral games data, we explore
the mechanisms that underlie individual risk-taking after a natural
disaster. Unlike the existing literature, which focuses mostly on
community-level economic and disaster data, our unique dataset allows
us to match detailed interviews on individual risk perceptions and loss
experiences with game choices. In the context of rural Punjab, Pakistan,
we find that having observed others’ losses is as important as personal
experience of loss, although the type of loss also matters. In multiple
rounds of the game, we also find that the change in strategy between
rounds depends on the severity of losses experienced or observed and
on the number of floods experienced over one’s lifetime.


Attitudes Towards Risk in the Wake of a Rare Event:
Evidence from Pakistan
1. Introduction
While several studies have investigated the change in behavior that
follows an extreme or traumatic natural disaster (see, for instance, Eckel,
El-Gambal, & Wilson, 2009; Cameron & Shah, 2010; Zylberberg, 2011;
Fleming, Chong, & Bejarano, 2011; Reynaud, Aubert, & Nguyen, 2013),
there is no consensus on the direction of change. For instance, Eckel et
al. (2009) have observed that Hurricane Katrina evacuees were more
risk-loving than the control group in their study, though this difference
declined over time. However, the authors divide their sample into
hurricane-affected and unaffected groups without controlling for the
impact of disaster losses. On the other hand, for Indonesian households
affected by earthquakes and floods, Cameron and Shah (2010) report
higher levels of risk aversion than for individuals in the unaffected
villages—the higher the number of floods experienced, the higher was
the level of risk aversion. They also find this differential to be long
lasting, depending on the severity of the natural disaster. However, their
study focuses on village-level rather than individual differences, ignoring
the potential variation across individual experiences.
This paper enhances the external validity of the existing literature by
combining data from behavioral games with information from a detailed
household survey. Our data allows a comparison of flood-related effects
not only across villages, but also across households and individuals.
Given that flood risk is highly location-specific and flood effects more
difficult to estimate parametrically than those of other natural disasters,
such household- and individual-level survey data provide rich insights.
We can therefore test for the impact of individual characteristics,
perceptions, and losses on individual risk-taking behavior.
Risk-Taking and Risk-Learning After a Rare Event: Evidence from Pakistan
2
2. Updating Based on Experience or Observation and Heuristics
We draw on the broader literature on risk aversion and Bayesian updating
under limited information.1 Kahneman and Tversky (1973) identify (i) the
“availability” heuristic—the propensity of individuals to determine
likelihood on the basis of prominent information; (ii) the
“representativeness” heuristic, which causes individuals to overweigh
salient events in determining the probability of an occurrence; and (iii) the
“conservatism” heuristic, under which individuals are predisposed to give
more weight to conservative values. Additionally, Mullainathan (2002)
describes the “associativeness” heuristic under which current events
remind individuals of similar past events such that multiple events are
compounded into a single perception. An example of the availability
heuristic is given by Deryugina (2010), who uses the US Gallup polls to
provide evidence that individuals are more likely to report a belief in
climate change when the weather has been hot over the past week.
2.1. Preferences versus Constraints
Although neoclassical economists generally assume that preferences are
fixed while constraints change, there is a large body of literature in
psychology and other behavioral sciences that examines the potential for
behavioral learning. Voors et al. (2010) provide evidence that, several
years after experiencing the traumatic conflict in Burundi, participants in
behavioral games appeared to have shifted their risk-taking preferences.
Similar studies highlight the possibility of risk-taking preferences changing
over time when individuals experience traumatic events (see Dillenberger
& Rozen, 2011). Natural disasters can be traumatic events that separate
family members and destroy physical assets. Therefore, a rational agent
might conceivably adjust his or her risk perceptions and mitigation plans
for natural disasters when given new information.
Kahneman and Tversky’s (1979) seminal work introduced the “prospect”
theory, which deviates from other rational utility-maximizing utility
models. Under the prospect theory, individuals consider potential gains
or losses when making decisions rather than final outcomes. They set
“reference” points: any potential outcome lower than the reference point
is considered a loss. Moreover, the value function is steeper for losses
1 For further discussion, see Deryugina (2010).

Farah Said, Uzma Afzal, and Ginger Turner
3
than for gains. In this context, Harrison, Humphrey, and Verschoor
(2005) find that, in a sample of developing countries, just under 50
percent of the individuals behaved according to the prospect theory.
Using data on affectees of the Australian floods of 2011, Page, Savage,
and Torgler (2012) establish that the adoption of risk-seeking attitudes
after large flood-associated losses is consistent with the prospect theory.
Identifying changes in risk preferences requires one to observe risk-
taking behavior as well as to control for the constraints to risk taking.
We consider two main areas of constraints: financial and psychological.
2.1.1. Financial Constraints
As demonstrated by Holt and Laury (2002), the level of financial assets
at stake can determine the level of risk aversion. Cameron and Shah
(2010), for instance, find that higher losses lead to higher risk aversion
but that access to remittances mitigates the impact of floods on risk
aversion. Orozco (2010) further demonstrates a change in risk aversion
when subsistence is at risk. Falcon (1964), Mellor (1966), and Behrman
(1968) have found that low-income and subsistence farmers are more
risk averse. Kunreuther and Wright (1979) postulate that a behavioral
kink emerges at a certain income level after which higher income leads
to riskier choices. This finding is confirmed by Ortiz (1979): farmers
tend to maximize their returns by taking risks after reaching a particular
subsistence level. On the other hand, Tanaka, Camerer, and Nguyen
(2006) find wealth effects to be insignificant in this context.
Expectations of external assistance can be an important factor in
perceived financial constraints. In Pakistan’s case, Andrabi and Das
(2010) show the significant effect of earthquake-tied foreign aid on the
public perception of foreign donors. Individuals who have received
government aid for flood-related loss in the past, witnessed government
aid being given to flood-affected neighbors, or interacted regularly with
government officials to receive other types of nonflood-related
government aid2 may be more likely to expect external assistance to
reduce their total losses in the case of a natural disaster.
2 For example, the Benazir Income Support Program (BISP), which provides financial
assistance to those below the poverty line through a variety of subprograms (see Pakistan,
Ministry of Finance, 2013).

Risk-Taking and Risk-Learning After a Rare Event: Evidence from Pakistan
4
Nielsen, Keil, and Zeller (2013) have found that, for farmers in Vietnam,
shocks that involved extensive ex-post assistance by the government
(such as deaths and floods) led to an increase in risk aversion, while
shocks that involved ex-post government coverage (such as livestock
loss) led to no change in risk aversion. Similarly, we might expect
network effects in receiving aid—for instance, through powerful patrons
such as landlords—to influence individuals’ risk levels.
2.1.2. Psychological Constraints
Psychological factors can be important determinants of risk choices.
Specifically, psychological reasons may dictate how individuals perceive
risk and, subsequently, how they mitigate it.
Loewenstein, Weber, Hsee, and Welch (2001) have put forward the risk-as-feelings hypothesis. Apart from conventional cognitive utility
maximization, the emotional aspect of individual decision-making is
more intuitive and automatic. Therefore, individual preferences may
diverge from an economically rational utility maximization approach
due to emotions. Following a trauma, an individual might put more
weight on emotions (positive or negative) than on cognition. Eckel et al.
(2009) attribute the increase in risk-loving behavior to greater
importance being given to emotions immediately after the event, and
the subsequent increase in risk aversion to the reassertion of cognitive
reasoning. Similarly, Dillenberger and Rozen (2011) highlight two
documented emotional biases in risk preferences: (i) the increase in risk
aversion after a disappointing event and (ii) the stronger impact on risk
averseness of earlier events.
Using household data from the Netherlands, Botzen, Aerts, and van den
Bergh (2009) show that perceptions are different from actual risk; they
find, for example, that individuals in unprotected areas consistently
underestimate the risk of floods. Bubeck, Botzen, Suu, and Aerts (2012)
note that even a high perception of flood risk does not necessarily lead
one to take risk-mitigating actions because taking action also depends on
the individual’s perception of its cost effectiveness. In the context of
Pakistan, even among villagers who have the financial resources needed
to reduce risk, risk information and self-perception can vary, which, in
turn, could determine the change in ex-post risk choices.

Farah Said, Uzma Afzal, and Ginger Turner
5
In particular, religious beliefs can play an important role in the
perception of fate versus individual free will to influence the future.
Although most people in rural Punjab are Muslim, individual
interpretations of a natural disaster and its outcomes may vary, as can
people’s belief in their own ability to reduce future risk. The religious
aspect may drive an individual toward risk-seeking behavior if they
interpret future outcomes as acts of God. Cultural differences, even
between people of the same religion, can further influence perceptions
and mitigation. For example, subsistence farmers living in the Layyah
district of Punjab, where the Indus riverbed stretches over several
hundred kilometers, are economically dependent on small perennial
floods to enrich arable land; they are, therefore, accustomed to being
displaced briefly almost every year due to minor flooding. With
perennial mobility, flood displacement may be a cultural norm.
2.2. Individual and Household Characteristics
Studies have found the level of risk aversion to differ by gender. Females
tend to be more risk-averse (Riley & Chow, 1992; Jianakoplos &
Bernasek, 1998; Weber, Blais, & Betz, 2002; Eckel et al., 2009;
Cameron & Shah, 2010). On the other hand, Tanaka et al. (2006) report
greater risk aversion in males. While many studies have explored the
relationship between gender and risk preferences, they are largely silent
on why risk aversion varies by gender among members of the same
household. Bajtelsmit and Bernasek (1996) suggest a conceptual
framework linking risk preferences to differences in labor market
experiences, discrimination, human capital, socialization, and biological
differences. Schubert, Gysler, Brachinger, and Brown (1999) argue that
the difference in risk taking in lottery games arises because men and
women face different opportunity sets.
Wang and Hanna (1997) and Bakshi and Chen (1994) present evidence
for the “lifecycle risk aversion” hypothesis, according to which risk
tolerance increases with age. Once again, there is a lack of consensus in
the literature on the effects of age on risk tolerance. Older people are
found to be more risk-averse in the Indonesian households sampled by
Cameron and Shah (2010). Morin and Suarez (1983) and Pålsson (1996)
observe similar results. Riley and Chow (1992) find nonlinear effects
such that risk aversion decreases up to the age of 65 and then increases
significantly.
Risk-Taking and Risk-Learning After a Rare Event: Evidence from Pakistan
6
The literature also explores the relationship between risk aversion and
education. A concern with such analysis is that the correlation between
education, wealth, and income might confound the interpretation of
results. Once again, the literature does not agree on the expected
direction of the relationship. Riley and Chow (1992) report a negative
relationship between risk aversion and education, while Jianakoplos and
Bernasek (1998) and Tanaka et al. (2006) find that risk aversion
increases with education level.
Other studies investigate the relation between migration (Beegle, De
Weerdt, & Dercon, 2011; Halliday, 2006; Yang, 2008; Paxson & Rouse,
2008), occupation (Tanaka et al., 2006), and risk aversion. Risk
decisions are not made in isolation—background risk (or other risk
sources) can increase risk aversion (Gollier & Pratt, 1996) or decrease it
(Quiggin, 2003). This includes risk from occupation: Tanaka et al.
(2006), for instance, show risk aversion to be lower among fisherfolk
households (fishing is considered a risky occupation). Arrondel and
Masson (1996) find that individuals in the private sector who are more
exposed to risk are also likely to invest a greater proportion of their
wealth in riskier assets than individuals who work in the public sector.
2.3. Motivation and Contributions
A better understanding of post-disaster risk-taking behavior is needed to
provide more effective relief and insurance programs. (For instance,
using data from the US, Gallagher (2012) finds that the demand for flood
insurance increases significantly just after a flood but declines
subsequently over the following decade.) This paper contributes to the
literature by closely investigating both the financial and psychological
mechanisms that underlie risk-taking, by matching detailed variation in
individual experiences and observation of neighbors’ experiences with
behavioral game data.
Many regions in Pakistan are prone to minor perennial flooding and it is
likely that some individuals will have experienced multiple floods, apart
from the catastrophic 2010 floods. This has allowed us to ask questions
about the number of floods experienced, their intensity, and the coping
mechanisms adopted that may or may not have proved effective. We
then use this information to estimate the differences in behavior
between (i) those who have experienced multiple floods (including

Farah Said, Uzma Afzal, and Ginger Turner
7
2010) and those that experienced only the exceptional 2010 flood, or
(ii) those who experienced the 2010 flood versus those who have
experienced only minor floods.
Our first main result is that the observation of disaster losses is as
important as the personal experience of loss in determining risk-taking
behavior. Individuals who have experienced floods do not make
significantly different choices from those who have not. However,
individuals who live in areas designated as flood clusters make
systematically more risk-averse choices than those who live elsewhere.
Personal experience of floods in these areas increases the likelihood of
more risk-seeking choices.
Our second contribution is to examine the impact of both severity and
frequency in a region where minor floods occur perennially but a
historically rare flood occurred recently. We find that frequency of
experience is as important as severity, as individuals make significantly
more risk-averse choices with the number of floods they have
experienced. We isolate the psychological impact of individual flood
experience from potential confounding factors (such as cumulative asset
changes or unobserved geographic variation) by controlling for income
effects and geographic flood propensity.
Our third main result is that the type of loss matters. While overall loss
experience makes individuals more risk loving, we see that differences
in risk behavior are driven mainly by those individuals who have either
personal experience of floods or who have observed the loss of house
structures as opposed to agricultural assets or personal possessions.
Our final contribution is to provide evidence that the process of risk
learning depends on real-world disaster experience. In particular,
learning between game rounds is influenced by the number of floods
experienced and the severity of damage to the house structure.
3. Econometric Model and Hypothesis
The following section presents an econometric model of the
determinants of game options.

Risk-Taking and Risk-Learning After a Rare Event: Evidence from Pakistan
8
3.1. Econometric Model
We are interested in the effects of flood experience on risk aversion
decisions made by individuals. We estimate the following equation
using an ordered probit regression:
Game option is the choice made by participants in each round of the
lottery game, where game option = 1 represents most risk-averse, 2
represents moderate risk aversion, 3 represents moderate risk-taking, and
4 represents most risk-taking. The higher the dependent variable, the more
risk-seeking that choice will be. Explanatory variables include indicator
variables for whether the individual belongs to a household that has
experienced floods and for whether that household lives in an area that
was severely affected by a flood (designated as flood cluster). Controls
include the age and gender of the game participant and household
characteristics collected from the survey. Round2 and Round3 are binary
variables equal to 1 if the observation is from the second and third rounds
of the game, respectively, and 0 otherwise. Standard errors are
heteroskedasticity-robust and clustered at the village level.
All data was collected through a household survey administered to 640
individuals in 320 households (one male and one female per
household). Of this group, 384 individuals (192 males and 192 females)
also participated in a risk choice experiment. Lottery games involving
384 participants, as well as male and female questionnaires, were
administered to the households to which they belonged. In total, there
were 320 households that provided 640 observations at the household
level. Table 1 provides summary statistics for the variables used.
A central question of this paper is whether individuals learn about risk,
or change their risk-taking behavior, after rare events. First, we test
whether the household flood experience, and particularly the 2010
flood experience, significantly determines the risk-taking behaviors
measured by the game. We then test for how flood losses affect the risk-
taking decisions, controlling for household and individual
Game optioni = a + b1( flood experiencei) +b2( flood clusteri)
+b3( flood experience. flood clusteri)+ b4Round2i + b5Round3i
+S j (b j other hhchars)+e (1)

Farah Said, Uzma Afzal, and Ginger Turner
9
characteristics. This improves on the literature, which investigates the
impact of natural disaster events on risk-taking in lottery games without
controlling for individual or household-level losses. With our data, we
are able to investigate how observation or experience of a natural
disaster, the severity of the loss, as well as preparation and perceptions
play a role in the process of learning from a disaster.
3.2. Hypothesis to be Tested
The following sections put forward the hypotheses for this study.
3.2.1. Observation versus Experience of Previous Events
Using survey questions that detail personal experience of floods versus
only observation of flood damage incurred by others, we test whether
risk aversion is different among individuals due to personal experience
of a traumatic past event. According to Cameron and Shah (2010),
people in communities who have experienced a natural disaster more
recently report a higher probability of a natural disaster occurring in the
next 12 months and expect it to be more severe than those who have
not experienced a disaster. In contrast, Eckel et al. (2009) find that
disaster-affected individuals make more risk-loving choices in a lottery
game setting. The difference in findings could be due to differences
between individual versus community loss experiences.
As discussed above, some households in designated flood villages had
not suffered any flood damage. This allows us to test the location-
specific aspect of flood risk. Individuals living in designated flood
clusters may be more likely to make risk-averse choices even if they
have not experienced a flood but have observed its negative impact on
others. We will be able to test if individuals make decisions involving
risk based on experience or on a summary description of outcomes
related by others.
3.2.2. Updating Beliefs Based on Flood Frequency versus Severity
Under the “representativeness” heuristic, in determining the likelihood
of an adverse event occurring, individuals tend to overweigh salient
events. If true, this implies that individuals who recently experienced the
severe floods of 2010 will make significantly different choices from

Risk-Taking and Risk-Learning After a Rare Event: Evidence from Pakistan
10
those who did not experience the 2010 floods. On the other hand,
according to Mullainathan (2002) and Deryugina (2010), current events
remind individuals of similar past events, compounding their
perceptions into a single perception of the event recurring in the future.
This implies that individuals who have experienced multiple floods will
make different choices from those individuals who have experienced a
single flood, even if it were the 2010 flood. Our dataset also allows us to
check for the differential impact of the frequency of floods versus the
severity in areas designated as flood clusters versus those that are not.
3.2.3. Learning About Risk
According to Kahneman and Tversky (1973), individuals determine the
likelihood of an event occurring by using prominent information. This
implies that learning about risk (and potentially coping with it) depends
on whether they encounter risk in other aspects of life. Under the
“associativeness” heuristic, individuals learn about the risk of an event
and form their perceptions of the event risk differently if it is easy to
imagine or associate. Another example of associativeness is when
individuals with risky livelihoods are more comfortable facing risk in
other spheres of life. According to Çelen and Kariv (2004), individuals
may be overconfident and overweigh personal information when
making decisions. This implies that the options chosen in subsequent
rounds of the game may depend on payoffs won in the last round: a
higher payoff may encourage greater risk taken in the next round.
If the experience of previous events strengthens the effect of the most
recent experience on behavior, this would be consistent with the
associativeness heuristic. However, the memory of previous events
experienced could make the impact of the 2010 event less significant
had they already enhanced individual resilience to floods. Individuals
with experience of other floods could also have a downward bias in
reporting the comparative impact of the 2010 event.
We test for the likelihood of learning about risk by investigating the
difference in decisions made by individuals who have experienced
floods and/or live in designated flood clusters in subsequent rounds of
the lottery game.

Farah Said, Uzma Afzal, and Ginger Turner
11
3.2.4. The Impact of Losses Incurred on Risk Aversion
Using data on the extent of loss incurred by flood-affected individuals
from our survey, we will test if the level of risk aversion increases with
losses. According to the prospect theory, individuals should become
systematically more risk seeking after having incurred large flood losses
(Page et al., 2012). On the other hand, Kunreuther and Wright (1979)
propose a behavioral link at an income level under which lower income
leads to more risk-averse choices. This is also consistent with the
findings of Ortiz (1979). Cameron and Shah (2010) find that risk
aversion increases with higher level of loss incurred.
Our data allows us to further disaggregate this effect by the type of loss.
As discussed above, losses in terms of crop or structural damage tend to
be more severe and variable than livestock damage or possessions lost
due to a flood. We test if these relatively high losses also lead to
significantly higher levels of risk-seeking behavior, consistent with the
findings of Page et al. (2012).
4. Empirical Methodology and Data Collection
This section presents the methodology used and data collected.
4.1. Household and Individual Surveys
Our survey included a total of 640 individuals across three districts
(Muzaffargarh, Layyah, and Rahimyar Khan) in the Punjab province of
Pakistan during April 2013. This followed a province-wide household
survey in 2008/09 that had included modules on the following categories:
Household demographics, assets, land ownership
Adoption of new practices, general adaption, perception of self- and
others’ resilience to change
Experience of traumatic events (e.g., crime, injury)
Risk perception and risk-taking preferences
Savings, loans, gifts, financial and expenditure aspirations
Patronage, social networks, relations to and assistance from powerful
people

Risk-Taking and Risk-Learning After a Rare Event: Evidence from Pakistan
12
Experience of natural disasters (floods, earthquakes, storms, droughts)
2010 flood losses (if any)
Mitigation and prevention activities
Information sources and warning times
Perception of neighbors’ 2010 flood losses
Community assistance, assistance received or given to others
External assistance, including government assistance and Watan cards
Future expectations of flood timing, frequency, and severity
Precautions taken against future floods; changes and learning in
precautions taken
Experience of and attitudes toward insurance products
4.2. Community Leader Interviews
In addition, interviews with a community leader in each village
confirmed the village-level information collected.
The remainder of this section describes some particular elements of the
survey and game. (A full copy of the survey instruments and game
instructions can be obtained on request.)
4.3. Lottery Game
To elicit risk preferences, experimental games were conducted in groups
of 12 males and 12 females from among the respondents of the
household survey in each village. In the lottery game, participants were
given four choices of paired lottery outcomes. The enumerator would
randomly draw either a red or green ball from a bag, and participants
would then receive the amount corresponding to that randomly chosen
color for the choice they had made. The game was repeated in three
rounds, with the second round offering higher payoffs with a similar
spread, and the third round offering higher payoffs than the first two
rounds and a wider spread.
The payoffs were slightly asymmetrical because the game design was
constrained by the need to use payoffs in even units of currency so that

Farah Said, Uzma Afzal, and Ginger Turner
13
participants could recognize bills immediately and did not have to
perform addition sums to recognize the payoff choices. The level and
spread of possible game outcomes in the three rounds is shown in
Figures 1, 2, and 3. Negative payoffs are not possible, so loss aversion is
not considered.
Figure 1: Round 1 payoffs based on participant choice and random-
color ball drawn
Figure 2: Round 2 payoffs based on participant choice and random-
color ball drawn
0
10
20
30
40
50
60
1 2 3 4
PR
s
Participant choice
Green Red
0
20
40
60
80
100
120
1 2 3 4
PR
s
Participant choice
Green Red

Risk-Taking and Risk-Learning After a Rare Event: Evidence from Pakistan
14
Figure 3: Round 3 payoffs based on participant choice and random-
color ball drawn
We measure the lottery game choice variable in several ways: as the
average across all rounds, as the variance in choices, and as the final-
round choice. We can also estimate collectively over all three rounds to
determine whether participant choices were consistent across the three
rounds. We test whether each explanatory characteristic has a significant
positive or negative impact on making more or less risky choices in the
general lottery game setting.
Within each round, the dependent variable is defined as 1 = least risk
taking and 4 = most risk taking. As an added measure, we also look at
the return and risk characteristics of the choices given in each round.
This would entail assigning higher levels of risk aversion to the choice
that has a higher compensation for the risk undertaken (i.e., a higher
Sharpe ratio). Individuals who are more risk-averse will opt for the
choice that provides them with greater compensation for the spread
between returns. For all rounds, the Sharpe ratio falls as we move from
option 1 to 4. We can take this to mean that the level of risk aversion
falls progressively as individuals move from opting for option 1 to 4
(Lettau & Uhlig, 2002).
4.4. Sampling Methodology and Data Construction
Our study focuses on Punjab, which is an advantageous location for
sampling both flood-affected and unaffected households, given the five
rivers that flow through the province and the geographic diversity of flood
0
50
100
150
200
250
300
1 2 3 4
PR
s
Participant choice
Green Red

Farah Said, Uzma Afzal, and Ginger Turner
15
effects. There is considerable variation across the province in terms of
rainfall levels, advent of floodwater, losses, and external assistance.
Punjab is divided into 36 districts, which are subdivided into 127
tehsils.3 Tehsils generally correspond to towns, but within one tehsil,
there may be multiple towns. Each tehsil is further divided into union
councils that serve as the local administrative unit and can comprise
multiple villages. The general methodology followed by national surveys
for rural areas is to then divide these villages further into compact
enumerator blocks of 200–250 proximate households out of which 16
are randomly selected for the survey (see the Punjab Bureau of Statistics’
Multiple Indicator Cluster Survey [MICS] for 2008/09). Keeping in line
with the terminology used in national surveys, these 16 randomly
selected households are hereafter referred to as a “cluster.”
Our sampling frame is taken from a representative survey of 30,000
households in Punjab that took place in 2011—about a year after the
flood had occurred. We sample flood-affected (“treated”) households
and unaffected (“control”) households with similar characteristics along
other dimensions that could affect the outcome variables.
4.4.1. Selection of Districts
We test not only the direct impact of flood losses on risk perceptions
and risk-taking behavior, but also the indirect impact of having observed
a flood event that did not necessarily incur personal loss. We therefore
select districts with variations in flood effects ranging from low/zero to
moderate to severe.
To select districts that will allow a sufficient range of flood-affected and
nonaffected villages, we have used the list of villages that were surveyed
under the Multi-cluster Rapid Assessment Mechanism (McRAM) surveys
in 2010 as well as information from the MICS 2011 implemented by the
Punjab Bureau of Statistics. The McRAM survey, conducted in late
August 2010, covered eight of eleven flood-affected districts,4 and
gathered detailed information on flood damage and rehabilitation needs
3 http://www.punjab.gov.pk/?q=punjab_quick_stats 4 According to the MICS 2011, the districts where any households reported having been
affected by the 2010 floods were Rajanpur, Muzaffargarh, Jhang, Layyah, Dera Ghazi Khan,
Sargodha, Multan, Rahimyar Khan, Bhakkar, and Bahawalpur.

Risk-Taking and Risk-Learning After a Rare Event: Evidence from Pakistan
16
(see Figure 4). In Pakistan, the MICS is implemented approximately
every four years in Punjab and draws a sample of households from the
province’s total population, representative at the tehsil level. The most
recent MICS took place in 2007/08 and 2011, providing representative
household data for the periods preceding and following the 2010 floods.
We obtained access to parts of the MICS data from the Punjab Bureau of
Statistics—a provincial government agency that administers the survey
on behalf of UNICEF.
The 2011 MICS asked each respondent if the 2010 floods had affected
their household. Based on the responses to this question, the Punjab
Bureau of Statistics designated a cluster as being “flood-affected” if all
the randomly selected households in that cluster had responded “yes,”
and as being “nonflood-affected” if any of the households in the cluster
had responded “no.”5 Based on this list of flood-affected clusters, we
determine the percentage of flood-affected clusters in each district.6
These clusters were not only affected more severely by the 2010 floods
but, given their proximity to the rivers Indus and Chenab, also tend to
be affected more frequently than other clusters.
5 A cluster was designated as flood-affected only if all the households in that cluster had
responded “yes” when asked if they had been affected by the 2010 flood. This was done to
make sure there was no error due to the migration of households into and out of the cluster
between 2010 and 2011 when the survey was conducted. Only clusters with a minimum
likelihood of in- and out-migration were selected as flood-affected. 6 Note that the MICS is a representative random sample of the total population, not a census of
all households, so the percentage of flood-affected clusters calculated is approximate but
based on the random sample.

Farah Said, Uzma Afzal, and Ginger Turner
17
Figure 4: Punjab flood map, August 2010
Source: Lahore University of Management Sciences (floodwaters in red). Available from
http://floodmaps.lums.edu.pk/
Based on information from both the MICS 2011 and the McRAM survey
2010, the five districts with the highest number of 2010 flood-affected
clusters were Rajanpur, Muzaffargarh, Layyah, Dera Ghazi Khan, and
Rahimyar Khan. For security reasons, female staff and enumerators could
not visit Rajanpur and Dera Ghazi Khan, and so we concentrated our
survey in the three remaining districts: Muzaffargarh, Layyah, and
Rahimyar Khan. Flood maps obtained from the McRAM survey, the
Punjab Provincial Disaster Management Authority, and Lahore University
of Management Sciences confirm that each of the three districts lies across
the border of flooded and nonflooded areas. According to the MICS 2011,
9 percent of the clusters sampled in Rahimyar Khan can be classified as
flooded, while 18 percent of the clusters in Layyah and 51 percent in
Muzaffargarh were “flooded” in 2010.
The terrain in these districts is mainly plain with barani (rain-fed) crops
grown in the eastern half of Layyah. Layyah and Muzaffargarh are
bounded to the west by the Indus and by the Chenab to the east. The

Risk-Taking and Risk-Learning After a Rare Event: Evidence from Pakistan
18
Indus flows across Rahimyar Khan’s northwestern boundary (Figure 5).
In Muzaffargarh and Layyah, the historical mean rainfall is 200–400 mm
per annum, while the per annum mean rainfall in Rahimyar Khan is less
than 200 mm.
Heavy rainfall in the north of the country causes the Indus and its
tributaries to swell and overflow, leading to floods in the plains below.
The monsoon rains in 2010 are considered to have been the heaviest
(particularly in the north) since 1994 and the sixth heaviest in the last 50
years (Pakistan Meteorological Department, 2010).7 Figure 5 below
displays the surface water record maintained by the Dartmouth Flood
Observatory, Colorado, for 2000 to 2013.8 The blue areas indicate any
reservoir or new body of water post-2000; the grey areas are those that
have been inundated by floods in the past but where floodwaters have
since then receded.
Figure 5: Surface water, 2000–13
7 Wang, Davies, Huang, and Gillies (2011) attribute the 2010 floods to anomalies in wind
circulation and the warming and moistening of the lower troposphere. 8 http://floodobservatory.colorado.edu

Farah Said, Uzma Afzal, and Ginger Turner
19
4.4.2. Selection of Villages
Using a list of all the villages in the three focus districts, we sort out the
flood-affected and nonflood-affected clusters. We then select clusters in
terms of flooded and nonflooded pairs based on propensity scores. We
use pre-flood data from the 2007/08 MICS (including household wealth
and livestock, income, occupation of household head, access to utilities,
literacy, health, and access to public infrastructure) to create a score of
characteristics correlated with the propensity to be flooded. By matching
propensity scores based on these characteristics, we obtain a control
group that was not flooded in 2010 but is socioeconomically similar to
those that were.9 The propensity score matching provides us with a
balanced sample: there are no significant differences in the mean of the
key socioeconomic variables between the treatment and control groups
(Table A5 in the Appendix).
Note that this list of flood-affected villages comprises those that were
also randomly surveyed in the MICS 2011, when they reported having
been flooded in 2010. Among the list of flood-affected villages, we
randomly select eight villages as the treatment group: four in
Muzaffargarh, two in Layyah, and two in Rahimyar Khan. Using the
propensity scores, we map the flooded villages and unaffected villages.
For half (four) the flood-affected villages, we select a control village with
a matching propensity score in closest proximity. For the other half
(four), we select a control village with a matching propensity score that
is located farthest from its paired flooded village.10 For the “nonflooded”
villages, an additional check is performed using our several mapping
sources to verify that the village area was not considered flooded during
2010. Five nonflooded villages adjacent to the flooded villages are
selected in Muzaffargarh, two in Layyah, and one in Rahimyar Khan. As
can be seen in Figure 6, the average distance to one of the rivers (Indus,
9 Note that, in using both the 2007/08 and 2011 rounds of the MICS, we have effectively
restricted our sample to villages that were common to both rounds. Since the samples in both
years were completely random, any villages that were sampled in both rounds are also
random. There is no reason to suspect any bias in the selection of these villages. Moreover, re-
sampling the same villages in 2011 that were sampled in 2007/08 does not mean that the same
households were sampled since the selection of households was random. 10 The propensity scores of the nonflooded villages do not exceed those of the flooded villages
by more than 30 percent of the standard deviation of the scores.

Risk-Taking and Risk-Learning After a Rare Event: Evidence from Pakistan
20
Jhelum, or Chenab) among the control and treatment villages (shown by
the dots) is also comparable.
Figure 6: Sample villages selected
4.4.3. Selection of Households
The latest round of the MICS (2011) provides a complete list of
households in one randomly selected village block (a settlement or basti or a geographically concentrated group of households). We have
surveyed 20 households from each village.
Enumerators recorded reasons for why any household was not available
for the survey. They were provided with a list of five additional
randomly selected households to draw for replacement, which was used
when (i) no one was available who could provide household
information, (ii) the house was uninhabited, or (iii) household members
declined to participate in the survey.
4.4.4. Addressing Potential Attrition Bias
Given that the 2010 floods induced temporary out-migration, there is a
possibility that a sample of flood-affected villages might under-represent
flood-affected households. We have used multiple sources to
approximate village population changes and asked about migration

Farah Said, Uzma Afzal, and Ginger Turner
21
directly in a separate survey module for village leaders who can give
village-level estimates.
Although the most recent population census was performed in 1998, the
Punjab Bureau of Statistics provides data for 2011 on the approximate
number of households in a village. The MICS representative 2008
provincial survey also provides a count of the number of households in
each block. Note that, since enumeration blocks within a village are
selected randomly for survey in each round of the MICS, it is unlikely
that the same enumeration block selected in 2008 would also have been
selected in 2011. Comparing the available lists between these two
surveys would not, therefore, reliably track households over time.
To collect direct information on village migration, we approached each
settlement with the pre-existing MICS roster of households and asked the
village leader and/or numberdar why any households on the list were
missing and, specifically, the number of households that had moved
away since 2010 due to the flood. In the household survey, we also
asked participants about the extent of migration for various reasons,
including the flood.
Characteristics such as risk perception and memory of past events were
identified at the individual level. Other characteristics, such as assets
and flood losses, which are identical for males and females from the
same household, were identified at the household level. There was
generally one male and one female from each household. Standard
errors are heteroskedasticity-robust and clustered at the village (or
census “cluster”) level.
Note that the interaction term between living in a flood cluster and having
experienced at least one flood captures the within-village variation. Some
households that had suffered flood damage were located in villages not
officially designated as flood-affected, and vice versa; some households in
flood-affected villages had not suffered flood damage at all. This highly
location-specific aspect of flood risk is one of the reasons our unique
dataset with individual loss measurements is so important.
Household income and savings exhibit wide variation. While the
poorest person lives on PRs 100 (approximately $1) per day, the richest

Risk-Taking and Risk-Learning After a Rare Event: Evidence from Pakistan
22
in the sample has an annual income of nearly $83,000, with the average
individual earning approximately $7,000 per annum.
5. Results
This section gives the results of our survey.
5.1. Summary Statistics
Table 1 provides the summary statistics of the variables used.
Table 1: Summary statistics
Variable Obs. Mean SD Min. Max.
Age 384 37.77 12.58 16.00 80.00
Monthly savings (Rs) 640 4094 14,972 0.00 200,000
Monthly income (Rs) 640 27,750 61,315.5 3,000 724,000
Lives in a designated flood cluster 640 0.50 0.50 0.00 1.00
Has experienced floods (including 2010) 640 0.79 0.40 0.00 1.00
Lives in a designated flood cluster and
has experienced floods (including 2010)
640 0.48 0.50 0.00 1.00
Has only experienced the 2010 floods 640 0.45 0.50 0.00 1.00
Lives in a designated flood cluster and has only experienced the 2010 floods
640 0.31 0.46 0.00 1.00
Experienced floods prior to 2010 only 640 0.06 0.24 0.00 1.00
Lives in a flood cluster and experienced floods prior to 2010 only
640 0.01 0.07 0.00 1.00
Has taken any mitigation action 640 0.33 0.47 0.00 1.00
Thinks the next flood will be worse 640 0.08 0.27 0.00 1.00
Lives in a designated flood cluster and thinks the next flood will be worse
640 0.04 0.20 0.00 1.00
Lives in a designated flood cluster and thinks nothing works to protect against
640 0.34 0.47 0.00 1.00
Flood crop loss as a percentage of monthly income
640 3.90 16.17 0.00 250.00
Flood house structure loss as a percentage of monthly income
640 5.42 12.38 0.00 133.33
Flood livestock loss as a percentage of monthly income
640 0.64 7.30 0.00 180.00
Flood possessions loss as a percentage of monthly income
640 0.69 3.60 0.00 60.00

Farah Said, Uzma Afzal, and Ginger Turner
23
Variable Obs. Mean SD Min. Max.
Number of floods experienced 627 1.16 1.04 0.00 6.00 a
Number of floods experienced living in a
designated flood cluster
627 0.79 1.07 0.00 6.00
Received government assistance 640 0.42 0.49 0.00 1.00
Received government flood BISP
assistance
640 0.17 0.37 0.00 1.00
Received government flood cash
assistance
640 0.08 0.28 0.00 1.00
Received government flood food
assistance
640 0.30 0.46 0.00 1.00
Received government flood non-food
assistance
640 0.16 0.36 0.00 1.00
Related to an influential local 640 0.19 0.39 0.00 1.00
Neighbors incurred damage to their houses
640 0.64 0.48 0.00 1.00
Lives in a designated flood cluster and neighbors incurred damage to their houses
640 0.45 0.50 0.00 1.00
Has held insurance in the past 640 0.10 0.30 0.00 1.00
Head of the household is a male 640 0.98 0.16 0.00 1.00
Ratio of males to females in the household 640 1.27 0.72 0.11 6.00
Ratio of members who are under 16 years old
640 0.42 0.16 0.00 0.78
Ratio of members who are migrants 640 0.18 0.25 0.00 1.00
Has experienced hardships in life 640 0.86 0.35 0.00 1.00
Education of household head 626 3.64 4.23 0.00 16.00
Has adopted new techniques 640 0.51 0.50 0.00 1.00
Ratio of members who have their own enterprise
640 0.05 0.08 0.00 0.44
Ratio of members who are in agriculture or livestock
640 0.06 0.09 0.00 0.67
Ratio of members who are laborers 640 0.11 0.11 0.00 0.60
Finished floor (house) 640 0.31 0.46 0.00 1
Finished roof (house) 640 0.77 0.42 0.00 1
House owned by member of household 640 0.87 0.33 0.00 1
Takes mitigation measures now 640 0.15 0.36 0.00 1
Has adopted new building material 637 0.22 0.41 0.00 1
Note: a = Respondents reported floods to have occurred in 1972/73, 1975, 1978, 1987,
1994, 1995, 2003, 2009, 2010, 2011, and 2012.
Source: Authors’ calculations.

Risk-Taking and Risk-Learning After a Rare Event: Evidence from Pakistan
24
It is also interesting to note the distribution of different types of losses
(Figures A1 to A4 in the Appendix). Note that all distributions are
clustered around 0, with losses of personal possessions and livestock
equal to 0 up to the 75th percentile. Losses in agriculture and household
structure are much higher and more varied. However, apart from extreme
values, losses in terms of house damage are, on average, higher and have
a lower variation than losses incurred in the form of crop damage.
On average, total flood losses as a percentage of income are almost four
times as high in the flooded areas as in the clusters that were designated
“nonflooded.” Specifically, the loss of crops as a percentage of income is
more than three times as high in flooded areas (5.98 percent) as in the
nonflooded areas (1.82 percent). On the other hand, losses incurred by
household structures (as a percentage of income) are more than four
times as high in the flooded clusters (8.82 percent) as in the nonflooded
clusters (2.02 percent).
Table 2 provides summary statistics for the dependent variable used. On
average, individuals made riskier choices in the second round, and this
choice is statistically different in the second and third rounds at a
significance level of 5 percent. Among individuals from the same
household, females were seen to make marginally riskier choices in
each round than their male counterparts, though the difference in choice
made is not statistically significant. The correlation between options
chosen by male and female individuals belonging to the same
household is statistically insignificant at 14 percent.
The following section discusses the regression results from an ordered
probit regression of Game option on a vector of independent variables.
OLS regression was also carried out using the average game choice over
the three rounds as the dependent variable. The OLS results are
consistent with the results discussed below and are available on request.

Farah Said, Uzma Afzal, and Ginger Turner
25
Table 2: Summary statistics for game choice
Variable Obs. Mean SD Min. Max.
Option – all rounds 1152 2.47 1.09 1 4
Option – Round 1 384 2.45 1.03 1 4
Option – Round 2 384 2.56 1.11 1 4
Option – Round 3 384 2.42 1.12 1 4
Choice made by males and females from the same household
Option – all rounds, male 456 a 2.45 0.89 1 4
Option – all rounds, female 456 2.53 0.7 1 4
Option – Round 1, male 152 2.43 1.09 1 4
Option – Round 1, female 152 2.49 1.05 1 4
Option – Round 2, male 152 2.46 1.15 1 4
Option – Round 2, female 152 2.5 0.98 1 4
Option – Round 3, male 152 2.44 1.16 1 4
Option – Round 3, female 152 2.59 1.05 1 4
Correlation (average choice by male,
average choice by female from the same household)
0.14
Note: a = Out of the total 384 individuals who participated, only 304 belonged to the
same household. Out of 40 households, only one individual, either male or female,
participated in the games.
Source: Authors’ calculations.
5.2. Regression Results
As shown in Table 3, individuals with flood-related experience do not
make significantly different choices from those who have no experience
of floods. However, individuals who live in areas designated as flood
clusters make systematically more risk-averse choices than those who do
not live in flood clusters. This is consistent with the findings of Cameron
and Shah (2010).
The effect of flood experience on risk aversion is only significant for
individuals who live in areas where floods are more frequent and more
severe (the designated flood clusters). The positive and significant
interaction term between flood clusters and flood experience implies that
individuals with flood experience who live in designated flood clusters

Risk-Taking and Risk-Learning After a Rare Event: Evidence from Pakistan
26
tend to make more risk-loving choices. However, this impact is
insignificant for individuals in flood clusters who had only experienced the
2010 flood (columns 2 and 3, Table 3). Finally, individuals who have
experienced any flood and those who had experienced floods only prior to
2010 (column 3 and 4, Table 3) show the same degree of risk aversion.11
Table 3: Risk aversion and flood experience
(1) (2) (3) (4) (5) (6)
Variable GOption GOption GOption GOption GOption GOption
Lives in a designated flood
cluster
-0.387** -0.132 -0.050 -0.344* -0.376* -0.293
(0.194) (0.134) (0.110) (0.195) (0.216) (0.236)
Has experienced floods
(including 2010)
-0.077 -0.078 -0.104
(0.112) (0.116) (0.106)
Lives in a designated flood
cluster and has experienced
floods
0.384** 0.305** 0.396** 0.447**
(0.168) (0.145) (0.174) (0.197)
Has only experienced the 2010
floods
-0.079 0.037 0.036
(0.171) (0.117) (0.115)
Lives in a designated flood
cluster and has only
experienced the 2010 floods
0.208
(0.270)
Experienced floods prior to
2010 only
0.081 0.078
(0.133) (0.133)
Number of floods experienced -0.027
(0.046)
Number of floods experienced
living in a designated flood
cluster
-0.087**
(0.040)
Round2 0.123** 0.122** 0.123** 0.123** 0.113** 0.114**
(0.053) (0.053) (0.053) (0.053) (0.055) (0.056)
Round3 -0.035 -0.036 -0.036 -0.035 -0.044 -0.044
(0.086) (0.086) (0.086) (0.086) (0.088) (0.088)
11 Note that there are only three participants who live in a flood cluster and have only
experienced floods prior to the 2010 floods. Therefore, an interaction term between pre-2010
flood experience and flood clusters has not been tested.

Farah Said, Uzma Afzal, and Ginger Turner
27
(1) (2) (3) (4) (5) (6)
Variable GOption GOption GOption GOption GOption GOption
Cut1
Constant -0.289 -0.238 -0.268 -0.264 -0.067 -0.075
(0.598) (0.600) (0.617) (0.613) (0.598) (0.560)
Cut2
Constant 0.402 0.453 0.424 0.429 0.623 0.616
(0.598) (0.600) (0.617) (0.613) (0.597) (0.558)
Cut3
Constant 1.192* 1.243** 1.212* 1.218* 1.412** 1.406**
(0.619) (0.620) (0.636) (0.632) (0.614) (0.576)
Observations 1,152 1,152 1,152 1,152 1,131 1,131
Note: Control variables include: respondent age, respondent gender, household income,
household savings, propensity score, and district dummies.
Robust standard errors in parentheses. *** p < 0.01, ** p < 0.05, * p < 0.1.
Source: Authors’ calculations.
The greater the number of floods experienced, the greater is the
likelihood of making risk-averse choices. However, this is only true for
individuals who live in designated flood clusters, that is, risk-seeking
behavior in individuals with flood experience in designated flood
clusters decreases with each flood that they have experienced. Note also
that the inclusion of the interaction term between flood clusters and the
number of floods experienced renders the coefficient on flood clusters
insignificant. Individuals who have experienced multiple floods appear
to consistently make more risk-averse choices; this tendency can be
attributed to the greater level of risk aversion exhibited in designated
flood clusters (Table 3). These results are robust to the estimation
methodology. Table A1 in the Appendix gives the OLS results taking the
average risk choice over three rounds as the dependent variable.
The impact of perceptions and past mitigating actions is shown in Table
4. Participants who undertook actions to mitigate damage incurred after
the 2010 floods, e.g., reinforcing the structure of their house or moving
their possessions to a safer location, are also more likely to make more
risk-averse choices. Similarly, participants who believed the floods
would only worsen in terms of intensity in the future are more likely to
make more risk-averse choices. However, individuals who believed that
nothing could be done to reduce flood damage tend to make more risk-
seeking choices (see Table A1, Appendix).

Risk-Taking and Risk-Learning After a Rare Event: Evidence from Pakistan
28
Table 4: Risk aversion and financial constraints
(1) (2) (3) (4) (5)
Variable GOption GOption GOption GOption GOption
Lives in a designated flood
cluster
-0.440** -0.564*** -0.462** -0.397** -0.441**
(0.193) (0.214) (0.181) (0.184) (0.214)
Has experienced floods
(including 2010)
-0.115 -0.232* -0.278* -0.078 -0.102
(0.114) (0.130) (0.144) (0.113) (0.122)
Lives in a designated flood
cluster and has experienced floods
0.423*** 0.496*** 0.568*** 0.385** 0.441**
(0.163) (0.141) (0.198) (0.166) (0.181)
Flood crop loss as a
percentage of monthly income
-0.002
(0.001)
Flood possessions loss as a
percentage of monthly income
0.002
(0.011)
Flood livestock loss as a
percentage of monthly income
-0.000
(0.005)
Flood house structure loss as
a percentage of monthly income
0.009***
(0.003)
Round2 0.123** 0.125** 0.125** 0.123** 0.123**
(0.053) (0.054) (0.054) (0.053) (0.053)
Round3 -0.035 -0.036 -0.036 -0.035 -0.035
(0.086) (0.086) (0.086) (0.086) (0.086)
Neighbors incurred damage to their houses
0.262** 0.343**
(0.126) (0.142)
Lives in a designated flood
cluster and neighbors
incurred damage to their houses
-0.225
(0.227)

Farah Said, Uzma Afzal, and Ginger Turner
29
(1) (2) (3) (4) (5)
Variable GOption GOption GOption GOption GOption
Received government
assistance
0.030
(0.095)
Related to an influential local -0.158
(0.143)
Cut1
Constant -0.032 -0.307 -0.348 -0.276 -0.237
(0.637) (0.612) (0.606) (0.589) (0.598)
Cut2
Constant 0.660 0.389 0.348 0.416 0.456
(0.639) (0.611) (0.605) (0.589) (0.600)
Cut3
Constant 1.454** 1.182* 1.142* 1.206** 1.248**
(0.657) (0.629) (0.623) (0.608) (0.623)
Observations 1,152 1,152 1,152 1,152 1,152
Note: Robust standard errors in parentheses. *** p < 0.01, ** p < 0.05, * p < 0.1.
These results are after controlling for age, gender, income, savings, propensity score, and
district.
Source: Authors’ calculations.
In sum, observation seems just as important as experience in determining
the effect of floods on risk aversion: individuals who live in designated
flood clusters are more likely to make risk-averse choices even if they
have never experienced a flood. Personal experience of floods in these
areas increases the likelihood of less risk-averse choices. Moreover, while
the frequency of floods experienced has a positive impact on the
likelihood of more risk-averse choices being made, the severity of floods
experienced does not affect risk decision-making. Individuals who had
just experienced the 2010 floods did not make significantly different
decisions from those who had experienced prior floods.
The type of loss is relevant in estimating the impact of loss on an
individual’s risk preference. Risk aversion is lower among individuals who
have sustained losses as a result of flood damage to their house structure.
However, risk aversion is not affected by losses incurred to crops, livestock,
or personal possessions (Table 4). Such losses have no differential impacts
for individuals who live in designated flood clusters. Risk aversion is also
lower for individuals who have observed their neighbors experience flood

Risk-Taking and Risk-Learning After a Rare Event: Evidence from Pakistan
30
damage to their house structure. Levels of risk aversion are not different due
to the receipt of patron or government assistance.
Losses incurred to house structure (as a percent of monthly income) in
2010 are significantly correlated with the current quality of the house, its
ownership, and whether any mitigation measure is now being taken to
reinforce the structure. Individuals who incurred lower losses now have
better-quality houses though we do not have information to ascertain if
this was because of the lower losses incurred earlier. Homeowners
incurred higher losses; of these, 40 percent chose to move away to
avoid the floodwaters, 14 percent chose to reinforce the house to
protect it against flood damage, and only 5 percent did both. Individuals
who had incurred higher household losses in the past were taking
greater measures to protect against future floods and adopting better
building materials (Table 5).
Table 5: Correlation of house loss (percent of monthly income) and
house/owner characteristics
House
has a
finished floor
House
has a
finished roof
Owned
by a
household member
Takes
mitigation
measures now
Reinforced
house
before 2010 flood
Believes
reinforcing
house is effective
Adopted
new
building materials
House
structure
loss (% of income)
-0.075* -0.114* 0.070* 0.080* 0.044 0.063 0.140*
Note: * denotes significance at 10% level.
Source: Authors’ calculations.
Risk aversion is significantly higher for individuals who have received
cash assistance from the government (cash) but lower for those who are
recipients of the Benazir Income Support Program (targeted towards the
rural poor). Further, consistent with theory, individuals who have used
insurance products in the past make more risk-averse choices. We can
also see that individuals from households where a greater proportion of
members work in agriculture, livestock, or as laborers, are more risk
loving (Tables A2 and A3, Appendix).

Farah Said, Uzma Afzal, and Ginger Turner
31
Age and risk aversion are negatively related.12 Older individuals tend to
make more risk loving choices. Furthermore, while risk choices are
insignificantly related to income, individuals who save more tend to be
more risk-averse. Females tend to make more risk-seeking choices and,
consistent with this, individuals from households with a male household
head tend to be more risk-averse. Individuals are also more risk-averse the
more educated is the household head (Tables A2 and A3, Appendix).
Statistically, individuals from households with a higher number of
children (under 16 years of age) do not make more risk-loving or risk-
seeking choices, whereas those from households with a larger
proportion of members who have in-migrated from another location are
more risk-averse. We also see greater risk aversion in individuals who
report that their household has adopted new production or consumption
techniques (cooking, schooling, agriculture, financing, construction).
The impacts of flood experience and living in a designated flood cluster
(discussed above) are robust to adding these individual and household-
level controls. Individuals consistently made riskier choices in the
second round compared to the first (Tables 2, 3, and A1–A3) and then
reverted to relatively more risk-averse choices in the last round.
Participants who had won the higher amount in any option chosen in
round 1 made more risk-seeking decisions in the second round (Table
A4, Appendix). Decisions in the second round were influenced by the
number of floods experienced (greater risk aversion) and losses incurred
as damage to the house (lower risk aversion), but were not influenced by
either flood experience or living in a flood cluster (Table A4, Appendix).
This implies that the number of floods experienced and the severity of
house structure loss incurred influenced learning between games.
6. Discussion and Conclusion
The question of whether people learn about disaster risk is vital for
future disaster risk reduction and preparation. With global flood risk on
the rise, understanding individual risk-taking in the face of disaster is
especially important because it affects individuals’ ability to perceive,
pool, and mitigate risks. When event experiences increase risk salience,
12 The nonlinear impact of age was tested for and found insignificant.

Risk-Taking and Risk-Learning After a Rare Event: Evidence from Pakistan
32
individuals might overestimate risks. Alternatively, if individuals adjust
to coping with risk exposure, they may be less proactive about
protecting themselves against potential disaster risk. The behavior of
individuals ultimately affects the loss burden on themselves, their
communities, and governments.
Risk taking is important for household investment in productive
activities (agricultural techniques, education, entrepreneurship,
migration). If individuals have fixed preferences, they will always return
to their previous investment steady state as their income constraints
recover after a shock. If, however, individual risk preferences can
change with the experience of rare loss events, this could cause a
permanent shift in behavior.
This paper provides evidence that individuals do experience persistent
effects on risk-taking after a rare event. However, there is considerable
individual variation within this and our unique dataset allows us to
examine the effects of such variations in losses and observations, which
has not been discussed in the existing literature. Although the direction of
risk-taking effects is broadly consistent with the literature at the
community level, we find that individuals who have suffered more severe
recent flood losses make riskier choices on average, even after controlling
for income and savings effects. Individuals with a greater number of
lifetime flood experiences make more risk-averse choices, even when
controlling for measures of geographic flood propensity to separate out
potential unobserved characteristics that might lead risk-averse individuals
to live in higher-risk areas. In sum, these results indicate that the timing,
frequency, and severity of losses are important qualifiers.
Furthermore, observation of neighbor or community losses is a powerful
mechanism in risk behavior. Those individuals who have observed their
neighbors or community incur losses react in similar ways to those who
have experienced personal losses, with stronger effects for those who
have observed more severe neighbor losses.
Finally, using multiple game rounds has allowed us to examine the risk-
learning process and to compare learning for people who have
experienced or observed a real loss event. We find that real-world loss
experience or observation strengthens the pattern of behavior changes
after experiencing losses in the game situation. Those who had

Farah Said, Uzma Afzal, and Ginger Turner
33
experienced or observed the most severe (house structure) actual losses
tended to increase their risk-taking throughout the rounds of the game.
Those who had experienced more pre-2010 floods tended to make less
significant changes in strategy throughout the game. This finding points
to an interesting parallel of the external validity of learning about risk in
laboratory versus field environments.

Risk-Taking and Risk-Learning After a Rare Event: Evidence from Pakistan
34
References
Andrabi, T., & Das, J. (2010, September). In aid we trust: Hearts and minds and the Pakistan earthquake of 2005. Paper presented at
the Massachusetts Avenue Development Seminar, Center for
Global Development, Washington, DC.
Arrondel, L., & Masson, A. (1996). Gestion du risque et comportements
patrimoniaux. Economie et Statistique, 296(1), 63–89.
Bajtelsmit, V. L., & Bernasek, A. (1996). Why do women invest differently
than men? Financial Counseling and Planning, 7, 1–10.
Bakshi, G., & Chen, Z. (1994). Baby boom, population aging, and
capital markets. Journal of Business, 67(2), 165–202.
Beegle, K., De Weerdt, J., & Dercon, S. (2011). Migration and economic
mobility in Tanzania: Evidence from a tracking survey. Review of Economics and Statistics, 93(3), 1010–1033.
Behrman, J. R. (1968). Supply response in underdeveloped agriculture: A case study of four major annual crops in Thailand, 1937–1963. Amsterdam: North-Holland.
Botzen, W. J. W., Aerts, J. C. J. H., & van den Bergh, J. C. J. M. (2009).
Willingness of homeowners to mitigate climate risk through
insurance. Ecological Economics, 68, 2265–2277.
Bubeck, P., Botzen, W. J. W., Suu, L. T. T., & Aerts, J. C. J. H. (2012).
Do flood risk perceptions provide useful insights for flood risk
management? Findings from central Vietnam. Journal of Flood
Risk Management, 5(4), 295–302.
Cameron, L., & Shah, M. (2010). Risk-taking behavior in the wake of natural disasters (Working paper). Irvine, CA: University of
California, Irvine.
Çelen, B., & Kariv, S. (2004). Observational learning under imperfect
information. Games and Economic Behavior, 47(1), 72–86.
Farah Said, Uzma Afzal, and Ginger Turner
35
Deryugina, T. (2010). How do people update? The effects of local weather on fluctuations on beliefs about global warming (Research paper).
Cambridge, MA: Massachusetts Institute of Technology.
Dillenberger, D., & Rozen, K. (2011). History-dependent risk attitude
(Working Paper No. 11-004). Philadelphia, PA: Penn Institute for
Economic Research.
Eckel, C., El-Gambal, M., & Wilson, R. (2009). Risk loving after the storm:
A Bayesian network study of Hurricane Katrina evacuees. Journal
of Economic Behavior and Organization, 69(2), 110–124.
Falcon, W. P. (1964). Farmer response to price in a subsistence
economy: The case of West Pakistan. American Economic Review, 54(3), 580–591.
Fleming, D. A., Chong, A. E., & Bejarano, H. D. (2011, July). Do natural disasters affect trust/trustworthiness? Evidence from the 2010 Chilean earthquake. Paper presented at the Annual Meeting of the
Agricultural and Applied Economics Association, Pittsburg, PA.
Gallagher, J. (2012). Learning about an infrequent event: Evidence from flood insurance take-up in the US (Working paper). Cleveland,
OH: Case Western Reserve University.
Gollier, C., & Pratt, J. (1996). Risk vulnerability and the tempering effect
of background risk. Econometrica, 64(5), 1109–1123.
Halliday, T. J. (2006). Migration, risk, and liquidity constraints in El
Salvador. Economic Development and Cultural Change, 54(4),
893–925.
Harrison, G., Humphrey, S. & Verschoor, A. (2005) Choice under
uncertainty in developing countries (Discussion Paper No.
2005–18). Nottingham, UK: Centre for Decision Research and
Experimental Economics.
Holt, C., & Laury, S. (2002). Risk aversion and incentive effects.
American Economic Review, 92(5), 1644–1655.

Risk-Taking and Risk-Learning After a Rare Event: Evidence from Pakistan
36
Jianakoplos, N. A., & Bernasek, A. (1998). Female risk aversion: By age, across cohorts and over the lifecycle (Working paper). Fort
Collins, CO: Colorado State University.
Kahneman, D., & Tversky, A. (1973). Availability: A heuristic for judging
frequency and probability. Cognitive Psychology, 5(2), 207–232.
Kahneman, D., & Tversky, A. (1979). Prospect theory: An analysis of
decision under risk. Econometrica, 47(2), 263–291.
Kunreuther, H., & Wright, G. (1979). Safety-first, gambling, and the
subsistence farmer. In J. Roumasset, J.-M. Boussard, & I. Singh
(Eds.), Risk, uncertainty, and agricultural development (pp. 213–
230). New York, NY: Agricultural Development Council.
Lettau, M., & Uhlig, H. (2002). The Sharpe ratio and preferences: A
parametric approach. Macroeconomic Dynamics, 6(2), 242–265.
Loewenstein, G., Weber, E., Hsee, C., & Welch, N. (2001). Risk as
feelings. Psychological Bulletin, 127(2), 267–286.
Mellor, J. W. (1966). The economics of agricultural development. Ithaca, NY: Cornell University Press.
Morin, R. A., & Suarez, F. (1983). Risk aversion revisited. Journal of Finance, 38, 1201–1216.
Mullainathan, S. (2002). A memory-based model of bounded rationality.
Quarterly Journal of Economics, 117(3), 735–774.
Nielsen, T., Keil, A., & Zeller, M. (2013). Assessing farmers’ risk
preferences and their determinants in a marginal upland area of
Vietnam: A comparison of multiple elicitation techniques.
Agricultural Economics, 44(3), 255–273.
Orozco, G. A. C. (2010). Risk preferences under extreme poverty: A field experiment (Documentos CEDE No. 007717). Bogotá,
Colombia: Universidad de los Andes.
Ortiz, S. (1979). The effect of risk aversion strategies on subsistence and
cash crop decisions. In J. Roumasset, J.-M. Boussard, & I. Singh

Farah Said, Uzma Afzal, and Ginger Turner
37
(Eds.), Risk, uncertainty, and agricultural development (pp. 231–
246). New York, NY: Agricultural Development Council.
Page, L., Savage, D., & Torgler, B. (2012). Variation in risk-seeking behavior in a natural experiment on large losses induced by a natural disaster (Working Paper No. 83). Brisbane, Australia:
National Centre for Econometric Research.
Pakistan, Ministry of Finance. (2013). Pakistan economic survey 2012–13. Islamabad: Author.
Pålsson, A.-M. (1996). Does the degree of relative risk aversion vary
with household characteristics? Journal of Economic Psychology,
17(6), 771–787.
Paxson, C., & Rouse, C. E. (2008). Returning to New Orleans after
Hurricane Katrina. American Economic Review, 98(2), 38–42.
Quiggin, J. C. (1982). A theory of anticipated utility. Journal of Economic Behavior and Organization, 3(4), 323–343.
Quiggin, J. C. (2003). Background risk in generalized expected utility
theory. Economic Theory, 22, 607–611.
Reynaud A., Aubert, C., & Nguyen, M.-H. (2013). Living with floods:
Flood protective behaviors and flood risk perception of
Vietnamese households. The Geneva Papers on Risk and Insurance: Issues and Practice, 38(3), 547–579.
Riley, W. B., & Chow, K. V. (1992). Asset allocation and individual risk
aversion. Financial Analysts Journal, 48(6), 32–37.
Schubert, R., Gysler, M., Brachinger, H., & Brown, M. (1999). Financial
decision-making: Are women really more risk averse? American Economic Review Papers and Proceedings, 89(2), 381–385.
Tanaka, T., Camerer, C. F., & Nguyen, Q. (2006). Preferences, poverty, and politics: Experimental and survey data from Vietnam
(Mimeo). Los Angeles, CA: University of California, Los Angeles.

Risk-Taking and Risk-Learning After a Rare Event: Evidence from Pakistan
38
Voors, M., Nillesen, E., Verwimp, P., Bulte, E., Lensink, R., and van
Soest, D. (2010). Does conflict affect preferences? Results from field experiments in Burundi (Research Working Paper No. 21).
Brighton, UK: MICROCON.
Wang, H., & Hanna, S. (1997). Does risk tolerance decrease with age?
Financial Counseling and Planning, 8(2), 27–31.
Wang, S.-Y., Davies, R. E., Huang, W. R., & Gillies, R. R. (2011).
Pakistan’s two-stage monsoon and links with recent climate
change. Journal of Geophysical Research, 116, D16114.
Weber, E. U., Blais, A.-R. & Betz, N. E. (2002). A domain-specific risk-
attitude scale: Measuring risk perceptions and risk behaviors.
Journal of Behavioral Decision Making, 15(4), 263–290.
Yang, D. (2008). Risk, migration, and rural financial markets: Evidence
from earthquakes in El Salvador. Social Research, 75(3), 955–992.
Zylberberg, Y. (2011). Do tropical typhoons smash community ties?
Theory and evidence from Vietnam (Working paper). Barcelona,
Spain: University Pompeu Fabra.

Farah Said, Uzma Afzal, and Ginger Turner
39
Appendix
Table A1: Ordered probit results for risk aversion and perceptions
(1) (2) (3) (4) (5)
Variable GOption GOption GOption GOption GOption
Lives in a designated flood
cluster
-0.366* -0.315 -0.404** -0.391** -0.551**
(0.196) (0.192) (0.200) (0.197) (0.261)
Has experienced floods
(including 2010)
-0.056 -0.082 -0.076 -0.081 -0.088
(0.112) (0.114) (0.113) (0.111) (0.112)
Lives in a designated flood
cluster and has experienced floods
0.373** 0.422** 0.402** 0.417** 0.378*
(0.164) (0.182) (0.176) (0.173) (0.206)
Took any mitigation action -0.096
(0.128)
Round2 0.123** 0.124** 0.123** 0.123** 0.123**
(0.053) (0.053) (0.053) (0.053) (0.053)
Round3 -0.035 -0.035 -0.035 -0.035 -0.036
(0.086) (0.086) (0.086) (0.086) (0.086)
Lives in designated flood
cluster and took mitigation action
-0.260*
(0.138)
Thinks the next flood will be worse
-0.237**
(0.110)
Lives in a designated flood
cluster and thinks the next
flood will be worse
-0.349**
(0.145)
Lives in a designated flood
cluster and believes nothing
protects against flood damages
0.263**
(0.131)
Cut1
Constant -0.242 -0.224 -0.361 -0.353 -0.355
(0.593) (0.584) (0.584) (0.577) (0.584)

Risk-Taking and Risk-Learning After a Rare Event: Evidence from Pakistan
40
(1) (2) (3) (4) (5)
Variable GOption GOption GOption GOption GOption
Cut2
Constant 0.449 0.469 0.332 0.340 0.339
(0.592) (0.583) (0.586) (0.577) (0.583)
Cut3
Constant 1.240** 1.262** 1.123* 1.132* 1.132*
(0.609) (0.602) (0.606) (0.599) (0.603)
Observations 1,152 1,152 1,152 1,152 1,152
Note: Robust standard errors in parentheses. *** p < 0.01, ** p < 0.05, * p < 0.1.
These results are after controlling for age, gender, income, savings, propensity score, and
district.
Source: Authors’ calculations.
Table A2: Ordered probit results for risk aversion and
household/individual characteristics
(1) (2) (3)
Variable GOption GOption GOption
Age 0.009* 0.009** 0.009*
(0.005) (0.004) (0.005)
Participant is a female 0.150 0.154 0.163
(0.101) (0.105) (0.106)
Log(savings) -0.023* -0.023* -0.019
(0.012) (0.012) (0.012)
Log(monthly income) 0.013 0.022 -0.006
(0.059) (0.061) (0.062)
Lives in a designated flood cluster -
0.361**
-
0.413**
-
0.389**
(0.177) (0.194) (0.174)
Has experienced floods (including 2010) -0.036 -0.059 -0.080
(0.104) (0.105) (0.123)
Lives in a designated flood cluster and has
experienced floods (including 2010)
0.353** 0.382** 0.392**
(0.151) (0.163) (0.169)
Received government flood cash assistance -0.159*
(0.092)
Received government flood nonfood assistance -0.227
(0.185)
Received government flood food assistance 0.132

Farah Said, Uzma Afzal, and Ginger Turner
41
(1) (2) (3)
Variable GOption GOption GOption
(0.087)
Received government flood BISP assistance 0.216**
(0.096)
Round2 0.125** 0.123** 0.122**
(0.053) (0.053) (0.054)
Round3 -0.035 -0.036 -0.035
(0.086) (0.086) (0.086)
Has had insurance in the past -
0.207**
(0.103)
Head of the household is a male -0.106
(0.360)
Ratio of males to females in the household 0.021
(0.052)
Ratio of members who are under 16 years old 0.214
(0.175)
Ratio of members who are migrants -0.282**
(0.129)
Cut 1: Constant -0.234 -0.137 -0.421
(0.587) (0.602) (0.691)
Cut 2: Constant 0.462 0.557 0.272
(0.588) (0.601) (0.690)
Cut 3: Constant 1.257** 1.348** 1.065
(0.604) (0.628) (0.694)
Observations 1,152 1,152 1,152
Note: Robust standard errors in parentheses. *** p < 0.01, ** p < 0.05, * p < 0.1.
These results are after controlling for propensity score, district and the experience of
hardships such as crime, job loss, safety threats, and deaths in the family.
Source: Authors’ calculations.

Risk-Taking and Risk-Learning After a Rare Event: Evidence from Pakistan
42
Table A3: Ordered probit results for risk aversion and
household/individual characteristics
(1) (2) (3) (4)
Variable GOption GOption GOption GOption
Age 0.009** 0.009* 0.009** 0.009**
(0.004) (0.005) (0.004) (0.004)
Participant is a female 0.141 0.139 0.224** 0.149
(0.101) (0.104) (0.113) (0.104)
Log(savings) -0.019* -0.023** -0.017 -0.022*
(0.011) (0.011) (0.012) (0.011)
Log(monthly income) -0.001 0.035 0.011 0.025
(0.057) (0.055) (0.059) (0.055)
(0.315) (0.325) (0.327) (0.342)
Lives in a designated flood cluster -0.352** -0.388* -0.347 -0.426**
(0.168) (0.211) (0.221) (0.195)
Has experienced floods (including 2010) -0.087 -0.050 -0.071 -0.074
(0.116) (0.113) (0.113) (0.109)
Lives in a designated flood cluster and has experienced floods (including 2010)
0.331** 0.341* 0.339* 0.431***
(0.138) (0.186) (0.194) (0.164)
Round2 0.123** 0.110* 0.124** 0.124**
(0.053) (0.057) (0.053) (0.053)
Round3 -0.035 -0.041 -0.036 -0.035
(0.086) (0.089) (0.086) (0.086)
Years of education attained by the household head
-0.035***
(0.011)
Has adopted new techniques -0.228***
(0.079)
Ratio of members who have their own enterprise
0.818
(0.627)
Ratio of members who are in the agriculture or livestock industry
0.936*
(0.480)
Ratio of members who are laborers 1.048***
(0.374)
cut1
Constant -0.205 -0.163 -0.322 0.088
(0.620) (0.582) (0.611) (0.588)

Farah Said, Uzma Afzal, and Ginger Turner
43
cut2
Constant 0.488 0.537 0.374 0.786
(0.622) (0.587) (0.611) (0.592)
cut3
Constant 1.279** 1.330** 1.169* 1.580***
(0.641) (0.604) (0.633) (0.610)
Observations 1,152 1,113 1,152 1,152
Note: Robust standard errors in parentheses. *** p < 0.01, ** p < 0.05, * p < 0.1.
These results are after controlling for propensity score, district and the experience of
hardships such as crime, job loss, safety threats, and deaths in the family.
Source: Authors’ calculations.
Table A4: Risk preferences and learning between rounds
(1) (2) (3) (4)
Variable
Lives in a designated flood cluster -0.333* -0.375* -0.400** -0.415**
(0.187) (0.221) (0.192) (0.199)
Has experienced floods (including 2010) -0.093 -0.089 -0.128 -0.090
(0.106) (0.109) (0.100) (0.112)
Lives in a designated flood cluster and has experienced floods
0.384** 0.352 0.440*** 0.405**
(0.162) (0.226) (0.164) (0.167)
Round2 -0.035 0.067 0.111 0.080
(0.089) (0.091) (0.085) (0.056)
Round3 -0.035 -0.035 -0.044 -0.035
(0.086) (0.086) (0.088) (0.086)
Lives in flood cluster. Round2 -0.034
(0.311)
Has flood experience. Round2 0.036
(0.079)
Lives in flood cluster and has flood experience.
Round2
0.093
(0.319)
Higher amount won in round1. Round2 0.381***
(0.122)
Number of floods experienced. Round2 0.060
(0.056)
Number of flood experienced and lives in
flood cluster. Round2
-0.084*
(0.051)

Risk-Taking and Risk-Learning After a Rare Event: Evidence from Pakistan
44
HH loss share of income. Round2 0.008**
(0.004)
Cut1
Constant -0.310 -0.307 -0.121 -0.213
(0.576) (0.600) (0.585) (0.620)
Cut2
Constant 0.386 0.384 0.569 0.479
(0.577) (0.600) (0.585) (0.621)
Cut3
Constant 1.181** 1.175* 1.358** 1.270**
(0.598) (0.620) (0.601) (0.642)
Observations 1,152 1,152 1,131 1,152
Note: Robust standard errors in parentheses. *** p < 0.01, ** p < 0.05, * p < 0.1.
Source: Authors’ calculations.
Table A5: Results of t-test to check sample balance
Mean t-test
Variable Treated Control %bias T p> |t|
Literacy 0.232 0.219 11.2 0.54 0.593
Education of household head (years) 3.011 2.721 19.0 0.92 0.361
Primary occupation
Agriculture 0.065 0.071 -17.3 -0.75 0.454
Self-employed 0.019 0.020 -9.0 -0.47 0.642
Government employee 0.040 0.038 8.1 0.37 0.711
Average monthly Income 2419.3 233.4 7.7 0.59 0.559
Wealth index -1.050 -1.051 0.1 0.01 0.996
Average distance to public health facility 0.280 0.243 11.2 0.49 0.622
Average distance to boys’ primary school 0.757 0.770 -5.4 -0.23 0.818
Average distance to girls’ primary school 0.6875 0.712 -8.8 -0.38 0.705
Average distance to boys’ secondary
school
0.243 0.204 11.0 0.51 0.612
Average distance to girls’ secondary school 0.209 0.176 9.6 0.45 0.656
% of households with electricity 0.766 0.748 7.6 0.37 0.716
% of households with permanent floor 0.244 0.255 -6.6 -0.36 0.721
% of households with permanent roof 0.605 0.625 -10.1 -0.46 0.65
% of households with permanent walls 0.411 0.442 -14.1 -0.69 0.491
Average number of households who
receive pensions
2.007 1.997 12.3 0.61 0.546
Average number of cattle owned by 3.374 3.294 6.1 0.23 0.816

Farah Said, Uzma Afzal, and Ginger Turner
45
households
Average number of goats owned by households
2.999 2.772 11.8 0.60 0.553
Average poultry owned by households 2.182 1.747 27.9 1.23 0.224
Measure of cluster size (weights) 0.947 1.052 -25.1 -0.79 0.432
Source: Authors’ calculations.
Figure A1: Distribution of household structure loss
Source: Based on authors’ calculations.
Figure A2: Distribution of personal possessions loss
Source: Based on authors’ calculations.
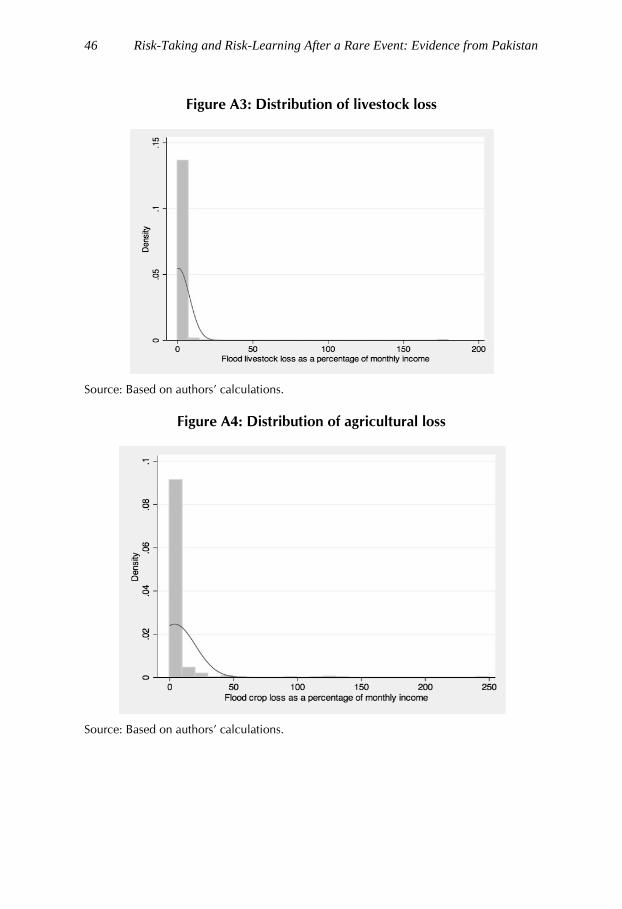
Risk-Taking and Risk-Learning After a Rare Event: Evidence from Pakistan
46
Figure A3: Distribution of livestock loss
Source: Based on authors’ calculations.
Figure A4: Distribution of agricultural loss
Source: Based on authors’ calculations.

Lahore School of EconomicsCentre for Research in Economics & Business
Recent Working Papers
No. 01-14Resource Misallocation and Aggregate Productivity in PunjabMuhammad Haseeb and Theresa Thompson Chaudhry
No. 04-13Labor Pooling as a Determinant of Industrial Agglomeration Najam uz Zehra Gardezi
No. 03-13The Effects of Agglomeration on the Formation and Scale of Operation of New FirmsMaryiam Haroon
No. 02-13Agglomeration and Firm TurnoverMarjan Nasir
No. 01-13Determinants of School Choice: Evidence from Rural Punjab, PakistanHamna Ahmed, Sahar Amjad, Masooma Habib and Syed Ahsan Shah
No. 03-12The Effects of External Migration on Enrolments, Accumulated Schooling, and Dropouts in PunjabRabia Arif and Azam Chaudhry
No. 02-12The Determinants of Child Health and Nutritional Status in Punjab: An Economic AnalysisUzma Afzal
No. 01-12Investigating the Proposed Changes to Pakistan’s Corporate Bankruptcy CodeAli Hasanain and Syed Ahsan Ahmad Shah
No. 02-11Cross-Country Growth Spillovers: Separating the Impact of Cultural Distance from Geographical DistanceAzam Chaudhry and Rabia Ikram
No. 01-11The Determinants of Female Labor Force Participation in Pakistan: An Instrumental Variable ApproachMehak Ejaz
No. 01-10The Determinants of Interest Rate Spreads in Pakistan’s Commercial Banking Sector Ayesha Afzal and Nawazish Mirza
No. 03-09Evaluating the Impact of Microcredit on Women’s Empowerment in Pakistan Salman Asim
No. 02-09Speculative Bubbles in Karachi Stock Exchange Nawazish Mirza
No. 01-09Economic Development: A View From the ProvincesKhalid Ikram
Policy Papers
No. 01-11Pakistan and Lessons from East Asia: Growth, Equity, and GovernanceKhalid Ikram
No. 01-10A Strategy for Reversing Pakistan’s Dismal Export PerformanceHamna Ahmed, Mahreen Mahmud, Naved Hamid and Talal-Ur-Rahim
These papers can be accessed at: www.creb.org.pk

The Lahore School of Economics (established in 1993) is one of
Pakistan's leading centres of learning for teaching and research
in economics, finance and business administration. Its
objectives are (i) to train young Pakistanis as professional
economists, finance managers, accountants, financial analysts,
bankers, and business executives, and (ii) to undertake research
in economics, management, finance, and banking to deepen
the understanding of major facts, issues, and policies.
The Centre for Research in Economics and Business (CREB) is an
independent research centre at the Lahore School of
Economics. CREB’s mission is to conduct and facilitate
research, coordinate and manage the Lahore School’s
postgraduate program, and promote discussion on policy issues
facing Pakistan. The research focus at CREB is on the
management of the Pakistan economy, income distribution and
poverty, and the role of the modern services sector in the area of
economics; and financial markets in the area of business
management.
The Lahore School's publication program comprises the Lahore
Journal of Economics, Lahore Journal of Policy Studies, Lahore
Journal of Business, a Text Book Series, Lahore School Case
Study Journal, the CREB Working Paper Series, and CREB Policy
Paper Series. The program encourages both in-house and
external contributors.