attitudes, southern identity, and race, among other
TRANSCRIPT
Predictors of Perceptions toward the Confederate Flag:
The Impacts of Social Class and Sub-Regional Differences
By
Ryan Talbert
April 2015
Director of Thesis: Dr. Mamadi Corra
Department of Sociology
Abstract: Individuals typically fall within one of two categories when perceiving the
Confederate flag: one, that it reflects Southern culture and regional pride, or two, that it
represents racism and hatred. This work makes a case for the addition of social class and sub-
regional residence to the understanding of perceptions toward the Confederate flag. I utilize two
separate datasets, one that allows control for racial attitudes, and the other a control for Southern
identity. In the former, I test the effects of social class and sub-regional residence in predicting
whether a person supports the removal of the Confederate flag from the South Carolina Capitol,
and in the latter, I test whether a respondent has a negative reaction to the Confederate flag.
These analyses show that in both national samples, social class has an independent effect on
perceptions to the flag. Respondents of the upper class are more likely to reject the public display
of the flag and to have a negative reaction when presented with the symbol relative to members
of the lower class. This thesis also shows that not only does being from the Non-South and
Border States predict a stronger likelihood of wanting the Confederate flag removed relative to
the Deep South respondents, but that different factors matter within the four sub-regions in
predicting perception toward flag. For example, being from a rural area statistically predicts
perception toward the flag only within the Deep South. In line with previous research, racial

attitudes, Southern identity, and race, among other variables, predict flag perceptions. Further
split model analyses show that key independent variables contrast among Black and White
respondents, and lower, middle, and upper class respondents. Results are consistent with both
symbolic politics theory and racial threat theory.

Predictors of Perceptions toward the Confederate Flag:
The Impacts of Social Class and Sub-Regional Differences
A Thesis Presented to
The Faculty of the Department of Sociology
East Carolina University
In Partial Fulfillment
Of the Requirements for the Degree
Master of Arts in Sociology
By
Ryan Talbert
April 2015

© (Ryan D. Talbert, 2015)
Predictors of Perceptions toward the Confederate Flag:
The Impacts of Social Class and Sub-Regional Differences
By
Ryan Talbert
APPROVED BY: DIRECTOR OF THESIS: _________________________________________________________
Mamadi Corra, Ph.D. COMMITTEE MEMBER: ________________________________________________________
Melinda D. Kane, Ph.D. COMMITTEE MEMBER: _______________________________________________________
A.J. Jacobs, Ph.D. COMMITTEE MEMBER: _______________________________________________________
Anthony Papalas, Ph.D. CHAIR OF THE DEPARTMENT OF SOCIOLOGY:__________________________________
Marieke Van Willigen, Ph.D.
DEAN OF THE GRADUATE SCHOOL:____________________________________________ Paul J. Gemperline, Ph.D.

Dedication
To my cohort
Acknowledgement
First and foremost, I would like to thank my thesis chair, Dr. Mamadi Corra not only for
his time, effort, and support, but also for amount of mentoring that I have received throughout
the completion of this thesis. I would also like to thank the rest of my thesis committee: Dr.
Kane, Dr. Jacobs, and Dr. Papalas. Your different expertise served me well in approaching this
subject. Thank you to all of you.
To my support system: my family, friends, cohort, and mentors, as always, I couldn’t
have done this without your love and support. Thank you for everything that you all do. I am also
indebted to members of the East Carolina Sociology Department that went out of their way to
assist me in every way possible. Thank you to Dr. Van Willigen, Dr. Powers, and Dr. Wilson for
the various roles you have played in this project.
Table of Contents
Title page ......................................................................................................................................... i Copyright page ................................................................................................................................ ii Signature page ................................................................................................................................ iii Dedication page ............................................................................................................................. iv Acknowledgement page ...................................................................................................................v Table of Contents ........................................................................................................................... vi List of Tables ............................................................................................................................... viii List of Figures ................................................................................................................................ ix CHAPTER I. INTRODUCTION .....................................................................................................1
1.1 The Current Project ........................................................................................................4 CHAPTER II. THEORETICAL FRAMEWORK .........................................................................11
2.1 Symbolic Politics Theory .............................................................................................11 2.2 Racial Threat Theory ...................................................................................................13
CHAPTER III. LITERATURE REVIEW .....................................................................................16 3.1 Previous Studies ...........................................................................................................16 3.2 Race, Region, and Support for the South Carolina Confederate Flag ........................22 3.3 Race and Politics in the U.S. South .............................................................................23 3.4 Cultural Symbols .........................................................................................................25
CHAPTER IV. DATA, METHODS, AND SAMPLE DESCRIPTION .......................................28 4.1 Annenberg National Survey .........................................................................................29 4.2 Pew Research Survey ...................................................................................................31
CHAPTER V. RESULTS ..............................................................................................................34 5.1 Annenberg Univariate Statistics ..................................................................................34 5.2 Annenberg Bivariate Statistics .....................................................................................35 5.3 Annenberg Multivariate Statistics................................................................................37 Sub-Regional Analyses ......................................................................................................41 5.4 Annenberg Non-South Sample ....................................................................................41 5.5 Annenberg Border States Sample ................................................................................43 5.6 Annenberg Upper South Sample .................................................................................45 5.7 Annenberg Deep South Sample ...................................................................................47 Race Analyses ....................................................................................................................49 5.8 Annenberg Black Respondents Sample .......................................................................49 5.9 Annenberg White Respondents Sample.......................................................................51 Social Class Analyses ........................................................................................................53 5.10 Annenberg Lower Class Sample ................................................................................53 5.11 Annenberg Middle Class Sample...............................................................................54 5.12 Annenberg Upper Class Sample ................................................................................56 5.13 Pew Univariate Statistics ...........................................................................................57 5.14 Pew Bivariate Statistics..............................................................................................59 5.15 Pew Multivariate Statistics ........................................................................................60
CHAPTER VI. DISCUSSION.......................................................................................................64 CHAPTER VII. CONCLUSION ...................................................................................................72 References ......................................................................................................................................75 Figures............................................................................................................................................84

Tables .............................................................................................................................................85 Appendices ...................................................................................................................................103
List of Tables
TABLES ........................................................................................................................................85 Table 1: Comparison of Datasets ...................................................................................................85 Table 2: Annenberg Dataset Questions and Recoding ..................................................................86 Table 3: Pew Dataset Questions and Recoding .............................................................................85 Table 4: Descriptive Statistics for Annenberg Dataset ..................................................................88 Table 5: Sub-regional Percentages for Annenberg Dataset Demographics ...................................90 Table 6: Contingency Table for Annenberg Dataset .....................................................................91 Table 7: Logistic Regression Predicting Support to Remove South Carolina Confederate Flag for Annenberg dataset ..........................................................................................................................92 Table 8: Logistic Regression Predicting Support to Remove South Carolina Confederate Flag for Annenberg dataset: Non-South ......................................................................................................93 Table 9: Logistic Regression Predicting Support to Remove South Carolina Confederate Flag for Annenberg dataset: Border States ..................................................................................................94 Table 10: Logistic Regression Predicting Support to Remove South Carolina Confederate Flag for Annenberg dataset: Upper South..............................................................................................95 Table 11: Logistic Regression Predicting Support to Remove South Carolina Confederate Flag for Annenberg dataset: Deep South ...............................................................................................96 Table 12: Logistic Regression Predicting Support to Remove South Carolina Confederate Flag for Annenberg dataset: Black and White Split Models .................................................................97 Table 13: Logistic Regression Predicting Support to Remove South Carolina Confederate Flag for Annenberg dataset: Lower, Middle, and Upper Class Split Models ........................................98 Table 14: Descriptive Statistics for Pew Dataset ...........................................................................99 Table 15: Contingency Table for Pew Dataset ............................................................................100 Table 16: Logistic Regression Predicting Negative Reaction to the Confederate Flag for Pew Dataset..........................................................................................................................................101

List of Figures
FIGURE .........................................................................................................................................85 Figure 1: 2010 U.S. Census Map Illustrating Percentage of Black Population in Counties across Sub-Divided Southern Regions......................................................................................................85
CHAPTER I. INTRODUCTION
The Confederate flag remains a symbol of controversy in the United States. The emblem
is powerfully meaningful as illustrated by the amount of emotions that it stirs. While some argue
that the flag is a positive symbol that has been tarnished by hate groups and years of
misrepresentation, others believe that the flag carries negative racial connotations that cannot be
separated from a Southern regional pride.
The flag has been used by counter-organizers to defiantly stand against movements with
which they disagree and by people who simply revere its symbolism; yet in one case, a mistaken
interpretation of its symbolism resulted in the death of a person. A 1995 New York Times article
told the story of a young White male who was shot and killed by three Black men that seemingly
took exception to his flying the Confederate flag in the bed of his truck. The case investigator
noted that in his opinion, the culprits’ only motivation for violence was the presence of the
Confederate flag. In a separate but also impactful event, during the recent widely covered
indictment trial involving the shooting of Ferguson, Missouri, teenager Michael Brown,
protesters were met by counter-organizers holding a Confederate flag (Kansas City Star 2014).
In this sense, race seems to matter in terms of how people feel towards the flag, at least on the
surface. In stark contrast, others view the flag in a positive light. Byron Thomas, an African
American undergraduate at the University of South Carolina and subject of a 2011 news article,
is quoted as saying that the Confederate flag is a symbol of “Southern Pride” distinct from what
others see as a racist symbol (Aziz 2011).
The flag continues to stir radically diverging views no matter the setting, and because it
carries with it such controversy, some institutions have altered rules allowing its usage. In the
Missouri public school system, the flag becoming more and more of a "disruption to learning"
2
led law makers to ban it from public school grounds (Luetkemeyer 2010). Even more
noteworthy, a recent New York Daily News article (2014) states that California has banned the
selling and displaying of Confederate-flag-emblazoned memorability on state property. Whether
the flag is a positive or negative symbol or not, the debate seems to have reached such high
levels that lawmakers believed it posed a controversial distraction and took action to ban its
presence in certain environments.
Generally, opinions toward the flag follow a view that it represents southern heritage or
that it is a symbol of racial hatred. Scholars have termed this a heritage versus hate debate
(Woliver, Ledford and Dolan 2001; Leib 1995). In other words, scholars have analyzed whether
conservative racial attitudes or identifying with and being prideful of the U.S. South are more
predictive of supporting the Confederate flag. Research has linked racial attitudes as well as
Southern heritage with flag support, yet what’s found is that racial attitudes are more strongly
related than Southern identity (Clark 1997; Reingold and Wike 1998; Orey 2004; Cooper and
Knotts 2006). Others have labeled these two ideologically opposing camps as “’traditionalists’”
and “’modernists’” (Martinez 2008:200). Illustrating this debate, a Huffington Post (2012) article
entitled “Lynyrd Skynyrd: Confederate flag Is 'Heritage, Not Hate'” notes that the Las Cruces
Tea Party in New Mexico generated anger for flying the Confederate flag on their parade float.
Although the city mayor apologized for the incident, the Tea Party defended using the symbol on
the grounds that: “The float was intended to celebrate the totality of the state's history.”
Likewise, in the same (2012) article, the author includes an anecdote of a bus driver in Oregon
that lost his job for flying the flag on his vehicle on school property. The individual went on to
win court battle for the right to sue the school district citing a violation of the First Amendment
(Huffington Post 2012).

3
Historically, the Confederate flag has taken on different meanings over time in U.S.
history. While the flag was never officially adopted by the Confederate States of America (CSA),
the Flag was flown during the 1860s as the battle flag of the CSA (Coski 2005). Fast forward
100 years and the flag is a symbol utilized by reactionary social groups such as the Ku Klux Klan
and White Citizens Councils. In more modern times, Neo-Confederate groups across the nation
from such as the League of the South and Southern Legal Resource Center not only use the Flag
to represent themselves, but also use the court system to staunchly defend its usage (Southern
Poverty Law Center 2000).
The Confederate flag has flown over the capitol buildings in Alabama and South
Carolina, and the Confederate flag’s cross insignia has been represented as a portion of the state
flags in Georgia, Mississippi, and Alabama (Coski 2005; Hutson 1995). Currently, Mississippi is
the only state that still uses the Confederate flag in its own state flag (Coski 2005). Even still, the
flag remains an object protected by state law in some areas. Many southern states such as
Florida, Georgia, Louisiana, Mississippi, and South Carolina continue to have statutes banning
the desecration of the Confederate flag (Fla. § 256:10; Ga. § 50-3-1; La. RS § 14:116; Miss.
Code Ann. § 97-7-39; S.C. Code § 16-17-220; Coski 1996).
Although one might imagine that like with these aforementioned states’ protection
measures, the flag is only connected to the U.S. South, it actually is a symbol used
internationally too. Case in point, twenty five years ago during the coverage of the fall of
Communist Eastern Europe, Confederate flags were waived as a symbol for “national
liberation;” years later, they also emerged in protests promoting Democracy in Yugoslavia
(Coski 2005: 292). Moreover, during World War II, military personnel from the U.S. South
stationed around the globe used the flag as a symbol of regional pride (Davis 1998).
4
Debate over the flag reached the national level in 2000 when the flag was eventually
removed from the South Carolina state capitol after a long battle over its presence. To understand
the controversy it created, the 2000 Annenberg Survey conducted by the University of
Pennsylvania School of Communication captured opinions toward the flag’s public display and
subsequent removal during the most contested times. Over 34% of respondents supported
keeping the flag atop the capitol while 32% desired its removal (Romer et. al. 2004). Less than a
decade prior, in a survey of Georgians asked whether they wish to keep the then Confederate flag
as a part of the Georgia state flag or wish to change it altogether, 60% of respondents took one of
the two strongest positions either strongly supporting or strongly opposing it (Clark
1997:485).Such polar opposite yet uniquely proportional positive and negative impressions
suggests that the flag is still widely disputed.
A recent Pew Research national survey (April 2011 Political Survey 2011) shows that
one quarter of respondents identify themselves as Southerners with 22% of those Whites
Southern-identifying respondents having a positive reaction to the Confederate flag.
Comparatively, only 4% of Whites that do not identify as Southern view the flag positively.
When it comes to racial differences, 41% of Black respondents expressed a negative view of the
flag compared to 30% of Whites (“Civil War at 150: Still Relevant, Still Divisive” 2011). From a
statistical standpoint, race and pride in one’s Southern heritage both have an influence on
perception of the flag.
1.1 The Current Project
Ultimately, the historical significance of the flag has been translated to modern times, and
with the United States’ history of contentious and violent race relations, I undertake an in-depth
investigation into the symbol and predictors of positive (or negative) perceptions to it. This
5
project attempts to add to research that focusses on the connection between racial attitudes,
Southern heritage, and the Confederate flag, by identifying the direct effects of social class and
sub-regional heritage. Debate on the flag has led to a heritage versus hate conceptualization of
attitudes toward the symbol (Woliver, Ledford, and Dolan 2001; Leib 1995). Although scholarly
inquiry into the subject has generated robust findings (See, for example, Cooper and Knotts
2006; Clark 1997; Reingold and Wike 1998; Orey 2004), no work yet has systematically
analyzed perceptions of the flag in relation to race, sub-region, racial attitudes, Southern identity
and social class.
Social class is an overlooked yet seemingly crucial predictor of flag perception. People of
a lower social class typically lack feelings of personal control, and as a result, they typically
explain social outcomes as a result of factors external to what they can control (Krause, Piff, and
Keltner 2009). Because Blacks and Whites of the same social class are typically competing for
the same resources, this competition would seemingly be even greater in the strata that has fewer
resources to offer. Applying the theory of racial threat to the topic of the flag, Whites of social
strata with more racial competition would be expected to view the flag more positively than
those of higher social classes that have no real competition for resources with members of
another race. According to most theories on race, social class should matter because, for
example, the position of the poor is more threatened by racial equality than any other social class
(see Bonacich 1972, 1976; Bobo and Kluegel 1993) thus creating conflict between social groups.
Bobo (1983:1200) suggests that this conflict is not solely about the objective competition for
resources but also, “the subjective assessment of a threat posed by out-group members to
individual and collective interests.” As an example, dating back to the time of integration in the
middle of the 20th century, Whites with lower socioeconomic status were impacted by racial
6
integration more than others. As Sokol (2008) states, “the upper classes maintained country
clubs, private schools, and exclusive suburbs [while] poorer whites confronted [newly
desegregated] public schools, swimming pools, and neighborhoods.” Additionally, the South’s
culture is unique, and its music represents this uniqueness while interweaving race and class into
musical works. In Eastman and Schrock’s (2008) analysis of Southern Rock music, they find that
bands use the Confederate flag to symbolize not only a new construction of “white trash,” but
also as a boundary between them and the White upper class. In other words, “Musicians’ display
of the flag and can be seen, at least in part, as a kind of class resistance, as well as revaluing
stereotypes of southerners” (Eastman and Schrock 2008:210).
This study differs from previous investigations into the topic of the flag in that it divides
the United States into four areas: the Deep South, Upper South, Border States, and the Non-
South. The Deep South, historically and contemporarily, is unique politically, demographically,
and economically even within the context of the already distinct U.S. South. Historically, seven
states (South Carolina, Georgia, Florida, Alabama, Mississippi, Louisiana, and Texas) seceded
from the United States Union prior to the Battle at Fort Sumter in April of 1861 (White 2011).
Politically, the Deep South’s particularity is evident; for example, with the 1964 Presidential
campaign that pitted Barry Goldwater, an overt conservative on civil rights issues, against Texas-
native and President Kennedy successor, Lyndon B. Johnson. Of the total six states in which he
had a majority, Goldwater won five of the seven Deep South states and Arizona, his home state.
He took an astonishing 87% majority in Mississippi. Johnson won all other states in the union
(Winter 2013). In addition to the results of the campaign, two important political changes
immediately affected the Deep South’s politics: Black voters’ bloc growing exponentially
politically, and the Republicans’ newly implemented “Southern Strategy” (Winter 2013). Winter

7
(2013) asserts that these changes rearranged Southern politics, and over the next few decades,
Watergate, Jimmy Carter’s successful campaign targeting an inter-racial coalition, and Ronald
Reagan’s invoking states’ rights in his 1980’s campaign, altered the Deep South politics even
more. These changes can be understood as positive or negative, but more importantly, they point
to the political uniqueness and relevancy of the Deep South. Prior to President Obama, three of
the past five presidents were from states in the Deep South, and four of five were from either the
Upper South or Deep South (Winter 2013).
Demographically, race also continues to be relevant to the Deep South in some ways
more so than the rest of the nation (Winter 2013). The Deep South has a greater proportion of
Blacks to Whites within each state (Rastogi et. al. 2011). The map of the United States in Figure
1 shows the percent Black of each state. Darker colors indicate a larger percentage of Blacks in
the area. With the exception of Texas and Florida, two states which Shafer and Johnston (2009)
include in their “Peripheral South” conceptualization, all Deep South states have a Black
population greater than 25% of the total state population. Of the other Upper South and Border
States, only Maryland has a black population that makes up more than 1/4th of the total
population (Rastogi et. al. 2011). Since the Deep South’s population has more Blacks compared
to other regions of the U.S., racial threat is more explicitly present. Thus, according to the theory
of racial threat, the Deep South should generally exhibit more positive views of the flag relative
to other areas since inter-racial competition is more of a reality compared to other regions.
The Deep South, historically, had a different economy compared to the rest of the United
States. Dating back to the time of slavery, the South relied mostly on an agricultural economy
based on plantation slavery. This is in comparison to the rest of the nation that did not have the
South’s rich-soil to maintain an agro economy. Northern economies relied more on “indentured
8
servitude, apprenticeship, and wage labor, rather than slavery,” and were affected by growing
transportation ventures which created larger pools of workers and widened the economic base of
the Northern United States (White 2011:475). Lang (2013:374) states that even after the passing
of the thirteenth amendment and the outlawing of slavery, the South continued, “a heritage of
plantation slavery through sharecropping, which preserved the existence of large, low-waged
African American populations subject to debt peonage, enticement statutes, vagrancy and
contract enforcement policies, and similar modes of racialized, labor-repressive class relations.”
The Deep South’s economic differences compared to other regions of the nation impact the
region’s population demographics and vice versa. In their economic analysis, Felbermayr and
Groschl (2014:399) find that, “The defunct border [separating the North from the South]
represents a trade barrier that lowers trade between U.S. states by on average 7% to 22%.” The
Civil War, its causes and effects, continues to impact economics. More relevantly, the Deep
South’s distinctive economics have influenced Southern politics and race relations over time.
The Upper South is states that seceded from the Union after the battle of Fort Sumter:
North Carolina, Tennessee, Arkansas, and Virginia. All four Upper South states are represented
as one of the thirteen stars on the Confederate flag, but, dissimilar to the Deep South, they “were
not historically dominated by the agrarian elite” (Lang 2013:388). In addition, Murphy (2005)
notes that the Upper South was less dependent on the large plantation style economies of the
Deep South; yet they profited from the slave based economy in many ways by developing
insurance companies that began issuing life insurance for slaves, benefiting owners. In some
cases, policies would not be granted on slaves that were sold south of North Carolina because of
a perceived maltreatment in the deeper parts of the region (Murphy 2005). Moreover, the Upper
South differed from the Deep South in its manners of control; the former relied on ‘white
9
paternalism’ and the latter, ‘legal terrorism and vigilantism’ (Lang 2013:376). In terms of time of
secession, economics, and social control, the Upper South is differentiated from the Deep South.
Border States, conceptually similar to Lang’s (2013) definition and identical to
Felbermayr and Groschl (2014), are understood as Maryland, Kentucky, Missouri, West
Virginia, and Delaware. Lang (2013) terms Border States as the ‘border South,’ and includes:
Maryland, Kentucky, Missouri, Delaware, West Virginia and Tennessee. Since Tennessee
seceded from the Union after the Battle of Fort Sumter and subsequently joined the Confederacy,
it is considered to be a part of the Upper South for this project. Felbermayr and Groschl (2014)
assert that these states were represented in both the North’s and South’s militias; therefore it is
difficult to ascertain their loyalty on either side. The Border States hold a peculiar place
geographically splitting the Union from the Confederacy. In the Border States, the economy did
not depend on a single crop plantation system as occurred in the Deep South, and this resulted in
a smaller number of Blacks in the area. Slavery was not the primary economic base of the Border
States, but slavery was legal at some point in these states (Lang 2013). Lang (2013) notes that
Border States epitomized the nation’s division when it came to slavery; Missouri’s admittance
represented the first challenge to the dispute of the legality of slavery. Bleeding Kansas events
followed by the Dred Scott decision ultimately precipitated the Civil War (Lang 2013).
Furthermore, more contemporarily, Border States were the first former slave states to begin
“dismantling legal racial apartheid in higher education, housing, and employment
discrimination” (Lang 2013:318). The Border States served as the border between the North and
South, and they epitomized the debates that led up to the Civil War. Border States are
distinguished from both the Deep South and Upper South.

10
In sum, to better uncover and explain what predicts support for the Confederate flag, this
study uses the theories of symbolic politics and racial threat, and largely builds upon previous
scholarship as an investigative template. Two datasets will be used for this project. Data used for
this part of the project comes from the same Romer et. al. (2004) Annenberg national dataset
collected in 2000, and used by Cooper and Knotts’ (2006) study Race, Region and Support for
the South Carolina Confederate Flag. A second dataset comes from a more recent (April 2011
Political Survey 2011) national survey conducted by the Pew Research Center and noted above.
Taken together, these two sets of datasets will be used to answer the questions: what variables
predict positive (or negative) support for the Confederate flag? What role does sub-regional
residence (i.e., Deep South, Upper South, Border States, and Non-South) play in this respect?
How does social class influence perception?
CHAPTER II. THEORETICAL FRAMEWORK
I approach and explain perception of the flag by using symbolic politics and racial threat
as a theoretical framework. Each of these two approaches provide a unique way of examining
our subject matter and, in the two sub-sections to immediately follow, I discuss each in turn.
2.1 Symbolic Politics
Sears, Hensler, and Speer (1979:381) explain symbolic politics theory suggesting that,
“The ongoing flow of information about public events presents symbols which evoke habitual
emotional responses from the citizen. These need not necessarily be isomorphic; symbols similar
to those originally associated with the response may, by stimulus generalization, evoke the same
response.” The Confederate flag carries with it racial significance, according to some. Both
Blacks and Whites interpret the flag with this significance in mind. In their theoretical
contribution to Symbolic Racism theory, Sears, Hensler and Speer (1979:381) explain, “The
racial imagery surrounding the concept of busing is enough to evoke racial attitudes.” Busing,
then as a symbol, queues racial attitudes similar to the Confederate flag. Those that perceive it
positively would typically score more conservatively on the racial attitudes scale simply because
the flag evokes these types of attitudes.
Clark (1997) supports the notion of symbolic politics with his findings that those that
grow up outside of the South view the flag differently than those that grow up within the South.
Socialization is crucial to interpreting symbols, the crux of symbolic politics theory (Clark
1997). Kaufman (2001:29) in his work Modern Hatreds: The Symbolic Politics of Ethnic War,
states that the central assumption of symbolic politics theory is that, “people make political
choices based on emotion and in response to symbols.” Moreover, Grillo (2012) suggests in the
12
understanding of symbolic politics, “successful leaders appeal to hostile myths and symbols
about the out-group to evoke strong negative emotions such as fear and anger, while also
appealing to positive emotions that rouse a sense of self-worth and optimism for the in-group's
future.”
Symbols, like the Confederate flag, evoke emotional responses. The flag was used during
a highly racially contested era of the 1950’s too as a mode to draw on these emotions. Kaufman
(2006:66) states that, “When the government began to shift on racially related politics in
response to the civil rights movement, opportunity to mobilize presented itself.” Similarly, if the
federal government acts on behalf of one group, an opposing group will feel their interests not
getting heard. Likewise, the outcomes of Brown v. Board, “provoked a response from race hard-
liners most visibly in the South” (Kaufman 2006:66). Areas that had typically been segregated
were going to be legally integrated. People responded drawing on a symbolic pushback in the
form of placing the Confederate flag atop many capitol buildings (Coski 2005). Thus, people in
an area such as the Deep South would view the flag differently relative to the Non-South.
In application of symbolic politics, people of different ages would view the flag similarly
in an area where the flag is more visible. In other words, citizens of a sub-region such as the
Deep South where the flag is more salient would view the flag similarly according to what they
have associated its meaning. In other words, although no age gap may exists, there would likely
be racial gap in perception. Additionally, a person’s age in certain areas would not matter in
determining perception toward the flag because, in part, that sub-region’s culture influences
generations equally. Outside of the Non-South, for example, there would be opinion differences
between generations because younger people may not be aware of the flag’s meaning historically
(Cooper and Knotts 2006).
13
2.2 Racial Threat Theory
States that have and continue to display the Confederate flag are overtly supporting
whatever message it is intended to send (Dorf 2011). Historically, in Alabama, “The
[Confederate] flag was placed atop the Alabama Capitol on the very ‘day that United States
Attorney General Robert F. Kennedy travelled to Montgomery to discuss with then-Governor
George Wallace the governor's announced intention to block the admission of the first black
students to the University of Alabama’ (Dorf 2011:1318). It was removed in 1993 (Dorf 2011).
Ultimately, the flag was used symbolically at a time when integration was actively being
disputed. Integration affected the lower strata on a more personal level compared to upper levels
(Sokol 2008), and this personal-impact also presents a new group threat and a shift in the status-
quo (Bobo 1983). Racial threat applies to perceptions toward the Confederate flag.
In states such as Alabama, having a population greater than 25% Black means that there
will be interracial competition for resources and status. Racial threat rests on the idea that,
“racialization occurs when Whites use their disproportionate power to implement state-control
over minorities and, in the face of a growing minority population, encourage more rigorous,
racialized practices in order to protect their existing power and privileges” (Dollar 2014:1). This
threat can take the form of an economic, political, or symbolic threat (Dollar 2014). Giles and
Buckner (1993) support racial threat theory in a study on the 1990 Louisiana Senate race
between notable KKK affiliate David Duke and his opponent. In areas with higher
concentrations of Black populations, higher percentages of Whites registered to vote and
consequently voted compared to other regions (Giles and Buckner 1993). In other words, “The
greater the threat which blacks posed to white political hegemony, the greater the proportion of
eligible whites who registered to vote” (Giles and Buckner 1993:711). Stated clearly, where a
14
Black population seemingly poses a threat to the White citizenry in an area, whether real or not,
there tends to be an effort to reinforce group dominance.
In a related application of racial threat to a racially motivated group, Cunningham
(2013:7) explains that one reason the civil rights era Ku Klux Klan in North Carolina was able to
recruit such a formidable following is because, “[W]hite residents perceived civil rights reforms
to be a significant threat to their status.” In other words, Klan recruiters utilized racial threat to
their advantage to propagate their group (Cunningham 2013). Within racial threat, there is a fear
of an out group encroaching on the in-groups’ livelihood, resources, or opportunities.
Cunningham (2013) furthers his point by stating, “Much of the difference in UKA strength
across the state was due to county-by-county shifts in factors associated with this perceived
racial threat, including the degree of overlap between black and white workers, black electoral
strength, the vibrancy of civil rights activism, and the level of interracial contact in schools,
shops, and other public venues” (Cunningham 2013:11). In addition, not only were Klan chapters
of the early and mid-1960’s in areas with greater Black/White proportion, they were also more
likely to be found in counties with incomes, on average, lower than the median (McVeigh et. al.
2014). Taking into consideration the racial and class conflict present at different intensities
within the South, respondents in sub-regions where there is greater racial threat would be
expected to show a greater racial divide on the topic of the Confederate flag.
Racial threat is highly evident in Figure 1, a display of the southeastern United States.
Whites in the Deep South would be expected to see the flag quite differently compared to Blacks
in the same sub-region. In a sense, the racial threat effect leads to diverging views on what some
would suggest is a racist symbol. Similarly, perceptions toward the flag would also be expected
to deviate based on sub-region. An area like the Non-South where racial threat is not as apparent

15
may not have the same strong positive correlation between White respondents and support for
the Confederate flag. In other words, the racial opinion gap would not be as pronounced as in the
Deep South.

CHAPTER III. LITERATURE REVIEW
3.1 Previous Studies
The political fight over the Confederate flag follows a view that it represents southern
heritage or that it is a symbol of racial hatred. Frequently framed as "heritage verses hate"
(Woliver, Ledford, and Dolan 2001; Leib 1995), previous studies have, not surprisingly, also
investigated which of these two better explains attitudes toward the flag. While limited in scope
(see below), such studies have generally found that conservative racial attitudes are more
important than measures of southern heritage in explaining support for the flag (Clark 1997;
Reingold and Wike 1998; Orey 2004).
Racial attitudes play a strongly predictive role in opinions towards the flag. In a study of
undergraduates at eight universities in Mississippi, one researcher finds that conservative racial
attitudes continue to be the biggest predictor of support for the symbol (Orey 2004). Likewise,
others have found a similar connection between conservative racial attitudes and support for the
flag (Reingold and Wike 1998; Clark 1997). In other words, previous analyses have indicated
that feeling, for example, that the federal government should do nothing or less than they
currently do to protect Blacks from job discrimination, is predictive of supporting the flag’s
presence (Cooper and Knotts 2006). To take it one step further, Orey (2004) shows that not only
do racial attitudes predict perception to the flag, but more specifically, old-fashioned racism as
opposed to symbolic or new racism better explains the relationship between how individuals feel
about racially related matters and opinions of the flag.
Since one half of the heritage versus hate argument is in fact that the flag represents
Southern heritage and culture, scholars have, not surprisingly, found a link between Southern

17
identity and support for or a positive impression of the Confederate flag (Cooper and Knotts
2006). To some,
[A] positive version of the Confederate past is deeply rooted in the public memory of the South and remains, especially for many white southerners, a key element of southern identity. These people believe strongly that a southern heritage of bravery and idealism is real. They deeply resent the demand that Confederate symbolism be repudiated and construe the attack on the Confederate past as heavy-handed, politically correct moralizing that vilifies white southern identity. Most of all, they fear imposition of a new orthodoxy of southern apology, wherein anything southern is automatically assumed to be racist (Thornton 1996:233-234).
Reingold and Wike (1998) find that racial attitudes and southern identity are inextricably linked,
and identifying with the Old South does predict positive perceptions of the flag. On the other
hand, identifying with the New South correlates with more progressive views on racially related
topics. In both cases, Southern identity and perceptions of the flag are associated (Reingold and
Wike 1998). Results assessing the link between Southern identity and flag perception are not
always consistent, however. Controlling for all variables in his analysis, Clark (1997:490) finds
that the relationship between growing up in the South and support for the flag is not statistically
significant. He does caution interpreting this result at face value though since region could
indirectly impact other predictor variables leading to its lack of statistical significance.
More recent literature suggests a possible complicated relationship between predictor
variables and opinions such that racial attitudes explain only a portion of the variation in
perceptions. In a national survey of both Blacks and Whites, Cooper and Knotts (2006) show that
although racial attitudes do affect perceptions of the flag, race of the individual and region
interact in unique ways to predict support for the flag. Yet, it is also important to note that, even
in this study, racial attitudes were found to exert a significant influence on perceptions of the flag
for both Southerners and non-Southerners, although statistically more so for Southerners (Cooper
18
and Knotts 2006). Thus, scholarship supports the idea that racial attitudes play a critical role in
predicting positive attitudes to the Confederate flag, but this relationship seems to be mediated
by the interaction of race and region.
Race is a crucial element to predicting perception to the flag. In his analysis of political
supporters of a measure to remove the Confederate flag as a part of the Georgia state flag in
1993, Leib (1995) finds that none (thirty-one total) of the Black members of the Georgia House
of Representatives sponsored House Bill 637 that threatened funding cuts to regions that did not
fly the Georgian flag with its Confederate emblem. One-hundred and one White House members
did sponsor it, all of which were White (Leib 1995). Similarly, over 92% of Alabama’s House
members that voted to return the Confederate flag to the top of the House Chamber were from
districts with constituencies less than 20% Black (Webster and Leib 2002). In fact, voting and
race of constituency were statistically significant. Areas concentrated with Blacks were more
likely to vote to keep the non-Confederate flag, and White areas typically voted to return the
Battle flag (Webster and Leib 2002). Ultimately, racial makeup of voting districts seems to be
related to how a politician votes on issues of the Confederate flag.
Research has typically shown a significant association between region and support for the
flag. Cooper and Knotts (2006) believe that individuals from the South, a region with a unique
history of White racial dominance over Blacks, plantation based slavery, and racial segregation,
explains why Southerners would feel positively toward the flag, a symbol of holding the
dominant position in Southern society. Region, for these authors, plays a crucial role in the
support or opposition to the flag. They find that support for the flag is strongest among Southern
Whites followed by non-Southern Whites, non-Southern Blacks and Southern Blacks,
demonstrative of the difficult to decipher simultaneous influence of race and region (Cooper and
19
Knotts 2006). Comparatively, Reingold and Wike (1998) show that feelings of connection to the
Old South are strongly associated with conservative racial attitudes while connection to the
South has only a small impact on perception of the flag (Reingold and Wike 1998).
Support for the flag also seems to be related to how populous an area is. People that live
in more rural areas are generally more supportive of the flag than those from urban and suburban
areas (Leib 1995; Webster and Leib 2002). Similarly, Cooper and Knotts (2006) show that
citizens living in rural areas are less likely to support a measure to remove the Confederate flag
from the South Carolina Capitol. It has also been found that citizens in the urbanized Atlanta
metro area are more likely to favor removing the Georgia flag with its Confederate emblem
compared to more rural areas (Reingold and Wike 1998).
In addition to these variables, ideological conservatism has been identified as a key
predictor of support for the flag. That is to say, studies have previously found ideological
conservatives to have a greater tendency to support the Confederate flag than their more liberal
counterparts (Clark 1997; Orey 2004). This is found to be true even after controlling for racial
attitudes. Davis (1998:328) states that, in fact, the Confederate flag has been “co-opted by
political conservatives to bolster their hegemony.” To understand the role of ideological
conservatism and its relation to support for the flag, it is important to take into consideration the
political realignment that took place during the civil rights era where conservative Southern
Democrats formed their own States’ Rights Democratic Party, later labeled Dixiecrats, in
response to President Truman’s, at that time, progressive legislation in 1948 aimed at ending
lynching and eliminating poll taxes (Davis 1998). The newly formed Dixiecrats symbolized their
party with the Confederate flag, and they based their political platform most overtly on fighting
against racial integration. Davis (1998:310) notably states, “[The Dixiecrats’] use of the
20
Confederate symbol established a strong link between the flag, racism, and political
conservatism.”
Like conservatism, individuals that identify with the Republican Party tend to support the
Confederate flag more often compared to those with Democrat affiliation. In his analysis of
political supporters of a measure to remove the Confederate flag as a part of the Georgia state
flag in 1993, Leib (1995) finds that 85% of Republicans in the Georgia state House of
Representatives supported keeping the state flag with the Confederate flag insigne within it. In a
similar analysis this time in Alabama, Webster and Leib (2002) show that 80% of Republicans
voted to return the Confederate flag to atop the House Chamber in Alabama compared to 14% of
Democrats, which taken together with other findings leads them to conclude that party affiliation
is slightly more predictive of support for the flag than race. Conversely, although Clark (1997)
and Orey (2004) show ideological conservatism predicts support for the flag, neither uncover a
statistical relationship with party identification. Reingold and Wike (2005) find no relationship
between one’s identification with a political party and support for the flag, either.
Research on the connection between age and support for the flag has been mixed. Clark
(1997) finds that older individuals tend to support the Confederate flag, while others have found
the reverse (Reingold and Wike 1998). One study, for example, found that, as age increases, it
leads to stronger desire for removing the Confederate flag from the Georgia state flag (Reingold
and Wike 1998). Dispute over the role of age when it comes to explaining perceptions of the flag
has shown in more recent studies as well. Cooper and Knotts (2006) show that young
Southerners are just as likely to support the flag as older Southerners. By contrast, with respect to
public opinion at the national level, age has been found to increase the likelihood for supporting
the removal of the flag from state venues for those that live outside of the South (Cooper and

21
Knotts 2006). Older respondents may be more knowledgeable of the Confederate flag unlike
younger cohorts that were not born or alive during the civil rights era (Cooper and Knotts 2006).
Similar to the results of age and support for the flag, conclusions are varied when it
comes to the influence of gender. Orey (2004) finds that women tend to express less support for
the Confederate flag as being a part of the State flag of Mississippi compared to men. By
contrast, Reingold and Wike (1998) discover no statistically significant relationship between
gender and disapproval of the flag. Of note, scholarship on the relationship between the role of
women in society and support for the flag has found that people who rate that women’s role
should be more so in the home as opposed to an equal opportunity in business and government
tend to support the flag compared to those who feel oppositely toward women’s roles (Clark
1997).
Yet, much of the foregoing literature is limited in scope (e.g., sample size, number of
groups studied). Clark (1997), Reingold and Wike (1998), and Orey (2004) are three studies that
have systematically investigated perceptions of the Confederate flag (Cooper and Knotts 2006).
These three studies, however, use regional samples composed of only Southerners from the
states of Georgia, Georgia, and Mississippi, respectively, making them difficult to generalize to
other populations. More specifically, Clark’s (1997) analysis, although providing quite valuable
knowledge, was limited to a sample of 391 campaign contributors which he also termed the
“political elite.” Orey’s (2004) work uses a much larger sample size of 847, but his study was
limited to a survey of college students from eight universities in Mississippi. Mississippi has a
unique history of race relations and usage of the Confederate flag (Newman 2007) so relying on
a survey of this group in addition to them being college students may not reflect the population.
Reingold and Wike (1998) use a sample of 543 Georgians, another uniquely Deep South state,
22
but again not representative of the national population. The studies of Orey (2004), Reingold and
Wike (1998) and Clark (1997) are also limited in that they only focus specifically on White
respondents.
3.2 Race, Region, and Support for the South Carolina Confederate Flag
Cooper and Knotts (2006) utilize the 2000 Annenberg survey conducted by the
Annenberg School of Communication at the University of Pennsylvania. Their models control
for region, sex, age, ideology, race, education, and racial attitudes, and urban/rural (Cooper and
Knotts 2006). They also control for the timing of each telephone survey. Since only Whites and
Blacks represent the significant majority of those that responded, these authors excluded all other
racial and ethnic groups.
Unlike previous studies, Cooper and Knotts are able to test the effects of both region and
racial attitudes. Ultimately, these scholars propose that the answer to what influences perception
of the flag is not exclusively racial attitudes or an affinity for Southern Heritage, rather each are
direct predictors (Cooper and Knotts 2006).
Yet, while Cooper and Knotts (2006) provide robust findings, they do not control for
income, useful measure of social class. It should be noted, however, that they do control for
education level while not defining it as a measure of social class. I propose that social class has
an independent effect on perceptions of the flag even while controlling for other predictor
variables, and measuring social class via income level provides more precise findings that
illuminate the relationship between class and perceptions. Income signifies control over
economic resources, and is a commonly used measure of socioeconomic status in social science
research (Diemer et. al. 2013). Diemer et. al. (2013:91) also state that measures of income can be

23
effectively used as predictors of policy-opinion and implementation research. In regards to
assessing the impact of social class on matters related to the Confederate flag, individuals are
separated into income brackets signifying relative control over economic resources, and this
hierarchical measure of class can be independently modeled with flag perceptions. Additionally,
Cooper and Knotts’ (2006) conceptualization of region does not take into consideration
differences between the Deep South and the rest of the region (South). Dividing region into four
distinct areas would lead to a better understanding of the impact of sub-region on perceptions of
the flag.
3.2 Race and Politics in the U.S. South
The South continues to be a unique and traditional region of the United States. Dating
back over a century and a half ago, racially based slavery remained the backbone of the Southern
plantation economy. Nearly a century after slavery’s abolishment, there began a shift from the
Democratic Party among White Southerners to the Republican Party. Switching political
affiliations from Democrat to Republican allowed for White Southerners to voice racial attitudes
in social policy preferences (Griffin and Hargis 2008). The Barry Goldwater presidency bid
followed by the Nixon “Southern strategy” further polarized the political parties on the basis of
race (Hutchings and Valentino 2004). Valentino and Sears (2005) explain that this shift and the
shift that would continue for a few more decades was due to a desire for both racial and political
conservatism. Interestingly though, “racial resentment” and political affiliation cannot be
explained by non-racial factors, pointing to race, and not necessarily political ideology,
continuing to play a significant part in the everyday South (Valentino and Sears 2005). Not
surprisingly, evidence to support such a statement includes the fact that in every measureable
way, Southern Whites continue to elicit more racial prejudice than any other region of people
24
(Valentino and Sears 2005), a finding that has been replicated with success (Carter 2010). Today,
the South continues to be “racially distinct” in terms of racial attitudes and racial norms.
Education, Republican Party affiliation, political conservatism, and being in more rural locations
do not explain Southerners’ racial attitudes and preferences (Griffin and Hargis 2008).
The South has often been thought of as an isolated unit. For example, in terms of
confidence towards the medical field, the confidence gap between Non-Southerners and
Southerners has consistently increased with Southerners showing the least amount of confidence
in the biomedical system (Corra and Carter 2008). At the same time, racial attitudes measured in
1998 show that Southern Whites expressed more conservative racial views; for example,
Southern Whites were,
More likely to blame African Americans themselves for their relatively disadvantaged conditions rather than opportunity structures or discrimination; less likely to support principles of equality, such as residential desegregation and marriage freedoms; less likely to favor the implementation of principles of equality through such measures as open housing laws and busing; more likely to wish for social distance from black folk, whether in schools, neighborhoods, or families; less likely to prefer governmental redress for the past’s harmful legacy, to differentiate the experiences of African Americans and white ethnics, and to support affirmative action; and more likely to espouse pejorative stereotypes about Americans of African ancestry (Griffin and Hargis 2008:124).
Likewise, a lasting impression from miscegenation laws of years past leaves over half of all
White Southerners opposing family members marrying a Black individual (Griffin and Hargis
2008).
Those living in rural locations tend to have more prejudicial attitudes toward explanations
of racial inequality than those from more urban environments partly explained by the fact that
those from more rural locations tend to rely more so on individualistic interpretations of racial
inequality (Carter and Corra 2012). The effect of living in an urban environment on prejudice,

25
although seemingly decreasing over time, allows for people to come into routine contact with
members of different out-groups which explains why there would generally be less prejudice in
these areas than rural ones (Carter 2010), a conclusion shared by Carter et. al. (2005). Likewise,
the South and rural areas continue to be havens for intolerance even when controlling for
education, income, and question variation (Carter et. al. 2005). Kuklinski et. al. (1997)
demonstrate that almost twice the number of Southerners as opposed to non-Southerners, and
almost half of all Southerners in general, get angry at the thought of a Black family living next to
them. Most importantly, an astounding 98% of Southerners are genuinely angered at the thought
of affirmative action (Kuklinski et. al. 1997). Opposing these conclusions, though, Moore and
Ovadia (2006) show that the differences in racial tolerance between the South and Non-South as
well as rural versus urban go away when you control for appropriate factors such as religion and
education. In fact, those that live in an area with a greater proportion of evangelicals are less
tolerant in general (Moore and Ovadia 2006). Supporting this dissenting opinion, Tuch and
Hughes (1996) show that region is not an important factor in predicting attitudes toward racial
policy. Evidently, research on region and differences in racial tolerance and policy produces
mixed findings.
3.4 Cultural Symbols
According to Geertz (1973: 45), symbols are, “anything that is disengaged from its mere
actuality and used to impose meaning upon experience.” Symbols can even be individuals such
as President Obama who took on a symbolic meaning far greater than the position he holds
(Bonilla-Silva and Dietrich 2001). A symbol such as the Confederate flag thus, holds incredible
power based on a perceiver’s interpretation of it. Reingold and Wike (1998) find that while
Southern identity and racial attitudes do correlate in a study of White Georgians, the defense of
26
the Confederate flag is much more related to race issues rather than a defense of Southern
culture. Still, one must make note that Southern identity, at least in this study, was generally not
related to racial conservatism. Reingold and Wike (1998), in part, show the flaw to the debate on
the Confederate flag, and their synopsis sheds light on a greater controversy: the meaning of the
Civil War. Similarly, as Coski (2005) notes, it is hard to distance the flag’s meaning from slavery
itself. While Southerners tend to suggest that the flag can be separated from slavery, a glance at
the words of Confederate ancestors shows a different story. A 1904 pamphlet detailing the
reasons for the Civil War showed that the United Daughters of the Confederacy believed the War
was about state rights, namely, “The right to regulate their own affairs and to hold slaves as
property” (Coski 2005:26).
Symbols take on different meanings depending upon a time period. For example, one can
note that the swastika took on an entirely different meaning from what its intended purpose was
as a symbol within Buddhist and Hindu religious contexts (Quinn 2005). Likewise, some note
that the flag simply fell into the wrong hands like when it became synonymous with the Ku Klux
Klan and citizen councils, and when race conscious Dixiecrats utilized it as a symbol of radically
conservative racial politics (Coski 2005). Historically speaking, the St. Andrew’s cross began as
the battle flag for Robert E. Lee’s platoon in Northern Virginia, and it soon became the most
popular flag to symbolize the Confederate states (Martinez, Richardson, and McNich-Su 2000).
The flag garnered popularity, not only because of its symbolizing radical social movements
against Black advancement, but also because of its presence in pop culture, namely, the
television show known as the Dukes of Hazard (Martinez, Richardson, and McNich-Su 2000).
Although seemingly off point, these facts situate the flag within a greater social context. Its
meaning, therefore comes from these settings. The flag is, in both name and purpose, a rebel
27
flag. To waive it signifies a rebellion which illustrates why so many radical groups have chosen
it as their emblem (Bonner 2002).
Allport (1954) focused on including analysis of prejudice on many levels: historical,
sociocultural, situational, personality, psychological, and stimulus object. In the case of the
Confederate flag, the symbol is rooted in all of these levels of prejudice. The flag has been
defended by people who claim it represents Southern heritage and opposed because it represents
White supremacy of the Old South (Reingold and Wike 1998). We see this in studies that prime
individuals with the flag itself. Ehrlinger et. al. (2011) found that those primed with the
Confederate flag were disinclined to vote for then-candidate President Obama. Furthermore, a
more startling finding showed that those primed with the Confederate flag were more likely to
judge Black targets negatively. This leads to the conclusion that although some may genuinely
view the flag as a symbol for their Southern heritage, the consequences of having the flag visibly
displayed include inciting racial resentment and negative affect toward Blacks (Ehrlinger et. al.
2011).

CHAPTER IV. DATA, METHODS, AND SAMPLE DESCRIPTION
This study adds to Cooper and Knott’s (2006) analysis by creating a more focused
regional variable in addition to controlling for social class. Although region has been found to
impact citizens’ perception to the flag, research has only looked at the South versus the Non-
South. In addition to the methodologies of previous scholarly research, I incorporate a more
individualized analysis of views of the flag among subjects by using split models of race, sub-
regional residence, and social class. Although studies have researched at the relationship between
the region and race of individuals, a more complete analysis includes a distinction between the
Deep South, Upper South and Border States as well as assessing the direct effect of social class. I
add these two critically important concepts to the study creating a more refined understanding of
what predicts support for the flag. I first analyze predictors of support for the South Carolina
Confederate flag with the 2000 Annenberg national dataset before engaging in a complimentary
analysis of emotional reaction to the flag using a 2011 Pew Research national dataset.
Regionally, I distinguish the Upper South from the Deep South based on time of
secession during the Civil War. Also known as “cotton states,” the Deep South states include
Alabama, Georgia, Louisiana, Mississippi, Texas, Florida and South Carolina: seven states that
seceded from the Union before the start of the Civil War (White 2011). The original Confederate
States of America was composed of the seven mentioned Deep South states as well as four more
Upper South states: North Carolina, Tennessee, Virginia, and Arkansas. The Upper South states
all seceded from the Union after the beginning of the Civil War at Fort Sumter (White 2011).
The Confederate flag is hard to separate from the Civil War. Therefore, only those states that
seceded from the Union and subsequently joined the Confederate States of America are
understood as comprising the Deep South or Upper South. For this study, Border States are
29
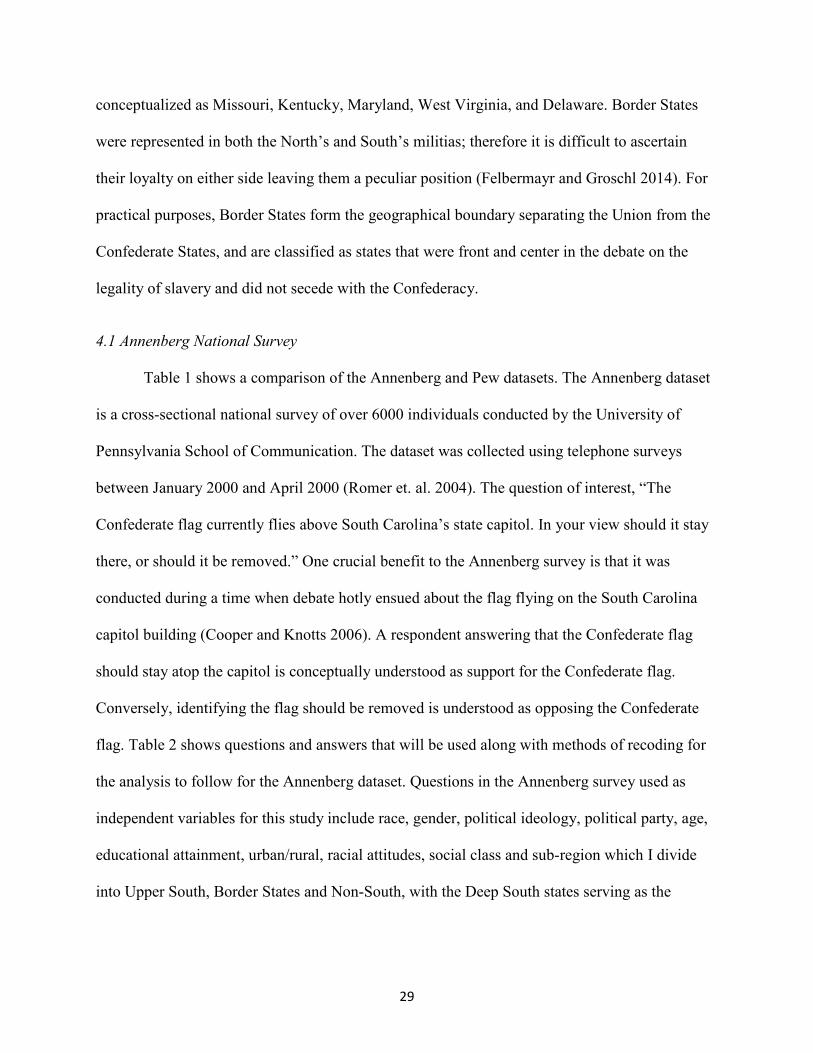
conceptualized as Missouri, Kentucky, Maryland, West Virginia, and Delaware. Border States
were represented in both the North’s and South’s militias; therefore it is difficult to ascertain
their loyalty on either side leaving them a peculiar position (Felbermayr and Groschl 2014). For
practical purposes, Border States form the geographical boundary separating the Union from the
Confederate States, and are classified as states that were front and center in the debate on the
legality of slavery and did not secede with the Confederacy.
4.1 Annenberg National Survey
Table 1 shows a comparison of the Annenberg and Pew datasets. The Annenberg dataset
is a cross-sectional national survey of over 6000 individuals conducted by the University of
Pennsylvania School of Communication. The dataset was collected using telephone surveys
between January 2000 and April 2000 (Romer et. al. 2004). The question of interest, “The
Confederate flag currently flies above South Carolina’s state capitol. In your view should it stay
there, or should it be removed.” One crucial benefit to the Annenberg survey is that it was
conducted during a time when debate hotly ensued about the flag flying on the South Carolina
capitol building (Cooper and Knotts 2006). A respondent answering that the Confederate flag
should stay atop the capitol is conceptually understood as support for the Confederate flag.
Conversely, identifying the flag should be removed is understood as opposing the Confederate
flag. Table 2 shows questions and answers that will be used along with methods of recoding for
the analysis to follow for the Annenberg dataset. Questions in the Annenberg survey used as
independent variables for this study include race, gender, political ideology, political party, age,
educational attainment, urban/rural, racial attitudes, social class and sub-region which I divide
into Upper South, Border States and Non-South, with the Deep South states serving as the
30
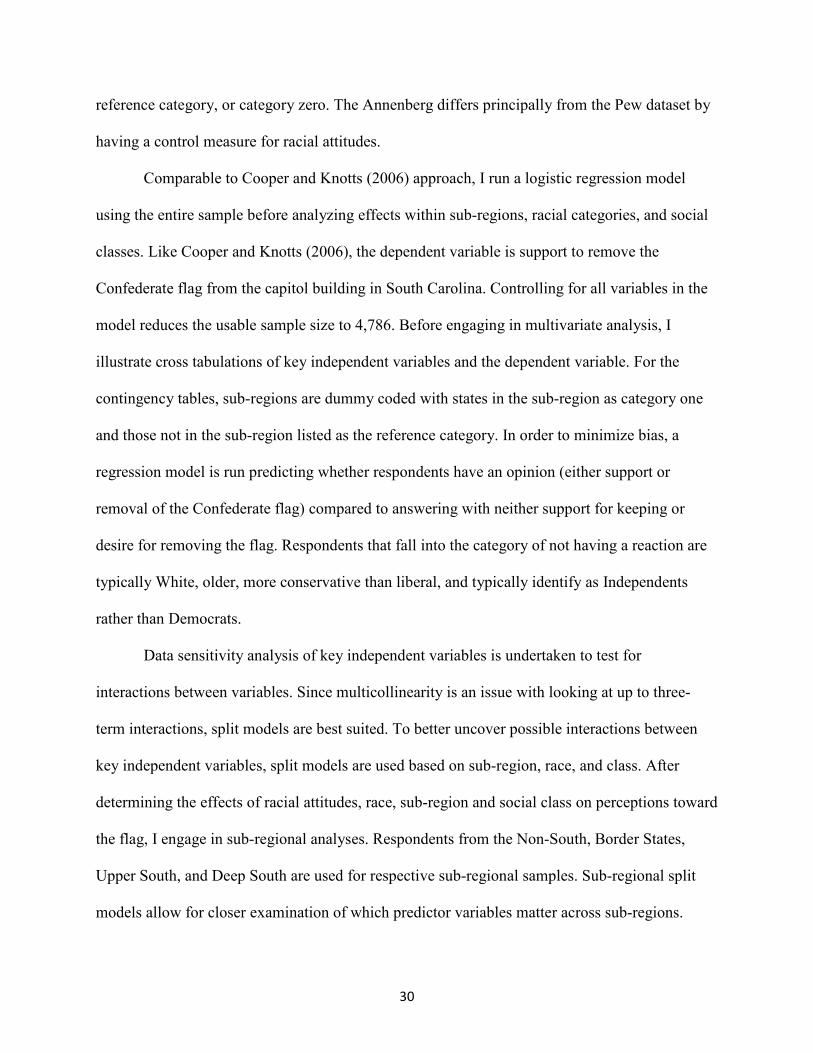
reference category, or category zero. The Annenberg differs principally from the Pew dataset by
having a control measure for racial attitudes.
Comparable to Cooper and Knotts (2006) approach, I run a logistic regression model
using the entire sample before analyzing effects within sub-regions, racial categories, and social
classes. Like Cooper and Knotts (2006), the dependent variable is support to remove the
Confederate flag from the capitol building in South Carolina. Controlling for all variables in the
model reduces the usable sample size to 4,786. Before engaging in multivariate analysis, I
illustrate cross tabulations of key independent variables and the dependent variable. For the
contingency tables, sub-regions are dummy coded with states in the sub-region as category one
and those not in the sub-region listed as the reference category. In order to minimize bias, a
regression model is run predicting whether respondents have an opinion (either support or
removal of the Confederate flag) compared to answering with neither support for keeping or
desire for removing the flag. Respondents that fall into the category of not having a reaction are
typically White, older, more conservative than liberal, and typically identify as Independents
rather than Democrats.
Data sensitivity analysis of key independent variables is undertaken to test for
interactions between variables. Since multicollinearity is an issue with looking at up to three-
term interactions, split models are best suited. To better uncover possible interactions between
key independent variables, split models are used based on sub-region, race, and class. After
determining the effects of racial attitudes, race, sub-region and social class on perceptions toward
the flag, I engage in sub-regional analyses. Respondents from the Non-South, Border States,
Upper South, and Deep South are used for respective sub-regional samples. Sub-regional split
models allow for closer examination of which predictor variables matter across sub-regions.
31
Likewise, using split models comparing White respondents with Black respondents shows the
independent effect of class and sub-region within racial categories. Lastly, respondents are split
into one of three social class groups to show the direct effect of independent variables within
class groupings. Income, as measured on a one to nine scale, is divided into thirds to determine
social class where individuals making under $25,000 are in the lower class; respondents making
between $25,000 to less than $75,000 comprise the middle, and those with incomes above
$75,000 make up the upper class.
In sum, for each logistic model, national, sub-regional, race and class split categories, I
predict the odds ratios of someone desiring to remove the Confederate flag from the South
Carolina Capitol. In the case of the Annenberg, odds ratios are interpreted in logistic regression
as the likelihood of desiring the removal of the flag. In cases where the independent variable is
dummy coded such that, for example, Black is category one and White, category zero, the odds
ratio would be read as the likelihood of a black respondent wanting to remove the flag compared
to a white respondent. If, for instance, the odds ratio for Black respondents was 1.50, then it
could be interpreted as Blacks having 1.50 times the odds of Whites, or a 50% greater likelihood
of desiring the flag’s removal. In cases where the independent variable is an ordinal or scale
measure, the odds ratio is read such that every increasing unit change in the independent variable
results in a positive or negative change in the likelihood of wanting the flag removed. Odds
ratios are interpreted similar to the Black/White example in this case such that if the ratio is 5.6,
then every unit change increase results in 5.6 greater odds of wanting the flag taken down.
4.2 Pew Research Survey
The second dataset to be used in this analysis was collected by the Princeton Survey
Research Associates International for the Pew research lab between March 30 and April 3, 2011.

32
A combination of 1507 respondents were contacted on landline and cellphone telephones during
this time period (“Civil War at 150: Still Relevant, Still Divisive” 2011). Surveyors for the
landline portion of the sample requested to speak with the eldest female or male in the household
in a rotation. People conducting cellphone surveys asked to question the person that answered
the phone. The dependent measure is created from a question asked about perception of the flag:
“When you see the Confederate flag displayed, do you have a positive reaction, a negative
reaction or neither?” (April 2011 Political Survey 2011). The Pew dataset includes questions
related to race, gender, political ideological, age, educational attainment, political affiliation,
urban/rural, social class, southern identity, and sub-region which I also subdivide into Border
States, Upper South, and Non-South, with Deep South serving as the reference category. As
previously stated, the Deep South is understood as a racially, historically, and politically
distinctive area; thus, based on my theoretical and conceptual frameworks, respondents from this
region would be expected to react differently than respondents in other regions. Table 3 shows
question wording and recoding for the Pew dataset. Income, like in the Annenberg, is
operationalized as social class. The Pew set is used as a supplementary piece to the Annenberg
survey. One important distinction for the Pew dataset is that it includes a key variable not found
in the Annenberg dataset, Southern identity. On the other hand, there are no questions related to
measures of racial attitudes like in the Annenberg.
Similar to the Annenberg, examination of the Pew dataset works progressively from
descriptive statistics to bivariate and then multivariate analyses. Restricting the sample to just
those that have a negative or positive reaction lowers the usable sample size to 435 total
respondents. Before engaging in multivariate analysis, contingency tables are created between
key independent variables (social class, sub-region, and Southern identity) and the dichotomous

33
dependent variable (negative reaction vs. positive reaction). In other words, I cross tabulate the
proportion of respondents within the independent variable that fall within the negative or positive
reaction categories. Finally, a logistic regression model is run to test the effect of independent
variables predicting negative reaction to the Confederate flag. Odds ratios for the Pew survey are
read as the likelihood of having a negative reaction to the flag. Unlike Annenberg data analyses,
the Pew survey cannot be broken into split models to further investigate interaction effects
because of sample size limitations.
Additionally, based on my theoretical framework using symbolic politics theory and
racial threat theory, I predict negative reactions to the Flag with positive reactions serving as the
reference category. Sample size changes (drops) drastically when focusing specifically on those
that have a positive or negative reaction to the flag. To reduce bias, a regression is run to
determine the relationship between independent variables and whether someone has either a
positive or negative reaction to the flag compared to no reaction. In this case, a reaction serves as
the comparison category. Respondents that typically fall into the category of having neither a
positive or negative reaction to the Confederate flag are more likely to be from the Non-South,
older, have less education, are more conservative, and identify as Independents relative to
Democrats.
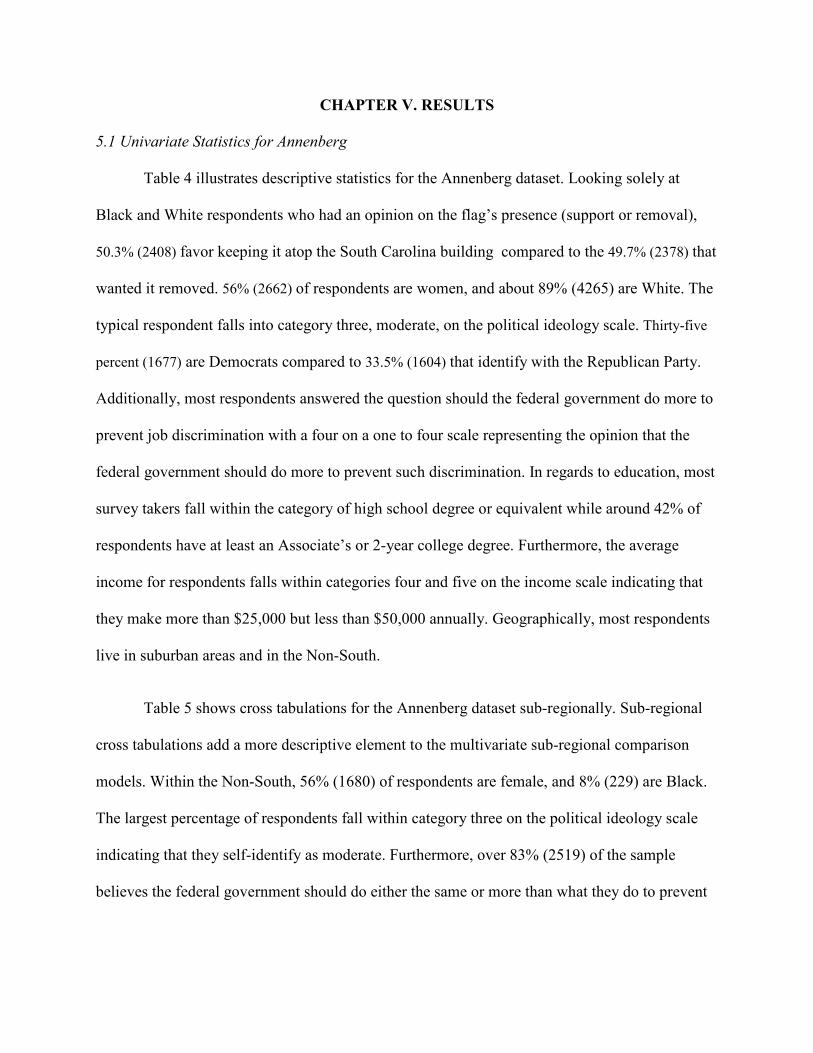
CHAPTER V. RESULTS
5.1 Univariate Statistics for Annenberg
Table 4 illustrates descriptive statistics for the Annenberg dataset. Looking solely at
Black and White respondents who had an opinion on the flag’s presence (support or removal),
50.3% (2408) favor keeping it atop the South Carolina building compared to the 49.7% (2378) that
wanted it removed. 56% (2662) of respondents are women, and about 89% (4265) are White. The
typical respondent falls into category three, moderate, on the political ideology scale. Thirty-five
percent (1677) are Democrats compared to 33.5% (1604) that identify with the Republican Party.
Additionally, most respondents answered the question should the federal government do more to
prevent job discrimination with a four on a one to four scale representing the opinion that the
federal government should do more to prevent such discrimination. In regards to education, most
survey takers fall within the category of high school degree or equivalent while around 42% of
respondents have at least an Associate’s or 2-year college degree. Furthermore, the average
income for respondents falls within categories four and five on the income scale indicating that
they make more than $25,000 but less than $50,000 annually. Geographically, most respondents
live in suburban areas and in the Non-South.
Table 5 shows cross tabulations for the Annenberg dataset sub-regionally. Sub-regional
cross tabulations add a more descriptive element to the multivariate sub-regional comparison
models. Within the Non-South, 56% (1680) of respondents are female, and 8% (229) are Black.
The largest percentage of respondents fall within category three on the political ideology scale
indicating that they self-identify as moderate. Furthermore, over 83% (2519) of the sample
believes the federal government should do either the same or more than what they do to prevent
35
job discrimination against Blacks. Almost 19% (569) of the Non-South sample fall within
category six on the income scale meaning that they earn between $50,000 and $75,000 annually.
Almost 40% (135) of the Border States sample are male while 87% (300) are White.
Politically, like the Non-South, most respondents in Border States identify as moderate than any
other category. In addition, over 42% (147) of the sample falls within category four, or more
progressive, on the racial attitudes scale. Most respondents earn a yearly income between
$35,000 and $50,000.
Like the other three sub-regions, the Upper South is majority female and White.
Likewise, about 42% (201) of respondents fall into category three on the political spectrum. One-
hundred and seven (22.2%) of citizens of the Upper South suggest that the government should do
less or nothing to prevent job discrimination against Blacks. The largest percentage of
respondents earn between thirty-five and fifty thousand dollars.
The Deep South has a higher proportion of Blacks to Whites relative to other sub-regions.
The Deep South also has the highest percentage of male respondents (46.8%). A fraction of
respondents (8.7%) identify as very conservative compared to 3.1% (30) that say they are very
liberal. Slightly more than one-tenth (121) of the sub sample believe that the federal government
should do less than what they already do to prevent job discrimination against Blacks. Lastly,
5.7% (56) of those in the Deep South earn less than $10,000 yearly.
5.2 Bivariate Statistics for Annenberg
Table 6 illustrates contingency tables for the Annenberg dataset. In regards to gender, a
higher proportion of women (51.3:48.7) than men (47.7:52.3) want the Confederate flag
removed. There is evidence to suggest that there is a statistically significant relationship between

36
gender and perception to the flag (Chi-Square = 6.071; p<.05). A statistically significant
relationship indicates that the finding can be generalized to the population. In other words, a
significance level at the .001 level means that there is a less than 1% chance that the null
hypothesis, or the idea that there is no real relationship, is true. Comparatively, results would
indicate a 99% confidence in the probability that the relationship is real and generalizable. In
addition, race also exhibits an influence on either supporting or wanting the flag removed. For
example, 46.5% of Whites want to remove the flag from atop the capitol building compared to
over three-fourths of Black respondents. According to the Chi-Square analysis, there is a
statistically significant relationship between race and perception toward the Confederate flag
(Chi-Square = 157.331; p<.001).
Racial attitudes tends to separate people into support versus removal camps. For instance,
almost 61% (1289) of those that fall into the liberal side of the racial attitude category, or a four
on the one to four scale, desire for the flag’s removal. Contrarily, only 24.9% (103) of those that
score a one on the one to four racial attitudes scale indicating that the government should do
nothing about preventing job discrimination against Blacks, want the flag removed. On the other
hand, 75.1% (311) of respondents with a more conservative racial attitude and 39.1% (828) of
those with more liberal racial attitudes want to keep the flag. The Chi-Square analysis indicates a
real (statistically significant) relationship between racial attitudes and desire for keeping or
removing the flag (Chi-Square = 270.648; p<.001).
Social Class measured via income level is also a predictor of perception to the flag.
Almost 47% of those that fall into the lowest income category favor removing the flag compared
to about 56% of those in the top income bracket that feel similarly. It’s not until income category
five ($35,000 to less than $50,000) that the proportion of respondents wanting to remove the flag
37
rounds to fifty-fifty. Statistically, social class is significantly related to predicting perception to
the flag (Chi-Square = 43.463; p<.001). The highest proportion of any income bracket favoring
to remove the flag are persons earning between $75,000 to less than $100,000 dollars annually.
According to my theoretical approach, sub-regional residence should influence whether
someone desires to keep versus remove the flag. Over half of respondents (54%) in the Non-
South want the flag removed. Evident of the influence of sub-region on perception toward the
flag, there seems to be a gradient moving from the Non-South to the Deep South in regards to the
slight decreasing proportion of respondents that want to remove the Confederate flag. For
example, 44.8% of those in Border States, 42.3% in the Upper South, and 42.0% in the Deep
South want to remove the South Carolina Confederate flag. In each relationship between sub-
region and the dependent measure, there is a statistically significant relationship at the .05 level
with the exception to the Border States where the significance value for the Chi-Square analysis
is marginally significant at the .08 level (p=.058).
5.3 Multivariate Statistics for Annenberg
A multivariate analysis is undertaken to uncover the direct effect of independent variables
on support for removing the flag. In this case, the dependent measure is operationalized as
desiring the South Carolina Confederate flag to be removed from the capital building. Table 7
shows the results of a logistic regression predicting support for the removal of the South Carolina
Confederate flag for the national sample. The sample size drops to 4,786 when taking into
account social class because of missing cases. The percentage of cases correctly predicted by
model one is about 61%. After all independent variables are added, the percentage of cases
correctly predicted by model five is about 67%. A higher percentage of correctly predicted cases

38
suggests that calculations within models are able to correctly predict, in this case, wanting the
Confederate flag removed from the South Carolina capitol.
Social class influences perception toward the South Carolina Confederate flag on the
national level. Every unit change in income category from a one, indicating that a person earns
less than $10,000, to nine, meaning they earn more than $150,000, results in a person being
almost 4% more likely to want the flag removed (p<.05). The coefficient for social class
decreases from model one to model three because of controlling for race of respondent. There is
a negative indirect effect between social class, race, and desiring for the flag to be removed.
Neither of the direct effects of race and class go away across models, meaning that they maintain
their statistical significance even while controlling for each. Still, class mediates the relationship
between race and flag perception.
Sub-regionally speaking, living in Non-South states leads to a 76% increase in the
likelihood of wanting the take down the flag compared to those that live in the Deep South
(p<.001). Similarly, living in Border States makes respondents 28% more likely to support
removing the flag compared to Deep South residents (p<.08). No statistical difference presents
itself between the Upper South and Deep South in support for the flag in the multivariate logistic
regression analysis when controlling for other measures in the national sample. This finding will
be elaborated on in the sub-regional analyses.
In model one, controlling for sub-region and social class, increasing one category on the
liberal racial attitude ordinal measure from one, indicating that the federal government should do
nothing to prevent job discrimination against Blacks, to four, meaning that a respondent feels the
federal government should do more than what it does now to prevent such discrimination, leads
39
to a 76% increase in the likelihood of supporting the removal of the Confederate flag (p<.001).
When controlling for all variables in the analysis, every unit change in racial attitudes results in a
53% increase in the likelihood of a person supporting the flag’s removal (p<.001).
As previously stated, race also exhibits an effect on support for the flag. Solely
controlling for demographic variables (gender, age, and education), Black respondents in the
U.S. are 4.5 times more likely than Whites to want the South Carolina Confederate flag removed.
In model five with all control measures, in the national sample, Black respondents are almost
three and a half times more likely than Whites to desire for removing the Confederate flag
(p<.001). A multiplicative interaction term between race and class shows that these two
independent variables interact with one another to influence perception to the flag (p<.05). In
other words, the intensity of the direct relationships between class and flag support, and race and
flag support is dependent upon the other.
In regards to demographics, education is statistically related to flag perception. Every unit
increase on the education ordinal measure from level one, meaning a respondent finished eighth
grade or less, to level nine, indicative of having a graduate or professional degree, results in
about a 24% increase in the likelihood of a person wanting to remove the Confederate flag
(p<.001). Education is consistently predictive of flag perception from models one through five
even when adding additional control measures to each model.
Solely controlling for race, age, and education, females are 22% more likely to support
removing the flag (p<.01). However, in models four and five, gender loses its significance
leading to no real relationship between being female and support for the flag. Both political
40
ideology and political party affiliation mediate and wipe out the direct effect of gender in
predicting support for removing the flag.
Also, older individuals tend to support the removal of the flag compared to younger
people. Further analysis indicates that the effect of age on perception to the flag is best expressed
linearly. Controlling for all variables in the analysis, a year increase in age results in about a 1%
increase in the odds of wanting to remove the flag from the South Carolina capitol.
Politics are also involved with flag perception. Political ideology is measured as an
ordinal variable from one to five with lower numbers indicating greater conservatism, a middle
number suggesting more moderate views, and higher scores indicating very liberal views. For
example, every unit change in a respondent’s placement on the political ideology spectrum from
one, those who identify as having very conservative views, to five, those who say they have very
liberal political views, results in a 20% increase in the likelihood of favoring the removal of the
flag when controlling for all independent variables in the model (p<.001). Likewise, perception
is also dependent on political party. Specifically, on the national level, Democrats are almost
50% more likely to support removing the flag compared to those who identify as Independents
(p<.001). No real difference presents itself in comparing Republican’s views with those of
Independents.
Being from an urban or rural area, nationally, does not seem to matter in predicting
support for removing the flag, either. Nationally, those in urban areas are no more likely to desire
for the South Carolina Confederate flag’s removal than those in suburban areas. Equally,
respondents in rural areas do not feel differently than those from suburban areas.
41
Sub-Regional Analyses
5.4 Annenberg Non-South Sample
To further uncover the relationship intra-sub-regionally, separate analyses of sub-regions
are conducted. In each sub-regional analysis, results indicate age is best expressed linearly. Table
8 illustrates the Non-South sub-regional analysis. The sample size for the Non-South is 2,981
respondents. The percentage of correctly predicted cases increases from model one, 59.9%,
peaking at model three (63.8%), before dropping slightly to 63.2% in model five.
Within the Non-South, there is not enough evidence to reject the null hypothesis that
social class does not predict support for removal of the South Carolina flag. On the other hand,
within the Non-South, race and class interact to predict how an individual will feel about the
South Carolina flag (p<.08). The interaction between race and class only occurs within the
national sample and Non-South sample.
Like within the larger national sample, racial attitudes do seem to be related. For
example, increasing one category on the liberal racial attitude ordinal measure from one,
indicating that the federal government should do nothing to prevent job discrimination against
Blacks, to four, meaning that a respondent feels the federal government should do more to
prevent such discrimination, results in an almost 50% increase in the odds of wanting the South
Carolina Confederate flag removed (p<.001).
Black respondents in Non-South states are 90% more likely to support removing the flag
compared to White respondents (p<.001). The coefficient progressively decreases from model
two to model five; however, it never loses its significance. Comparable to the indirect
42
relationship found within the national sample, social class mediates the relationship between
Blacks in the Non-South and desire to remove the flag.
Additionally, there is no evidence that men and women in the Non-South differ in their
desire to remove the flag. This finding is consistently found across the full sample models and
within all four sub-regional analyses. Furthermore, age is predictive of wanting to take down the
flag in the full sample, and only within the Non-South sub-region does age statistically predict
perception toward the flag. A one-year increase in age results in about a 1% increase in the odds
that a person living in the Non-South will want to remove the Confederate flag from the South
Carolina capitol building (p<.05).
Like within the national estimate and all other sub-regional analyses, education level is
positively related to wanting the flag taken down. Each unit change in education level on the
scale ranging from one to nine with nine indicating higher educational attainment, results in a
person being 24% more likely to support removing the Confederate flag (p<.001).
More liberal individuals in the Non-South are also less likely to favor keeping the flag. In
fact, every unit change in the political ideology scale ranging from one to five with five
indicating more liberal political stances, leads to an 11% increase in the likelihood of wanting the
flag taken down (p<.001). Likewise, Democrats relative to Independents in the Non-South are
45% more likely to support the removal of the flag (p<.001). No statistical difference presents
itself in comparing Republicans with Independents.
Urban/rural does not matter in the full national sample; however, it does in the Non-
South sample. Respondents in urban areas in the Non-South are 30% more likely than those in
Non-South suburban areas to desire for the flag to be taken down (p<.01). The Non-South is the

43
only sub-regional sample where being from an urban area statistically predicts support for
removal of the Confederate flag. Respondents in the Non-South that live in rural areas are no
more likely than Non-South respondents in suburban areas to desire for the South Carolina
Confederate flag to be removed.
5.5 Annenberg Border States Sample
The Border States are those that represent the geographical boundary between the states
of the Old Confederacy (conceptually, the Upper South states and Deep South states for this
project) and the Non-South. Table 9 shows the Border States analysis. Five models are run with
Border State respondents to predict the likelihood of supporting the removal of the South
Carolina Confederate flag. Three-hundred forty-four respondents comprise the Border States
sample, the smallest of the sub-regional analyses. Model five of the Border States analysis
correctly predicts almost sixty-six percent of cases. Analysis confirms no interaction effects are
present within the Border States sample.
Social class for respondents in Border States predicts support to remove the Confederate
flag at least at the .08 level until model five when it loses its significance altogether (p=.109). In
model one, for example, while only controlling for racial attitudes, a one unit increase in the
income measure from one to nine results in a 19% increase in the odds of desiring for the
removal of the Confederate flag. Adding urban and rural to model five accounts for some of the
variation in the dependent measure, support for removing the flag, that social class explained in
model four. In other words, those with the highest income in Border States do not desire the
South Carolina Confederate flag to be removed at a higher or lower rate than those with the
lowest income.

44
Racial attitudes in Border States, like in all other sub-regional models, consistently
predicts views on the Confederate flag in South Carolina. Every unit change in the liberal racial
attitudes scale from one to four, indicating more liberal stances on race, for Border State
respondents leads to a 50% increase in the likelihood of supporting the removal of the
Confederate flag (p<.001).
Blacks in Border States are close to three times as likely than Whites in Border States to
want the flag to be taken down, controlling for all independent variables in the model (p<.001).
In each sub-regional and national analysis, Black respondents are more likely to desire the
removal of the Confederate flag compared to White respondents.
In Border States, increasing a respondent’s educational attainment, ranging from one to
nine with nine being higher levels of attainment, by one level results in a person being 23% more
likely to support removing the flag (p<.001). Educational attainment, like in other models, is
consistently positively related to wanting the flag removed.
Political ideology also predicts whether Border States residents want to remove the
Confederate flag from South Carolina’s capitol. Moving one unit on the liberal ideology scale
from one (very liberal) to five (very conservative) leads to a 32% increase in the odds of a person
desiring the flag be removed (p<.05).
The Border States sample has the fewest statistically significant variables with four. As a
comparison, the national sample has seven statistically significant independent variables
excluding sub-region control variables. With the exception of Border States, in all sub-regional
and national models, political party plays a role in predicting flag perception. Border States
comprise the only sub-region where Democrats view the flag no differently than Independents.
45
In addition, from Border States southward, age does not directly influence support for the
flag. In other words, older respondents are no more likely to want to keep or remove the flag
relative to younger people. Likewise, males do not feel differently than females in regards to
support for the Confederate flag among Border States residents. In comparison to the Non-South
and Deep South, neither being of a rural or urban area matters in determining flag perceptions
within Border States.
5.6 Annenberg Upper South Sample
Within the Upper South, five models are run to predict the odds of wanting to remove the
Confederate flag from the South Carolina capitol. The Upper South’s sample size is 480
respondents, the second smallest of any of the sub-regional analyses. Odds ratios of the five
Upper South models are illustrated in Table 10. Model five of the Upper South sample correctly
predicts almost three-quarters of the total cases.
Like with the other three sub-regional analyses, social class does not statistically impact
the odds of wanting to remove the South Carolina Confederate flag. In no model for the Upper
South sample is social class statistically significant. Poorer respondents in the Upper South are
no different than richer respondents in the Upper South in opinions toward removing the
Confederate flag.
While only controlling for class in the Upper South, graduating up the liberal racial
attitudes scale one level from one, believing the government should do nothing about job
discrimination toward Blacks, to level four, believing the government should do more, leads to
twice the likelihood of favoring the removal of the Confederate flag (p<.001). Even when
46
controlling for all variables in the model, a unit increase in racial attitudes measure results in a
68% increase in the chances of supporting the removal (p<.001).
Black respondents in the Upper South are almost four and a half times as likely to support
removing the flag compared to Upper South White respondents (p<.001). Not only are Blacks
more likely than Whites to favor removing the flag, but those with higher education levels are
too. Each increase in the educational attainment measure from level one to level nine results in a
person being 23% more likely to support taking down the Confederate flag (p<.001).
Different from the Border States sample, Upper South Democrats are 80% more likely to
desire the flag be removed compared to Independents in the Upper South (p<.05). In this sense,
Democratic political party affiliation in the Upper South matters in determining perception to the
flag. Correspondingly, increasing on the political ideology scale from one, very conservative, to
five, very liberal, results in a 42% increase in the odds of favoring the removal of the flag
(p<.01). Political placement like in the other three sub-regions and national samples, predicts flag
perception. In other words, those that are more liberal in the Upper South are more likely than
those that are more conservative to want the South Carolina flag removed.
Males and females as well as Republicans and Independents within the Upper South do
not statistically differ in flag perception. Similarly, older individuals are no different than
younger people in how they feel towards the Confederate flag on South Carolina capitol. The
Upper South is more similar to the Border States than the Deep South in terms of urban/rural
independently affecting perception. Neither being from an urban or rural area as compared to a
suburban area matters in determining how a respondent feels about the flag.

47
5.7 Annenberg Deep South Sample
The Deep South sample has five independent variables statistically associated with the
dependent measure, support for removing the South Carolina Confederate flag. Table 11 shows
the logistic regression for the Deep South sample. Nine-hundred and eighty one respondents fall
within one of the seven Deep South states. Model five of the Deep South sample correctly
predicts 72.9% of cases, highest percentage of any of the sub-region models.
Social class among Deep South residence is statistically predictive of support for the flag
until model two when demographic controls are added. Race wipes out the effect of social class.
In this sense, respondents in the highest income category support the removal of the flag at no
higher or lower rate than those in the lowest income category. This finding is consistent across
sub-regional models.
Racial attitudes, specifically liberal racial attitudes, positively relate to support to remove
the Confederate flag among Deep South residents. Every unit change in a person’s racial attitude
score from one to four, meaning more liberal views, is associated with a 62% increase in the
likelihood of favoring the removal of the Flag (p<.001). Consistent across all sub-regional
samples, those that lean more liberally on the racial attitudes scale tend to support the removal of
the flag. Inversely, those with more conservative racial attitudes have a higher likelihood of
desiring to keep the flag.
Blacks in the Deep South are close to seven times more likely than Whites in the Deep
South to desire the Confederate flag be removed from the South Carolina capitol (p<.001). This
represents quite a large racial gap in perception to the flag specifically in the Deep South. Before
controlling for social class and racial attitudes in model three, the odds ratio for Blacks in model

48
two stands at nine times more likely than Whites to desire that the flag be taken down. Across
models, race never loses its significance even with the addition of control measures.
Education, like in other samples, is statistically related to perception to the flag. A change
increase in education category on the one to nine scale leads to a 25% increase in the odds of a
person favoring the removal of the S.C. Confederate flag (p<.001). Likewise, leaning toward the
liberal end of the political spectrum, measured one to five, leads to a 37% increase in the
likelihood of wanting the flag removed (p<.01). In all sub-regional models including the Deep
South, political ideology placement predicts support for removing or keeping the Confederate
flag. Similar to the Upper South and Non-South, Democrats in the Deep South are 73% more
likely than Independents to desire the flag be taken down (p<.01).
What separates the Deep South from the national sample and other sub-regional analyses
is the significance of being from a rural area. Respondents from Deep Southern rural areas are
close to 40% less likely than those from suburban Deep South regions to want the flag removed.
In other words, people from the rural Deep South tend to have a higher likelihood of supporting
the keeping of the Confederate flag atop the South Carolina capital. In comparison, respondents
from urban areas are not statistically different than those from suburban areas.
Of note, age is not statistically significant in the Deep South. In fact, it’s only significant
in the Non-South sub-region. Being a Republican has no statistically predictive value in relation
to flag perception in the Deep South compared to Independents. Also, Deep South females do
not statistically differ from males in the Deep South.
49
Race Analyses
5.8 Annenberg Black Respondent Sample
Split models are run between racial categories to illustrate differences in the relevance of
predictor variables. Table 12 illustrates split models for Whites and Blacks. The model with all
independent variables in it for Black respondents correctly predicts close to 80% of cases. Five-
hundred and twenty-one respondents are Black and are used in the Black respondent analysis.
For Blacks, like in the national sample, social class matters. A one unit change increase in
income category (ranging from one, making less than $10,000 to nine, making over $150,000)
increases the odds of wanting the South Carolina Confederate flag removed by almost 17%
(p<.05).
In the sub-regional split model analyses, all four sub-regions indicate that being Black as
opposed to White increases the odds of desiring the removal of the Confederate flag.
Interestingly, in the Black respondent sample, Blacks in the Non-South are 49% less likely than
Blacks in the Deep South to want the flag removed. Another way of interpreting this is that
Blacks in the Deep South very strongly want the flag removed from the capitol building relative
to Blacks in the Non-South sub-region. Black respondents in Border States and the Deep South
as well as within the Upper South compared to the Deep South do not statistically differ in flag
perception. In other words, Blacks in Border States and Upper South states are just as likely to
want the flag removed as Blacks in the Deep South, according to this analysis.
Racial attitudes for Black respondents and flag perception have a statistically significant
relationship. An 81% increase in the odds of wanting to remove the Confederate flag results from
a unit increase in the racial attitudes score (p<.01). Stated differently, increasing one level on the
ordinal racial attitude scale from one, being that the federal government should do nothing to
50
protect Blacks from discrimination, to four, that the government should do more to protect
Blacks from job discrimination, leads to an increase in the odds of wanting the flag taken down.
An unintended yet interesting finding results from the Black respondent analysis. Black
females are less likely than Black males to support the removal of the flag. More specifically, the
odds of Black females favoring the removal of the flag are 36% lower than the odds of Black
males (p<.08). This gender difference in flag perception only occurs in the Black respondent
sample. In no other Annenberg or Pew analysis does gender predict odds of removing the flag.
Education and political party also matter in the Black respondent sample. For instance, a
unit increase in the educational attainment measure increases the odds of wanting to remove the
flag by slightly over 30% (p<.001). In the same model, Black Democrats are more likely to favor
taking down the flag relative to Black Independents. No such difference exists between Black
Republicans and Black Independents.
In addition to two sub-region variables and identifying as a Republican compared to an
Independent not being statistically significant, several other independent variables in the Black
respondent analysis are not statistically related to the dependent measure. Age, political
ideology, and neither of the urban/rural measures matter. Older Black respondents do not differ
from younger Black respondents in terms of how they feel towards the South Carolina
Confederate flag. Likewise, and unique to the Black sample, placement on the political spectrum
is not related to flag perception. In other words, Black respondents that identify as very
conservative have similar opinions even to those that identify as very liberal. In all other
Annenberg analyses, political ideology does in fact matter. Lastly, Black respondents in urban or
51
rural areas as compared to suburban areas do not differ from those in suburban areas in terms of
how strongly they want the flag removed from the South Carolina capitol.
5.9 Annenberg White Respondent Sample
Like in the Black respondent sample, social class predicts flag perception for White
respondents. More specifically, a one unit change in the independent variable income level
measured on a one to nine scale with higher numbers indicating higher income, increases the
odds of wanting to remove the flag by a factor of 1.031 (p<.08). Stated slightly different,
increasing on the ordinal income measure leads to a 3% increase in the likelihood of desiring the
removal of the flag. Social class in both the Black and White samples positively related to
wanting the flag taken down.
Interestingly, Whites in Non-South states are twice as likely as White respondents in the
Deep South to desire the flag be removed from the South Carolina capitol. In other words, Deep
South Whites are strongly supportive of keeping the flag relative to Non-South Whites. Different
from the Black sample, Border States differ principally from the Deep South in terms of
perceptions for Whites. Whites within Border States are close to 50% more likely than those in
the Deep South to want the flag taken down (p<.01). Finally, in the third sub-regional
comparison, Whites from the Upper South do not differ in opinion toward the flag relative to
Deep South Whites; although there is not enough evidence to reject the null hypothesis that no
relationship exists, it should be pointed out that statistics indicate that there does seem to be a
general trend in Upper South residents Black and White wanting the flag removed more so
compared to Deep South residents.
52
Racial attitudes, as is the case for all models, relates to the dependent measure. In the
case of White respondents, a unit increase in the one to four racial attitudes scale, where four
indicates a more progressive stance on race, results in about a 50% increase in the odds of
wanting to remove the Confederate flag (p<.001).
Age in the White sample matters whereas in the Black respondent analysis, it does not. A
unit increase in age increases the odds of wanting to remove the flag by a factor of 1.005 (p<.05).
In other words, as age increases so too do the odds of wanting to take down the flag. Older
cohorts are more likely to favor removing the flag.
Additionally, education, political ideology, and identifying as a Democrat, all statistically
predict flag support for White respondents. In the case of education, as educational attainment
increases, the likelihood of favoring the removal of the South Carolina flag also increases. In a
similar sense, moving from one unit on the one to five political ideology scale, where lower
numbers represent conservatism and high numbers, liberalism, results in a higher likelihood of
wanting the flag taken down. Lastly, White Democrats as compared White Independents are
36% more likely to desire the flag be removed (p<.001).
Being of an urban area compared to a suburban area matters for White respondents in
relation to flag support too. Unlike the Black sample, urban/rural does statistically predict the
odds of an individual wanting to remove the flag. The predicted odds for White urbanites are
1.16 times the odds for Whites from suburban areas (p<.08). Whites from rural areas do not
contrast with suburban Whites with reference to the dependent measure.
53
Social Class Analyses
5.10 Annenberg Lower Class Sample
Social class is broken into income levels. Since income is measured as an ordinal variable
ranging from one to nine, it is easily split into thirds which are loosely defined as the lower,
middle, and upper classes. Multivariate regression model results of social class are shown in
Table 13. Of all respondents, 1.058 fall within the lower class meaning that they fall within one
of the first three categories of income. In other words, they earn less than $25,000 annually. The
model with all independent variables in it correctly predicts 66.6% of cases for lower class
respondents.
Within the lower class, respondents from the Non-South are 60% more likely than those
in the Deep South to want to remove the Confederate flag from the South Carolina capitol
(p<.01). Lower class-Border State residents and Deep South residents of the lower class do not
statistically differ in terms of support for the flag. Similarly, the Upper South and Deep South are
not distinguished from each other with regards to flag perception among the lower class.
For lower class respondents, racial attitudes and race are related to flag perception. A unit
increase in the racial attitudes measure results in a 52% increase in the odds of wanting the flag
removed among lower class respondents (p<.001). Similarly, Blacks from the lower third of the
income scale are almost three times as likely as lower class Whites to desire the flag be taken
down from the South Carolina capitol (p<.001). In other words, there is a racial difference
among members of the lower social class.
Education represents the only other independent variable that is significant in the lower
class model. Increasing on the educational attainment scale which ranges from one to nine results
54
in a 26% increase in the likelihood of wanting the flag removed (p<.001). Higher education
levels lead to higher chances of desiring the flag be taken down.
Gender, age, political ideology, political party, and urban/rural are not statistically related
to support for the Confederate flag in South Carolina. Like in most other models, no gender
difference exists in terms of flag support in the lower class. Likewise, older respondents in the
lower class are no more likely to favor the position the flag on the South Carolina capitol than
lower class-younger respondents. Similarly, politics do not seem to matter in the lower class.
Both placement on the political spectrum and party identification do not relate in significance.
Lastly, rural and urban areas do not differ among lower class respondents compared to suburban
areas in terms of support for the flag.
5.11 Annenberg Middle Class Sample
The middle class model is comprised of respondents that earn between $25,000 and less
than $75,000 annually. Of all respondents, the majority, 2,392, fall within this middle class
category. Compared to the other two social class split analyses, the middle class model has the
most variables statistically related to the dependent measure with nine total.
Sub-regionally, middle class respondents in the Non-South as well as Border States differ
from the Deep South in support for removing the flag. Results indicate that Non-South middle
class respondents are over twice as likely as middle class citizens in the Deep South to want the
Confederate flag removed (p<.001). Middle class people in Border States have odds 48% greater
than those of middle class respondents in the Deep South to favor the removal of the flag
(p<.01). In sum, with the exception of the Upper South, members of the middle class within the
55
Deep South are more likely than those in the Non-South and Border States to favor keeping the
flag flying above the South Carolina capitol.
Race and racial attitudes of middle class respondents, like in other social class split
models, matter in predicting support for the flag’s removal. The odds of wanting to remove the
flag are 47% higher with every increase in the one to four racial attitudes scale (p<.001). Those
that are on the highest and most liberal spot on the racial attitudes score would have the greatest
odds of wanting the flag taken down. Likewise, Black respondents in the middle class are close
to 4.5 times more likely than Whites to desire the flag be removed. Within the middle class, a
very evident racial gap exists in opinions toward the South Carolina Confederate flag.
Age and urban are only significant in the middle class model. Like in other Annenberg
analyses where age is predictive, as it increases, it leads to a greater likelihood of wanting the
flag removed for middle class respondents. Older members of the middle class are therefore
more likely to want the flag taken down. Additionally, survey takers that are both middle class
and from an urban area are 26% more likely than middle class citizens of suburban areas to feel
like the flag should be removed (p<.05).
A unit increase in the educational attainment scale ranging from one to nine results in an
increase in the likelihood of wanting the flag removed by a factor of 1.253 (p<.001). Also
exhibiting a positive correlation, a unit change in the political ideology scale where higher
numbers indicate greater liberal political views leads to a 17% increase in the odds that that
person will want the South Carolina Confederate flag removed. Political ideology and political
party only statistically matter within the middle and upper class models. The odds of wanting the
flag taken down are 1.526 times greater for Democrats than Independents (p<.001). Contrarily,
56
Republicans in the middle class are no more likely than Independents to favor the removal of the
flag.
5.12 Annenberg Upper Class Sample
The upper class sample consists of respondents that earn above $75,000 annually which
totals 934 people. The model with all independent variables controlled for correctly predicts
close to 67% of cases. The upper class has several independent predictors that meaningfully play
a role in support for the flag.
Like the other two class categories, sub-region matters in the upper class in predicting
flag support. More specifically, in all three models being from the Non-South as opposed to the
Deep South leads to an increase in the odds of wanting the flag taken down. In other words, in
each income category, respondents in the Deep South desire to keep the South Carolina
Confederate flag flying above the capitol at a higher rate relative to Non-South residents. The
predicted odds of wanting to remove the flag for the Non-South upper class are 1.421 times
greater than those of the Deep South upper class even when controlling for other factors (p<.08).
Neither Border States nor the Upper South differ from the Deep South among upper class survey
takers.
Racial attitudes matter in predicting support among the upper class. A unit change in the
racial attitude independent measure leads to a 65% increase in the odds of wanting the flag taken
down (p<.001). Racial attitudes consistently predict flag perceptions across all three class
categories.
Interestingly, the Black upper class differs quite a bit compared to the White upper class.
Upper class Blacks are over nine times more likely than upper class Whites to desire the flag be
57
taken down. Such a wide racial gap among a class category indicates that opinions diverge along
racial lines even among respondents in a similar.
Education, political ideology, and political party all matter in determining the odds of
support for removing the South Carolina Confederate flag. A unit increase on the one to nine
educational attainment scale leads to a 15% increase in the odds of wanting to remove the flag.
Likewise, a unit change in the political ideology scale leads to a twenty-five percent increase in
the likelihood of rejecting the placement of the Confederate flag (p<.05). Lastly, like in the
middle class sample, upper class respondents that identify as Democrats have predicted odds of
wanting to remove the flag at 1.758 times the odds for upper class Independents (p<.01).
Gender, age, Republican affiliation, and urban/rural do not seem to matter in predicting
support for removing the Confederate flag among the upper class sample. In the upper class, men
do not have greater or lower odds than women in terms of support for the flag’s placement.
Republicans as opposed to Independents, and young people as opposed to older persons have no
real difference in flag opinion. Lastly, rural compared to suburban, and urban relative to
suburban display no statistically significant relationship for upper class respondents.
5.12 Univariate Statistics for Pew Survey
Table 14 illustrates descriptive statistics for the Pew survey. Within the Pew sample, the
average respondent falls within categories five and six on the income scale indicating that they
make more than $40,000 but less than $75,000 annually. The income scales for both the Pew and
Annenberg range from level one to level nine. However, the Pew’s measure differs in the range
of incomes between levels. For example, the Pew begins level one similar to the Annenberg in
that it is comprised of those that earn less than $10,000 annually. Level two includes those that
58
make ten to less than twenty thousand dollars. Thereafter, it progressively increases by $10,000
until category six. Income levels six through nine are identically coded in the Pew as they are in
the Annenberg.
In addition, about 20% of respondents in the sample identify as a Southerner. A key
difference between the Pew and Annenberg is that while the Annenberg has a control measure
for racial attitudes and not Southern identity, the Pew has the opposite: a control measure for
Southern identity but not racial attitudes. This warrants utilizing two compatible datasets,
specifically, the Pew as a compliment to the Annenberg. Additionally, in regards to education,
the average survey taker has an Associate’s degree or more. Geographically, most respondents in
the Pew dataset live in suburban areas and in the Non-South.
In the Pew dataset, 18.2% (79) of respondents are Black, and 81.8% (356) are White.
There is a slightly greater proportion of Black respondents to White respondents in the Pew
survey compared to the Annenberg. Among respondents, 19% (81) have a positive reaction to
the Confederate flag compared to 81% (354) that have a negative reaction. In slight comparison,
the Annenberg dataset showed a closer almost 50:50 proportion of favoring to keep or remove
the Confederate flag from the South Carolina capitol, suggesting that these are not identical
dependent measures. Both datasets have greater than 50% female respondents; for example, 53%
(230) of respondents are women in the Pew sample while 47% (205) are men. The typical
respondent falls into category three, moderate, on the political ideology scale. The Pew and
Annenberg have identical questions related to political ideology. In regards to political party
affiliation, 45% (195) are Democrats compared to 23% (100) that identify with the Republican
Party. About a third of respondents are Independents. In addition, Pew respondents on the whole

59
are on average older than those of the Annenberg, 52 years old compared to 46 years old,
respectively.
5.13 Bivariate Statistics for Pew Survey
Table 15 shows bivariate cross tabulations with the Pew dataset. Cross tabulations
indicate what percentage of key independent variables fall within having a negative or positive
reaction to the Confederate flag. Close to half, 45% (13), of those that are in the lowest income
bracket have a positive reaction to the flag, the highest percentage of positive reaction for any
income group. Likewise, 94% (44) of those in the highest income bracket have a negative
reaction to the Flag. Chi-Square analysis suggests there is a statistically significant relationship
between income and reaction to the flag (p<.001). This suggests that there is a less than one
percent likelihood that these findings are due to change. In other words, we could expect to find
this relationship in the general population.
Sub-regionally, 89.1% (220) respondents from the Non-South have a negative reaction to
the flag. Comparatively, 81.8% (27) of those in Border States, 65.3% (32) from the Upper South,
and 70.8% (75) of Deep Southerners have negative reactions to the Confederate flag. Findings
suggest that there is a greater proportion of respondents in the Upper South that have a positive
reaction to the flag as opposed to negative reaction, compared to Deep South respondents. With
that being said, only forty-nine respondents are within an Upper South state compared to 106
from Deep South states. There is evidence to suggest there is a statistically significant difference
between those in Non-South areas and Southerners (Chi-Square = 22.301; p<.001), Upper South
and Non-Upper South states (Chi-Square = 9.414; p<.01), and Deep South and Non-Deep South
(Chi-Square = 10.440; p<.01).
60
In a separate Southern identity exhibits the strongest relationship with negative
perception to the flag (r = -.360; p<.001). 90% (290) of those that do not identify as Southern
have a negative reaction to the flag compared to 56% (64) that do identify as Southern having a
negative response to it. Likewise, 44% (50) of those with Southern identity have a positive
reaction to the flag (Chi-Square = 64.941; p<.001). Additionally, almost 20% (70) of White
respondents have a positive reaction to the flag compared to only 13.9% (11) of Blacks. The
bivariate relationship between race and reaction to the flag, however, is not statistically
significant (Chi-Square = 1.405). Controlling for other independent measures in the Pew
multivariate analysis indicates that there is a relationship between race and reaction to the flag.
Lastly, the proportion of men to women and perception to the flag is not significant (Chi-Square
= 2.320).
5.14 Multivariate Statistics for Pew Survey
Table 16 shows the multivariate regression run with the Pew dataset. The Pew’s
dependent variable differs from the Annenberg. In the Pew sample, odds ratios indicate the
likelihood of having a negative reaction to the flag. Negative reaction is coded as category one
whereas positive reaction is coded as category zero. Five models are run with the Pew dataset.
Model five indicates that 88% of case are correctly predicted. With a much smaller sample size
than the Annenberg, split analyses cannot be conducted with the Pew sub-regionally or based on
racial or class categories.
Social class is related to reaction to the Confederate flag. Every unit increase in social
class, ranging from one, indicative of a person that makes less than $10,000, to nine, indicative
of a person that makes more than $150,000, results in a slightly greater than 25% increase in
likelihood of reacting negatively to the Confederate flag (p<.01). In other words, those with
61
higher annual incomes in comparison with those with lower annual incomes have a higher
likelihood of reacting negatively when faced with the Confederate flag. Like in the Annenberg
where there is a positive correlation between income level and odds of wanting the South
Carolina Confederate flag removed, the Pew shows that there is a positive correlation between
income level and odds of having a negative reaction to the Confederate flag.
The Pew dataset includes a control measure for Southern identity but not racial attitudes.
Identifying as Southern leads to a close to 85% decrease in the odds of a person reacting
negatively to the Confederate flag when controlling for other measures (p<.001). Thus,
individuals that label themselves as Southern tend to have higher rates of having a positive
reaction to the Confederate flag.
Although bivariate analyses indicates that three of the four sub-regions have statistically
significant relationships with flag perception, multivariate analysis shows that when controlling
for other independent variables, sub-region does not independently influence reaction to the flag.
Since no single sub-region differs principally from the Deep South even in model one where
only social class and Southern identity are controlled for, it could be the case that too few cases
are present within these categories. For example, only thirty-three cases fall within Border States.
Race does predict reaction to the flag. Black respondents are 3.4 times more likely than
White respondents to react negatively to the Confederate flag (p<.05). Similar to the Annenberg,
White respondents are more likely than Black respondents to have a positive perception to the
flag. In other words, Whites are more likely to favor keeping the Confederate flag atop the South
Carolina capitol. Likewise, Whites are more likely to react positively when faced with the
Confederate flag.
62
Education, as is the case in all other models, influences flag perception. A unit change in
the educational attainment measure ranging from one, indicating completed the eighth grade or
less, to nine, indicating post-graduate training or professional schooling after college, is
associated with a 32% increase in the likelihood of viewing the flag negatively (p<.05). As
education increases, so too do the odds of an individual having a negative reaction to the flag.
Political ideology, like in the case of the Annenberg, is statistically related to flag
reaction. An increase on the ideology scale where the lowest number indicates being very
conservative and the highest number, being very liberal, results in a 2.2 times the likelihood of
having a negative reaction to the Confederate flag. In other words, persons that fall closer to the
liberal end of the political spectrum are more likely to have a negative reaction to the
Confederate flag compared to their more conservative counterparts.
Additionally, being from a rural area decreases the likelihood of negatively viewing the
Confederate flag 55% compared to those from suburban areas (p<.05). Similar to the Deep South
sub-regional analysis, urban/rural matters, but it’s being from a rural area as opposed to an urban
area that really influences perception. In the Pew, no statistical difference exists between being
from an urban area or suburban area in predicting flag perception.
In comparison with the Annenberg’s national sample, no gender difference presents itself
in predicting negative reaction to the flag. In contrast to the Annenberg where age influences a
positive relationship on support for removing the Confederate flag, age in the Pew shows no such
relationship. Instead, older individuals are just as likely as younger people to have a negative
reaction to the Confederate flag. Still, age in both cases is best expressed linearly with the

63
dependent variables. Lastly, political party affiliation, although mattering in the Annenberg
national sample, does not matter in the Pew national dataset.
Discussion
Within the Annenberg national sample, the Annenberg split race models, and the Pew
national sample, social class statistically matters in predicting flag perception. In the case of the
Annenberg, social class impacts support for removing the Confederate flag from the South
Carolina capitol, and for the Pew, social class matters in predicting reaction to the Confederate
flag. Only two foregoing studies have used income as an independent predictor of flag
perception, and only one of those two has found it to be statistically significant. Without
controlling for other factors, Leib and Webster (2012) find a positive correlation between county
level income average and voting for keeping the Mississippi state flag insigne with the
Confederate Battle flag emblazoned within it; on the other hand, Reingold and Wike (1998) find
that when controlling for other variables, income (social class) does not predict voting patterns in
the Georgia state flag referendum. This study shows that even while controlling for all other
variables in each model, social class reliably predicts both predicting whether an individual will
want to remove the South Carolina Confederate flag and will have a negative reaction to the flag.
In other word, as social class increases, so too do the odds of wanting the S.C. flag removed and
having a negative reaction to the flag.
This analysis also looks at the role of social class within sub-regions and within racial
categories. When controlling for other independent measures in each of the four sub-regional
analyses, social class does not statistically predict level of support for the Confederate flag. In
each of the models, it seems that not adding race to the analysis results in omitted variable bias.
In other words, racial identity wipes out the effect of class within sub-regions. Conversely, like
within the Annenberg national and Non-South samples, race and class interact to predict
perception to the flag. Thus race impacts whether someone will want to remove the South
65
Carolina Confederate flag, but that this relationship works in tandem with social class. Black
respondents as well as upper class respondents are more likely to desire the removal of the flag
relative to Whites and lower class respondents, respectively. Incorporating income level into the
analyses offers a more critical look at social class’ role in affecting perception. Just as Klan
chapters were more likely to be found in counties with lower income areas relative to that area’s
median income (McVeigh et. al. 2014), social class matters, because, as much research has
concluded, lower classes are more directly affected by equality than others (see Bonacich 1972,
1976; Bobo and Kluegel 1993).
To take it one step further, for both Blacks and Whites, social class matters in level of
support for the Confederate flag. A unit increase for social class among Blacks leads to a 16%
increase in the odds of favoring the removal of the South Carolina Confederate flag. Likewise, a
change in social class, measured on the income scale from one to nine, results in a 3% greater
odds of wanting the flag taken down. Thus, in both racial categories, those on the higher end of
the class hierarchy favor the removal of the flag at higher rates than those in the lower classes.
According to symbolic politics theory, socialization plays a crucial role in the manner in
which people interpret symbols (Clark 1997). Sears, Hensler, and Speer (1979), for example,
explain that information produces symbols from which emotional responses are formed. Symbols
similar to the original producer of the response will then elicit emotional responses compatible
with the initial symbol (Sears, Hensler, and Speer 1979). Since there are regional differences in
the structure that agents interact with within the United States, for instance, the church holding
more hegemony over the South than other regions, socialization experiences should be different;
thus, people from dissimilar regions should theoretically interpret symbols differently. The
foregoing Annenberg analyses show that not only do people from the Non-South and Border
66
States differ in terms of level of support for removing the South Carolina Confederate flag, but
that different factors within these four sub-regions do feel dissimilarly about the flag, offering
support for symbolic politics theory.
Comparable to Clark’s (1997) and Cooper and Knotts’ (2006) findings, people that grow
up outside of the South view the Confederate flag differently than those that grow up within the
South, according to this study. More specifically, people from the Non-South are 76% more
likely than those in the Deep South to support the removal of the South Carolina Confederate
flag (p<.001). Likewise, Border States that form the geographical boundary between the
historically relevant North and South regions, are 28% more likely than those in the Deep South
to favor removing the flag (p<.08).
Although there seems to be little evidence that, for instance, the Upper South is different
from the Deep South in terms of flag perception controlling for other factors in the national
samples, closer sub-regional split model analyses yield surprising results. Within the Upper
South individuals being from an urban compared to suburban area or rural versus suburban area
do not differ in support for the flag when controlling for other variables. Comparatively, only in
the Deep South does being from a rural area as opposed to a suburban area matter. Respondents
that live in the rural Deep South are less likely to support removing the Confederate flag
compared to suburban Deep South residents.
According to Kaufman (2001:29), “People make political choices based on emotion and
in response to symbols.” Thus, when Alabama Governor George Wallace raised the Confederate
flag above the Alabama capitol, he was appealing to the majority of White Southerners who, like
Wallace, were opposed to the admission of Black students at the University of Alabama. In this
sense, the flag forced a reaction from people pushing them into either supporting those in control
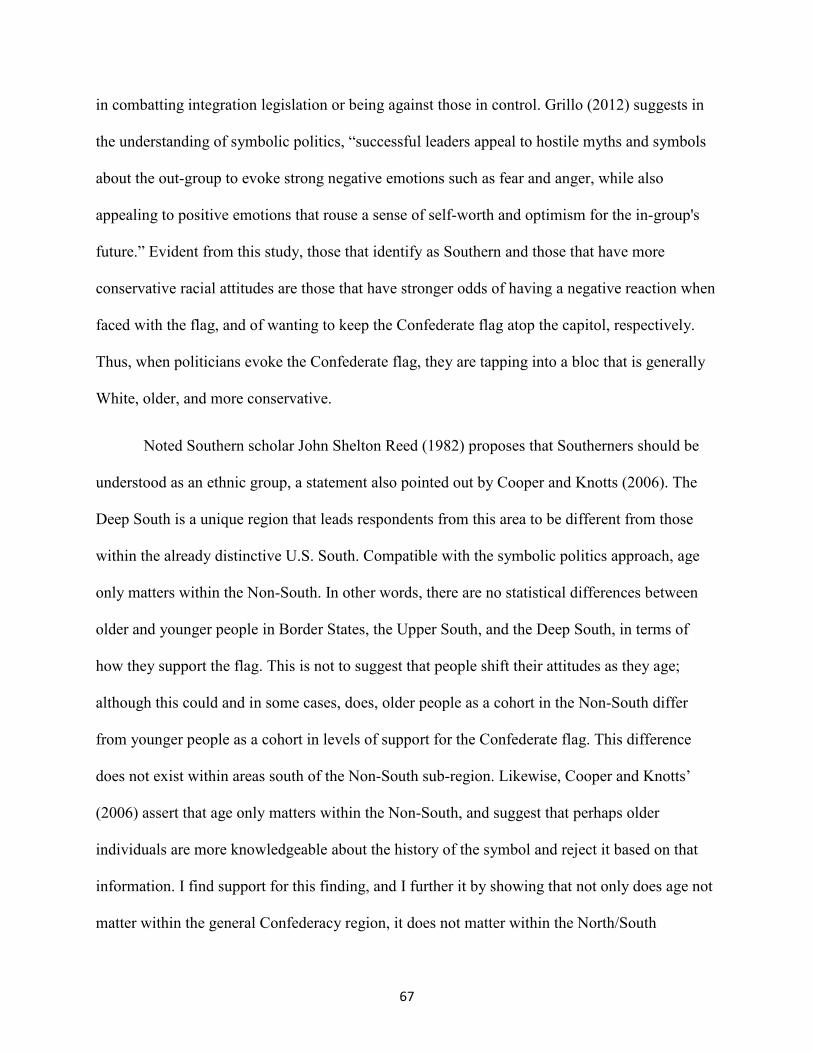
67
in combatting integration legislation or being against those in control. Grillo (2012) suggests in
the understanding of symbolic politics, “successful leaders appeal to hostile myths and symbols
about the out-group to evoke strong negative emotions such as fear and anger, while also
appealing to positive emotions that rouse a sense of self-worth and optimism for the in-group's
future.” Evident from this study, those that identify as Southern and those that have more
conservative racial attitudes are those that have stronger odds of having a negative reaction when
faced with the flag, and of wanting to keep the Confederate flag atop the capitol, respectively.
Thus, when politicians evoke the Confederate flag, they are tapping into a bloc that is generally
White, older, and more conservative.
Noted Southern scholar John Shelton Reed (1982) proposes that Southerners should be
understood as an ethnic group, a statement also pointed out by Cooper and Knotts (2006). The
Deep South is a unique region that leads respondents from this area to be different from those
within the already distinctive U.S. South. Compatible with the symbolic politics approach, age
only matters within the Non-South. In other words, there are no statistical differences between
older and younger people in Border States, the Upper South, and the Deep South, in terms of
how they support the flag. This is not to suggest that people shift their attitudes as they age;
although this could and in some cases, does, older people as a cohort in the Non-South differ
from younger people as a cohort in levels of support for the Confederate flag. This difference
does not exist within areas south of the Non-South sub-region. Likewise, Cooper and Knotts’
(2006) assert that age only matters within the Non-South, and suggest that perhaps older
individuals are more knowledgeable about the history of the symbol and reject it based on that
information. I find support for this finding, and I further it by showing that not only does age not
matter within the general Confederacy region, it does not matter within the North/South
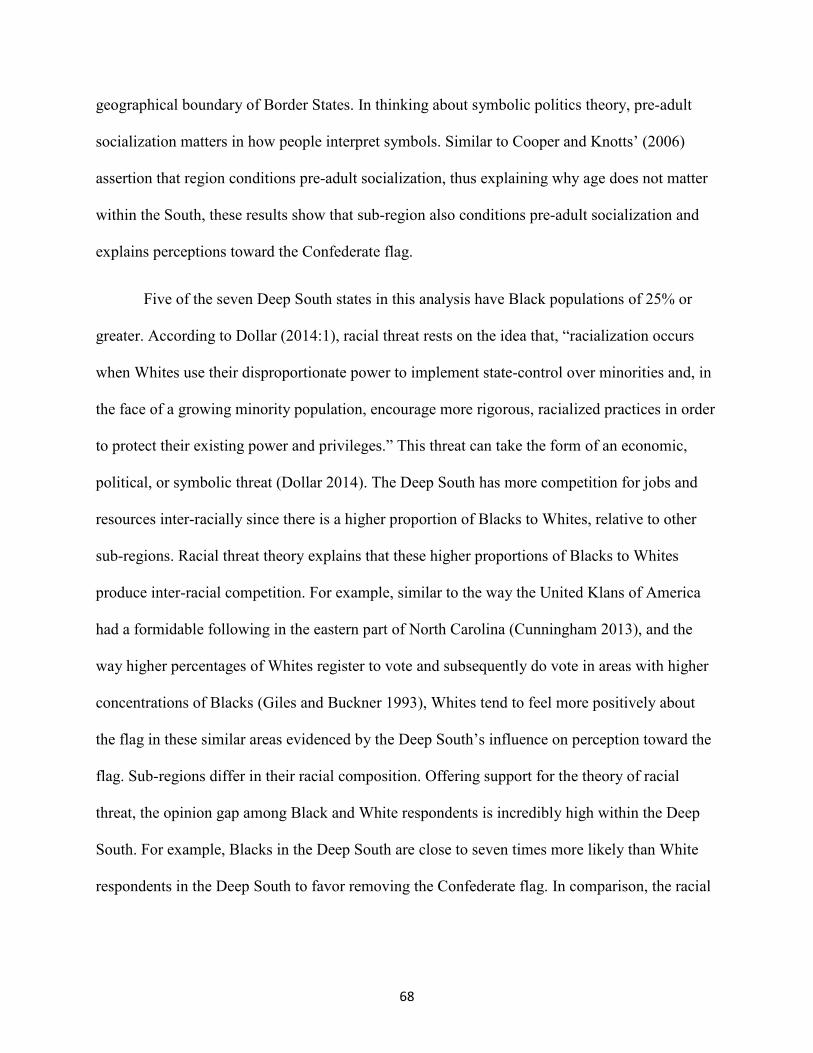
68
geographical boundary of Border States. In thinking about symbolic politics theory, pre-adult
socialization matters in how people interpret symbols. Similar to Cooper and Knotts’ (2006)
assertion that region conditions pre-adult socialization, thus explaining why age does not matter
within the South, these results show that sub-region also conditions pre-adult socialization and
explains perceptions toward the Confederate flag.
Five of the seven Deep South states in this analysis have Black populations of 25% or
greater. According to Dollar (2014:1), racial threat rests on the idea that, “racialization occurs
when Whites use their disproportionate power to implement state-control over minorities and, in
the face of a growing minority population, encourage more rigorous, racialized practices in order
to protect their existing power and privileges.” This threat can take the form of an economic,
political, or symbolic threat (Dollar 2014). The Deep South has more competition for jobs and
resources inter-racially since there is a higher proportion of Blacks to Whites, relative to other
sub-regions. Racial threat theory explains that these higher proportions of Blacks to Whites
produce inter-racial competition. For example, similar to the way the United Klans of America
had a formidable following in the eastern part of North Carolina (Cunningham 2013), and the
way higher percentages of Whites register to vote and subsequently do vote in areas with higher
concentrations of Blacks (Giles and Buckner 1993), Whites tend to feel more positively about
the flag in these similar areas evidenced by the Deep South’s influence on perception toward the
flag. Sub-regions differ in their racial composition. Offering support for the theory of racial
threat, the opinion gap among Black and White respondents is incredibly high within the Deep
South. For example, Blacks in the Deep South are close to seven times more likely than White
respondents in the Deep South to favor removing the Confederate flag. In comparison, the racial
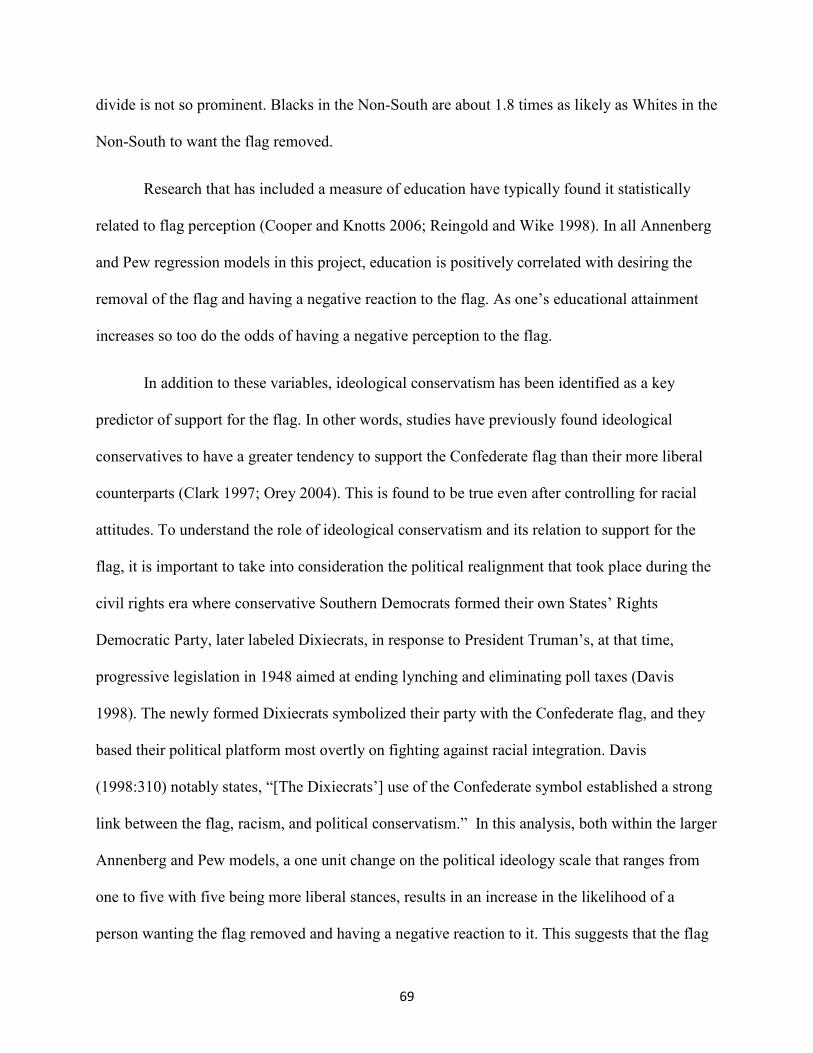
69
divide is not so prominent. Blacks in the Non-South are about 1.8 times as likely as Whites in the
Non-South to want the flag removed.
Research that has included a measure of education have typically found it statistically
related to flag perception (Cooper and Knotts 2006; Reingold and Wike 1998). In all Annenberg
and Pew regression models in this project, education is positively correlated with desiring the
removal of the flag and having a negative reaction to the flag. As one’s educational attainment
increases so too do the odds of having a negative perception to the flag.
In addition to these variables, ideological conservatism has been identified as a key
predictor of support for the flag. In other words, studies have previously found ideological
conservatives to have a greater tendency to support the Confederate flag than their more liberal
counterparts (Clark 1997; Orey 2004). This is found to be true even after controlling for racial
attitudes. To understand the role of ideological conservatism and its relation to support for the
flag, it is important to take into consideration the political realignment that took place during the
civil rights era where conservative Southern Democrats formed their own States’ Rights
Democratic Party, later labeled Dixiecrats, in response to President Truman’s, at that time,
progressive legislation in 1948 aimed at ending lynching and eliminating poll taxes (Davis
1998). The newly formed Dixiecrats symbolized their party with the Confederate flag, and they
based their political platform most overtly on fighting against racial integration. Davis
(1998:310) notably states, “[The Dixiecrats’] use of the Confederate symbol established a strong
link between the flag, racism, and political conservatism.” In this analysis, both within the larger
Annenberg and Pew models, a one unit change on the political ideology scale that ranges from
one to five with five being more liberal stances, results in an increase in the likelihood of a
person wanting the flag removed and having a negative reaction to it. This suggests that the flag
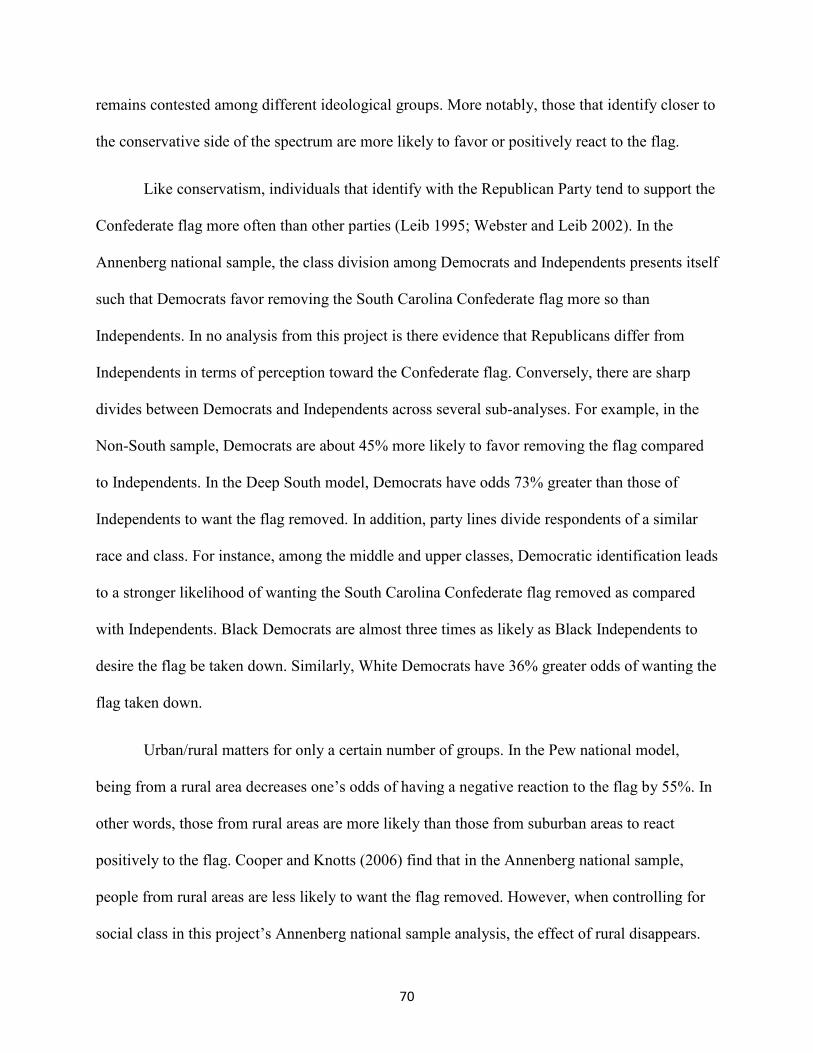
70
remains contested among different ideological groups. More notably, those that identify closer to
the conservative side of the spectrum are more likely to favor or positively react to the flag.
Like conservatism, individuals that identify with the Republican Party tend to support the
Confederate flag more often than other parties (Leib 1995; Webster and Leib 2002). In the
Annenberg national sample, the class division among Democrats and Independents presents itself
such that Democrats favor removing the South Carolina Confederate flag more so than
Independents. In no analysis from this project is there evidence that Republicans differ from
Independents in terms of perception toward the Confederate flag. Conversely, there are sharp
divides between Democrats and Independents across several sub-analyses. For example, in the
Non-South sample, Democrats are about 45% more likely to favor removing the flag compared
to Independents. In the Deep South model, Democrats have odds 73% greater than those of
Independents to want the flag removed. In addition, party lines divide respondents of a similar
race and class. For instance, among the middle and upper classes, Democratic identification leads
to a stronger likelihood of wanting the South Carolina Confederate flag removed as compared
with Independents. Black Democrats are almost three times as likely as Black Independents to
desire the flag be taken down. Similarly, White Democrats have 36% greater odds of wanting the
flag taken down.
Urban/rural matters for only a certain number of groups. In the Pew national model,
being from a rural area decreases one’s odds of having a negative reaction to the flag by 55%. In
other words, those from rural areas are more likely than those from suburban areas to react
positively to the flag. Cooper and Knotts (2006) find that in the Annenberg national sample,
people from rural areas are less likely to want the flag removed. However, when controlling for
social class in this project’s Annenberg national sample analysis, the effect of rural disappears.
71
Similarly, they find that being from a rural area in one of the eleven Confederacy states leads to a
decrease in the odds of wanting the flag taken down. Comparatively, when the Confederacy
states are broken into the Upper and Deep South, only in the Deep South does being from a rural
area matter. Additionally, White respondents from urban areas have 16% greater odds of
preferring the flag removed. Among social class samples, being from the middle class and an
urban makes a person 1.257 times as likely as middle class respondents from suburban areas to
want the flag taken down.
Conclusion
In a two-data set analysis identifying predictors of perceptions toward the Confederate
flag, social class plays an independent and predictive role in feelings toward the flag on the
national level. This work makes a case for the addition of social class and sub-regional residence
to the understanding of perceptions toward the Confederate flag. Using two national sample
surveys is crucial to this project since one dataset, the Annenberg, allows for a control measure
of racial attitudes but not Southern identity, and the other, the Pew, controls for whether a
respondent identifies as a Southerner but not racial attitudes. The dependent measure created
from the Annenberg survey asks respondents whether or not the Confederate flag should stay or
be removed from atop the South Carolina capitol building (Romer et. al. 2004). The second
dataset, a recent 2011 national sample collected by the Pew Research Center, is used as a
compliment to the larger Annenberg survey, and asks whether individuals have a positive or
negative reaction when faced with the flag (April 2011 Political Survey 2011).
These analyses show that social class has an independent effect on perceptions to the
flag. Respondents with higher levels of income support the removal of the South Carolina
Confederate flag more than those with lower levels of income. Similarly, richer respondents tend
to have a negative reaction to the Confederate flag relative to lower income respondents. A
striking finding from these analyses is that a wide racial gap exists in perception among three
separate social classes. In the upper class, Black respondents are more likely to want the flag
removed at a rate nine times that of White respondents. Likewise, among racial categories,
increasing on the one to nine income scale results in a 16% increase and a 3% increase in the
odds of preferring the flag be taken down for Black and White respondents, respectively.

73
This thesis also shows that not only does being from the Non-South and Border States
predict a stronger likelihood of wanting the South Carolina removed relative to the Deep South
respondents, but that different factors matter within the four sub-regions in predicting perception
toward flag. Only in the Deep South, of all models run, does being from a rural area as opposed
to a suburban area statistically predict flag perception. Those from the rural Deep South are more
likely to desire that the South Carolina Confederate flag stay atop the capitol. In comparison,
only in the Non-South sample does being from an urban area differ from living in a suburban
area in relation to flag support.
Consistent with previous research, conservative racial attitudes and identifying as
Southerner inversely relate to wanting the South Carolina flag removed and to having a negative
reaction to the Confederate flag, respectively. Overall, individuals that are: Black, fall closer to
the liberal end of the political spectrum, more educated, older, identify as a Democrat as
compared to an Independent, and that are from the Non-South or Border States relative to the
Deep South, show a stronger likelihood of wanting to remove the Confederate flag from atop the
South Carolina capitol. Comparatively, respondents that are: Black, more liberal than
conservative, have higher educational attainment, and are from suburban as compared to rural
areas, are more likely to have a negative reaction to the Confederate flag.
Consistent with symbolic politics, age is only statistically predictive of perception toward
the flag in the Non-South states, but not Border States, the Upper South, or Deep South.
Respondents in more Southern sub-regions develop attitudes toward the flag at an early age, and
these attitudes do not change as they age. Similarly, individuals in the Deep South, an area with a
higher proportion of Blacks to Whites, would be expected to feel differently about the flag
because of this presence of racial threat theory. Results show that respondents in the Non-South

74
and Border States, even while controlling for all independent variables, are more likely to
support the removal of the South Carolina Confederate flag relative to the Deep South.
Overall, results are consistent with symbolic politics theory and racial threat theory. In
line with other relevant scholarly inquiry into perceptions toward the flag, racial attitudes and
Southern identity do statistically directly predict perception. Conversely, the independent effect
of each does not control for the other. Research has shown that Southern identity is related to
conservative racial attitudes (Clark 1997). In conclusion, social class and sub-regional location
overlooked, but important variables in predicting perception toward the Confederate flag.
References
Allport, Gordon. 1954. The Nature of Prejudice. Cambridge, MA: Addison Wesley.
“April 2011 Political Survey.” 2011. Pew Research Center.
New York Times. 1995. "Symbolism Turns Deadly when Flag is Misread." January 29.
New York Daily News. 2014. "California Bill Passes to Ban State Sales of Confederate Flag
Items." May 6.
Aziz, Naeesa. 2011. "Black Student Defends Confederate Flag." BET.com, December 2.
Bobo, Lawrence. 1983. "Whites' Opposition to Busing: Symbolic Racism Or Realistic Group
Conflict?" Journal of Personality and Social Psychology 45(6):1196-1210.
Bobo, Lawrence and James Kluegel. 1993. "Opposition to Race-Targeting: Self-Interest,
Stratification Ideology, Or Racial Attitudes?" American Sociological Review 58(4):443-
464.
Bonacich, Edna. 1972. "A Theory of Ethnic Antagonism: The Split Labor Market." American
Sociological Review 37(5):547-559.
Bonacich, Edna. 1976. "Advanced Capitalism and Black/ White Race Relations in the United
States: A Split Labor Market Interpretation." American Sociological Review 41(1):34-51.
Bonilla-Silva, Eduardo and David Dietrich. 2011. "The Sweet Enchantment of Color-Blind
Racism in Obamerica." The ANNALS of the American Academy of Political and Social
Science 634:190-206.

76
Bonner, Robert E. 2002. Colors and Blood: Flag Passions of the Confederate South. Princeton,
NJ: Princeton University Press.
Carter, J. Scott. 2010. "A Cosmopolitan Way of Life for all? A Reassessment of the Impact of
Urban and Region on Racial Attitudes from 1972 to 2006." Journal of Black
Studies 40(6):1075-1093.
Carter, J. Scott. and Mamadi Corra. 2012. "Beliefs about the Causes of Racial Inequality: The
Persisting Impact of Urban and Suburban Locations?." Urban Studies Research: 1-7.
Carter, J. Scott., Lala C. Steelman, Lynn M. Mulkey and Casey Borch. 2005. "When the Rubber
Meets the Road: Effects of Urban and Regional Residence on Principle and
Implementation Measures of Racial Tolerance." Social Science Research 34:408-425.
“Civil War at 150: Still Relevant, Still Divisive.” 2011. Pew Research Center.
(http://www.people-press.org/files/legacy-pdf/04-08-
11%20Civil%20War%20Release%20.pdf).
Clark, John A. 1997. "Explaining Elite Attitudes on the Georgia Flag." American Politics
Quarterly 25(4):482-496.
Cooper, Christopher A. and H. G. Knotts. 2006. "Region, Race, and Support for the South
Carolina Confederate Flag." Social Science Quarterly 87(1):142-154
(http://search.ebscohost.com.jproxy.lib.ecu.edu/login.aspx?direct=true&db=bth&AN=19
615866&site=ehost-live). doi: 10.1111/j.0038-4941.2006.00373.x.
77
Corra, Mamadi and J. Scott. Carter. 2008. "Shadow of the Past?: Assessing Racial and Gender
Differences in Confidence in the Institutions of Science and Medicine ." Black Women,
Gender, and Families 2(1):54-83.
Coski, John M. 2005. The Confederate Battle Flag: America's most Embattled Symbol.
Cambridge, Mass: Belknap Press of Harvard University Press.
Cunningham, David. 2013. Klansville, U.S.A.: The Rise and Fall of the Civil Rights-Era Ku Klux
Klan. Oxford University Press.
Davis, John W. 1998. "An Air of Defiance: Georgia's State Flag Change of 1956." Georgia
Historical Quarterly 82(2):305-330.
Diemer, Matthew A., Rashmita S. Mistry, Martha E. Wadsworth, Irene López and Faye Reimers.
2013. "Best Practices in Conceptualizing and Measuring Social Class in Psychological
Research." Analyses of Social Issues and Public Policy 13(1):77-113.
Dollar, Cindy B. 2014. "Racial Threat Theory: Assessing the Evidence, Requesting
Redesign." Journal of Criminology: 1-7.
Dorf, Michael C. 2011. "Same-Sex Marriage, Second-Class Citizenship, and Law's Social
Meanings." Virginia Law Review 97(6):1267-1346.
Eastman, Jason T. and Douglas P. Schrock. 2008. "Southern Rock Musicians' Construction of
White Trash." Race, Gender & Class 15(1):205-219.
Ehrlinger, Joyce, E. A. Plant, Richard P. Eibach, Corey J. Columb, Joanna L. Goplen, Jonathan
W. Kunstman and David A. Butz. 2011. "How Exposure to the Confederate Flag Affects

78
Willingness to Vote for Barack Obama." Political Psychology 32(1):131-146
(http://search.ebscohost.com.jproxy.lib.ecu.edu/login.aspx?direct=true&db=bth&AN=56
599785&site=ehost-live). doi: 10.1111/j.1467-9221.2010.00797.x.
Felbermayr, Gabriel, and Jasmin Groschl. 2014. "Within U.S. Trade and the Long Shadow of the
American Secession." Economic Inquiry 52(1):382-404.
Fla. Stat. § 256:10. Mutilation of or Disrespect for Confederate Flags or Replicas.
Ga. Code. Title 50-3-1. Description of State Flag.
Geertz, Clifford. 1973. The Interpretation of Cultures. New York: Basic Books.
Giles, Micheal W. and Melanie A. Buckner. 1993. "David Duke and Black Threat: An Old
Hypothesis Revisited." Journal of Politics 55(3):702.
Griffin, Larry J. and Peggy G. Hargis. 2008. "Still Distinctive After all these Years Trends in
Racial Attitudes in and Out of the South." Southern Cultures 14(3):117-141.
Grillo, Michael C. 2012. "The Social Psychology of Leadership and Followership in Symbolic
Politics Theory: The Case of Islamophobia in American Politics.", ProQuest Information
& Learning, US
(http://search.ebscohost.com.jproxy.lib.ecu.edu/login.aspx?direct=true&db=psyh&AN=2
012-99070-003&site=ehost-live).
Huffington Post. 2012. "Lynyrd Skynyrd: Confederate Flag is 'Heritage, Not Hate'." September
24.
79
Hutchings, Vincent L. and Nicholas A. Valentino. 2004. "The Centrality of Race in American
Politics." Annual Review of Political Science 7:383-408.
Hutson, Kirk. 1995. "Hot 'N' Nasty: Black Oak Arkansas and its Effect on Rural Southern
Culture." Arkansas Historical Quarterly 54(2):185-211.
Kansas City Star. 2014. “Ferguson Protesters Met with Hecklers, Confederate Flag, in Rural
Missouri.” December 4.
La. Rev. Stat. § 14:116. Flag desecration.
Miss. Code of Laws. § 97-7-39. Flags; Desecration of National or State Flag Prohibited.
S.C. Code Ann. § 16-17-210. Desecration or Mutilation of Flags.
Southern Poverty Law Center. 2000. Intelligence Report: Rebels with a Cause (99).
(http://www.splcenter.org/get-informed/intelligence-report/browse-all-
issues/2000/summer).
Kaufman, Stuart J. 2001. Modern Hatreds: The Symbolic Politics of Ethnic War. United States of
America: Cornell Univ. Press.
------. 2006. "Symbolic Politics Or Rational Choice?" International Security 30(4):45-86.
Krause, Michael, Paul Piff and Dacher Keltner. 2009. "Social Class, Sense of Control, and Social
Explanation." Journal of Personality and Social Psychology 97(6):992-1004.

80
Kuklinski, James H., Paul M. Sniderman, Kathleen Knight, Thomas Piazza, Philip E. Tetlock,
Gordon R. Lawrence and Barbara Mellers. 1997. "Racial Prejudice and Attitudes Toward
Affirmative Action." American Journal of Political Science 41(2):402-419.
Lang, Clarence. 2013. "Locating the Civil Rights Movement: An Essay on the Deep South,
Midwest, and Border South in Black Freedom Studies." Journal of Social
History 47(2):371-400.
Leib, Jonathan. 1995. "Heritage Versus Hate: A Geographical Analysis of Georgia's
Confederate Battle Flag Debate." Southeastern Geographer (35):37-57.
Leib, Jonathan I., and Gerald R. Webster. 2012. "Black, White Or Green? the Confederate Battle
Emblem and the 2001 Mississippi State Flag Referendum." Southeastern
Geographer 52(3):299-326.
Luetkemeyer, Lucinda H. 2010. "Silencing the Rebel Yell: The Eighth Circuit Upholds a Public
School's Ban on Confederate Flags." Missouri Law Review 75(3):989-1014
(http://search.ebscohost.com.jproxy.lib.ecu.edu/login.aspx?direct=true&db=a9h&AN=60
824215&site=ehost-live).
Martinez, J. Michael. 2008. "The Georgia Confederate Flag Dispute." Georgia Historical
Quarterly 92(2):200-228.
Martinez, J. Michael., William D. Richardson and Ron McNinch-Su, eds. 2000. "Confederate
Symbols in the Contemporary South." Pp. 351 in "Confederate Symbols in the
Contemporary South." Gainesville, Fl: University of Florida Press.

81
McVeigh, Rory, David Cunningham and Justin Farrell. 2014. "Political Polarization as a Social
Movement Outcome: 1960s Klan Activism and its Enduring Impact on Political
Realignment in Southern Counties, 1960 to 2000." American Sociological
Review 79(6):1144-1171.
Moore, Laura M. and Seth Ovadia. 2006. "Accounting for Spatial Variation in Tolerance: The
Effects of Education and Religion." Social Forces 84(4):2205-2222.
Murphy, Sharon A. 2005. "Securing Human Property: Slavery, Life Insurance, and
Industrialization in the Upper South." Journal of the Early Republic 25(4):615-652.
Newman, Joshua I. 2007. "Old Times there are Not Forgotten: Sport, Identity, and the
Confederate Flag in the Dixie South." Sociology of Sport Journal 24(3):261-282.
Orey, Byron D. 2004. "White Racial Attitudes and Support for the Mississippi State
Flag." American Politics Research 32(1):102-116
(http://search.ebscohost.com.jproxy.lib.ecu.edu/login.aspx?direct=true&db=ahl&AN=12
118880&site=ehost-live). doi: 10.1177/1532673X03255169.
Quinn, Malcolm. 2005. The Swastika: Constructing the Symbol. New York: Routledge.
Reingold, Beth and Richard S. Wike. 1998. "Confederate Symbols, Southern Identity, and Racial
Attitudes: The Case of the Georgia State Flag." Social Science Quarterly (University of
Texas Press) 79(3):568-580
(http://search.ebscohost.com.jproxy.lib.ecu.edu/login.aspx?direct=true&db=bth&AN=12
25442&site=ehost-live).
82
Sears, David O., Carl P. Hensler and Leslie K. Speer. 1979. "Whites' Opposition to "Busing":
Self-Interest Or Symbolic Politics?." The American Political Science Review 73(2):369-
384.
Shafer, Byron E. and Richard Johnston. 2009. The End of Southern Exceptionalism:
Class, Race, and Partisan Change in the Postwar South. Harvard University Press.
Rastogi, Sonya, Tallese D. Johnson, Elizabeth M. Hoeffel, and Malcolm P. Drewery, Jr. 2011.
The Black Population: 2010. United States Census Bureau.
Reed, John Shelton. 1982. One South: An Ethnic Approach to Regional Culture. Baton Rouge,
LA: Louisiana State University Press.
Romer, Daniel, Kate Kenski, Paul Waldman, Christopher Adasiewicz, and Kathleen Hall
Jamieson. 2004. Capturing Campaign Dynamics: The National Annenberg Election
Survey: Design, Method, and Data. Cambridge: Cambridge University Press.
Sokol, Jason. 2008. "White Southerners’ Reactions to the Civil Rights Movement." United States
Bureau of International Information Programs.
(http://iipdigital.usembassy.gov/st/english/publication/2009/01/20090106143801jmnamd
eirf0.9369623.html#axzz3QGYEI3nh).
Thornton, Kevin. 1996. "The Confederate Flag and the Meaning of Southern History." Southern
Cultures 2(2):233-245
(http://search.ebscohost.com/login.aspx?direct=true&db=ahl&AN=45793700&site=ehost
-live).

83
Tuch, Steven A. and Michael Hughes. 1996. "Whites' Racial Policy Attitudes." Social Science
Quarterly 77(4):723-745.
U.S. Census Bureau. 2010. (http://tigerweb.geo.census.gov/datamapper/map.html).
Valentino, Nicholas A. and David O. Sears. 2005. "Old Times there are Not Forgotten: Race and
Partisan Realignment in the Contemporary South." American Journal of Political
Science 49(3):672-688.
Webster, Gerald R. and Jonathan I. Leib. 2002. "Political Culture, Religion, and the Confederate
Battle Flag Debate in Alabama." Journal of Cultural Geography 20(1):1
(http://search.ebscohost.com.jproxy.lib.ecu.edu/login.aspx?direct=true&db=ahl&AN=93
44635&site=ehost-live).
White, G. Edward. 2011. "Recovering the Legal History of the Confederacy." Washington & Lee
Law Review 68(2):467-554.
Winter, William F. 2013. "The Evolution of Politics in the Deep South." Southern
Quarterly 51(1):93-105.
Woliver, Laura R., Angela D. Ledford and Chris J. Dolan. 2001. "The South Carolina
Confederate Flag: The Politics of Race and Citizenship." Politics & Policy 29(4):708-
730.
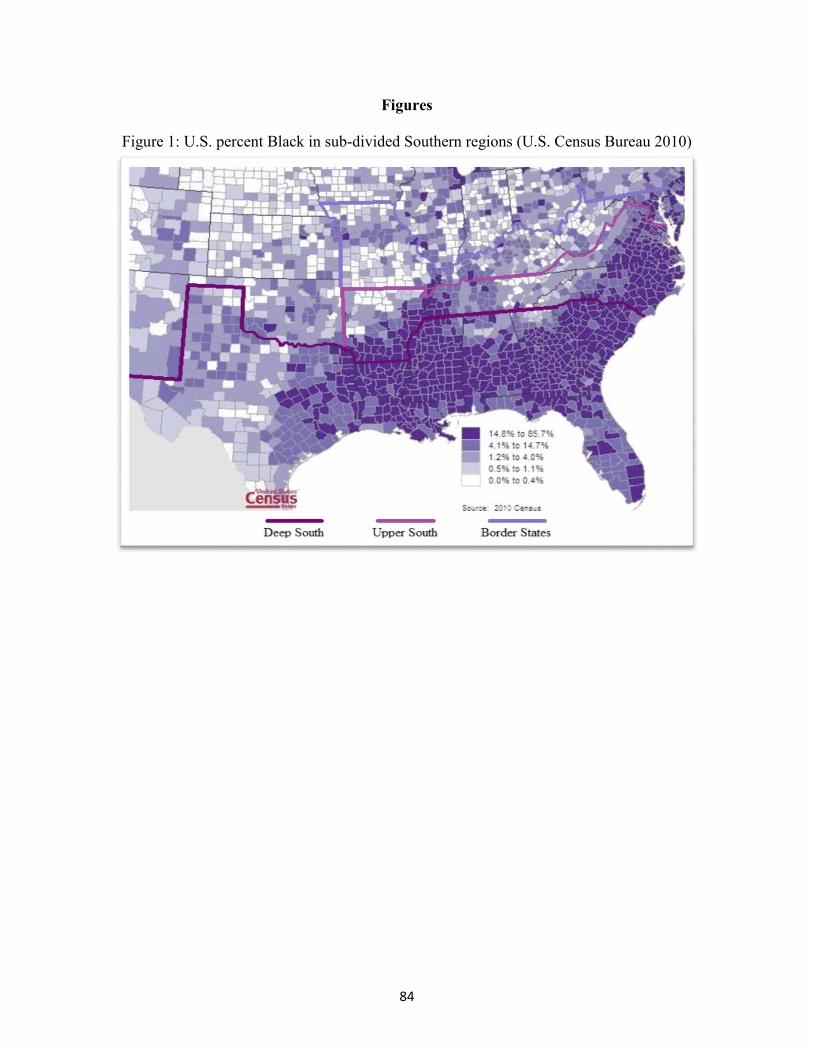
84
Figures
Figure 1: U.S. percent Black in sub-divided Southern regions (U.S. Census Bureau 2010)
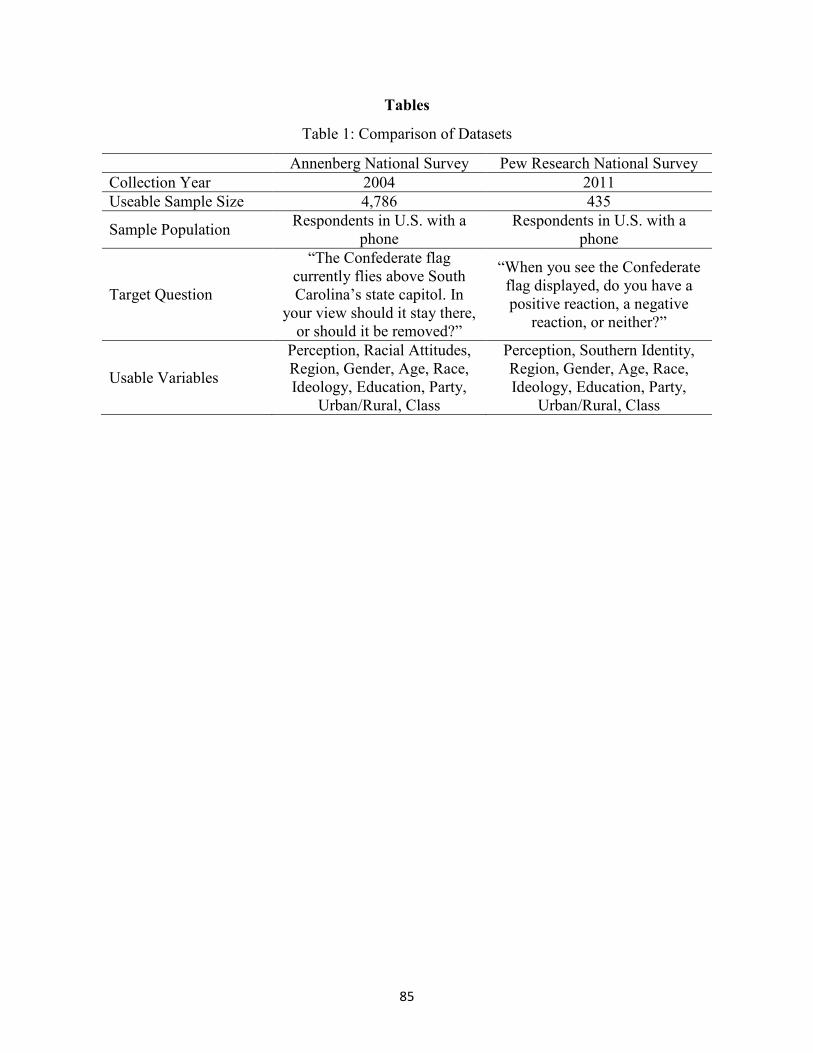
85
Tables
Table 1: Comparison of Datasets
Annenberg National Survey Pew Research National Survey
Collection Year 2004 2011
Useable Sample Size 4,786 435
Sample Population Respondents in U.S. with a
phone Respondents in U.S. with a
phone
Target Question
“The Confederate flag currently flies above South Carolina’s state capitol. In
your view should it stay there, or should it be removed?”
“When you see the Confederate flag displayed, do you have a positive reaction, a negative
reaction, or neither?”
Usable Variables
Perception, Racial Attitudes, Region, Gender, Age, Race, Ideology, Education, Party,
Urban/Rural, Class
Perception, Southern Identity, Region, Gender, Age, Race, Ideology, Education, Party,
Urban/Rural, Class

86
Table 2: Annenberg Dataset Questions and Recoding
Variable Question Wording and Recoding
Flag Perception “The Confederate flag currently flies above South Carolina’s state capitol. In your view, should it stay there or should it be removed?” 0-Stay; 1-Be removed
Racial Attitudes
Please tell me how much effort you think the federal government should put into each of the following. Trying to stop job discrimination against blacks: should the federal government do more about this, the same as now, less or nothing at all? 1-none; 2-less; 3-some; 4-more
Region No question. Deep South-TX, MS, LA, AL, GA, SC, FL; Upper South-NC, TN, VA, AR; Border States-DE, MD, KY, MO, WV; Non-South-All else
Female No question. Female-1; Male-0
Age “What is your age?” Coded as a continuous variable
Black “What is your race?” Black-1; White-0
Liberal Political Ideology
“Generally speaking would you consider your political views as very conservative, conservative, moderate, liberal, or very liberal?’’ 1—Very conservative; 2—Conservative; 3—Moderate; 4—Liberal; 5—Very liberal
Political Party
“Generally speaking, do you usually think of yourself as a Republican, a Democrat, an independent or something else?” Republican: 1–Republican; 0-Democrat & Independent. Democrat: 1-Democrat; 0-Republican & Independent
Education Level
“What is the last grade or class you completed in school?’’ 1—Grade eight or lower; 2—Some high school, no diploma; 3—High school diploma or equivalent; 4—Technical or vocational school after high school; 5—Some college, no degree; 6—Associate’s or two-year college degree; 7—Four-year college degree; 8—Graduate or professional school after college, no degree; 9—Graduate or professional degree
Urban No question. 0—Rural and suburban; 1—Urban
Rural No question. 0—Urban and suburban; 1—Rural
Social Class (Income)
“Last year, what was your total household income before taxes? Just stop me when I get to the right category.” 1-Less than $10,000; 2-$10,000 to less than $15,000; 3-$15,000 to less than $25,000; 4-$25,000 to less than $35,000; 5-$35,000 to less than $50,000; 6-$50,000 to less than $75,000; 7-$75,000 to less than $100,000; 8-$100,000 to less than $150,000; 9-or $150,000 or more?
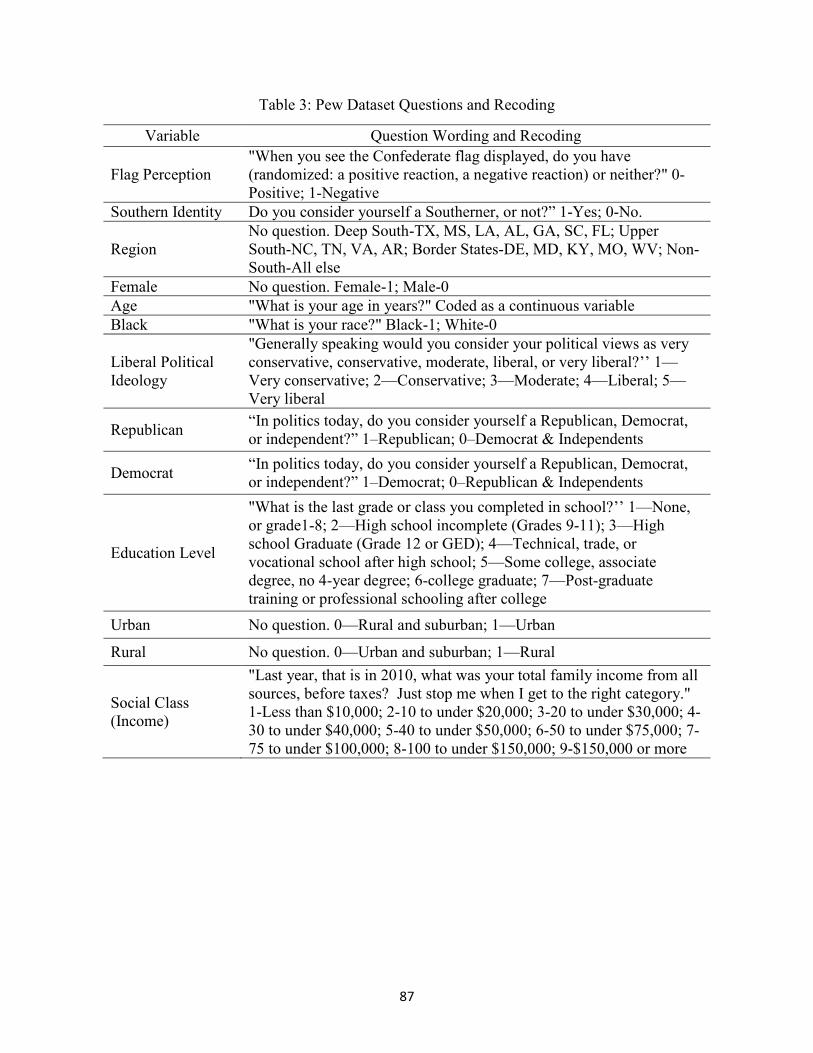
87
Table 3: Pew Dataset Questions and Recoding
Variable Question Wording and Recoding
Flag Perception "When you see the Confederate flag displayed, do you have (randomized: a positive reaction, a negative reaction) or neither?" 0-Positive; 1-Negative
Southern Identity Do you consider yourself a Southerner, or not?” 1-Yes; 0-No.
Region No question. Deep South-TX, MS, LA, AL, GA, SC, FL; Upper South-NC, TN, VA, AR; Border States-DE, MD, KY, MO, WV; Non-South-All else
Female No question. Female-1; Male-0
Age "What is your age in years?" Coded as a continuous variable
Black "What is your race?" Black-1; White-0
Liberal Political Ideology
"Generally speaking would you consider your political views as very conservative, conservative, moderate, liberal, or very liberal?’’ 1—Very conservative; 2—Conservative; 3—Moderate; 4—Liberal; 5—Very liberal
Republican “In politics today, do you consider yourself a Republican, Democrat, or independent?” 1–Republican; 0–Democrat & Independents
Democrat “In politics today, do you consider yourself a Republican, Democrat, or independent?” 1–Democrat; 0–Republican & Independents
Education Level
"What is the last grade or class you completed in school?’’ 1—None, or grade1-8; 2—High school incomplete (Grades 9-11); 3—High school Graduate (Grade 12 or GED); 4—Technical, trade, or vocational school after high school; 5—Some college, associate degree, no 4-year degree; 6-college graduate; 7—Post-graduate training or professional schooling after college
Urban No question. 0—Rural and suburban; 1—Urban
Rural No question. 0—Urban and suburban; 1—Rural
Social Class (Income)
"Last year, that is in 2010, what was your total family income from all sources, before taxes? Just stop me when I get to the right category." 1-Less than $10,000; 2-10 to under $20,000; 3-20 to under $30,000; 4-30 to under $40,000; 5-40 to under $50,000; 6-50 to under $75,000; 7-75 to under $100,000; 8-100 to under $150,000; 9-$150,000 or more
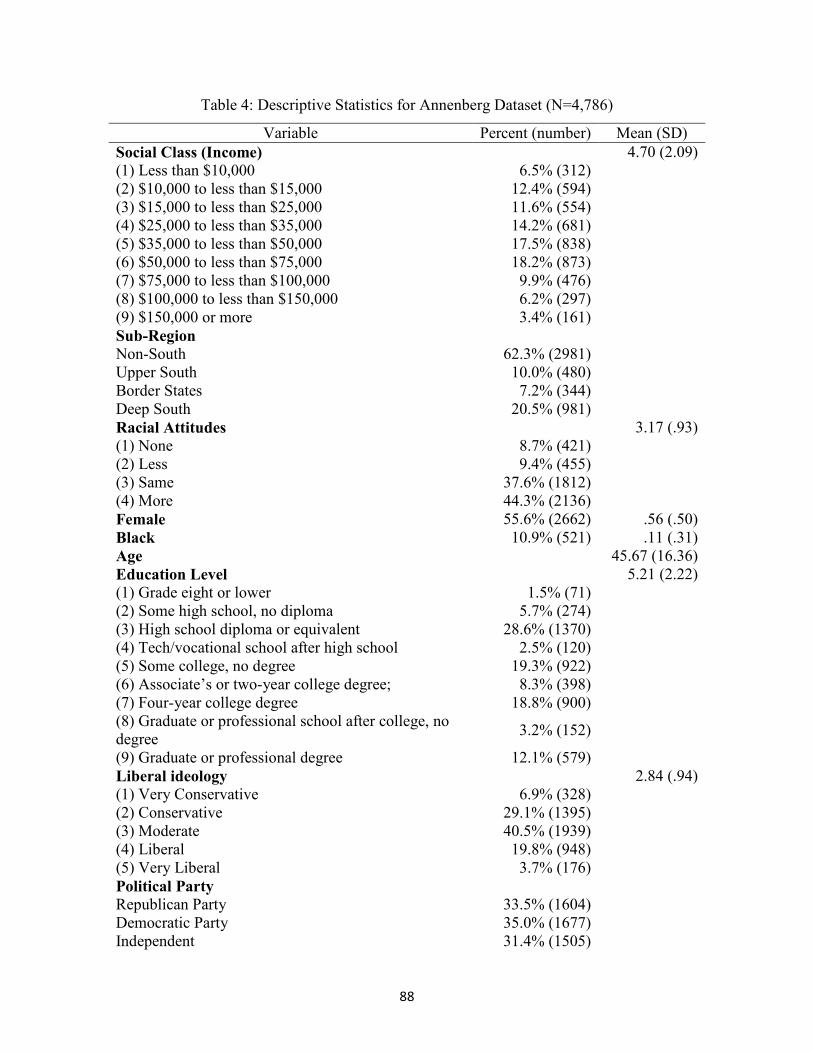
88
Table 4: Descriptive Statistics for Annenberg Dataset (N=4,786)
Variable Percent (number) Mean (SD)
Social Class (Income) 4.70 (2.09) (1) Less than $10,000 6.5% (312) (2) $10,000 to less than $15,000 12.4% (594) (3) $15,000 to less than $25,000 11.6% (554) (4) $25,000 to less than $35,000 14.2% (681) (5) $35,000 to less than $50,000 17.5% (838) (6) $50,000 to less than $75,000 18.2% (873) (7) $75,000 to less than $100,000 9.9% (476) (8) $100,000 to less than $150,000 6.2% (297) (9) $150,000 or more 3.4% (161)
Sub-Region Non-South 62.3% (2981) Upper South 10.0% (480) Border States 7.2% (344) Deep South 20.5% (981)
Racial Attitudes 3.17 (.93) (1) None 8.7% (421) (2) Less 9.4% (455) (3) Same 37.6% (1812) (4) More 44.3% (2136)
Female 55.6% (2662) .56 (.50)
Black 10.9% (521) .11 (.31)
Age 45.67 (16.36)
Education Level 5.21 (2.22) (1) Grade eight or lower 1.5% (71) (2) Some high school, no diploma 5.7% (274) (3) High school diploma or equivalent 28.6% (1370) (4) Tech/vocational school after high school 2.5% (120) (5) Some college, no degree 19.3% (922) (6) Associate’s or two-year college degree; 8.3% (398) (7) Four-year college degree 18.8% (900) (8) Graduate or professional school after college, no degree
3.2% (152)
(9) Graduate or professional degree 12.1% (579)
Liberal ideology 2.84 (.94) (1) Very Conservative 6.9% (328) (2) Conservative 29.1% (1395) (3) Moderate 40.5% (1939) (4) Liberal 19.8% (948) (5) Very Liberal 3.7% (176)
Political Party Republican Party 33.5% (1604) Democratic Party 35.0% (1677) Independent 31.4% (1505)

89
Table 4 (Continued): Descriptive Statistics for Annenberg Dataset (N=4,786)
Variable Percent (number) Mean (SD)
Urban/Rural Urban 27.2% (1300) Suburban 48.5% (2323) Rural 24.3% (1163)
Flag Perception Support to keep flag 50.3% (2408) Wants removal of flag 49.7% (2378)
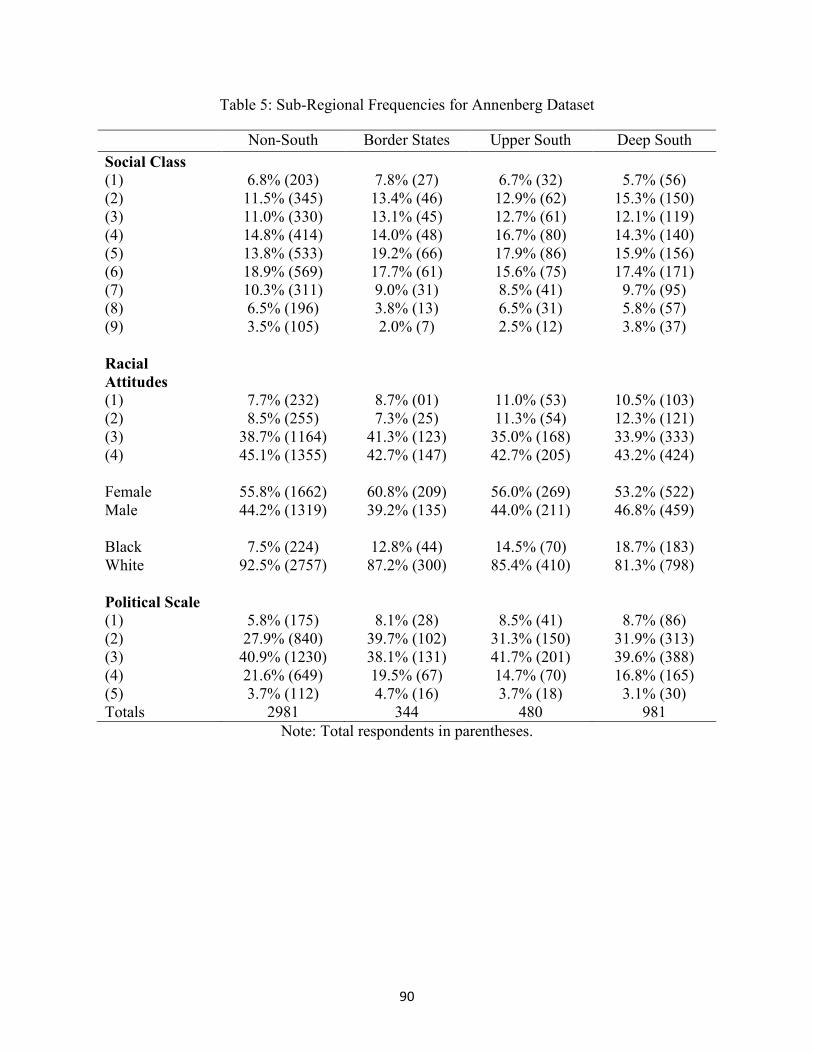
90
Table 5: Sub-Regional Frequencies for Annenberg Dataset
Non-South Border States Upper South Deep South
Social Class (1) 6.8% (203) 7.8% (27) 6.7% (32) 5.7% (56) (2) 11.5% (345) 13.4% (46) 12.9% (62) 15.3% (150) (3) 11.0% (330) 13.1% (45) 12.7% (61) 12.1% (119) (4) 14.8% (414) 14.0% (48) 16.7% (80) 14.3% (140) (5) 13.8% (533) 19.2% (66) 17.9% (86) 15.9% (156) (6) 18.9% (569) 17.7% (61) 15.6% (75) 17.4% (171) (7) 10.3% (311) 9.0% (31) 8.5% (41) 9.7% (95) (8) 6.5% (196) 3.8% (13) 6.5% (31) 5.8% (57) (9) 3.5% (105) 2.0% (7) 2.5% (12) 3.8% (37)
Racial
Attitudes
(1) 7.7% (232) 8.7% (01) 11.0% (53) 10.5% (103) (2) 8.5% (255) 7.3% (25) 11.3% (54) 12.3% (121) (3) 38.7% (1164) 41.3% (123) 35.0% (168) 33.9% (333) (4) 45.1% (1355) 42.7% (147) 42.7% (205) 43.2% (424) Female 55.8% (1662) 60.8% (209) 56.0% (269) 53.2% (522) Male 44.2% (1319) 39.2% (135) 44.0% (211) 46.8% (459) Black 7.5% (224) 12.8% (44) 14.5% (70) 18.7% (183) White 92.5% (2757) 87.2% (300) 85.4% (410) 81.3% (798)
Political Scale (1) 5.8% (175) 8.1% (28) 8.5% (41) 8.7% (86) (2) 27.9% (840) 39.7% (102) 31.3% (150) 31.9% (313) (3) 40.9% (1230) 38.1% (131) 41.7% (201) 39.6% (388) (4) 21.6% (649) 19.5% (67) 14.7% (70) 16.8% (165) (5) 3.7% (112) 4.7% (16) 3.7% (18) 3.1% (30) Totals 2981 344 480 981
Note: Total respondents in parentheses.
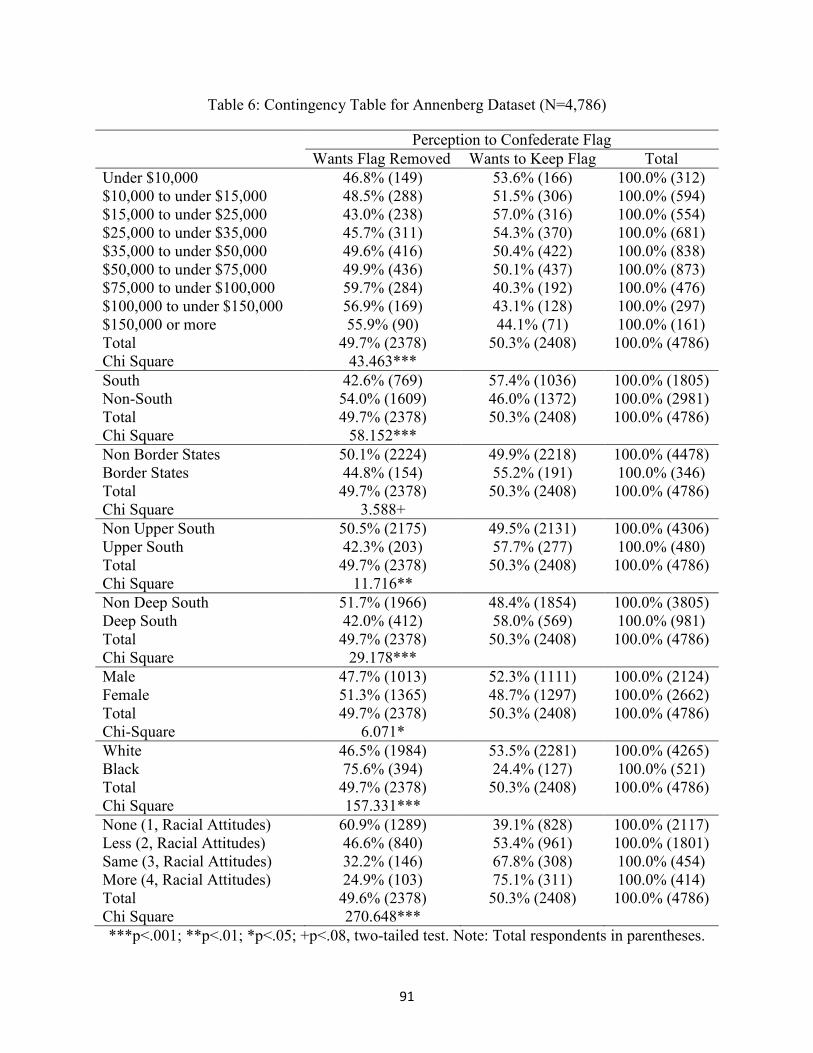
91
Table 6: Contingency Table for Annenberg Dataset (N=4,786)
Perception to Confederate Flag
Wants Flag Removed Wants to Keep Flag Total
Under $10,000 46.8% (149) 53.6% (166) 100.0% (312) $10,000 to under $15,000 48.5% (288) 51.5% (306) 100.0% (594) $15,000 to under $25,000 43.0% (238) 57.0% (316) 100.0% (554) $25,000 to under $35,000 45.7% (311) 54.3% (370) 100.0% (681) $35,000 to under $50,000 49.6% (416) 50.4% (422) 100.0% (838) $50,000 to under $75,000 49.9% (436) 50.1% (437) 100.0% (873) $75,000 to under $100,000 59.7% (284) 40.3% (192) 100.0% (476) $100,000 to under $150,000 56.9% (169) 43.1% (128) 100.0% (297) $150,000 or more 55.9% (90) 44.1% (71) 100.0% (161) Total 49.7% (2378) 50.3% (2408) 100.0% (4786) Chi Square 43.463***
South 42.6% (769) 57.4% (1036) 100.0% (1805) Non-South 54.0% (1609) 46.0% (1372) 100.0% (2981) Total 49.7% (2378) 50.3% (2408) 100.0% (4786) Chi Square 58.152***
Non Border States 50.1% (2224) 49.9% (2218) 100.0% (4478) Border States 44.8% (154) 55.2% (191) 100.0% (346) Total 49.7% (2378) 50.3% (2408) 100.0% (4786) Chi Square 3.588+
Non Upper South 50.5% (2175) 49.5% (2131) 100.0% (4306) Upper South 42.3% (203) 57.7% (277) 100.0% (480) Total 49.7% (2378) 50.3% (2408) 100.0% (4786) Chi Square 11.716**
Non Deep South 51.7% (1966) 48.4% (1854) 100.0% (3805) Deep South 42.0% (412) 58.0% (569) 100.0% (981) Total 49.7% (2378) 50.3% (2408) 100.0% (4786) Chi Square 29.178***
Male 47.7% (1013) 52.3% (1111) 100.0% (2124) Female 51.3% (1365) 48.7% (1297) 100.0% (2662) Total 49.7% (2378) 50.3% (2408) 100.0% (4786) Chi-Square 6.071*
White 46.5% (1984) 53.5% (2281) 100.0% (4265) Black 75.6% (394) 24.4% (127) 100.0% (521) Total 49.7% (2378) 50.3% (2408) 100.0% (4786) Chi Square 157.331***
None (1, Racial Attitudes) 60.9% (1289) 39.1% (828) 100.0% (2117) Less (2, Racial Attitudes) 46.6% (840) 53.4% (961) 100.0% (1801) Same (3, Racial Attitudes) 32.2% (146) 67.8% (308) 100.0% (454) More (4, Racial Attitudes) 24.9% (103) 75.1% (311) 100.0% (414) Total 49.6% (2378) 50.3% (2408) 100.0% (4786) Chi Square 270.648***
***p<.001; **p<.01; *p<.05; +p<.08, two-tailed test. Note: Total respondents in parentheses.
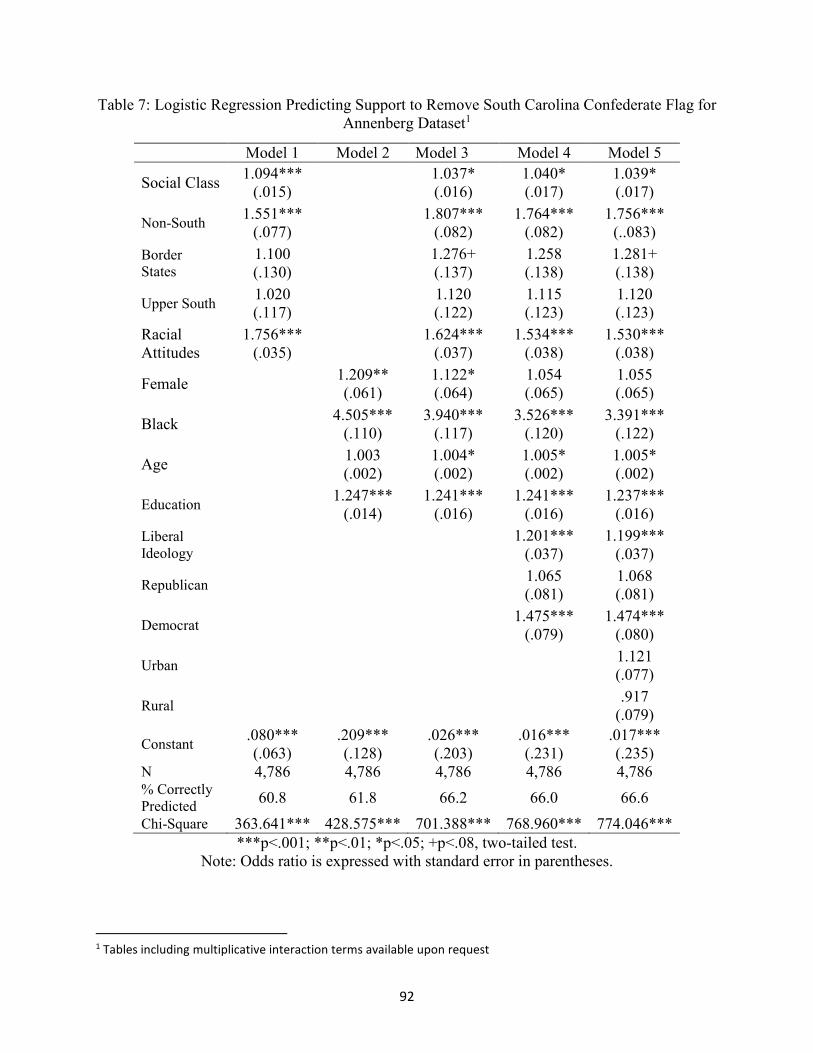
92
Table 7: Logistic Regression Predicting Support to Remove South Carolina Confederate Flag for Annenberg Dataset1
Model 1 Model 2 Model 3 Model 4 Model 5
Social Class 1.094***
(.015)
1.037* (.016)
1.040* (.017)
1.039* (.017)
Non-South 1.551***
(.077)
1.807*** (.082)
1.764*** (.082)
1.756*** (..083)
Border States
1.100 (.130)
1.276+ (.137)
1.258 (.138)
1.281+ (.138)
Upper South 1.020 (.117)
1.120 (.122)
1.115 (.123)
1.120 (.123)
Racial Attitudes
1.756*** (.035)
1.624***
(.037) 1.534***
(.038) 1.530***
(.038)
Female 1.209** (.061)
1.122* (.064)
1.054 (.065)
1.055 (.065)
Black 4.505***
(.110) 3.940***
(.117) 3.526***
(.120) 3.391***
(.122)
Age 1.003 (.002)
1.004* (.002)
1.005* (.002)
1.005* (.002)
Education 1.247***
(.014) 1.241***
(.016) 1.241***
(.016) 1.237***
(.016)
Liberal Ideology
1.201***
(.037) 1.199***
(.037)
Republican 1.065 (.081)
1.068 (.081)
Democrat 1.475***
(.079) 1.474***
(.080)
Urban 1.121 (.077)
Rural .917
(.079)
Constant .080*** (.063)
.209*** (.128)
.026*** (.203)
.016*** (.231)
.017*** (.235)
N 4,786 4,786 4,786 4,786 4,786 % Correctly Predicted
60.8 61.8 66.2 66.0 66.6
Chi-Square 363.641*** 428.575*** 701.388*** 768.960*** 774.046***
***p<.001; **p<.01; *p<.05; +p<.08, two-tailed test. Note: Odds ratio is expressed with standard error in parentheses.
1 Tables including multiplicative interaction terms available upon request

93
Table 8: Logistic Regression Predicting Support to Remove Confederate Flag by Sub-Region: Non-South2
Model 1 Model 2 Model 3 Model 4 Model 5
Social Class 1.087***
(.018)
1.024 (.020)
1.026 (.020)
1.031 (.020)
Racial Attitudes
1.629*** (.044)
1.567***
(.046) 1.490***
(.047) 1.484***
(.047)
Female 1.197* (.077)
1.117 (.079)
1.064 (.080)
1.066 (.080)
Black 3.231***
(.162) 2.419***
(.165) 2.099***
(.169) 1.895***
(.174)
Age 1.005* (.002)
1.006* (.002)
1.005* (.002)
1.006* (.002)
Education 1.243***
(.018) 1.241***
(.019) 1.243***
(.019) 1.240***
(.020)
Liberal Ideology
1.113* (.047)
1.112* (.047)
Republican .974
(.100) .978
(.100)
Democrat 1.448***
(.099) 1.447***
(.099)
Urban 1.296** (.096)
Rural 1.051 (.101)
Constant .164*** (.178)
.243*** (.159)
.055*** (.236)
.043*** (.270)
.039*** (.277)
N 2981 2981 2981 2981 2981
% Correctly Predicted
59.9 61.5 63.8 63.7 63.2
Chi-Square 145.973*** 205.766*** 306.695*** 339.230*** 346.683***
***p<.001; **p<.01; *p<.05; +p<.08, two-tailed test. Note: Odds ratio is expressed with standard error in parentheses.
2 Tables including multiplicative interaction terms available upon request 2

94
Table 9: Logistic Regression Predicting Support to Remove Confederate Flag by Sub-Region:
Border States
Model 1 Model 2 Model 3 Model 4 Model 5
Social Class 1.185** (.058)
1.143* (.066)
1.130+ (.067)
1.117 (.069)
Racial Attitudes
1.657*** (.136)
1.516** (.143)
1.500** (.144)
1.498** (.144)
Female 1.470
(.240) 1.507 (.247)
1.370 (.255)
1.373 (.257)
Black 4.026***
(.364) 3.528** (.383)
3.135** (.395)
2.961** (.406)
Age 1.007
(.007) 1.009 (.008)
1.012 (.008)
1.012 (.008)
Education 1.275***
(.054) 2.239***
(.058) 1.239***
(.059) 1.231***
(.059)
Liberal Ideology
1.344 (.137)
1.325* (.138)
Republican 1.177
(.315) 1.172 (.316)
Democrat 1.058
(.288) 1.071 (.289)
Urban 0.909
(.340)
Rural 0.750
(.274)
Constant .075*** (.568)
.121*** (.502)
.019*** (.781)
.008*** (.919)
.012*** (.951)
N 344 344 344 344 344
% Correctly Predicted
60.8 62.8 65.1 66.0 65.4
Chi-Square 20.860*** 36.610*** 48.573*** 53.492*** 54.605***
***p<.001; **p<.01; *p<.05; +p<.08, two-tailed test. Note: Odds ratio is expressed with standard error in parentheses.

95
Table 10: Logistic Regression Predicting Support to Remove Confederate Flag by Sub-Region:
Upper South
Model 1 Model 2 Model 3 Model 4 Model 5
Social Class 1.067 (.048)
1.014 (.058)
1.020 (.059)
1.016 (.059)
Racial Attitudes
2.059*** (.115)
1.863*** (.122)
1.684*** (.125)
1.675*** (.125)
Female 1.028
(.200) .999
(.209) .914
(.216) .921
(.216)
Black 7.182***
(.313) 4.716***
(.331) 4.457***
(.338) 4.482***
(.341)
Age .998
(.006) 1.001 (.007)
1.001 (.007)
1.001 (.007)
Education 1.224***
(.046) 1.237***
(.053) 1.234***
(.054) 1.233***
(.055)
Liberal Ideology
1.428** (.123)
1.420** (.123)
Republican 1.156
(.271) 1.144 (.271)
Democrat 1.795*
(.256) 1.797* (.256)
Urban .897
(.260)
Rural .818
(.250)
Constant .053*** (.462)
.217*** (.407)
.026*** (.635)
.011*** (.753)
.012*** (.769)
N 480 480 480 480 480
% Correctly Predicted
63.3 67.1 68.8 72.5 72.3
Chi-Square 49.651*** 58.342*** 88.218*** 106.758*** 107.410***
***p<.001; **p<.01; *p<.05; +p<.08, two-tailed test. Note: Odds ratio is expressed with standard error in parentheses.
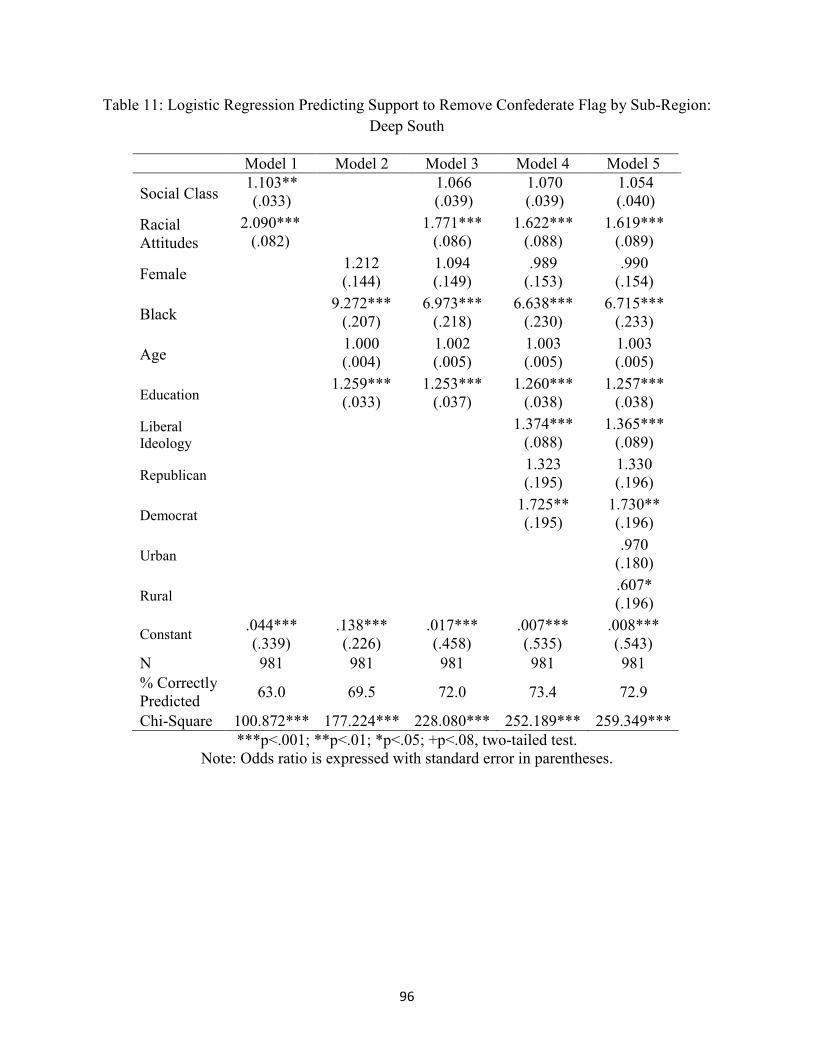
96
Table 11: Logistic Regression Predicting Support to Remove Confederate Flag by Sub-Region:
Deep South
Model 1 Model 2 Model 3 Model 4 Model 5
Social Class 1.103** (.033)
1.066 (.039)
1.070 (.039)
1.054 (.040)
Racial Attitudes
2.090*** (.082)
1.771*** (.086)
1.622*** (.088)
1.619*** (.089)
Female 1.212
(.144) 1.094 (.149)
.989 (.153)
.990 (.154)
Black 9.272***
(.207) 6.973***
(.218) 6.638***
(.230) 6.715***
(.233)
Age 1.000
(.004) 1.002 (.005)
1.003 (.005)
1.003 (.005)
Education 1.259***
(.033) 1.253***
(.037) 1.260***
(.038) 1.257***
(.038)
Liberal Ideology
1.374*** (.088)
1.365*** (.089)
Republican 1.323
(.195) 1.330 (.196)
Democrat 1.725**
(.195) 1.730** (.196)
Urban .970
(.180)
Rural .607*
(.196)
Constant .044*** (.339)
.138*** (.226)
.017*** (.458)
.007*** (.535)
.008*** (.543)
N 981 981 981 981 981
% Correctly Predicted
63.0 69.5 72.0 73.4 72.9
Chi-Square 100.872*** 177.224*** 228.080*** 252.189*** 259.349***
***p<.001; **p<.01; *p<.05; +p<.08, two-tailed test. Note: Odds ratio is expressed with standard error in parentheses.

97
Table 12: Logistic Regression Predicting Support to Remove South Carolina Confederate Flag by Racial Category
Black Respondents White Respondents
Social Class 1.165* (.069)
1.031+ (.017)
Non-South .512* (.286)
2.005*** (.089)
Border States
.586 (.420)
1.477** (.147)
Upper South 1.203 (.376)
1.184 (.135)
Racial Attitudes
1.815** (.191)
1.513*** (.039)
Female .644+ (.644)
1.097 (.068)
Age 1.006 (.007)
1.005* (.002)
Education 1.302***
(.070) 1.232***
(.016)
Liberal Ideology
1.048 (.109)
1.233*** (.040)
Republican .737
(.415) 1.082 (.083)
Democrat 2.745***
(.267) 1.364***
(.084)
Urban 1.238 (.267)
1.160+ (.082)
Rural .669
(.354) 0.913 (.082)
Constant .039** (.956)
.015*** (.247)
N 521 4,265
% Correctly Predicted
79.5 65.1
Chi-square 82.693*** 575.536***
***p<.001; **p<.01; *p<.05; +p<.08, two-tailed test. Note: Odds ratio is expressed with standard error in parentheses.
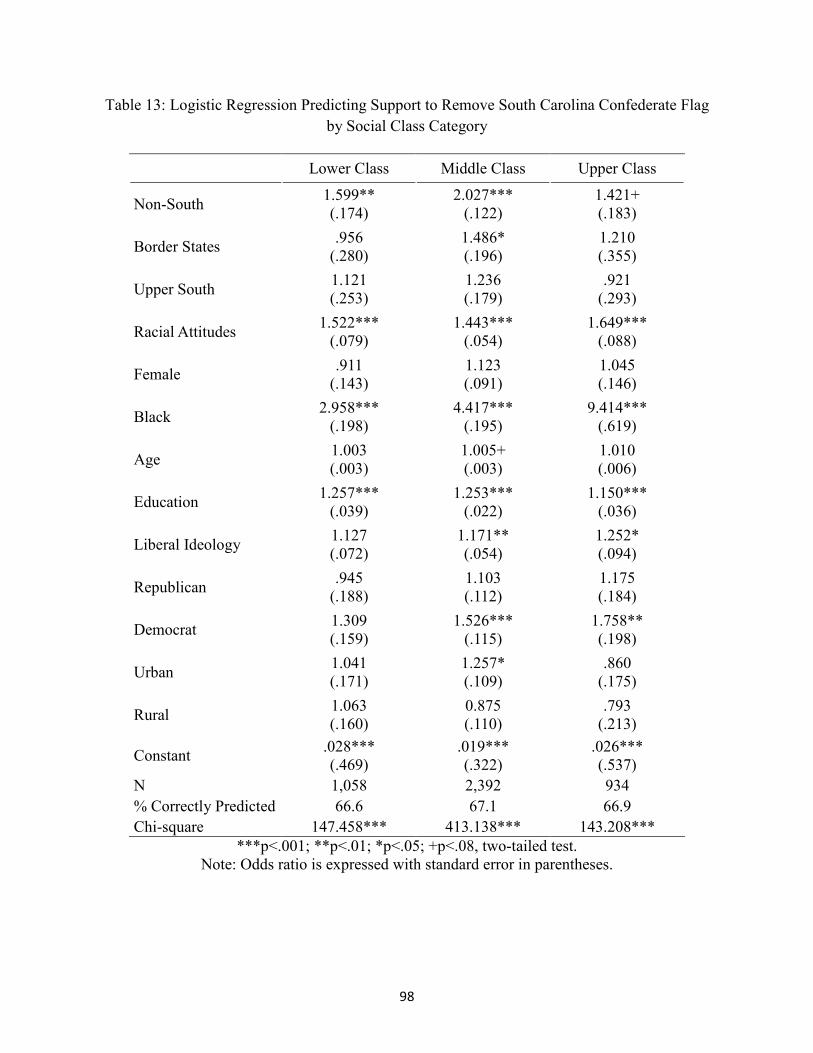
98
Table 13: Logistic Regression Predicting Support to Remove South Carolina Confederate Flag
by Social Class Category
Lower Class Middle Class Upper Class
Non-South 1.599** (.174)
2.027*** (.122)
1.421+ (.183)
Border States .956
(.280) 1.486* (.196)
1.210 (.355)
Upper South 1.121 (.253)
1.236 (.179)
.921 (.293)
Racial Attitudes 1.522***
(.079) 1.443***
(.054) 1.649***
(.088)
Female .911
(.143) 1.123 (.091)
1.045 (.146)
Black 2.958***
(.198) 4.417***
(.195) 9.414***
(.619)
Age 1.003 (.003)
1.005+ (.003)
1.010 (.006)
Education 1.257***
(.039) 1.253***
(.022) 1.150***
(.036)
Liberal Ideology 1.127 (.072)
1.171** (.054)
1.252* (.094)
Republican .945
(.188) 1.103 (.112)
1.175 (.184)
Democrat 1.309 (.159)
1.526*** (.115)
1.758** (.198)
Urban 1.041 (.171)
1.257* (.109)
.860 (.175)
Rural 1.063 (.160)
0.875 (.110)
.793 (.213)
Constant .028*** (.469)
.019*** (.322)
.026*** (.537)
N 1,058 2,392 934
% Correctly Predicted 66.6 67.1 66.9
Chi-square 147.458*** 413.138*** 143.208***
***p<.001; **p<.01; *p<.05; +p<.08, two-tailed test. Note: Odds ratio is expressed with standard error in parentheses.

99
Table 14: Descriptive Statistics for Pew Dataset (N=435)
Variables Percent (Number) Mean (SD)
Social Class 5.46 (2.35) (1) Less than $10,000 6.7% (29) (2) 10 to under $20,000 7.1% (31) (3) 20 to under $30,000 10.6% (46) (4) 30 to under $40,000 10.1% (44) (5) 40 to under $50,000 10.3% (45) (6) 50 to under $75,000 17.5% (76) (7) 75 to under $100,000 16.6% (72) (8) 100 to under $150,000 10.3% (45) (9) $150,000 or more 10.8% (47)
Sub-Region Non-South 56.8% (247) Border States 7.6% (33) Upper South 11.3% (49) Deep South 24.4% (106)
Southern Identity 26.2% (114) .26 (.44)
Female 52.9% (230) .53 (.50)
Black 18.2% (79) .182 (.39)
Age 51.55 (16.77)
Education Level 5.18 (1.60) (1) Up to 8th grade 1.4% (6) (2) Up to 11th grade 3.7% (16) (3) High school or GED 19.3% (84) (4) Technical school 1.6% (7) (5) Associate degree 24.4% (106) (6) Bachelor degree 24.8% (108) (7) Post graduate training 24.8% (108)
Liberal ideology 2.97 (.98) (1) Very Conservative 5.7% (25) (2) Conservative 26.0% (113) (3) Moderate 39.8% (173) (4) Liberal 22.3% (97) (5) Very Liberal 6.2% (27)
Political Party Republican Party 23.0% (100) Democratic Party 44.8% (195) Independent 32.2% (140)
Urban/Rural Urban 30.8% (134) Suburban 52.9% (230) Rural 16.3% (71)
Flag perception .81 (.39) Positive Reaction 18.6% (81) Negative Reaction 81.4% (354)

100
Table 15: Contingency Table for Pew Dataset (N=435)
Perception to Confederate Flag
Negative Reaction Positive Reaction Total
Less than $10,000 55.2% (16) 44.8% (13) 100.0% (29) 10 to under $20,000 67.7% (21) 32.3% (10) 100.0% (31) 20 to under $30,000 80.4% (37) 19.6% (9) 100.0% (46) 30 to under $40,000 68.2% (30) 31.8% (14) 100.0% (44) 40 to under $50,000 91.1% (41) 8.9% (4) 100.0% (45) 50 to under $75,000 77.6% (59) 22.4% (17) 100.0% (76) 75 to under $100,000 93.1% (67) 6.9% (5) 100.0% (72) 100 to under $150,000 86.7% (39) 13.3% (6) 100.0% (39) $150,000 or more 93.6% (44) 6.4% (3) 100.0% (44) Total 81.4% (354) 18.6% (81) 100.0% (435) Chi Square 37.503***
South 71.3% (134) 28.7% (54) 100.0% (188) Non-South 89.1% (220) 10.9% (27) 100.0% (247) Total 81.4% (354) 18.6% (81) 100.0% (435) Chi Square 22.301***
Non Border States 81.3% (327) 18.7% (75) 100.0% (402) Border States 81.8% (27) 18.2% (6) 100.0% (33) Total 81.4% (354) 18.6% (81) 100.0% (435) Chi Square .005
Non Upper South 83.4% (322) 16.6% (64) 100.0% (386) Upper South 65.3% (32) 34.7% (17) 100.0% (49) Total 81.4% (354) 18.6% (81) 100.0% (435) Chi Square 9.414**
Non Deep South 84.8% (279) 15.2% (50) 100.0% (329) Deep South 70.8% (75) 29.2% (31) 100.0% (106) Total 81.4% (354) 18.6% (81) 100.0% (435) Chi Square 10.440**
No Southern Identity 90.3% (290) 9.7% (31) 100.0% (321) Identifies as Southern 56.1% (64) 43.9% (50) 100.0% (114) Total 81.4% (354) 18.6% (81) 100.0% (435) Chi Square 64.941***
Male 84.4% (173) 15.6% (32) 100.0% (205) Female 78.7% (181) 21.3% (49) 100.0% (230) Total 81.4% (354) 18.6% (81) 100.0% (435) Chi Square 2.320
White 80.3% (286) 19.7% (70) 100.0% (356) Black 86.1% (68) 13.9% (11) 100.0% (79) Total 81.4% (354) 18.6% (81) 100.0% (435) Chi Square 1.405
***p<.001; **p<.01; *p<.05; +p<.08, two-tailed test. Note: Total respondents in parentheses.
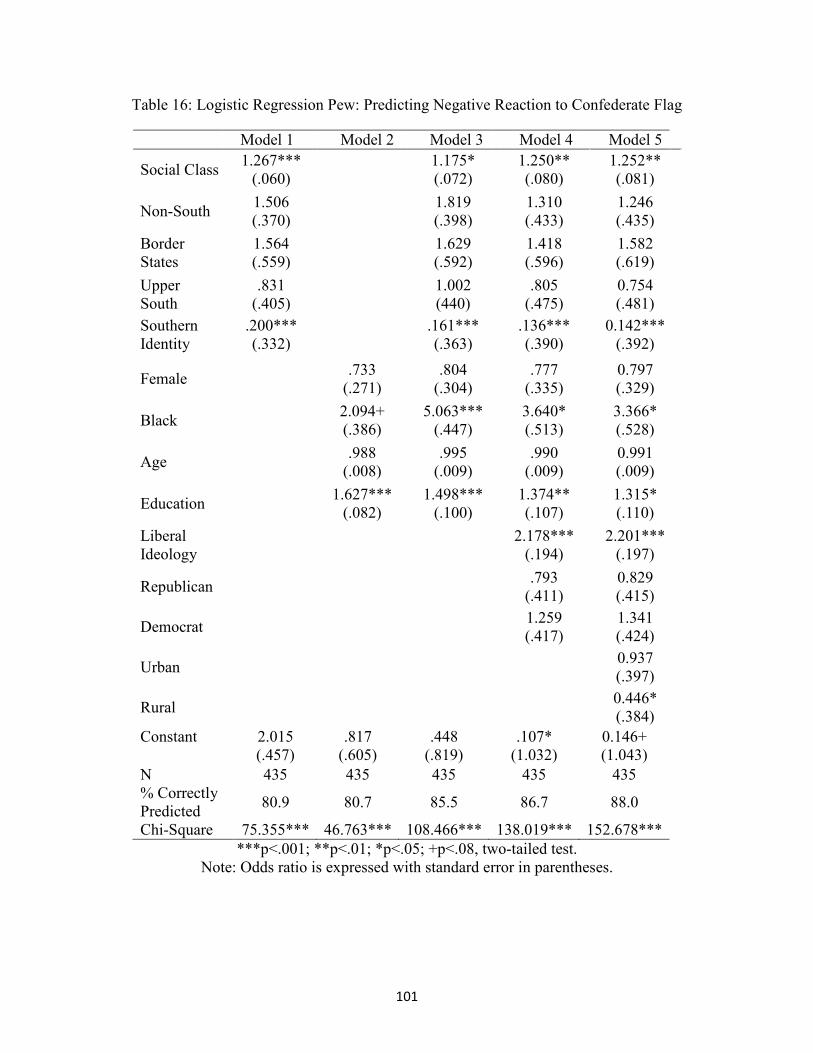
101
Table 16: Logistic Regression Pew: Predicting Negative Reaction to Confederate Flag
Model 1 Model 2 Model 3 Model 4 Model 5
Social Class 1.267***
(.060)
1.175* (.072)
1.250** (.080)
1.252** (.081)
Non-South 1.506 (.370)
1.819 (.398)
1.310 (.433)
1.246 (.435)
Border States
1.564 (.559)
1.629 (.592)
1.418 (.596)
1.582 (.619)
Upper South
.831 (.405)
1.002 (440)
.805 (.475)
0.754 (.481)
Southern Identity
.200*** (.332)
.161*** (.363)
.136*** (.390)
0.142*** (.392)
Female .733
(.271) .804
(.304) .777
(.335) 0.797 (.329)
Black 2.094+ (.386)
5.063*** (.447)
3.640* (.513)
3.366* (.528)
Age .988
(.008) .995
(.009) .990
(.009) 0.991 (.009)
Education 1.627***
(.082) 1.498***
(.100) 1.374** (.107)
1.315* (.110)
Liberal Ideology
2.178***
(.194) 2.201***
(.197)
Republican .793
(.411) 0.829 (.415)
Democrat 1.259 (.417)
1.341 (.424)
Urban 0.937 (.397)
Rural 0.446* (.384)
Constant 2.015 (.457)
.817 (.605)
.448 (.819)
.107* (1.032)
0.146+ (1.043)
N 435 435 435 435 435 % Correctly Predicted
80.9 80.7 85.5 86.7 88.0
Chi-Square 75.355*** 46.763*** 108.466*** 138.019*** 152.678***
***p<.001; **p<.01; *p<.05; +p<.08, two-tailed test. Note: Odds ratio is expressed with standard error in parentheses.

102
Appendices
Appendix A: IRB Approval Form

103
Appendix B: IRB Amendment Approval Form