attention and decision making - au...
TRANSCRIPT
ATTENTION AND DECISION-MAKING:SEPARATING TOP-DOWN FROM BOTTOM-UP
COMPONENTS
PhD dissertation
Martin Petri Bagger
Aarhus BSS, Aarhus UniversityDepartment of Economics and Business Economics
2016


"In God we trust. All others must bring data.”
- W. Edwards Deming


PREFACE
This dissertation was written in the period September 2012 to September 2016 and
it is the tangible outcome of my time as a PhD student at Aarhus University. During
this period I have been enrolled as a PhD student at the Department of Business
Administration and at the Department of Economics and Business Economics. I
am grateful to both departments for providing stimulating and positive research
environments and for generous financial support.
I would like to thank my supervisors Joachim Scholderer and Hans Jørn Juhl for
helping and guiding me in the pursuit of my goals. It has been a pleasure working
with both of you, and I hope to continue doing so in the years to come.
During my time as a PhD student I have met a lot of amazing, brilliant, and lovely
people and every single one of them deserves my gratitude. Some even deserve extra
thanks for being part of my journey. My fellow K.A.G.E. Consortium management
team (Anne, Morten and Lina) should receive huge thanks, not only for spamming
my mailbox with "very important" information, but mostly for just creating a fun and
relaxing atmosphere. It has been amazing sharing an office with Anne and Morten,
and I hope that we can continue to do so at this ever changing institution.
I would like to thank Dan and Josh for their work and help in the lab and for
ensuring high quality coffee. Thanks also for good talks on nerdy topics.
Special thanks go to Jacob Lund Orquin who has been a friend, great co-author
and mentor during my time as a PhD student. I have learned a lot from working
closely with you and I hope that we can continue cooperating on challenging and
exciting projects in the future.
I would like to thank Sarah and Kasper for being great friends with whom I can
talk about small and large things related to our both academic and our personal lives.
Meeting you has been a great added bonus of these four years. I also wish to thank
Jacob Rosendahl who has been part of my academic journey ever since we started
our bachelor studies in 2008. Thank you for being part of my and my family’s lives.
I am especially indebted to my family who have endured my ups and downs for
the past four years. I wish to thank my wife Marie for her endless support and for
always believing in me. I hope that I can repay you with just a fraction of what you
have given me. And last but not least I wish to thank my three boys Samuel, Vilhelm
and Hector for lightening up my life and showing me that life is great; no matter what
i

ii
problem one might have they fade away in your presence. I love you.
Martin Petri Bagger
Aarhus, September 2016

UPDATED PREFACE
The predefence took place on October 26, 2016. I would like to thank the members
of the assessment committee, Martin Meißner, Anderas Glöckner, and Julia Nafziger
(chair) for their very constructive and insightful comments. Some of the suggestions
have already been incorporated into the dissertation, and more will follow in the near
future.
Martin Petri Bagger
Aarhus, November 2016
iii

CONTENTS
Summary vii
Danish summary xi
1 Learning affects top-down and bottom-up modulation of eye movementsin decision-making 1
1.1 Introduction . . . . . . . . . . . . . . . . . . . . . . . . . . . . . . . . . 2
1.2 Method . . . . . . . . . . . . . . . . . . . . . . . . . . . . . . . . . . . . 9
1.3 Results . . . . . . . . . . . . . . . . . . . . . . . . . . . . . . . . . . . . . 12
1.4 Discussion . . . . . . . . . . . . . . . . . . . . . . . . . . . . . . . . . . 20
1.5 Implications and future research . . . . . . . . . . . . . . . . . . . . . 24
1.6 References . . . . . . . . . . . . . . . . . . . . . . . . . . . . . . . . . . 26
1.7 Appendix . . . . . . . . . . . . . . . . . . . . . . . . . . . . . . . . . . . 32
2 Efficiency gains in repeated binary choice: Adaptation to the task envi-ronment 35
2.1 Introduction . . . . . . . . . . . . . . . . . . . . . . . . . . . . . . . . . 36
2.2 Overview of experimental procedure . . . . . . . . . . . . . . . . . . . 43
2.3 Treatment 1 . . . . . . . . . . . . . . . . . . . . . . . . . . . . . . . . . . 49
2.4 Treatment 2 . . . . . . . . . . . . . . . . . . . . . . . . . . . . . . . . . . 55
2.5 Treatment 3 . . . . . . . . . . . . . . . . . . . . . . . . . . . . . . . . . . 57
2.6 Treatment 4 . . . . . . . . . . . . . . . . . . . . . . . . . . . . . . . . . . 60
2.7 Cross-treatment analysis . . . . . . . . . . . . . . . . . . . . . . . . . . 62
2.8 General discussion . . . . . . . . . . . . . . . . . . . . . . . . . . . . . 65
2.9 Conclusion . . . . . . . . . . . . . . . . . . . . . . . . . . . . . . . . . . 73
2.10 References . . . . . . . . . . . . . . . . . . . . . . . . . . . . . . . . . . 74
2.11 Appendix . . . . . . . . . . . . . . . . . . . . . . . . . . . . . . . . . . . 79
3 The Perceptual Pull in Decision Making 81
3.1 Introduction . . . . . . . . . . . . . . . . . . . . . . . . . . . . . . . . . 82
3.2 Method . . . . . . . . . . . . . . . . . . . . . . . . . . . . . . . . . . . . 83
3.3 Results . . . . . . . . . . . . . . . . . . . . . . . . . . . . . . . . . . . . . 86
v

vi CONTENTS
3.4 Discussion . . . . . . . . . . . . . . . . . . . . . . . . . . . . . . . . . . 88
3.5 References . . . . . . . . . . . . . . . . . . . . . . . . . . . . . . . . . . 92
3.6 Appendix . . . . . . . . . . . . . . . . . . . . . . . . . . . . . . . . . . . 94

SUMMARY
This thesis consists of three independent chapters, dealing with decision making and
visual attention. The three chapters each examine different aspects of the interaction
between the visual environment and goals in decision-making situations, and the
thesis contributes with insights into human decision making processes. All chap-
ters are based on experimental data which has been collected through controlled
experiments in computer labs. Data for the second and third chapters were collected
in the facilities of the Aarhus University Cognition and Behavior (COBE) Lab. Data
for the first chapter were collected prior to the establishment of the COBE Lab on
equipment at the Department of Business Administration (now the Department of
Management).
A large part of the analyses in the thesis are based on eye-tracking, which is a
process tracking method where the participants’ eye movements are recorded and
mapped. The method provides a variety of opportunities to examine how people col-
lect information and how external factors can affect this process (e.g. the information
gathered by the participants and the order in which the information was collected).
Eye-tracking is a powerful and excellent tool for studying decision-making because
the method imposes few restrictions on the participants compared to other process
tracking tools (e.g., "think aloud" and "information search displays"). Eye-tracking as
process a tracking tool has been strongly recommended (e.g. Bialkova & van Trijp,
2011; Glaholt & Reingold, 2011), and for an in-depth introduction to eye-tracking the
books by Holmqvist, Nyström, Andersson, Dewhurst, Jarodzka & van de Weijer (2011)
and Duchowski (2007) are highly recommendable.
The first chapter, Learning affects top down and bottom up modulation of eye
movements in decision making, explores the perceptual processes that drive temporal
dynamics in decision making. Under the framework of "top-down" and "bottom-up"
processes, we examine the information reduction hypothesis (Haider & Frensch,
1999). We conduct a repeated measures binary choice experiment under three dif-
ferent presentation formats. We operationalise top-down and bottom-up control as
the effect of individual usefulness and presentation formats, ability to capture the
participants’ visual attention. We examine the prediction that experience increases
the effect of top-down control of attention, which in turn leads to a reduction in
the effect of the bottom-up factors, ability to capture attention. The results show an
vii
viii SUMMARY
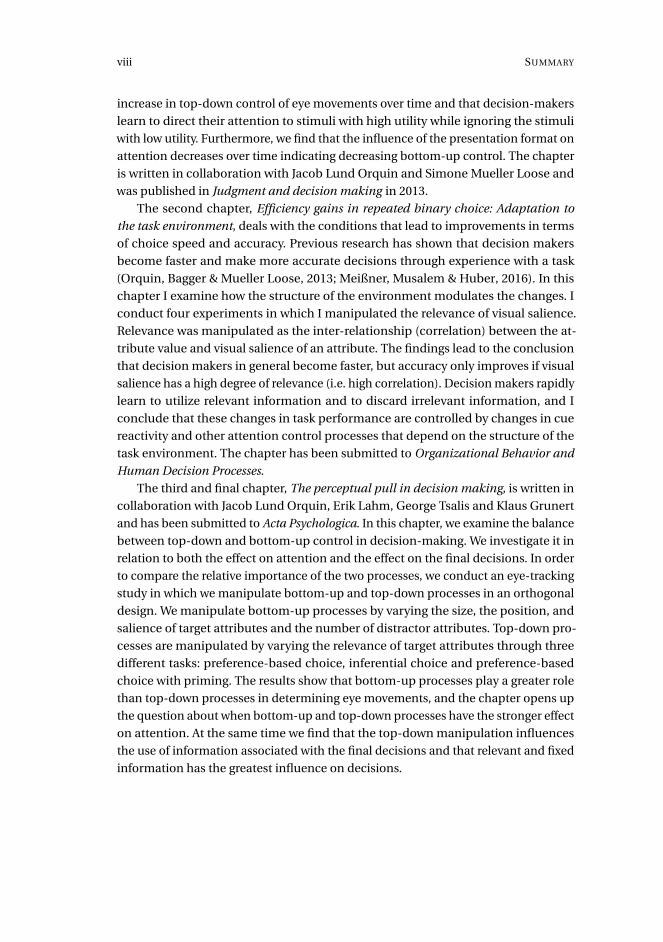
increase in top-down control of eye movements over time and that decision-makers
learn to direct their attention to stimuli with high utility while ignoring the stimuli
with low utility. Furthermore, we find that the influence of the presentation format on
attention decreases over time indicating decreasing bottom-up control. The chapter
is written in collaboration with Jacob Lund Orquin and Simone Mueller Loose and
was published in Judgment and decision making in 2013.
The second chapter, Efficiency gains in repeated binary choice: Adaptation to
the task environment, deals with the conditions that lead to improvements in terms
of choice speed and accuracy. Previous research has shown that decision makers
become faster and make more accurate decisions through experience with a task
(Orquin, Bagger & Mueller Loose, 2013; Meißner, Musalem & Huber, 2016). In this
chapter I examine how the structure of the environment modulates the changes. I
conduct four experiments in which I manipulated the relevance of visual salience.
Relevance was manipulated as the inter-relationship (correlation) between the at-
tribute value and visual salience of an attribute. The findings lead to the conclusion
that decision makers in general become faster, but accuracy only improves if visual
salience has a high degree of relevance (i.e. high correlation). Decision makers rapidly
learn to utilize relevant information and to discard irrelevant information, and I
conclude that these changes in task performance are controlled by changes in cue
reactivity and other attention control processes that depend on the structure of the
task environment. The chapter has been submitted to Organizational Behavior and
Human Decision Processes.
The third and final chapter, The perceptual pull in decision making, is written in
collaboration with Jacob Lund Orquin, Erik Lahm, George Tsalis and Klaus Grunert
and has been submitted to Acta Psychologica. In this chapter, we examine the balance
between top-down and bottom-up control in decision-making. We investigate it in
relation to both the effect on attention and the effect on the final decisions. In order
to compare the relative importance of the two processes, we conduct an eye-tracking
study in which we manipulate bottom-up and top-down processes in an orthogonal
design. We manipulate bottom-up processes by varying the size, the position, and
salience of target attributes and the number of distractor attributes. Top-down pro-
cesses are manipulated by varying the relevance of target attributes through three
different tasks: preference-based choice, inferential choice and preference-based
choice with priming. The results show that bottom-up processes play a greater role
than top-down processes in determining eye movements, and the chapter opens up
the question about when bottom-up and top-down processes have the stronger effect
on attention. At the same time we find that the top-down manipulation influences
the use of information associated with the final decisions and that relevant and fixed
information has the greatest influence on decisions.

ix
References
Bialkova, S. & van Trijp, H. C. M. (2011). An efficient methodology for assessing
attention to and effect of nutrition information displayed front-of-pack. Food
Quality and Preference, 22(6), 592–601.
Duchowski, A. (2007). Eye tracking methodology: Theory and practice, volume 373.
Springer Science & Business Media.
Glaholt, M. G. & Reingold, E. M. (2011). Eye Movement Monitoring as a Process Trac-
ing Methodology in Decision Making Research. Journal of Neuroscience, Psychology,
& Economics, 4(2), 125–146.
Haider, H. & Frensch, P. A. (1999). Eye movement during skill acquisition: More
evidence for the information-reduction hypothesis. Journal of Experimental Psy-
chology: Learning, Memory, and Cognition, 25(1), 172–190.
Holmqvist, K., Nyström, M., Andersson, R., Dewhurst, R., Jarodzka, H., & van de
Weijer, J. (2011). Eye Tracking : A Comprehensive Guide to Methods and Measures.
Oxford: Oxford University Press.
Meißner, M., Musalem, A., & Huber, J. (2016). Eye Tracking Reveals Processes That
Enable Conjoint Choices to Become Increasingly Efficient with Practice. Journal of
Marketing Research (JMR), 53(1), 1–17.
Orquin, J. L., Bagger, M. P., & Mueller Loose, S. (2013). Learning affects top down
and bottom up modulation of eye movements in decision making. Judgment and
Decision Making, 8(6), 700–716.


DANISH SUMMARY
Denne afhandling består af tre selvstændige kapitler, som alle beskæftiger sig med
beslutningsadfærd og visuel opmærksomhed. De tre kapitler undersøger hver især
forskellige aspekter af samspillet mellem det visuelle miljø og menneskers mål i
beslutningssituationer, og afhandlingen bidrager med ny indsigt i menneskelige be-
slutningsprocesser. Alle afhandlingens kapitler bygger på eksperimentelle data, som
er blevet indsamlet gennem kontrollerede eksperimenter i computer-laboratorier.
Data til andet og tredje kapitel blev indsamlet i faciliteterne i Aarhus Universitets
Cognition and Behaviour (COBE) Lab. Data til første kapitel blev indsamlet inden
etableringen af COBE Lab på udstyr udlånt af daværende Institut for Marketing og
Organisation (nu Institut for Virksomhedsledelse).
En stor del af afhandlingens analyser bygger på eye-tracking, som er en metode
proces-sporing, hvor deltageres øjenbevægelser optages og kortlægges. Metoden gi-
ver mange muligheder for at undersøge, hvordan mennesker indsamler information,
og hvordan eksterne faktorer kan have indvirkning på denne proces (eksempelvis
hvilke informationer deltagere har indsamlet, og i hvilken rækkefølge informatio-
nerne er blevet indsamlet). Eye-tracking er et kraftfuldt og fremragende redskab til
undersøgelse af beslutningsprocesser, da deltageren stort set ikke er begrænset af
metoden, hvilket er i modsætning til andre metoder (for eksempel "think aloud"og
"information search displays"). Eye-tracking som proces metode er blevet kraftigt
anbefalet (eksempelvis af Bialkova & van Trijp, 2011; Glaholt & Reingold, 2011), og
hvis en mere dybdegående indføring i eye-tracking ønskes, kan bøgerne af Holmqvist
et al. (2011) og Duchowski (2007) varmt anbefales.
Afhandlingens første kapitel, Learning affects top down and bottom up modu-
lation of eye movements in decision making, undersøger de perceptuelle processer,
som driver temporale dynamikker i beslutningstagning. Under rammerne af "top-
down"og "bottom-up"processer undersøger vi informationsreduktions-hypotesen
(the information reduction hypothesis) (Haider & Frensch, 1999). Vi gennemfører
et "repeated measures"eksperiment med binære beslutninger under tre forskellige
præsentationsformater. Vi operationaliserer top-down og bottom-up kontrol som
effekten af individuelle nytteværdi og præsentationsformaters evne til at fange delta-
gernes visuelle opmærksomhed. I kapitlet undersøger vi en hypotese om, at erfaring
med en opgave øger effekten af top-down kontrol på opmærksomhed, som igen fører
xi
xii DANISH SUMMARY
til en reduktion i effekten af bottom-up faktorenes evne til at fange opmærksomhed.
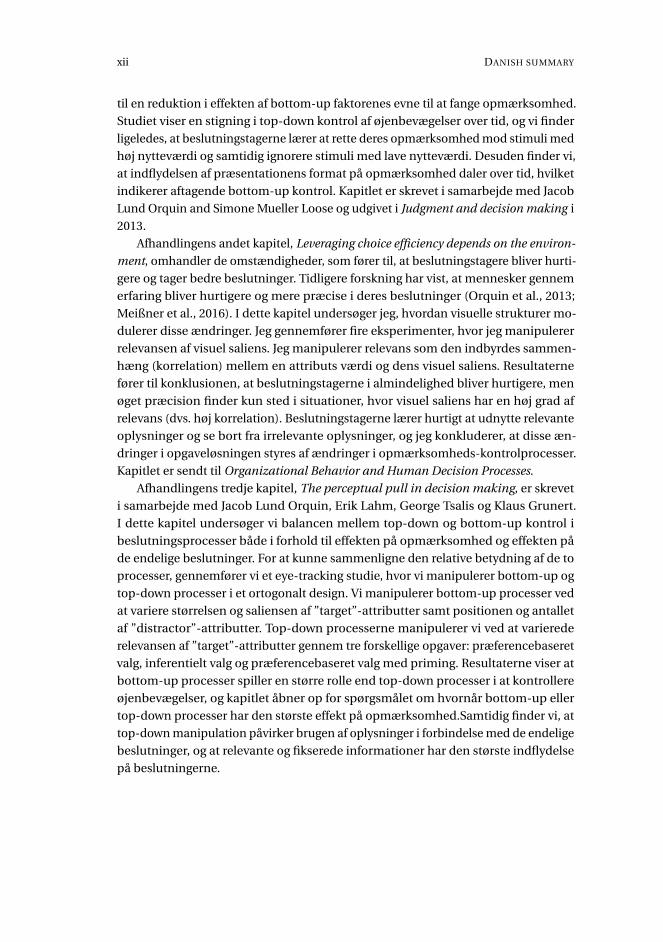
Studiet viser en stigning i top-down kontrol af øjenbevægelser over tid, og vi finder
ligeledes, at beslutningstagerne lærer at rette deres opmærksomhed mod stimuli med
høj nytteværdi og samtidig ignorere stimuli med lave nytteværdi. Desuden finder vi,
at indflydelsen af præsentationens format på opmærksomhed daler over tid, hvilket
indikerer aftagende bottom-up kontrol. Kapitlet er skrevet i samarbejde med Jacob
Lund Orquin and Simone Mueller Loose og udgivet i Judgment and decision making i
2013.
Afhandlingens andet kapitel, Leveraging choice efficiency depends on the environ-
ment, omhandler de omstændigheder, som fører til, at beslutningstagere bliver hurti-
gere og tager bedre beslutninger. Tidligere forskning har vist, at mennesker gennem
erfaring bliver hurtigere og mere præcise i deres beslutninger (Orquin et al., 2013;
Meißner et al., 2016). I dette kapitel undersøger jeg, hvordan visuelle strukturer mo-
dulerer disse ændringer. Jeg gennemfører fire eksperimenter, hvor jeg manipulerer
relevansen af visuel saliens. Jeg manipulerer relevans som den indbyrdes sammen-
hæng (korrelation) mellem en attributs værdi og dens visuel saliens. Resultaterne
fører til konklusionen, at beslutningstagerne i almindelighed bliver hurtigere, men
øget præcision finder kun sted i situationer, hvor visuel saliens har en høj grad af
relevans (dvs. høj korrelation). Beslutningstagerne lærer hurtigt at udnytte relevante
oplysninger og se bort fra irrelevante oplysninger, og jeg konkluderer, at disse æn-
dringer i opgaveløsningen styres af ændringer i opmærksomheds-kontrolprocesser.
Kapitlet er sendt til Organizational Behavior and Human Decision Processes.
Afhandlingens tredje kapitel, The perceptual pull in decision making, er skrevet
i samarbejde med Jacob Lund Orquin, Erik Lahm, George Tsalis og Klaus Grunert.
I dette kapitel undersøger vi balancen mellem top-down og bottom-up kontrol i
beslutningsprocesser både i forhold til effekten på opmærksomhed og effekten på
de endelige beslutninger. For at kunne sammenligne den relative betydning af de to
processer, gennemfører vi et eye-tracking studie, hvor vi manipulerer bottom-up og
top-down processer i et ortogonalt design. Vi manipulerer bottom-up processer ved
at variere størrelsen og saliensen af ”target”-attributter samt positionen og antallet
af ”distractor”-attributter. Top-down processerne manipulerer vi ved at varierede
relevansen af ”target”-attributter gennem tre forskellige opgaver: præferencebaseret
valg, inferentielt valg og præferencebaseret valg med priming. Resultaterne viser at
bottom-up processer spiller en større rolle end top-down processer i at kontrollere
øjenbevægelser, og kapitlet åbner op for spørgsmålet om hvornår bottom-up eller
top-down processer har den største effekt på opmærksomhed.Samtidig finder vi, at
top-down manipulation påvirker brugen af oplysninger i forbindelse med de endelige
beslutninger, og at relevante og fikserede informationer har den største indflydelse
på beslutningerne.
xiii
Litteratur
Bialkova, S. & van Trijp, H. C. M. (2011). An efficient methodology for assessing
attention to and effect of nutrition information displayed front-of-pack. Food
Quality and Preference, 22(6), 592–601.
Duchowski, A. (2007). Eye tracking methodology: Theory and practice, volume 373.
Springer Science & Business Media.
Glaholt, M. G. & Reingold, E. M. (2011). Eye Movement Monitoring as a Process
Tracing Methodology in Decision Making Research. Journal of Neuroscience, Psy-
chology, & Economics, 4(2), 125–146.
Haider, H. & Frensch, P. A. (1999). Eye movement during skill acquisition: More eviden-
ce for the information-reduction hypothesis. Journal of Experimental Psychology:
Learning, Memory, and Cognition, 25(1), 172–190.
Holmqvist, K., Nyström, M., Andersson, R., Dewhurst, R., Jarodzka, H., & van de
Weijer, J. (2011). Eye Tracking : A Comprehensive Guide to Methods and Measures.
Oxford: Oxford University Press.
Meißner, M., Musalem, A., & Huber, J. (2016). Eye Tracking Reveals Processes That
Enable Conjoint Choices to Become Increasingly Efficient with Practice. Journal of
Marketing Research (JMR), 53(1), 1–17.
Orquin, J. L., Bagger, M. P., & Mueller Loose, S. (2013). Learning affects top down
and bottom up modulation of eye movements in decision making. Judgment and
Decision Making, 8(6), 700–716.


CH
AP
TE
R
1LEARNING AFFECTS TOP-DOWN AND BOTTOM-UP
MODULATION OF EYE MOVEMENTS IN
DECISION-MAKING1
PUBLISHED IN JUDGMENT AND DECISION-MAKING, VOL. 8, NO. 6 (2013), 700-716
Jacob Lund Orquin
Aarhus University
Martin Petri Bagger
Aarhus University
Simone Mueller Loose
Aarhus University and University of South Australia
Abstract
Repeated decision-making is subject to changes over time such as decreases
in decision time and information use and increases in decision accuracy. We show
that a traditional strategy selection view of decision-making cannot account for
these temporal dynamics without relaxing main assumptions about what defines
a decision strategy. As an alternative view we suggest that temporal dynamics
in decision-making are driven by attentional and perceptual processes and that
this view has been expressed in the information reduction hypothesis. We test
the information reduction hypothesis by integrating it in a broader framework
of top-down and bottom-up processes and derive the predictions that repeated
1Acknowledgments: We thank Jana Jarecki for her helpful comments to the introduction.
1
2 CHAPTER 1. LEARNING AFFECTS EYE MOVEMENTS IN DECISION-MAKING
decisions increase top-down control of attention capture which in turn leads to a
reduction in bottom-up attention capture. To test our hypotheses we conducted
a repeated measures discrete choice experiment with three different information
presentation formats. We thereby operationalized top-down and bottom-up
control as the effect of individual utility levels and presentation formats on
attention capture on a trial-by-trial basis. The experiment revealed an increase in
top-down control of eye movements over time and that decision-makers learn to
attend to high utility stimuli and ignore low utility stimuli. We furthermore find
that the influence of presentation format on attention capture reduces over time
indicating diminishing bottom-up control.
1.1 Introduction
Human decision behavior is consistently inconsistent in its tendency to change
over time and over repeated decisions, yet these changes are mostly seen as a nui-
sance factor or even treated as a theoretical anomaly. In economics the static view of
decision-making is reflected in the assumption about stability of preferences (McFad-
den, 2001) while in psychology a similar assumption is often made about the stability
of decision strategies over time (Riedl, Brandstätter, & Roithmayr, 2008). While both
assumptions have been challenged on different occasions (Kahneman, 2003; Svenson,
1979) many studies implement them implicitly by aggregating choice and process
data over time. In this paper we propose that not only are temporal dynamics in
decision-making much more than a nuisance factor, in fact they are informative to
decision research out of two reasons. First of all, temporal dynamics in decision-
making pose a theoretical challenge to strategy selection models of decision-making
which in itself makes it a topic worthy of study and second, understanding temporal
dynamics calls for a previously neglected perspectives on decision-making. We re-
cently argued that decision research to a large extent has ignored attention processes
and that a better integration of visual cognition into decision research could help
account for a large number of observations (Orquin & Mueller Loose, 2013). Here we
expand our argument by examining temporal dynamics in decision-making, more
particularly how decision-making changes over the course of repeated decisions. We
explore two competing explanations of temporal dynamics in decision-making one
derived from strategy selection theory and one derived from vision research.
Can strategy selection account for temporal dynamics?
Among the many findings on temporal dynamics three have emerged as particularly
robust: Over time decision-makers become faster in making decisions (Meißner &
Decker, 2010; Mueller Loose & Orquin, 2012), use less information in making their
decisions (Payne, Bettman, & Johnson, 1988), and at the same time increase the
accuracy of their decisions (Carlsson, Mørkbak, & Olsen, 2011; Hess, Hensher, &
Daly, 2012; Payne, et al., 1988). The simultaneous reduction in decision time and
1.1. INTRODUCTION 3
information use with an increase in decision accuracy seems counter-intuitive at first,
but can only mean that decision-makers become better or more efficient at making
decisions over time. According to a strategy selection view of decision-making, which
in general terms posits that decision-makers first select a decision strategy and then
implement it in a given decisions task (Glöckner & Betsch, 2008), the increased effi-
ciency could result either from a more efficient application of one particular decision
strategy or from selecting a decision strategy that is more efficient in the given deci-
sion environment. If decision-makers become more efficient in applying a decision
strategy we would expect a decrease in decision time and perhaps also a reduction
in the amount of information that is re-fixated. One could, for instance, imagine
that decision-makers become faster in reading and remembering information which
would lead to shorter fixation durations and fewer re-fixations. On the other hand,
we would not expect any changes as to what or how the information is searched since
the decision strategy itself specifies what information is needed and in what order it
should be acquired (Costa-Gomes, Crawford, & Broseta, 2001). However, this account
of decision efficiency is in conflict with studies showing that decision-makers often
change their search pattern over the course of repeated decisions (Meißner & Decker,
2010; Patalano, Juhasz, & Dicke, 2010). Even though decision-makers may become
more efficient over time in applying one particular decision strategy, this merely
accounts for some of the observations on temporal dynamics. The change in search
pattern could, on the other hand, indicate that decision-makers are likely to change
their decision strategy over time.
If decision-makers learn over repeated decisions to select strategies that are more
efficient to the decision environment we would expect a reduction in decision time,
an increase in decision accuracy, and a change in the information search pattern
because each decision strategy predicts qualitatively different search patterns (Riedl,
et al., 2008). Although this view seems promising as it could potentially explain the
general observations from studies using repeated decision trials there is one major
problem: There is most likely no order for which decision-makers could select their
decision strategies so that they over time would decrease in information use, decision
time and increase in accuracy. In Figure 1 we compare a typical pattern of observed
decision time and accuracy (compare this to Appendix 2) with the predicted deci-
sion time and accuracy of nine different decision strategies. The predicted decision
times and accuracies are borrowed from Payne and colleagues (Payne et al., 1988,
Table 1 column 4) who simulated the performance of nine decision strategies under
different environments. The simulation reports the number of operations which we
use as a proxy for decision time following (Johnson & Payne, 1985). The decision
time and accuracy measures are fitted to the same scale for the sake of comparison.
The figure illustrates that there is no ordering of decision strategies that can produce
or approximate the observed pattern. The predicted decision times and accuracies
are positively correlated across decision strategies while the observed pattern indi-

4 CHAPTER 1. LEARNING AFFECTS EYE MOVEMENTS IN DECISION-MAKING
Figure 1.1. A: Typical pattern of observed decision time and accuracy in a repeated choicetask. B: Ordering of decision strategies in accordance with their predicted decision times andaccuracies (Payne et al., 1988). The y-axis represents normalized values for both decisiontime and accuracy. WADD = weighted additive, EQW = equal weight, EBA = Elimination byaspects, MCD = majority of confirming dimensions, SAT = satisficing, LEX = lexicographic,LEXSEMI = lexicographic semi-order, EBA+WADD elimination-by-aspects plus weightedadditive, EBA+MCD = elimination-by-aspects plus majority of confirming dimensions.
0.4
0.6
0.8
1.0
Firs
t trial
Last
trial
A
●
●
●
●●
●
●
●
●
●
●
●
●●
●
●
●
●
●
●
●
●● ●
●
●
●
●
●
●
●● ● ●
●
●
Accuacy
Decision time
0.4
0.6
0.8
1.0
WADDMCD
EBA+WADD
EBA+MCDEBA
LEXSEMIEQW LEX
SAT
B
cates a negative correlation. Although the comparison is neither a mathematical nor
empirical proof, it does point us to a theoretical challenge to the strategy selection
view of decision-making: It is impossible to account for the development of decision
time and accuracy in repeated decisions by switching between decision strategies. To
account for temporal dynamics through strategy selection one could, for instance,
relax the assumptions about what defines a decision strategy or about how deci-
sion strategies are mapped to process measures such as information acquisition,
decision time and choice accuracy (see the discussion). In the following section we
pursue an alternative view of temporal dynamics which accounts for the behavioral
observations mainly through attentional and perceptual processes.
Temporal dynamics and perceptual efficiency
In the previous section we examined whether the strategy selection paradigm could
account for temporal dynamics in decision-making such as the development in
decision time, information search patterns, and decision accuracy. The compari-
son between observed and predicted decision time and accuracy suggested that
the strategy selection paradigm cannot account for temporal dynamics in decision-
making except by relaxing the assumptions about what defines a decision strategy
or by introducing new strategies. As an alternative account, we propose that at least
part of the development in decision time, information search, and decision accu-
racy could be driven by increased efficiency in attentional and perceptual processes.
1.1. INTRODUCTION 5
Such a view has previously been expressed in the information reduction hypothesis
(Haider & Frensch, 1999) which accounts for expertise across different domains as
a consequence of perceptual efficiency. The theory posits that experts compared
to beginners are more efficient because they have learned to fixate task relevant
information and ignore task redundant information — hence the term "information
reduction". Information reduction effects has been demonstrated in various domains,
and a recent meta-analysis on the effect of expertise on attention to visualizations
(Gegenfurtner, Lehtinen, & Säljö, 2011) concludes that experts have more fixations
to task-relevant areas and fewer fixations to task-irrelevant areas. Information re-
duction has also been demonstrated in repeated-measures experiments showing
that practice increases fixation likelihood and fixation duration to important stimuli,
and reduces fixation likelihood and duration for irrelevant stimuli (Droll, Gigone,
& Hayhoe, 2007; Hegarty, Canham, & Fabrikant, 2010; Jovancevic-Misic & Hayhoe,
2009; Lee & Anderson, 2001). In decision-making similar observations have emerged,
indicating that decision-makers become more likely to fixate high utility attributes
over the course of repeated decision trials (Meißner & Decker, 2010; Mueller Loose
& Orquin, 2012). decision-makers also reduce the overall number of fixations per
trial over the course of repeated-measures experiments (Fiedler & Glöckner, 2012;
Knoepfle, Tao-yi Wang, & Camerer, 2009; Toubia, de Jong, Stieger, & Füller, 2012).
Although none of these studies address information reduction directly, the increased
attention to high utility information and the overall reduction in information search
indicates that information reduction is likely to happen in repeated decision-making.
If decision-makers reduce information in a manner predicted by the information
reduction hypothesis this could potentially explain the development in decision time,
information search, and accuracy. Whereas the strategy selection theory shows a
positive correlation between decision time, information search, and accuracy across
decision strategies the information reduction hypothesis posits a negative correlation,
i.e. the more accurate you are the less information you look at, and the faster you are.
However, even if it is the case that decision-makers reduce information as sug-
gested above there is still one problem; the information reduction hypothesis does
not account for the underlying cognitive mechanism that leads to information re-
duction. Accounting for temporal dynamics by information reduction is therefore
no different than giving the problem a new name. To avoid this logical loop the fol-
lowing section attempts to integrate information reduction in a broader theoretical
framework and derive hypotheses concerning the development of visual attention in
repeated decision tasks.
Top-down and bottom-up control of attention
An alternative way of viewing information reduction/perceptual efficiency is to see
it as a consequence of top-down and bottom-up processes, i.e. goal and stimulus
driven processes (Corbetta & Shulman, 2002; Theeuwes, 2010). According to this
6 CHAPTER 1. LEARNING AFFECTS EYE MOVEMENTS IN DECISION-MAKING
terminology, the findings above strongly suggest that practice, whether in the form
of years of expertise in a particular field or as practice in repeated measures exper-
iments, increases top-down control of attention. The claim follows logically from
the propositions that top-down control is defined as attention to task relevant stim-
uli, and that practice in repeated measures experiments increases attention to task
relevant stimuli. However, the process through which practice increases top-down
modulation is by no means clear.
One possible explanation is that increasing top-down control is a consequence
of perceptual learning, i.e. an improved ability to identify and discriminate between
sensory inputs. It has, for instance, been demonstrated that playing certain video
games can improve spatial resolution (Green & Bavelier, 2007) and target detection
(Green & Bavelier, 2006) so that experienced video game players become better at
identifying objects in visually cluttered environments. This may lead to enhanced
top-down control of eye movements (West, Al-Aidroos, & Pratt, 2013), and reduced
bottom-up attention capture by distractors (Chisholm, Hickey, Theeuwes, & King-
stone, 2010). Perceptual learning could therefore explain perceptual efficiency in
situations where the target stimulus is difficult to identify or categorize, such as in
comprehending visualizations (e.g. Gegenfurtner, et al., 2011) or when performing
tasks under time pressure, such as in reaction time experiments (e.g. Chisholm, et
al., 2010; West, et al., 2013). However, in the walking experiment by Jovancevic-Misic
and Hayhoe (2009) and in the choice experiment by Meißner and Decker (2010), the
stimuli were easy to discriminate and categorize, and the participants were not under
time pressure, which questions the role of perceptual learning.
Another perspective on increasing top-down control would be the reward-based
model of gaze allocation advocated by Hayhoe and colleagues (Hayhoe & Rothkopf,
2011; Tatler, Hayhoe, Land, & Ballard, 2011). According to their theory, gaze allocation
is crucially dependent on reward systems so that eye movements are guided by the
reward value of gazing at a particular stimulus. Reward value is understood here both
as primary reinforcers such as foods and as secondary reinforcers such as money or
system feedback. It has, for instance, been demonstrated that monkeys are willing to
trade-off food rewards for visual information about members of their social group
(Deaner, Khera, & Platt, 2005), and studies on humans indicate similar trade-off
patterns (Dai, Brendl, & Ariely, 2010). Trommershäuser and colleagues have also
pointed to the fact that most brain areas dedicated to the control of eye movements
are sensitive to rewards, and that neural computations during visual search in humans
and primates are similar to those activated when eye movements are extrinsically
rewarded (Trommershäuser, Glimcher, & Gegenfurtner, 2009). According to this
view, top-down control develops in a feedback loop between the agent and the
environment. Certain gaze behaviors are selected because they lead to rewarding
outcomes such as avoiding collisions with other pedestrians or completing a decision
task successfully.
1.1. INTRODUCTION 7
The question is, of course, what type of feedback decision-makers can rely on in a
repeated decision task in which no explicit feedback is given? One possibility is that
decision-makers monitor their own decision process in terms of how effortful the
decision is and how confident they feel about it (Anzai & Simon, 1979; Payne, et al.,
1988). Such process feedback could potentially serve to guide learning of top-down
control both within and across decision trials. Given that decision-makers generate
some form of process feedback we therefore hypothesize the following, in accordance
with the reward-based model of gaze allocation (Hayhoe & Rothkopf, 2011; Tatler, et
al., 2011), and the information-reduction hypothesis (Haider & Frensch, 1999):
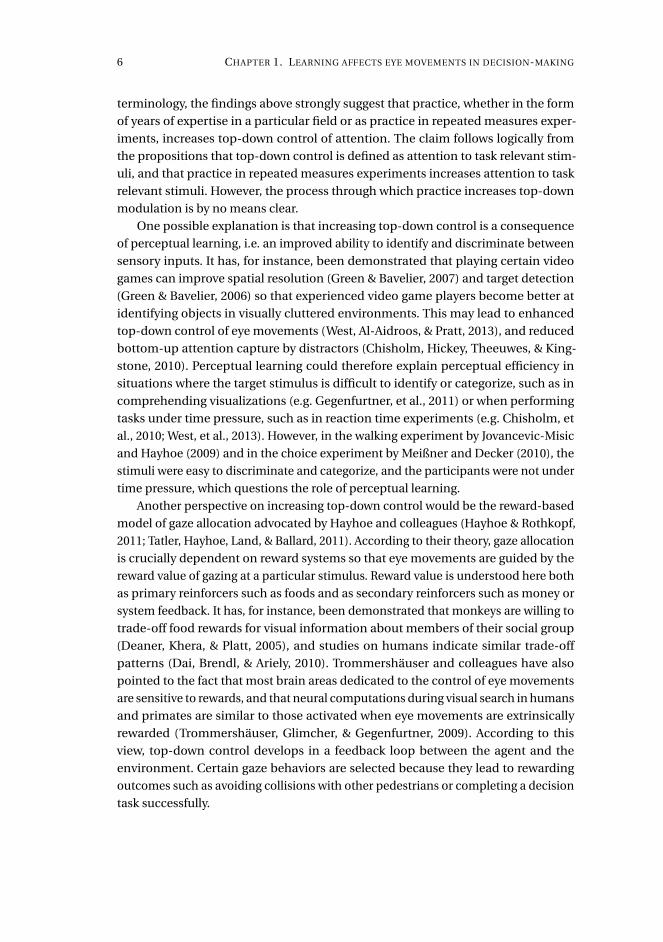
H1: Learning during repeated decision trials increases top-down modulation of
attention leading to higher fixation likelihood for important attributes and
lower fixation likelihood for unimportant attributes.
The hypothesis poses another important question: What is the role of bottom-up
modulation during the development of top-down modulation? In line with the biased
competition theory of selective attention (Desimone & Duncan, 1995) we suggest
that, in a situation with weak top-down modulation, the competition between stimuli
will be based on bottom-up processes. A similar view is proposed by Theeuwes
(2010), who argues that selective attention is initially completely driven by bottom-
up processes and only later (a few hundred milliseconds after stimulus onset) by
top-down processes. Both theories suggest that in the absence of top-down control
we should expect a stronger influence of bottom-up control. If H1 is correct and
top-down control increases over repeated decisions we would expect that bottom-up
control has a relatively larger influence in the beginning of the experiment when
top-down control is still relatively weak.
However, the important question is what will happen later in the learning process
when top-down modulation becomes relatively stronger? One possibility is that
increasing top-down modulation will diminish bottom-up control. It has, for instance,
been shown that top-down factors, such as semantic or contextual cues about a
visual scene, feature based attention, object representations, task demands, and
rewards for task performance, all override the effect of visual saliency (Kowler, 2011).
Alternatively, it has been suggested that changes in the balance between the two
processes over time will favor the process that makes more efficient use of cognitive
resources (Nyamsuren & Taatgen, 2013; Salvucci & Taatgen, 2008). According to
this view, both top-down and bottom-up modulation could in fact increase over
time if both processes contributed to higher perceptual efficiency. Such interaction
effects between top-down and bottom-up processes have been demonstrated on
attention capture (Nyamsuren & Taatgen, 2013) and encoding to short term memory
(Nordfang, Dyrholm, & Bundesen, 2013). Although interactions between top-down
and bottom-up control are theoretically possible in laboratory experiments, studies
8 CHAPTER 1. LEARNING AFFECTS EYE MOVEMENTS IN DECISION-MAKING
on naturalistic tasks often show a limited role of bottom-up and interaction processes
in gaze allocation.
According to our previous proposition, strong top-down modulation should re-
duce bottom-up modulation except in the special case in which an interaction be-
tween the two processes leads to higher perceptual efficiency (Nyamsuren & Taatgen,
2013). Given that there is no interaction or that the interaction between top-down
and bottom-up processes remains constant, we therefore hypothesize the following:
H2: bottom-up modulation of attention is stronger in the beginning of the exper-
iment and diminishes over time as a consequence of increasing top-down
modulation.
Experimental approach
In order to examine Hypotheses 1 and 2, we decided for an experimental approach
combining measured within-subjects and manipulated between-subjects indepen-
dent variables. top-down factors were operationalized as individual level attribute
importance, while bottom-up factors were operationalized through information pre-
sentation formats. Combining measured and manipulated independent variables
has the main advantage that it disentangles top-down and bottom-up modulation.
Earlier studies have shown that important attributes gain higher fixation likelihood
over time (Meißner & Decker, 2010), but it is in principle impossible to rule out that
the effect could have been caused by bottom-up factors or interactions between
top-down and bottom-up factors, i.e. the important attributes could have been more
salient than the less important attributes.
The importance of attributes can also be directly manipulated through task in-
structions, which, for instance, increases the utility of the attribute in one situation
but lowers it in another (Bialkova & van Trijp, 2011; van Herpen & Trijp, 2011; Viss-
chers, Hess, & Siegrist, 2010), however, a more subtle approach is to derive it from
individual level estimates of part-worth utilities. By taking a measurement approach
to attribute importance it should be possible to show that participants who assign a
higher level of importance to an attribute will increase their fixation likelihood for
that attribute, compared with participants who assign a lower importance.
Regarding bottom-up factors, one common approach in decision research has
been to manipulate the format in which the information is presented using, for
instance, verbal matrices or more naturalistic product representations (Huang & Kuo,
2011; Smead, Wilcox, & Wilkes, 1981; Söllner, Bröder, & Hilbig, 2013; Van Raaij, 1977).
Although this method involves less control over individual bottom-up factors, such
as saliency, size and position of information elements, one can think of all these
factors as captured across presentation formats. In this experiment, the product
representation format varies in, for instance, the saliency and size of attributes relative
to a verbal or visual matrix presentation. Using this approach, the strength of bottom-

1.2. METHOD 9
up modulation on gaze allocation is observable as the difference in fixation likelihood
between the presentation formats as well as in the effect size of the presentation
format model terms. If an increasing top-down modulation competes with bottom-
up modulation, we therefore expect that differences in fixation likelihood across
presentation formats diminish over the course of repeated decisions.
In line with H1, we expect that learning over the course of the experiment will
increase top-down modulation, leading to a larger effect size of attribute importance
over time and to increasing fixation likelihood when attributes are high, rather than
low, in importance. We also expect, in line with H2, that increasing top-down mod-
ulation will diminish the effect of bottom-up modulation, leading to diminishing
differences in fixation likelihood between the presentation formats and a smaller
effect size of presentation format over time.
1.2 Method
Participants
Sixty eight participants were recruited on campus, thereof 62 percent male. The
average age was 25.6 years. To qualify, participants had to be of normal sight and had
to buy and eat fruit yoghurt at least once a month.
Experimental design
We conducted a discrete choice experiment in which participants made choices
between four alternative fruit yoghurts and a no-choice alternative. Each participant
saw 48 choice sets in which six product attributes varied on four levels according
to a D-optimal design, which maximizes the differences in attribute levels between
choice alternatives (Street & Burgess, 2007). Accordingly, all four choice alternatives
in a set differed in those attributes with four levels (brand, flavor, fat percentage, and
price), while attributes with two levels (organic and health claim) were present twice
in each choice set. The presentation order of the choice sets was randomized across
participants. As an additional between-subjects factor, the choice set presentation
format varied between a verbal information matrix (N = 22), a visual information
matrix (N = 24), and a realistic product representation (N = 22) (Mueller, Lockshin, &
Louviere, 2010).
Materials and measures
The three stimulus presentation formats were operationalized as follows: For the
verbal and visual matrix formats the attributes were presented in six rows and the
alternatives as four columns within the rows. The attributes were, from top to bottom:
brand, flavor, fat percentage, organic claim, health claim, and price. The product
10 CHAPTER 1. LEARNING AFFECTS EYE MOVEMENTS IN DECISION-MAKING
representation format was operationalized as individual products presented next to
each other. The attributes were inserted on the products with the brand at the top of
the product followed by the flavor, fat percentage, organic claim in the lower right
and health claim in the lower left of each product, and price at the very bottom below
each product. The verbal information matrix was based on written descriptions of
the attribute levels. Each attribute description was kept to a minimum number of
letters stating only the name of the attribute level, such as "strawberry" or "peach"
for the flavor attribute or "Arla" or "Cultura" for the brand attribute.
The position of the attributes remained constant throughout the experiment. Two
of the attributes, organic and health claim, had two levels (absent or present). The
absence of either the organic or health claim on an alternative was operationalized
as an empty cell in the verbal and visual matrices or as empty space in the product
representation format. A pre-test ensured that all attribute levels were sufficiently
large to be easily readable in all three presentation formats at a distance of 60 cm
from the screen which is the optimal distance for the Tobii 2150 eye-tracker system
used in the study.
Assuming that participants remained at a distance of 60 cm to the screen, the
individual attributes were separated by an average angle of 2.3 degrees for the verbal
and visual matrices and an average angle of 2 degrees for the product representation
format. The spacing of attributes was chosen so that it would be impossible for
participants to foveate more than one attribute at the time.
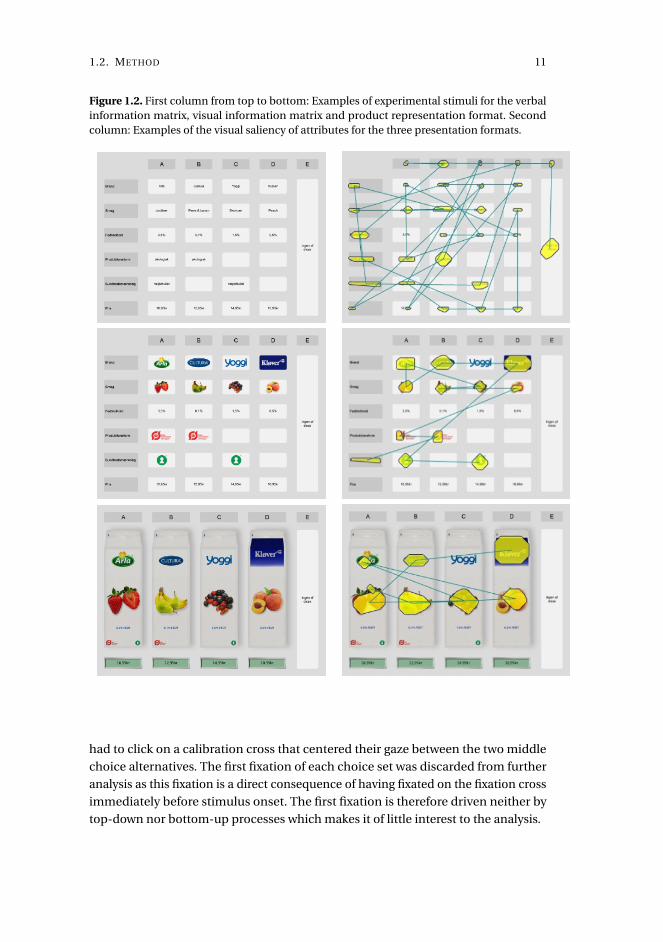
The yellow highlighted areas in Figure 2 represent the rank of product attributes
by visual saliency as assessed by the Itti-Koch algorithm (Itti & Koch, 2001). The
algorithm predicts a visual scanpath based on a computation of visual saliency,
i.e. the color, intensity, and orientation of stimuli, and gives an impression of how
attention would be distributed in the absence of top-down modulation. There were
no systematic differences in visual saliency between product attributes in the verbal
information matrix (lower left of Figure 2). In the visual information matrix (lower
middle of Figure 2), the health claim had the highest visual saliency followed by brand
(top row), flavor (second row), and organic claim. In the product representation
format, the attribute flavor had the highest visual saliency followed by brand. The
relative size of the attributes also differed between the product representation and
the two information matrices.
Eye movements were recorded using a Tobii 2150 eye-tracker (21 inches, 50 frames
per second). Respondents’ choices were recorded as mouse clicks on the chosen
product.
Procedure
Upon entering the laboratory, participants were seated in front of the eye tracker and
randomly assigned to one of the three presentation format conditions. After calibra-
tion, each participant completed 48 choice sets. Before each choice set, respondents
1.2. METHOD 11
Figure 1.2. First column from top to bottom: Examples of experimental stimuli for the verbalinformation matrix, visual information matrix and product representation format. Secondcolumn: Examples of the visual saliency of attributes for the three presentation formats.
had to click on a calibration cross that centered their gaze between the two middle
choice alternatives. The first fixation of each choice set was discarded from further
analysis as this fixation is a direct consequence of having fixated on the fixation cross
immediately before stimulus onset. The first fixation is therefore driven neither by
top-down nor bottom-up processes which makes it of little interest to the analysis.

12 CHAPTER 1. LEARNING AFFECTS EYE MOVEMENTS IN DECISION-MAKING
Analytical plan
The analysis unfolded in four steps: First we assessed the stability of preferences over
time. This is an important prerequisite as any conclusion regarding learning effects
on attention would only be valid if the participants did not change their preferences
during the experiment. The first step was carried out by splitting the choice sets into
three bins of 16 choice sets, separately estimating individual level choice models for
each of the bins and checking if there were any differences within participants across
the three bins. In the second step we modelled choices across all 48 choice sets for
each participant at a time, thus providing individual level estimates of part-worth
utilities and attribute importance. In the third step we merged the individual level
choice data with the attention data and analysed attention selection as a function of
trial order, attribute importance, and presentation format. To interpret the model we
computed the correlation between fixation likelihood and attribute importance for
each trial which reflects changes in top-down modulation. To interpret the model
with regards to bottom-up modulation we plotted the fixation likelihood for all
six attributes across the presentation formats. In the fourth step of the analysis
we calculated effect sizes for top-down, bottom-up, and interaction components
separately for each of the 48 trials to assess changes in modulatory strength over time.
1.3 Results
Step 1. Analysis of stability of preferences
In the first step of the analysis, participants’ choices were analyzed individually for
three consecutive bins of 16 choice sets based on random utility theory (Louviere,
Hensher, & Swait, 2000), according to which subjects choose the alternative that
maximizes their subjective utility. Utility is defined as:
Ui =Vi +εi (1.1)
where Ui is the utility of the choice alternative i , Vi is the observable or systematic
utility component, which is a function of its attributes, and εi is the random utility
component. The systematic component Vi is assumed to be an additive and linear
function in the attributes X . The systematic component is defined as:
Vi =∑
sβs Xi s (1.2)
where Xi s is the value of alternative i with attributes s(s = 1, . . . ,6), and βs are
part-worth utilities to be estimated. Under the assumption that the random error
terms εi are independently and identically extreme value distributed, the choice
probability of alternative i being chosen from all the alternatives in choice set T
follows the closed form expression of the multinomial logit (MNL) model
1.3. RESULTS 13
P (i ) = exp(Vi )∑i ′∈T exp(Vi ′ )
(1.3)
Parameters are estimated with maximum likelihood where likelihood is given by:
L =N∏
n=1
∏i∈Cn
Pn(i ) fi n (1.4)
where N represents the number of choice observations and fi n is a dummy
variable such that fi n = 1 if alternative i is chosen and fi n = 0 if an alternative is not
chosen from the choice set.
Attribute importance was approximated for each participant and each choice
set bin with the share of variance explained by each attribute, assuming that the
presented attributes determine 100 % of the choice process (Lancsar, Louviere, &
Flynn, 2007; Louviere & Islam, 2008). All choice models were run in Latent Gold
Syntax 4.5 (Statistical Innovations Corp.).
Differences in attribute importance were calculated on an individual level be-
tween the first and second as well as the second and third bin. T-tests were per-
formed to test if these changes in attribute importance differed significantly from
zero. Only brand differed significantly between the first and second choice set bin
(t =−3.038, p = 0.003), while all other attributes were not significantly different from
zero. Accordingly, results overall suggested that participants did not change prefer-
ences over the course of the experiment.
Step 2. Analysis of choice data
Because preferences were confirmed to be stable during the experiment, participants?
choices were analyzed individually for all 48 choice sets according to equations (1)
to (4), resulting in individual level importances [0;100] for all six product attributes. A
summary of average attribute importance is provided in Table 1.
Step 3. Analysis of fixation likelihood
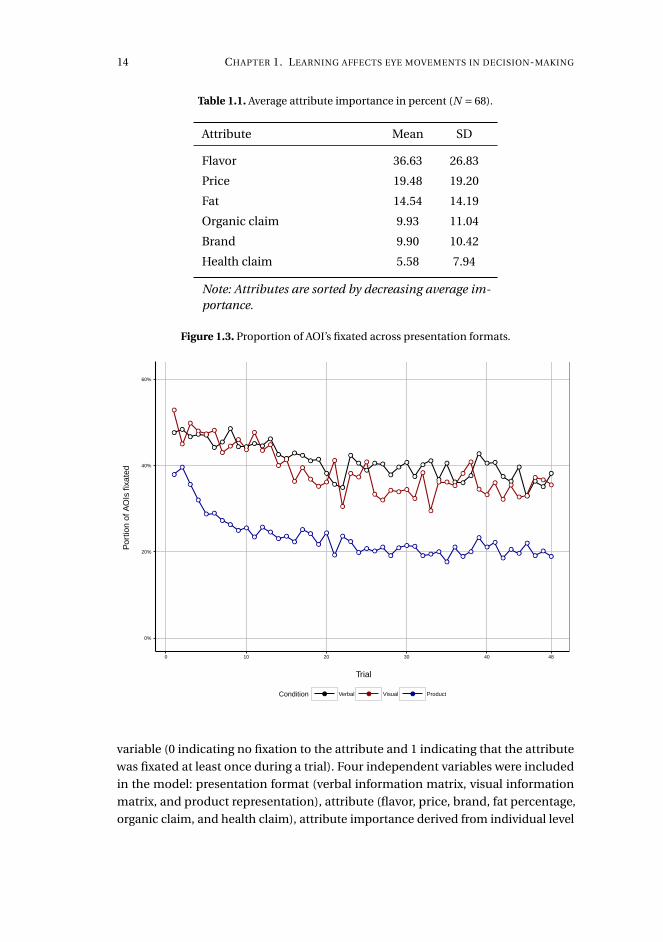
Before analyzing fixation likelihood we first inspected the proportion of attributes
fixated per trial as a complete or very high degree of attendance or non-attendance
would go against the purpose of the analysis. The inspection revealed that roughly
50 % of the attributes are fixated in the beginning of the experiment for the verbal and
visual information matrices and less than 40 % are fixated in the product representa-
tion format. The proportion of attributes fixated furthermore declines throughout
the experiment (see Figure 3).
In the third step of the analysis, individual level attribute importances were
merged with the eye tracking data. We estimated fixation likelihood by means of
a generalized linear mixed model (GLMM), using fixation selection as the dependent
14 CHAPTER 1. LEARNING AFFECTS EYE MOVEMENTS IN DECISION-MAKING
Table 1.1. Average attribute importance in percent (N = 68).
Attribute Mean SD
Flavor 36.63 26.83
Price 19.48 19.20
Fat 14.54 14.19
Organic claim 9.93 11.04
Brand 9.90 10.42
Health claim 5.58 7.94
Note: Attributes are sorted by decreasing average im-portance.
Figure 1.3. Proportion of AOI’s fixated across presentation formats.
●●
●● ●
●●
●
● ●● ●
●
●●
●●
● ●
●
●●
●
●
●
● ●
●
●●
●
●●
●
●
● ●
●
●
● ●
●●
●
●
●●
●
●
●
●
●●
●
●
●
●
●
●
●●
●●
●
●
●
●●
●
●
●●
●
●●
● ● ●
●
●
●
● ●●
●
●
●●
●
●
●
● ●
●●
●
●
●
●
●
● ●
●●
●●
●
●●
●●
●
●●
●
●
●
●●
●●
●●
●
● ● ●
● ●●
●
●
●●
●
●●
●
●●
●
●●
●
●●
●● ●
●
●
●
● ●●
●
●
●
●
●●
●●
●
●●
●
●
●
● ●
●
●
●
●
●
●
●
●
● ●
●
●
● ●
●
●
●
●
●
●
●
●
●
●
●●
●
●
●
●
●
●
●
●
●
●
●
●
●
●
●
●
●
●
●
●
●
●
●●
●
●
●
●
● ●
●
●
●
●
●
●
●
●
● ●
●●
●
●
●
●
●
● ●
●
●
●●
●
●
●
●●
●
●
●
●
●
●
●
●
●
●●
●
●
●● ●
●●
●
●
●
●
●
●
●
●
●
●
●
●
●
●
●
0%
20%
40%
60%
0 10 20 30 40 48
Trial
Por
tion
of A
OIs
fixa
ted
Condition ● ● ●Verbal Visual Product
variable (0 indicating no fixation to the attribute and 1 indicating that the attribute
was fixated at least once during a trial). Four independent variables were included
in the model: presentation format (verbal information matrix, visual information
matrix, and product representation), attribute (flavor, price, brand, fat percentage,
organic claim, and health claim), attribute importance derived from individual level
1.3. RESULTS 15
estimates, and experimental trial order.
Data from all 68 participants and 48 choice sets were used to estimate the model.
The GLMM assumed a binomial distribution for the dependent variable with a log link
function and a random intercept for participants to capture individual differences in
fixation likelihood. The model was estimated by means of maximum likelihood esti-
mation with quadrature approximation. This approximation was used to obtain log
likelihood values for model comparison and effect size measurement (Schabenberger,
2007; Stroup, 2013).
We estimated a full factorial model and compared it to reduced models. Model
comparison (LR tests) revealed that the full factorial model provided the best fit, and
that model was therefore used for interpretation. Table 2 shows the type III test of
fixed effects.
All effects in the final model were significant indicating that trial order, presen-
tation format, attribute importance, and attribute type as well as their interactions
contribute to explain fixation likelihood. In relation to the hypotheses we were mainly
interested in the interaction terms between trial and importance and between trial
and presentation format which would indicate changes in top-down and bottom-up
attention capture over time.
Table 2 shows that the model terms trial×importance and trial×importance×attribute
are significant which means that the influence of attribute importance on fixation
likelihood changes over time. Similarly, the significance of the interaction terms
trial×format and trial×format×attribute means that the influence of presentation
format on fixation likelihood changes over time. It is important to observe that the
interpretation of the interaction terms between importance and format is limited
because the two main effects might not be causally independent.
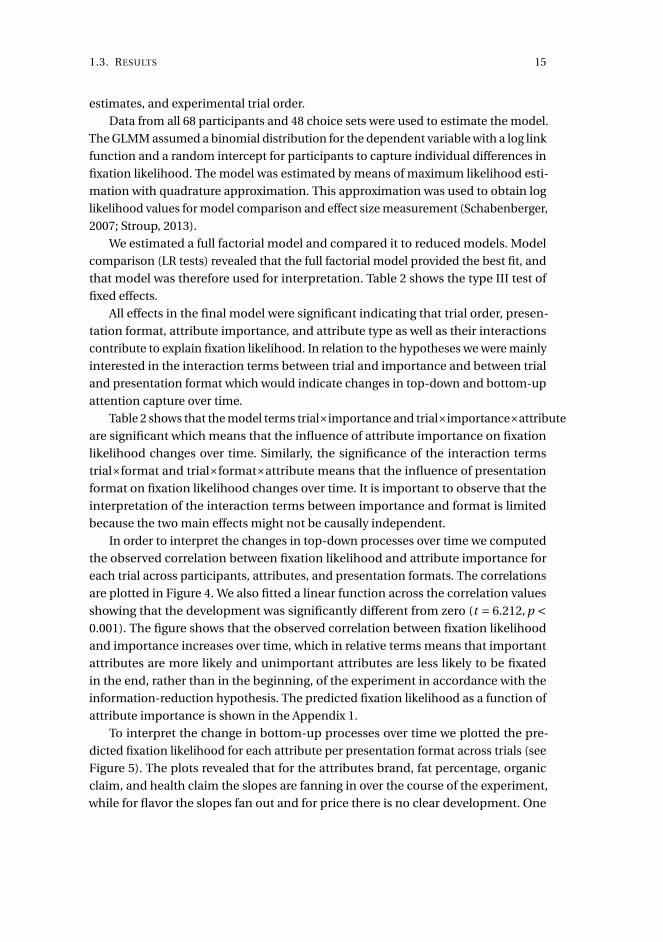
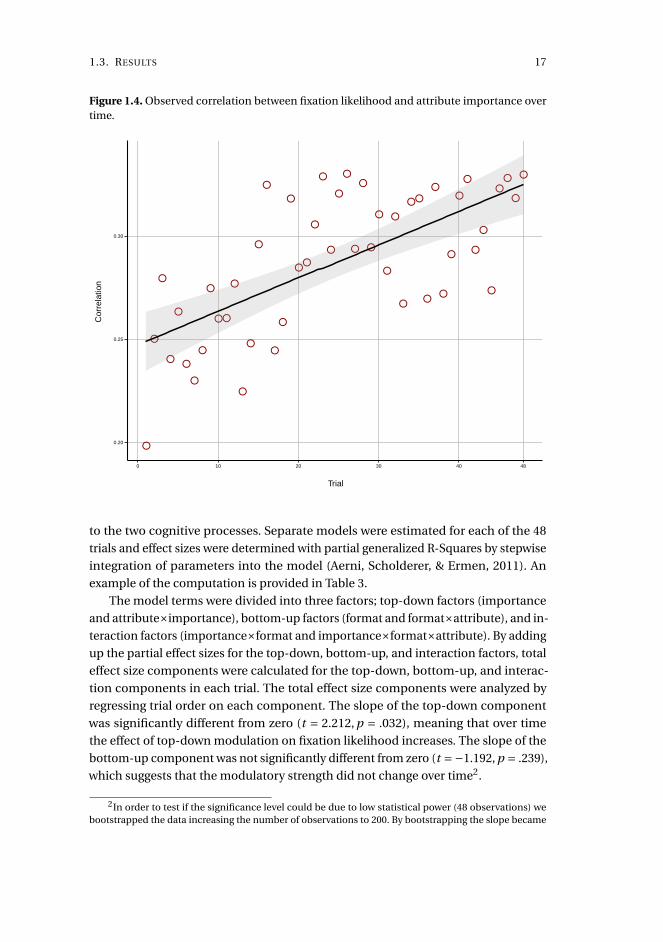
In order to interpret the changes in top-down processes over time we computed
the observed correlation between fixation likelihood and attribute importance for
each trial across participants, attributes, and presentation formats. The correlations
are plotted in Figure 4. We also fitted a linear function across the correlation values
showing that the development was significantly different from zero (t = 6.212, p <0.001). The figure shows that the observed correlation between fixation likelihood
and importance increases over time, which in relative terms means that important
attributes are more likely and unimportant attributes are less likely to be fixated
in the end, rather than in the beginning, of the experiment in accordance with the
information-reduction hypothesis. The predicted fixation likelihood as a function of
attribute importance is shown in the Appendix 1.
To interpret the change in bottom-up processes over time we plotted the pre-
dicted fixation likelihood for each attribute per presentation format across trials (see
Figure 5). The plots revealed that for the attributes brand, fat percentage, organic
claim, and health claim the slopes are fanning in over the course of the experiment,
while for flavor the slopes fan out and for price there is no clear development. One
16 CHAPTER 1. LEARNING AFFECTS EYE MOVEMENTS IN DECISION-MAKING
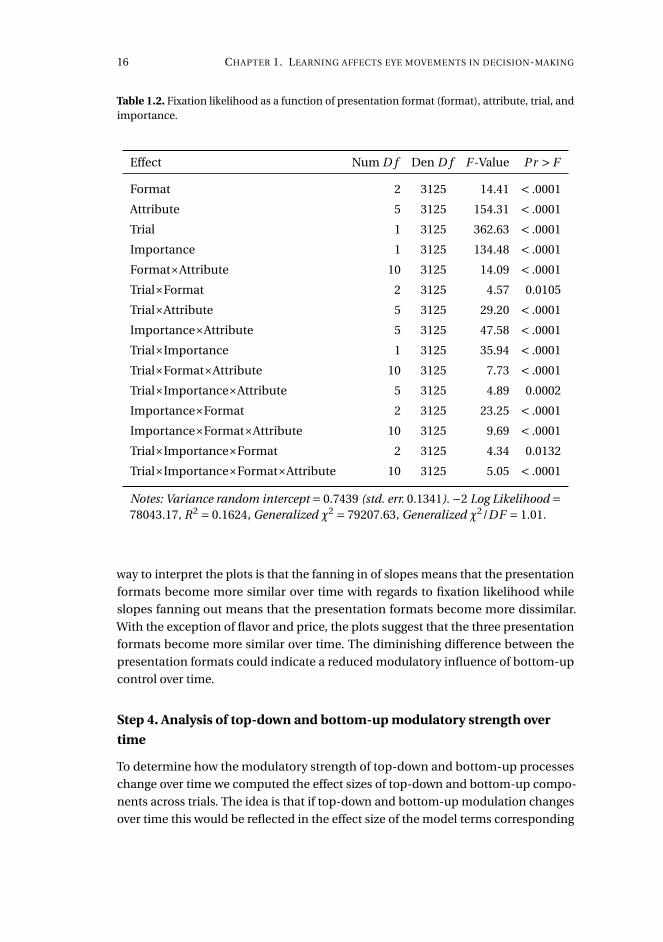
Table 1.2. Fixation likelihood as a function of presentation format (format), attribute, trial, andimportance.
Effect Num D f Den D f F -Value Pr > F
Format 2 3125 14.41 < .0001
Attribute 5 3125 154.31 < .0001
Trial 1 3125 362.63 < .0001
Importance 1 3125 134.48 < .0001
Format×Attribute 10 3125 14.09 < .0001
Trial×Format 2 3125 4.57 0.0105
Trial×Attribute 5 3125 29.20 < .0001
Importance×Attribute 5 3125 47.58 < .0001
Trial×Importance 1 3125 35.94 < .0001
Trial×Format×Attribute 10 3125 7.73 < .0001
Trial×Importance×Attribute 5 3125 4.89 0.0002
Importance×Format 2 3125 23.25 < .0001
Importance×Format×Attribute 10 3125 9.69 < .0001
Trial×Importance×Format 2 3125 4.34 0.0132
Trial×Importance×Format×Attribute 10 3125 5.05 < .0001
Notes: Variance random intercept = 0.7439 (std. err. 0.1341). −2 Log Likelihood =78043.17, R2 = 0.1624, Generalized χ2 = 79207.63, Generalized χ2/DF = 1.01.
way to interpret the plots is that the fanning in of slopes means that the presentation
formats become more similar over time with regards to fixation likelihood while
slopes fanning out means that the presentation formats become more dissimilar.
With the exception of flavor and price, the plots suggest that the three presentation
formats become more similar over time. The diminishing difference between the
presentation formats could indicate a reduced modulatory influence of bottom-up
control over time.
Step 4. Analysis of top-down and bottom-up modulatory strength over
time
To determine how the modulatory strength of top-down and bottom-up processes
change over time we computed the effect sizes of top-down and bottom-up compo-
nents across trials. The idea is that if top-down and bottom-up modulation changes
over time this would be reflected in the effect size of the model terms corresponding
1.3. RESULTS 17
Figure 1.4. Observed correlation between fixation likelihood and attribute importance overtime.
●
●
●
●
●
●
●
●
●
●●
●
●
●
●
●
●
●
●
●●
●
●
●
●
●
●
●
●
●
●
●
●
●●
●
●
●
●
●
●
●
●
●
●●
●
●
0.20
0.25
0.30
0 10 20 30 40 48
Trial
Cor
rela
tion
to the two cognitive processes. Separate models were estimated for each of the 48
trials and effect sizes were determined with partial generalized R-Squares by stepwise
integration of parameters into the model (Aerni, Scholderer, & Ermen, 2011). An
example of the computation is provided in Table 3.
The model terms were divided into three factors; top-down factors (importance
and attribute×importance), bottom-up factors (format and format×attribute), and in-
teraction factors (importance×format and importance×format×attribute). By adding
up the partial effect sizes for the top-down, bottom-up, and interaction factors, total
effect size components were calculated for the top-down, bottom-up, and interac-
tion components in each trial. The total effect size components were analyzed by
regressing trial order on each component. The slope of the top-down component
was significantly different from zero (t = 2.212, p = .032), meaning that over time
the effect of top-down modulation on fixation likelihood increases. The slope of the
bottom-up component was not significantly different from zero (t =−1.192, p = .239),
which suggests that the modulatory strength did not change over time2.
2In order to test if the significance level could be due to low statistical power (48 observations) webootstrapped the data increasing the number of observations to 200. By bootstrapping the slope became

18 CHAPTER 1. LEARNING AFFECTS EYE MOVEMENTS IN DECISION-MAKING
Table
1.3.Exam
ple
for
goo
dn
ess-of-fi
tand
effectsizestatistics
(Trial1).No.in
dicates
the
mo
deln
um
ber.
Go
od
ness-o
f-fitstatistics
Mo
delco
mp
arison
statistics
No.
Effects
entered
Effecttyp
eln
LL
Rχ
2d
fp
R2
LR∆χ
2∆
df
p∆
R2
0N
on
e−
1028.561
Form
atb
otto
m-u
p−
1026.444.24
2.120
.0024.24
2.120
.0022
Attrib
ute
−756.77
543.577
.000.264
539.335
.000.263
3Im
po
rtance
top
-dow
n−
728.66599.79
8.000
.29256.22
1.000
.0374
Form
at×A
ttribu
teb
otto
m-u
p−
693.40670.31
18.000
.32670.52
10.000
.0485
Attrib
ute×
Imp
ortan
ceto
p-d
own
−684.72
687.6823
.000.334
17.375
.004.013
6Im
po
rtance×
Form
atIn
teraction
−682.44
692.2425
.000.337
4.562
.102.003
7Im
po
rtance×
Form
at×A
ttribu
teIn
teraction
−665.13
726.8635
.000.353
34.6210
.000.025

1.3. RESULTS 19
Figure 1.5. Fixation likelihood for the six attributes across presentation formats.
Brand Flavour
Fat Organic claim
Health claim Price
0%
20%
40%
60%
0%
20%
40%
60%
0%
20%
40%
60%
0 10 20 30 40 48 0 10 20 30 40 48
Trial
Fix
atio
n lik
elih
ood
Condition Verbal Visual Product
The slope of the interaction component between top-down and bottom-up fac-
tors was not significantly different from zero (t = −1.040, p = 0.304). As for step 3
of the analysis, it is important to observe that the interpretation of the interaction
component is limited since we cannot assume that the two main effects are causally
independent.
significantly different from zero.

20 CHAPTER 1. LEARNING AFFECTS EYE MOVEMENTS IN DECISION-MAKING
Figure 1.6. bottom-up, top-down and interaction effect sizes over time.
●
●●
●
●
●● ●
●
●
● ●
●
●●
●
●●
●
●
●
●
●
●
●●
●●
● ●
●
●● ●
●
●
●
●
● ●●
●
● ●●
●
●●
●
● ●●
●
●
●
●
●●
●
●
●
●
●
●
●
●
●
●
●
●
●
●
●
●
●●
●
●
●
●
●
●
●
●
●
●
●
●
●
●
●
●
●
●
●
●
●
●
●
●
●
●
●
●
●
●
●
●
●●
●
● ●
●
●● ●
●●
●
●
●
●
●
●
● ●●
●
●●
●
●
●
●●
● ●●
●
●
●●
●
●
●
●
●
●
●●
●
●
●
● ●
●
●
●●
●
●
●
●
●
●
●
●
●
●
●
●
●●
●
●
● ●
●
●
●
●
●●
●
●
● ●
●
●
●●
●
●●
●
●
●
●
●
●
●●
●
●
●
●
●
●
●
●
●
●
●
●
●
●
●
●
●
●
●
●
●
●
●
●
●
●
●
●
●
●
●
●
●
●
●
●
●
●
●
●
●
●
●
●
●
●
●
●
●
●●
●
●●
●
●
● ●
●
●
●
●
●
●
●
●
●●
●
●
●
●
●
●
●
●
●
● ●●
●
●
●●
●
0.025
0.050
0.075
0.100
0 10 20 30 40 48
Trial
R−
squa
red
Type ● ● ●Interaction Bottom up Top down
1.4 Discussion
Summary of results
In line with the reward-based model of gaze allocation (Hayhoe & Rothkopf, 2011;
Tatler, et al., 2011) we hypothesized that top-down modulation is learned through
interaction with the environment and that modulatory strength increases as partici-
pants become more experienced with a task or situation. The modulatory increase
will lead to higher fixation likelihood for task relevant stimuli and lower fixation
likelihood for task redundant stimuli consistent with the information reduction hy-
pothesis (Haider & Frensch, 1999). This prediction was expressed in H1. Furthermore,
we hypothesized that an increase in top-down modulatory strength would reduce
bottom-up attention capture as the two processes have been shown to compete
for control over eye movements (Desimone & Duncan, 1995; Theeuwes, 2010). This
prediction was expressed in H2.
In order to examine the hypotheses we conducted a repeated measures discrete
choice experiment manipulating three different presentation formats. In the first
step of the analysis we compared the choice models based on bins of the first, middle
and last groups of choice sets. The analysis revealed that participants were largely
1.4. DISCUSSION 21
stable in their preferences throughout the experiment, which is an important point
when drawing conclusions about learning effects. In the second step of the analysis
we modeled individual level estimates of attribute importance. In the third step we
merged the individual level estimates with the attention data to model and analyze
the effect of top-down and bottom-up factors over time. The analysis revealed signifi-
cant interaction effects between trial order and attribute importance and trial order
and presentation format, indicating a change over time in top-down and bottom-up
processes. To interpret the direction of effects, we computed the correlation across
trials between fixation likelihood and importance. Plotting the correlations revealed
a positive slope demonstrating that fixation likelihood increases over time when an
attribute is of high importance to the decision-maker relative to when the attribute
is of low importance to the decision-maker. In order to interpret the direction of
effects for bottom-up processes, we plotted the predicted fixation likelihood for all
six attributes across the three presentation formats. The plots revealed that for the
most part the slopes were fanning in, indicating that the fixation likelihoods became
more similar across presentation formats over time.
In the fourth step of the analysis we tested the modulatory strength of top-down
and bottom-up processes over time. In order to do so, we estimated the effects
sizes of importance and presentation format factors for each trial separately. The
analysis revealed an increase in the effect size of importance over time, suggesting
that top-down modulation increases over time, thus confirming H1. The results for
bottom-up modulation were less clear, as the effect size of presentation format factors
did decrease over time, although the slope was not statistically significant. Future
experiments with more observations are required to further test changes in effect
sizes in order to adequately confirm or reject H2.
Alternative interpretations of our data
So far, we have mainly focused on one interpretation of our data in accordance with
the information reduction hypothesis (Haider & Frensch, 1999) and the reward based
model of gaze allocation (Hayhoe & Rothkopf, 2011; Tatler, et al., 2011). However, it
is worth considering at least a few alternative interpretations of the data. While the
information reduction hypothesis considers developments in perceptual efficiency it
would be worthwhile to also consider whether developments in cognitive efficiency
could explain the observations or part hereof. If we think of cognitive efficiency in
terms of cognitive skill acquisition there are at least four possible interpretations (Lee
& Anderson, 2001): The decrements in fixation proportions and fixation likelihood
could have been driven by cognitive skill acquisition through a) transforming or
collapsing the individual components of the procedure, b) strengthening the compo-
nents of the procedure, or c) changing the procedure altogether. Finally we can also
conceive of cognitive skill acquisition as a process of becoming familiar with the task
requirements thereby reducing initial task confusion. The first view of cognitive skill
22 CHAPTER 1. LEARNING AFFECTS EYE MOVEMENTS IN DECISION-MAKING
acquisition is to see it as a result of transforming or collapsing a multistep procedure
into one or more macro procedures (Newell & Rosenbloom, 1981). One could, for
instance, hypothesize that the decrease in proportion of fixations would stem from
participants collapsing smaller process steps such as scanning alternatives for an
overview, comparing alternatives or attributes, checking chosen alternative and so
forth into larger process steps. One possibility could, for instance, be to collapse
two binary comparison steps into one trinary comparison (on binary and trinary
comparisons see (Russo & Leclerc, 1994)) thereby decreasing the time and number
of fixations needed to complete the decision task. Based on our class of analysis we
cannot exclude the possibility that participants were collapsing process steps and
thereby decreasing the number of fixations and decision times. Future studies might
address this question using different classes of scanpath analyses (Holmqvist et al.,
2011). It would, for instance, be interesting to examine if there is a shift in binary to
trinary comparisons over time or whether other steps in the decision process are
being transformed over time.
A second view of cognitive skill acquisition is to see it as resulting from increased
efficiency in performing the individual task components (Anderson, 1982). Although
this particular view is strongly associated with the notion of "strengthening" in Ander-
son’s ACT theory one could also think of efficiency in terms of automaticity. It seems
plausible that individual process steps will require more deliberation in the early trials
while the later trials might be characterized by a more automatic execution. Another
possibility is that participants will rely increasingly on memory retrieval, for instance,
when searching for acceptable attribute levels. Because of the D-optimal design all
attribute levels were present in every choice set which would allow participants to
retrieve the last attribute level from memory after having fixated the first three levels.
Such a mixed visual search and memory retrieval approach would lead to a decrease
in the number of fixations needed to complete the decision task and perhaps also a
reduction in the decision time. Based on our analyses we cannot exclude the possibil-
ity that participants became more efficient in terms of automaticity nor can we do
so by simply inspecting individual fixation durations over time as fixation durations
might not be closely related to deliberate versus automatic decisions (Horstmann,
Ahlgrimm, & Glöckner, 2009). Future studies might wish to examine such processes
by analyzing changes to the scanpath over time or by examining multiple process
measures (Glöckner, 2009).
A third view of cognitive skill acquisition is to see it as resulting from selecting a
faster method or strategy (Crossman, 1959). In a decision task this could mean that
participants change from one decision strategy to another that is faster such as going
from a weighted additive strategy to a lexicographic or satisficing strategy (see the
introduction). If we qualitatively compare individual participants? scanpaths from
the first and the last trials it does, in fact, seem like the participants are changing their
decision strategy dramatically. While the first few trials are characterized by partici-
1.4. DISCUSSION 23
pants fixating many or most of the attributes the last trials are often characterized
by the participants fixating only one or two rows of attributes. Such a simple inspec-
tion suggests that participants over time go from a slower strategy involving more
fixations to a faster strategy involving fewer fixations. The only problem with this
claim is that the change in strategy would have to occur gradually which is in conflict
with the way decision strategies are currently specified. If we adhere to the view that
decision strategies are qualitatively different and discrete processes then the gradual
change in fixation patterns can suggest two things: a) either participants use the
same decision strategy throughout the experiment but the way it is implemented in a
search process changes (concerning instability of search patterns see (Costa-Gomes,
et al., 2001; Svenson, 1979)) or b) participants simply do not use decision strategies
in the form or to the extent they have been specified in the decision literature (for a
related discussion see (Orquin & Mueller Loose, 2013)). In the case of participants
maintaining a stable decision strategy but changing their fixation pattern over time,
it is unlikely that we can either confirm or reject the hypothesis based on the choice
and fixation data alone, but future studies might look into this question using other
techniques. Regarding the second implication, one can either reach the conclusion
that decision-makers do not rely on decision strategies or that decision strategies
are not discrete entities. Future studies might wish to relax the assumption about
discrete and deterministic decision strategies and look into probabilistic or stochastic
specifications instead (Bergert & Nosofsky, 2007). Given a relaxed assumption about
discrete decision strategies we cannot exclude that participants actually changed
their strategy during the experiment and that this strategy change explains the devel-
opment in proportion of fixations and fixation likelihood. However, we can exclude
that participants made any discrete changes in their decision strategies since our
data reveals a gradual change in fixation patterns.
Another possible view of our data is to see the decline in fixation proportions and
fixation likelihood as a consequence of task-level familiarization, or in other words a
reduction in task-confusion. This hypothesis suggests that participants during the
first few trials are uncertain about the task requirements which would increase the
number of fixations because additional time and effort is spent on becoming familiar
with the task. If participants are confused about the task requirements during the first
few trials we should also expect them to be less consistent in their choices. Inspecting
the development in choice consistency over time indicates that participants are,
in fact, less consistent in the beginning of the experiment. However, two aspects
speak against participants being confused: First of all, choice consistency increases
gradually throughout the experiment albeit with the strongest increase in consistency
in the beginning of the experiment (See Appendix 2). Second, even in the first trial
participants are highly consistent with more that 70 % choosing the highest utility
alternative. The high degree of consistency suggests that participants cannot be
confused about the task requirements otherwise choices would be random. Although
24 CHAPTER 1. LEARNING AFFECTS EYE MOVEMENTS IN DECISION-MAKING
it is plausible that participants experienced a certain degree of confusion in the first
couple of trials it is difficult to say whether this could explain the development in
proportion of fixations or in top-down and bottom-up control. Future studies could
look into this process by more directly manipulating task confusion and test whether
it amplifies, for instance, bottom-up control of attention.
1.5 Implications and future research
The study has several implications for research on decision-making, as well as re-
search on eye movements and attention. Firstly, we replicate findings from prior
studies on top-down and bottom-up effects in decision-making (Orquin & Mueller
Loose, 2013), and extend these findings by showing that the modulatory processes
change over time. The study lends support to the reward-based model of gaze alloca-
tion (Hayhoe & Rothkopf, 2011; Tatler, et al., 2011) by showing that learning increases
top-down modulation of attention. Furthermore, we present evidence suggesting
that top-down and bottom-up processes compete for influence over eye movements,
and that increases in top-down modulation could diminish bottom-up modulation.
However, based on this experiment alone, we cannot say whether the likely reduction
in bottom-up modulation is caused by the increase in top-down modulation. Another
possibility could be that bottom-up modulation decreases over time even when top-
down modulation remains equal. On the other hand, there are theoretical reasons
(Desimone & Duncan, 1995), as well as empirical findings (Kowler, 2011), suggest-
ing that the two processes influence each other in what could be a competition for
control over eye movements. Future studies should address this issue and examine
the more precise circumstances under which top-down and bottom-up processes
are in competition, and when they interact to amplify attention capture (e.g. Folk,
Remington, & Johnston, 1992).
Furthermore, due to the experimental approach, several bottom-up factors were
manipulated simultaneously across the three presentation formats. Although it was
possible to demonstrate separate effects of top-down and bottom-up processes
using this approach, it still leaves open the question of what particular bottom-up
processes were acting on attention capture. Future studies could take advantage of a
more structured approach in which bottom-up factors, such as visual saliency, size,
and position, are manipulated separately.
The study also lends support to the information reduction hypothesis (Haider &
Frensch, 1999), by showing that participants over time learn to fixate important infor-
mation and ignore less important information. The results imply that participants
in choice experiments become more efficient at a perceptual level over time, which
could explain how decision times decrease and accuracy increases over the course
of repeated measures experiments. We do not wish to say that no gains occur at a
cognitive skill level, which most likely is the case, however our findings suggest that

1.5. IMPLICATIONS AND FUTURE RESEARCH 25
an important reason for the reduction in decision time and increment in accuracy is
due to perceptual efficiency. An interesting question for future research is, therefore,
to examine the degree to which the reduction in decision time and gain in accuracy
can be explained by gains in perceptual efficiency and cognitive skill level.
Another implication from our findings relates to process tracing studies, partic-
ularly studies measuring eye movements. The fact that attention processes change
over time, as a consequence of learning, should matter to most experimenters, since
the vast majority of eye tracking studies in judgment and decision-making are based
on repeated measures experiments. Because of the pervasive use of repeated choice
experiments, we must conclude that these studies lead to learning effects as demon-
strated in this paper. Our data show that learning occurs rapidly right from the begin-
ning of the experiment. Particularly the effect of bottom-up modulation is subject to
a steep decline in the first 3-4 trials (see Figure 6). It could potentially be problematic
to aggregate process measures over time particularly if one is interested in improv-
ing choice models based on process measures (Balcombe, Fraser, & McSorley, 2011;
Hensher, Rose, & Greene, 2005; Meißner, Musalem, & Huber, 2012; Scarpa, Zanoli,
Bruschi, & Naspetti, 2013). Assuming that temporal changes in top-down and bottom-
up processes is problematic for the estimation of choice models one could possibly
counteract or at least diminish this change by randomizing the position of attributes
within-subjects. It has, for instance, been shown that randomizing the position of
information elements from trial to trial diminishes information reduction (Haider
& Frensch, 1999). However, randomizing the attribute position within-subjects may
lead to other effects besides diminishing information reduction and more studies
would be needed to examine the effects of such a manipulation on top-down and
bottom-up processes.
Last but not least, throughout the study we have argued that temporal dynamics
constitute a theoretical challenge to the strategy selection view of decision-making.
In the introduction we demonstrated that there is no ordering of decision strategies
that will lead to a decrease in decision time and increase in accuracy. In the previous
section we discussed different possibilities for relaxing the assumptions about deci-
sion strategies and whether this could explain our observations. Although relaxing
the assumptions about strategy selection and what defines a decision strategy would
fit the theory better to the data we suggest that a more promising approach would be
to reconsider the role of visual processes in decision-making.
26 CHAPTER 1. LEARNING AFFECTS EYE MOVEMENTS IN DECISION-MAKING
1.6 References
Aerni, P., Scholderer, J., & Ermen, D. (2011). How would Swiss consumers decide if
they had freedom of choice? Evidence from a field study with organic, conventional
and GM corn bread. Food Policy, 36, 830-838. http://dx.doi.org/10.1016/j.foodpol.2011.08.002.
Anderson, J. R. (1982). Acquisition of cognitive skill. Psychological Review, 89, 369-406.
http://psycnet.apa.org/doi/10.1037/0033-295X.89.4.369.
Anzai, Y., & Simon, H. A. (1979). The theory of learning by doing. Psychological Review,
86, 124-140. http://dx.doi.org/10.1037//0033-295X.86.2.124.
Balcombe, K., Fraser, I., & McSorley, E. (2011). Visual attention and attribute at-
tendance in multi-attribute choice experiments. Department of Agricultural Food
Economics, University of Reading. Reading.
Bergert, F. B., & Nosofsky, R. M. (2007). A response-time approach to comparing
generalized rational and take-the-best models of decision-making. Journal of
Experimental Psychology: Learning, Memory, and Cognition, 33, 107-129. http://dx.doi.org/10.1037/0278-7393.33.1.107.
Bialkova, S., & van Trijp, H. C. M. (2011). An efficient methodology for assessing
attention to and effect of nutrition information displayed front-of-pack. Food
Quality and Preference, 22, 592-601. http://dx.doi.org/10.1016/j.foodqual.2011.03.010.
Carlsson, F., Mørkbak, M. R., & Olsen, S. B. (2011). The first time is the hardest: A test of
ordering effects in choice experiments. Paper presented at the International Choice
Modelling Conference, 4-6 July 2011, Leeds, UK.
Chisholm, J. D., Hickey, C., Theeuwes, J., & Kingstone, A. (2010). Reduced attentional
capture in action video game players. Attention, Perception, & Psychophysics, 72,
667-671. http://dx.doi.org/10.3758/APP.72.3.667.
Corbetta, M., & Shulman, G. L. (2002). Control of goal-directed and stimulus-driven
attention in the brain. Nature Review Neuroscience, 3, 201-215. http://dx.doi.org/10.1038/nrn755.
Costa-Gomes, M., Crawford, V. P., & Broseta, B. (2001). Cognition and Behavior in
Normal-Form Games: An Experimental Study. Econometrica, 69, 1193-1235. http://dx.doi.org/10.1111/1468-0262.00239.
Crossman, E. (1959). A theory of the acquisition of speed-skill. Ergonomics, 2, 153-166.
http://dx.doi.org/10.1080/00140135908930419.
Dai, X., Brendl, C. M., & Ariely, D. (2010). Wanting, liking, and preference construction.
Emotion, 10, 324-334. http://dx.doi.org/10.1037/a0017987.

1.6. REFERENCES 27
Deaner, R. O., Khera, A. V., & Platt, M. L. (2005). Monkeys pay per view: adaptive
valuation of social images by rhesus macaques. Current Biology, 15, 543-548. http://dx.doi.org/10.1016/j.cub.2005.01.044.
Desimone, R., & Duncan, J. (1995). Neural mechanisms of selective visual atten-
tion. Annual review of Neuroscience, 18, 193-222. http://dx.doi.org/10.1146/annurev.ne.18.030195.001205.
Droll, J. A., Gigone, K., & Hayhoe, M. M. (2007). Learning where to direct gaze during
change detection. Journal of Vision, 7, 1-12. http://dx.doi.org/10.1167/7.14.6.
Fiedler, S., & Glöckner, A. (2012). The dynamics of decision-making in risky choice:
An Eye-tracking Analysis. Frontiers in Psychology, 3, 1-18. http://dx.doi.org/10.3389/fpsyg.2012.00335.
Folk, C. L., Remington, R. W., & Johnston, J. C. (1992). Involuntary covert orienting is
contingent on attentional control settings. Journal of Experimental Psychology: Hu-
man Perception and Performance, 18, 1030-1044. http://dx.doi.org/10.1037//0096-1523.18.4.1030.
Gegenfurtner, A., Lehtinen, E., & Säljö, R. (2011). Expertise Differences in the Compre-
hension of Visualizations: a Meta-Analysis of Eye-Tracking Research in Professional
Domains. Educational Psychology Review, 23, 523-552. http://dx.doi.org/10.1007/s10648-011-9174-7.
Glöckner, A. (2009). Investigating intuitive and deliberate processes statistically: The
multiple-measure maximum likelihood strategy classification method. Judgment
and decision-making, 4, 186-199.
Glöckner, A., & Betsch, T. (2008). Modeling option and strategy choices with con-
nectionist networks: Towards an integrative model of automatic and deliberate
decision-making. Judgment and decision-making, 3, 215-228. http://dx.doi.org/10.2139/ssrn.1090866.
Green, C. S., & Bavelier, D. (2006). Effect of action video games on the spatial distribu-
tion of visuospatial attention. Journal of Experimental Psychology. Human Percep-
tion and Performance, 32, 1465-1478. http://dx.doi.org/10.1037/0096-1523.32.6.1465.
Green, C. S., & Bavelier, D. (2007). Action-video-game experience alters the spatial
resolution of vision. Psychological Science, 18, 88-94. http://dx.doi.org/10.1111/j.1467-9280.2007.01853.x.
Haider, H., & Frensch, P. A. (1999). Eye movement during skill acquisition: More
evidence for the information-reduction hypothesis. Journal of Experimental Psy-
chology: Learning, Memory, and Cognition, 25, 172-190. http://dx.doi.org/10.1037//0278-7393.25.1.172.
28 CHAPTER 1. LEARNING AFFECTS EYE MOVEMENTS IN DECISION-MAKING
Hayhoe, M. M., & Rothkopf, C. A. (2011). Vision in the natural world. Wiley Interdis-
ciplinary Reviews: Cognitive Science, 2, 158-166. http://dx.doi.org/10.1002/wcs.113.
Hegarty, M., Canham, M. S., & Fabrikant, S. I. (2010). Thinking About the Weather:
How Display Salience and Knowledge Affect Performance in a Graphic Inference
Task. Journal of Experimental Psychology: Learning, Memory, and Cognition, 36,
37-53. http://dx.doi.org/10.1037/a0017683.
Hensher, D. A., Rose, J., & Greene, W. H. (2005). The implications on willingness
to pay of respondents ignoring specific attributes. Transportation, 32, 203-222.
http://dx.doi.org/10.1007/s11116-004-7613-8.
Hess, S., Hensher, D., & Daly, A. (2012). Not bored yet - revisiting respondent fatigue
in stated choice experiments. Transportation Research Part A, 46, 626-644. http://dx.doi.org/10.1016/j.tra.2011.11.008.
Holmqvist, K., Nyström, M., Andersson, R., Dewhurst, R., Jarodzka, H., & Van de
Weijer, J. (2011). Eye tracking: A comprehensive guide to methods and measures.
Oxford University Press.
Horstmann, N., Ahlgrimm, A., & Glöckner, A. (2009). How distinct are intuition and
deliberation? An eye-tracking analysis of instruction-induced decision modes.
Judgment and decision-making, 4, 335-354. http://dx.doi.org/10.2139/ssrn.1393729.
Huang, M. Y., & Kuo, F. (2011). An eye-tracking investigation of internet consumers?
decision deliberateness. Internet Research, 21, 541-561. http://dx.doi.org/10.1108/10662241111176362.
Itti, L., & Koch, C. (2001). Computational modeling of visual attention. Nature Reviews
Neuroscience, 2, 194-203.
Johnson, E. J., & Payne, J. W. (1985). Effort and accuracy in choice. Management
Science, 31, 395-414.
Jovancevic-Misic, J., & Hayhoe, M. M. (2009). Adaptive Gaze Control in Natural Envi-
ronments. The Journal of Neuroscience, 29, 6234-6238. http://dx.doi.org/10.1523/jneurosci.5570-08.2009.
Kahneman, D. (2003). A perspective on judgement and choice: Mapping bounded
rationality. American Psychologist, 58, 697-720. http://dx.doi.org/10.1037/0003-066X.58.9.697.
Knoepfle, D. T., Tao-yi Wang, J., & Camerer, C. F. (2009). Studying learning in games
using eye-tracking. Journal of the European Economic Association, 7, 388-398. http://dx.doi.org/10.1162/JEEA.2009.7.2-3.388.
1.6. REFERENCES 29
Kowler, E. (2011). Eye movements: The past 25 years. Vision Research, 51, 1457-1483.
urlhttp://dx.doi.org/http://dx.doi.org/10.1016/j.visres.2010.12.014.
Lancsar, E., Louviere, J. J., & Flynn, T. N. (2007). Several methods to investigate relative
attribute impact in stated preference experiments. Social Science & Medicine, 64,
1738-1753.
Lee, F. J., & Anderson, J. R. (2001). Does learning a complex task have to be complex?:
A study in learning decomposition. Cognitive Psychology, 42, 267-316. http://dx.doi.org/10.1006/cogp.2000.0747.
Louviere, J. J., Hensher, D. A., & Swait, J. D. (2000). Stated choice methods: analysis
and application. Cambridge: Cambridge University Press.
Louviere, J. J., & Islam, T. (2008). A comparison of importance weights/measures
derived from choice-based conjoint, constant sum scales and best-worst scal-
ing. Journal of Business Research, 61, 903-911. http://dx.doi.org/10.1016/j.jbusres.2006.11.010.
McFadden, D. (2001). Economic choices. American Economic Review, 91, 351-378.
http://dx.doi.org/10.1257/aer.91.3.351.
Meißner, M., & Decker, R. (2010). Eye-tracking information processing in choice-
based conjoint analysis. International Journal of Market Research, 52, 591-610.
http://dx.doi.org/10.2501/s147078531020151x.
Meißner, M., Musalem, A., & Huber, J. (2012). Gaze cascade effects in repeated
conjoint choices. Paper presented at the Australian and New Zealand Marketing
Academy (ANZMAC) Conference Adelaide.
Mueller Loose, S., & Orquin, J. (2012). How stimuli presentation format affects visual
attention and choice outcomes in choice experiments. Paper presented at the
Australian and New Zealand Marketing Academy Conference, Adelaide..
Mueller, S., Lockshin, L., & Louviere, J. J. (2010). What you see may not be what you
get: Asking consumers what matters may not reflect what they choose. Marketing
Letters, 21, 335-350. http://dx.doi.org/10.1007/s11002-009-9098-x.
Newell, A., & Rosenbloom, P. S. (1981). Mechanisms of skill acquisition and the law
of practice. In J. R. Anderson (Ed.), Cognitive skills and their acquisition (pp. 1-55).
Hillsdale, NJ: Erlbaum.
Nordfang, M., Dyrholm, M., & Bundesen, C. (2013). Identifying Bottom-Up and Top-
Down Components of Attentional Weight by Experimental Analysis and Com-
putational Modeling. Journal of Experimental Psychology: General, 142, 510-535.
http://dx.doi.org/10.1037/a0029631.
Nyamsuren, E., & Taatgen, N. A. (2013). Set as an Instance of a Real-World Visual-
Cognitive Task. Cognitive Science, 37, 146-175. http://dx.doi.org/10.1111/cogs.12001.

30 CHAPTER 1. LEARNING AFFECTS EYE MOVEMENTS IN DECISION-MAKING
Orquin, J. L., & Mueller Loose, S. (2013). Attention and choice: A review on eye move-
ments in decision-making. Acta Psychologica, 144, 190-206. http://dx.doi.org/10.1016/j.actpsy.2013.06.003
Patalano, A. L., Juhasz, B. J., & Dicke, J. (2010). The relationship between indeci-
siveness and eye movement patterns in a decision-making informational search
task. Journal of Behavioral decision-making, 23, 353-368. http://dx.doi.org/10.1002/bdm.661.
Payne, J. W., Bettman, J. R., & Johnson, E. J. (1988). Adaptive strategy selection in
decision-making. Journal of Experimental Psychology: Learning, Memory and Cog-
nition, 14, 534-552. http://dx.doi.org/10.1037//0278-7393.14.3.534.
Riedl, R., Brandstätter, E., & Roithmayr, F. (2008). Identifying decision strategies: A
process-and outcome-based classification method. Behavior Research Methods, 40,
795-807.
Russo, J. E., & Leclerc, F. (1994). An eye-fixation analysis of choice processes for
consumer nondurables. Journal of Consumer Research, 21, 274-290. http://dx.doi.org/10.1086/209397.
Salvucci, D. D., & Taatgen, N. A. (2008). Threaded cognition: An integrated theory
of concurrent multitasking. Psychological Review, 115, 101-130. http://dx.doi.org/10.1037/0033-295X.115.1.101.
Scarpa, R., Zanoli, R., Bruschi, V., & Naspetti, S. (2013). Inferred and Stated Attribute
Non-attendance in Food Choice Experiments. American Journal of Agricultural
Economics, 95, 165-180. http://dx.doi.org/10.1093/ajae/aas073.
Schabenberger, O. (2007). Growing up fast: SAS 9.2 enhancements to the GLIMMIX
procedure. Paper presented at the SAS Global Forum.
Smead, R. J., Wilcox, J. B., & Wilkes, R. E. (1981). How Valid Are Product Descriptions
and Protocols in Choice Experiments? Journal of Consumer Research, 8, 37-42.
http://dx.doi.org/10.1086/208838.
Street, D., & Burgess, L. (2007). The construction of optimal stated choice experiments:
Theory and methods. Hoboken, New Jersey: John Wiley & Sons, Inc.
Stroup, W. W. (2013). Generalized Linear Mixed Models: Modern Concepts, Methods
and Applications. CRC PressI Llc.
Svenson, O. (1979). Process descriptions of decision-making. Organizational Behavior
and Human Performance, 23, 86-112.http://dx.doi.org/10.1016/0030-5073(79)90048-5.
Söllner, A., Bröder, A., & Hilbig, B. E. (2013). Deliberation versus automaticity in
decision-making: Which presentation format features facilitate automatic decision-
making? Judgment and decision-making, 8, 278-298.
1.6. REFERENCES 31
Tatler, B. W., Hayhoe, M. M., Land, M. F., & Ballard, D. H. (2011). Eye guidance in
natural vision: Reinterpreting salience. Journal of Vision, 11, 1-23. http://dx.doi.org/10.1167/11.5.5.
Theeuwes, J. (2010). Top-down and bottom-up control of visual selection. Acta Psy-
chologica, 135, 77-99. http://dx.doi.org/10.1016/j.actpsy.2010.02.006.
Toubia, O., de Jong, M. G., Stieger, D., & Füller, J. (2012). Measuring Consumer Prefer-
ences Using Conjoint Poker. Marketing Science, 31, 138-156. http://dx.doi.org/10.1287/mksc.1110.0672.
Trommershäuser, J., Glimcher, P. W., & Gegenfurtner, K. R. (2009). Visual processing,
learning and feedback in the primate eye movement system. Trends in Neuro-
sciences, 32, 583-590. http://dx.doi.org/10.1016/j.tins.2009.07.004.
van Herpen, E., & Trijp, H. C. M. v. (2011). Front-of-pack nutrition labels. Their effect
on attention and choices when consumers have varying goals and time constraints.
Appetite, 57, 148-160. http://dx.doi.org/10.1016/j.appet.2011.04.011.
Van Raaij, F. W. (1977). Consumer information processing for different information
structures and formats. Advances in Consumer Research, 4, 176-184.
Visschers, V. H. M., Hess, R., & Siegrist, M. (2010). Health motivation and product
design determine consumers’ visual attention to nutrition information on food
products. Public Health Nutrition, 13, 1099-1096. http://dx.doi.org/10.1017/S1368980009993235.
West, G. L., Al-Aidroos, N., & Pratt, J. (2013). Action video game experience affects
oculomotor performance. Acta Psychologica, 142, 38-42. http://dx.doi.org/10.1016/j.actpsy.2011.08.005.
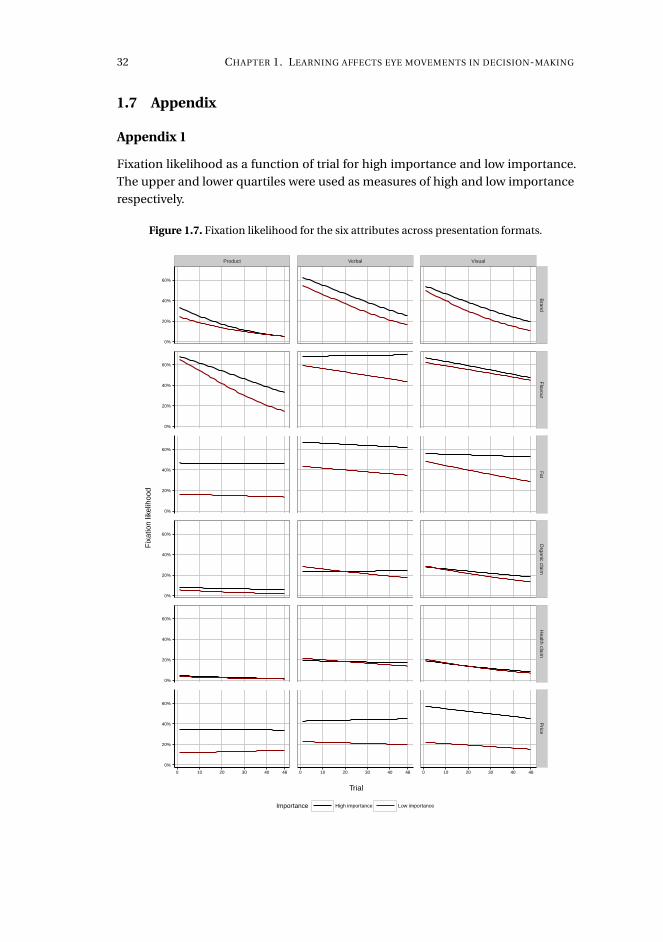
32 CHAPTER 1. LEARNING AFFECTS EYE MOVEMENTS IN DECISION-MAKING
1.7 Appendix
Appendix 1
Fixation likelihood as a function of trial for high importance and low importance.
The upper and lower quartiles were used as measures of high and low importance
respectively.
Figure 1.7. Fixation likelihood for the six attributes across presentation formats.
Product Verbal Visual
0%
20%
40%
60%
0%
20%
40%
60%
0%
20%
40%
60%
0%
20%
40%
60%
0%
20%
40%
60%
0%
20%
40%
60%
Brand
Flavour
FatO
rganic claimH
ealth claimP
rice
0 10 20 30 40 48 0 10 20 30 40 48 0 10 20 30 40 48
Trial
Fix
atio
n lik
elih
ood
Importance High importance Low importance
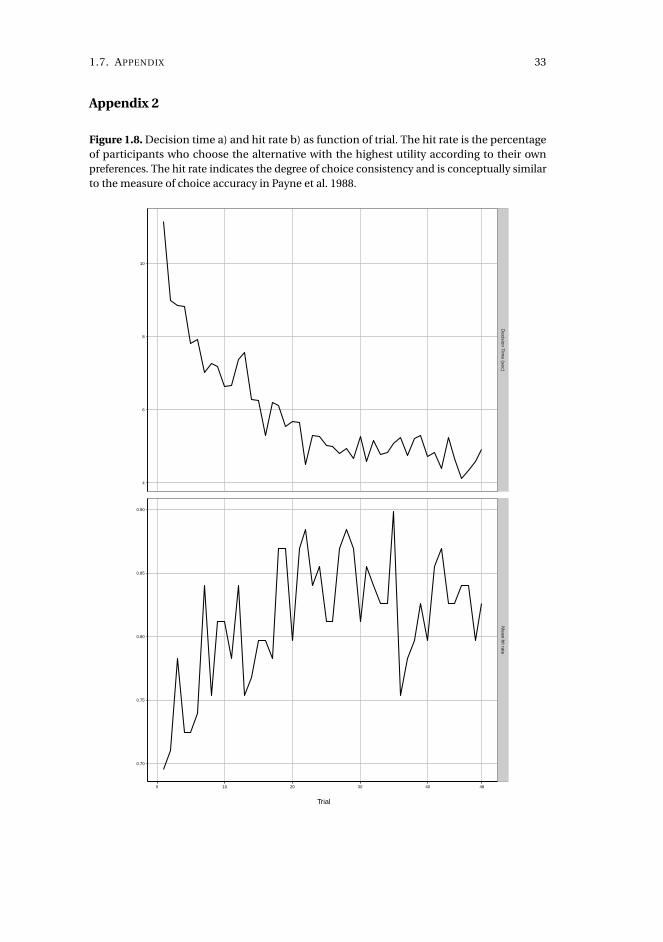
1.7. APPENDIX 33
Appendix 2
Figure 1.8. Decision time a) and hit rate b) as function of trial. The hit rate is the percentageof participants who choose the alternative with the highest utility according to their ownpreferences. The hit rate indicates the degree of choice consistency and is conceptually similarto the measure of choice accuracy in Payne et al. 1988.
4
6
8
10
0.70
0.75
0.80
0.85
0.90
Decision T
ime (sec)
Mean hit rate
0 10 20 30 40 48
Trial

CH
AP
TE
R
2EFFICIENCY GAINS IN REPEATED BINARY CHOICE
ADAPTATION TO THE TASK ENVIRONMENT1
SUBMITTED TO ORGANIZATIONAL BEHAVIOUR AND HUMAN DECISION PROCESSES
Martin Petri Bagger
Aarhus University
Abstract
It is a well-established result in judgment and decision-making research that
decision-makers become faster and more accurate through experience with a
task. However, if the structure of the task environment varies, different types of ef-
ficiency gains may occur, and under some conditions there may even be no gains
at all. Four multiple-cue probability learning experiments were conducted in
which the task environment was varied. In addition to the values of 16 attributes,
we varied their visual salience and (across experiments) the validity of visual
salience as a cue to the values of the attributes. Participants became faster under
all conditions but they only became more accurate when visual salience had high
cue validity. The results suggest that decision-makers learn to utilise relevant
information and discard irrelevant information quite rapidly and that changes in
task performance are controlled by changes in cue reactivity and other attention
control processes that depend on the structure of the task environment.
1Acknowledgments: I would like to thank Hans Jørn Juhl, Anne Odile Peschel, Jacob Lund Orquin,Joachim Scholderer and participants in the Markets, Organization and Behaviour Seminar in February2016 at Aarhus University for valuable comments on this research project.
35
36 CHAPTER 2. EFFICIENCY GAINS IN REPEATED BINARY CHOICE
2.1 Introduction
Procedural invariance is a central assumption in models of rational decision-making
(Tversky, Slovic & Kahneman, 1990): equivalent ways of representing a choice task
should not change the order in which a rational decision-maker prefers the alterna-
tives in a choice set. Empirically, however, violations of this assumption appear to be
the norm rather than the exception (e.g., Slovic, 1995). Classical examples include
preference reversals (Slovic & Lichtenstein, 1968; Tversky et al., 1990) and framing
effects (Tversky & Kahneman, 1981).
Unlike classical decision analysis, the Brunswikian research tradition has always
held it as a central notion that performance on a decision task simultaneously de-
pends on the characteristics of the task environment and the utilisation of the avail-
able information by the decision-maker (e.g., Brunswik, 1952, 1955; Gigerenzer &
Goldstein, 1996; Hammond, 1966; Hammond & Stewart, 2001; Tucker, 1964). From
this perspective, a surface attribute that characterises the way in which a choice task
is represented is not necessarily an unwanted confounder. Three prototypical cases
can be distinguished:
• Case 1: Noise. If the surface attribute is unrelated to the objective function of
the decision task, it might weaken the performance of a decision-maker but in
an unsystematic manner.
• Case 2: Non-zero cue validity but insufficient cue utilisation. If the surface
attribute is correlated with the objective function but its diagnostic value is not
utilised by the decision-maker, it should leave the performance of the decision-
maker unaffected or, if its cue validity is particularly weak, add noise to the
task.
• Case 3: Non-zero cue validity and sufficient cue utilisation. If the surface at-
tribute is correlated with the objective function and the decision-maker utilises
its diagnostic value, the performance of the decision-maker may even increase
if the surface attribute can substitute for other attributes that are more difficult
to process.
The aim of the research presented here is to investigate how decision-makers learn
to cope with the presence of such a surface attribute and how the efficiency of their
choice processes is moderated by the type and strength of the relationship between
the surface attribute and the objective function of the task. In the four experiments
presented later on, we will utilise a multiple-cue probability learning task. The surface
attribute we are interested in is visual salience, perhaps the most obvious but maybe
also the most important of all surface attributes.

2.1. INTRODUCTION 37
Multiple-cue probability learning
Multiple-cue probability learning (MCPL) is a paradigm for studying how people
learn probabilistic relationships between cues and outcomes (Holzworth, 2001).
MCPL studies have been conducted in numerous contexts, including social judgment,
weather forecasting, medical diagnoses, and decision-making. In MCPL studies,
participants are faced with a series of trials over which they have to judge the value of
a criterion based on a number of cues with varying degrees of validity. The cues can
have positive and negative predictive value for the criterion or can be irrelevant. After
each trial, participants are given feedback about their performance.
One stream of MCPL research has been concerned with the nature of the feedback
that is required for learning. Feedback about the overall performance in a trial ("out-
come feedback"; e.g., correct versus incorrect) mimics learning in many repetitive
real-life decision tasks. The effectiveness of this type of feedback has been debated
extensively and research on the matter has not been fully conclusive (e.g. Klayman,
1988; Newell, Weston, Tunney & Shanks, 2009). Some studies do provide evidence
that learning can be achieved from outcome feedback alone (e.g. Castellan, 1974;
Pachur & Olsson, 2012), and in Karelaia and Hogarth’s meta-analysis of lens model
studies, 2008, the authors conclude that subjects are indeed able to learn from out-
come feedback, provided that the number of cues in the task is relatively low and
the cues are not too correlated. Klayman (1988) finds that subjects can discover new
cues in rather complex and uncertain environments if they are able to structure their
own learning environment, and Nestler, Egloff, Küfner & Back (2012) speculates that
feedback might not lead to major shifts in utilisation but may lead to discovery of
new valid cues.
Another, smaller stream of MCPL research has focused on the effect of irrelevant
information on performance. The general finding is that irrelevant information has a
negative effect on performance, i.e., irrelevant information decreases the utilization of
relevant information. Castellan (1973) found that the effect of irrelevant information
is dependent on the validity of the relevant information and if cue-validity of the
relevant information is high, the effect of irrelevant information is low. Subjects were
also able to improve their performance and ignore irrelevant information, but they
were not able to completely ignore irrelevant information even after many trials.
Edgell, Castellan Jr, Roe, Barnes, Ng, Bright & Ford (1996) found that the effect of
irrelevant information is not due to the irrelevant nature of the information, but
rather due to information overload.
Visual salience as a surface attribute in decision tasks
Although it was Egon Brunswik who coined the term "ecological validity", Brunswikian
researchers rarely considered that the cue values and cue validities in many real-life
decision tasks are systematically related to certain surface attributes (notably, their vi-
38 CHAPTER 2. EFFICIENCY GAINS IN REPEATED BINARY CHOICE
sual salience), very much in the manner of a Stroop task (Stroop, 1935) and that many
people can look back on a long history of learning to utilise these relationships when
they form preferences and make choices. And not just that: in today’s competitive
markets, we see a proliferation of entire functional specialisations that try to exploit
such learned relationships in a systematic manner. Marketing communications is
a good example: marketers try to make attributes on which a product is superior to
its competitors particularly salient on the packages of a consumer product, in the
ads and commercials that try to convince consumers of the product’s virtues. Recent
studies indicate that this is to a certain degree successful: the more the visual salience
of a given attribute is increased over its baseline, the more important the attribute
tends to become in consumer’s product choices (e.g. see Bialkova & van Trijp, 2011;
Milosavljevic, Navalpakkam, Koch & Rangel, 2012; Orquin et al., 2013).
A similar neglect of physical stimulus properties has prevailed in research on
multi-attribute decision-making. Often tasks are presented using numeric represen-
tation of attributes in a matrix layout (e.g. Payne, Bettman & Johnson, 1988). However,
in many real-life situations, information is not presented numerically but visually.
Already in 1971 Hammond found evidence that graphical representations of cues
produce better judgments (Hammond, 1971). His result has largely been overlooked,
and subsequent studies have yielded somewhat less conclusive results regarding
this effect (see Bayindir, Bolger & Say, 2015). Recent work does, however, support
that graphic representation supports learning (Bayindir et al., 2015), and Lurie &
Mason (2007) showed that visualisations may change the way decision-makers col-
lect information. In extreme cases, this can lead to myopic tendencies such that
decision-makers focus on a small and possibly highly biased set of attributes.
Visual salience can be defined as the ability of a visual stimulus to attract the
attention of the viewer. Although it is based on the physical characteristics of the
stimulus object (including its size, colour, brightness and movement), salience is
a perceptual property and therefore subjective. Visual salience captures attention
by making objects "pop-out" in a bottom-up fashion (Theeuwes, 2004; Theeuwes
& Burg, 2011), but it has been shown to interact with task instructions and goals
(Desimone & Duncan, 1995; Itti & Koch, 2001), and it has also been shown that such
top-down factors can completely override the bottom-up effects of visual salience
(Kowler, 2011).
One aspect of visual salience that is often neglected is that the visual salience of
an object can only be defined by the visual properties of the object relative to the
rest of the visual environment. Changing the physical properties of one object in the
visual environment therefore alters the entire saliency distribution and not just the
salience of the object. When visual salience is controlled by one binary feature (e.g.,
high versus low opacity), the properties of each attribute can be defined in terms of
this feature if all other features of the attribute (e.g. colour and shape) can be argued
to be approximately equally salient. In the experiments presented in this article
2.1. INTRODUCTION 39
we argue that the shape-colour combinations used as attributes are approximately
equally salient, and that the only additional feature inducing variation in their visual
salience is the variation in the opacity levels of the shape-colour combinations.
Similar manipulations have been applied in previous research by Bialkova & van Trijp
(2011) and Milosavljevic et al. (2012).
With the present research we seek to contribute to the existing research on MCPL
and multi-attribute decision-making by investigating how different levels of inter-
correlation between the task-irrelevant stimulus characteristics and the relevance of
a cue affects performance. We seek to investigate the effect on initial performance as
well as changes that might occur through repeated exposure to a given task environ-
ment.
The task
Studies that take stimulus characteristics into account to explain decision-making
often use naturalistic stimuli (e.g. Bialkova & van Trijp, 2011; Milosavljevic et al., 2012;
Orquin et al., 2013). This makes the task more realistic and readily applicable, for
example in contexts such as package design. However, such an approach does not
control for the fact that participants may have pre-existing and very well-learned
mental models of the task structure: a strong source of endogeneity.
One aim of the present work was to construct a task in which the relationship
between cue validity and perceptual salience was under full experimental control and
at the same time to construct an inferential choice task that simulated a preferential
choice task. In our approach, participants first had to learn the relationship between
the stimulus objects encoding the attributes and their associated value. The attributes
were represented by colour-shape combinations. Their values were binary (either
zero or one).
Participants first completed a series of learning trials to learn the value of each
attribute. After learning the values of attributes, participants completed a repeated
binary decision task. Each of the two alternatives consisted of six attributes each, and
one alternative was dominant in terms of total attribute value. The visual salience
of the attributes was varied within and between the choice sets, and the correlation
between visual salience and attribute value was varied between treatments (for a
thorough description of task and procedure, see section ”Overview of experimental
procedure” below). The salience-value correlation could be either zero, low and
positive, high and positive, or high and negative.
In many daily decision tasks (e.g., a consumer choice between products on a
product shelf) decision makers strive to be fast while choosing the preferred alter-
native. The definition of efficiency use in the present work is therefore one which
comprises speed and accuracy. We instructed participants to make accurate choices
as fast as possible and they were compensated according to their performance on
40 CHAPTER 2. EFFICIENCY GAINS IN REPEATED BINARY CHOICE
both parameters2.
Predictions
Initial biasing effects of visual salience
Only few studies have been published until now in which the biasing effects of
visual salience on choice behaviour are investigated (Bialkova & van Trijp, 2011;
Milosavljevic et al., 2012; Towal, Mormann & Koch, 2013). They all found that salience
leads to a particular bias in decisions: the more salient the visual representation of
a particular alternative, the higher the likelihood that it will be chosen. However,
salience was manipulated at the alternative level in these studies, and all trials were
pooled in the analysis, neglecting potential learning effects that might have occurred
over the various trials in the respective experiments.
Studies that used multiple-cue probability learning paradigms (MCPL) also found
evidence of salience biases: increasing the salience of valid cues appears to increases
the utilisation of these cues (Edgell & Morrissey, 1992; Edgell, Neace, Harbison &
Brian, 2015; Kruschke & Johansen, 1999) whereas increasing the salience of invalid
cues decreases the utilisation of valid cues (Kruschke & Johansen, 1999). It should
be noted though that other authors could not reproduce the latter finding (Edgell &
Morrissey, 1992) and suggested that the original finding may actually have reflected
an increase in task complexity (Castellan, 1973; Edgell et al., 1996). Based on the
findings in the decision-making and MCPL literature, we expect that visually salient
attributes will bias decisions in such a way that the probability of making the correct
choice in initial trials strongly depends on the correlation between the salience and
the value of attributes. The following hypothesis can be derived:
H1.1: The higher the correlation of salience and value, the higher the choice accuracy.
Even though previous research on the effect of salient invalid cues on performance
has been inconclusive (Edgell & Morrissey, 1992; Kruschke & Johansen, 1999) we
expect that accuracy will be negatively affected in situations where invalid cues are
more salient than valid cues. Assuming that a visually salient object has a higher
likelihood of capturing attention regardless of its task relevance (Theeuwes, 2004;
Theeuwes & Burg, 2011), salience will have a negative biasing effect on attention to
objects which are not salient, i.e., the likelihood of attending a valid cue will be low if
valid cues has low salience. The following hypothesis is therefore derived:
H1.2: When correlation is negative, the effect is reverse, i.e., negative correlation leads
to lower choice accuracy.
2Participants were payed a fixed sum (approximately 4e) for their participation in the experimentand on top of that they could earn an extra 0.1e per choice trial if the choice was correct and faster than2.5 sec. They received feedback on their performance after each trial
2.1. INTRODUCTION 41
Research has so far mainly been interested in the effects of salience on choice
accuracy. However, when the goal is not only accuracy but efficiency, measures of
decision speed (or reaction time) are of equal importance. We expect that reaction
time will be affected by the correlation between salience and value in a similar manner
as choice accuracy:
H2.1: The higher the correlation of salience and value, the lower reaction time, i.e.,
high correlation leads to faster decisions.
H2.2: When correlation is negative, the effect is reverse, i.e., negative correlation leads
to slower decisions.
A subject’s overt visual attention can be seen as the mediating process that may
lead to biased choice behaviour. Previous research on visual attention in decision-
making has found that participants fixate more on visually salient information
(Bialkova & van Trijp, 2011; Milosavljevic et al., 2012; Towal et al., 2013), consistent
with most cognitive models of visual attention that posit that attention is (partially)
guided by the visual features of the stimuli, for example feature integration theory
(Treisman & Sato, 1990) and Guided Search (Wolfe, Cave & Franzel, 1989; Wolfe, 1994).
We therefore expect to observe the following:
H3: More fixations initially on visually salient attributes regardless of the value of
attributes.
Learning effects and debiasing
Most research on the effects of visual salience on performance takes (often indirectly)
a static or stable view. We are not aware of any studies in which the stability of the
effect was actually analysed over the repetitions of a repeated choice task. There
is good reason to believe that the effect of salience will actually change over such
repetitions.
In studies that exposed decison-makers to many repetitions of the same type of
decision task, reaction time tends to decrease (Meißner & Decker, 2010; Meißner
et al., 2016), decision accuracy tends to increase (Meißner et al., 2016; Orquin et al.,
2013; Payne et al., 1988), and decision-makers tend to use decreasing amounts of
information to make their decisions (Bialkova & van Trijp, 2011; Payne et al., 1988).
The simultaneous increase in accuracy and decrease in reaction time and information
use show that decision-makers increase their efficiency through repeated exposure
to a task, and this efficiency can be explained by changes in the attention process
(Orquin et al., 2013). It is, however, still unclear how the attention process is altered
through learning and under which conditions this efficiency increase can occur.
There is an ongoing debate about early filtering and late inhibition models of
attention which has been articulated for decades. Early filtering models propose
that available information is filtered pre-perceptually and only relevant information
42 CHAPTER 2. EFFICIENCY GAINS IN REPEATED BINARY CHOICE
is selected for further processing, whereas late inhibition models assume that all
information is perceptually selected and selection is performed at a later stage before
entering short-term memory. In this sense early filtering is a rapid process whereas
late inhibition is slow. Broadbent (1958) advocated the view of early filtering whereas
Deutsch & Deutsch (1963) and Norman (1968) argued for late inhibition (for a review
see Friedenberg & Silverman, 2011). Advocates of other models, for example the
multimode model of attention (Johnston & Heinz, 1978) and the perceptual load
theory (Lavie & Tsal, 1994), have made an attempt to merge the two views by arguing
that selection can be both early and late depending on the needs of the subject or the
perceptual load inflicted by the task.
Efficiency gains can be explained by one of the two modes and each mode would
lead to different predictions regarding how salience interferes. If participants are able
to become more accurate on the basis of change by early filtering of the stimuli, the
effects would only be present if salience-value correlation is non-zero (and possibly
also high for the effect to be detectable), however, if changes should be based on the
notion of late inhibition of information, there will not be a difference between the
different salience-value correlations. As visual salience is operationalised as a low
level feature, it is likely that selection will occur pre-perceptually through a change
in the weighting features as proposed by Guided Search, for instance. If changes
in choice accuracy are an effect caused by changes in early filtering, the following
hypothesis should be true:
H4: Accuracy will increase if visual salience carries task-relevant information, that
is, in experiments with a non-zero salience-value-correlation.
Reaction time could decrease on the basis of both early and late selection, though.
In the case of late selection there should not be a difference between different salience-
value correlations, whereas in the case of early selection the decrease should depend
on the salience-value correlation: the larger the salience-value correlation, the larger
the decrease.
H5: Participants will become faster especially in the high correlation experiments.
Haider & Frensch (1999) argue that efficiency gains can be explained by percep-
tual filtering of redundant information. They had participants evaluate alphabetic
strings under different conditions and found that participants learned to attend
task-relevant information and to ignore task-redundant information at the percep-
tual level. Research on expertise supports this idea: experts, as compared to novices,
have shorter times-to-first-fixation on relevant information, more fixations on task-
relevant information and fewer fixations on task-irrelevant information (for a review
see Gegenfurtner, Lehtinen & Säljö, 2011). It is still uncertain how this change occurs,
that is, how people become better at directing their attention to task-relevant infor-
mation. One explanation could be that people change the weighting of specific visual
2.2. OVERVIEW OF EXPERIMENTAL PROCEDURE 43
features after learning the relevance of these features. That would have the impli-
cation that efficiency should only increase if a task-relevant visual feature actually
exists. We therefore expect that choice efficiency will only increase in experiments
with non-zero salience-value correlation:
H6: Assuming that H3 holds, the effect of salience on attention should not decrease
as long as the salience-value correlation remains positive. However, in the
case of a zero or negative correlation, the effect of salience on attention will
decrease.
2.2 Overview of experimental procedure
In the following section the experimental procedure and the statistical modelling
approach will be described. Afterwards, each experimental treatment will first be
analysed separately and then integrated with the others in a cross-treatment analysis.
Stimuli
The experimental stimuli consisted of 16 attributes that were used to generate choice
alternatives. The attributes were constructed as combinations of four polygon shapes
(triangle, square, rhombus and pentagon) and four colours (red, blue, yellow and
green). Each of these sixteen attributes was associated with a specific value (one or
zero). Six were randomly assigned the value one and ten were assigned the value
zero, with the restriction that the value had to be uncorrelated with colour and shape
in order to make attention deployment based on either single feature impossible.
The total number of attributes was chosen based on a pilot study that showed that
participants were able to learn the value of sixteen attributes within the time frame
of this experiment. Visual salience was manipulated by varying the opacity level of
the attributes (0.2 or 1), that is, an attribute could either have high or low salience.
The statistical design was varied between the experimental treatments by ma-
nipulating the correlation between value and salience, thereby changing the task-
relevance of visual salience. Table 2.1 shows the statistical design of the different treat-
ments and the associated salience-value correlations. In Treatment 1 the correlation
between salience and value was 0. Here, salience did not provide any task-relevant
information to the participants. The salience-value correlation in Treatment 2 was
.258. Salience provided task-relevant information but had low diagnostic value. In
Treatment 3, the correlation was .775. Here, salience provided task-relevant infor-
mation and also had high diagnostic value. In Treatment 4, this was reversed: the
correlation had the same absolute value as in Treatment 3 but was negative (-.775).
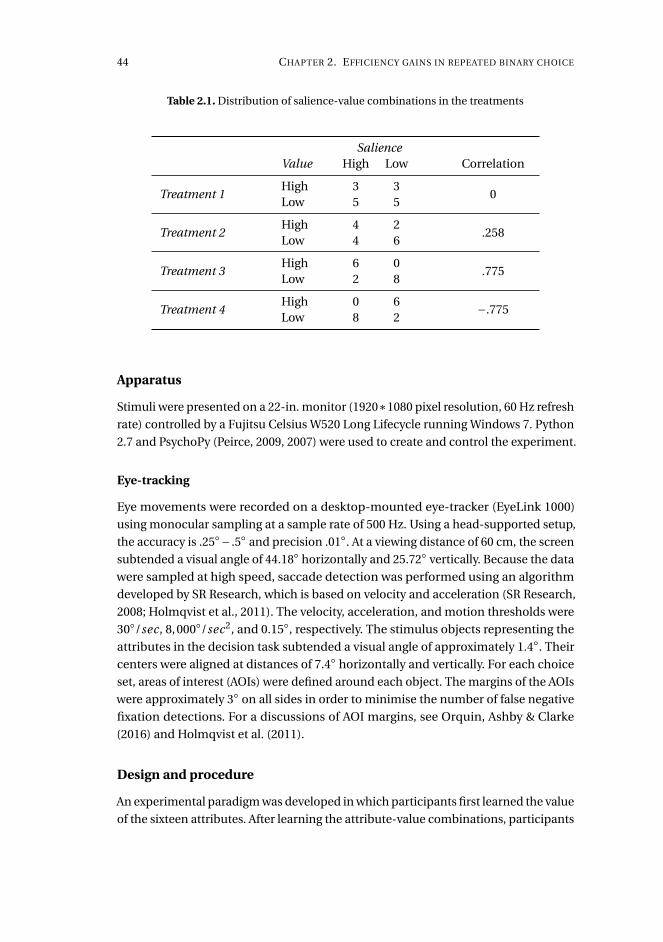
44 CHAPTER 2. EFFICIENCY GAINS IN REPEATED BINARY CHOICE
Table 2.1. Distribution of salience-value combinations in the treatments
SalienceValue High Low Correlation
Treatment 1High 3 3
0Low 5 5
Treatment 2High 4 2
.258Low 4 6
Treatment 3High 6 0
.775Low 2 8
Treatment 4High 0 6 −.775Low 8 2
Apparatus
Stimuli were presented on a 22-in. monitor (1920∗1080 pixel resolution, 60 Hz refresh
rate) controlled by a Fujitsu Celsius W520 Long Lifecycle running Windows 7. Python
2.7 and PsychoPy (Peirce, 2009, 2007) were used to create and control the experiment.
Eye-tracking
Eye movements were recorded on a desktop-mounted eye-tracker (EyeLink 1000)
using monocular sampling at a sample rate of 500 Hz. Using a head-supported setup,
the accuracy is .25◦− .5◦ and precision .01◦. At a viewing distance of 60 cm, the screen
subtended a visual angle of 44.18◦ horizontally and 25.72◦ vertically. Because the data
were sampled at high speed, saccade detection was performed using an algorithm
developed by SR Research, which is based on velocity and acceleration (SR Research,
2008; Holmqvist et al., 2011). The velocity, acceleration, and motion thresholds were
30◦/sec, 8,000◦/sec2, and 0.15◦, respectively. The stimulus objects representing the
attributes in the decision task subtended a visual angle of approximately 1.4◦. Their
centers were aligned at distances of 7.4◦ horizontally and vertically. For each choice
set, areas of interest (AOIs) were defined around each object. The margins of the AOIs
were approximately 3◦ on all sides in order to minimise the number of false negative
fixation detections. For a discussions of AOI margins, see Orquin, Ashby & Clarke
(2016) and Holmqvist et al. (2011).
Design and procedure
An experimental paradigm was developed in which participants first learned the value
of the sixteen attributes. After learning the attribute-value combinations, participants
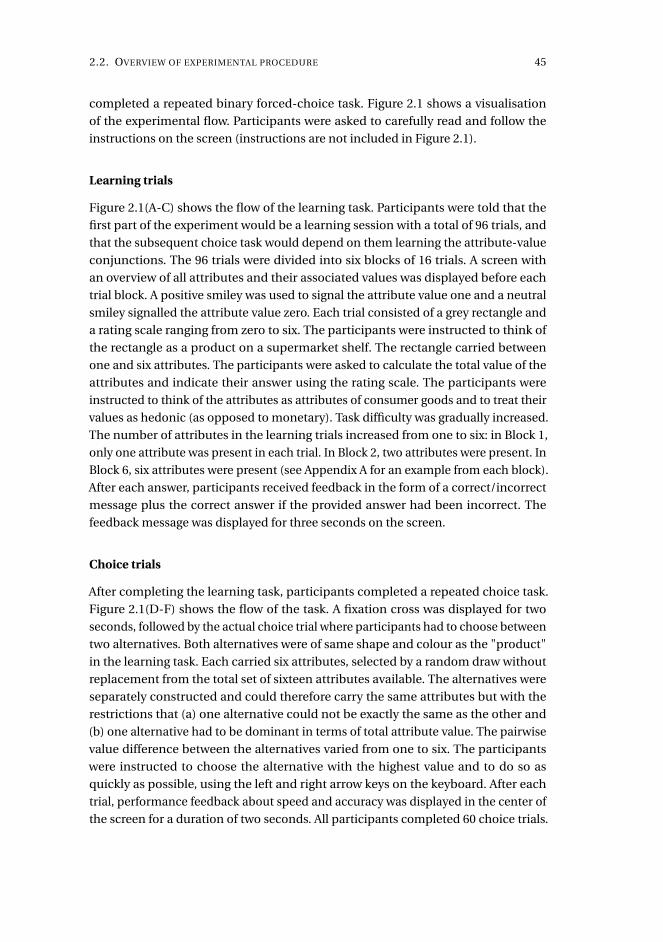
2.2. OVERVIEW OF EXPERIMENTAL PROCEDURE 45
completed a repeated binary forced-choice task. Figure 2.1 shows a visualisation
of the experimental flow. Participants were asked to carefully read and follow the
instructions on the screen (instructions are not included in Figure 2.1).
Learning trials
Figure 2.1(A-C) shows the flow of the learning task. Participants were told that the
first part of the experiment would be a learning session with a total of 96 trials, and
that the subsequent choice task would depend on them learning the attribute-value
conjunctions. The 96 trials were divided into six blocks of 16 trials. A screen with
an overview of all attributes and their associated values was displayed before each
trial block. A positive smiley was used to signal the attribute value one and a neutral
smiley signalled the attribute value zero. Each trial consisted of a grey rectangle and
a rating scale ranging from zero to six. The participants were instructed to think of
the rectangle as a product on a supermarket shelf. The rectangle carried between
one and six attributes. The participants were asked to calculate the total value of the
attributes and indicate their answer using the rating scale. The participants were
instructed to think of the attributes as attributes of consumer goods and to treat their
values as hedonic (as opposed to monetary). Task difficulty was gradually increased.
The number of attributes in the learning trials increased from one to six: in Block 1,
only one attribute was present in each trial. In Block 2, two attributes were present. In
Block 6, six attributes were present (see Appendix A for an example from each block).
After each answer, participants received feedback in the form of a correct/incorrect
message plus the correct answer if the provided answer had been incorrect. The
feedback message was displayed for three seconds on the screen.
Choice trials
After completing the learning task, participants completed a repeated choice task.
Figure 2.1(D-F) shows the flow of the task. A fixation cross was displayed for two
seconds, followed by the actual choice trial where participants had to choose between
two alternatives. Both alternatives were of same shape and colour as the "product"
in the learning task. Each carried six attributes, selected by a random draw without
replacement from the total set of sixteen attributes available. The alternatives were
separately constructed and could therefore carry the same attributes but with the
restrictions that (a) one alternative could not be exactly the same as the other and
(b) one alternative had to be dominant in terms of total attribute value. The pairwise
value difference between the alternatives varied from one to six. The participants
were instructed to choose the alternative with the highest value and to do so as
quickly as possible, using the left and right arrow keys on the keyboard. After each
trial, performance feedback about speed and accuracy was displayed in the center of
the screen for a duration of two seconds. All participants completed 60 choice trials.
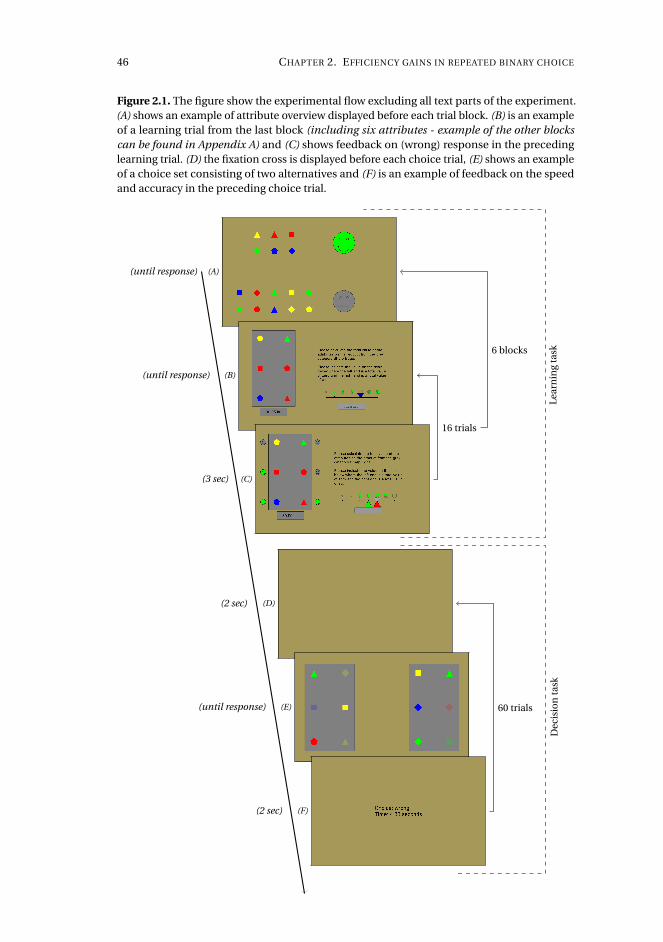
46 CHAPTER 2. EFFICIENCY GAINS IN REPEATED BINARY CHOICE
Figure 2.1. The figure show the experimental flow excluding all text parts of the experiment.(A) shows an example of attribute overview displayed before each trial block. (B) is an exampleof a learning trial from the last block (including six attributes - example of the other blockscan be found in Appendix A) and (C) shows feedback on (wrong) response in the precedinglearning trial. (D) the fixation cross is displayed before each choice trial, (E) shows an exampleof a choice set consisting of two alternatives and (F) is an example of feedback on the speedand accuracy in the preceding choice trial.
Lear
nin
gta
skD
ecis
ion
task
16 trials
6 blocks
60 trials
(until response)
(until response)
(3 sec)
(2 sec)
(until response)
(2 sec)
(A)
(B)
(C)
(D)
(E)
(F)
2.2. OVERVIEW OF EXPERIMENTAL PROCEDURE 47
The opacity level of the attributes was varied as a manipulation of salience, with
opacity levels of 20% and 100% for low-salience and high-salience attributes, respec-
tively. The four treatments varied in terms of the correlation between the salience
and the value of the attributes (no correlation, positive correlation, highly positive
correlation and highly negative correlation). The statistical designs and correlations
are shown in Table 2.1.
Statistical modelling approach
The data from the four experimental treatments was analysed both separately and
combined to account for complexity and non-linearity which would not be captured
in a cross-treatment analysis alone. Three relevant measures were used to test the
hypothesis of the experiment (see Predictions): choice accuracy, reaction time, and vi-
sual attention. Choice accuracy and reaction time were both measured on alternative
level (i.e. the alternatives being the lowest level of analysis) whereas visual attention
was measured on attribute level (i.e. attributes being the lowest level of analysis).
The statistical computing environment R (R Core Team, 2015) was used for pro-
cessing and analysing the data. All models were fitted using the "lme4" package
(Bates, Mächler, Bolker & Walker, 2015). Tables were generated using the "texreg"
package (Leifeld, 2013)and graphical visualisations were created using the "ggplot2"
package (Wickham, 2009).
Choice accuracy
The probability that a participant correctly chose the dominant alternative was mod-
elled by means of a generalised linear mixed model (GLMM) with a binomial response
distribution and a logit link function. The dependent variable (accuracy) took the
value one if the chosen alternative was the dominant one, and zero if not. Two inde-
pendent variables were included in the model: the value difference between the two
alternatives involved in the choice set in question (ranging from one to six) and trial
order (ranging from one to sixty). Value difference was not of direct interest but it was
included as a covariate to account for possible confounding effects. Trial order was
transformed using a power function to account for non-linearities in the learning
patterns.
The fixed-effects model included both main effects and all interactions of the
independent variables, i.e., the full model. A "step-up" procedure was applied to find
the best-fitting specification for the random part of the model. In the baseline model,
only a random intercept for participant was included. After that, random effects were
added. AIC and BIC were used as selection criteria. In situations where there was not
agreement between the two, the principle of complexity reduction was applied and
the most conservative criterion (BIC) was used for selection.

48 CHAPTER 2. EFFICIENCY GAINS IN REPEATED BINARY CHOICE
Choice accuracy models were estimated separately for each treatment and the
results of these models were subsequently used in a cross-treatment analysis to test
Hypothesis 1.1, 1.2, and 4.
Reaction time
Reaction time was measured as the time from stimulus onset until the participant
pressed the key that indicated the choice. Reaction time was modelled using a linear
mixed model (LMM) with the same independent variables as in the analysis of choice
accuracy (value difference and trial order). Again, the fixed part of the model included
main effects as well as all interactions of the independent variables, and the best
specification for the random part was chosen based on the "step-up" procedure
outlined above.
Reaction time models were estimated separately for each treatment and the
results of these models were subsequently used in a cross-treatment analysis to test
Hypothesis 2.1, 2.2, and 5.
Attention
Attention can be either overt or covert. Overt attention occurs when the stimulus
is caught by the fovea where the sensory neurons of the eye have a high density.
The high density serves to enhance visual processing. In contrast, covert attention
occurs when the object of attention is not in fovea (i.e. you look at one object while
attending to another). A typical assumption when dealing with visual attention and
eye-tracking is the eye-mind assumption. This assumption suggests that fixation on
stimulus is directly related to the processing of the stimulus (Just & Carpenter, 1980),
that is, assuming that attention is overt. The eye-mind assumption has been shown
to hold (Hoffman & Subramaniam, 1995; Posner, 1980) and covert attention normally
only occurs prior to a saccade, when attention shifts to a new location (Shepherd,
Findlay & Hockey, 1986). The use of eye-tracking in decision-making provides a
great measure of information processing by inducing very few constraints on the
participant compared to other process tracing tools (e.g., think aloud, information
search displays). Eye-tracking as process tracing tool has been strongly advocated
(Bialkova & van Trijp, 2011; Glaholt & Reingold, 2011).
The likelihood of attending an attribute was modelled by means of a GLMM with
a binomial response distribution and a logit link function. The dependent variable
(selection) was constructed such that, if an object was fixated within the time-course
of a trial, the value was one and zero otherwise. Three independent variables were
included in the model: the salience of the object representing the attribute in question
(experimentally controlled opacity level of 0.2 or 1), the value of the attribute (zero or
one) and trial order (from one to sixty). Trial order was transformed using a power
function to account for non-linearities in the learning patterns. The fixed part of the
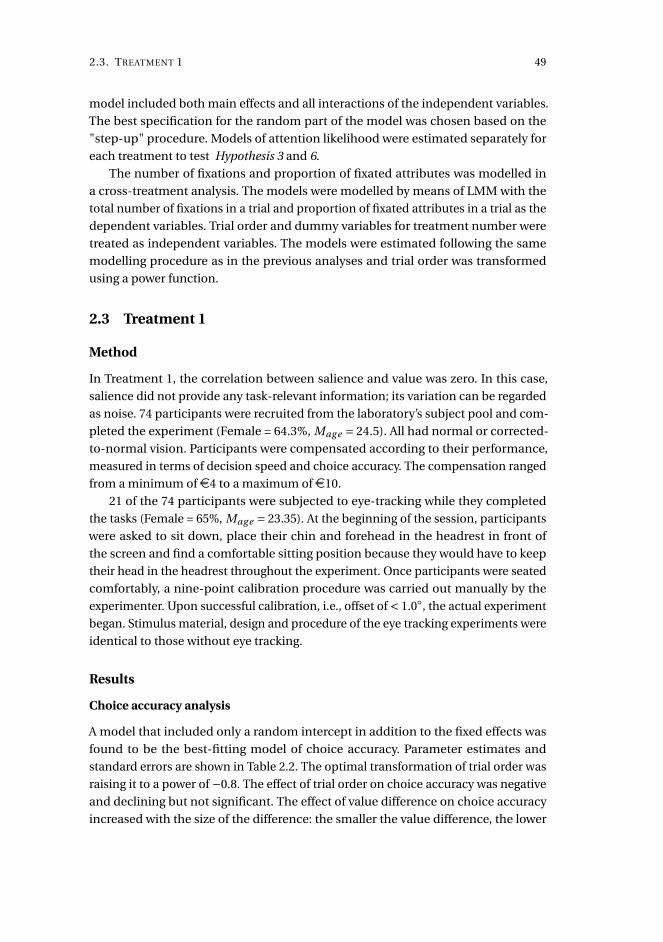
2.3. TREATMENT 1 49
model included both main effects and all interactions of the independent variables.
The best specification for the random part of the model was chosen based on the
"step-up" procedure. Models of attention likelihood were estimated separately for
each treatment to test Hypothesis 3 and 6.
The number of fixations and proportion of fixated attributes was modelled in
a cross-treatment analysis. The models were modelled by means of LMM with the
total number of fixations in a trial and proportion of fixated attributes in a trial as the
dependent variables. Trial order and dummy variables for treatment number were
treated as independent variables. The models were estimated following the same
modelling procedure as in the previous analyses and trial order was transformed
using a power function.
2.3 Treatment 1
Method
In Treatment 1, the correlation between salience and value was zero. In this case,
salience did not provide any task-relevant information; its variation can be regarded
as noise. 74 participants were recruited from the laboratory’s subject pool and com-
pleted the experiment (Female = 64.3%, Mag e = 24.5). All had normal or corrected-
to-normal vision. Participants were compensated according to their performance,
measured in terms of decision speed and choice accuracy. The compensation ranged
from a minimum ofe4 to a maximum ofe10.
21 of the 74 participants were subjected to eye-tracking while they completed
the tasks (Female = 65%, Mag e = 23.35). At the beginning of the session, participants
were asked to sit down, place their chin and forehead in the headrest in front of
the screen and find a comfortable sitting position because they would have to keep
their head in the headrest throughout the experiment. Once participants were seated
comfortably, a nine-point calibration procedure was carried out manually by the
experimenter. Upon successful calibration, i.e., offset of < 1.0◦, the actual experiment
began. Stimulus material, design and procedure of the eye tracking experiments were
identical to those without eye tracking.
Results
Choice accuracy analysis
A model that included only a random intercept in addition to the fixed effects was
found to be the best-fitting model of choice accuracy. Parameter estimates and
standard errors are shown in Table 2.2. The optimal transformation of trial order was
raising it to a power of −0.8. The effect of trial order on choice accuracy was negative
and declining but not significant. The effect of value difference on choice accuracy
increased with the size of the difference: the smaller the value difference, the lower
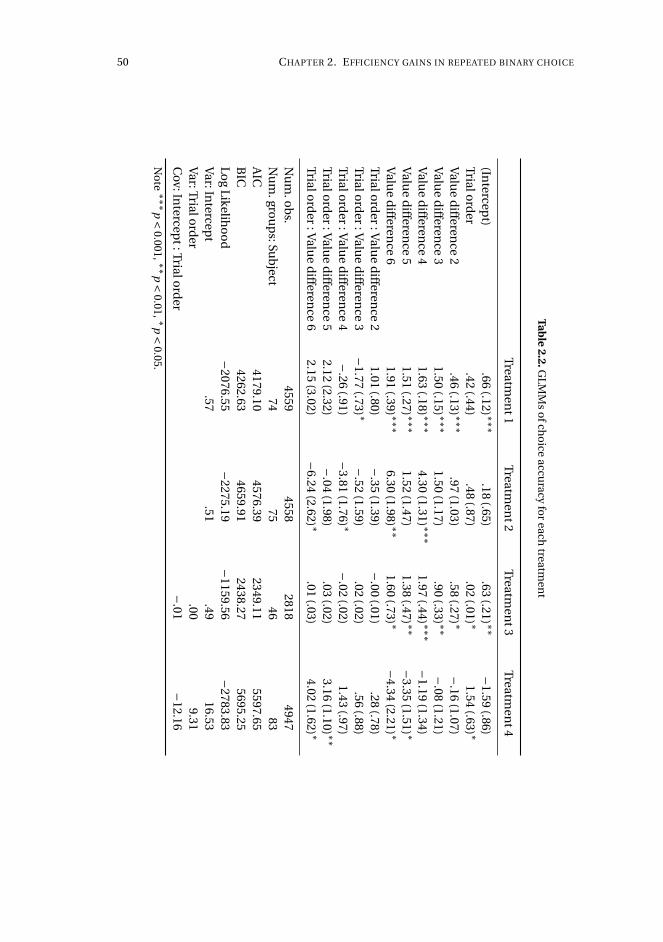
50 CHAPTER 2. EFFICIENCY GAINS IN REPEATED BINARY CHOICE
Table
2.2.GLM
Ms
ofch
oice
accuracy
for
eachtreatm
ent
Treatmen
t1Treatm
ent2
Treatmen
t3Treatm
ent4
(Intercep
t).66
(.12) ∗∗∗.18
(.65).63
(.21) ∗∗−
1.59(.86)
Trialord
er.42
(.44).48
(.87).02
(.01) ∗1.54
(.63) ∗V
alue
differen
ce2
.46(.13) ∗∗∗
.97(1.03)
.58(.27) ∗
−.16
(1.07)V
alue
differen
ce3
1.50(.15) ∗∗∗
1.50(1.17)
.90(.33) ∗∗
−.08
(1.21)V
alue
differen
ce4
1.63(.18) ∗∗∗
4.30(1.31) ∗∗∗
1.97(.44) ∗∗∗
−1.19
(1.34)V
alue
differen
ce5
1.51(.27) ∗∗∗
1.52(1.47)
1.38(.47) ∗∗
−3.35
(1.51) ∗V
alue
differen
ce6
1.91(.39) ∗∗∗
6.30(1.98) ∗∗
1.60(.73) ∗
−4.34
(2.21) ∗Trialo
rder
:Valu
ed
ifference
21.01
(.80)−
.35(1.39)
−.00
(.01).28
(.78)Trialo
rder
:Valu
ed
ifference
3−
1.77(.73) ∗
−.52
(1.59).02
(.02).56
(.88)Trialo
rder
:Valu
ed
ifference
4−
.26(.91)
−3.81
(1.76) ∗−
.02(.02)
1.43(.97)
Trialord
er:V
alue
differen
ce5
2.12(2.32)
−.04
(1.98).03
(.02)3.16
(1.10) ∗∗Trialo
rder
:Valu
ed
ifference
62.15
(3.02)−
6.24(2.62) ∗
.01(.03)
4.02(1.62) ∗
Nu
m.o
bs.
45594558
28184947
Nu
m.gro
up
s:Sub
ject74
7546
83A
IC4179.10
4576.392349.11
5597.65B
IC4262.63
4659.912438.27
5695.25Lo
gLikelih
oo
d−
2076.55−
2275.19−
1159.56−
2783.83V
ar:Intercep
t.57
.51.49
16.53V
ar:Trialord
er.00
9.31C
ov:Intercep
t:Trialord
er−
.01−
12.16
No
te ∗∗∗p<
0.001, ∗∗p<
0.01, ∗p<
0.05.
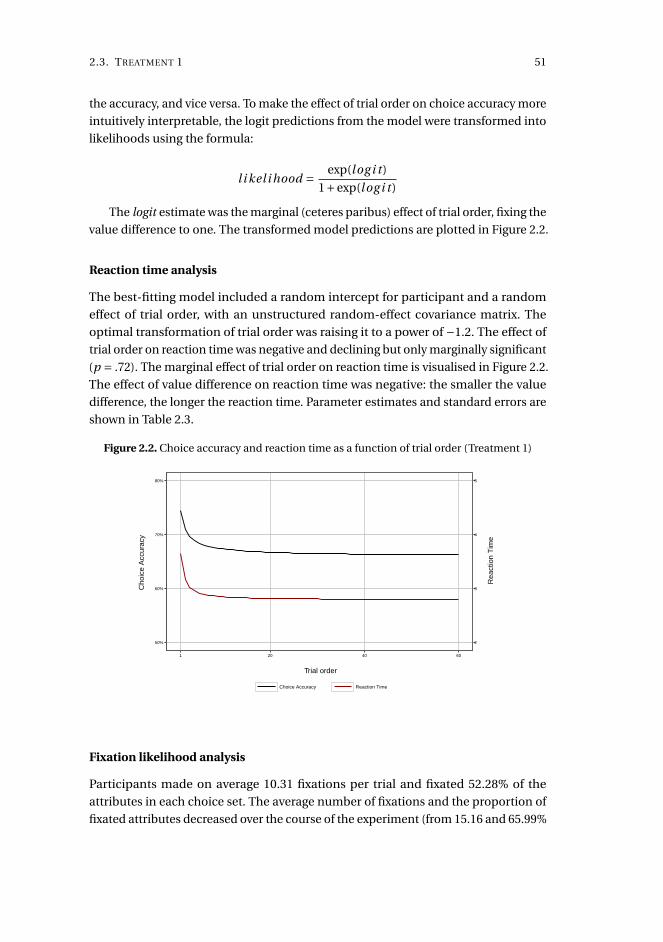
2.3. TREATMENT 1 51
the accuracy, and vice versa. To make the effect of trial order on choice accuracy more
intuitively interpretable, the logit predictions from the model were transformed into
likelihoods using the formula:
l i kel i hood = exp(l og i t )
1+exp(l og i t )
The logit estimate was the marginal (ceteres paribus) effect of trial order, fixing the
value difference to one. The transformed model predictions are plotted in Figure 2.2.
Reaction time analysis
The best-fitting model included a random intercept for participant and a random
effect of trial order, with an unstructured random-effect covariance matrix. The
optimal transformation of trial order was raising it to a power of −1.2. The effect of
trial order on reaction time was negative and declining but only marginally significant
(p = .72). The marginal effect of trial order on reaction time is visualised in Figure 2.2.
The effect of value difference on reaction time was negative: the smaller the value
difference, the longer the reaction time. Parameter estimates and standard errors are
shown in Table 2.3.
Figure 2.2. Choice accuracy and reaction time as a function of trial order (Treatment 1)
50%
60%
70%
80%
1 20 40 60
Trial order
Cho
ice
Acc
urac
y
Choice Accuracy Reaction Time
2
3
4
5
Rea
ctio
n T
ime
Fixation likelihood analysis
Participants made on average 10.31 fixations per trial and fixated 52.28% of the
attributes in each choice set. The average number of fixations and the proportion of
fixated attributes decreased over the course of the experiment (from 15.16 and 65.99%

52 CHAPTER 2. EFFICIENCY GAINS IN REPEATED BINARY CHOICE
Table
2.3.LMM
so
freaction
time
for
eachtreatm
ent
Treatmen
t1Treatm
ent2
Treatmen
t3Treatm
ent4
(Intercep
t)2.79
(.17) ∗∗∗2.60
(.17) ∗∗∗2.38
(.19) ∗∗∗3.02
(.27) ∗∗∗Trialo
rder
.86(.48)
.84(.47)
2.19(.47) ∗∗∗
2.24(.50) ∗∗∗
Valu
ed
ifference
2−
.16(.06) ∗∗
−.16
(.05) ∗∗−
.22(.09) ∗
−.20
(.06) ∗∗∗V
alue
differen
ce3
−.37
(.07) ∗∗∗−
.21(.05) ∗∗∗
−.62
(.09) ∗∗∗−
.23(.06) ∗∗∗
Valu
ed
ifference
4−
.50(.07) ∗∗∗
−.41
(.06) ∗∗∗−
.76(.10) ∗∗∗
−.39
(.07) ∗∗∗V
alue
differen
ce5
−.73
(.09) ∗∗∗−
.54(.07) ∗∗∗
−.82
(.11) ∗∗∗−
.48(.08) ∗∗∗
Valu
ed
ifference
6−
.72(.11) ∗∗∗
−.49
(.09) ∗∗∗−
.83(.17) ∗∗∗
−.61
(.11) ∗∗∗Trialo
rder
:Valu
ed
ifference
2.11
(.57).01
(.70)−
.31(.48)
.15(.55)
Trialord
er:V
alue
differen
ce3
.10(.64)
−.69
(.78)1.32
(.47) ∗∗−
.37(.62)
Trialord
er:V
alue
differen
ce4
−.28
(.62)−
.28(.77)
1.14(.55) ∗
1.05(.70)
Trialord
er:V
alue
differen
ce5
.61(.85)
−.37
(.81).61
(.57).81
(.66)Trialo
rder
:Valu
ed
ifference
6−
.59(.86)
−.05
(1.07)−
.65(1.10)
−.94
(1.23)
Nu
m.o
bs.
45594558
28184947
Nu
m.gro
up
s:Sub
ject74
7546
83A
IC16218.31
14883.549066.91
17680.92B
IC16321.11
14986.349162.02
17785.02Lo
gLikelih
oo
d−
8093.15−
7425.77−
4517.46−
8824.46V
ar:Intercep
t2.06
2.071.58
5.76V
ar:Trialord
er6.55
3.336.33
10.90C
ov:Intercep
t:Trialord
er−
.11.06
.12−
1.00V
ar:Resid
ual
1.851.38
1.301.84
No
te ∗∗∗p<
0.001, ∗∗p<
0.01, ∗p<
0.05.
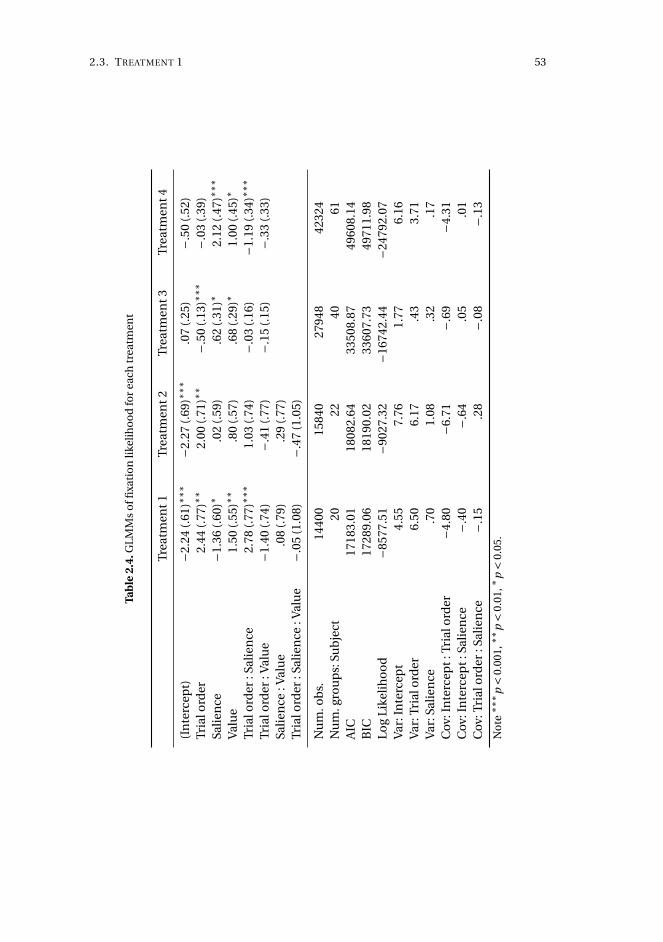
2.3. TREATMENT 1 53
Tab
le2.
4.G
LMM
so
ffixa
tio
nli
keli
ho
od
for
each
trea
tmen
t
Trea
tmen
t1Tr
eatm
ent2
Trea
tmen
t3Tr
eatm
ent4
(In
terc
ept)
−2.2
4(.
61)∗
∗∗−2
.27
(.69
)∗∗∗
.07
(.25
)−.
50(.
52)
Tria
lord
er2.
44(.
77)∗
∗2.
00(.
71)∗
∗−.
50(.
13)∗
∗∗−.
03(.
39)
Salie
nce
−1.3
6(.
60)∗
.02
(.59
).6
2(.
31)∗
2.12
(.47
)∗∗∗
Val
ue
1.50
(.55
)∗∗
.80
(.57
).6
8(.
29)∗
1.00
(.45
)∗Tr
ialo
rder
:Sal
ien
ce2.
78(.
77)∗
∗∗1.
03(.
74)
−.03
(.16
)−1
.19
(.34
)∗∗∗
Tria
lord
er:V
alu
e−1
.40
(.74
)−.
41(.
77)
−.15
(.15
)−.
33(.
33)
Salie
nce
:Val
ue
.08
(.79
).2
9(.
77)
Tria
lord
er:S
alie
nce
:Val
ue
−.05
(1.0
8)−.
47(1
.05)
Nu
m.o
bs.
1440
015
840
2794
842
324
Nu
m.g
rou
ps:
Sub
ject
2022
4061
AIC
1718
3.01
1808
2.64
3350
8.87
4960
8.14
BIC
1728
9.06
1819
0.02
3360
7.73
4971
1.98
Log
Like
lih
oo
d−8
577.
51−9
027.
32−1
6742
.44
−247
92.0
7V
ar:I
nte
rcep
t4.
557.
761.
776.
16V
ar:T
rial
ord
er6.
506.
17.4
33.
71V
ar:S
alie
nce
.70
1.08
.32
.17
Cov
:In
terc
ept:
Tria
lord
er−4
.80
−6.7
1−.
69−4
.31
Cov
:In
terc
ept:
Salie
nce
−.40
−.64
.05
.01
Cov
:Tri
alo
rder
:Sal
ien
ce−.
15.2
8−.
08−.
13
No
te∗∗
∗ p<
0.00
1,∗∗
p<
0.01
,∗p<
0.05
.

54 CHAPTER 2. EFFICIENCY GAINS IN REPEATED BINARY CHOICE
at the beginning of the experiment to 8.61 and 47.47% at the end of the experiment,
respectively).
The best-fitting model included a random intercept for participant and additional
random effects of trial order and salience, with an unstructured random-effect co-
variance matrix. The optimal transformation of trial order was raising it to a power
of −0.1. All main effects and the interaction effect of trial order and salience were
significant (see Table 2.4). The model showed a positive effect of value difference
and a negative effect of salience on fixation likelihood. The model also showed that
trial order had a decreasing effect on fixation likelihood, and that this effect was
moderated by salience. Predicted logits were transformed into likelihoods, using
the same transformation as applied in the choice accuracy analysis. The effects are
plotted in Figure 2.3.
Figure 2.3. Fixation likelihood as a function of trial order, attribute salience and attribute value(Treatment 1)
30%
40%
50%
60%
70%
80%
90%
1 20 40 60
Trial order
Fix
atio
n lik
elih
ood
Opacity High Low Value High Low
Discussion
The results of treatment 1 show that trial order had only a marginally significant effect
on reaction time and no effect at all on choice accuracy. Participants did become
slightly faster, but they did not improve the accuracy of their choices over the course of
the experiment. Note that, in this experiment, the salience of the attributes had been
unrelated to the values of the attributes. Apparently, adding this "noise component"
to the decision task prevented participants from increasing their choice efficiency
over the 60 test trials despite the feedback that was provided immediately after each
trial.
The results of the analysis of the eye tracking data clearly show that participants
attended to decreasing amounts of information over the course of the experiment.

2.4. TREATMENT 2 55
This was the case for the total number of fixations on attributes as well as for the
proportion of attributes that were fixated. These results are consistent with previous
results by Bialkova & van Trijp (2011) and Payne et al. (1988) who found that decision-
makers use decreasing amounts of information to form their decisions when they
are repeatedly exposed to the same type of choice task. The results of the experiment
also show that the effect of salience on fixation likelihood was initially positive but
that it decreased over the course of the experiment. This suggests that participants
were indeed initially affected by the visual characteristics of the task environment but
that they gradually learned that the visual salience of the attributes did not actually
provide any task-relevant information. To some degree, participants appear to be able
to inhibit or override the effect of visual salience on their attention. The decrease in
sampled information could be driven by such a change in attention control processes.
2.4 Treatment 2
Method
In treatment 2, the correlation between salience and value was .258. Salience did pro-
vide task-relevant information but, as a cue, had relatively low validity. 75 participants
were recruited from the laboratory’s subject pool and completed the experiment (Fe-
male = 57.7%, Mag e = 24.66). 22 of the 75 participants were subjected to eye-tracking
while they completed the tasks (Female = 59.1 %, Mag e = 25.22). Participants were
instructed as in treatment 1. All had normal or corrected-to-normal vision and were
compensated in the same way as in the previous experiments.
Results
Choice accuracy analysis
The best-fitting choice accuracy model included only a random intercept for par-
ticipants. The optimal transformation of trial order was raising it to the power −0.1.
The effect of trial order on choice accuracy was negative and declining but not sig-
nificant (see Figure 2.4). The effect of value difference on choice accuracy generally
increased with the size of the difference. However, the interaction effect did not reach
significance either. Parameter estimates and standard errors are shown in Table 2.2.
Reaction time analysis
The best-fitting reaction time model included a random intercept for participants and
a random slope for trial order (see Table 2.3). The optimal transformation of trial was
raising it to a power of −3.3. The effect of trial order on reaction time was negative and
declining, but like in treatment1 the effect was only marginally significant (p = .71).
The marginal effect of trial order on reaction time is plotted in Figure 2.4. The effect
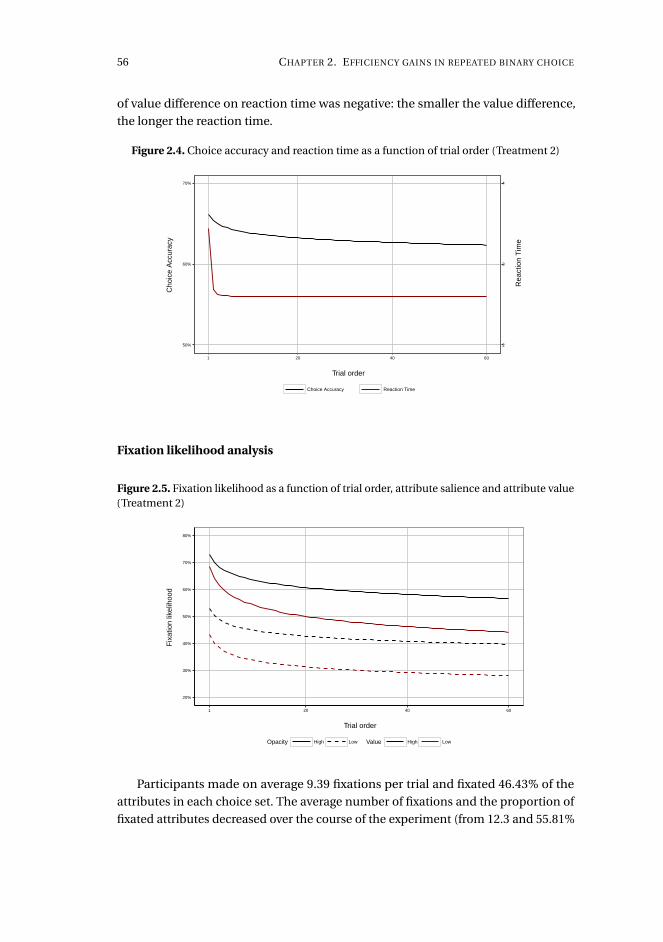
56 CHAPTER 2. EFFICIENCY GAINS IN REPEATED BINARY CHOICE
of value difference on reaction time was negative: the smaller the value difference,
the longer the reaction time.
Figure 2.4. Choice accuracy and reaction time as a function of trial order (Treatment 2)
50%
60%
70%
1 20 40 60
Trial order
Cho
ice
Acc
urac
y
Choice Accuracy Reaction Time
2
3
4
Rea
ctio
n T
ime
Fixation likelihood analysis
Figure 2.5. Fixation likelihood as a function of trial order, attribute salience and attribute value(Treatment 2)
20%
30%
40%
50%
60%
70%
80%
1 20 40 60
Trial order
Fix
atio
n lik
elih
ood
Opacity High Low Value High Low
Participants made on average 9.39 fixations per trial and fixated 46.43% of the
attributes in each choice set. The average number of fixations and the proportion of
fixated attributes decreased over the course of the experiment (from 12.3 and 55.81%

2.5. TREATMENT 3 57
at the beginning of the experiment to 8.37 and 43.15% at the end of the experiment,
respectively).
The best-fitting model included a random intercept and random effects of trial
order and salience. The model showed a decreasing effect of trial order on fixation
likelihood. All other fixed effects were insignificant. The optimal transformation
of trial order was raising it to a power of −0.1. The effect is plotted in Figure 2.5.
Parameter estimates and standard errors are shown in Table 2.4.
Discussion
The results of treatment 2 show the same pattern as the results of treatment 1: par-
ticipants did become faster but they did not improve the accuracy of their decisions
over the course of the experiment. Apparently, the validity of attribute salience as a
cue was still too low (note that the salience-value correlation was only .258) to be
utilisable by participants, despite the performance feedback that was displayed after
each trial.
The results of the analysis of the eye tracking data again show that participants
attended to decreasing amounts of information over the course of the experiment
in terms of total number of fixations as well as the proportion of fixated attributes.
Although this replicates the results of Treatment 1, the descriptive statistics seem to
suggest that the effect is considerably smaller than in Treatment 13. The decreased
effect may suggest that when salience is correlated with value in such a way that it
carries task-relevant information and can operate as a "Brunswikian cue," decision-
makers do not significantly change their perceptual weighting of salience. A cross-
experiment analysis of these measures will be carried out at a later point in this
article.
2.5 Treatment 3
Method
In Treatment 3, the correlation between salience and value was .775. Unlike in Treat-
ment 1 (where it was zero) and Treatment 2 (where it was positive but weak), this
constitutes substantial cue validity. The positive direction of the relationship should
also make it easy for participants to utilise salience as a cue to value. 46 participants
were recruited from the general population and completed the experiment (Female =
48.78%, Mag e = 35.73). All had normal or corrected-to-normal vision. Eye-tracking
measures were collected from all participants. However, six participants had to be
excluded from the eye-tracking analysis due to missing data. Apart from the statistical
3The decrease in number of fixations was 6.55 and 3.93 in Treatment 1 and 2, respectively, and thedecrease in proportion of fixated attributes was 18.52 and 13.66, respectively.
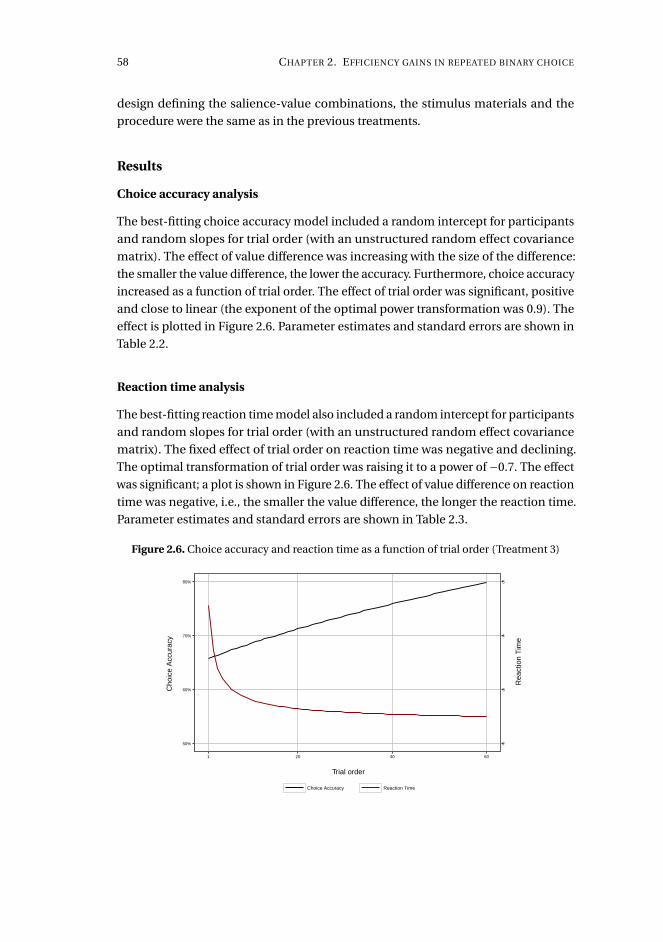
58 CHAPTER 2. EFFICIENCY GAINS IN REPEATED BINARY CHOICE
design defining the salience-value combinations, the stimulus materials and the
procedure were the same as in the previous treatments.
Results
Choice accuracy analysis
The best-fitting choice accuracy model included a random intercept for participants
and random slopes for trial order (with an unstructured random effect covariance
matrix). The effect of value difference was increasing with the size of the difference:
the smaller the value difference, the lower the accuracy. Furthermore, choice accuracy
increased as a function of trial order. The effect of trial order was significant, positive
and close to linear (the exponent of the optimal power transformation was 0.9). The
effect is plotted in Figure 2.6. Parameter estimates and standard errors are shown in
Table 2.2.
Reaction time analysis
The best-fitting reaction time model also included a random intercept for participants
and random slopes for trial order (with an unstructured random effect covariance
matrix). The fixed effect of trial order on reaction time was negative and declining.
The optimal transformation of trial order was raising it to a power of −0.7. The effect
was significant; a plot is shown in Figure 2.6. The effect of value difference on reaction
time was negative, i.e., the smaller the value difference, the longer the reaction time.
Parameter estimates and standard errors are shown in Table 2.3.
Figure 2.6. Choice accuracy and reaction time as a function of trial order (Treatment 3)
50%
60%
70%
80%
1 20 40 60
Trial order
Cho
ice
Acc
urac
y
Choice Accuracy Reaction Time
2
3
4
5
Rea
ctio
n T
ime
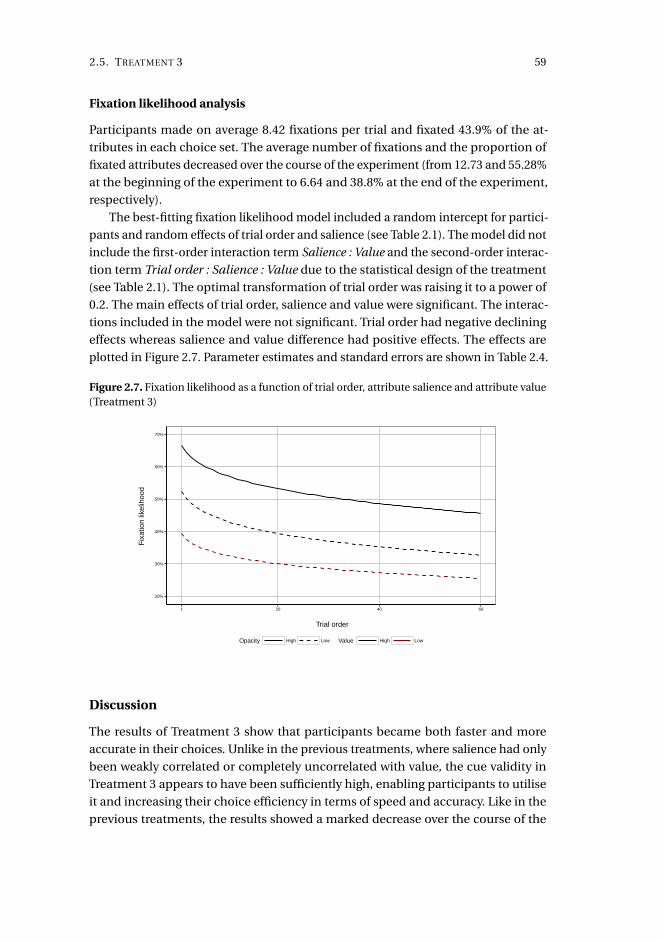
2.5. TREATMENT 3 59
Fixation likelihood analysis
Participants made on average 8.42 fixations per trial and fixated 43.9% of the at-
tributes in each choice set. The average number of fixations and the proportion of
fixated attributes decreased over the course of the experiment (from 12.73 and 55.28%
at the beginning of the experiment to 6.64 and 38.8% at the end of the experiment,
respectively).
The best-fitting fixation likelihood model included a random intercept for partici-
pants and random effects of trial order and salience (see Table 2.1). The model did not
include the first-order interaction term Salience : Value and the second-order interac-
tion term Trial order : Salience : Value due to the statistical design of the treatment
(see Table 2.1). The optimal transformation of trial order was raising it to a power of
0.2. The main effects of trial order, salience and value were significant. The interac-
tions included in the model were not significant. Trial order had negative declining
effects whereas salience and value difference had positive effects. The effects are
plotted in Figure 2.7. Parameter estimates and standard errors are shown in Table 2.4.
Figure 2.7. Fixation likelihood as a function of trial order, attribute salience and attribute value(Treatment 3)
20%
30%
40%
50%
60%
70%
1 20 40 60
Trial order
Fix
atio
n lik
elih
ood
Opacity High Low Value High Low
Discussion
The results of Treatment 3 show that participants became both faster and more
accurate in their choices. Unlike in the previous treatments, where salience had only
been weakly correlated or completely uncorrelated with value, the cue validity in
Treatment 3 appears to have been sufficiently high, enabling participants to utilise
it and increasing their choice efficiency in terms of speed and accuracy. Like in the
previous treatments, the results showed a marked decrease over the course of the
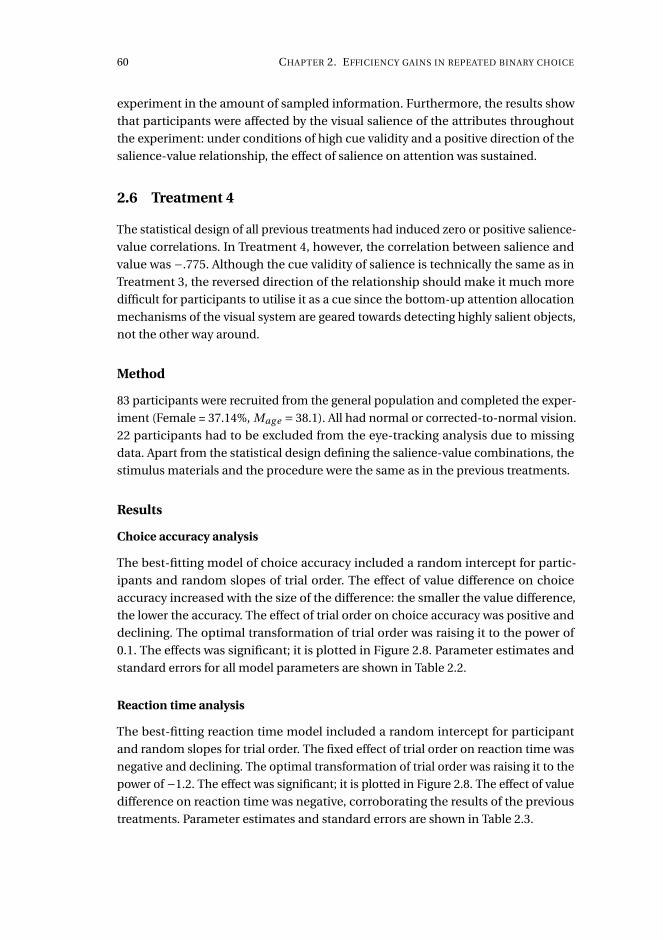
60 CHAPTER 2. EFFICIENCY GAINS IN REPEATED BINARY CHOICE
experiment in the amount of sampled information. Furthermore, the results show
that participants were affected by the visual salience of the attributes throughout
the experiment: under conditions of high cue validity and a positive direction of the
salience-value relationship, the effect of salience on attention was sustained.
2.6 Treatment 4
The statistical design of all previous treatments had induced zero or positive salience-
value correlations. In Treatment 4, however, the correlation between salience and
value was −.775. Although the cue validity of salience is technically the same as in
Treatment 3, the reversed direction of the relationship should make it much more
difficult for participants to utilise it as a cue since the bottom-up attention allocation
mechanisms of the visual system are geared towards detecting highly salient objects,
not the other way around.
Method
83 participants were recruited from the general population and completed the exper-
iment (Female = 37.14%, Mag e = 38.1). All had normal or corrected-to-normal vision.
22 participants had to be excluded from the eye-tracking analysis due to missing
data. Apart from the statistical design defining the salience-value combinations, the
stimulus materials and the procedure were the same as in the previous treatments.
Results
Choice accuracy analysis
The best-fitting model of choice accuracy included a random intercept for partic-
ipants and random slopes of trial order. The effect of value difference on choice
accuracy increased with the size of the difference: the smaller the value difference,
the lower the accuracy. The effect of trial order on choice accuracy was positive and
declining. The optimal transformation of trial order was raising it to the power of
0.1. The effects was significant; it is plotted in Figure 2.8. Parameter estimates and
standard errors for all model parameters are shown in Table 2.2.
Reaction time analysis
The best-fitting reaction time model included a random intercept for participant
and random slopes for trial order. The fixed effect of trial order on reaction time was
negative and declining. The optimal transformation of trial order was raising it to the
power of −1.2. The effect was significant; it is plotted in Figure 2.8. The effect of value
difference on reaction time was negative, corroborating the results of the previous
treatments. Parameter estimates and standard errors are shown in Table 2.3.
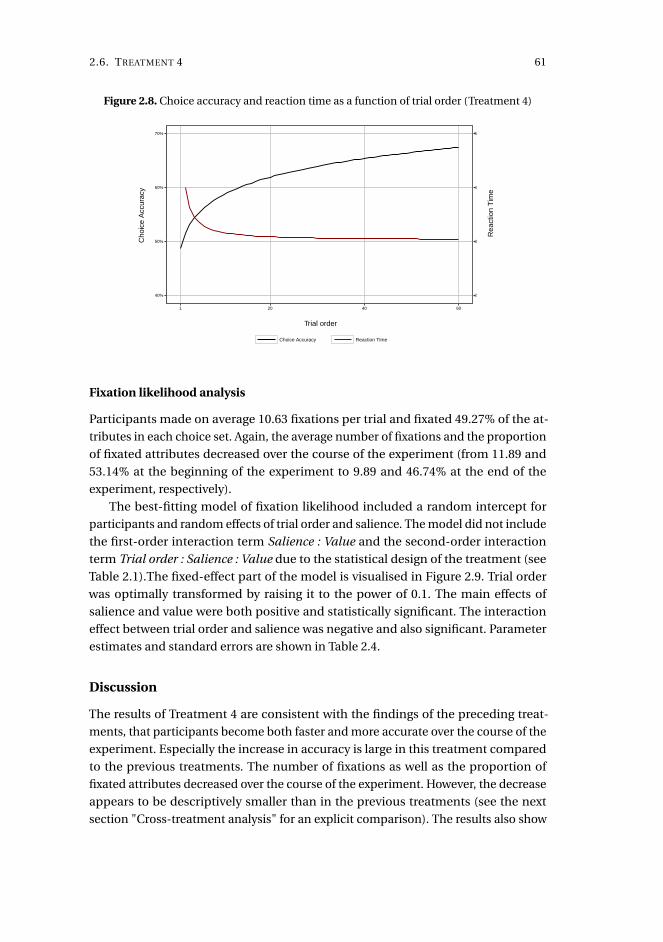
2.6. TREATMENT 4 61
Figure 2.8. Choice accuracy and reaction time as a function of trial order (Treatment 4)
40%
50%
60%
70%
1 20 40 60
Trial order
Cho
ice
Acc
urac
y
Choice Accuracy Reaction Time
2
3
4
5
Rea
ctio
n T
ime
Fixation likelihood analysis
Participants made on average 10.63 fixations per trial and fixated 49.27% of the at-
tributes in each choice set. Again, the average number of fixations and the proportion
of fixated attributes decreased over the course of the experiment (from 11.89 and
53.14% at the beginning of the experiment to 9.89 and 46.74% at the end of the
experiment, respectively).
The best-fitting model of fixation likelihood included a random intercept for
participants and random effects of trial order and salience. The model did not include
the first-order interaction term Salience : Value and the second-order interaction
term Trial order : Salience : Value due to the statistical design of the treatment (see
Table 2.1).The fixed-effect part of the model is visualised in Figure 2.9. Trial order
was optimally transformed by raising it to the power of 0.1. The main effects of
salience and value were both positive and statistically significant. The interaction
effect between trial order and salience was negative and also significant. Parameter
estimates and standard errors are shown in Table 2.4.
Discussion
The results of Treatment 4 are consistent with the findings of the preceding treat-
ments, that participants become both faster and more accurate over the course of the
experiment. Especially the increase in accuracy is large in this treatment compared
to the previous treatments. The number of fixations as well as the proportion of
fixated attributes decreased over the course of the experiment. However, the decrease
appears to be descriptively smaller than in the previous treatments (see the next
section "Cross-treatment analysis" for an explicit comparison). The results also show
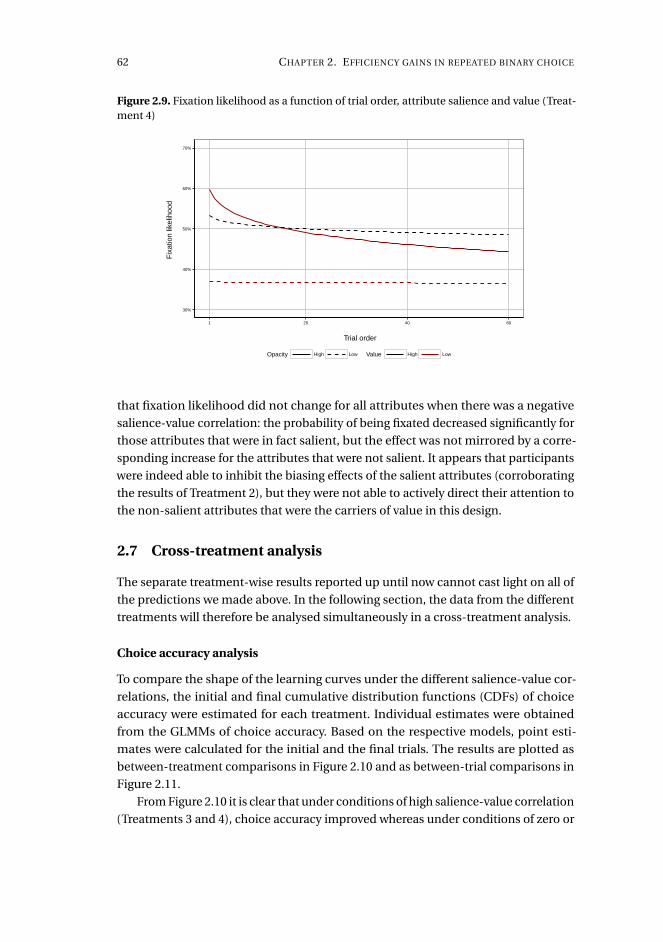
62 CHAPTER 2. EFFICIENCY GAINS IN REPEATED BINARY CHOICE
Figure 2.9. Fixation likelihood as a function of trial order, attribute salience and value (Treat-ment 4)
30%
40%
50%
60%
70%
1 20 40 60
Trial order
Fix
atio
n lik
elih
ood
Opacity High Low Value High Low
that fixation likelihood did not change for all attributes when there was a negative
salience-value correlation: the probability of being fixated decreased significantly for
those attributes that were in fact salient, but the effect was not mirrored by a corre-
sponding increase for the attributes that were not salient. It appears that participants
were indeed able to inhibit the biasing effects of the salient attributes (corroborating
the results of Treatment 2), but they were not able to actively direct their attention to
the non-salient attributes that were the carriers of value in this design.
2.7 Cross-treatment analysis
The separate treatment-wise results reported up until now cannot cast light on all of
the predictions we made above. In the following section, the data from the different
treatments will therefore be analysed simultaneously in a cross-treatment analysis.
Choice accuracy analysis
To compare the shape of the learning curves under the different salience-value cor-
relations, the initial and final cumulative distribution functions (CDFs) of choice
accuracy were estimated for each treatment. Individual estimates were obtained
from the GLMMs of choice accuracy. Based on the respective models, point esti-
mates were calculated for the initial and the final trials. The results are plotted as
between-treatment comparisons in Figure 2.10 and as between-trial comparisons in
Figure 2.11.
From Figure 2.10 it is clear that under conditions of high salience-value correlation
(Treatments 3 and 4), choice accuracy improved whereas under conditions of zero or

2.7. CROSS-TREATMENT ANALYSIS 63
Figure 2.10. Empirical cumulative distribution functions of predicted initial and final levels ofchoice accuracy (between-treatments comparison)
0.00
0.25
0.50
0.75
1.00
0% 25% 50% 75% 100%
Trea
tmen
t 1
0.00
0.25
0.50
0.75
1.00
0% 25% 50% 75% 100%
Trea
tmen
t 2
0.00
0.25
0.50
0.75
1.00
0% 25% 50% 75% 100%
Trea
tmen
t 3
0.00
0.25
0.50
0.75
1.00
0% 25% 50% 75% 100%
Choice Accuracy
Trea
tmen
t 4
Predicted initial trial Predicted final trial

64 CHAPTER 2. EFFICIENCY GAINS IN REPEATED BINARY CHOICE
low salience-value correlation (Treatments 1 and 2), choice accuracy remained static.
Descriptively accuracy even deteriorated here; however, the effect was not significant.
Figure 2.11 shows that, initially, participants in the treatments with positive salience-
value correlation performed worse than participants in the treatment with zero
correlation, and those in the negative correlation initially performed worse than the
participants in all other treatments. Over the course of the experiments, however, the
picture changed. In the final trials, participants in the treatment with a high positive
correlation performed better than the participants in all other treatments, and the
participants in the treatment with a negative salience-value correlation performed
on par with the participants in the other treatments.
Figure 2.11. Empirical cumulative distribution functions of predicted initial and final levels ofchoice accuracy (between-trials comparison)
0.00
0.25
0.50
0.75
1.00
0% 25% 50% 75% 100%
Initi
al tr
ial
0.00
0.25
0.50
0.75
1.00
0% 25% 50% 75% 100%
Choice Accuracy
Fin
al tr
ial
1 2 3 4
Reaction time analysis
Similarly to the cross-treatment analysis of choice accuracy, we estimated the ini-
tial and final CDFs of reaction time. Individual estimates were obtained from the
LMMs of reaction time. The results are plotted as between-treatment comparisons in
Figure 2.12 and as between-trial comparisons in Figure 2.13.
The results indicate that, under conditions of high salience-value correlation
(Treatments 3 and 4), participants became significantly faster over the course of the

2.8. GENERAL DISCUSSION 65
experiments, whereas under conditions of zero or low salience-value correlation
(Treatments 1 and 2), the reaction time did not change significantly. The efficiency
gains were generally larger in the treatments with high positive and negative cor-
relation. The reaction time distributions in the treatments with zero and positive
correlations became very similar in the final trials. However, the largest change (and
the only significant change) was observed in the treatment with a high positive
correlation. Participants in the treatment with a high negative correlation also be-
came faster but remained below the levels achieved in the final trials in the other
treatments.
Fixation analysis
The treatment-wise analyses of fixation likelihood already suggested that the effect of
salience on fixation likelihood might be dependent on the salience-value correlation.
To directly compare the decrease in the number of fixations and proportion of fixated
attributes between the four treatments, we estimated two cross-treatment models.
Both models were estimated four times with each treatment dummy as the baseline
for the model. The models were LMMs with the number of fixations and proportion
of fixated attributes as the dependent variables. Trial order and treatment number
were treated as independent variables. The models were estimated following the
same modelling procedure as in the previous analyses. Trial order was optimally
transformed by a power of −1.1 for the total number of fixations and 0.1 for the
proportion of fixated attributes, respectively. The results are plotted in Figure 2.14.
Parameter estimates and standard errors for the models are shown in Table 2.5 and
Table 2.6 for number of fixations and proportion of fixated attributes, respectively.
Trial order had a negative and decreasing effect on the total number of fixations
as well as on the proportion of fixated attributes. The effect was statistically signifi-
cant in both models. In the model prediction total number of fixations, Treatment 3
and 4 were significantly different from each other in the interaction with trial order.
Participants in Treatment 4 had a significantly smaller decrease in total fixations
than in Treatment 3. None of the other independent variables were significant in the
model. In the model predicting the proportion of fixated attributes, Treatments 1,
2 and 3 were significantly different from Treatment 4, and Treatment 2 was signifi-
cantly different from Treatment 1. These differences were as main effects as well as
interaction with trial order. Participants in Treatments 2, 3 and 4 initially fixated a
smaller proportion of the attributes, and the decrease in the proportion was smaller
in Treatment 2 and 4. The decrease was smallest in Treatment 4.
2.8 General discussion
The aim of the research presented in this paper was to identify the processes through
which biasing effects of visual salience operate in repeated decision tasks and to

66 CHAPTER 2. EFFICIENCY GAINS IN REPEATED BINARY CHOICE
Figure 2.12. Empirical cumulative distribution functions of predicted initial and final levels ofreaction time (between-treatments comparison)
0.00
0.25
0.50
0.75
1.00
0 5 10 15
Trea
tmen
t 1
0.00
0.25
0.50
0.75
1.00
0 5 10 15
Trea
tmen
t 2
0.00
0.25
0.50
0.75
1.00
0 5 10 15
Trea
tmen
t 3
0.00
0.25
0.50
0.75
1.00
0 5 10 15
Reaction time
Trea
tmen
t 4
Predicted initial trial Predicted final trial
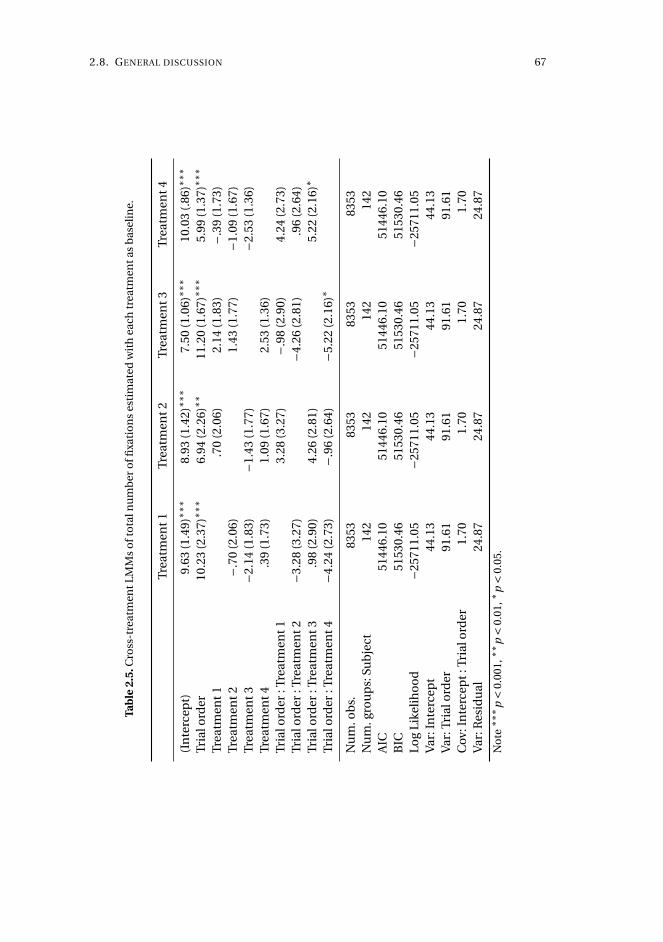
2.8. GENERAL DISCUSSION 67
Tab
le2.
5.C
ross
-tre
atm
entL
MM
so
fto
taln
um
ber
offi
xati
on
ses
tim
ated
wit
hea
chtr
eatm
enta
sb
asel
ine.
Trea
tmen
t1Tr
eatm
ent2
Trea
tmen
t3Tr
eatm
ent4
(In
terc
ept)
9.63
(1.4
9)∗∗
∗8.
93(1
.42)
∗∗∗
7.50
(1.0
6)∗∗
∗10
.03
(.86
)∗∗∗
Tria
lord
er10
.23
(2.3
7)∗∗
∗6.
94(2
.26)
∗∗11
.20
(1.6
7)∗∗
∗5.
99(1
.37)
∗∗∗
Trea
tmen
t1.7
0(2
.06)
2.14
(1.8
3)−.
39(1
.73)
Trea
tmen
t2−.
70(2
.06)
1.43
(1.7
7)−1
.09
(1.6
7)Tr
eatm
ent3
−2.1
4(1
.83)
−1.4
3(1
.77)
−2.5
3(1
.36)
Trea
tmen
t4.3
9(1
.73)
1.09
(1.6
7)2.
53(1
.36)
Tria
lord
er:T
reat
men
t13.
28(3
.27)
−.98
(2.9
0)4.
24(2
.73)
Tria
lord
er:T
reat
men
t2−3
.28
(3.2
7)−4
.26
(2.8
1).9
6(2
.64)
Tria
lord
er:T
reat
men
t3.9
8(2
.90)
4.26
(2.8
1)5.
22(2
.16)
∗Tr
ialo
rder
:Tre
atm
ent4
−4.2
4(2
.73)
−.96
(2.6
4)−5
.22
(2.1
6)∗
Nu
m.o
bs.
8353
8353
8353
8353
Nu
m.g
rou
ps:
Sub
ject
142
142
142
142
AIC
5144
6.10
5144
6.10
5144
6.10
5144
6.10
BIC
5153
0.46
5153
0.46
5153
0.46
5153
0.46
Log
Like
lih
oo
d−2
5711
.05
−257
11.0
5−2
5711
.05
−257
11.0
5V
ar:I
nte
rcep
t44
.13
44.1
344
.13
44.1
3V
ar:T
rial
ord
er91
.61
91.6
191
.61
91.6
1C
ov:I
nte
rcep
t:Tr
ialo
rder
1.70
1.70
1.70
1.70
Var
:Res
idu
al24
.87
24.8
724
.87
24.8
7
No
te∗∗
∗ p<
0.00
1,∗∗
p<
0.01
,∗p<
0.05
.

68 CHAPTER 2. EFFICIENCY GAINS IN REPEATED BINARY CHOICE
Table
2.6.Cro
ss-treatmen
tLMM
so
fpro
po
rtion
offi
xatedattrib
utes
estimated
with
eachtreatm
entas
baselin
e.
Treatmen
t1Treatm
ent2
Treatmen
t3Treatm
ent4
(Intercep
t)1.03
(.07) ∗∗∗.81
(.07) ∗∗∗.88
(.05) ∗∗∗.66
(.04) ∗∗∗Trialo
rder
−.37
(.04) ∗∗∗−
.25(.04) ∗∗∗
−.33
(.03) ∗∗∗−
.13(.02) ∗∗∗
Treatmen
t1.22
(.10) ∗.15
(.09).37
(.08) ∗∗∗Treatm
ent2
−.22
(.10) ∗−
.07(.08)
.15(.08)
Treatmen
t3−
.15(.09)
.07(.08)
.22(.06) ∗∗∗
Treatmen
t4−
.37(.08) ∗∗∗
−.15
(.08)−
.22(.06) ∗∗∗
Trialord
er:Treatm
ent1
−.12
(.05) ∗−
.04(.05)
−.24
(.05) ∗∗∗Trialo
rder
:Treatmen
t2.12
(.05) ∗.08
(.05)−
.12(.04) ∗∗
Trialord
er:Treatm
ent3
.04(.05)
−.08
(.05)−
.20(.04) ∗∗∗
Trialord
er:Treatm
ent4
.24(.05) ∗∗∗
.12(.04) ∗∗
.20(.04) ∗∗∗
Nu
m.o
bs.
83538353
83538353
Nu
m.gro
up
s:Sub
ject142
142142
142A
IC−
6388.91−
6388.91−
6388.91−
6388.91B
IC−
6318.61−
6318.61−
6318.61−
6318.61Lo
gLikelih
oo
d3204.45
3204.453204.45
3204.45V
ar:Intercep
t.04
.04.04
.04V
ar:Resid
ual
.03.03
.03.03
No
te ∗∗∗p<
0.001, ∗∗p<
0.01, ∗p<
0.05.
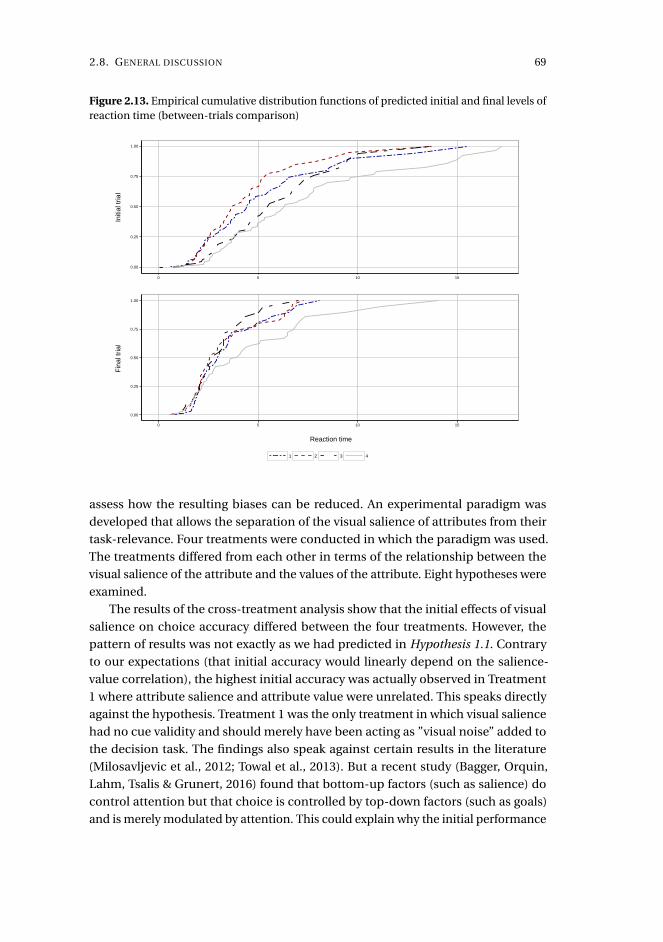
2.8. GENERAL DISCUSSION 69
Figure 2.13. Empirical cumulative distribution functions of predicted initial and final levels ofreaction time (between-trials comparison)
0.00
0.25
0.50
0.75
1.00
0 5 10 15
Initi
al tr
ial
0.00
0.25
0.50
0.75
1.00
0 5 10 15
Reaction time
Fin
al tr
ial
1 2 3 4
assess how the resulting biases can be reduced. An experimental paradigm was
developed that allows the separation of the visual salience of attributes from their
task-relevance. Four treatments were conducted in which the paradigm was used.
The treatments differed from each other in terms of the relationship between the
visual salience of the attribute and the values of the attribute. Eight hypotheses were
examined.
The results of the cross-treatment analysis show that the initial effects of visual
salience on choice accuracy differed between the four treatments. However, the
pattern of results was not exactly as we had predicted in Hypothesis 1.1. Contrary
to our expectations (that initial accuracy would linearly depend on the salience-
value correlation), the highest initial accuracy was actually observed in Treatment
1 where attribute salience and attribute value were unrelated. This speaks directly
against the hypothesis. Treatment 1 was the only treatment in which visual salience
had no cue validity and should merely have been acting as ”visual noise” added to
the decision task. The findings also speak against certain results in the literature
(Milosavljevic et al., 2012; Towal et al., 2013). But a recent study (Bagger, Orquin,
Lahm, Tsalis & Grunert, 2016) found that bottom-up factors (such as salience) do
control attention but that choice is controlled by top-down factors (such as goals)
and is merely modulated by attention. This could explain why the initial performance

70 CHAPTER 2. EFFICIENCY GAINS IN REPEATED BINARY CHOICE
Figure 2.14. Change in total number of fixations and proportion of fixated attributes for eachtreatment
7.5
10.0
12.5
15.0
17.5
20.0
0 20 40 60
Tota
l Fix
atio
ns
0.4
0.5
0.6
0 20 40 60
Trial Order
Pro
port
ion
Fix
ated
Attr
ibut
es
1 2 3 4
was not better in the two treatments with positive salience-value correlations. This
is also consistent with another result derived from Treatment 1 (zero correlation)
where we saw that the participants attended to a particularly large proportion of
the information available in this treatment (two thirds of the attributes on average).
This may indicate that participants in this treatment also utilised more information
for their decisions, which would in turn have led to higher accuracy. Furthermore,
the high proportion of initially attended information in this treatment suggests that
participants also considered attributes that were low in salience. Although the salient
attributes might have attracted their attention first, the other attributes were not
completely ignored and may have counteracted the expected difference in accuracy.
A negative salience-value correlation, on the other hand, had the expected neg-
ative effect on initial choice accuracy, in line with the predictions of Hypothesis 1.2.
This result is consistent with the findings by (Kruschke & Johansen, 1999) that irrele-
vant but highly salient cues may decrease the utilisation of relevant cues and thereby

2.8. GENERAL DISCUSSION 71
lower the performance of a decision-maker.
In Hypothesis 4 we predicted that accuracy would increase over the repetitions of
the choice task, but only under conditions of non-zero salience-value-correlations
(and therefore also positive cue validity) but not under conditions of a zero salience-
value-correlation. The results of our experiments support this hypothesis. There was
a large and significant change in choice accuracy over the course of the experiments
under treatments of a high positive or high negative negative salience-value correla-
tion. The effect was not significant in the treatment with a zero correlation and not in
the treatment with a low salience-value correlation either. Apparently, the cue validity
was too low in the latter condition to be effectively utilised by the participants and
was therefore unable to drive improvements in accuracy. To sum up, the pattern of
the learning effects observed over the many repetitions of the choice task suggests
that, under conditions of sufficiently high positive salience-value correlations, re-
peated choice with feedback can lead to further performance increases and, under
conditions of sufficiently high negative salience-value correlations, it can counteract
the bias that is initially caused by the negative correlation.
Regarding the effects of different salience-value correlations on reaction time
and decision speed, the results point in the same direction as for choice accuracy.
As predicted in Hypothesis 2.2, a negative correlation did have a detrimental effect:
participants in the negative-correlation treatment were considerably slower than
participants in all other treatments. There is no support for Hypothesis 2.1, though.
It appears that participants in the treatments with a zero, a low positive and a high
positive salience-value correlation made their decisions with approximately the same
speed.
As predicted in Hypothesis 5, participants generally became faster over the course
of the experiment, but the largest increase in decision speed was found in the treat-
ments with high salience-value correlations (both negative and positive). Under these
conditions, participants were really able to capitalise on the statistical contingency
between salience and value, learn to utilise salience as a cue, and thereby save time by
directing their attention to the relevant information. It should be noted, however, that
even though the improvement was particularly large in the treatment with a negative
correlation, this might simply have been the case because there was so much more to
gain here: in the final trials of Treatment 4, the average speed of participants was still
below the speed of participants in the other treatments.
We used eye-tracking methodology to investigate how changes in attention pro-
cesses relate to changes in choice accuracy and decision speed. Three of the four
treatments support Hypothesis 3: salient attributes appear to guide initial attention
regardless of their relevance, which is consistent with the results of previous research
(Bialkova & van Trijp, 2011; Milosavljevic et al., 2012; Towal et al., 2013) and provides
a good explanation of the findings regarding accuracy and decision speed in the
treatment with negative salience-value correlation.
72 CHAPTER 2. EFFICIENCY GAINS IN REPEATED BINARY CHOICE
Furthermore, the results suggest that attention control processes might be altered
by repeated exposure to the same type of decision task and that this depends on
the correlation between the salience and the value of the attributes. In the zero-
correlation treatment, participants became less affected by visual salience over
the course of the treatment, and the same observation was made in the negative-
correlation treatment. The effect of salience on attention was sustained in the two
positive-correlation treatments. These results support Hypothesis 6 and are consistent
with findings from vision research where the effects of stimulus characteristics have
been shown to interact with task goals (Desimone & Duncan, 1995; Itti & Koch, 2001).
Over the course of the experiments, our participants used decreasing amounts of
information to perform the task, which is in line with the results of previous research
(Gegenfurtner et al., 2011; Haider & Frensch, 1999). However, they also became better
at guiding their attention to relevant cue information. This makes good sense under
the assumption that efficiency increases mainly occur at an early filtering stage. In
the terminology of cognitive models of attention, the many repetitions of the task
may have changed the weighting of specific visual features on the activation map,
as proposed by Wolfe (1994). Wolfe’s notion of an activation map is basically a topo-
logical landscape based on stimulus features. The landscape is shaped by stimulus
features, and the features are weighted by top-down components (such as tasks, goals
and experience) which changes the landscape. Attention prioritisation is controlled
by the peaks in the activation map. Through repeated exposure to a given task and
task environment, the detection of relevant information becomes more efficient.
The learning effects observed in our experiments were achieved through overall
performance feedback alone: participants learned the relationships between salience
and value without ever receiving explicit information about them. This is in contrast
to previous findings on multiple-cue probability learning (see Karelaia & Hogarth,
2008) but our finding shows that people can learn to rapidly detect target patterns
in visual information and to use them in a given task to increase their efficiency,
provided that there are a sufficient number of repetitions and there is performance
feedback.
The present research also suggests that decreasing use of information and in-
creased choice accuracy do not always go together. In all treatments, we observed
certain changes and learning effects, but the nature of these changes and learning
effects depended on the salience-value correlations embedded in the task and to
which participants had to learn to adapt. When that correlation was zero or weakly
positive, participants appeared to become better at noise reduction by learning to
reduce their reactivity to attribute salience. When the correlation was highly positive,
on the other hand, participants appeared to learn to better leverage the diagnosticity
of salience by increasing their reactivity to it. Finally, under conditions of a high nega-
tive correlation, participants even appeared to learn new attention control strategies
that could partly counteract the biasing effects of attribute salience.

2.9. CONCLUSION 73
2.9 Conclusion
People do not make their decisions in the same way every time they are confronted
with the same task. The research presented in this paper has shown that decision-
makers become faster and more accurate through repeated experience with a task.
However, the particular types of efficiency gains that will occur depend on the struc-
ture of the task and the task environment. Simultaneous improvements in speed
and accuracy require visual cues that carry task-relevant information. If such cues
exist, decision-makers can rapidly learn to utilise them with only minimal levels
of feedback. The different types of efficiency gains appear to be associated with
characteristic changes in cue reactivity and other attention control processes.
The results have implications for research in multi-attribute decision-making
and multiple-cue probability learning where the effect of stimulus characteristics
on performance has not received a lot of attention up until now. Researcher need to
consider the visual features of the stimuli and its inter-correlation with task-relevant
attributes as the visual features have a huge effect on both visual search and different
performance measures. The results also have implications for a practitioners (e.g.,
within packaging design) who need to consider the inter-correlation of visual features
and the product characteristics they want to promote or expect to be relevant if they
want people to notice their product.

74 CHAPTER 2. EFFICIENCY GAINS IN REPEATED BINARY CHOICE
2.10 References
Bagger, M. P., Orquin, J. L., Lahm, E., Tsalis, G., & Grunert, K. G. (2016). The perceptual
pull in decision making. Acta Psychologica, manuscript submitted.
Bates, D., Mächler, M., Bolker, B., & Walker, S. (2015). Fitting Linear Mixed-Effects
Models Using lme4. Journal of Statistical Software, 67(1).
Bayindir, M., Bolger, F., & Say, B. (2015). An Investigation of the Role of Some Person
and Situation Variables in Multiple Cue Probability Learning. The Quarterly Journal
of Experimental Psychology, (just-accepted), 1–39.
Bialkova, S. & van Trijp, H. C. M. (2011). An efficient methodology for assessing
attention to and effect of nutrition information displayed front-of-pack. Food
Quality and Preference, 22(6), 592–601.
Broadbent, D. E. (1958). Perception and communication. London: Pergamon Press.
Brunswik, E. (1952). The conceptual framework of psychology.(Int. Encycl. unified
Sci., v. 1, no. 10.).
Brunswik, E. (1955). Representative design and probabilistic theory in a functional
psychology. Psychological review, 62(3), 193.
Castellan, N. J. (1973). Multiple-cue probability learning with irrelevant cues. Organi-
zational Behavior and Human Performance, 9(1), 16–29.
Castellan, N. J. (1974). The effect of different types of feedback in multiple-cue
probability learning. Organizational Behavior and Human Performance, 11(1),
44–64.
Desimone, R. & Duncan, J. (1995). Neural mechanisms of selective visual attention.
Annual review of neuroscience, 18(1), 193–222.
Deutsch, J. A. & Deutsch, D. (1963). Attention: some theoretical considerations.
Psychological review, 70(1), 80.
Edgell, S. E., Castellan Jr, N. J., Roe, R. M., Barnes, J. M., Ng, P. C., Bright, R. D., &
Ford, L. A. (1996). Irrelevant information in probabilistic categorization. Journal of
Experimental Psychology: Learning, Memory, and Cognition, 22(6), 1463.
Edgell, S. E. & Morrissey, J. M. (1992). Separable and unitary stimuli in nonmetric
multiple-cue probability learning. Organizational Behavior and Human Decision
Processes, 51(1), 118–132.
Edgell, S. E., Neace, W. P., Harbison, J. I., & Brian, E. S. (2015). Salience in Learning in
a Probabilistic Environment.
2.10. REFERENCES 75
Friedenberg, J. & Silverman, G. (2011). Cognitive science: An introduction to the study
of mind. Sage.
Gegenfurtner, A., Lehtinen, E., & Säljö, R. (2011). Expertise Differences in the Compre-
hension of Visualizations: a Meta-Analysis of Eye-Tracking Research in Professional
Domains. Educational Psychology Review, 23(4), 523–552.
Gigerenzer, G. & Goldstein, D. G. (1996). Reasoning the fast and frugal way: Models of
bounded rationality. Psychological Review, 103(4), 650–669.
Glaholt, M. G. & Reingold, E. M. (2011). Eye Movement Monitoring as a Process Trac-
ing Methodology in Decision Making Research. Journal of Neuroscience, Psychology,
& Economics, 4(2), 125–146.
Haider, H. & Frensch, P. A. (1999). Eye movement during skill acquisition: More
evidence for the information-reduction hypothesis. Journal of Experimental Psy-
chology: Learning, Memory, and Cognition, 25(1), 172–190.
Hammond, K. R. (1966). The psychology of Egon Brunswik. Holt, Rinehart and Winston
Oxford.
Hammond, K. R. (1971). Computer graphics as an aid to learning. Science, 172(3986),
903–908.
Hammond, K. R. & Stewart, T. R. (Eds.). (2001). The Essential Brunswik: Beginnings,
Explications, Applications. New York: Oxford University Press.
Hoffman, J. E. & Subramaniam, B. (1995). The role of visual attention in saccadic eye
movements. Perception & psychophysics, 57(6), 787–795.
Holmqvist, K., Nyström, M., Andersson, R., Dewhurst, R., Jarodzka, H., & van de
Weijer, J. (2011). Eye Tracking : A Comprehensive Guide to Methods and Measures.
Oxford: Oxford University Press.
Holzworth, R. J. (2001). Multiple cue probability learning. In K. R. Hammond & T. R.
Stewart (Eds.), The Essential Brunswik: Beginnings, Expectations, Applications (pp.
348 – 350). New York: Oxford University Press.
Itti, L. & Koch, C. (2001). Computational modelling of visual attention. Nature reviews
neuroscience, 2(3), 194–203.
Johnston, W. A. & Heinz, S. P. (1978). Flexibility and capacity demands of attention.
Journal of Experimental Psychology: General, 107(4), 420.
Just, M. A. & Carpenter, P. A. (1980). A theory of reading: from eye fixations to compre-
hension. Psychological review, 87(4), 329.
76 CHAPTER 2. EFFICIENCY GAINS IN REPEATED BINARY CHOICE
Karelaia, N. & Hogarth, R. M. (2008). Determinants of linear judgment: a meta-
analysis of lens model studies. Psychological bulletin, 134(3), 404.
Klayman, J. (1988). Cue discovery in probabilistic environments: Uncertainty and
experimentation. Journal of Experimental Psychology: Learning, Memory, and
Cognition, 14(2), 317.
Kowler, E. (2011). Eye movements: The past 25years. Vision research, 51(13), 1457–
1483.
Kruschke, J. K. & Johansen, M. K. (1999). A model of probabilistic category learning.
Journal of Experimental Psychology: Learning, Memory, and Cognition, 25(5), 1083.
Lavie, N. & Tsal, Y. (1994). Perceptual load as a major determinant of the locus of
selection in visual attention. Perception & Psychophysics, 56(2), 183–197.
Leifeld, P. (2013). texreg: Conversion of Statistical Model Output in R to LATEX and
HTML Tables. Journal of Statistical Software, 55(8), 1–24.
Lurie, N. H. & Mason, C. H. (2007). Visual representation: Implications for decision
making. Journal of Marketing, 71(1), 160–177.
Meißner, M. & Decker, R. (2010). Eye-tracking information processing in choice-based
conjoint analysis. International Journal of Market Research, 52(5), 591–610.
Meißner, M., Musalem, A., & Huber, J. (2016). Eye Tracking Reveals Processes That
Enable Conjoint Choices to Become Increasingly Efficient with Practice. Journal of
Marketing Research (JMR), 53(1), 1–17.
Milosavljevic, M., Navalpakkam, V., Koch, C., & Rangel, A. (2012). Relative visual
saliency differences induce sizable bias in consumer choice. Journal of Consumer
Psychology, 22(1), 67–74.
Nestler, S., Egloff, B., Küfner, A. C., & Back, M. D. (2012). An integrative lens model ap-
proach to bias and accuracy in human inferences: hindsight effects and knowledge
updating in personality judgments. Journal of personality and social psychology,
103(4), 689.
Newell, B. R., Weston, N. J., Tunney, R. J., & Shanks, D. R. (2009). The effectiveness
of feedback in multiple-cue probability learning. The Quarterly Journal of Experi-
mental Psychology, 62(5), 890–908.
Norman, D. A. (1968). Toward a theory of memory and attention. Psychological review,
75(6), 522.
Orquin, J. L., Ashby, N. J. S., & Clarke, A. D. F. (2016). Areas of Interest as a Signal
Detection Problem in Behavioral Eye-Tracking Research. Journal of Behavioral
Decision Making, (29), 103–115.

2.10. REFERENCES 77
Orquin, J. L., Bagger, M. P., & Mueller Loose, S. (2013). Learning affects top down
and bottom up modulation of eye movements in decision making. Judgment and
Decision Making, 8(6), 700–716.
Pachur, T. & Olsson, H. (2012). Type of learning task impacts performance and strategy
selection in decision making. Cognitive Psychology, 65(2), 207–240.
Payne, J. W., Bettman, J. R., & Johnson, E. J. (1988). Adaptive strategy selection in
decision making. Journal of Experimental Psychology: Learning, Memory, and
Cognition, 14(3), 534.
Peirce, J. W. (2007). PsychoPy—Psychophysics software in Python. Journal of Neuro-
science Methods, 162(1–2), 8–13.
Peirce, J. W. (2009). Generating stimuli for neuroscience using PsychoPy. Frontiers in
Neuroinformatics, 2, 10.
Posner, M. I. (1980). Orienting of attention. Quarterly journal of experimental psy-
chology, 32(1), 3–25.
R Core Team (2015). R: A language and environment for statistical computing. R
Foundation for Statistical Computing, Vienna, Austria.
Shepherd, M., Findlay, J. M., & Hockey, R. J. (1986). The relationship between eye
movements and spatial attention. The Quarterly Journal of Experimental Psychol-
ogy, 38(3), 475–491.
Slovic, P. (1995). The construction of preference. American psychologist, 50(5), 364.
Slovic, P. & Lichtenstein, S. (1968). Relative importance of probabilities and payoffs in
risk taking. Journal of experimental psychology, 78(3p2), 1.
SR Research (2008). EyeLink user manual. Version 1.4.0 (Computer Software Manual).
Stroop, J. R. (1935). Studies of interference in serial verbal reactions. Journal of
experimental psychology, 18(6), 643.
Theeuwes, J. (2004). Top-down search strategies cannot override attentional capture.
Psychonomic bulletin & review, 11(1), 65–70.
Theeuwes, J. & Burg, E. V. d. (2011). On the limits of top-down control of visual
selection. Attention, Perception, & Psychophysics, 73(7), 2092–2103.
Towal, R. B., Mormann, M., & Koch, C. (2013). Simultaneous modeling of visual
saliency and value computation improves predictions of economic choice. Pro-
ceedings of the National Academy of Sciences, 110(40), E3858–E3867.

78 CHAPTER 2. EFFICIENCY GAINS IN REPEATED BINARY CHOICE
Treisman, A. & Sato, S. (1990). Conjunction search revisited. Journal of Experimental
Psychology: Human Perception and Performance, 16(3), 459–478.
Tucker, L. R. (1964). A suggested alternative formulation in the developments by
Hursch, Hammond, and Hursch, and by Hammond, Hursch, and Todd. Psycholog-
ical Review, 71, 528–530.
Tversky, A. & Kahneman, D. (1981). The framing of decisions and the psychology of
choice. Science, 211, 453–458.
Tversky, A., Slovic, P., & Kahneman, D. (1990). The causes of preference reversal. The
American Economic Review, 204–217.
Wickham, H. (2009). ggplot2: elegant graphics for data analysis. Springer Science &
Business Media.
Wolfe, J. M. (1994). Guided Search 2.0 A revised model of visual search. Psychonomic
Bulletin & Review, 1(2), 202–238.
Wolfe, J. M., Cave, K. R., & Franzel, S. L. (1989). Guided search: An alternative to the
feature integration model for visual search. Journal of Experimental Psychology:
Human Perception and Performance, 15(3), 419–433.

2.11. APPENDIX 79
2.11 Appendix
Appendix A provides an example of each of the six learning blocks.
Example of learning task blocks (1-6)
(1)
(2)
(3)
(4)
(5)
(6)

CH
AP
TE
R
3THE PERCEPTUAL PULL IN DECISION MAKING1
SUBMITTED TO ACTA PSYCHOLOGICA
Martin Petri Bagger
Aarhus University
Jacob Lund Orquin, Erik Lahm, George Tsalis, and Klaus G. Grunert
Aarhus University and MAPP
Abstract
Judgement and decision making theories disagree on the relative contri-
bution of top-down and bottom-up control of eye movements. Some theories
assume pure top-down control while others assume a balance between top-down
and bottom-up control. However, without a direct comparison, it is difficult to
know how much weight should be given in decision theories to each process.
To compare the relative importance of the two processes, we conducted an eye
tracking study manipulating bottom-up and top-down processes orthogonally.
We manipulated bottom-up processes by varying the size and salience of a target
attribute as well as the position and number of distractor attributes. To manipu-
late top-down processes we varied the relevance of the target attribute through
three different decision tasks: preferential choice, inferential choice, and prefer-
ential choice with priming. Our results showed that bottom-up processes play a
greater role than top-down processes in determining eye movements, but that
1Acknowledgments: The research described in this paper was commissioned by the Danish Ministryof Food, Agriculture and Fisheries and is a part of the “Contract between Aarhus University and Ministry ofFood, Agriculture and Fisheries for the provision of research-based policy advice, etc., at Aarhus University,DCA – Danish Centre for Food and Agriculture, 2013-2016”.
81

82 CHAPTER 3. THE PERCEPTUAL PULL IN DECISION MAKING
the top-down manipulation influenced the use of information with relevant
and fixated information having a larger impact on decisions. The present study
opens up the question about when bottom-up and top-down processes have the
stronger effect on attention.
3.1 Introduction
Human visual attention is driven by top-down and bottom-up processes, i.e., goal
and stimulus-driven processes (Corbetta & Shulman, 2002). There is an ongoing
debate about the relative contribution of the two processes in different tasks, e.g.,
visual search, natural tasks and scene viewing (Tatler, Hayhoe, Land & Ballard, 2011;
Theeuwes, 2010). In judgment and decision making, most theories assume that visual
search is mostly or entirely top-down driven (see for instance Fiedler & Glöckner, 2012;
Schulte-Mecklenbeck, Sohn, Bellis, Martin & Hertwig, 2013). Toolbox models, for
instance, assume that decision strategies, e.g., take-the-best, elimination-by-aspect
or lexicographic rule, define visual search in a top-down manner (Gigerenzer & Gaiss-
maier, 2011). This assumption is supported by a large number of studies showing
effects of decision-relevant information on visual search (for a review see Orquin
& Mueller Loose, 2013). More recently, models have been developed assuming that
visual search is stochastic (Krajbich, Armel, & Rangel, 2010) or driven by a combina-
tion of bottom-up and top-down processes (Towal, Mormann, & Koch 2013). The
latter seems more realistic given several studies demonstrating bottom-up effects
on visual search in decision making. These studies have, for instance, found effects
of salience (Bialkova & van Trijp, 2011; Milosavljevic, Navalpakkam, Koch, & Rangel,
2012), surface size (Chandon, Hutchinson, Bradlow, & Young, 2009), positioning
(Navalpakkam et al., 2012; Shi, Wedel & Pieters, 2013; Sü tterlin, Brunner & Opwis,
2008), and set size (Horstmann, Ahlgrimm, & Glöckner, 2009; Lohse & Johnson, 1996;
Reutskaja, Nagel, Camerer, & Rangel, 2011; Russo & Dosher, 1983) on visual search. So
far bottom-up and top-down processes have mainly been investigated separately and
we therefore do not know the relative contribution of the two processes in decision
making. Some have even argued that bottom-up processes do not influence visual
search (Tatler et al., 2011), but without a direct comparison it is difficult to say how
much weight decision theories should give to the two processes. In order to directly
compare top-down and bottom-up processes and inform theory development in
judgment and decision making, we conducted a study manipulating top-down and
bottom-up factors orthogonally. We manipulated bottom-up factors by varying the
size and salience of a target attribute as well as the position and number of distractor
attributes in a two-alternative choice task. The target attribute was a food health
label indicating the level of healthiness. We manipulated top-down factors by varying
the relevance of the target attribute to the choice task across three conditions: an
inferential condition in which participants were instructed to choose the healthier al-
ternative, a preferential condition where participants were instructed to choose their

3.2. METHOD 83
preferred alternative, and a priming condition in which participants were exposed to
health information and instructed to choose their preferred alternative.
3.2 Method
Stimulus development
In order to generate target and distractor stimuli, we conducted a stimulus develop-
ment study (N = 225, Mag e = 45.58, SDag e = 15.60, 52 % females) to identify stimuli
relevant for forming health judgments of food products. The study used a within-
subjects design, in which participants assessed whether a product with a given label
was healthier than a product without that particular label. Responses were binary
with zero indicating that the product was considered healthier and one indicating
that the product was not considered healthier with that label. Labels were presented
individually and participants judged 39 labels in total. Mean judgments were cal-
culated by averaging participants’ health judgments with a score of zero indicating
perfect agreement that a label implies healthiness and a score of one that it does not
imply healthiness. Labels with a mean score < .4 were considered targets, and labels
with a mean score > .7 were considered distractors. Two labels with mean scores in the
interval [.4 - .7] were eliminated due to their ambiguity. The stimulus development
study identified four targets and 33 distractor labels. The mean and CIs for the pooled
target and distractor labels are shown in Table 3.1 and Figure 3.1 provide a graphical
illustration of the distribution of the judgments.
Participants
Seventy-six participants were recruited by a market research company (Mag e = 44.84,
SDag e = 13.25, 34 % female). Four participants were excluded due to failing the vision
test, lack of useful eye tracking data, or being intoxicated; the result was a final sample
of 72 participants. Participants had normal or corrected to normal vision. Participants
gave informed consent and received a gift card of DKK 250 for completing the study.
Experimental design
We conducted a two-alternative discrete choice experiment with a full factorial mixed
within-between subjects design manipulating choice conditions (inferential choice,
preferential choice, primed preferential choice) as a between-subjects factor, and
target label surface size (small, large), target label salience (high, low), and set size
(6, 10, 14, 18, 22, 26, 30 labels) as within-subjects factors. The position of target
and distractor labels on each alternative was randomly sampled from 15 possible
locations. The assignment of target labels went as follows: first, the target product
was chosen with an equal probability between left and right side. Second, a target
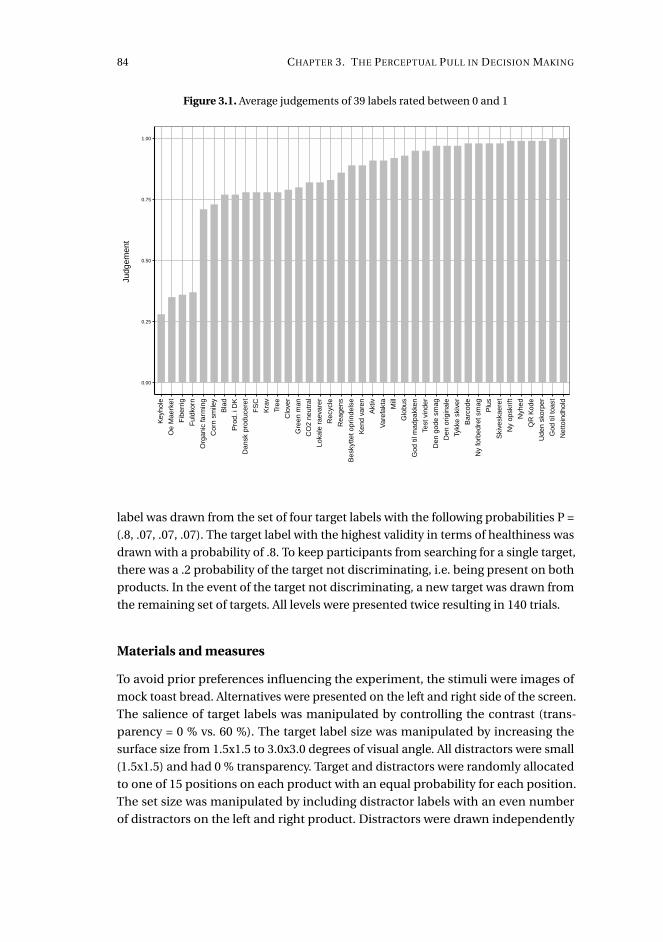
84 CHAPTER 3. THE PERCEPTUAL PULL IN DECISION MAKING
Figure 3.1. Average judgements of 39 labels rated between 0 and 1
0.00
0.25
0.50
0.75
1.00
Key
hole
Oe
Mae
rket
Fib
errig
Ful
dkor
n
Org
anic
farm
ing
Cor
n sm
iley
Bla
d
Pro
d. i
DK
Dan
sk p
rodu
cere
t
FS
C
Kra
v
Tree
Clo
ver
Gre
en m
an
CO
2 ne
utra
l
Loka
le r
aeva
rer
Rec
ycle
Rea
gens
Bes
kytte
t opr
inde
lse
Ken
d va
ren
Akt
iv
Var
efak
ta
Mill
Glo
bus
God
til m
adpa
kken
Test
vin
der
Den
god
e sm
ag
Den
orig
inal
e
Tykk
e sk
iver
Bar
code
Ny
forb
edre
t sm
ag
Plu
s
Ski
vesk
aere
t
Ny
opsk
rift
Nyh
ed
QR
Kod
e
Ude
n sk
orpe
r
God
til t
oast
Net
toin
dhol
d
Judg
emen
t
label was drawn from the set of four target labels with the following probabilities P =
(.8, .07, .07, .07). The target label with the highest validity in terms of healthiness was
drawn with a probability of .8. To keep participants from searching for a single target,
there was a .2 probability of the target not discriminating, i.e. being present on both
products. In the event of the target not discriminating, a new target was drawn from
the remaining set of targets. All levels were presented twice resulting in 140 trials.
Materials and measures
To avoid prior preferences influencing the experiment, the stimuli were images of
mock toast bread. Alternatives were presented on the left and right side of the screen.
The salience of target labels was manipulated by controlling the contrast (trans-
parency = 0 % vs. 60 %). The target label size was manipulated by increasing the
surface size from 1.5x1.5 to 3.0x3.0 degrees of visual angle. All distractors were small
(1.5x1.5) and had 0 % transparency. Target and distractors were randomly allocated
to one of 15 positions on each product with an equal probability for each position.
The set size was manipulated by including distractor labels with an even number
of distractors on the left and right product. Distractors were drawn independently
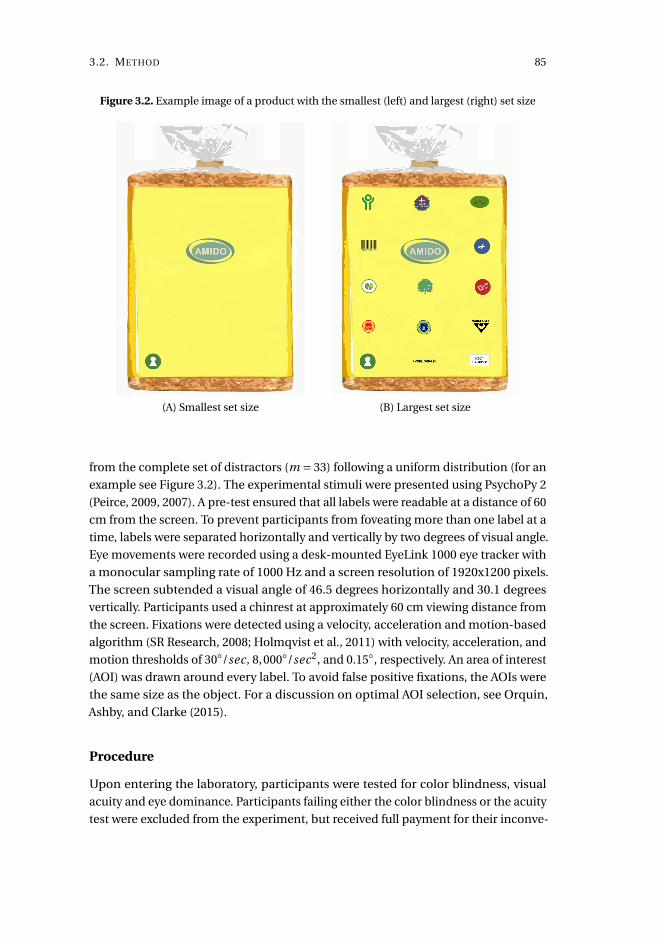
3.2. METHOD 85
Figure 3.2. Example image of a product with the smallest (left) and largest (right) set size
(A) Smallest set size (B) Largest set size
from the complete set of distractors (m = 33) following a uniform distribution (for an
example see Figure 3.2). The experimental stimuli were presented using PsychoPy 2
(Peirce, 2009, 2007). A pre-test ensured that all labels were readable at a distance of 60
cm from the screen. To prevent participants from foveating more than one label at a
time, labels were separated horizontally and vertically by two degrees of visual angle.
Eye movements were recorded using a desk-mounted EyeLink 1000 eye tracker with
a monocular sampling rate of 1000 Hz and a screen resolution of 1920x1200 pixels.
The screen subtended a visual angle of 46.5 degrees horizontally and 30.1 degrees
vertically. Participants used a chinrest at approximately 60 cm viewing distance from
the screen. Fixations were detected using a velocity, acceleration and motion-based
algorithm (SR Research, 2008; Holmqvist et al., 2011) with velocity, acceleration, and
motion thresholds of 30◦/sec , 8,000◦/sec2, and 0.15◦, respectively. An area of interest
(AOI) was drawn around every label. To avoid false positive fixations, the AOIs were
the same size as the object. For a discussion on optimal AOI selection, see Orquin,
Ashby, and Clarke (2015).
Procedure
Upon entering the laboratory, participants were tested for color blindness, visual
acuity and eye dominance. Participants failing either the color blindness or the acuity
test were excluded from the experiment, but received full payment for their inconve-
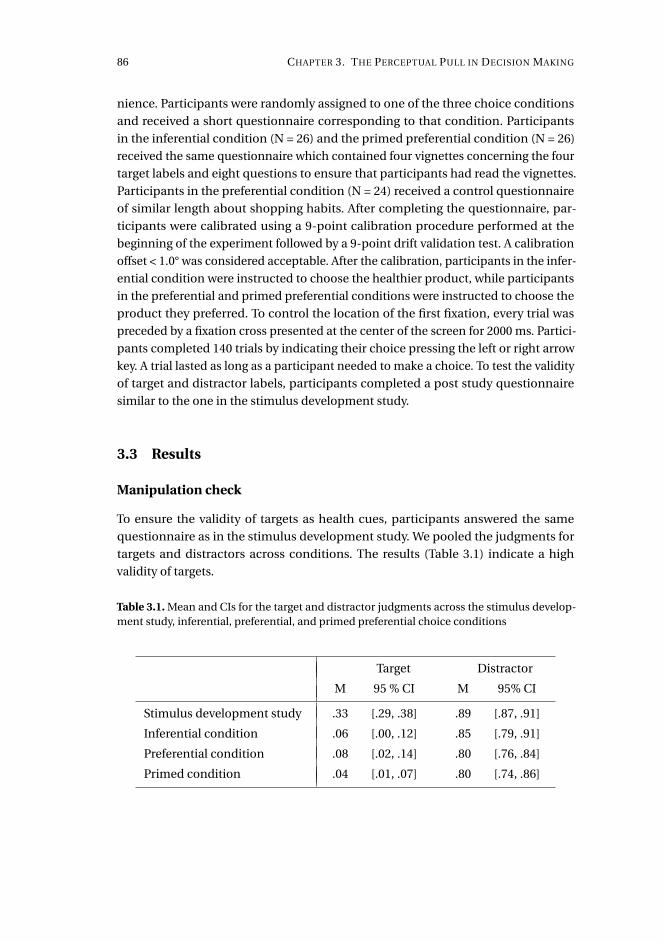
86 CHAPTER 3. THE PERCEPTUAL PULL IN DECISION MAKING
nience. Participants were randomly assigned to one of the three choice conditions
and received a short questionnaire corresponding to that condition. Participants
in the inferential condition (N = 26) and the primed preferential condition (N = 26)
received the same questionnaire which contained four vignettes concerning the four
target labels and eight questions to ensure that participants had read the vignettes.
Participants in the preferential condition (N = 24) received a control questionnaire
of similar length about shopping habits. After completing the questionnaire, par-
ticipants were calibrated using a 9-point calibration procedure performed at the
beginning of the experiment followed by a 9-point drift validation test. A calibration
offset < 1.0° was considered acceptable. After the calibration, participants in the infer-
ential condition were instructed to choose the healthier product, while participants
in the preferential and primed preferential conditions were instructed to choose the
product they preferred. To control the location of the first fixation, every trial was
preceded by a fixation cross presented at the center of the screen for 2000 ms. Partici-
pants completed 140 trials by indicating their choice pressing the left or right arrow
key. A trial lasted as long as a participant needed to make a choice. To test the validity
of target and distractor labels, participants completed a post study questionnaire
similar to the one in the stimulus development study.
3.3 Results
Manipulation check
To ensure the validity of targets as health cues, participants answered the same
questionnaire as in the stimulus development study. We pooled the judgments for
targets and distractors across conditions. The results (Table 3.1) indicate a high
validity of targets.
Table 3.1. Mean and CIs for the target and distractor judgments across the stimulus develop-ment study, inferential, preferential, and primed preferential choice conditions
Target Distractor
M 95 % CI M 95% CI
Stimulus development study .33 [.29, .38] .89 [.87, .91]
Inferential condition .06 [.00, .12] .85 [.79, .91]
Preferential condition .08 [.02, .14] .80 [.76, .84]
Primed condition .04 [.01, .07] .80 [.74, .86]

3.3. RESULTS 87
Eye movement analysis
We analyzed the likelihood of participants fixating targets using a generalized linear
mixed model (GLMM) with a binomial response distribution and a logit link function.
The model was fitted using the lme4 package (Bates, Mächler, Bolker, & Walker, 2015)
in the statistical software R (R Core Team, 2015). Tables were generated using "texreg"
(Leifeld, 2013), and graphical visualizations were created using "ggplot2" (Wickham,
2009).
The dependent variable (fixation selection) was a binary variable with value one
if a target was fixated and zero otherwise. The set of possible independent variables
for the fixed effects part of the model included size (binary), salience (binary), set size
(metric), distance to center (metric), and condition (categorical). We considered a
set of possible models for which we applied a hold-one-person-out cross validation
procedure for model selection (see Appendix A). For every participant we fitted the
model on the entire sample excluding that participant. The fitted model was then
used to predict the data for the excluded participant. The procedure was repeated for
each model and model selection was based on the Brier score:
Br i er Scor e = 1
N
N∑t=1
(pt −ot )2
where N is the total number of predictions, p is the predicted probability and o is
the true outcome for observation t. The Brier score ranges from zero to one where a
smaller value is better. The final model included main effects of all variables except
condition. The model included a random intercept for each participant. Table 3.2
contains coefficients, standard errors, and variance estimate for the final model.
The model performed reasonably well with 72.01 % accurate predictions. Figure 3.3
illustrates main effects.
Choice analysis
To investigate the effect of target relevance on choice, we analyzed the likelihood of
choosing the target alternative across conditions. We expected that participants in
the inferential condition would be more likely to choose the the alternative that was
dominant in terms of the target attribute than those in the primed preferential condi-
tion. We also expected that participants in the primed preferential condition would
be more likely to choose the alternative that was dominant in terms of the target at-
tribute than participants in the preferential condition. Furthermore we expected that
visually attending to the target attribute would increase the likelihood of choosing
the target alternative. The dependent variable (target choice) was a binary variable
indicating whether a participant chose the target alternative. Fixation selection and
condition were used as independent variables. As with the eye movement analysis,
we applied a hold-one-person-out cross validation procedure for model selection

88 CHAPTER 3. THE PERCEPTUAL PULL IN DECISION MAKING
Figure 3.3. Main effects of fixation likelihood model with error bars representing 95 % confi-dence intervals
0.50
0.54
0.58
0.62
5 10 15 20 25 30
Setsize
Fix
atio
n lik
elih
ood
0.0
0.2
0.4
Low High
Salience
Fix
atio
n lik
elih
ood
●
●
●
●
●
●
●
●
●
●
●
●
●
●
0.25
0.30
0.35
200 300 400
Distance to center (in px)
Fix
atio
n Li
kelih
ood
0.0
0.2
0.4
0.6
Small Large
Size
Fix
atio
n lik
elih
ood
(see Appendix B). The final model included main effects of selection and condition.
The model included a random intercept and slope for trial order grouped by partici-
pant. Table 3.3 contains coefficients, standard errors, and variance estimate for the
final model. The model performed reasonably well with 77.9 % accurate predictions.
Figure 3.4 illustrates main effects.
3.4 Discussion
Decision theories disagree on the relative contribution of top-down and bottom-up
control on visual search in decision making. To directly compare the two processes,
we manipulated top-down and bottom-up factors in an orthogonal design. The most
predictive model of fixation likelihood included in decreasing order of effect: attribute
size, distance from center of screen, set size, and salience. There was no effect of
condition in the final model. This model show that stimulus characteristics attracts
the attention of the decision maker under the design of the present study regardless
of the task condition. The most predictive model of target choice likelihood included
only the effect of task condition. From the manipulation check and the target choice
model, we know that the top-down manipulation was effective. The results of the
manipulation check show that both target and distractor attributes were interpreted

3.4. DISCUSSION 89
Table 3.2. GLMM of fixation likelihood
Fixation likelihood
(Intercept) .046(.195)
Size 1.321∗∗∗(.039)
Salience .347∗∗∗(.039)
Set size −.017∗∗∗(.002)
Distance −.002∗∗∗(.0002)
Num. obs. 14896Num. groups 76AIC 16353.63BIC 16399.28Log Likelihood −8170.82Var: Intercept 2.29
Note ∗∗∗p < 0.001, ∗∗p < 0.01, ∗p < 0.05.
Figure 3.4. Observed and predicted probability of choosing the target alternative with errorbars representing 95 % confidence intervals
●
●
●
●
●
●
0.5
0.6
0.7
0.8
0.9
1.0
Inferential Preferential Primed preferential
Condition
% c
hoic
e of
targ
et a
ltern
ativ
e
Selected ● ●no yes Predicted ●

90 CHAPTER 3. THE PERCEPTUAL PULL IN DECISION MAKING
Table 3.3. GLMM of target choice likelihood
Target Choice
(Intercept) 1.49∗∗∗(.25)
Fixation selection .42∗∗∗(.05)
Preferential condition −1.23∗∗∗(.28)
Primed condition −.84∗∗(.27)
Num. obs. 14896Num. groups 76AIC 13895.20BIC 13948.46Log Likelihood −6940.60Var: Intercept .6767Var: Trial order .0001Corr: Intercept : Trial order .47
Note ∗∗∗p < 0.001, ∗∗p < 0.01, ∗p < 0.05.
correctly, and in the target choice analysis we find that condition influences choice
as expected. Given its influence on choices, it is surprising that condition does not
influence visual search. Our results show that bottom-up factors play a greater role in
visual search than assumed by most contemporary theories of decision making. We
expected target choice to be approximately at chance level if a target attribute was not
fixated. However, target choice was well above chance level for all conditions in both
trials where the target attribute was fixated and trials where it was not. This might be
due to covert (peripheral) attention, i.e., participants fixating a point in proximity of
the target allowing for indirect detection of the target. This does not, however, change
the conclusion that fixation selection is driven by bottom-up processes which at the
perceptual level pull the decision makera attention and therefore also choice.
The present study opens up the question about when bottom-up and top-down
processes have the stronger effect on attention. Under the current experimental
design the effect of bottom-up factors are dominating and driving allocation of visual
attention, however, the effect might be caused by large differences in the variations
of the different manipulations. As such the variation between top-down conditions
might be too small compared to the variations in bottom-up manipulations (i.e. the
different tasks might be to similar). This gives rise to the questions: Which factors
determine whether bottom-up or top-down effects are stronger, how much does
tasks have to differ for it to affect search, and in which situations does bottom-up

3.4. DISCUSSION 91
effects dominate visual search?
92 CHAPTER 3. THE PERCEPTUAL PULL IN DECISION MAKING
3.5 References
Bates, D., Mächler, M., Bolker, B., & Walker, S. (2015). Fitting linear mixed-effects
models using lme4. Journal of Statistical Software, 67 (1-48).
Bialkova, S., & van Trijp, H. C. M. (2011). An efficient methodology for assessing
attention to and effect of nutrition information displayed front-of-pack. Food
Quality and Preference, 22(6), 592–601.
Chandon, P., Hutchinson, J. W., Bradlow, E. T., & Young, S. H. (2009). Does in-store
marketing work? Effects of the number and position of shelf facings on brand
attention and evaluation at the point of purchase. Journal of Marketing, 73(6), 1–17.
Corbetta, M. & Shulman, G. L. (2002). Control of goal-directed and stimulus-driven
attention in the brain. Nature Reviews Neuroscience, 3 (3), 201–215.
Fiedler, S. & Glöckner, A. (2012). The dynamics of decision making in risky choice: an
eye-tracking analysis. Frontiers in Psychology, 3, 1–18.
Gigerenzer, G., & Gaissmaier,W. (2011). Heuristic decision making. Annual Review of
Psychology, 62(1), 451–482. Holmqvist, K., Nyström, M., Andersson, R., Dewhurst,
R., Jarodzka, H., & van de Weijer, J. (2011). Eye Tracking: A Comprehensive Guide to
Methods and Measures. Oxford University Press.
Horstmann, N., Ahlgrimm, A., & Glöckner, A. (2009). How distinct are intuition and
deliberation? An eye-tracking analysis of instruction-induced decision modes.
Judgment and Decision Making, 4(5), 335–354.
Krajbich, I., Armel, C., & Rangel, A. (2010). Visual fixations and the computation and
comparison of value in simple choice. Nature Neuroscience, 13(10), 1292–1298.
Leifeld, P. (2013). texreg: Conversion of Statistical Model Output in R to LATEX and
HTML Tables. Journal of Statistical Software, 55 (8), 1-24.
Lohse, G. L., & Johnson, E. J. (1996). A comparison of two process tracing methods for
choice tasks. Organizational Behavior and Human Decision Processes, 68(1), 28–43.
Milosavljevic, M., Navalpakkam, V., Koch, C., & Rangel, A. (2012). Relative visual
saliency differences induce sizable bias in consumer choice. Journal of Consumer
Psychology, 22(1), 67–74.
Navalpakkam, V., Kumar, R., Li, L., & Sivakumar, D. (2012). Attention and selection
in online choice tasks. In J. Masthoff, B. Mobasher, M. Desmarais, & R. Nkambou
(Eds.), User modeling, adaptation, and personalization, Vol. 7379. (pp. 200–211),
Berlin Heidelberg: Springer.
Orquin, J. L., Ashby, N. J., & Clarke, A. D. (2015). Areas of interest as a signal detec-
tion problem in behavioral eye-tracking research. Journal of Behavioral Decision
Making, 29(2-3), 103-115.

3.5. REFERENCES 93
Orquin, J. L., & Mueller Loose, S. (2013). Attention and choice: A review on eye move-
ments in decision making. Acta Psychologica, 144, 190–206.
Peirce, J. W. (2007). PsychoPy—Psychophysics software in Python. Journal of Neuro-
science Methods, 162 (1–2), 8–13.
Peirce, J. W. (2009). Generating stimuli for neuroscience using PsychoPy. Frontiers in
Neuroinformatics, 2, 1-8.
R Core Team (2015). R: A language and environment for statistical computing. R
Foundation for Statistical Computing, Vienna, Austria.
Reutskaja, E., Nagel, R., Camerer, C. F., & Rangel, A. (2011). Search dynamics in con-
sumer choice under time pressure: An eye-tracking study. The American Economic
Review, 101(2), 900–926.
Russo, J. E., & Dosher, B. A. (1983). Strategies for multiattribute binary choice. Journal
of Experimental Psychology, 9(4), 676–696.
Schulte-Mecklenbeck, M., Sohn, M., Bellis, E., Martin, N., & Hertwig, R. (2013). A
lack of appetite for information and computation: Simple heuristics in food choice.
Appetite, 71, 242–251.
Shi, S. W., Wedel, M., & Pieters, F. G. M. (2013). Information acquisition during online
decision making: A model-based exploration using eye-tracking data. Management
Science, 59(5), 1009-1026.
SR Research (2008). EyeLink user manual. Version 1.4.0 (Computer Software Manual).
Sütterlin, B., Brunner, T. A., & Opwis, K. (2008). Eye-tracking the cancellation and
focus model for preference judgments. Journal of Experimental Social Psychology,
44(3), 904–911.
Tatler, B. W., Hayhoe, M. M., Land, M. F., & Ballard, D. H. (2011). Eye guidance in
natural vision: Reinterpreting salience. Journal of Vision, 11(5), 1–23.
Theeuwes, J. (2010). Top–down and bottom–up control of visual selection. Acta Psy-
chologica, 135 (2), 77–99.
Towal, R. B., Mormann, M., & Koch, C. (2013). Simultaneous modeling of visual
saliency and value computation improves predictions of economic choice. Pro-
ceedings of the National Academy of Sciences, 110(40), E3858-E3867.
Wickham, H. (2009). ggplot2: elegant graphics for data analysis. Springer Science &
Business Media.
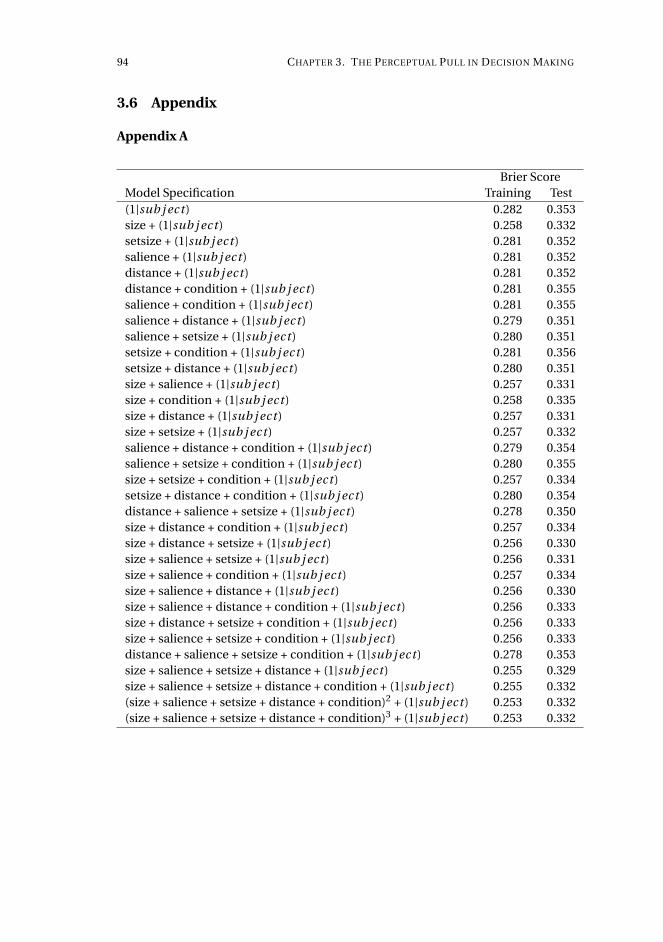
94 CHAPTER 3. THE PERCEPTUAL PULL IN DECISION MAKING
3.6 Appendix
Appendix A
Brier ScoreModel Specification Training Test(1|sub j ect ) 0.282 0.353size + (1|sub j ect ) 0.258 0.332setsize + (1|sub j ect ) 0.281 0.352salience + (1|sub j ect ) 0.281 0.352distance + (1|sub j ect ) 0.281 0.352distance + condition + (1|sub j ect ) 0.281 0.355salience + condition + (1|sub j ect ) 0.281 0.355salience + distance + (1|sub j ect ) 0.279 0.351salience + setsize + (1|sub j ect ) 0.280 0.351setsize + condition + (1|sub j ect ) 0.281 0.356setsize + distance + (1|sub j ect ) 0.280 0.351size + salience + (1|sub j ect ) 0.257 0.331size + condition + (1|sub j ect ) 0.258 0.335size + distance + (1|sub j ect ) 0.257 0.331size + setsize + (1|sub j ect ) 0.257 0.332salience + distance + condition + (1|sub j ect ) 0.279 0.354salience + setsize + condition + (1|sub j ect ) 0.280 0.355size + setsize + condition + (1|sub j ect ) 0.257 0.334setsize + distance + condition + (1|sub j ect ) 0.280 0.354distance + salience + setsize + (1|sub j ect ) 0.278 0.350size + distance + condition + (1|sub j ect ) 0.257 0.334size + distance + setsize + (1|sub j ect ) 0.256 0.330size + salience + setsize + (1|sub j ect ) 0.256 0.331size + salience + condition + (1|sub j ect ) 0.257 0.334size + salience + distance + (1|sub j ect ) 0.256 0.330size + salience + distance + condition + (1|sub j ect ) 0.256 0.333size + distance + setsize + condition + (1|sub j ect ) 0.256 0.333size + salience + setsize + condition + (1|sub j ect ) 0.256 0.333distance + salience + setsize + condition + (1|sub j ect ) 0.278 0.353size + salience + setsize + distance + (1|sub j ect ) 0.255 0.329size + salience + setsize + distance + condition + (1|sub j ect ) 0.255 0.332(size + salience + setsize + distance + condition)2 + (1|sub j ect ) 0.253 0.332(size + salience + setsize + distance + condition)3 + (1|sub j ect ) 0.253 0.332

3.6. APPENDIX 95
Appendix B
Brier ScoreModel Specification Training Testselection*condition + (1+ tr i al |sub j ect ) 0.320 0.280selection*condition + (1|sub j ect ) 0.320 0.332selection + condition + (1+ tr i al |sub j ect ) 0.320 0.277selection + condition + (1|sub j ect ) 0.320 0.330selection + (1|sub j ect ) 0.319 0.345(1|sub j ect ) 0.347 0.377
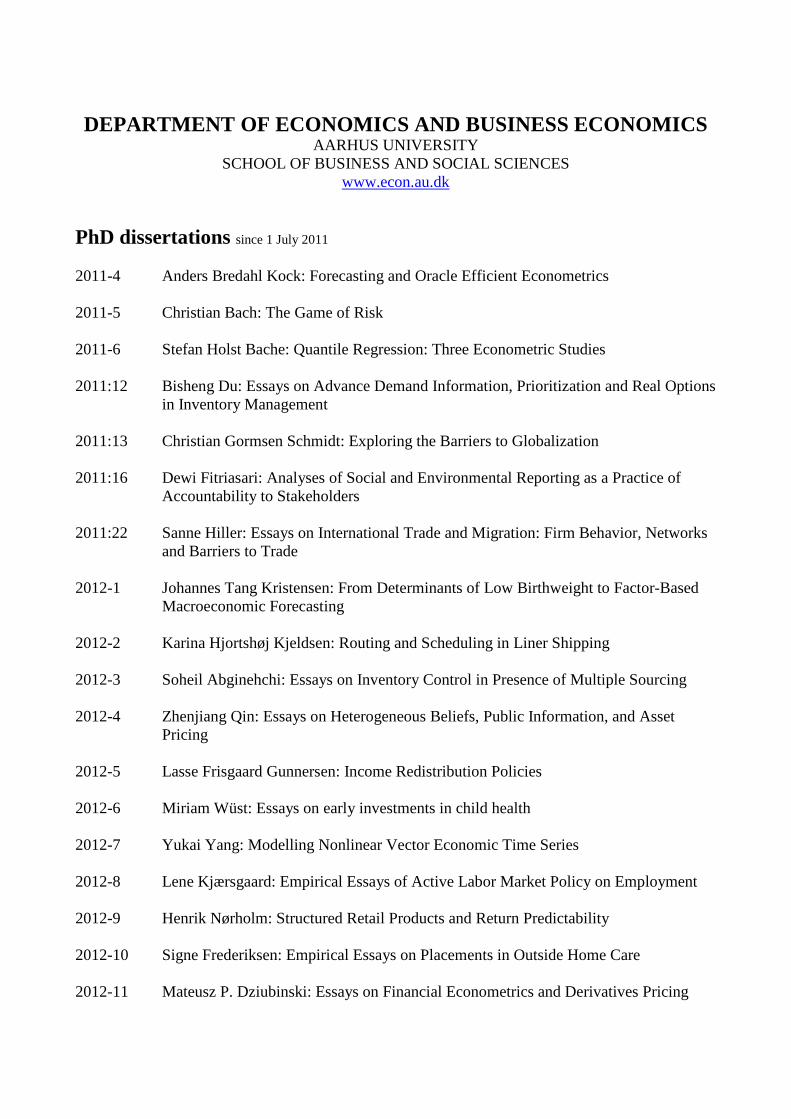
DEPARTMENT OF ECONOMICS AND BUSINESS ECONOMICS AARHUS UNIVERSITY
SCHOOL OF BUSINESS AND SOCIAL SCIENCES www.econ.au.dk
PhD dissertations since 1 July 2011 2011-4 Anders Bredahl Kock: Forecasting and Oracle Efficient Econometrics 2011-5 Christian Bach: The Game of Risk 2011-6 Stefan Holst Bache: Quantile Regression: Three Econometric Studies 2011:12 Bisheng Du: Essays on Advance Demand Information, Prioritization and Real Options
in Inventory Management 2011:13 Christian Gormsen Schmidt: Exploring the Barriers to Globalization 2011:16 Dewi Fitriasari: Analyses of Social and Environmental Reporting as a Practice of
Accountability to Stakeholders 2011:22 Sanne Hiller: Essays on International Trade and Migration: Firm Behavior, Networks
and Barriers to Trade 2012-1 Johannes Tang Kristensen: From Determinants of Low Birthweight to Factor-Based
Macroeconomic Forecasting 2012-2 Karina Hjortshøj Kjeldsen: Routing and Scheduling in Liner Shipping 2012-3 Soheil Abginehchi: Essays on Inventory Control in Presence of Multiple Sourcing 2012-4 Zhenjiang Qin: Essays on Heterogeneous Beliefs, Public Information, and Asset
Pricing 2012-5 Lasse Frisgaard Gunnersen: Income Redistribution Policies 2012-6 Miriam Wüst: Essays on early investments in child health 2012-7 Yukai Yang: Modelling Nonlinear Vector Economic Time Series 2012-8 Lene Kjærsgaard: Empirical Essays of Active Labor Market Policy on Employment 2012-9 Henrik Nørholm: Structured Retail Products and Return Predictability 2012-10 Signe Frederiksen: Empirical Essays on Placements in Outside Home Care 2012-11 Mateusz P. Dziubinski: Essays on Financial Econometrics and Derivatives Pricing

2012-12 Jens Riis Andersen: Option Games under Incomplete Information 2012-13 Margit Malmmose: The Role of Management Accounting in New Public Management Reforms: Implications in a Socio-Political Health Care Context 2012-14 Laurent Callot: Large Panels and High-dimensional VAR 2012-15 Christian Rix-Nielsen: Strategic Investment 2013-1 Kenneth Lykke Sørensen: Essays on Wage Determination 2013-2 Tue Rauff Lind Christensen: Network Design Problems with Piecewise Linear Cost
Functions
2013-3 Dominyka Sakalauskaite: A Challenge for Experts: Auditors, Forensic Specialists and the Detection of Fraud 2013-4 Rune Bysted: Essays on Innovative Work Behavior 2013-5 Mikkel Nørlem Hermansen: Longer Human Lifespan and the Retirement Decision 2013-6 Jannie H.G. Kristoffersen: Empirical Essays on Economics of Education 2013-7 Mark Strøm Kristoffersen: Essays on Economic Policies over the Business Cycle 2013-8 Philipp Meinen: Essays on Firms in International Trade 2013-9 Cédric Gorinas: Essays on Marginalization and Integration of Immigrants and Young Criminals – A Labour Economics Perspective 2013-10 Ina Charlotte Jäkel: Product Quality, Trade Policy, and Voter Preferences: Essays on
International Trade 2013-11 Anna Gerstrøm: World Disruption - How Bankers Reconstruct the Financial Crisis: Essays on Interpretation 2013-12 Paola Andrea Barrientos Quiroga: Essays on Development Economics 2013-13 Peter Bodnar: Essays on Warehouse Operations 2013-14 Rune Vammen Lesner: Essays on Determinants of Inequality 2013-15 Peter Arendorf Bache: Firms and International Trade 2013-16 Anders Laugesen: On Complementarities, Heterogeneous Firms, and International Trade

2013-17 Anders Bruun Jonassen: Regression Discontinuity Analyses of the Disincentive Effects of Increasing Social Assistance 2014-1 David Sloth Pedersen: A Journey into the Dark Arts of Quantitative Finance 2014-2 Martin Schultz-Nielsen: Optimal Corporate Investments and Capital Structure 2014-3 Lukas Bach: Routing and Scheduling Problems - Optimization using Exact and Heuristic Methods 2014-4 Tanja Groth: Regulatory impacts in relation to a renewable fuel CHP technology:
A financial and socioeconomic analysis 2014-5 Niels Strange Hansen: Forecasting Based on Unobserved Variables 2014-6 Ritwik Banerjee: Economics of Misbehavior 2014-7 Christina Annette Gravert: Giving and Taking – Essays in Experimental Economics 2014-8 Astrid Hanghøj: Papers in purchasing and supply management: A capability-based perspective 2014-9 Nima Nonejad: Essays in Applied Bayesian Particle and Markov Chain Monte Carlo Techniques in Time Series Econometrics 2014-10 Tine L. Mundbjerg Eriksen: Essays on Bullying: an Economist’s Perspective 2014-11 Sashka Dimova: Essays on Job Search Assistance 2014-12 Rasmus Tangsgaard Varneskov: Econometric Analysis of Volatility in Financial Additive Noise Models 2015-1 Anne Floor Brix: Estimation of Continuous Time Models Driven by Lévy Processes 2015-2 Kasper Vinther Olesen: Realizing Conditional Distributions and Coherence Across Financial Asset Classes 2015-3 Manuel Sebastian Lukas: Estimation and Model Specification for Econometric Forecasting 2015-4 Sofie Theilade Nyland Brodersen: Essays on Job Search Assistance and Labor Market Outcomes 2015-5 Jesper Nydam Wulff: Empirical Research in Foreign Market Entry Mode
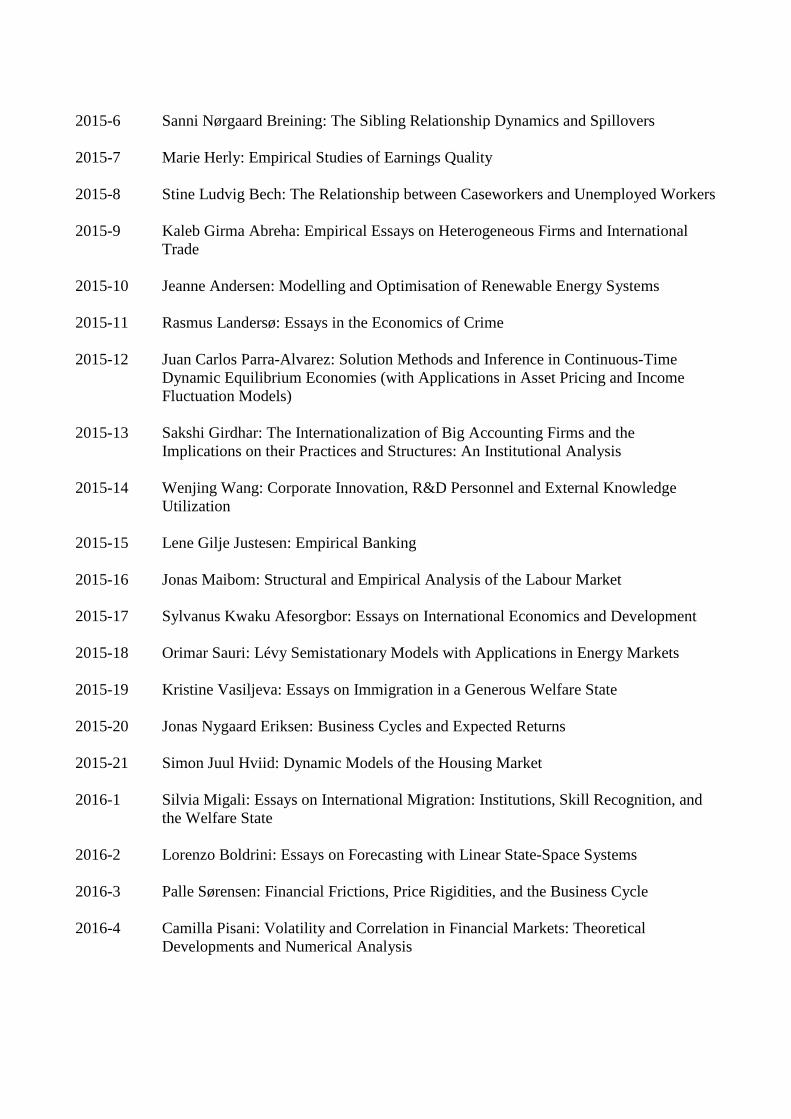
2015-6 Sanni Nørgaard Breining: The Sibling Relationship Dynamics and Spillovers 2015-7 Marie Herly: Empirical Studies of Earnings Quality 2015-8 Stine Ludvig Bech: The Relationship between Caseworkers and Unemployed Workers 2015-9 Kaleb Girma Abreha: Empirical Essays on Heterogeneous Firms and International Trade 2015-10 Jeanne Andersen: Modelling and Optimisation of Renewable Energy Systems 2015-11 Rasmus Landersø: Essays in the Economics of Crime 2015-12 Juan Carlos Parra-Alvarez: Solution Methods and Inference in Continuous-Time Dynamic Equilibrium Economies (with Applications in Asset Pricing and Income
Fluctuation Models) 2015-13 Sakshi Girdhar: The Internationalization of Big Accounting Firms and the
Implications on their Practices and Structures: An Institutional Analysis 2015-14 Wenjing Wang: Corporate Innovation, R&D Personnel and External Knowledge
Utilization 2015-15 Lene Gilje Justesen: Empirical Banking 2015-16 Jonas Maibom: Structural and Empirical Analysis of the Labour Market 2015-17 Sylvanus Kwaku Afesorgbor: Essays on International Economics and Development 2015-18 Orimar Sauri: Lévy Semistationary Models with Applications in Energy Markets 2015-19 Kristine Vasiljeva: Essays on Immigration in a Generous Welfare State 2015-20 Jonas Nygaard Eriksen: Business Cycles and Expected Returns 2015-21 Simon Juul Hviid: Dynamic Models of the Housing Market 2016-1 Silvia Migali: Essays on International Migration: Institutions, Skill Recognition, and the Welfare State 2016-2 Lorenzo Boldrini: Essays on Forecasting with Linear State-Space Systems 2016-3 Palle Sørensen: Financial Frictions, Price Rigidities, and the Business Cycle 2016-4 Camilla Pisani: Volatility and Correlation in Financial Markets: Theoretical Developments and Numerical Analysis
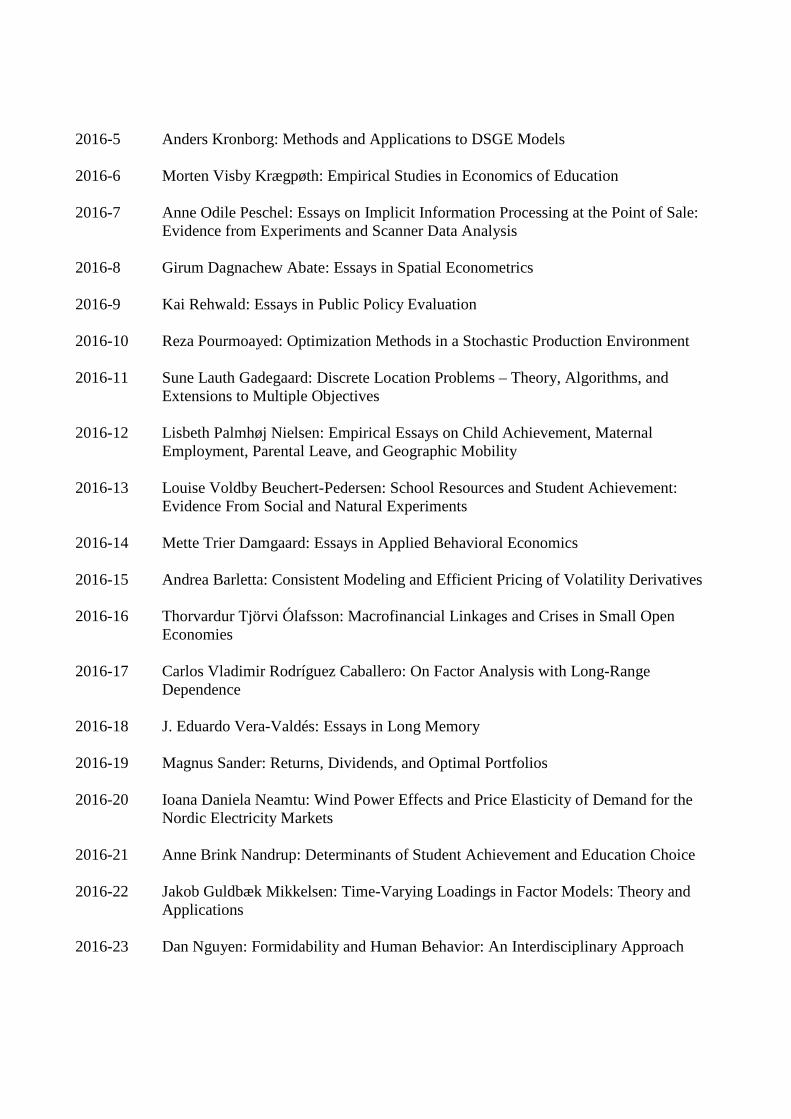
2016-5 Anders Kronborg: Methods and Applications to DSGE Models 2016-6 Morten Visby Krægpøth: Empirical Studies in Economics of Education 2016-7 Anne Odile Peschel: Essays on Implicit Information Processing at the Point of Sale: Evidence from Experiments and Scanner Data Analysis 2016-8 Girum Dagnachew Abate: Essays in Spatial Econometrics 2016-9 Kai Rehwald: Essays in Public Policy Evaluation 2016-10 Reza Pourmoayed: Optimization Methods in a Stochastic Production Environment 2016-11 Sune Lauth Gadegaard: Discrete Location Problems – Theory, Algorithms, and Extensions to Multiple Objectives 2016-12 Lisbeth Palmhøj Nielsen: Empirical Essays on Child Achievement, Maternal Employment, Parental Leave, and Geographic Mobility 2016-13 Louise Voldby Beuchert-Pedersen: School Resources and Student Achievement: Evidence From Social and Natural Experiments 2016-14 Mette Trier Damgaard: Essays in Applied Behavioral Economics 2016-15 Andrea Barletta: Consistent Modeling and Efficient Pricing of Volatility Derivatives 2016-16 Thorvardur Tjörvi Ólafsson: Macrofinancial Linkages and Crises in Small Open Economies 2016-17 Carlos Vladimir Rodríguez Caballero: On Factor Analysis with Long-Range Dependence 2016-18 J. Eduardo Vera-Valdés: Essays in Long Memory 2016-19 Magnus Sander: Returns, Dividends, and Optimal Portfolios 2016-20 Ioana Daniela Neamtu: Wind Power Effects and Price Elasticity of Demand for the Nordic Electricity Markets 2016-21 Anne Brink Nandrup: Determinants of Student Achievement and Education Choice 2016-22 Jakob Guldbæk Mikkelsen: Time-Varying Loadings in Factor Models: Theory and Applications 2016-23 Dan Nguyen: Formidability and Human Behavior: An Interdisciplinary Approach

2016-24 Martin Petri Bagger: Attention and Decision-Making: Separating Top-Down from Bottom-Up Components