highlightscpbrd.congress.gov.ph/images/pdf attachments/abn/abn2019-08_dost_fy2… · lowest in 2016...
TRANSCRIPT


HIGHLIGHTS
Expenditure Program. The Department’s total expenditure program amounts to P20.2
billion in 2020, coming from new appropriations of P19.93 billion and automatic
appropriation of P249.49 million. This is 0.4% lower than the 2019 level of P20.3 billion.
Maintenance and Other Operating Expenses (MOOE) gets 69.9% of the total expenditure
program with P14.11 billion, while Personnel Services (PS) gets 19.12% with P3.86 billion and
Capital Outlay (CO) 11.0% with P2.21 billion.
The following agencies will receive additional budgets in 2020: NAST (31.2%), PNRI (26.7%),
PIVS (17.0%), FNRI (6.5%), SEI (5.1%), STII (5.0%), PCAANRRD (2.0%), PCHRD (1.7%),
PCIEETRD (1.4%), and TAPI (1.0%). On the other hand, the following will experience a
decline in their budgets in 2020: ASTI (-18.9%), PTRI (-16.8%), PAGASA (-12.2%), FPRDI
(-11.1%), OSEC (-4.7%), NRCP (-1.5%), ITDI (-1.0%), MIRDC (-0.9%), and PSHS (-0.3%).
The Office of the Secretary (OSEC) will receive the highest allocation with 25.7% or P5.19
billion in 2020 which is 4.97% lower than the 2019 level of P5.46 billion. The Science
Education Institute (SEI) will receive the second largest share at 23.5% (P4.51 billion),
followed by the Philippine Science High School (PSHS) with 13.2% (P2.68 billion).
New Appropriations. The new appropriations for the DOST in the amount of P19.93 billion
in 2020 (0.4% less than the 2019 level of P20.02 billion) is distributed among the General
Administration and Support Services (GASS), Support to Operations (STO) and Operations.
GASS will be allotted with 9.8% of the total or P1.95 billion. STO will be allotted 4.0%
(P801.16 million) and Operations will get the bulk with 86.2% or P17.18 billion.
The following agencies will receive additional appropriations in 2020: NAST (31.3%), PNRI
(27.6%), PIVS (17.2%), FNRI (6.5%), SEI (5.1%), STII (5.0%), PCAANRRD (2.1%),
PCHRD (1.7%), PCIEETRD (1.3%), and TAPI (1.0%). On the other hand, the following will
experience a decline in their budgets in 2020: ASTI (-19.1%), PTRI (-17.2%), PAGASA (-
12.5%), FPRDI (-11.2%), OSEC (-4.8%), NRCP (-1.4%), ITDI (-1.1%), MIRDC (-1.0%), and
PSHS (-0.5%).
Allocation by Major Program. The OSEC, SEI and PSHS will corner 56.3% of the total
Operations budget of the Department. The OSEC gets 27.3% which will be appropriated for
its strategic S&T program (P2.63 billion) and S&T program for regional and countryside
development (P2.10 billion). The SEI will get 27.3% which will be devoted to its S&T
scholarship program (P4.65 billion) and S&T education development program (P44.1 million).
The PSHS will get 14.1% share which will be spent on its science, technology, engineering and

mathematics (STEM) secondary education scholarships (P2.4 billion) and STEM promotion
program (P26.6 million).
The top three programs that will receive additional budgets in 2020 are: a) Advanced S&T
R&D Program of ASTI (62.1%), b) Metals Industry S&T Services Program of the MRDI
(45.1%), and c) S&T Recognition and Policy Advisory Program of NAST (38.2%). On the
other hand, these are the top three programs that will experience a decline in budget in 2020:
a) R&D on Atmospheric, Geophysical and Astronomical and Allied Sciences Program of
PAGASA (-58.2% ), b) Weather and Climate Forecasting and Warning Program of PAGASA
(-50.1%), and c) Advanced S&T Transfer Program of ASTI (-38.8%).
Budget Utilization and Unused Appropriations. The DOST’s budget utilization (based
on obligations-to-appropriations ratio) improved from 84.4% in 2014 to 95.3% in 2018. For
the period 2014 to 2018, the unused appropriations was highest in 2015 at P3.45 billion and
lowest in 2016 at P846.8 million. In 2018, unused appropriations was P1.01 billion.
Compliance with Audit Recommendations. The three agencies which registered the
highest full compliance with the COA recommendations were the Advanced Science and
Technology Institute (100%), Food and Nutrition Research Institute (96.8%), and the
Philippine Council for Health Research and Development (91.7%) in 2018. The SEI had the
lowest full compliance rate of 67.1%. The two agencies with the highest percentage of
recommendations not implemented were the SEI (32.9%) and the Philippine Institute of
Volcanology and Seismology (32.7%).
COA revealed the DOST’s failure to collect some P251 million from the beneficiaries of its
flagship Small Enterprise Technology Upgrading Program (Setup), meant to empower
MSMEs. Receivable balances pertaining to Setup projects include P461.15 million in past due
accounts for over one to 10 years, of which P251.04 million has been reported as uncollected
refunds due to the inadequate/ineffective monitoring and evaluation on the viability of
projects.

TABLE OF CONTENTS
Page
I. Mandate and Organizational Outcomes 1
Figure 1 DOST Cost Structure and Organizational Outcomes, 2020 2
II. Sources of Appropriations 3
Table 1. DOST Sources of Funds, 2016-2020 4
Table 1.1 OSEC Sources of Funds, 2016-2020 4
III. Expenditure Program 5
Table 2 Expenditure Program by Agency, 2016-2020 6
Table 3 Expenditure Program by General Expense Class, 2016-2020 7
Table 4 Unfilled Positions by Agency, 2016-2020 7
Table 5 Regional Distribution of DOST Budget, 2017-2020 7
IV. New Appropriations 8
Table 6 New Appropriations by Agency, 2016-2020 8
Table 7 DOST Summary of Programs for 2019-2020 10
Table 8 Operations Budget by Organizational Outcome
By Program and General Expense Class, 2020, OSEC 11
V. Performance Review 11
Table 9 Obligations-Appropriations Ratio (%), 2014-2018 12
Table 10 Unused Appropriations, 2014-2018 12
Table 11 Disbursement Rate by Agency, 2018-2018 14
Table 12 Budget Utilization by Major Program, OSEC, 2018 14
Table 13 Performance Indicators by Organizational Outcomes, 2016-2018 15
Table 14 Performance Indicators of Major Programs, 2018-2020 15
VI. COA Findings and Recommendations 16
Table 15 Status of Implementation of COA Recommendations 16
Table 16 COA Auditor’s Opinions, 2014-2018 18
References 18
Annex 19

1
DEPARTMENT OF SCIENCE AND
TECHNOLOGY1
I. MANDATE AND ORGANIZATIONAL OUTCOMES
1.1 Executive Order No. 128 mandates the Department of Science and Technology (DOST),
through its Office of the Secretary (OSEC) to provide central direction, leadership and
coordination of scientific and technological efforts and ensure that the results therefrom
are geared and utilized in areas of maximum economic and social benefits for the people.
1.2 All programs, projects and activities of the Department shall redound to the achievement
of the following outcomes: (1) innovation stimulated; (2) technology adoption promoted
and accelerated; (3) critical mass of globally competitive science, technology, innovation
(STI) human resources developed; (4) productivity and efficiency of communities and the
production sector, particularly micro, small and medium enterprises (MSMEs) improved;
(5) resiliency to disaster risks and climate change ensured; (6) inequality in STI capacities
and opportunities reduced; and (7) effective STI governance achieved.
1.3 The DOST has 18 attached agencies. There are seven research and development institutes,
six service institutes, three sectoral planning councils, and two advisory bodies.
1.4 Research and Development Institutes. The agencies involved in research and
development include the following: Advanced Science and Technology Institute (ASTI)
– research and development on information and communications technology and
microelectronics; Food and Nutrition Research Institute (FNRI) – on food and nutrition;
Forest Products Research and Development Institute (FPRDI) – on forest based industry;
Industrial Technology Development Institute (ITDI) – on food, materials, chemicals,
energy, biotechnology, environment and packaging; Metals Industry Research and
Development Center (MIRDC) – on metals and engineering industries; Philippine Nuclear
Research Institute (PNRI) – on application of radiation and nuclear materials; and the
Philippine Textile Research Institute (PTRI) – on the textile industry.
1.5 Service Institutes. The agencies that provide services are as follows: Philippine
Atmospheric, Geophysical and Astronomical Services Administration (PAGASA)
provides protection against natural calamities; Philippine Institute of Volcanology and
Seismology (PIVS) predicts occurrence of volcanic eruptions and earthquakes; Philippine
Science High School (PSHS) offers free secondary course on subjects pertaining to science;
1 This document was prepared by Eleanor Mamaril as input to the deliberations of the House Committee on Appropriations on
the FY 2020 proposed National Budget. The report benefited from inputs of Director Elsie Gutierrez, Executive Director Manuel Aquino and from overall guidance of Director-General Romulo E.M. Miral, Jr. The layout/design of the infographics by Alexiz S. Taaca and Carla P. Soriano are also acknowledged. The views, opinions, and interpretations in this report do not necessarily reflect the perspectives of the House of Representatives as an institution or its individual Members. This Agency Budget Notes is available online at http://cpbrd.congress.gov.ph/.

2
FIGURE 1
DOST COST STRUCTURE AND ORGANIZATIONAL OUTCOMES, 2020
NEW APPROPRIATIONS (P19,932.13M) OSEC – P 5,144.6M
Development, adoption and implementation of harmonized R&D agenda
ASTI – P 335.5M
Benefit incidence of ASTI services among target local firms and institutions
FNRI – P 533.5M
Reduction of malnutrition prevalence FPRDI- P218.4M
Benefit incidence of FPRDI services to target local firms and institutions
ITDI – P 524.2M
Benefit incidence of ITDI services to target local firms and institutions
MIRDC – P 251.5M
Benefit incidence of MIRDC services to target local metals and engineering firms
NAST – P 105.6M
Enhancing and fostering the policy environment for the development of S&T
NRCP – P 89.9M
Problem-focused multi-disciplinary basic research, policy formulation and collaboration among Filipino researchers enhanced
PAGASA – P 1,411.8M
Extensive application by Filipinos of accurate and robust science-based weather-related information and services to enhance their safety and resilience to disaster risks
PCAANRRD – P1,230.0M
Priorities in the harmonized R&D agenda addressed
PCHRD – P652.9M
Priorities in the National Unified Health Research Agenda addressed
PCIEETRD – P724.0M
Priorities in the harmonized R&D agenda addressed
PIVS – P588.1M
Enhanced safety and resiliency of Filipinos to volcanic eruptions, earthquakes, tsunamis and other related hazards.
PNRI – P 443.8M
Benefit incidence of PNRI services to target local firms and institutions
PSHS – P2,602.1M
Competitiveness of Filipinos in science and engineering increased
PTRI – P106.9M
Benefit incidence of PTRI services among target MSMEs/local firms in textile, garment, allied industries and other institutions
SEI – P4,741.1M
Competitiveness of Filipinos in science and engineering increased
STII – P98.4M
Public science and technology awareness increased
TAPI – P130.0M
Filipinos protecting and venturing for innovative and emerging technology-based projects increased
General Administration and Support Services
P1,946.56M (9.77%)
OSEC P 404.12
ASTI P49.57
FNRI P107.05
FPRDI P89.31
ITDI P98.06
MIRDC P103.67
NAST P17.43
NRCP P 30.43
PAGASA P249.88
PCAANRRD P109.48
PCHRD P36.70
PCIEETRD P57.69
PIVS P109.36
PNRI P153.84
PSHS P 185.06
PTRI P 39.17
SEI P 45.96
STII P28.12
TAPI P31.68
Support to Operations P801.16M (4.02%)
OSEC P45.83
ASTI -----
FNRI -----
FPRDI -----
ITDI -----
MIRDC -----
NAST -----
NRCP P12.88
PAGASA P593.67
PCAANRRD -----
PCHRD -----
PCIEETRD -----
PIVS P1.63
PNRI P147.16
PSHS -----
PTRI -----
SEI -----
STII ----
TAPI ----
Operations
P17,184.41M (86.21%)
OSEC P4,694.61
ASTI P285.92
FNRI P426.46
FPRDI P129.12
ITDI P426.14
MIRDC P147.81
NAST P88.17
NRCP P46.55
PAGASA P568.24
PCAANRRD P1,120.54
PCHRD P616.20
PCIEETRD P666.30
PIVS P477.13
PNRI P142.81
PSHS P2,417.02
PTRI P67.77
SEI P4,695.10
STII P70.25
TAPI P98.28

3
Science Education Institute (SEI) undertakes science and education training; Science and
Technology Information Institute (STII) undertakes training on science and technology
information; and the Technology Application and Promotion Institute (TAPI) promotes
commercialization of technologies.
1.6 Sectoral Planning Councils. The following are the agencies involved in the development
of policies by sector: Philippine Council for Agriculture, Aquatic and Natural Resources
Research and Development (PCAANRRD) formulates strategies for science and
technology development in agriculture, forestry, aquatic and natural resources sectors;
Philippine Council for Health Research and Development (PCHRD) formulates strategies
for health science and technology development; and Philippine Council for Industry,
Energy and Emerging Technology Research and Development (PCIEETRD) develops
national research and development competence in strategic areas of industry, energy and
emerging technology.
1.7 Advisory Bodies. The following agencies provide advisory services on basic researches:
the National Academy of Science and Technology (NAST) provides incentives to engage
in scientific and technological researches; and the National Research Council of the
Philippines (NRCP) promotes basic research programs.
See Appendix for the full description of mandates of attached agencies.
II. SOURCES OF APPROPRIATIONS
2.1 Total appropriations come from new, automatic, supplementary and continuing
appropriations, and budget adjustments. For the 2020 cash-based budgeting, total
available appropriations come only from new and automatic appropriations. The 2020
DOST budget can still be supplemented by budgetary adjustments in the course of its
implementation. Continuing appropriations from unused appropriations of the previous
fiscal years are, however, not expected from cash-based budgeting.
2.2 Total available appropriation for 2020 is a 4.23% decrease from the 2019 level (P21.07
billion). The total available appropriations of the DOST for 2020 is initially estimated at
P20.18 billion. The DOST will get new appropriations of P19.91 billion and automatic
appropriations of P250 million (Table 1). The shares of new appropriations and automatic
appropriations to the total available appropriations for 2020 are higher at 98.6% and 1.2%,
respectively, compared to their 2019 levels.
2.3 During the period 2016-2018, the average percentage share of new appropriations was
94.1% while that of continuing appropriations was at 4.5%.

4
TABLE 1
DOST SOURCES OF FUNDS, 2016-2020
Particulars Obligation-Based Cash-Based
2016 2017 2018 2019 2020
Levels (in Million Pesos)
New Appropriations 14,352.9 20,770.2 21,020.16 20,018.94 19,932.13
Supplemental Appropriations
Automatic Appropriations 232.4 225.9 246.97 242.55 249.49
Continuing Appropriations 1,011.9 569.9 - 811.03 -
Budgetary Adjustments 402.6 387.9 194.02 - -
Total Available Appropriations 15,999.1 21,953.1 21,461.00 21,073.46 20,181.63
LESS: Unused Appropriations 846.8 1,336.8 1,008.82 811.61 -
Total Obligations 15,152.5 20,616.0 20,452.28 20,260.48 20,181.63
% Share (%)
New Appropriations 89.71 94.61 97.95 95.00 98.76
Supplemental Appropriations
Automatic Appropriations 1.45 1.03 1.15 1.15 1.24
Continuing Appropriations 6.32 2.60 3.85
Budgetary Adjustments 2.52 1.77 0.90
Total Available Appropriations 100.0 100.0 100.0 100.0 100.0
Sources of basic data: NEP 2018-2020
2.4 Office of the Secretary (OSEC). The total available appropriations of the OSEC which
account for the bulk of the total DOST appropriations is P5.19 billion in 2020, which is
4.97% lower than the 2019 level of P5.46 billion. Ninety-nine percent (99%) of this is made
up of new appropriations. The remaining 1.0% comes from automatic appropriations
(Table 1.1).
TABLE 1.1 OSEC SOURCES OF FUNDS, 2016-2020
Particulars Obligation-Based Cash-Based
2016 2017 2018 2019 2020
New Appropriations 3,901.2 4,505.2 4,901.2 5,402.1 5,144.6
Automatic Appropriation of which RLIP* 32.1 36.2 41.1 44.3 45.00
Continuing Appropriations 134.5 65.3 14.7
Budgetary Adjustments 118.5 148.2 100.0
Transfers from:
Calamity Funds 77.5 61.3
Miscellaneous and Personnel Benefit Funds 102.0 55.1 20.4
Pension Gratuity Fund 16.5 15.3 18.2
DICT 0.3
Total Available Appropriations 4,186.3 4,754.8 5,042.2 5,461.2 5,189.6
LESS: Unused Appropriations 75.0 74.6 22.5 14.7
Total Obligations 4,111.3 4,680.2 5,019.8 5,446.4 5,189.6
New Appro-Total Available Appro Ratio (%) 93.19 94.75 97.20 98.92 99.13
* RLIP - Retirement and Life Insurance Premiums Sources of basic data: NEP 2018-2020
2.5 Budget adjustments significantly decreased from P118.5 million in 2016 to P100.0 million
in 2018 and consisted of transfers from miscellaneous and personnel benefit and pension

5
gratuity funds from 2016 to 2018, and additional transfers from the calamity fund in 2017
and 2018, and to the Department of Information and Communications Technology
(DICT) in 2017.
III. EXPENDITURE PROGRAM
3.1 The expenditure program is the programmed amount out of the total appropriations to
enable the national government to contract delivery of goods and services in a given fiscal
year. The DOST’s cash-based budget in 2020 is P20.2 billion., lower by 0.4% of the 2019
level (P20.3 billion). The OSEC, Science Education Institute (SEI), and the Philippine
Science High School (PSHS) combined get 62.4% of the total budget or P13.24 billion
(Table 2).
The following agencies will receive additional budgets in 2020: NAST (31.2%), PNRI
(26.7%), PIVS (17.0%), FNRI (6.5%), SEI (5.1%), STII (5.0%), PCAANRRD (2.0%),
PCHRD (1.7%), PCIEETRD (1.4%), and TAPI (1.0%). On the other hand, the following
will experience a decline in their budgets in 2020: ASTI (-18.9%), PTRI (-16.8%),
PAGASA (-12.2%), FPRDI (-11.1%), OSEC (-4.7%), NRCP (-1.5%), ITDI (-1.0%),
MIRDC (-0.9%), and PSHS (-0.3%).
3.2 From 2016 to 2018, the total expenditure program grew, on the average, by 13.4%, from
P15.15 billion in 2016 to P21.23 billion in 2018. In 2020, the list of agencies with the
biggest cash-based budgets are the OSEC with P5,189.6 million or 25.7% of total, followed
by SEI with P4,744.2 million (23.5% of total), and PSHS with P2,671.8 million or 13.2%.
3.3 By General Expense Class. Maintenance and Other Operating Expenses (MOOE) will
get the highest share of the expenditure program in 2020 at 69.9% amounting to P14.11
billion. It is followed by Personnel Services (PS) at 19.1% (P3.9 billion) and Capital Outlay
(CO) at 11% (P2.2 billion). The percentage shares of PS and MOOE in 2020 are lower
than in 2019 by less than one percentage point. On the other hand, the percentage share
of CO is higher by one percentage point (Table 3).
The 2020 allocations for PS and MOOE were smaller than the 2019 levels by 1.53% and
0.7%, respectively. CO allocations grew by 3.76% in 2020.
3.4 Unfilled Positions. The share of total unfilled positions to authorized positions in 2020
is 14.3%, same as the current year’s share. Out of the 798 unfilled positions, 562 are in
these three agencies: PSHS with 263, PAGASA with 218, and OSEC with 81 (Table 4).
3.5 Regional Distribution. The National Capital Region (NCR) and Central Office will get
the bulk of the cash appropriations in 2020. NCR gets 56.4% or P11.39 billion while the
Central Office gets 16.1% (or P3.25 billion). The next big share at 9.1% goes to Region 4B
(or P1.84 billion). The Autonomous Region of Muslim Mindanao will not get any cash
appropriations again in 2020 (Table 5).
6
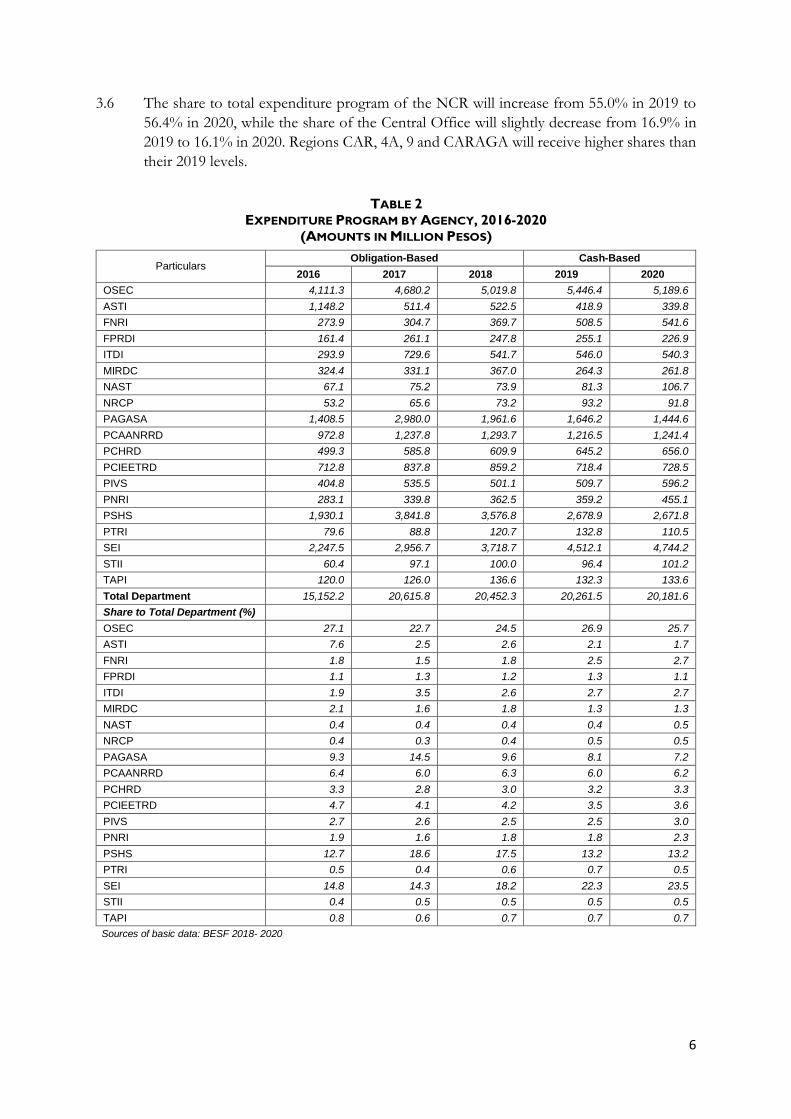
3.6 The share to total expenditure program of the NCR will increase from 55.0% in 2019 to
56.4% in 2020, while the share of the Central Office will slightly decrease from 16.9% in
2019 to 16.1% in 2020. Regions CAR, 4A, 9 and CARAGA will receive higher shares than
their 2019 levels.
TABLE 2
EXPENDITURE PROGRAM BY AGENCY, 2016-2020 (AMOUNTS IN MILLION PESOS)
Particulars Obligation-Based Cash-Based
2016 2017 2018 2019 2020
OSEC 4,111.3 4,680.2 5,019.8 5,446.4 5,189.6
ASTI 1,148.2 511.4 522.5 418.9 339.8
FNRI 273.9 304.7 369.7 508.5 541.6
FPRDI 161.4 261.1 247.8 255.1 226.9
ITDI 293.9 729.6 541.7 546.0 540.3
MIRDC 324.4 331.1 367.0 264.3 261.8
NAST 67.1 75.2 73.9 81.3 106.7
NRCP 53.2 65.6 73.2 93.2 91.8
PAGASA 1,408.5 2,980.0 1,961.6 1,646.2 1,444.6
PCAANRRD 972.8 1,237.8 1,293.7 1,216.5 1,241.4
PCHRD 499.3 585.8 609.9 645.2 656.0
PCIEETRD 712.8 837.8 859.2 718.4 728.5
PIVS 404.8 535.5 501.1 509.7 596.2
PNRI 283.1 339.8 362.5 359.2 455.1
PSHS 1,930.1 3,841.8 3,576.8 2,678.9 2,671.8
PTRI 79.6 88.8 120.7 132.8 110.5
SEI 2,247.5 2,956.7 3,718.7 4,512.1 4,744.2
STII 60.4 97.1 100.0 96.4 101.2
TAPI 120.0 126.0 136.6 132.3 133.6
Total Department 15,152.2 20,615.8 20,452.3 20,261.5 20,181.6
Share to Total Department (%)
OSEC 27.1 22.7 24.5 26.9 25.7
ASTI 7.6 2.5 2.6 2.1 1.7
FNRI 1.8 1.5 1.8 2.5 2.7
FPRDI 1.1 1.3 1.2 1.3 1.1
ITDI 1.9 3.5 2.6 2.7 2.7
MIRDC 2.1 1.6 1.8 1.3 1.3
NAST 0.4 0.4 0.4 0.4 0.5
NRCP 0.4 0.3 0.4 0.5 0.5
PAGASA 9.3 14.5 9.6 8.1 7.2
PCAANRRD 6.4 6.0 6.3 6.0 6.2
PCHRD 3.3 2.8 3.0 3.2 3.3
PCIEETRD 4.7 4.1 4.2 3.5 3.6
PIVS 2.7 2.6 2.5 2.5 3.0
PNRI 1.9 1.6 1.8 1.8 2.3
PSHS 12.7 18.6 17.5 13.2 13.2
PTRI 0.5 0.4 0.6 0.7 0.5
SEI 14.8 14.3 18.2 22.3 23.5
STII 0.4 0.5 0.5 0.5 0.5
TAPI 0.8 0.6 0.7 0.7 0.7
Sources of basic data: BESF 2018- 2020

7
TABLE 3
EXPENDITURE PROGRAM BY GENERAL EXPENSE CLASS, 2016-2020 (AMOUNTS IN MILLION PESOS)
Part.
Obligation-Based Cash-Based
2016 2017 2018 2019 2020
Amount % Amount % Amount % Amount % Amount %
PS 2,998.0 19.79 3,340.3 16.20 3,600.6 17.60 3,918.9 19.34 3,859.0 19.12
MOOE 10,063.0 66.41 11,531.0 55.93 12,981.9 63.47 14,211.1 70.14 14,111.1 69.92
CO 2,091.2 13.80 5,744.5 13.80 3,869.7 18.92 2,131.4 10.52 2,211.5 10.96
Total 15,152.2 100.00 20,615.8 100.00 20,452.3 100.00 20,261.5 100.00 20,181.6 100.00
Sources of basic data: BESF 2018- 2020
TABLE 4 UNFILLED POSITIONS BY AGENCY, 2016-2020
Agency Number of Unfilled Positions Share to Authorized Positions (%)
2016 2017 2018 2019 2020 2016 2017 2018 2019 2020
OSEC 90 86 80 81 81 11.2 10.5 9.8 9.9 9.9
ASTI 18 11 11 9 9 22.0 12.8 12.6 10.3 10.3
FNRI 25 28 23 23 22 13.4 15.1 12.4 12.4 11.8
FPRDI 5 8 12 16 16 2.6 4.2 6.3 8.3 8.3
ITDI 52 47 39 38 38 14.1 12.7 10.6 10.3 10.3
MIRDC 11 12 9 11 11 4.9 5.3 3.9 4.8 4.8
NAST 0 7 5 2 2 0 38.9 27.8 11.1 11.1
NRCP 2 2 1 6 6 5.4 5.4 2.7 14.3 14.3
PAGASA 181 206 221 218 218 17.5 19.9 21.4 21.1 21.1
PCAANRRD 27 34 29 29 29 10.6 13.4 11.4 11.4 11.4
PCHRD 4 8 6 5 5 6.7 13.3 10.0 8.3 8.3
PCIEETRD 7 11 12 6 6 9.9 15.5 16.2 8.1 8.1
PIVS 28 37 31 31 31 11.8 15.6 13.1 13.1 13.1
PNRI 55 42 40 38 38 21.0 16.0 15.3 14.5 14.5
PSHS 176 314 274 263 263 16.4 22.7 18.9 18.2 18.2
PTRI 8 9 9 9 9 9.0 10.1 10.1 10.1 10.1
SEI 7 10 8 9 9 13.2 17.2 13.8 15.5 15.5
STII 2 1 0 0 0 3.7 1.9 0 0 0
TAPI 3 8 2 5 5 5.1 12.5 3.1 7.8 7.8
TOTAL 701 881 812 799 798 13.6 16.0 14.6 14.3 14.3
Source: Staffing Summary 2018-2020
TABLE 5
REGIONAL DISTRIBUTION OF THE DOST BUDGET, 2017-2020 (AMOUNTS IN MILLION PESOS)
Region
Obligation-Based Cash-Based
2017 2018 2019 2020
Amount Share
(%) Amount
Share (%)
Amount Share
(%) Amount
Share (%)
Nationwide 0 - 0 0 - 0 -
Central Office 2,360.5 11.4 2,741.7 13.4 3,429.9 16.9 3,247.5 16.1
NCR 11,454.7 55.6 10,749.1 52.6 11,145.3 55.0 11,389.2 56.4
CAR 296.7 1.4 271.0 1.3 249.7 1.2 264.2 1.3
Reg 1 339.5 1.6 376.3 1.8 250.6 1.2 229.7 1.1
Reg 2 460.5 2.2 390.0 1.9 363.6 1.8 332.7 1.6
Reg 3 492.7 2.4 422.6 2.1 324.8 1.6 290.0 1.4
Reg 4A 1,918.5 9.3 2,092.7 10.2 1,753.5 8.7 1,837.3 9.1
Reg 4B 201.0 1.0 372.3 1.8 238.5 1.2 220.3 1.1
Reg 5 368.2 1.8 274.8 1.3 306.0 1.5 281.4 1.4
Reg 6 316.0 1.5 395.4 1.9 324.6 1.6 288.0 1.4
Reg 7 396.5 1.9 310.6 1.5 289.4 1.4 285.8 1.4
Reg 8 432.1 2.1 297.2 1.5 288.7 1.4 225.4 1.1
Reg 9 206.6 1.0 317.4 1.6 196.7 1.0 237.7 1.2
Reg 10 374.8 1.8 344.0 1.7 315.9 1.6 323.1 1.6
Reg 11 276.2 1.3 291.5 1.4 282.1 1.4 254.0 1.3
Reg 12 421.9 2.0 463.4 2.3 270.4 1.3 237.2 1.2
CARAGA 293.5 1.4 342.1 1.7 231.7 1.1 238.1 1.2
ARMM 5.9 0.0 0 - 0 - 0 -
Total 20,615.8 100.0 20,452.3 100.0 20,261.5 100.0 20,181.6 100.0
Source: BESF 2019-2020

8
IV. NEW APPROPRIATIONS
4.1 The proposed new appropriations of the DOST and its attached agencies for FY 2020
amounts to P19.9 billion, 0.4% less than the 2019 level of P20.02 billion. In terms of share
to the total Department budget, the OSEC will get the biggest chunk at 25.8% or P5.14
billion (Table 6). The SEI will get 23.8% (P4.74 billion) followed by PSHS at 13.1% (P2.60
billion). These three agencies will corner 62.7% of the total new appropriations of the
DOST.
TABLE 6 NEW APPROPRIATIONS BY AGENCY, 2016-2020
(AMOUNTS IN MILLION PESOS)
Particulars Obligation-Based Cash-Based
2016 2017 2018 2019 2020
OSEC 3,901.2 4,505.2 4,901.2 5,402.1 5,144.6
ASTI 870.2 595.2 545.6 414.6 335.5
FNRI 259.2 266.7 368.5 500.8 533.5
FPRDI 138.9 259.4 242.8 246.0 218.4
ITDI 254.1 763.2 553.0 530.0 524.2
ICTO 3,677.1
MIRDC 301.5 313.7 354.4 254.0 251.5
NAST 67.1 86.2 81.3 80.4 105.6
NRCP 45.7 64.5 71.3 91.2 89.9
PAGASA 1,210.2 3,297.6 2,456.2 1,613.5 1,411.8
PCAANRRD 949.4 1,237.4 1,287.3 1,205.0 1,230.0
PCHRD 493.0 581.6 607.2 642.1 652.9
PCIEETRD 686.9 845.8 860.3 714.6 724.0
PIVS 451.9 471.5 533.4 502.0 588.1
PNRI 248.8 336.7 335.4 347.7 443.8
PSHS 1,984.1 3,900.5 3,769.9 2,614.2 2,602.1
PTRI 74.7 79.8 116.2 129.1 106.9
SEI 2,244.6 2,951.7 3,711.5 4,509.1 4,741.1
STII 57.8 93.9 98.3 93.7 98.4
TAPI 113.4 122.6 126.6 128.7 130.0
Total Department 18,029.3 20,763.0 21,020.1 20,019.0 19,932.1
Share to Total Department (%)
OSEC 21.64 21.69 23.32 26.98 25.81
ASTI 4.83 2.87 2.80 2.07 1.68
FNRI 1.44 1.28 1.75 2.50 2.68
FPRDI 0.77 1.25 1.16 1.23 1.10
ITDI 1.41 3.67 2.63 2.65 2.63
ICTO 20.39
MIRDC 1.67 1.51 1.69 1.27 1.26
NAST 0.37 0.41 0.39 0.40 0.53
NRCP 0.25 0.31 0.34 0.46 0.45
PAGASA 6.71 15.87 11.68 8.06 7.08
PCAANRRD 5.27 5.96 6.12 6.02 6.17
PCHRD 2.73 2.80 2.89 3.21 3.28
PCIEETRD 3.81 4.07 4.09 3.57 3.63
PIVS 2.51 2.27 2.54 2.51 2.95
PNRI 1.38 1.62 1.60 1.74 2.23
PSHS 11.0 18.78 17.93 13.06 13.05
PTRI 0.41 6.38 0.55 0.64 0.54
SEI 12.45 14.21 17.66 22.52 23.79
STII 0.32 0.45 0.47 0.47 0.49
TAPI 0.63 0.59 0.60 0.64 0.65
Sources of basic data: GAA 2016- 2019 and NEP 2020
9
The following agencies will receive additional appropriations in 2020: NAST (31.3%),
PNRI (27.6%), PIVS (17.2%), FNRI (6.5%), SEI (5.1%), STII (5.0%), PCAANRRD
(2.1%), PCHRD (1.7%), PCIEETRD (1.3%), and TAPI (1.0%). On the other hand, the
following will experience a decline in their budgets in 2020: ASTI (-19.1%), PTRI (-17.2%),
PAGASA (-12.5%), FPRDI (-11.2%), OSEC (-4.8%), NRCP (-1.4%), ITDI (-1.1%),
MIRDC (-1.0%), and PSHS (-0.5%).
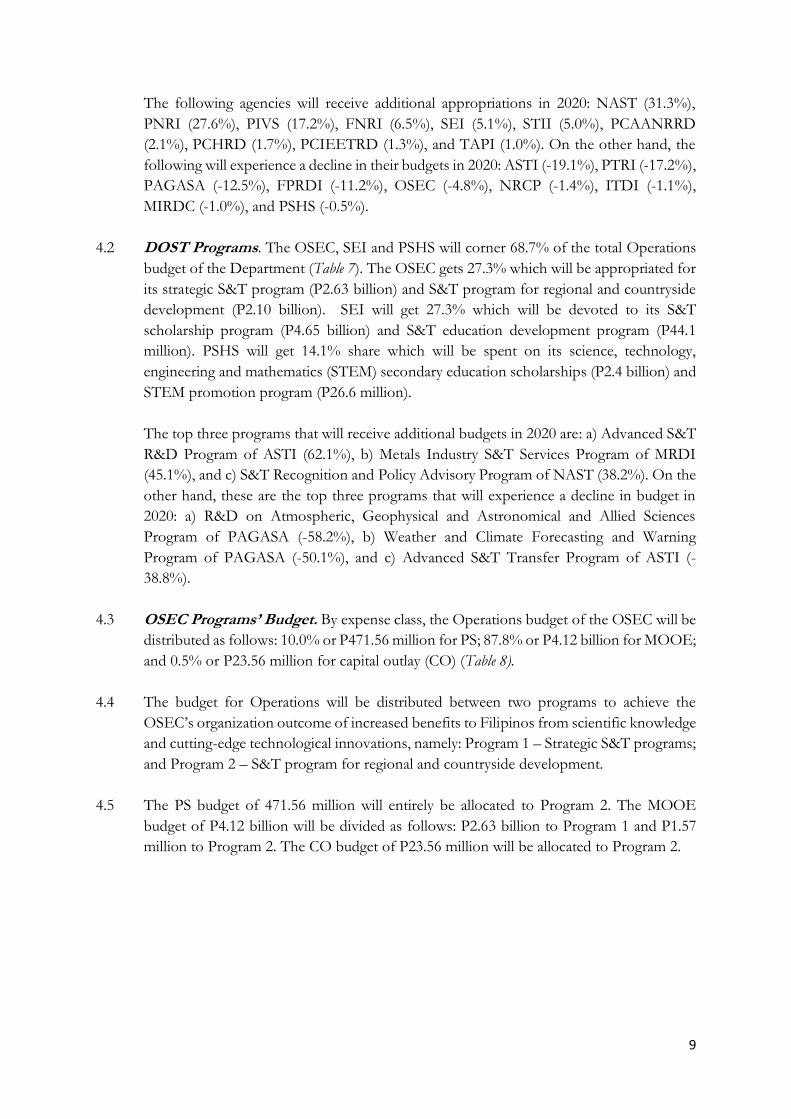
4.2 DOST Programs. The OSEC, SEI and PSHS will corner 68.7% of the total Operations
budget of the Department (Table 7). The OSEC gets 27.3% which will be appropriated for
its strategic S&T program (P2.63 billion) and S&T program for regional and countryside
development (P2.10 billion). SEI will get 27.3% which will be devoted to its S&T
scholarship program (P4.65 billion) and S&T education development program (P44.1
million). PSHS will get 14.1% share which will be spent on its science, technology,
engineering and mathematics (STEM) secondary education scholarships (P2.4 billion) and
STEM promotion program (P26.6 million).
The top three programs that will receive additional budgets in 2020 are: a) Advanced S&T
R&D Program of ASTI (62.1%), b) Metals Industry S&T Services Program of MRDI
(45.1%), and c) S&T Recognition and Policy Advisory Program of NAST (38.2%). On the
other hand, these are the top three programs that will experience a decline in budget in
2020: a) R&D on Atmospheric, Geophysical and Astronomical and Allied Sciences
Program of PAGASA (-58.2%), b) Weather and Climate Forecasting and Warning
Program of PAGASA (-50.1%), and c) Advanced S&T Transfer Program of ASTI (-
38.8%).
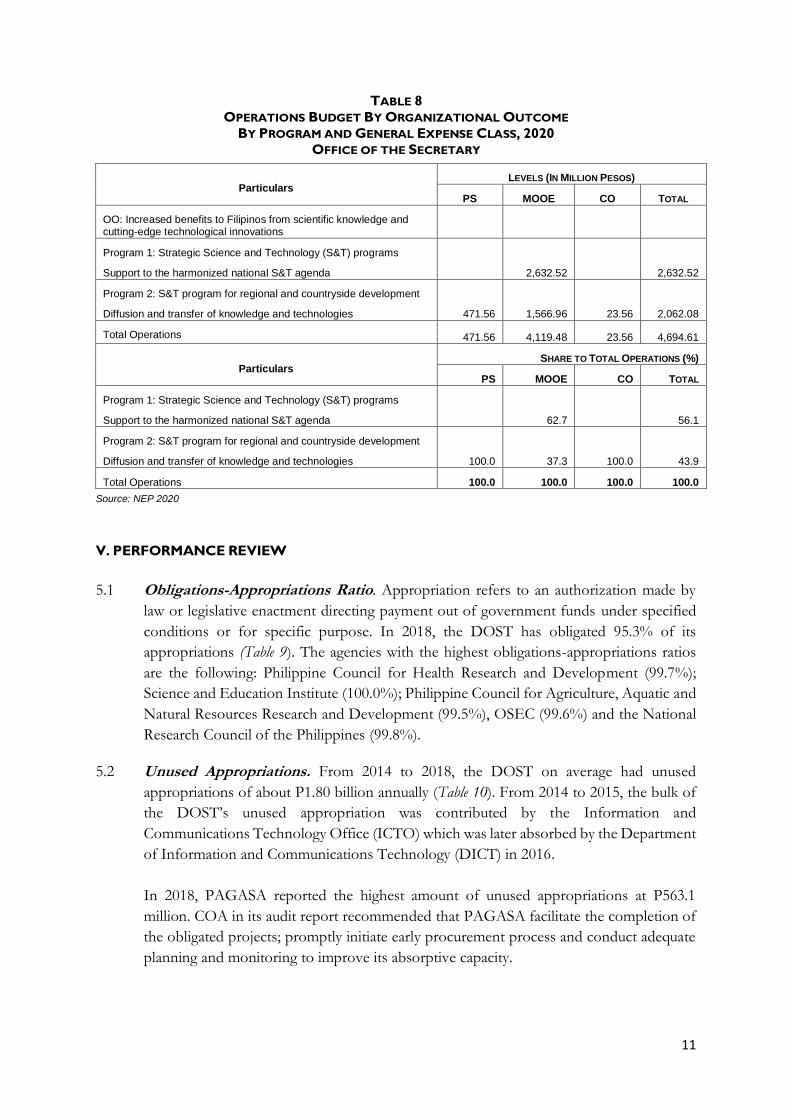
4.3 OSEC Programs’ Budget. By expense class, the Operations budget of the OSEC will be
distributed as follows: 10.0% or P471.56 million for PS; 87.8% or P4.12 billion for MOOE;
and 0.5% or P23.56 million for capital outlay (CO) (Table 8).
4.4 The budget for Operations will be distributed between two programs to achieve the
OSEC’s organization outcome of increased benefits to Filipinos from scientific knowledge
and cutting-edge technological innovations, namely: Program 1 – Strategic S&T programs;
and Program 2 – S&T program for regional and countryside development.
4.5 The PS budget of 471.56 million will entirely be allocated to Program 2. The MOOE
budget of P4.12 billion will be divided as follows: P2.63 billion to Program 1 and P1.57
million to Program 2. The CO budget of P23.56 million will be allocated to Program 2.

10
TABLE 7
DOST SUMMARY OF PROGRAMS FOR 2019-2020
Program Implementing
Agency
Amount(M) Growth Rate (%)
%Share to Total Program Cash-Based
2019 2020 ’19-‘20 2019 2020
Strategic S&T program OSEC 3,012.1 2,632.5 -12.6 16.88 15.32
S&T program for regional and countryside development
OSEC 2,115.4 2,062.1 -2.5 11.86 12.00
Advanced S&T transfer program ASTI 305.9 187.1 -38.8 1.71 1.09
Advanced S&T R&D program ASTI 61.0 98.9 62.1 0.34 0.58
Nutritional assessment and monitoring program FNRI 341.3 336.7 -1.3 1.91 1.96
Food and nutrition R&D program FNRI 48.5 55.4 14.2 0.27 0.32
Food and nutrition technology and knowledge diffusion program
FNRI 33.5 34.4 2.7 0.19 0.20
Forest products R&D program FPRDI 94.3 92.2 -2.2 0.53 0.54
Forest products S&T services program FPRDI 19.6 19.1 -2.6 0.11 0.11
Forest products technology transfer program FPRDI 19.4 17.9 -7.7 0.11 0.10
Industrial technology technical services program ITDI 233.8 201.3 -13.9 1.31 1.17
Industrial technology R&D program ITDI 153.6 198.5 29.2 0.86 1.16
Industrial technology transfer program ITDI 43.1 26.4 -38.7 0.24 0.15
Metals industry research program MIRDC 108.5 92.9 -14.4 0.61 0.54
Metals industry science and technology services program
MIRDC 22.6 32.8 45.1 0.13 0.19
Metals industry technology transfer program MIRDC 23.3 22.1 -5.2 0.13 0.13
S&T recognition and policy advisory program NAST 63.8 88.2 38.2 0.36 0.51
Basic R&D management program NRCP
NRCP 46.3 44.9 -3.0 0.26 0.26
Policy development for S&T advisory program NRCP 2.1 1.7 -19.1 0.01 0.01
Weather and climate forecasting and warning program
PAGASA 901.7 450.1 -50.1 5.05 2.62
R&D on atmospheric, geophysical and astronomical and allied sciences program
PAGASA 156.1 65.2 -58.2 0.88 0.38
Flood forecasting and warning program PAGASA 54.6 52.9 -3.1 0.31 0.31
National AANR sector R&D program PCAANRD 1,096.0 1,120.5 2.2 6.14 6.52
National health R&D program PCHRD 620.4 616.2 -0.7 3.48 3.59
National industry, energy and emerging industry sectors R&D program
PCIEETRD 655.7 666.3 1.6 3.68 3.88
Volcano, earthquake and tsunami monitoring and warning program
PIVS 295.4 342.8 16.1 1.66 1.99
Hazards mapping, risk assessment and R&D program
PIVS 87.0 111.0 27.6 0.49 0.65
Disaster preparedness and risk reduction program PIVS 24.0 23.3 -2.9 0.13 0.14
Nuclear S&T services and advisory program PNRI 80.8 83.3 3.1 0.45 0.48
Nuclear R&D program PNRI 43.4 43.2 -0.5 0.24 0.25
Nuclear regulations, security and safeguards program
PNRI 18.7 16.3 -12.8 0.10 0.09
STEM secondary education on scholarship basis program
PSHS 2,306.5 2,390.4 3.6 12.93 13.91
STEM promotion program PSHS 28.4 26.6 -6.3 0.16 0.15
Textile and other textile-related R&D program PTRI 52.1 32.0 -38.6 0.29 0.19
Textile S&T services program PTRI 21.0 15.0 -28.6 0.12 0.09
Textile technology transfer program PTRI 20.8 20.8 - 0.12 0.12
S&T scholarship program SEI 4,425.3 4,651.0 5.1 24.81 27.06
S&T education development program SEI 44.5 44.1 -0.9 0.25 0.26
S&T information program STII 60.8 70.2 15.5 0.34 0.41
Technology application and invention development program
TAPI 98.2 98.3 0.1 0.55 0.57
Source: GAA 2019 and NEP 2020
11
TABLE 8
OPERATIONS BUDGET BY ORGANIZATIONAL OUTCOME BY PROGRAM AND GENERAL EXPENSE CLASS, 2020
OFFICE OF THE SECRETARY
Particulars LEVELS (IN MILLION PESOS)
PS MOOE CO TOTAL
OO: Increased benefits to Filipinos from scientific knowledge and cutting-edge technological innovations
Program 1: Strategic Science and Technology (S&T) programs
Support to the harmonized national S&T agenda 2,632.52 2,632.52
Program 2: S&T program for regional and countryside development
Diffusion and transfer of knowledge and technologies 471.56 1,566.96 23.56 2,062.08
Total Operations 471.56 4,119.48 23.56 4,694.61
Particulars SHARE TO TOTAL OPERATIONS (%)
PS MOOE CO TOTAL
Program 1: Strategic Science and Technology (S&T) programs
Support to the harmonized national S&T agenda 62.7 56.1
Program 2: S&T program for regional and countryside development
Diffusion and transfer of knowledge and technologies 100.0 37.3 100.0 43.9
Total Operations 100.0 100.0 100.0 100.0
Source: NEP 2020
V. PERFORMANCE REVIEW
5.1 Obligations-Appropriations Ratio. Appropriation refers to an authorization made by
law or legislative enactment directing payment out of government funds under specified
conditions or for specific purpose. In 2018, the DOST has obligated 95.3% of its
appropriations (Table 9). The agencies with the highest obligations-appropriations ratios
are the following: Philippine Council for Health Research and Development (99.7%);
Science and Education Institute (100.0%); Philippine Council for Agriculture, Aquatic and
Natural Resources Research and Development (99.5%), OSEC (99.6%) and the National
Research Council of the Philippines (99.8%).
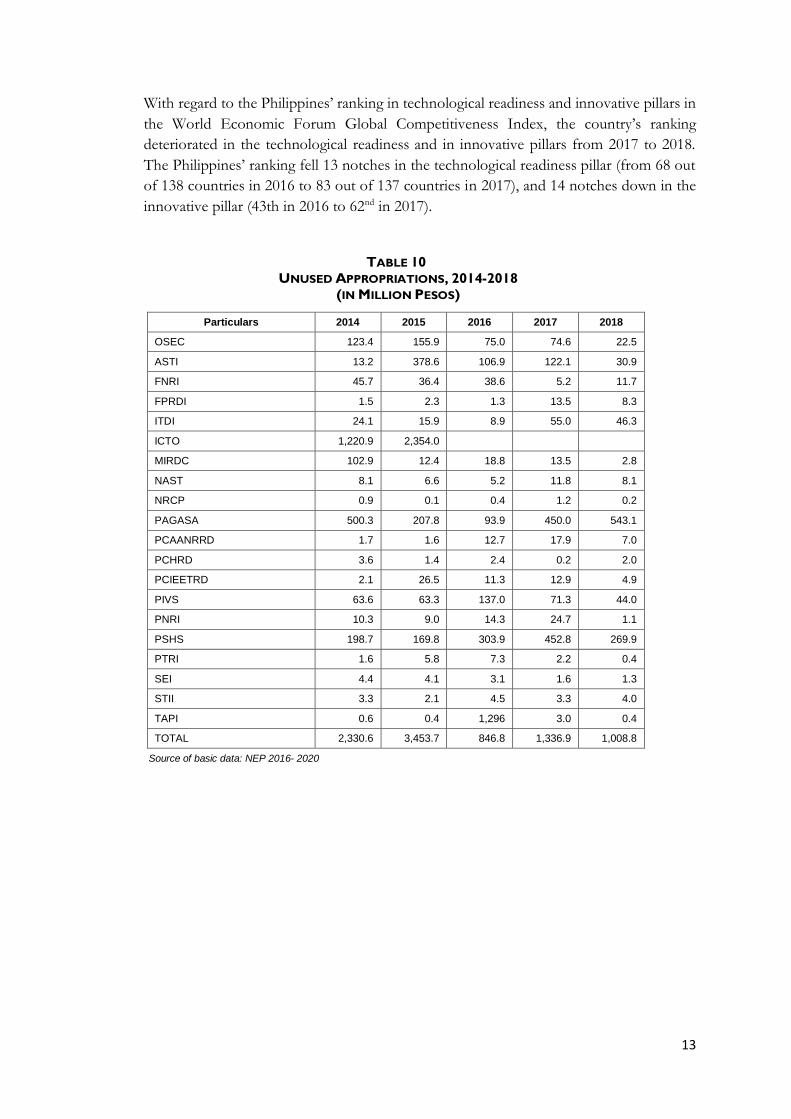
5.2 Unused Appropriations. From 2014 to 2018, the DOST on average had unused
appropriations of about P1.80 billion annually (Table 10). From 2014 to 2015, the bulk of
the DOST’s unused appropriation was contributed by the Information and
Communications Technology Office (ICTO) which was later absorbed by the Department
of Information and Communications Technology (DICT) in 2016.
In 2018, PAGASA reported the highest amount of unused appropriations at P563.1
million. COA in its audit report recommended that PAGASA facilitate the completion of
the obligated projects; promptly initiate early procurement process and conduct adequate
planning and monitoring to improve its absorptive capacity.

12
TABLE 9
OBLIGATION-APPROPRIATIONS RATIO (%), 2014-2018
Particulars 2014 2015 2016 2017 2018
OSEC 95.6 95.1 98.2 98.4 99.6
ASTI 85.5 51.2 91.5 81.6 94.4
FNRI 85.1 89.8 87.6 98.3 96.9
FPRDI 99.2 98.6 99.2 95.1 96.8
ITDI 92.0 94.6 97.1 93.0 92.1
ICTO 39.5 48.1
MIRDC 84.4 95.9 94.5 96.1 99.2
NAST 88.6 90.3 92.8 86.4 90.1
NRCP 98.8 99.8 99.3 98.2 99.8
PAGASA 73.5 94.8 93.7 86.9 78.3
PCAANRRD 99.9 99.8 98.7 98.6 99.5
PCHRD 99.2 99.7 99.5 100.0 99.7
PCIEETRD 99.6 95.8 98.4 98.5 99.4
PIVS 82.8 86.0 74.7 88.3 91.9
PNRI 96.2 96.8 95.2 93.2 99.7
PSHS 82.0 87.2 86.4 89.5 93.0
PTRI 97.5 92.3 91.7 97.6 99.7
SEI 99.7 99.8 99.9 99.9 100.0
STII 94.6 96.3 93.1 96.7 96.1
TAPI 99.4 99.7 99.0 97.7 99.7
Total Department 84.4 83.1 94.7 93.9 95.3
Sources of basic data: NEP 2016-2020
5.3 Disbursement Rate. Disbursement rate refers to the ratio of disbursements or settlement
of actual government obligations in the form of cash, check and other modes of payment
to total obligations. Low disbursement rates may indicate that an agency is not
implementing its projects in a timely manner during the year.
The disbursement rate of DOST improved from 69.1% in 2017 to 76.7% in 2018. In 2018,
these agencies have the lowest disbursement rates: PAGASA at 42.0%, PSHS with 58.9%,
and ITDI with 59.7% (Table 11).
5.4 Budget Utilization by Major Program. In 2018, all the appropriations for the three
major programs of the OSEC were obligated but were not completely disbursed.
Operations had a disbursement rate of only 60.3%, Support to Operations, 60.3%, and
GASS, 94.1% (Table 12).
5.5 Performance Indicators by Organizational Outcomes. In 2018, DOST set a target of
23,860 MSMEs to be assisted, but has actually assisted 52,790 MSMEs – which means that
it exceeded its target by 121.25%. This organizational outcome was also exceeded with
respect to its 2016 and 2017 targets by 0.14% and 2.85%, respectively (Table 13).
13
With regard to the Philippines’ ranking in technological readiness and innovative pillars in
the World Economic Forum Global Competitiveness Index, the country’s ranking
deteriorated in the technological readiness and in innovative pillars from 2017 to 2018.
The Philippines’ ranking fell 13 notches in the technological readiness pillar (from 68 out
of 138 countries in 2016 to 83 out of 137 countries in 2017), and 14 notches down in the
innovative pillar (43th in 2016 to 62nd in 2017).
TABLE 10 UNUSED APPROPRIATIONS, 2014-2018
(IN MILLION PESOS)
Particulars 2014 2015 2016 2017 2018
OSEC 123.4 155.9 75.0 74.6 22.5
ASTI 13.2 378.6 106.9 122.1 30.9
FNRI 45.7 36.4 38.6 5.2 11.7
FPRDI 1.5 2.3 1.3 13.5 8.3
ITDI 24.1 15.9 8.9 55.0 46.3
ICTO 1,220.9 2,354.0
MIRDC 102.9 12.4 18.8 13.5 2.8
NAST 8.1 6.6 5.2 11.8 8.1
NRCP 0.9 0.1 0.4 1.2 0.2
PAGASA 500.3 207.8 93.9 450.0 543.1
PCAANRRD 1.7 1.6 12.7 17.9 7.0
PCHRD 3.6 1.4 2.4 0.2 2.0
PCIEETRD 2.1 26.5 11.3 12.9 4.9
PIVS 63.6 63.3 137.0 71.3 44.0
PNRI 10.3 9.0 14.3 24.7 1.1
PSHS 198.7 169.8 303.9 452.8 269.9
PTRI 1.6 5.8 7.3 2.2 0.4
SEI 4.4 4.1 3.1 1.6 1.3
STII 3.3 2.1 4.5 3.3 4.0
TAPI 0.6 0.4 1,296 3.0 0.4
TOTAL 2,330.6 3,453.7 846.8 1,336.9 1,008.8
Source of basic data: NEP 2016- 2020

14
TABLE 11
DISBURSEMENT RATE BY AGENCY, 2017-2018 (AMOUNTS IN MILLION PESOS)
Particulars
2017 2018
Oblig Disb. Disb
Ratio Oblig. Disb.
Disb. Ratio
OSEC 4,680.2 3,360.1 71.8 5,019.8 3,838.2 76.5
ASTI 541.4 238.2 44.0 522.5 336.2 64.4
FNRI 304.7 245.0 80.4 369.7 350.2 94.7
FPRDI 261.1 236.9 90.8 247.8 222.9 90.0
ITDI 729.6 323.8 44.4 541.7 323.2 59.7
MIRDC 331.1 229.6 69.3 367.0 286.2 78.0
NAST 75.2 72.3 96.1 73.9 66.6 90.2
NRCP 65.6 63.9 97.4 73.2 70.5 96.3
PAGASA 2,980.0 863.4 29.0 1,961.6 822.9 42.0
PCAANRRD 1,237.8 1,198.5 96.8 1,293.7 1,134.3 87.7
PCHRD 585.8 565.9 96.6 609.8 605.2 99.2
PCIEETRD 537.8 793.0 94.7 860.3 760.6 88.4
PIVS 535.5 438.4 81.9 501.1 402.1 80.2
PNRI 339.8 307.9 90.6 362.5 332.1 91.6
PSHS 3,841.8 2,073.5 54.0 3,576.8 2,106.1 58.9
PTRI 88.8 81.0 91.2 120.7 108.7 90.0
SEI 2,956.7 2,947.7 99.7 3,718.7 3,714.2 99.9
STII 97.1 82.9 85.4 100.0 86.7 86.7
TAPI 126.0 119.3 94.7 132.6 129.6 97.7
TOTAL 20,615.8 14,241.3 69.1 20,453.4 15,696.6 76.7
Note: Disbursement rate is the percentage of disbursements over obligations.
Source: 2017-2018 SAAODB DBM
TABLE 12
BUDGET UTILIZATION BY MAJOR PROGRAM, OSEC, 2018 AMOUNTS IN MILLION PESOS
Program Approp Oblig Disb Oblig Rate (%)
Disb Rate (%)
GASS General management and supervision Administration of personnel benefits 147.6 147.5 138.8 99.9 94.1
STO Planning, policy formulation, monitoring, evaluation and management information services Conduct of scientific and technological conferences and exhibitions and international/local science and technological networking and other related activities 75th Mtg of the ASEAN Committee on Science and Technology and the 10th Informal ASEAN Ministerial Mtg on Science and Technology 39.3 39.2 34.0 99.7 86.7
Operations Strategic S&T program 2,456.2 2,456.2 1,480.8 100.0 60.3
Total 2,643.0 2,642.9 1,653.5 100.0 62.6
Note: Obligation rate is the ratio of obligations to appropriations. Disbursement rate is the ratio of disbursements to obligations.
Source: SAAODB (FAR No. 1 in Transparency Seal), DOST

15
TABLE 13
PERFORMANCE INDICATORS BY ORGANIZATIONAL OUTCOMES, 2016-2018
Program 2016
Actual 2017 Actual
2018
Target Actual
Development, adoption and implementation of harmonized R&D agenda
100% 100% N/A N/A
Increase in the number of MSMEs assisted 0.14% 2.85% 23,860 52,790
PH ranking in technological readiness and innovative pillars of the World Economic Forum Global Competitiveness Index
68/138 in technological
readiness, 48/138 in in
innovative pillars
83/137 in technological
readiness, 62/137 in
innovative pillars
N/A N/A
Source: NEP 2019-2020
5.6 Performance Indicators of Major Programs. The two major programs of the DOST
are the SEI’s S&T scholarship program with a proposed allocation of P4.65 billion and the
OSEC’s strategic S&T program with a proposed allocation of P2.63 billion in 2020. Table
14 shows the targets of the outcome and output indicators for 2018 to 2020. In 2018, the
actual performance of the outcome and output indicators were generally well above their
targets.
However, the Department should review the targets it sets since almost all indicators have
targets pegged at the same level as the baseline. The baseline is the minimum or starting
point used for comparison.
TABLE 14 PERFORMANCE INDICATORS OF MAJOR PROGRAMS, 2018-2020
Program 2018 2019
Target 2020
Target Target Actual
S&T scholarship program ( P4.65B)
Outcome Indicators
1.percentage of scholars employed in STEM--related fields 60% 79% 60% 65%
2.percentage of municipalities served 96% 97% 96% 97%
Output indicators
1.Number of scholars supported
Undergraduate level
Master’s program
Doctoral program
23,393
3,495
1,526
23,531
3,632
1,270
26,831
4,206
1,985
28,900
4,264
1,927
2.percentage of scholars graduating within the scheduled full-time program
Undergraduate level
Master’s program
Doctoral program
85%
70%
40%
98%
71%
61%
85%
70%
40%
85%
70%
40%
3.percentage of scholarship payments with a variance of actual payment to scheduled payment of more than one (1) day
90% 97%
90% 90%
Strategic S&T program (P2.6B)
Outcome Indicators
1.percentage of projects completed within the required timeframe 10% n/a 14% 16%
2.percentage of projects completed which are published in peer-reviewed journals, presented in national and/or international conferences or with IP filed or approved
90% 90%
90% 90%
3. percentage of priorities in the harmonized R&D agenda addressed 80% 80% 80% n/a
Output Indicators
1. Number of projects funded 152 164 98 173
2. percentage of programs received that are evaluated and approved within the standard period of 95 days
77% 89% n/a 75%
3. percentage of new and on-going projects monitored 100% 100% n/a n/a
4. Number of grantees supported 80 218 98 173
Source: NEP 2019-2020

16
“Targets should not be set very low such that they can be achieved easily and, therefore,
do not motivate and inspire the staff to improve performance. For clearly defining and
setting the target it is necessary to know the baseline and to set various benchmarks and
the end-line to be achieved within a feasible timeline.” (http://paiman.jsi.com/)
VI. COA FINDINGS AND RECOMMENDATIONS
6.1 Status of Implementation of COA Recommendations. Table 15 shows the status of
implementation of the Commission on Audit’s recommendations presented in the 2018
DOST Annual Audit Report. The three agencies which registered highest full compliance
were the Advanced Science and Technology Institute (100%), Food and Nutrition
Research Institute (96.8%), and Philippine Council for Health Research and Development
(91.7%). The Science Education Institute had the lowest full compliance rate of 67.1%.
TABLE 15
STATUS OF IMPLEMENTATION OF COA RECOMMENDATIONS AS OF DECEMBER 2018
PARTICULARS TOTAL FULLY IMPLEMENTED PARTIALLY IMPLEMENTED NOT IMPLEMENTED
NUMBER (%) NUMBER (%) NUMBER (%)
OSEC 65 56 86.2 - - 9 13.8
ASTI 18 18 100.0 - - 0 0.0
FNRI 31 30 96.8 - - 1 3.2
ITDI 39 33 84.6 - - 6 15.4
NAST 22 17 77.3 - - 5 22.7
NRCP 28 26 92.9 - - 2 7.1
PAGASA
PCHRD 35 34 91.7 - - 1 2.9
PCIEETRD 43 34 79.1 - - 9 20.9
PIVS 49 33 67.3 - - 16 32.7
PNRI 25 22 88.0 - - 3 12.0
PSHS - -
PTRI 23 21 91.3 - - 2 8.7
SEI 70 47 67.1 - - 23 32.9
STII 25 22 88.0 - - 3 12.0
TAPI 29 23 79.3 - - 6 20.7
Source: 2017 Annual Audit Reports (Part 3). Available at www.coa.gov.ph
6.2 The two agencies with the highest percentage of recommendations not implemented were
the Science Education Institute (32.9%) and the Philippine Institute of Volcanology and
Seismology (PIVS) (32.7%). The SEI has yet, among others, to observe proper accounting
and maintain separate books of accounts for each fund source; continue sending demand
letters/notices to all persons with outstanding balance to liquidate/settle immediately their
accountabilities and/or refund all unexpended balances; regularly update the database to

17
identify active scholars and those who are inactive/terminated in order to provide
appropriate measure or action to be taken to facilitate liquidation.
6.3 To mention a few, the PIVS has still to update/accomplish ledgers with complete details
relevant to specific projects/construction to facilitate the analysis/evaluation and
reconciliation of related accounts; reconcile beginning balance of P30.034 million with the
Land Bank and provide necessary details in their books.
6.4 Most of COA’s observations touched on the following issues (i) internal control
deficiencies on cash management; (ii) dormant funds/accounts; (iii) delayed submission of
financial reports; (iv) non-compliance with laws, rules and regulations; (v) non-remittance
of collections to the National Treasury; (vi) overstatement of Inventory Accounts; and (vii)
non-restoration of the cash equivalent of unreleased checks.
6.5 COA revealed the department’s failure to collect some P251 million from the beneficiaries
of its flagship Small Enterprise Technology Upgrading Program (Setup), meant to
empower MSMEs. Receivable balances pertaining to Setup projects include P461.150
million past due accounts for over one to 10 years, of which P251.040 million reported
with uncollected refunds due to the inadequate/ineffective monitoring and evaluation on
the viability of projects.
6.6 Termination of contract agreements by various beneficiaries was due to the following:
weak market demand, health problems of the owners, internal conflicts with the
organization, low sales and others which ultimately led to nonpayment of their obligation
to the government.
6.7 In its recommendation, the COA said the DOST should conduct a technology needs
assistance to evaluate the viability of the proposals, prior to approving them. “Include in
the selection criteria of prospective proponents the stability of proponent’s business and
its target markets to ensure returns on government investments and the attainment of the
objective of bringing science and technology for countryside development,” the report
said, adding that the department should also intensify its monitoring, after the release of
funds.
6.8 The COA’s opinion on the fairness of presentation and reliability of financial statements
of the OSEC, Advanced Science and Technology Institute, Philippine Atmospheric,
Geophysical and Astronomical Services Administration, Philippine Council for Industry,
Energy and Emerging Technology Research and Development, Philippine Institute of
Volcanology and Seismology, Philippine Nuclear Research Institute, Philippine Science
High School, Science Education Institute and Science and Technology Information
Institute remain “qualified” since 2014.

18
TABLE 16
COA AUDITOR’S OPINIONS
Particulars 2014 2015 2016 2017 2018
OSEC Q Q Q Q Q
ASTI Q Q Q Q Q
FNRI UQ UQ Q Q Q
ITDI Q UQ UQ Q Q
NAST UQ UQ UQ Q Q
NRCP UQ Q UQ Q Q
PAGASA Q Q Q Q
PCHRD Q Q Q A Q
PCIEETRD Q Q Q Q Q
PIVS Q Q Q Q Q
PNRI Q Q Q Q Q
PSHS Q Q Q Q
SEI Q Q Q Q Q
STII Q Q Q Q Q
TAPI Q UQ Q Q Q
Auditor’s Opinions are as follows: unqualified (UQ), qualified (Q), adverse (A), and disclaimer of opinion (D) Source of basic data: COA Annual Audit Reports available at www.coa.gov.ph
6.9 After the Philippine Council for Health Research and Development received “adverse”
opinion in 2017 for the misstatements by P103.85 million or 15.4 % of its total assets,
resulting in over/under statements of the affected accounts, it was rendered a qualified
opinion in 2018.
6.10 The Food Nutrition and Research Institute, Industrial Technology Development Institute,
National Academy of Science and Technology, and the National Research Council of the
Philippines changed in opinion from “unqualified” to “qualified”.
REFERENCES:
Budget Expenditures and Sources of Financing (BESF) 2016-2020 COA Annual Audit Report (Latest available data in COA website) General Appropriations Act (GAA). FYs 2016-2019 National Expenditure Program (NEP) FYs 2016-2020 Release/Status of Disbursements available at www.dbm/gov.ph/e-Fund Statement of Allotment, Obligation, Disbursement and Balances available at www.dbm.gov.ph www.dost.gov.ph

19
ANNEX 1. DOST ATTACHED AGENCIES
Agency Organizational Outcomes
Office of the Secretary Widespread benefits to Filipinos from scientific knowledge and cutting-edge technological innovations increased
Advanced Science and Technology Institute
Widespread benefits to Filipinos from scientific knowledge and ICT and microelectronics technologies increased
Food and Nutrition Research Institute
Widespread application to Filipinos of scientific knowledge and food and nutrition technologies increased
Forest Products Research & Development. Institute
Widespread benefits to Filipinos from scientific knowledge and forest-based product technological innovations increased
Industrial Technology Development Institute
Widespread benefits to Filipinos from scientific knowledge and technologies for industry productivity and competitiveness increased.
Metals Industry Research & Development Center
Widespread benefits to Filipinos from scientific knowledge and cutting-edge metals and engineering innovations increased
National Academy of Science and Technology
Widespread benefits to Filipinos from scientific knowledge and cutting-edge technological innovations by enhancing and fostering the policy environment for the development of Science and Technology
National Research Council of the Philippines
Problem-focused multi-disciplinary basic research, policy formulation and collaboration among Filipino researchers enhanced
Philippine Atmospheric, Geophysical, and Astronomical Services Administration
Extensive application by Filipinos of accurate and robust science-based weather-related information and services to enhance their safety and resilience to disaster risks
Philippine Council for Agriculture, Aquatic and Natural Resources Research and Development
Widespread benefits to Filipinos from science-based know-how and tools for agricultural productivity increased
Philippine Council for Health Research and Development
Widespread benefits to Filipinos from scientific and technological innovations for healthcare increased
Philippine Council for Industry, Energy and Emerging Technology Research and Development
Widespread benefits to Filipinos from scientific knowledge and technological innovations for productivity and competitiveness increased
Philippine Institute of Volcanology & Seismology
Enhanced safety and resiliency of Filipinos to volcanic eruptions, earthquakes, tsunamis and other related hazards
Philippine Nuclear Research Institute
Widespread benefits to Filipinos from science-based R&D know-how and tools in safe and secure cutting-edge nuclear and radiation technologies increased
Philippine Science High School Competitiveness of Filipinos in science and engineering increased
Philippine Textile Research Institute
Widespread benefits to Filipinos from scientific knowledge and technological innovations for the productivity and competitiveness of textile, garment and allied industries and other institutions increased
Science Education Institute Competitiveness of Filipinos in science and engineering increased
Science and Information Technology Institute
Public science and technology awareness increased
Technology Application and Promotion Institute
Filipinos protecting and venturing for innovative and emerging technology-based projects increased
Source: 2018 National Expenditure Program

20
Research and Development Institutes
The Advanced Science and Technology Institute (ASTI) is mandated to perform the following functions: scientific research
and development in the advanced fields of information and communications technology and microelectronics; undertake long-
term researches to strengthen and modernize science and technology infrastructure; conduct research and development works
in the advanced fields of studies including biotechnology and microelectronics; and complement the overall endeavor in the
scientific field with intensive activities in computer and information technologies.
The Food and Nutrition Research Institute (FNRI) undertakes researches that define the citizenry’s nutritional status, with
reference to the malnutrition problem, its causes and effects; develops and recommends policy options, strategies, programs and
projects for implementation by appropriate agencies; and diffuses knowledge and technologies in food and nutrition and provides
scientific and technology (S&T) services to relevant stakeholders.
The Forest Products Research and Development Institute (FPRDI) conducts applied research and development in secondary
and tertiary processing for the forest-based industry to generate information and technology which can improve the utility value
of wood and other forest products. The FPRDI also undertakes the transfer of completed researches directly to end-users or via
linkage units of other government agencies; undertakes technical services; and provides training programs.
The Industrial Technology Development Institute (ITDI) provides innovative technologies and services in the areas of food,
materials, chemicals, energy, biotechnology, environment and packaging to both private and government sectors with the highest
standards of quality and reliability, within our capabilities and resources according to customer and all applicable regulatory and
statutory requirements. The ITDI is also committed to continually improve the effectiveness of our QMS at all times in order to
meet customer satisfaction.
The Metals Industry Research and Development Center (MIRDC) provides both government and the private sector in the
metals and engineering industries with professional management and technical expertise on training of engineers and
technicians, information exchange, trade accreditation services, quality control and testing of metal products, research and
development, and business economics advisory services
The Philippine Nuclear Research Institute (PNRI) conducts R&D on application of radiation and nuclear materials, processes
and techniques in agriculture, food, health, nutrition and medicine and in industrial or commercial enterprises; undertakes the
transfer of research results to end-users including technical extension and training services; operates and maintains nuclear
research reactors and other radiation facilities; licenses and regulates activities relative to production, transfer and utilization of
nuclear and radioactive substances.
The Philippine Textile Research Institute (PTRI) performs the following functions: conduct applied research and development
for the textile industry sector; undertake the transfer of completed researchers to end-users or via linkage units of other
government agencies; and undertake technical services and provide training programs.
Service Institutes
The Philippine Atmospheric, Geophysical and Astronomical Services Administration (PAGASA) provides protection
against natural calamities and utilizes scientific knowledge as an effective instrument to insure the safety, well-being and
economic security of all the people, and for the promotion of national progress.
The Philippine Institute of Volcanology and Seismology (PHILVOCS) has the following strategic objectives: predict the
occurrence of volcanic eruptions and earthquakes and their related geotectonic phenomena; determine how eruptions and
earthquakes shall occur and also areas likely to be affected; generate sufficient data for forecasting volcanic eruptions and
earthquakes; mitigate hazards of volcanic activities through appropriate detection, forecast and warning system; formulate
appropriate disaster preparedness plans; exploit the positive aspects of volcanoes and volcanic terrains in furtherance of the
socio-economic development efforts of the government.
The Philippine Science High School (PSHS) is mandated to offer, on a free scholarship basis, a secondary course with special
emphasis on subjects pertaining to the sciences with the end in view of preparing its students for a science career.
The Science Education Institute (SEI) undertakes science education and training; administers scholarships, awards and grants;
undertakes science and technology manpower development; and formulates plans and establishes programs and projects for

21
the promotions and development of science and technology education and training in coordination with the Department of
Education (DepEd), Commission on Higher Education (CHED) and other institutions of learning.
The Science and Technology Information Institute (STII) establishes a Science and Technology databank and library;
disseminates Science and Technology information; and undertakes training on Science and Technology information.
The Technology Application and Promotion Institute (TAPI) serves as implementing arm of DOST in promoting the
commercialization of technologies and marketing the services of the other operating units of the department. It provides grants
and/or venture financing assistance for new and emerging projects; administers the Invention Development Assistance Fund
(IDAF) and the Inventors Guarantee Fund (IGF) for assisting inventors for invention-related activities and commercialization of
inventions; assists technology generators, inventors, and researchers avail of the laboratories and other facilities of the Research
and Development Institutes including regional offices and other government agencies, offices and instrumentalities; accredits and
recognizes inventors’ associations throughout their activities.
Sectoral Planning Councils
The Philippine Council for Agriculture, Aquatic and Natural Resources Research and Development (PCAARRD)
formulates policies, plans, programs, projects, and strategies for science and technology development, in the agriculture, forestry,
aquatic and natural resources sectors. PCARRD programs and allocates government and external funds generated for R&D
efforts in the agriculture, forestry, marine and natural resources sectors; monitors R&D projects; and generates external funds
for its R&D activities.
The Philippine Council for Health Research and Development (PCHRD) formulates policies, plans, programs, projects, and
strategies for health S&T development; programs and allocates government and external funds for R&D; monitors R&D projects;
and generates external funds.
The Philippine Council for Industry, Energy and Emerging Technology Research and Development (PCIEETRD) performs
the following functions to develop national R&D competence in strategic areas of industry, energy and emerging technology:
formulate national policies, programs and implementing strategies for advanced science industry and energy sectors; program
and allocate government and other external funds earmarked for advanced science, industry and energy sectors; provide the
mechanism for assessment, evaluation and monitoring of R&D programs and updating of the national R&D plan; develop and
implement resource generating strategies to implement and sustain programs for the sectors; provide support for the development
of institutions and R&D human resource pool; establish, develop and maintain local and international technical cooperation and
linkages; develop and implement programs for the optimal utilization, transfer, and commercialization of technologies and other
research outputs; and establish, develop, and maintain an effective system for the acquisition and dissemination of research
information.
Advisory Bodies
The National Academy of Science and Technology (NAST) recognizes outstanding achievements in science and technology
as well as provides meaningful incentives to those engaged in scientific and technological researches and advises the President
and the Cabinet on matters related to science and technology. NAST engages in projects and programs designed to recognize
outstanding achievements in science; promotes scientific productivity; and embarks on programs traditionally and internationally
expected of an academy of science.
The National Research Council of the Philippines (NRCP) promotes and supports fundamental or basic research and
comprehensive research programs. It promotes cooperation in research for continuing total improvement of the research
capability of individual or group scientists; provides advice to the government on problems and issues of national interest;
promotes scientific and technological culture in all sectors of society; and fosters linkages with local and international scientific
organizations for enhanced cooperation in the development of information.