attachment j-2: cost documentation “factsheets” and
TRANSCRIPT

Attachment J-2: Cost Documentation “Factsheets” and
Summary Table of Costs

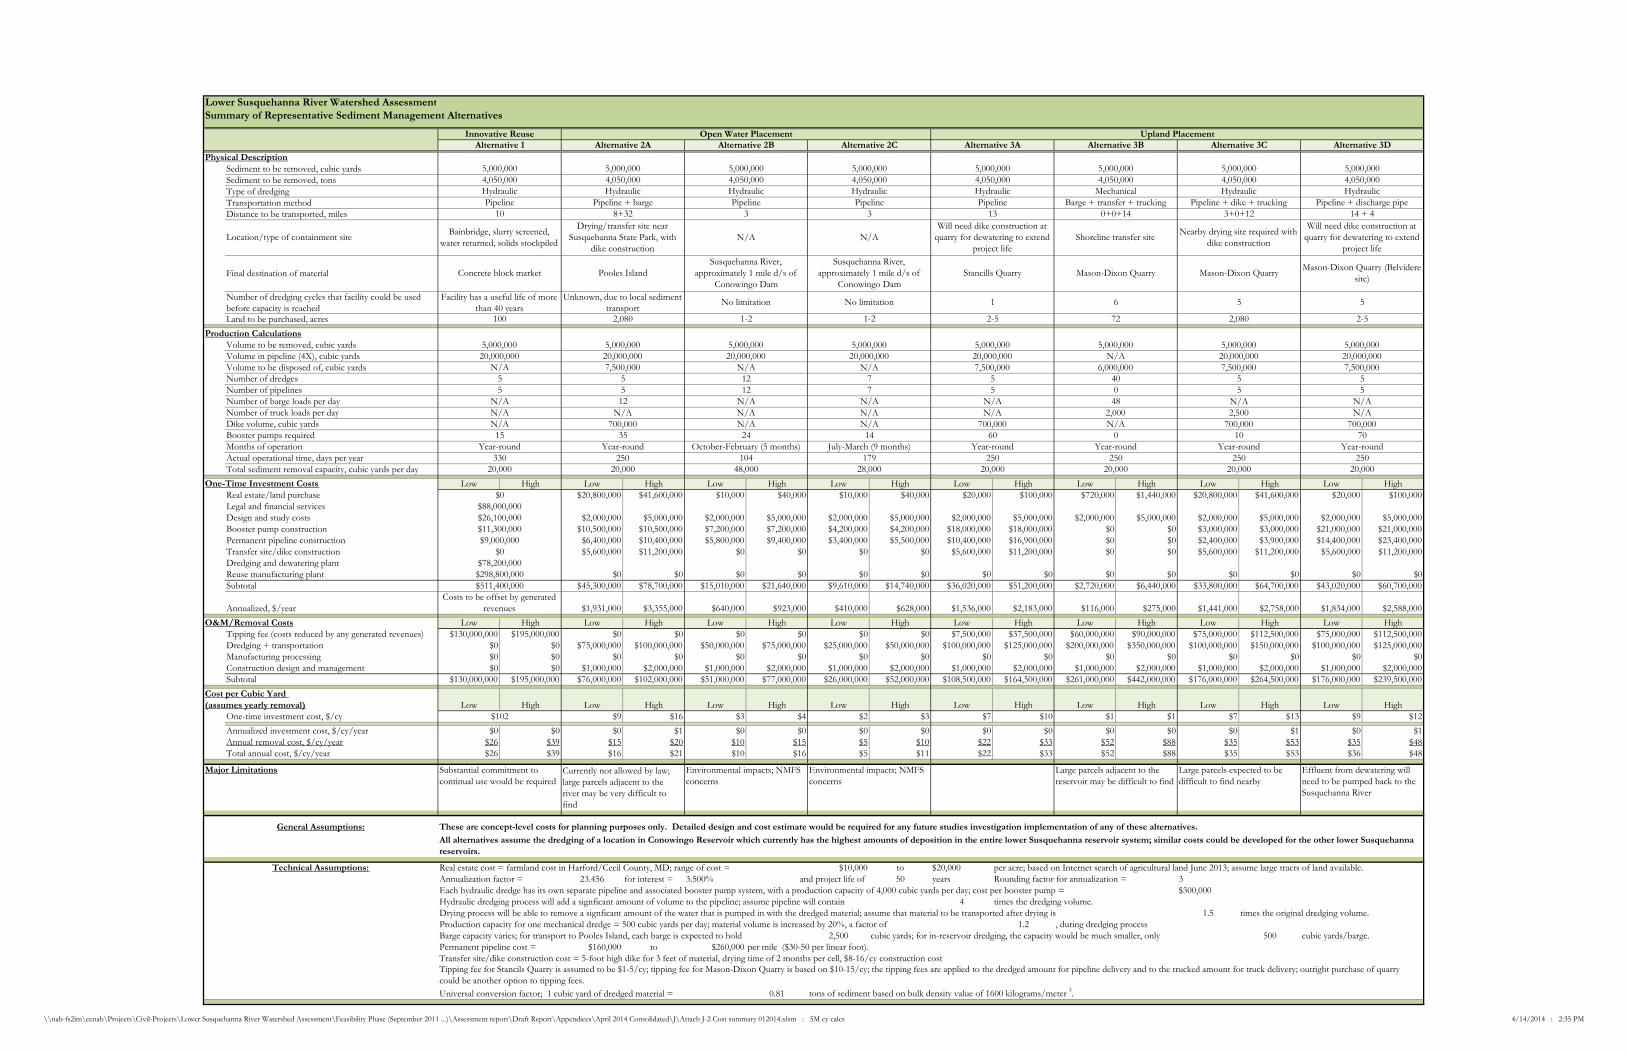
Lower Susquehanna River Watershed AssessmentSummary of Representative Sediment Management Alternatives
Physical DescriptionSediment to be removed, cubic yardsSediment to be removed, tonsType of dredging Transportation methodDistance to be transported, miles
Final destination of material
Land to be purchased, acres
Production CalculationsVolume to be removed, cubic yardsVolume in pipeline, cubic yardsVolume to be disposed of, cubic yardsNumber of dredgesNumber of pipelinesNumber of barge loads per dayNumber of truck loads per dayDike volume, cubic yardsBooster pumps requiredMonths of operationActual operational time, days per yearTotal sediment removal capacity, cubic yards per day
Low High Low High Low High Low High Low High Low High Low High Low HighReal estate/land purchase $4,200,000 $8,400,000 $10,000 $40,000 $10,000 $40,000 $20,000 $100,000 $150,000 $300,000 $4,200,000 $8,400,000 $20,000 $100,000Legal and financial services $0 $0 $0 $0 $0 $0 $0 $0 $0 $0 $0 $0 $0 $0Design and study costs $2,000,000 $5,000,000 $2,000,000 $5,000,000 $2,000,000 $5,000,000 $2,000,000 $5,000,000 $2,000,000 $5,000,000 $2,000,000 $5,000,000 $2,000,000 $5,000,000Booster pump construction $2,100,000 $2,100,000 $1,800,000 $1,800,000 $1,200,000 $1,200,000 $3,600,000 $3,600,000 $0 $0 $600,000 $600,000 $4,200,000 $4,200,000Permanent pipeline construction $1,300,000 $2,100,000 $1,400,000 $2,300,000 $1,000,000 $1,600,000 $2,100,000 $3,400,000 $0 $0 $500,000 $800,000 $2,900,000 $4,700,000Transfer site/dike construction $1,100,000 $2,200,000 $0 $0 $0 $0 $1,100,000 $2,200,000 $0 $0 $1,100,000 $2,200,000 $1,100,000 $2,200,000Dredging and dewatering plant $0 $0 $0 $0 $0 $0 $0 $0 $0 $0 $0 $0 $0 $0Reuse manufacturing plant $0 $0 $0 $0 $0 $0 $0 $0 $0 $0 $0 $0 $0 $0Subtotal $10,700,000 $19,800,000 $5,210,000 $9,140,000 $4,210,000 $7,840,000 $8,820,000 $14,300,000 $2,150,000 $5,300,000 $8,400,000 $17,000,000 $10,220,000 $16,200,000
Annualized, $/year $456,000 $844,000 $222,000 $390,000 $179,000 $334,000 $376,000 $610,000 $92,000 $226,000 $358,000 $725,000 $436,000 $691,000
Low High Low High Low High Low High Low High Low High Low High Low HighTipping fee (costs reduced by any generated revenues) $39,000,000 $50,000,000 $0 $0 $0 $0 $0 $0 $1,500,000 $7,500,000 $12,000,000 $18,000,000 $15,000,000 $22,500,000 $15,000,000 $22,500,000Dredging + transportation $0 $0 $15,000,000 $20,000,000 $10,000,000 $15,000,000 $5,000,000 $10,000,000 $20,000,000 $25,000,000 $40,000,000 $70,000,000 $20,000,000 $30,000,000 $20,000,000 $25,000,000Manufacturing processing $0 $0 $0 $0 $0 $0 $0 $0 $0 $0 $0 $0 $0 $0 $0 $0Construction design and management $0 $0 $1,000,000 $2,000,000 $1,000,000 $2,000,000 $1,000,000 $2,000,000 $1,000,000 $2,000,000 $1,000,000 $2,000,000 $1,000,000 $2,000,000 $1,000,000 $2,000,000Subtotal $39,000,000 $50,000,000 $16,000,000 $22,000,000 $11,000,000 $17,000,000 $6,000,000 $12,000,000 $22,500,000 $34,500,000 $53,000,000 $90,000,000 $36,000,000 $54,500,000 $36,000,000 $49,500,000
One-time investment cost, $/cy $11 $20 $5 $9 $4 $8 $9 $14 $2 $5 $8 $17 $10 $16
Annualized investment cost, $/cy/year $0 $0 $0 $1 $0 $0 $0 $0 $0 $1 $0 $0 $0 $1 $0 $1Annual removal cost, $/cy/year $39 $50 $16 $22 $11 $17 $6 $12 $23 $35 $53 $90 $36 $55 $36 $50Total annual cost, $/cy/year $39 $50 $16 $23 $11 $17 $6 $12 $23 $35 $53 $90 $36 $55 $36 $50
Major Limitations
These are concept-level costs for planning purposes only. Detailed design and cost estimate would be required for any future studies investigation implementation of any of these alternatives.
Real estate cost = farmland cost in Harford/Cecil County, MD; range of cost = $10,000 to $20,000 per acre; based on Internet search of agricultural land June 2013; assume large tracts of land available.Annualization factor = 23.456 for interest = 3.500% 50 years Rounding factor for annualization = 3Each hydraulic dredge has its own separate pipeline and associated booster pump system, with a production capacity of 4,000 cubic yards per day; cost per booster pump = $300,000Hydraulic dredging process will add a signficant amount of volume to the pipeline; assume pipeline will contain 4 times the dredging volume.Drying process will be able to remove a signficant amount of the water that is pumped in with the dredged material; assume that material to be transported after drying is 1.5 times the original dredging volume.Production capacity for one mechanical dredge = 500 cubic yards per day; material volume is increased by 20%, a factor of 1.2 (compared to original dredged volume), during dredging processBarge capacity varies; for transport to Pooles Island, each barge is expected to hold 2,500 cubic yards; for in-reservoir dredging, the capacity would be much smaller, only 500 cubic yards/barge.Permanent pipeline cost = $160,000 to $260,000 per mile ($30-50 per linear foot).Transfer site/dike construction cost = 5-foot high dike for 3 feet of material, assume 2 cycles per year, $8-16/cy construction cost
Universal conversion factor; 1 cubic yard of dredged material = 0.81 tons of sediment based on bulk density value of 1600 kilograms/meter 3.
All alternatives assume the dredging of a location in Conowingo Reservoir which currently has the highest amounts of deposition in the entire lower Susquehanna reservoir system; similar costs could be developed for the other lower Susquehanna reservoirs.
Tipping fee for Stancils Quarry is assumed to be $1-5/cy with a total volume available of 9Mcy; tipping fee for Mason-Dixon Quarry is based on $10-15/cy and a total volume available of 35Mcy; the tipping fees are applied to the dredged amount for pipeline delivery and to the trucked amount for truck delivery; outright purchase of quarry could be another option to tipping fees.
$13,300,000$2,300,000$1,800,000
$108,200,000$28,600,000
$0
$27,600,000$0
Costs to be offset by generated revenues
N/A N/A N/A N/A
2
330
Hydraulic Hydraulic
Alternative 3B
8 11 3 2 1
N/AN/A
3 7 6 4 12
400 500N/A
250
10 N/AN/A2
250
Innovative Reuse
Hydraulic
Alternative 2B Alternative 2C Alternative 3A
Hydraulic
Alternative 3COpen Water Placement
1,000,000 1,000,000 1,000,000 1,000,000 1,000,000 1,000,000 1,000,000
Alternative 1 Alternative 2AUpland Placement
Alternative 3D
1,000,000810,000
HydraulicHydraulic
Number of dredging cycles that facility could be used before capacity is reached
Unknown, due to local sediment transport
Drying/transfer site near Susquehanna State Park, with
dike construction
Pooles Island
Pipeline3
N/A
Susquehanna River, approximately 1 mile d/s of
Conowingo Dam
Location/type of containment siteBainbridge, slurry screened,
water returned, solids stockpiled
Concrete block market
Nearby drying site required with dike construction
3+0+12
5
0+0+14Pipeline + barge
8+32
Stancills Quarry
(assumes yearly removal) Low
140,000 140,000N/A N/AN/A 140,000
O&M/Removal Costs
One-Time Investment Costs
Year-round Year-round
Low High
Year-round0
$181,800,000
4,000
October-February (5 months) July-March (9 months) Year-round Year-round
4,0004,000
and project life of
Pipeline10 3
N/A
Susquehanna River, approximately 1 mile d/s of
Conowingo Dam
83 125
1-2
Pipeline
No limitation
High Low High Low
No limitation
4,000,0001,500,000
1,000,0004,000,000
1,000,0004,000,000
Environmental impacts; NMFS concerns
Environmental impacts; NMFS concerns
Will need dike construction at quarry for dewatering to extend
project life
2-5 15
Mason-Dixon Quarry (Belvidere site)
Pipeline
1-2
Large parcels adjacent to the reservoir may be difficult to find
Barge + transfer + trucking13
Pipeline + discharge pipe14 + 4
Will need dike construction at quarry for dewatering to extend
project life
Mason-Dixon Quarry (Belvidere site)
23
2-5
Year-round
1
1,000,000
General Assumptions:
Low High
810,000Hydraulic
23
1,000,0004,000,0001,500,000
1,000,000N/A
1,200,0001 1 3 2 1
MechanicalPipeline + dike + trucking
420
Technical Assumptions:
810,000 810,000 810,000 810,000 810,000 810,000
High Low High Low HighCost per Cubic Yard
Shoreline transfer site
1,000,0004,000,000
N/A
1,000,000
Facility has a useful life of more than 40 years
0N/A
N/A N/A 1,500,000
Effluent from dewatering will need to be pumped back to the Susquehanna River
2504,000
Low High
4,000,0001,500,000
11
N/AN/A
140,00014
Large parcels expected to be difficult to find nearby
Mason-Dixon Quarry (Belvidere site)
1,000,0004,000,000
29
$182
Substantial commitment to continual use would be required
1N/A
4,000
Currently not allowed by law; large parcels adjacent to the river may be very difficult to find
100 420
12,000 8,000250 250
4,000
\\nab-fs2im\cenab\Projects\Civil-Projects\Lower Susquehanna River Watershed Assessment\Feasibility Phase (September 2011 ...)\Assessment report\Draft Report\Appendices\April 2014 Consolidated\J\Attach J-2 Cost summary 012014.xlsm : 1M cy calcs 4/14/2014 : 2:35 PM

Lower Susquehanna River Watershed AssessmentSummary of Representative Sediment Management Alternatives
Physical DescriptionSediment to be removed, cubic yards Sediment to be removed, tonsType of dredgingTransportation methodDistance to be transported, miles
Final destination of material
Land to be purchased, acres
Production Calculations
2,430,0003,000,000
Alternative 1 Alternative 2A Alternative 2B Alternative 2C Alternative 3A Alternative 3B Alternative 3C Alternative 3D
2,430,000 2,430,000 2,430,000 2,430,000 2,430,000 2,430,000 2,430,000Hydraulic
Innovative Reuse Open Water Placement
3,000,000 3,000,000 3,000,000 3,000,000 3,000,000 3,000,000 3,000,000
Mechanical HydraulicHydraulic Hydraulic Hydraulic
Location/type of containment siteBainbridge, slurry screened,
water returned, solids stockpiled
Drying/transfer site near Susquehanna State Park, with
dike constructionN/A N/A
Will need dike construction at quarry for dewatering to extend
project life
Pipeline + dike + trucking10 8+32 3 3 13 0+0+14 3+0+12
Pipeline Pipeline + barge Pipeline Pipeline Pipeline Barge + transfer + trucking
Shoreline transfer siteNearby drying site required with
dike construction
Concrete block market Pooles IslandSusquehanna River,
approximately 1 mile d/s of Conowingo Dam
Susquehanna River, approximately 1 mile d/s of
Conowingo DamStancills Quarry Mason-Dixon Quarry Mason-Dixon Quarry
2-5
Number of dredging cycles that facility could be used before capacity is reached
No limitation No limitation 2 10 8Unknown, due to local sediment transport
100 1,250 1-2 1-2 2-5 44 1,250
Facility has a useful life of more than 40 years
Upland Placement
Pipeline + discharge pipe14 + 4
Will need dike construction at quarry for dewatering to extend
project life
Mason-Dixon Quarry (Belvidere site)
8
Hydraulic Hydraulic
Volume to be removed, cubic yardsVolume in pipeline (4X), cubic yardsVolume to be disposed of, cubic yardsNumber of dredgesNumber of pipelinesNumber of barge loads per dayNumber of truck loads per dayDike volume, cubic yardsBooster pumps requiredMonths of operationActual operational time, days per yearTotal sediment removal capacity, cubic yards per day
Low High Low High Low High Low High Low High Low High Low High Low HighReal estate/land purchase $12,500,000 $25,000,000 $10,000 $40,000 $10,000 $40,000 $20,000 $100,000 $440,000 $880,000 $12,500,000 $25,000,000 $20,000 $100,000Legal and financial services $0 $0 $0 $0 $0 $0 $0 $0 $0 $0 $0 $0 $0 $0Design and study costs $2,000,000 $5,000,000 $2,000,000 $5,000,000 $2,000,000 $5,000,000 $2,000,000 $5,000,000 $2,000,000 $5,000,000 $2,000,000 $5,000,000 $2,000,000 $5,000,000Booster pump construction $6,300,000 $6,300,000 $4,800,000 $4,800,000 $2,400,000 $2,400,000 $10,800,000 $10,800,000 $0 $0 $1,800,000 $1,800,000 $12,600,000 $12,600,000Permanent pipeline construction $3,800,000 $6,200,000 $3,800,000 $6,200,000 $1,900,000 $3,100,000 $6,200,000 $10,100,000 $0 $0 $1,400,000 $2,300,000 $8,600,000 $14,000,000Transfer site/dike construction $3,400,000 $6,700,000 $0 $0 $0 $0 $3,400,000 $6,700,000 $0 $0 $3,400,000 $6,700,000 $3,400,000 $6,700,000Dredging and dewatering plant $0 $0 $0 $0 $0 $0 $0 $0 $0 $0 $0 $0 $0 $0Reuse manufacturing plant $0 $0 $0 $0 $0 $0 $0 $0 $0 $0 $0 $0 $0 $0Subtotal $28 000 000 $49 200 000 $10 610 000 $16 040 000 $6 310 000 $10 540 000 $22 420 000 $32 700 000 $2 440 000 $5 880 000 $21 100 000 $40 800 000 $26 620 000 $38 400 000
$0$65,700,000$21,600,000$6,800,000$5,400,000
$0$56,600,000$212,000,000
3 3 8 4 3 0 3
N/A N/A N/A N/A N/A 1,200 1,500N/A 7
N/A 4,500,000 N/A12,000,000 12,000,000 12,000,000 12,000,000 12,000,000 N/A
Year-round Year-round October-February (5 months) July-March (9 months) Year-round Year-round Year-round9 21 16 8 36 0
Year-round6
420,000 N/A N/A 420,000
12,000 12,000 32,000 16,000 12,000 12,000 12,000330 250 94 188 250 250 250
12,000
One-Time Investment Costs
$368 100 000
3,000,000 3,000,000 3,000,000 3,000,000 3,000,000 3,000,000 3,000,000
N/A 420,000
N/A
3,000,00012,000,0004,500,000
33 8 4 3
12,000,000
N/A N/A N/A 29
N/A 4,500,000 3,600,000 4,500,000
N/A
3N/AN/A
420,00042
250
3 24 3
Subtotal $28,000,000 $49,200,000 $10,610,000 $16,040,000 $6,310,000 $10,540,000 $22,420,000 $32,700,000 $2,440,000 $5,880,000 $21,100,000 $40,800,000 $26,620,000 $38,400,000
Annualized, $/year $1,194,000 $2,098,000 $452,000 $684,000 $269,000 $449,000 $956,000 $1,394,000 $104,000 $251,000 $900,000 $1,739,000 $1,135,000 $1,637,000
Low High Low High Low High Low High Low High Low High Low High Low HighTipping fee (costs reduced by any generated revenues) $87,000,000 $117,000,000 $0 $0 $0 $0 $0 $0 $4,500,000 $22,500,000 $36,000,000 $54,000,000 $45,000,000 $67,500,000 $45,000,000 $67,500,000Dredging + transportation $0 $0 $45,000,000 $60,000,000 $30,000,000 $45,000,000 $15,000,000 $30,000,000 $60,000,000 $75,000,000 $120,000,000 $210,000,000 $60,000,000 $90,000,000 $60,000,000 $75,000,000Manufacturing processing $0 $0 $0 $0 $0 $0 $0 $0 $0 $0 $0 $0 $0 $0 $0 $0Construction design and management $0 $0 $1,000,000 $2,000,000 $1,000,000 $2,000,000 $1,000,000 $2,000,000 $1,000,000 $2,000,000 $1,000,000 $2,000,000 $1,000,000 $2,000,000 $1,000,000 $2,000,000Subtotal $87,000,000 $117,000,000 $46,000,000 $62,000,000 $31,000,000 $47,000,000 $16,000,000 $32,000,000 $65,500,000 $99,500,000 $157,000,000 $266,000,000 $106,000,000 $159,500,000 $106,000,000 $144,500,000
One-time investment cost, $/cy $9 $16 $4 $5 $2 $4 $7 $11 $1 $2 $7 $14 $9 $13
Annualized investment cost, $/cy/year $0 $0 $0 $1 $0 $0 $0 $0 $0 $0 $0 $0 $0 $1 $0 $1Annual removal cost, $/cy/year $29 $39 $15 $21 $10 $16 $5 $11 $22 $33 $52 $89 $35 $53 $35 $48Total annual cost, $/cy/year $29 $39 $16 $21 $10 $16 $5 $11 $22 $34 $52 $89 $36 $54 $36 $49
Major Limitations
These are concept-level costs for planning purposes only. Detailed design and cost estimate would be required for any future studies investigation implementation of any of these alternatives.
Costs to be offset by generated revenues
O&M/Removal Costs
Cost per Cubic Yard Low High Low High Low High
$368,100,000
General Assumptions:
(assumes yearly removal)
Currently not allowed by law; large parcels adjacent to the river may be very difficult to find
Environmental impacts; NMFS concerns
Environmental impacts; NMFS concerns
Large parcels adjacent to the reservoir may be difficult to find
Large parcels expected to be difficult to find nearby
Low High Low HighLow High Low High Low High$123
Substantial commitment to continual use would be required
Effluent from dewatering will need to be pumped back to the Susquehanna River
Real estate cost = farmland cost in Harford/Cecil County, MD; range of cost = $10,000 to $20,000 per acre; based on Internet search of agricultural land June 2013; assume large tracts of land available.Annualization factor = 23.456 for interest = 3.500% 50 years Rounding factor for annualization = 3Each hydraulic dredge has its own separate pipeline and associated booster pump system, with a production capacity of 4,000 cubic yards per day; cost per booster pump = $300,000Hydraulic dredging process will add a signficant amount of volume to the pipeline; assume pipeline will contain 4 times the dredging volume.Drying process will be able to remove a signficant amount of the water that is pumped in with the dredged material; assume that material to be transported after drying is 1.5 times the original dredging volume.Production capacity for one mechanical dredge = 500 cubic yards per day; material volume is increased by 20%, a factor of 1.2 , during dredging processBarge capacity varies; for transport to Pooles Island, each barge is expected to hold 2,500 cubic yards; for in-reservoir dredging, the capacity would be much smaller, only 500 cubic yards/barge.Permanent pipeline cost = $160,000 to $260,000 per mile ($30-50 per linear foot).Transfer site/dike construction cost = 5-foot high dike for 3 feet of material, drying time of 2 months per cell, $8-16/cy construction cost
Universal conversion factor; 1 cubic yard of dredged material = 0.81 tons of sediment based on bulk density value of 1600 kilograms/meter3.
Tipping fee for Stancils Quarry is assumed to be $1-5/cy with a total volume available of 9Mcy; tipping fee for Mason-Dixon Quarry is based on $10-15/cy and a total volume available of 35Mcy; the tipping fees are applied to the dredged amount for pipeline delivery and to the trucked amount for truck delivery; outright purchase of quarry could be another option to tipping fees.
Technical Assumptions:and project life of
All alternatives assume the dredging of a location in Conowingo Reservoir which currently has the highest amounts of deposition in the entire lower Susquehanna reservoir system; similar costs could be developed for the other lower Susquehanna reservoirs.
\\nab-fs2im\cenab\Projects\Civil-Projects\Lower Susquehanna River Watershed Assessment\Feasibility Phase (September 2011 ...)\Assessment report\Draft Report\Appendices\April 2014 Consolidated\J\Attach J-2 Cost summary 012014.xlsm : 3M cy calcs 4/14/2014 : 2:35 PM
Lower Susquehanna River Watershed AssessmentSummary of Representative Sediment Management Alternatives
Physical DescriptionSediment to be removed, cubic yardsSediment to be removed, tonsType of dredgingTransportation methodDistance to be transported, miles
Final destination of material
Land to be purchased, acres
Production CalculationsVolume to be removed, cubic yardsVolume in pipeline (4X), cubic yardsVolume to be disposed of, cubic yardsNumber of dredgesNumber of pipelinesNumber of barge loads per dayNumber of truck loads per dayDike volume, cubic yardsBooster pumps requiredMonths of operationActual operational time, days per yearTotal sediment removal capacity, cubic yards per day
Low High Low High Low High Low High Low High Low High Low High Low HighReal estate/land purchase $20,800,000 $41,600,000 $10,000 $40,000 $10,000 $40,000 $20,000 $100,000 $720,000 $1,440,000 $20,800,000 $41,600,000 $20,000 $100,000Legal and financial servicesDesign and study costs $2,000,000 $5,000,000 $2,000,000 $5,000,000 $2,000,000 $5,000,000 $2,000,000 $5,000,000 $2,000,000 $5,000,000 $2,000,000 $5,000,000 $2,000,000 $5,000,000Booster pump construction $10,500,000 $10,500,000 $7,200,000 $7,200,000 $4,200,000 $4,200,000 $18,000,000 $18,000,000 $0 $0 $3,000,000 $3,000,000 $21,000,000 $21,000,000Permanent pipeline construction $6,400,000 $10,400,000 $5,800,000 $9,400,000 $3,400,000 $5,500,000 $10,400,000 $16,900,000 $0 $0 $2,400,000 $3,900,000 $14,400,000 $23,400,000Transfer site/dike construction $5,600,000 $11,200,000 $0 $0 $0 $0 $5,600,000 $11,200,000 $0 $0 $5,600,000 $11,200,000 $5,600,000 $11,200,000Dredging and dewatering plantReuse manufacturing plant $0 $0 $0 $0 $0 $0 $0 $0 $0 $0 $0 $0 $0 $0Subtotal $45,300,000 $78,700,000 $15,010,000 $21,640,000 $9,610,000 $14,740,000 $36,020,000 $51,200,000 $2,720,000 $6,440,000 $33,800,000 $64,700,000 $43,020,000 $60,700,000
Annualized, $/year $1,931,000 $3,355,000 $640,000 $923,000 $410,000 $628,000 $1,536,000 $2,183,000 $116,000 $275,000 $1,441,000 $2,758,000 $1,834,000 $2,588,000
Low High Low High Low High Low High Low High Low High Low High Low HighTipping fee (costs reduced by any generated revenues) $130,000,000 $195,000,000 $0 $0 $0 $0 $0 $0 $7,500,000 $37,500,000 $60,000,000 $90,000,000 $75,000,000 $112,500,000 $75,000,000 $112,500,000Dredging + transportation $0 $0 $75,000,000 $100,000,000 $50,000,000 $75,000,000 $25,000,000 $50,000,000 $100,000,000 $125,000,000 $200,000,000 $350,000,000 $100,000,000 $150,000,000 $100,000,000 $125,000,000Manufacturing processing $0 $0 $0 $0 $0 $0 $0 $0 $0 $0 $0 $0 $0 $0 $0 $0Construction design and management $0 $0 $1,000,000 $2,000,000 $1,000,000 $2,000,000 $1,000,000 $2,000,000 $1,000,000 $2,000,000 $1,000,000 $2,000,000 $1,000,000 $2,000,000 $1,000,000 $2,000,000Subtotal $130,000,000 $195,000,000 $76,000,000 $102,000,000 $51,000,000 $77,000,000 $26,000,000 $52,000,000 $108,500,000 $164,500,000 $261,000,000 $442,000,000 $176,000,000 $264,500,000 $176,000,000 $239,500,000
One-time investment cost, $/cy $9 $16 $3 $4 $2 $3 $7 $10 $1 $1 $7 $13 $9 $12
Annualized investment cost, $/cy/year $0 $0 $0 $1 $0 $0 $0 $0 $0 $0 $0 $0 $0 $1 $0 $1Annual removal cost, $/cy/year $26 $39 $15 $20 $10 $15 $5 $10 $22 $33 $52 $88 $35 $53 $35 $48Total annual cost, $/cy/year $26 $39 $16 $21 $10 $16 $5 $11 $22 $33 $52 $88 $35 $53 $36 $48
Major Limitations
These are concept-level costs for planning purposes only. Detailed design and cost estimate would be required for any future studies investigation implementation of any of these alternatives.
Real estate cost = farmland cost in Harford/Cecil County, MD; range of cost = $10,000 to $20,000 per acre; based on Internet search of agricultural land June 2013; assume large tracts of land available.Annualization factor = 23.456 for interest = 3.500% 50 years Rounding factor for annualization = 3Each hydraulic dredge has its own separate pipeline and associated booster pump system, with a production capacity of 4,000 cubic yards per day; cost per booster pump = $300,000Hydraulic dredging process will add a signficant amount of volume to the pipeline; assume pipeline will contain 4 times the dredging volume.Drying process will be able to remove a signficant amount of the water that is pumped in with the dredged material; assume that material to be transported after drying is 1.5 times the original dredging volume.Production capacity for one mechanical dredge = 500 cubic yards per day; material volume is increased by 20%, a factor of 1.2 , during dredging processBarge capacity varies; for transport to Pooles Island, each barge is expected to hold 2,500 cubic yards; for in-reservoir dredging, the capacity would be much smaller, only 500 cubic yards/barge.Permanent pipeline cost = $160,000 to $260,000 per mile ($30-50 per linear foot).Transfer site/dike construction cost = 5-foot high dike for 3 feet of material, drying time of 2 months per cell, $8-16/cy construction cost
Universal conversion factor; 1 cubic yard of dredged material = 0.81 tons of sediment based on bulk density value of 1600 kilograms/meter 3.
All alternatives assume the dredging of a location in Conowingo Reservoir which currently has the highest amounts of deposition in the entire lower Susquehanna reservoir system; similar costs could be developed for the other lower Susquehanna reservoirs.
Tipping fee for Stancils Quarry is assumed to be $1-5/cy; tipping fee for Mason-Dixon Quarry is based on $10-15/cy; the tipping fees are applied to the dredged amount for pipeline delivery and to the trucked amount for truck delivery; outright purchase of quarry could be another option to tipping fees.
$0$88,000,000$26,100,000$11,300,000$9,000,000
$0$78,200,000$298,800,000
Costs to be offset by generated revenues
Innovative Reuse Open Water PlacementAlternative 1 Alternative 2A Alternative 2B Alternative 2C Alternative 3A Alternative 3B Alternative 3C
5,000,000 5,000,000 5,000,0004,050,000
Hydraulic Hydraulic Hydraulic Hydraulic Hydraulic Mechanical4,050,000 4,050,000 4,050,000 4,050,000 4,050,000 4,050,0005,000,000 5,000,000 5,000,000 5,000,000
Hydraulic
Location/type of containment siteBainbridge, slurry screened,
water returned, solids stockpiled
Drying/transfer site near Susquehanna State Park, with
dike constructionN/A N/A
Pipeline + dike + trucking10 8+32 3 3 13 0+0+14 3+0+12
Pipeline Pipeline + barge Pipeline Pipeline Pipeline Barge + transfer + trucking14 + 4
Concrete block market Pooles IslandSusquehanna River,
approximately 1 mile d/s of Conowingo Dam
Susquehanna River, approximately 1 mile d/s of
Conowingo DamStancills Quarry Mason-Dixon Quarry Mason-Dixon Quarry
Will need dike construction at quarry for dewatering to extend
project lifeShoreline transfer site
Nearby drying site required with dike construction
Will need dike construction at quarry for dewatering to extend
project life
Mason-Dixon Quarry (Belvidere site)
5
1-2 1-2
N/A
20,000,000 20,000,000 20,000,000 20,000,000 20,000,000 N/A 20,000,000N/A 7,500,000 N/A
N/A 12 N/A N/A N/A 485 5 12 7 5 0 55 5 12 7 5 40
Year-round Year-round October-February (5 months) July-March (9 months) Year-round Year-round Year-round15 35 24 14 60 0 70
Year-round
20,000 20,000 48,000 28,000 20,000 20,000 20,000330 250 104 179 250 250 250
20,000
One-Time Investment Costs
O&M/Removal Costs
Cost per Cubic Yard Low High Low High Low High
$511,400,000
General Assumptions:
Technical Assumptions:and project life of
(assumes yearly removal)
Currently not allowed by law; large parcels adjacent to the river may be very difficult to find
Environmental impacts; NMFS concerns
Environmental impacts; NMFS concerns
Large parcels adjacent to the reservoir may be difficult to find
Large parcels expected to be difficult to find nearby
Low High Low HighLow High Low High Low$102
Substantial commitment to continual use would be required
Number of dredging cycles that facility could be used before capacity is reached
No limitation No limitation 1 6 5
5,000,000 5,000,000 5,000,000 5,000,000 5,000,000 5,000,000 5,000,000
Unknown, due to local sediment transport
100 2,080 2,080
N/A
Facility has a useful life of more than 40 years
N/A 7,500,000 6,000,000 7,500,000
700,000 N/A N/A 700,000 N/A 700,000
N/AN/A N/A N/A N/A 2,000
Effluent from dewatering will need to be pumped back to the Susquehanna River
Upland Placement
55
N/AN/A
700,000
2-5
5,000,00020,000,0007,500,000
Alternative 3D
5,000,0004,050,000Hydraulic
Pipeline + discharge pipe
250
10
2,500
2-5 72
High
5
\\nab-fs2im\cenab\Projects\Civil-Projects\Lower Susquehanna River Watershed Assessment\Feasibility Phase (September 2011 ...)\Assessment report\Draft Report\Appendices\April 2014 Consolidated\J\Attach J-2 Cost summary 012014.xlsm : 5M cy calcs 4/14/2014 : 2:35 PM
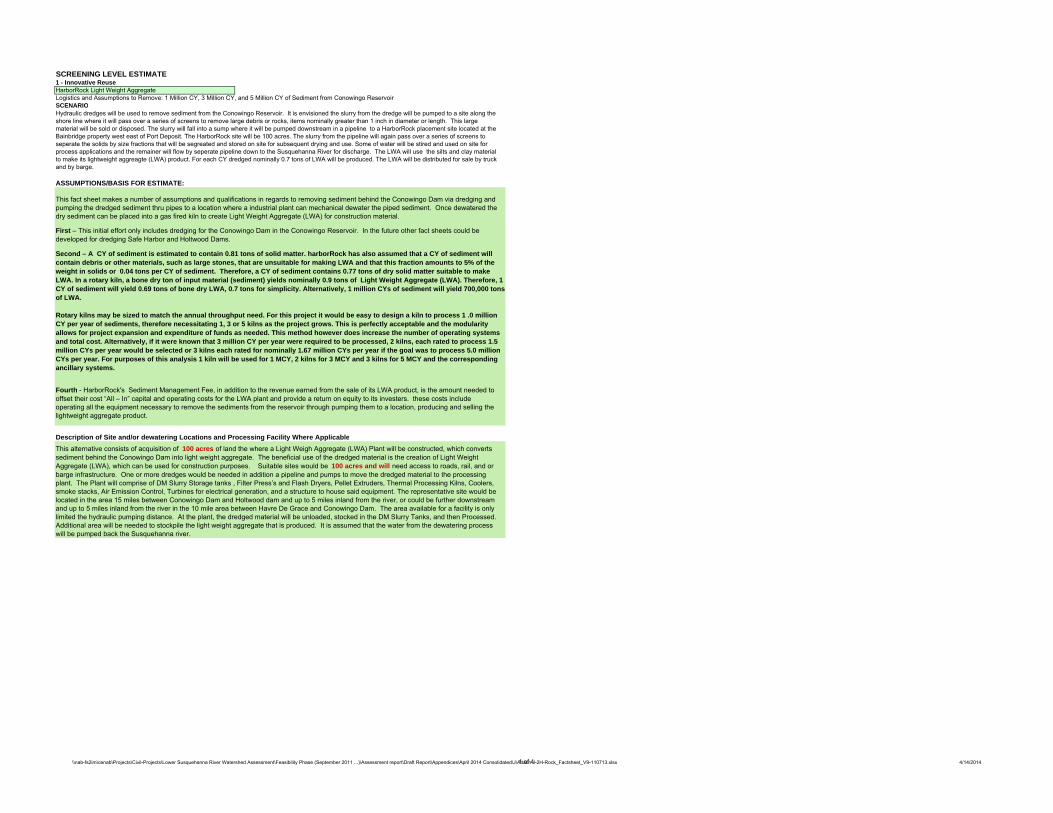
SCREENING LEVEL ESTIMATE 1 - Innovative Reuse
SCENARIO
ASSUMPTIONS/BASIS FOR ESTIMATE:
Description of Site and/or dewatering Locations and Processing Facility Where Applicable
HarborRock Light Weight Aggregate
This alternative consists of acquisition of 100 acres of land the where a Light Weigh Aggregate (LWA) Plant will be constructed, which converts sediment behind the Conowingo Dam into light weight aggregate. The beneficial use of the dredged material is the creation of Light Weight Aggregate (LWA), which can be used for construction purposes. Suitable sites would be 100 acres and will need access to roads, rail, and or barge infrastructure. One or more dredges would be needed in addition a pipeline and pumps to move the dredged material to the processing plant. The Plant will comprise of DM Slurry Storage tanks , Filter Press’s and Flash Dryers, Pellet Extruders, Thermal Processing Kilns, Coolers, smoke stacks, Air Emission Control, Turbines for electrical generation, and a structure to house said equipment. The representative site would be located in the area 15 miles between Conowingo Dam and Holtwood dam and up to 5 miles inland from the river, or could be further downstream and up to 5 miles inland from the river in the 10 mile area between Havre De Grace and Conowingo Dam. The area available for a facility is only limited the hydraulic pumping distance. At the plant, the dredged material will be unloaded, stocked in the DM Slurry Tanks, and then Processed. Additional area will be needed to stockpile the light weight aggregate that is produced. It is assumed that the water from the dewatering process will be pumped back the Susquehanna river.
This fact sheet makes a number of assumptions and qualifications in regards to removing sediment behind the Conowingo Dam via dredging and pumping the dredged sediment thru pipes to a location where a industrial plant can mechanical dewater the piped sediment. Once dewatered the dry sediment can be placed into a gas fired kiln to create Light Weight Aggregate (LWA) for construction material.
First – This initial effort only includes dredging for the Conowingo Dam in the Conowingo Reservoir. In the future other fact sheets could be developed for dredging Safe Harbor and Holtwood Dams.
Second – A CY of sediment is estimated to contain 0.81 tons of solid matter. harborRock has also assumed that a CY of sediment will contain debris or other materials, such as large stones, that are unsuitable for making LWA and that this fraction amounts to 5% of the weight in solids or 0.04 tons per CY of sediment. Therefore, a CY of sediment contains 0.77 tons of dry solid matter suitable to make LWA. In a rotary kiln, a bone dry ton of input material (sediment) yields nominally 0.9 tons of Light Weight Aggregate (LWA). Therefore, 1 CY of sediment will yield 0.69 tons of bone dry LWA, 0.7 tons for simplicity. Alternatively, 1 million CYs of sediment will yield 700,000 tons of LWA.
Rotary kilns may be sized to match the annual throughput need. For this project it would be easy to design a kiln to process 1 .0 million CY per year of sediments, therefore necessitating 1, 3 or 5 kilns as the project grows. This is perfectly acceptable and the modularity allows for project expansion and expenditure of funds as needed. This method however does increase the number of operating systems and total cost. Alternatively, if it were known that 3 million CY per year were required to be processed, 2 kilns, each rated to process 1.5 million CYs per year would be selected or 3 kilns each rated for nominally 1.67 million CYs per year if the goal was to process 5.0 million CYs per year. For purposes of this analysis 1 kiln will be used for 1 MCY, 2 kilns for 3 MCY and 3 kilns for 5 MCY and the corresponding ancillary systems.
Fourth - HarborRock's Sediment Management Fee, in addition to the revenue earned from the sale of its LWA product, is the amount needed to offset their cost “All – In” capital and operating costs for the LWA plant and provide a return on equity to its investers. these costs include operating all the equipment necessary to remove the sediments from the reservoir through pumping them to a location, producing and selling the lightweight aggregate product.
Logistics and Assumptions to Remove: 1 Million CY, 3 Million CY, and 5 Million CY of Sediment from Conowingo Reservoir
Hydraulic dredges will be used to remove sediment from the Conowingo Reservoir. It is envisioned the slurry from the dredge will be pumped to a site along the shore line where it will pass over a series of screens to remove large debris or rocks, items nominally greater than 1 inch in diameter or length. This large material will be sold or disposed. The slurry will fall into a sump where it will be pumped downstream in a pipeline to a HarborRock placement site located at the Bainbridge property west east of Port Deposit. The HarborRock site will be 100 acres. The slurry from the pipeline will again pass over a series of screens to seperate the solids by size fractions that will be segreated and stored on site for subsequent drying and use. Some of water will be stired and used on site for process applications and the remainer will flow by seperate pipeline down to the Susquehanna River for discharge. The LWA will use the silts and clay material to make its lightweight aggreagte (LWA) product. For each CY dredged nominally 0.7 tons of LWA will be produced. The LWA will be distributed for sale by truck and by barge.
\\nab-fs2im\cenab\Projects\Civil-Projects\Lower Susquehanna River Watershed Assessment\Feasibility Phase (September 2011 ...)\Assessment report\Draft Report\Appendices\April 2014 Consolidated\J\Attach J-2H-Rock_Factsheet_V9-110713.xlsx1 of 4 4/14/2014

Evaluation of Available Capacity:
Total Amount of Material to be dredged (CY)
Sediment to be Removed Tons @ 0.81 tons per Cubic Yard
Number of Dredges at (400 CY/hr solids at 10 hour
days or 4000 CY/day or 1000000 CY/yr) per Dredge
Actual CY of Sediment Plus Water Volume Hydraulically
Dredged (water adds 4 times the original volume)
Distance to be Piped (miles)
1,000,000 810,000 1 4,000,000 103,000,000 2,430,000 3 12,000,000 105,000,000 4,050,000 5 20,000,000 10
Total Amount of Material to be dredged (CY) Number of Pipes Number of Booster pumps Acreage Needed for Factory
(acres)
Acreage Needed for Storage of Hydraulically Dredged Material
(acres)Total Acreage Neededl (acres)
1,000,000 1 3 80 20 1003,000,000 3 9 80 20 1005,000,000 5 15 80 20 100
Total Amount of Material to be dredged (CY)
Number of Slurry Screening Operations Number of Rotary Dryers Number of Flash Dryers Number of Pellet Extruders
1,000,000 2 1 1 43,000,000 4 2 2 85,000,000 6 4 4 16
Total Amount of Material to be dredged (CY) Number of Kilns Number of Coolers Number of Smoke Stacks Number of Air Emission
Controllers
1,000,000 1 1 1 13,000,000 2 2 2 25,000,000 3 3 3 3
COSTSOne-Time Investment Costs
Total Amount of Material to be dredged (CY)
Design and study costs(includes development,
permitting and engineering)
Legal and Financial services(includes capitalized interest,
debt service and major maintanence reserve funds
and fees)
Booster pump construction Permanent pipeline construction Dredging & dewatering plant Reuse manufacturing plant,
buildings & shipping equipment TOTAL
1,000,000 13,339,450 27,645,057 2,250,000 1,800,000 28,553,813 108,239,629 $181,827,9483,000,000 21,599,677 65,652,691 6,750,000 5,400,000 56,637,522 212,015,378 $368,055,2675,000,000 26,099,677 88,044,244 11,250,000 9,000,000 78,196,230 298,780,385 $511,370,536
O&M/Removal CostsTotal Amount of Material to be
dredged (CY) Manufacturing processing Management and financial repayment (30 yrs.) TOTAL
1,000,000 $43,136,320 $17,095,261 60,231,5813,000,000 $120,478,090 $31,758,675 152,236,7655,000,000 $203,180,414 $42,499,175 245,679,589
Sales RevenueTotal Amount of Material to be
dredged (CY)Net LWA Rrevenue (gross
sales minus profit)1,000,000 $11,907,480 3,000,000 $42,461,770 5,000,000 $67,780,000
Tip Fee Range - Privately financed
Total Amount of Material to be dredged (CY) Expected Low High
1,000,000 $48 $46 $503,000,000 $37 $34 $395,000,000 $36 $32 $39
Tip Fee Range - Publically financed
Total Amount of Material to be dredged (CY) Expected Low High
1,000,000 Unknown $39 $403,000,000 Unknown $29 $335,000,000 Unknown $26 $33
Note:
Ideally, there would be a site of approximately 2 acres size on-shore at the Conowingo Resevoir to allow for slurry screening to removdebris and a collection station of the outputs from the multiple dredges to allow for uniform and consisnet pumping of the slurry downsRemoving large debris from the slurry initially will improve reliability, save time and cost.
Multiple stacks are proposed to allow for maximum reliability and up time for operations. The loss of a kiln or other device in a single trwould then only affect that train.
If the total quantity to be dredged annually is known at start of design, then there may be fewer total systems, stacks etc. used. Elimination of Booster pumps and pipeline one-time investment costs lowers Tip Fee by $1.00 - 2.00/CYThere is 1 pipeline and associated booster pumps per 1 MCY.Economies of scale would result if pipeline were designed to maximum flow, eliminating multiple pipes. It would appear a good size for the pipeline would be 3.42 MCY. At this size, increasing operational days from 250 to 365 increases annual flow by a factor Private Finance = 80% debt finaced over 30 years at 5.25% per annum.Public Finace = 100% debt finaced at 3.75% per annum for 50 years
\\nab-fs2im\cenab\Projects\Civil-Projects\Lower Susquehanna River Watershed Assessment\Feasibility Phase (September 2011 ...)\Assessment report\Draft Report\Appendices\April 2014 Consolidated\J\Attach J-2H-Rock_Factsheet_V9-110713.xlsx2 of 4 4/14/2014

SCREENING LEVEL ESTIMATE 2A - Open Water PlacementPooles Island Open Water PlacementLogistics and Assumptions to Remove: 1 Million CY, 3 Million CY, and 5 Million CY of Sediment from Conowingo ReservoirSCENARIO
ASSUMPTIONS/BASIS FOR ESTIMATE:
Hydraulic dredges will be used to remove sediment from the Conowingo Reservoir, then using a pipeline from the dredge the removed sediment will be pumped downstream to a temporary placement site that is available near Port Deposit. At this location material can be dewatered and loaded into barges. Once the dredged material is placed onto the barges it will be moved to a placement site at Pooles Island, Md.
1) The Pooles Island placement area is assumed to be 350 acres, the expansion of the Pooles Island site connects G-West to Site 92. Allowable fill would be to a depth to -11' MLLW.
2) The 350 ac site is identified as having 4.7 mcy of capacity which would result in an 8.3 ft placement thickness (4,700,000cy x 27cf/cy /350 ac / 43560 cf/ac = 8.32 ft thick). The assumption holds that Pooles Island capacity to handle new material recharges yearly allowing for 4.7 CY of material to be placed every year.
3) Assume 1 cy of sediment contains 0.81 tons of solids.
4) An initial estimate and sizing of a dredge for Conowingo reservoir placement indicated that a dredge such as the Jet Dragon 870 should be suitable for dredging the Conowingo Reservoir at 400 CY / hr. A Jet Dragon 870 Dredge costs 1.5 million. (Based on discussion and materials from Ellicott Dredging Company who have dredges such as the dragon cutter head line which can dredge from 100 to 1000 CY/hr)
10) We are assuming a 2500 cy / barge will have access to transfer sites at our temporary dewatering site
11) Equipment needed: Dredge's, Pipe, Booster Pumps, Excavators (enough to remove the same amount of material that the dredge pumps per hour), Bulldozers (to trench and move material for drying), Barges.
Potential temporary placement sites across river from Port Deposit in the Susquehanna St Park with access to River.
5) This estimate will be based on the assumption that there are 250 work days per year and up to 10 work hours days.
6) Approximately 7 boosters per pipe at $300,000 per booster will be needed to get hydraulically dredged material to a temporary placement site that is assumed to be available across the river from Port Deposit (circled in green in the picture below) the dredge will push the sediment for the first mile then booster pumps are needed every mile thereafter.
7) The Legislative restrictions for open water placement at Pooles Island would be lifted or suspended. Opposition from the fishing community will be assuaged.
8) Dredged material would first be removed from the reservoir via hydraulic dredging and pumped to a temporary holding site near Port Deposit. This site would be a number of acres surrounded by a sediment holding dike which will contain the dredged material while it is dewatered by working and trenching the material with bulldozers. Drying the material will take approximately 4 months per cell.
9) After the sediment is dewatered the material will then be mechanically loaded into barges via clam shell dredge or large excavators and transported to the Pooles Island placement site ~30 Miles by bargeThe material would then be pumped from the barge into the Pooles Island open water site.
Attach J-2 Open_Water_Placement_A-B-C_V-8.xlsxAttach J-2 Open_Water_Placement_A-B-C_V-8.xlsx

Location of Pooles island
Evaluation of Available Capacity:
Total Amount of Material to be dredged (CY)
Number of Dredges at (400 CY/hr solids at 10
hour days or 4000 CY/day or 1000000 CY/yr) per Dredge
Number of days to dredge amount at given
number of dredges.
Actual CY of Sediment Plus Water Volume
Hydraulically Dredged
Distance to be Piped (miles) Number of Pipes Number of Booster
pumps
Equivalent Acreage of Hydraulically Dredged Material @ 3 ft or 1 yd
depth
1,000,000 1 250 4,000,000 8 1 7 8003,000,000 3 250 12,000,000 8 3 21 2,5005,000,000 5 250 20,000,000 8 5 35 4,100
Total (CY) of Sediment Plus Water Volume
Placed into Temporary Holding Cells During
One Year
Equivalent Acreage of Hydraulically Dredged Material @ 3 ft or 1 yd
depth
Acreage needed for 6 drying Cells which are
used 2 times per year for temporary placement
Area of one Drying Cell (acres)
Dike Length in Feet for 6 cells
Dike Volume in CY for 6 cells at 5 ft elevation
Dewatered Volume of Material (1.5 times
original amount dredged)
4,000,000 800 420 70 33,200 140,000 1,500,00012 000 000 2 500 1 250 210 99 600 420 000 4 500 00012,000,000 2,500 1,250 210 99,600 420,000 4,500,00020,000,000 4,100 2,080 350 166,000 700,000 7,500,000
Temporary Dewatering Sediment Cells and Associated Months of HandlingCell 1 Cell 2 Cell 3 Cell 4 Cell 5 Cell 6
Pump 1 2 3 4 5 6Dry 2,3,4,5 3,4,5,6 4,5,6,7 6,7,8,9 7,8,9,10 8,9,10,11 Cycle 1
Remove 6 7 8 9 10 11Pump 7 8 9 10 11 12Dry 8,9,10,11 9,10,11,12 10,11,12,1 11,12,1,2, 12,1,2,3 1,2,3,4 Cycle 2
Remove 12 1 2 3 4 5
Volume of Material to be barged to Pooles Island
After Drying (CY)
Volume of Dried Material per Drying Cell (CY)
Area of one Drying Cell (acres)
Transfer pads and associated 400 Cy/hr
transfer excavators per Drying Cell
Number of barge loads per day
Number of loads per year at 2500 cy/barge
Percentage of Material Dredged per year that
Pooles island can Handle per year (%)
# of dredging cycles that facility could be used
before capacity is reached
1,500,000 130,000 70 1 2 600 100 Unknown4,500,000 380,000 210 4 7 1,800 100 Unknown7,500,000 630,000 350 7 12 3,000 63 Unknown
Attach J-2 Open_Water_Placement_A-B-C_V-8.xlsx

SCREENING LEVEL ESTIMATE 2B - Open Water Placement5 Months of Sediment BypassingLogistics and Assumptions to Remove: 1 Million CY, 3 Million CY, and 5 Million CY of Sediment from Conowingo ReservoirSCENARIO
ASSUMPTIONS/BASIS FOR ESTIMATE:
Sediment Pipe around Conowingo Dam and location of Down Stream Release point in the Susquehanna River.
5) Approximately 2 boosters per pipe at $300,000 per booster are needed to get hydraulically dredged material past Conowingo Dam. The dredge will push the sediment for the first mile then booster pumps are needed every mile thereafter.
6) The Legislative restrictions for open water placement would be lifted or suspended. Opposition from the fishing community will be assuaged.
7) Equipment needed: Dredge's, Pipe, Booster Pumps.
Hydraulic dredges will be used to remove sediment from the Conowingo Reservoir, then using a pipeline from the dredge the removed sediment will be pumped past Conowingo Dam downstream to arelease point bypassing sediment over 5 months from October - February.
1) Assume 1 cy of sediment contains 0.81 tons of solids.
2) An initial estimate and sizing of a dredge for Conowingo reservoir placement indicated that a dredge such as the Jet Dragon 870 should be suitable for dredging the Conowingo Reservoir at 400 CY / hr. A Jet Dragon 870 Dredge costs 1.5 million. (Based on discussion and materials from Ellicott Dredging Company who have dredges such as the dragon cutter head line which can dredge from 100 to 1000 CY/hr)
3) This estimate will be based on the assumption that there are approximately 105 work days in five months and up to 10 work hours days.
4) A sediment release point can be found down stream of the dam where channel hydraulics would promote sustainable sediment transport.
Attach J-2 Open_Water_Placement_A-B-C_V-8.xlsxAttach J-2 Open_Water_Placement_A-B-C_V-8.xlsx

Evaluation of Available Capacity:
Total Amount of Material to be dredged (CY)
Number of Dredges at (400 CY/hr solids at 10
hour days or 4000 CY/day per Dredge at 21 days per month or 84000
CY per month
Number of days to dredge amount at given
number of dredges.
Actual CY of Sediment Plus Water Volume
Hydraulically Dredged
Distance to be piped (miles) Number of Pipes Number of Booster
pumps
Percentage of Material Dredged per year that can be Bypassed per
year (%) (No Total Capacity Limit)
1,000,000 3 83 4,000,000 3 3 6 1003,000,000 8 94 12,000,000 3 8 16 1005,000,000 12 104 20,000,000 3 12 24 100
Attach J-2 Open_Water_Placement_A-B-C_V-8.xlsxAttach J-2 Open_Water_Placement_A-B-C_V-8.xlsx
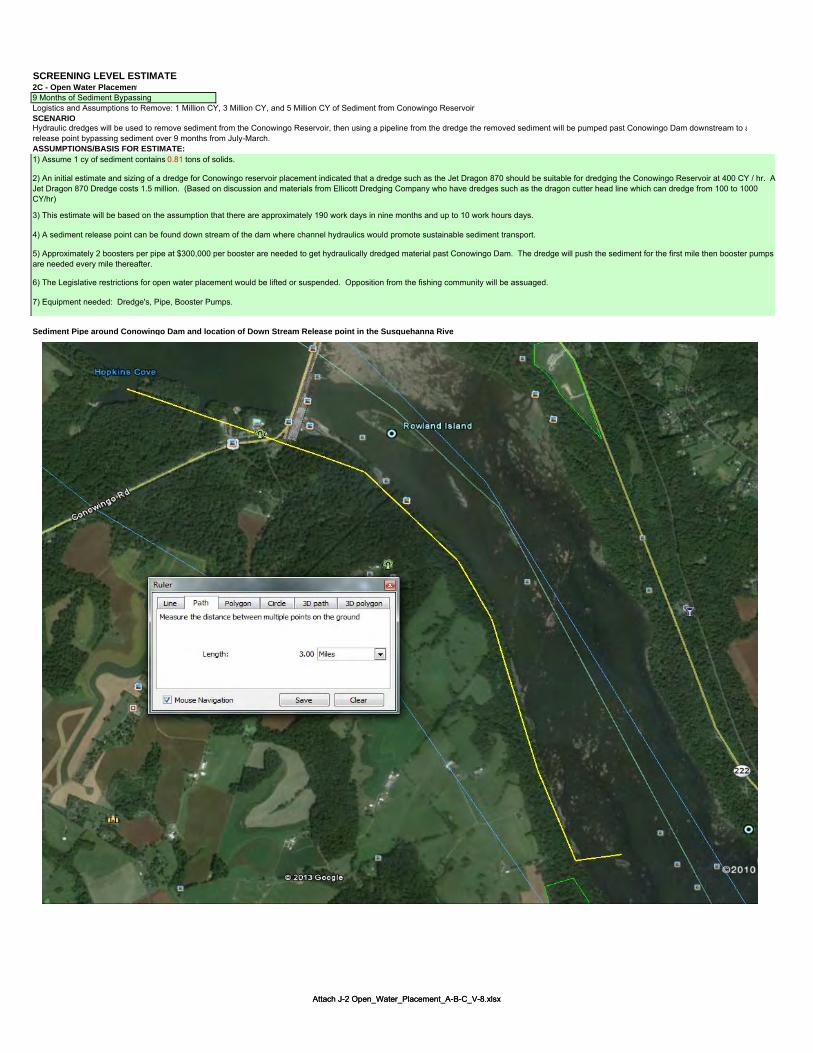
SCREENING LEVEL ESTIMATE 2C - Open Water Placement9 Months of Sediment BypassingLogistics and Assumptions to Remove: 1 Million CY, 3 Million CY, and 5 Million CY of Sediment from Conowingo ReservoirSCENARIO
ASSUMPTIONS/BASIS FOR ESTIMATE:
6) The Legislative restrictions for open water placement would be lifted or suspended. Opposition from the fishing community will be assuaged.
Sediment Pipe around Conowingo Dam and location of Down Stream Release point in the Susquehanna Rive
Hydraulic dredges will be used to remove sediment from the Conowingo Reservoir, then using a pipeline from the dredge the removed sediment will be pumped past Conowingo Dam downstream to arelease point bypassing sediment over 9 months from July-March.
1) Assume 1 cy of sediment contains 0.81 tons of solids.
2) An initial estimate and sizing of a dredge for Conowingo reservoir placement indicated that a dredge such as the Jet Dragon 870 should be suitable for dredging the Conowingo Reservoir at 400 CY / hr. A Jet Dragon 870 Dredge costs 1.5 million. (Based on discussion and materials from Ellicott Dredging Company who have dredges such as the dragon cutter head line which can dredge from 100 to 1000 CY/hr)
3) This estimate will be based on the assumption that there are approximately 190 work days in nine months and up to 10 work hours days.
4) A sediment release point can be found down stream of the dam where channel hydraulics would promote sustainable sediment transport.
5) Approximately 2 boosters per pipe at $300,000 per booster are needed to get hydraulically dredged material past Conowingo Dam. The dredge will push the sediment for the first mile then booster pumps are needed every mile thereafter.
7) Equipment needed: Dredge's, Pipe, Booster Pumps.
Attach J-2 Open_Water_Placement_A-B-C_V-8.xlsxAttach J-2 Open_Water_Placement_A-B-C_V-8.xlsx

Evaluation of Available Capacity:
Total Amount of Material to be dredged (CY)
Number of Dredges at (400 CY/hr solids at 10
hour days or 4000 CY/day per Dredge at 21 days per month or 84000
CY per month
Number of days to dredge amount at given
number of dredges.
Actual CY of Sediment Plus Water Volume
Hydraulically Dredged
Distance to be piped (miles) Number of Pipes Number of Booster
pumps
Percentage of Material Dredged per year that can be Bypassed per year (%) (No Total Capacity Limit)
1,000,000 2 125 4,000,000 3 2 4 1003,000,000 4 188 12,000,000 3 4 8 1005,000,000 7 179 20,000,000 3 7 14 100
Attach J-2 Open_Water_Placement_A-B-C_V-8.xlsxAttach J-2 Open_Water_Placement_A-B-C_V-8.xlsx

SCREENING LEVEL ESTIMATE 3A - Upland PlacementStancil Quarry Upland PlacementLogistics and Assumptions to Remove: 1 Million CY, 3 Million CY, and 5 Million CY of Sediment from Conowingo ReservoirSCENARIO
ASSUMPTIONS/BASIS FOR ESTIMATE:
Pump and Placement at Stancil Quarry
4) Approximately 12 boosters per pipe at $300,000 per booster will be needed to get hydraulically dredged material to Stancil Quarry. The dredge will push the sediment for the first mile then booster pumps are needed every mile thereafter.
5) Dredged material would first be removed from the reservoir via hydraulic dredging and pumped 13 miles to a holding area at Stancil Quarry where it can be dewatered to the Susquehanna flats. Once the material is dewatered it can be placed perminantly in final fill areas at the quarry. The dewatering site at the quarry would be a number of acres surrounded by a sediment holding dike which will contain the dredged material while it is dewatered by working and trenching the material with bulldozers. Drying the material will take approximately 4 months per cell.
6) After the sediment is dewatered the material will then be pushed and moved via bulldozer and excavator to a final fill location within Stancil Quarry.
Hydraulic dredges will be used to remove sediment from the Conowingo Reservoir, then using a pipeline from the dredge the removed sediment will be pumped downstream to a dewatering site at Stancil Quarry before it is placed in a permanent site that is available at Stancil Quarry.
1) Assume 1 cy of sediment contains 0.81 tons of solids.
2) An initial estimate and sizing of a dredge for Conowingo reservoir placement indicated that a dredge such as the Jet Dragon 870 should be suitable for dredging the Conowingo Reservoir at 400 CY / hr. A Jet Dragon 870 Dredge costs 1.5 million. (Based on discussion and materials from Ellicott Dredging Company who have dredges such as the dragon cutter head line which can dredge from 100 to 1000 CY/hr)
3) This estimate will be based on the assumption that there are 250 work days per year and up to 10 work hours days.
7) Equipment needed: Dredge's, Pipe, Booster Pumps, Excavators, Bulldozers (to trench and move material for drying).
Attach J-2Upland_Placement_A-B-C_V-8.xlsx

Evaluation of Available Capacity:
Total Amount of Material to be dredged (CY)
Number of Dredges at (400 CY/hr solids at 10
hour days or 4000 CY/day or 1000000 CY/yr) per Dredge
Number of days to dredge amount at given
number of dredges.
Actual CY of Sediment Plus Water Volume
Hydraulically Dredged
Distance to be Piped (miles) Number of Pipes Number of Booster
pumps
Equivalent Acreage of Hydraulically Dredged Material @ 3 ft or 1 yd
depth
1,000,000 1 250 4,000,000 13 1 12 8003,000,000 3 250 12,000,000 13 3 36 2,5005,000,000 5 250 20,000,000 13 5 60 4,100
Total (CY) of Sediment Plus Water Volume
Placed into Temporary Holding Cells During
One Year
Equivalent Acreage of Hydraulically Dredged Material @ 3 ft or 1 yd
depth
Acreage needed for 6 drying Cells which are
used 2 times per year for temporary placement
Area of one Drying Cell (acres)
Dike Length in Feet for 6 cells
Dike Volume in CY for 6 cells at 5 ft elevation
Dewatered Volume of Material (1.5 times
original amount dredged)
4,000,000 800 420 70 33,200 140,000 1,500,00012,000,000 2,500 1,250 210 99,600 420,000 4,500,00020,000,000 4,100 2,080 350 166,000 700,000 7,500,000
Temporary Dewatering Sediment Cells and Associated Months of HandlingCell 1 Cell 2 Cell 3 Cell 4 Cell 5 Cell 6
Pump 1 2 3 4 5 6Dry 2,3,4,5 3,4,5,6 4,5,6,7 6,7,8,9 7,8,9,10 8,9,10,11 Cycle 1
Remove 6 7 8 9 10 11Pump 7 8 9 10 11 12Dry 8,9,10,11 9,10,11,12 10,11,12,1 11,12,1,2, 12,1,2,3 1,2,3,4 Cycle 2
Remove 12 1 2 3 4 5
Volume of Material for Permanent placement at
Stancil Quarry After Drying (CY)
Volume of Dried Material per Drying Cell (CY)
Area of one Drying Cell (acres)
Percentage of Material Dredged per year that
Stancil Quarry can Handle per year (%)
# of dredging cycles that facility could be used till
capacity is reached
1,500,000 130,000 70 Unknown 64,500,000 380,000 210 Unknown 27,500,000 630,000 350 Unknown 1
Attach J-2Upland_Placement_A-B-C_V-8.xlsx

SCREENING LEVEL ESTIMATE 3B - Upland Placement
Logistics and Assumptions to Remove: 1 Million CY, 3 Million CY, and 5 Million CY of Sediment from Conowingo ReservoirSCENARIO
ASSUMPTIONS/BASIS FOR ESTIMATE:
Potential barge truck transfer site with Truck access to Roads and the location of Mason Dixon quarry
Mason Dixon Quarry Upland Placement - Mechanical Dredge
Mechanical dredges will be used to remove sediment from the Conowingo Reservoir and place that sediment into barges, then the barges will circulate between the dredges and the southern shoreline where their contents will be offloaded via excavators. The southern shoreline was chosen due to the rail line on the northern shoreline, which would make offloading the barges too expensive or potentially unfeasible. There will be staging areas on the southern shoreline for the transfer of dredge material from each barge to the trucksAn excavator at each transfer site will then place the wet material into trucks able to hall 12 cy of wet material. Each staging area will have one excavator which will unload the barge and transfer its contents to the trucks at a assumed rate of one truck every 10 minutes. The trucks will then cross the Conowingo Bridge and drive to Mason Dixon Quarry where they will unload their contents, and return to be filled again.
8) Equipment needed: Mechanical Dredge, Barges, Trucks, Excavators, and Bulldozers (to move material at Mason Dixon Quarry).
1) Assume 1 cy of sediment contains 0.81 tons of solids.
2) An initial estimate of the sizing of a mechanical dredge for Conowingo reservoir suggested a mechanical dredge capable of removing remove 500 CY / day would be the minimum size dredge needed..
3) This estimate will be based on the assumption that there are 250 work days per year and up to 10 work hours days.
5) Dredged material would first be removed from the reservoir via mechanical dredging and barged to a transfer sites on the Conowingo Reservoir southern shore. There the wet material will be transferred to trucks via excavators. The material will then be trucked to Mason Dixon Quarry for final placement.
4) Pipes or pumping of sediment infrastructure are not needed for the logistics of this example.
6) The depth necessary to move the required number of 500 CY barges is present or can be dredged, and the dock structure to allow excavators to transfer sediment from barge to truck will be able to be constructed.
7) Any temporary to permanent road structures to allow sediment trucks to access state, or county roads and highways will be built, and all road access for the large number of trucks will be approved.
Attach J-2Upland_Placement_A-B-C_V-8.xlsxAttach J-2Upland_Placement_A-B-C_V-8.xlsx

Evaluation of Available Capacity: Based on Mechanical Dredging
Total Amount of Material to be dredged (CY)
Number of Dredges at 500 CY/day per Dredge
Number of days to dredge amount at given
number of dredges.
Actual CY of Sediment Plus Water Volume
Mechanically Dredged (1.2 times original amt.)
Number of Barge Loads per day at 500 CY per
barge
~ Total Number of Truck Loads Per Day @ ~42 Truck Loads per Barge
~ Total Number of Truck Loads Per Year
Number of Transfer sites at 6 trucks per hour per
transfer site
1,000,000 8 250 1,200,000 9.6 400 100000 103,000,000 24 250 3,600,000 28.8 1200 300000 295,000,000 40 250 6,000,000 48.0 2000 500000 48
Transfer Area Acreage needed at 1.5 acres per
Transfer Site
Volume of Material for Permanent placement at
Mason Dixon Quarry (CY)
Percentage of Material Dredged per year that
Mason Dixon can Handle per year (%)
# of dredging cycles that facility could be used till
capacity is reached
15 1,200,000 Unknown 2944 3,600,000 Unknown 1072 6,000,000 Unknown 6
Attach J-2Upland_Placement_A-B-C_V-8.xlsxAttach J-2Upland_Placement_A-B-C_V-8.xlsx
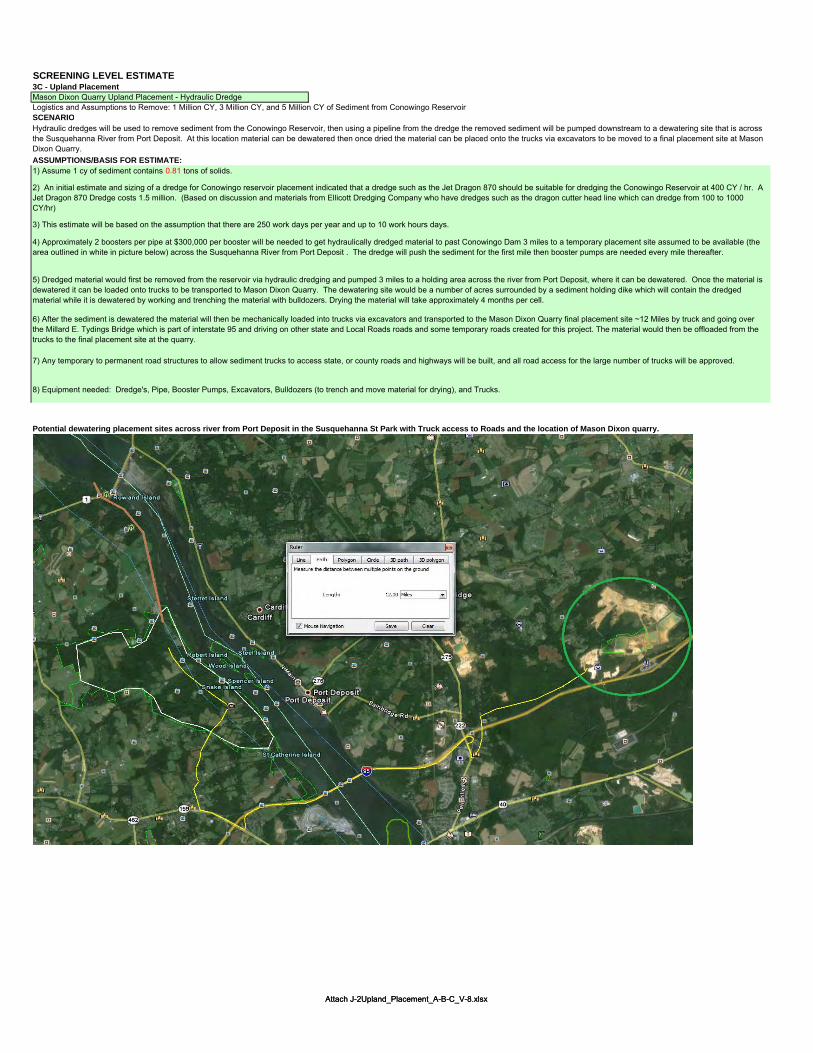
SCREENING LEVEL ESTIMATE 3C - Upland Placement
Logistics and Assumptions to Remove: 1 Million CY, 3 Million CY, and 5 Million CY of Sediment from Conowingo ReservoirSCENARIO
ASSUMPTIONS/BASIS FOR ESTIMATE:
Potential dewatering placement sites across river from Port Deposit in the Susquehanna St Park with Truck access to Roads and the location of Mason Dixon quarry.
Mason Dixon Quarry Upland Placement - Hydraulic Dredge
Hydraulic dredges will be used to remove sediment from the Conowingo Reservoir, then using a pipeline from the dredge the removed sediment will be pumped downstream to a dewatering site that is across the Susquehanna River from Port Deposit. At this location material can be dewatered then once dried the material can be placed onto the trucks via excavators to be moved to a final placement site at Mason Dixon Quarry.
6) After the sediment is dewatered the material will then be mechanically loaded into trucks via excavators and transported to the Mason Dixon Quarry final placement site ~12 Miles by truck and going over the Millard E. Tydings Bridge which is part of interstate 95 and driving on other state and Local Roads roads and some temporary roads created for this project. The material would then be offloaded from the trucks to the final placement site at the quarry.
7) Any temporary to permanent road structures to allow sediment trucks to access state, or county roads and highways will be built, and all road access for the large number of trucks will be approved.
8) Equipment needed: Dredge's, Pipe, Booster Pumps, Excavators, Bulldozers (to trench and move material for drying), and Trucks.
1) Assume 1 cy of sediment contains 0.81 tons of solids.
2) An initial estimate and sizing of a dredge for Conowingo reservoir placement indicated that a dredge such as the Jet Dragon 870 should be suitable for dredging the Conowingo Reservoir at 400 CY / hr. A Jet Dragon 870 Dredge costs 1.5 million. (Based on discussion and materials from Ellicott Dredging Company who have dredges such as the dragon cutter head line which can dredge from 100 to 1000 CY/hr)
3) This estimate will be based on the assumption that there are 250 work days per year and up to 10 work hours days.
4) Approximately 2 boosters per pipe at $300,000 per booster will be needed to get hydraulically dredged material to past Conowingo Dam 3 miles to a temporary placement site assumed to be available (the area outlined in white in picture below) across the Susquehanna River from Port Deposit . The dredge will push the sediment for the first mile then booster pumps are needed every mile thereafter.
5) Dredged material would first be removed from the reservoir via hydraulic dredging and pumped 3 miles to a holding area across the river from Port Deposit, where it can be dewatered. Once the material is dewatered it can be loaded onto trucks to be transported to Mason Dixon Quarry. The dewatering site would be a number of acres surrounded by a sediment holding dike which will contain the dredged material while it is dewatered by working and trenching the material with bulldozers. Drying the material will take approximately 4 months per cell.
Attach J-2Upland_Placement_A-B-C_V-8.xlsxAttach J-2Upland_Placement_A-B-C_V-8.xlsx

Evaluation of Available Capacity:
Total Amount of Material to be dredged (CY)
Number of Dredges at (400 CY/hr solids at 10
hour days or 4000 CY/day or 1000000 CY/yr) per Dredge
Number of days to dredge amount at given
number of dredges.
Actual CY of Sediment Plus Water Volume
Hydraulically Dredged
Distance to be Piped (miles) Number of Pipes Number of Booster
pumps
Equivalent Acreage of Hydraulically Dredged Material @ 3 ft or 1 yd
depth
1,000,000 1 250 4,000,000 3 1 2 8003,000,000 3 250 12,000,000 3 3 6 2,5005,000,000 5 250 20,000,000 3 5 10 4,100
Total (CY) of Sediment Plus Water Volume
Placed into Temporary Holding Cells During
One Year
Equivalent Acreage of Hydraulically Dredged Material @ 3 ft or 1 yd
depth
Acreage needed for 6 drying Cells which are
used 2 times per year for temporary placement
Area of one Drying Cell (acres)
Dike Length in Feet for 6 cells
Dike Volume in CY for 6 cells at 5 ft elevation
Dewatered Volume of Material (1.5 times
original amount dredged)
4,000,000 800 420 70 33,200 140,000 1,500,00012,000,000 2,500 1,250 210 99,600 420,000 4,500,00020,000,000 4,100 2,080 350 166,000 700,000 7,500,000
Temporary Dewatering Sediment Cells and Associated Months of HandlingCell 1 Cell 2 Cell 3 Cell 4 Cell 5 Cell 6
Pump 1 2 3 4 5 6Dry 2,3,4,5 3,4,5,6 4,5,6,7 6,7,8,9 7,8,9,10 8,9,10,11 Cycle 1
Remove 6 7 8 9 10 11Pump 7 8 9 10 11 12Dry 8,9,10,11 9,10,11,12 10,11,12,1 11,12,1,2, 12,1,2,3 1,2,3,4 Cycle 2
Remove 12 1 2 3 4 5
Volume of Material for Permanent placement at
Stancil Quarry After Drying (CY)
Volume of Dried Material per Drying Cell (CY)
Area of one Drying Cell (acres)
~ Total Number of Truck Loads Per Year
Number of Transfer sites at 6 trucks per hour over 10 hours per transfer site
Percentage of Material Dredged per year that
Mason Dixon Quarry can Handle per year (%)
# of dredging cycles that facility could be used till
capacity is reached
1,500,000 130,000 70 125000 9.0 Unknown 234,500,000 380,000 210 375000 25.0 Unknown 87,500,000 630,000 350 625000 42.0 Unknown 5
Attach J-2Upland_Placement_A-B-C_V-8.xlsxAttach J-2Upland_Placement_A-B-C_V-8.xlsx

SCREENING LEVEL COST ESTIMATE 3D - Upland Placement
Logistics and Assumptions to Remove: 1 Million CY, 3 Million CY, and 5 Million CY of Sediment from Conowingo ReservoirSCENARIO
ASSUMPTIONS/BASIS FOR ESTIMATE:
Location of Proposed Pipeline and Mason Dixon Belvidere Quarry in Cecil County Md.
4) Approximately 13 boosters per pipe at $300,000 per booster will be needed to get hydraulically dredged material to Mason Dixon Belvidere Quarry. The dredge will push the sediment for the first mile then booster pumps are needed every mile thereafter.
5) Dredged material would first be removed from the reservoir via hydraulic dredging and pumped over 13 miles to a holding area at Mason Dixon Belvidere Quarry where it can be dewatered to the Susquehanna River or to the Susquehanna flats approximately 5 miles away . Once the material is dewatered it can be placed permanently in final fill areas at the quarry. The dewatering site will be a number of acres surrounded by a sediment holding dike which will contain the dredged material while it is dewatered by working and trenching the material with bulldozers. Drying the material will take approximately 4 months per cell.
8) Cells will be set up to dewater the sediment at the Quarry and Effluent will be pumped back to the Susquehanna River or the Susquehanna Flats area 5 miles away. After the sediment is dewatered the material will then be pushed and moved via bulldozer and excavator to a final fill location within the Quarry.
Mason Dixon Belvidere Quarry Upland Placement - Hydraulic Dredge
6) Where needed the pipeline can be constructed along roads, rail lines and thru areas of farm land or forest.
7) Initially the dredges will pump sediment under the train trestle on Old Conowingo Creek in order to cross under the rail lines, and move the material in the pipeline from water to land.
Hydraulic dredges will be used to remove sediment from the Conowingo Reservoir, then using a pipeline from the dredge the removed sediment will be pumped downstream directly to the Mason Dixon (Belvidere Plant) Quarry in Cecil County Md., where it can be dewatered and permanently placed at the site.
1) Assume 1 cy of sediment contains 0.81 tons of solids.
2) An initial estimate and sizing of a dredge for Conowingo reservoir placement indicated that a dredge such as the Jet Dragon 870 should be suitable for dredging the Conowingo Reservoir at 400 CY / hr. A Jet Dragon 870 Dredge costs 1.5 million. (Based on discussion and materials from Ellicott Dredging Company who have dredges such as the dragon cutter head line which can dredge from 100 to 1000 CY/hr)
3) This estimate will be based on the assumption that there are 250 work days per year and up to 10 work hours days.
9) Equipment needed: Dredge's, Pipe, Booster Pumps, Excavators, Bulldozers (to trench and move material for drying).
Conowingo Creek
Belvidere Quarry
\\nab-fs2im\cenab\Projects\Civil-Projects\Lower Susquehanna River Watershed Assessment\Feasibility Phase (September 2011 ...)\Assessment report\Draft Report\Appendices\April 2014 Consolidated\J\Attach J-2Upland_Placement_3D_V-3.xlsx 1 of 2 4/14/2014

Evaluation of Available Capacity:
Total Amount of Material to be dredged (CY)
Number of Dredges at (400 CY/hr solids at 10
hour days or 4000 CY/day or 1000000 CY/yr.) per Dredge
Number of days to dredge amount at given
number of dredges.
Actual CY of Sediment Plus Water Volume
Hydraulically Dredged
Distance to be Piped (miles) Number of Pipes Number of Booster
pumps
Equivalent Acreage of Hydraulically Dredged
Material @ 3 ft. or 1 yd. depth
1,000,000 1 250 4,000,000 14 1 13 8003,000,000 3 250 12,000,000 14 3 39 2,5005,000,000 5 250 20,000,000 14 5 65 4,100
Total (CY) of Sediment Plus Water Volume
Placed into Temporary Holding Cells During
One Year
Equivalent Acreage of Hydraulically Dredged
Material @ 3 ft. or 1 yd. depth
Acreage needed for 6 drying Cells which are used 2 times per year
for temporary placement
Area of one Drying Cell (acres)
Dike Length in Feet for 6 cells
Dike Volume in CY for 6 cells at 5 ft. elevation
Dewatered Volume of Material (1.5 times
original amount dredged)
Distance to Pipe Effluent from
Dewatering Operation (miles) using 2 pumps
4,000,000 800 420 70 33,200 140,000 1,500,000 512,000,000 2,500 1,250 210 99,600 420,000 4,500,000 520,000,000 4,100 2,080 350 166,000 700,000 7,500,000 5
Temporary Dewatering Sediment Cells and Associated Months of HandlingCell 1 Cell 2 Cell 3 Cell 4 Cell 5 Cell 6
Pump 1 2 3 4 5 6Dry 2,3,4,5 3,4,5,6 4,5,6,7 6,7,8,9 7,8,9,10 8,9,10,11 Cycle 1
Remove 6 7 8 9 10 11Pump 7 8 9 10 11 12Dry 8,9,10,11 9,10,11,12 10,11,12,1 11,12,1,2, 12,1,2,3 1,2,3,4 Cycle 2
Remove 12 1 2 3 4 5
Volume of Material for Permanent placement at Mason Dixon Belvidere
Quarry After Drying (CY)
Volume of Dried Material per Drying
Cell (CY)
Area of one Drying Cell (acres)
Percentage of Material Dredged per year that
Mason Dixon Belvidere Quarry can Handle per
year (%)
# of dredging cycles that facility could be used
before capacity is reached
1,500,000 130,000 70 Unknown 234,500,000 380,000 210 Unknown 87,500,000 630,000 350 Unknown 5
\\nab-fs2im\cenab\Projects\Civil-Projects\Lower Susquehanna River Watershed Assessment\Feasibility Phase (September 2011 ...)\Assessment report\Draft Report\Appendices\April 2014 Consolidated\J\Attach J-2Upland_Placement_3D_V-3.xlsx 2 of 2 4/14/2014

SCREENING LEVEL ESTIMATE 4 - Watershed Management Strategy
SCENARIO DESCRIPTION
ASSUMPTIONS/BASIS FOR ESTIMATE:
Description of POTENTIAL SITE/Locations/Include PHOTOS, FIGURE, MAP
Description of POTENTIAL BMPs PHOTOS, FIGURE
Implement "E3" Scenario
1) Assume 1 CY of sediment contains 0.81 tons of solids.
2) Model runs that were used to develop the "E3" scenario will result in the sediment reductions described in the scenario.
3) The unit costs to implement the "E3" scenario will not change greatly over time.
4) Jurisdictions will be able to secure adequate funding and political support.
Best management practices will be implemented in the Susquehanna River watershed in areas of New York, Pennsylvania, and Maryland above Conowingo Dam.
Logistics and Assumptions to Reduce Sediment Yield: 243,000 CY from Conowingo Reservoir
Total maximum daily loads (TMDLs) have been established for nutrients (phosphorus and nitrogen), which will be met through watershed implementation plans (WIPs). After meeting the nutrient TMDLs there will still be available sediment reduction by implementing the "E3" scenario (everyone doing everything technically feasible everywhere in the watershed) beyond the WIPs.
Two examples of best management practices that could be implemented in urban areas are pervious pavers and rain gardens, which allow overland flow generated during storms to slowly infiltrate. This will reduce runoff and erosion and help to reduce sediment loads.
\\nab-fs2im\cenab\Projects\Civil-Projects\Lower Susquehanna River Watershed Assessment\Feasibility Phase (September 2011 ...)\Assessment report\Draft Report\Appendices\April 2014 Consolidated\J\Attach J-2 Watershed BMP Template.xlsx 1 of 1 4/14/2014
Two examples of agriculture best management practices are cover crops and covered manure sheds. Cover crops help to reduce erosion and sediment loads and manure sheds reduce nutrient inputs to local water systems and ultimately the Bay.
\\nab-fs2im\cenab\Projects\Civil-Projects\Lower Susquehanna River Watershed Assessment\Feasibility Phase (September 2011 ...)\Assessment report\Draft Report\Appendices\April 2014 Consolidated\J\Attach J-2 Watershed BMP Template.xlsx 1 of 1 4/14/2014